Article

Application of PlanetScope Imagery for Flood Mapping: A Case Study in South Chickamauga Creek, Chattanooga, Tennessee

by
Mithu Chanda
1 and
A. K. M. Azad Hossain
2,*
1
Department of Civil Engineering, The University of Tennessee at Chattanooga, 615 McCallie Avenue, Chattanooga, TN 37403, USA
2
Department of Biology, Geology, and Environmental Science, The University of Tennessee at Chattanooga, 615 McCallie Avenue, Chattanooga, TN 37403, USA
*
Author to whom correspondence should be addressed.
Remote Sens. 2024, 16(23), 4437; https://doi.org/10.3390/rs16234437
Submission received: 13 May 2024 / Revised: 16 November 2024 / Accepted: 19 November 2024 / Published: 27 November 2024
(This article belongs to the Special Issue Remote Sensing of Floods: Progress, Challenges and Opportunities)

Abstract

:
Floods stand out as one of the most expensive natural calamities, causing harm to both lives and properties for millions of people globally. The increasing frequency and intensity of flooding underscores the need for accurate and timely flood mapping methodologies to enhance disaster preparedness and response. Earth observation data obtained through satellites offer comprehensive and recurring perspectives of areas that may be prone to flooding. This paper shows the suitability of high-resolution PlanetScope imagery as an efficient and accessible approach for flood mapping through a case study in South Chickamauga Creek (SCC), Chattanooga, Tennessee, focusing on a significant flooding event in 2020. The extent of the flood water was delineated and mapped using image classification and density slicing of Normalized Difference Water Index (NDWI). The obtained results indicate that PlanetScope imagery performed well in flood mapping for a narrow creek like SCC, achieving an overall accuracy of more than 90% and a Kappa coefficient of over 0.80. The findings of this research contribute to a better understanding of the flood event in Chattanooga and demonstrate that PlanetScope imagery can be utilized as a very useful resource for accurate and timely flood mapping of streams with narrow widths.

Graphical Abstract

1. Introduction

Flooding, a common natural disaster in many regions in the world, causes a considerable threat to both lives and properties. Floods occur due to intense rainfall and snowmelt, leading to river overflow and temporary water stagnation. Overflow of water results in damage to communities mostly situated along the riverbanks [1]. Flood damage includes structural damage, erosion, water contamination, disruption of social and economic activities, and the loss of lives and properties [2]. The economic consequences can be significant and long-lasting, devastating communities for months. For instance, in 2017, floods and flash floods led to approximately $60.7 billion in property damage across the United States (US) [3]. During the 2006–2015 period, floods impacted approximately 800 million individuals globally, resulting in economic losses exceeding $300 billion [4]. The United Nations (UN) reports that floods cause more fatalities than any other type of natural disaster [5]. Additionally, an example of the prolonged impact of flooding was seen in South China in 1998, which persisted for over four months and resulted in widespread disruption, affecting millions of people. It also led to thousands of deaths and caused extensive physical and material losses [6]. The occurrence of flooding could be explained by natural and man-made interventions, including heavy rainfall, climate change, and changes in land use and land cover types [1]. Floods cause substantial destruction in densely populated urban areas with extensive development compared to rural areas. Idowu and Zhou [7] carried out an extensive study on frequent floods in 12 megacities worldwide. They found a significant and clear correlation between edge expansion and leapfrogging patterns in urban areas with flood hazards, indicating the impacts of urban expansion on frequent flooding events [8]. The study also revealed that all the megacities studied have experienced severe flooding over the past two decades, leading to increased fatalities and significant economic losses. One way to reduce the losses due to flooding is to increase the adaptation of proper flood planning and management [9]. Flood management is highly varied based on specific sites and necessitates participation from multiple disciplines, including hydrology, meteorology, engineering, urban planning, geography, emergency management, public health, economics, and social science.
Effectively managing floods necessitates a comprehensive understanding of past flood patterns and future projections and identifying vulnerable areas. Flood mapping serves as a fundamental practice in gathering such crucial data, enabling proactive measures in preparedness, response, and recovery efforts to mitigate flood impacts efficiently [10]. For example, accurate flood mapping is essential for disaster management teams to assess impacted areas. This critical information guides their response actions and efforts to assist victims in flood-affected regions [11]. Accurate delineation of water extents is vital for predicting, monitoring, and providing relief during current and potential future floods. Flood-affected areas can be examined through various methods, such as field surveys, predictive modeling, statistical analysis, remote sensing, and more. Traditional survey methods are often challenging due to water bodies’ rapid and inaccessible nature during flooding events such as high tides and storm surges. Additionally, outdated equipment, financial limitations, time constraints, and technical obstacles can hinder the gathering of sufficient data for flood modeling and mapping in certain situations [12]. That is why one of the most common types of initial management practice involves the application of remote sensing (RS) techniques, which provide cost-effective and rapid methods for obtaining spatial data about flood events and delineating affected areas [13]. Remote sensing technologies have revolutionized this process by allowing for the synoptic and repetitive monitoring of water and land areas acquired through satellite images using numerous national and international satellites. The principles of RS techniques involve detecting and monitoring the physical characteristics of an area by measuring its reflected and emitted radiation from a distance, usually via satellites or aircraft. Special cameras capture these remotely sensed images, enabling researchers to gather information about the Earth.
Remote sensing technology offers essential data for mapping drought, flood, and water resources [14,15,16]. Recent research has highlighted the dual significance of remotely sensed variables in hydrology: they play a crucial role in calibrating and validating hydraulic models while also revolutionizing real-time flood mapping and monitoring techniques [4]. Various satellites have their coverage areas and have intervals of time to revisit the Earth’s orbit and gather images through sensors. Once information about a flood event is received, anyone can promptly gather necessary images of flood-affected areas from such satellites. Those images can be further processed by employing proper procedures to identify and map flood-prone areas. Due to its wide coverage, satellite-based imagery can serve as the optimal tool for assessing the extent of flood-affected regions with high spatial and temporal resolution. Moreover, it allows for the permanent documentation of such occurrences, offering advantages over in situ measurements and other data sources [17]. It is also regarded as the fastest and most efficient means of identifying flood-affected regions and delivering flood inundation data [18].
Previous studies have revealed that multiple factors influence the selection of optimal satellite data for flood mapping, and the timing of satellite imagery relative to the flood peak emerges as the most critical factor. The Ebro River basin (Spain), particularly its upper and middle sections, experienced heavy rainfall in 2015. The precipitation led to four separate flooding incidents in the middle Ebro valley near Zaragoza City. Multispectral images such as Landsat-8, Moderate Resolution Imaging Spectroradiometer (MODIS)-Terra/Aqua, and Proba-V were used to detect over 90% of the flooded area in the 2015 Ebro flooding event [19]. In November 2016, the western portion of the Po River basin, located in the Piemonte region of northwestern Italy, experienced a severe flood. This area is prone to recurring floods, especially during autumn and spring. Post-flood multispectral imagery (MODIS-Aqua, Proba-V, and Sentinel-1/2) obtained for the 2016 Po and Tanaro plains flood showed detection rates below 50% within weeks, yet still provided valuable information on inundation patterns [19]. Therefore, one can say that timing is a crucial factor for accurate RS analysis for flood mapping.
Geographic Information Systems (GIS) exhibit exceptional versatility, offering robust spatial analysis, modeling, visualization, and data processing and management capabilities. As a fundamental technology, GIS facilitate numerous applications across various disciplines [14]. Recent progress in GIS and remote sensing (RS) has dramatically enhanced the assessment of geoenvironmental disasters, facilitating the development of flood susceptibility maps, risk assessments, and effective flood management strategies. Saha and Agrawal [20] utilized GIS and RS to quantify historical flood extents, and they assessed the impact of various land use and land cover categories in the Prayagraj district, India. The flood risk assessment showed that within the study area, 701.71 km2 (12.80%) is classified as high-risk, while 1273.0 km2 (23.22%) falls under the moderate-risk category. Islam et al. [21] developed flood inundation maps of Bangladesh derived from land and water surface indices utilizing MODIS surface reflectance images for 2004 and 2007. Chormanski et al. [22] introduced an integrated methodology for flood extent assessment and spatial distribution of water resources of the Biebrza River Lower Basin, Poland, combining various measurement and data processing techniques, including Geographical Positioning System, GIS, RS, and water chemistry analysis during flood events. The study showed that a significant agreement, around 85%, existed between RS and GPS field measurements. Brivio et al. [23] implemented an integrated RS and GIS approach for flood mapping, which proved an agreement of 96.7% with an official record by the local government office. Addressing flood-related challenges requires thorough planning studies and meticulous projects tailored explicitly to flood-prone areas [24].
Remote sensing technologies have been used to model flood-affected areas and hazard risk assessments in many places [5,12,24,25,26,27,28]. Researchers have employed optical imagery, Radio Detection and Ranging (RADAR), and Light Detection and Ranging (LiDAR) data in RS studies focusing on flood mapping and modeling [25,27]. Optical images offer a distinct advantage in their ability to quickly distinguish water from other land covers due to the unique reflectance properties of water. In contrast, RADAR data presents clear and high-resolution images unaffected by weather conditions, which is particularly advantageous. The application of emerging technologies, particularly artificial intelligence (AI), unmanned aerial vehicles (UAV), machine learning (ML), and image processing techniques, can facilitate the automation of flood risk mapping processes. Numerous ML techniques have been applied to natural hazard prediction, particularly in flood hazard forecasting. These techniques involve artificial neural networks, logistic regression, random forest, and support vector machines [28,29,30,31,32,33]. The cloud-based Google Earth Engine recently facilitated the rapid development of operational land cover maps for damage assessment [34]. In AI techniques, predictive performance deteriorates when the testing dataset extends beyond the scope of the training data. However, for example, RADAR data such as Synthetic Aperture Radar (SAR)-derived flood extents may lack precision in densely populated areas due to increased backscattering from buildings, posing a challenge in accurately identifying water bodies amidst other ground features [27]. Another major limitation is that public access to SAR remote sensing satellite data is time-constrained, and obtaining these images can incur significant expenses [28]. Another important issue is the accuracy of the data for remote sensing studies. The accuracy and reliability of flood mapping heavily depends on factors such as spatial resolution and the timing of image acquisition [25]. The utilization of very high-resolution and frequent optical satellite imagery can overcome these challenges, facilitating quick flood planning and emergency response.
Some major RS data sources include the United States Geological Survey (USGS), the National Aeronautics and Space Administration (NASA), the European Space Agency (ESA), and the Indian Space Research Organization (ISRO). Both active and passive sensors, functioning across visible, infrared, thermal, and microwave wavelengths of the electromagnetic spectrum, offer crucial and economically viable data about regions affected by floods [35]. Examples of active sensors include ALOS PALSAR, ENVISAT ASAR, RADARSAT-1/2, Sentinel-1A/1B, and TerraSAR-X, whereas passive sensors include AVHRR/3, Landsat, MODIS, and Sentinel-2A/2B. Regarding optical imageries, Landsat and MODIS are vastly used in remote sensing studies for their image coverage, resolution, and timelines. However, the spatial resolution of the Landsat image is 30 m, while MODIS has a coarse resolution (250 m–1 km), though it covers a large area with twice-daily temporal resolution. Landsat, Sentinel-1, Sentinel-2, and MODIS were frequently used for flood mapping and hazard risk assessments [18,28,34,36,37,38,39]. Kabir et al. [34] established an operational methodology for mapping rapid flood inundation and potential areas employing Sentinel-1 images and Landsat 8 images. Dao and Liou [18] developed an object-based technique to map flood extents and quantify affected rice croplands of Central Cambodia, integrating data from Landsat 8 Operational Land Imager (OLI) and MODIS vegetation indices. The approach employs image segmentation with optimal scale parameter estimation based on variations in local object variances. Image segmentation combines individual pixels or sub-objects into larger image objects using spectral and spatial criteria. Spectral homogeneity is based on average object values, while spatial homogeneity considers shape features: smoothness and compactness [18]. Landsat, Sentinel, and MODIS applications are not suitable for high-resolution research investigations, such as small creeks. In addition, the revisit times of Landsat, Sentinel-1, and Sentinel-2 satellites prevent their applications in emergency cases [40,41]. To address these issues, the emergence of commercial satellite remote sensing with both high temporal and spatial resolutions has enabled the detailed observation and characterization of ground features like never before [42]. Therefore, the demand for commercial satellites and their applications in various fields is increasing daily.
PlanetScope, a commercial satellite, stands out for its ability to capture high-resolution images almost daily, making it valuable for various ecological and environmental studies. PlanetScope consists of around 175 satellites orbiting in low-Earth, Sun-synchronous orbits at altitudes ranging from 450 to 580 km [43,44]. Each satellite within the PlanetScope constellation is a 3U CubeSat, measuring 10 cm × 10 cm × 30 cm in size, and is equipped to capture multiband images at a higher spatial resolution of 3–5 m. Currently, there are three generations of PlanetScope satellites in orbit, referred to as Dove or PS2 for the first generation, Dove-R or PS2.SD for the second generation, and Super Dove or PSB.SD for the third generation. PlanetScope satellite data and its applications have expanded since its first satellite was launched in 2013. Several researchers have used PlanetScope satellite imagery in numerous disciplines, including ice-dam failure identification, forest monitoring, general flower monitoring, grapevine stem water potential, water quality monitoring, coral bleaching detection, land use land cover, rubber plantations, bathymetry mapping, burned area mapping, and crop growth patterns in different parts of the world [45,46,47]. As PlanetScope provides high spatial and temporal resolution imagery, those images can be very useful for flood mapping and risk assessment in small and restricted areas where Landsat and MODIS imageries are not feasible.
This study aims to explore the application of conventional digital image processing techniques using PlanetScope imagery to study a flood event caused by a narrow channel. The flood event occurred in Chattanooga, TN along the South Chickamauga Creek (SCC) in 2020, which provided a unique opportunity to carry out this study. No study has been conducted using PlanetScope imagery for flood mapping in small creeks such as SCC yet. Therefore, this research provides a very important case study of remote sensing-based flood mapping using commercial high-resolution satellite imagery. It also bears regional significance, since this would be the first-ever study of a flood using remote sensing and PlanetScope imagery in Chattanooga, TN. While it is not feasible to completely evade flood risks or halt their happening, mitigating their impacts and consequent losses is certainly achievable [48]. This study would provide a very useful method of using remote sensing technology to conduct flood related research in Chattanooga, TN and other similar areas.

2. Materials and Methods

2.1. Study Site

South Chickamauga Creek (SCC), running in Catoosa County, Northwest Georgia (GA), and spanning approximately 1212 km2, ultimately flows into the Tennessee River near downtown Chattanooga (Figure 1). Hamilton County, TN, encompasses seven watersheds of United States Geological Survey (USGS) Hydrologic Unit Code 12 (HUC-12). The lower region is urbanized and covers about a third of Chattanooga, Tennessee’s land area. The major land covers in the watershed are forests (48%), pastures (24%), and urban areas (24%). Despite its relatively small size, this creek serves as a tranquil escape for paddlers amidst Chattanooga’s bustling industrial landscape, emerging as a critical recreational destination for locals. However, its geological makeup predisposes it to elevated levels of dissolved and suspended solids and conductivity, heightening susceptibility to erosion in its valleys [46]. The watershed features a humid subtropical climate. Winter temperatures typically range from 5 to 10 °C while summers are characterized by hot and humid conditions, averaging 21 to 27 °C. Annual precipitation and snowfall average around 140 and 90 cm, respectively (https://www.weather.gov; accessed on 3 November 2024). Soils in the watershed are primarily loam, sandy, or silty loam. They fall within hydrologic groups C and D, indicating low infiltration rates and high runoff potential following rainfall events [49]. The stretch of streambank along both sides covers over 30 mi from the Tennessee River to Northwest Georgia. The boundary of our study site for flood mapping is shown in Figure 1 (enclosed by arrows). Only one USGS gauging station in SCC exists within our research area. As per USGS data, the action stage for SCC is at a gauge height of 4.9 m, with the minor flood stage at 5.5 m, moderate flood stage at 6.7 m, and major flood stage at 8.2 m [46,50]. In the study area, the width of the lower SCC varies from under 10 m to over 50 m [46]. The downtown region lies within a floodplain that is relatively open and flat. The west side of SCC is primarily hilly with forest areas. Given these characteristics, any unexpected flooding in SCC could result in significant environmental contamination in the surrounding areas, impacting the socio-economic activities of the community. Over the past two decades, the creek has experienced two major flooding incidents, in 2003 and 2020, resulting in millions of dollars in infrastructure damage [51,52]. Notably, the 2020 flooding event was particularly severe, with water levels rising to 2.5 m above major flood-stage levels, causing extensive damage to structures and necessitating the closure of schools [50,51,53]. Flood maps play a crucial role in assessing the extent and severity of inundation, providing vital information for future flood preparedness efforts to minimize risks to lives and properties [54]. So, given the recent floods in the area, there is a high demand for flood control measures. A thorough evaluation of the flood situation using remote sensing and GIS-based methods is required. It can promptly assist authorities in implementing corrective and preventive measures in regions prone to flooding.

2.2. Work Flow

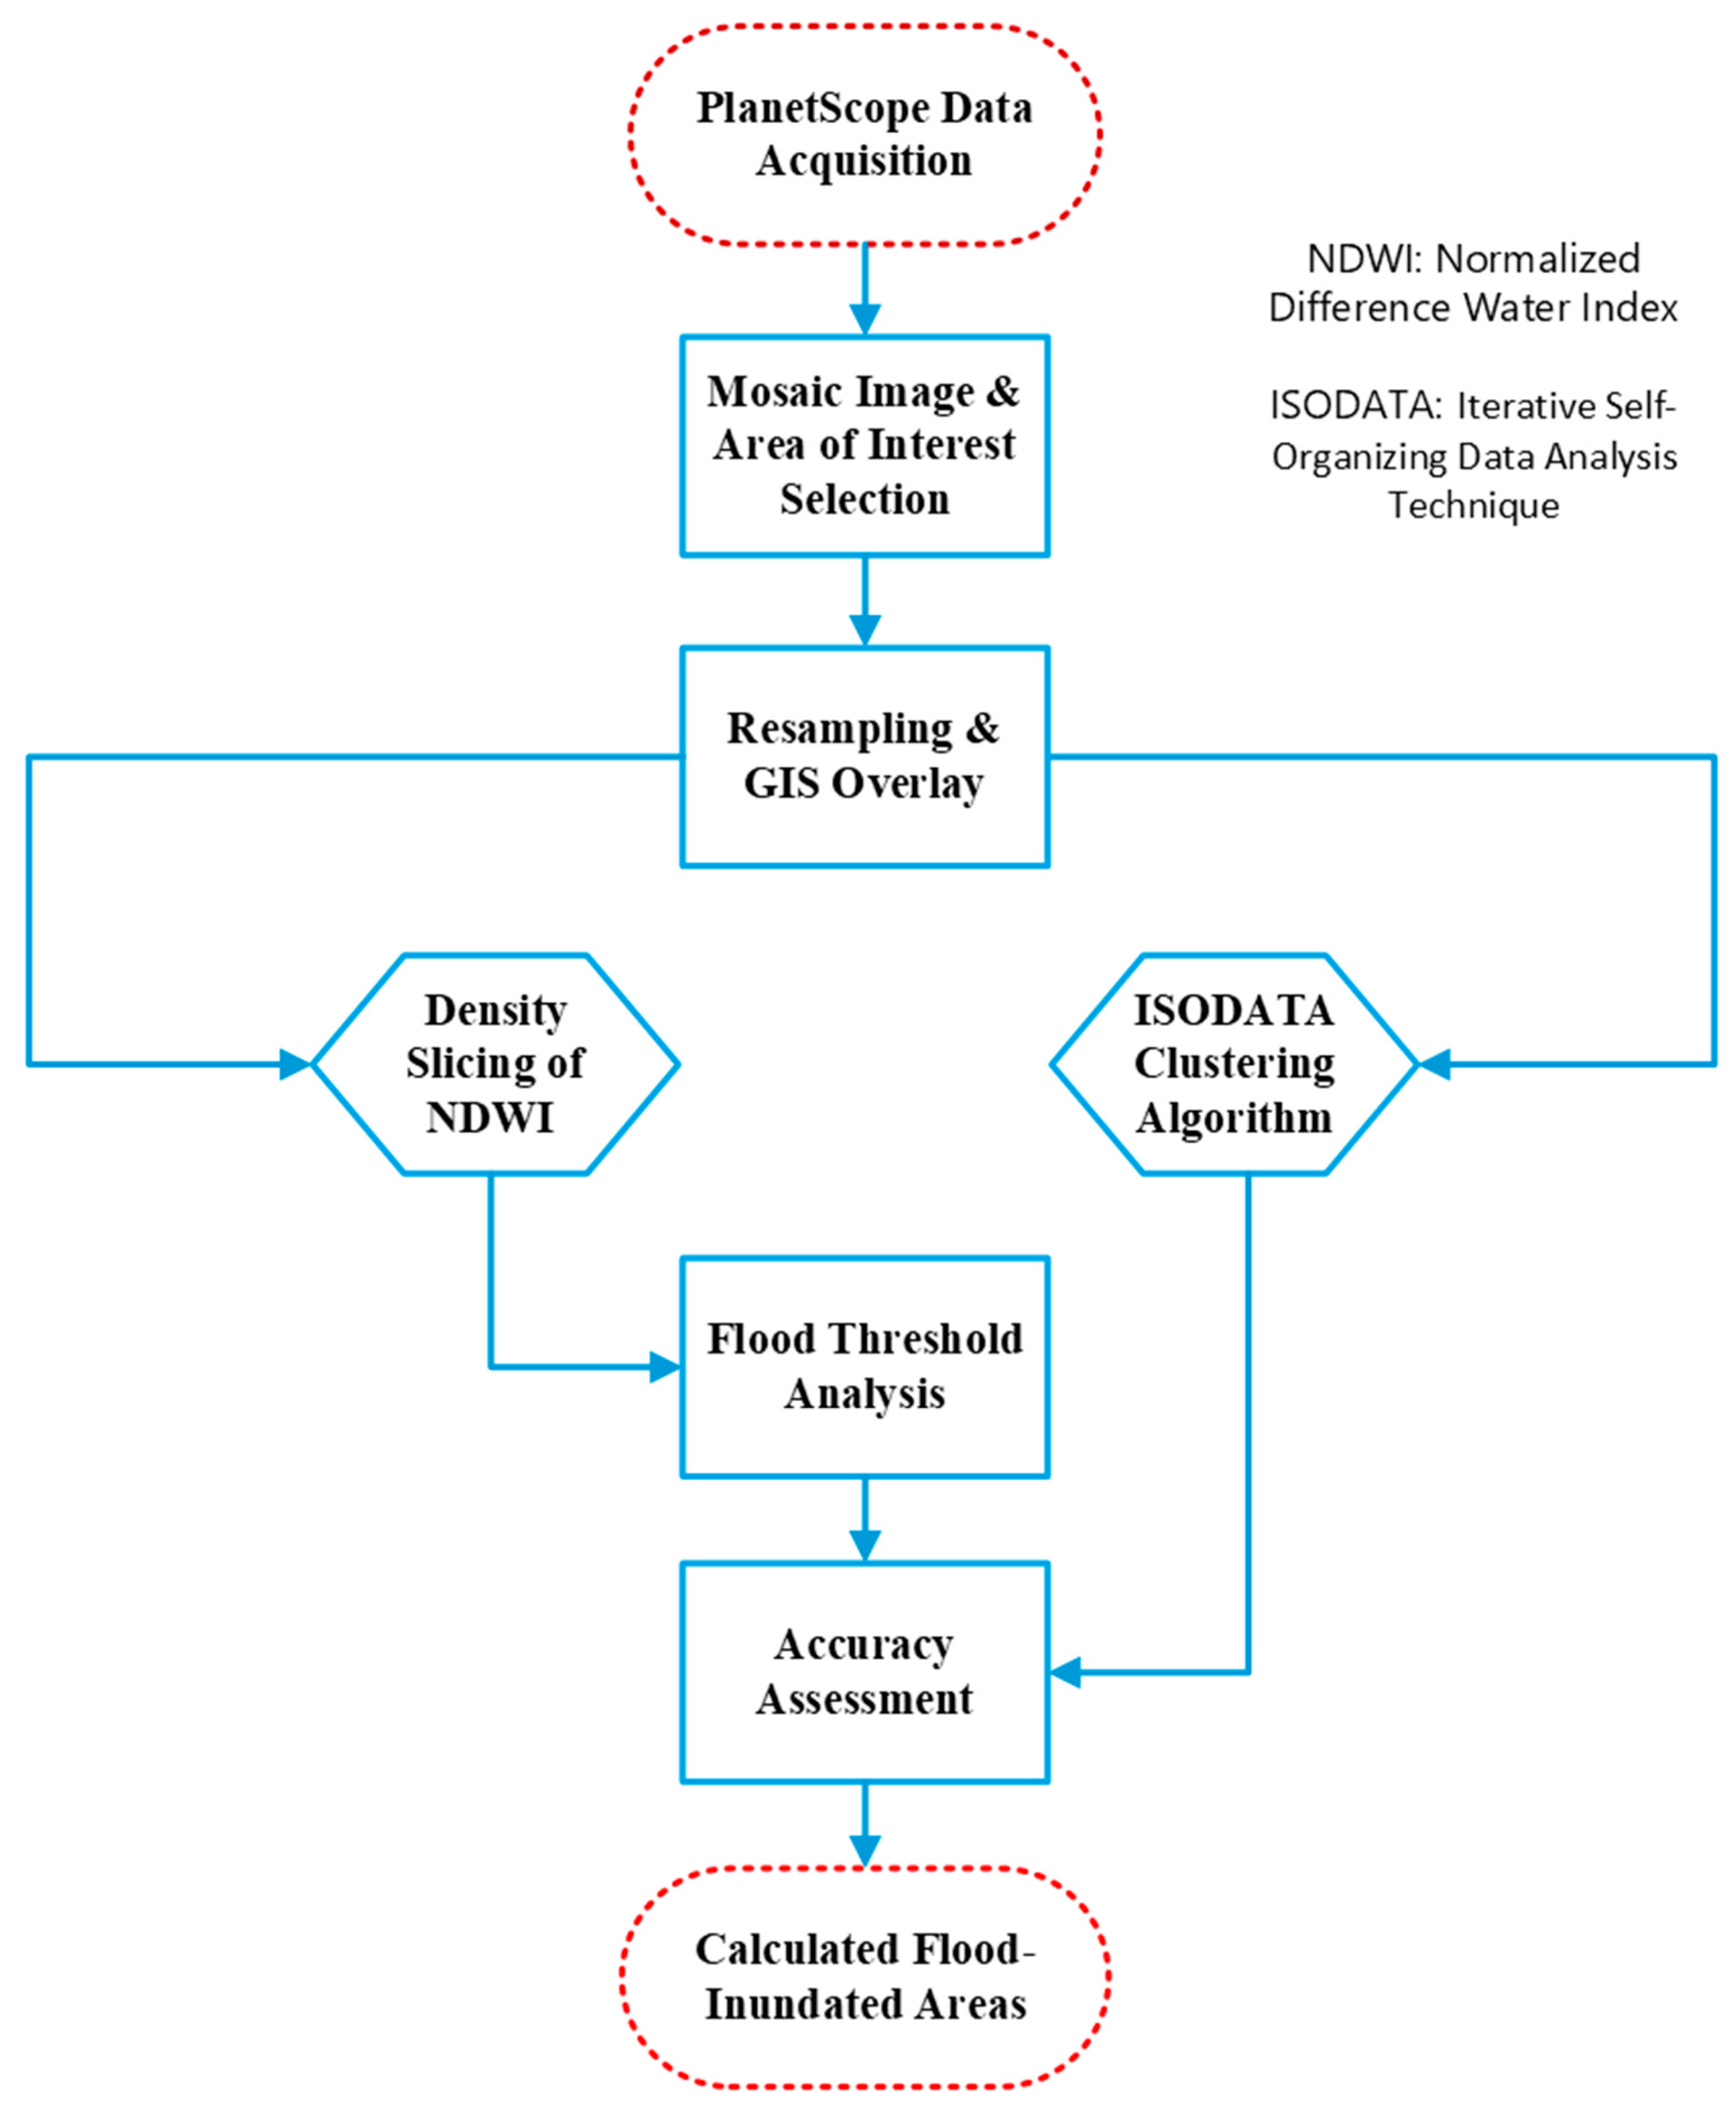
The overall workflow of this study for flood mapping of South Chickamauga Creek (SCC) using PlanetScope imagery is illustrated in Figure 2. ERDAS Imagine 2022 and ArcGIS Pro 3.1.3 software were used in this study to conduct all the geospatial and image processing tasks. The major steps included data acquisition, image preprocessing and feature selection, image classification, accuracy assessment, and estimation of inundated areas. Data acquisition involved gathering required satellite images from Planet Labs PBC. Flood mapping required image preprocessing and feature selection, which encompassed tasks such as aligning images, correcting distortions, assembling them into a mosaic, selecting areas of interest, and resampling. Then, resampled images were laid over in ArcGIS Pro 3.1.3 software and classified into two classes, land and water, to extract flood-inundated areas. Lastly, an accuracy assessment was performed using a confusion matrix generated from reference data to evaluate the effectiveness of the PlanetScope imagery for flood mapping.

2.3. Data Acquisition

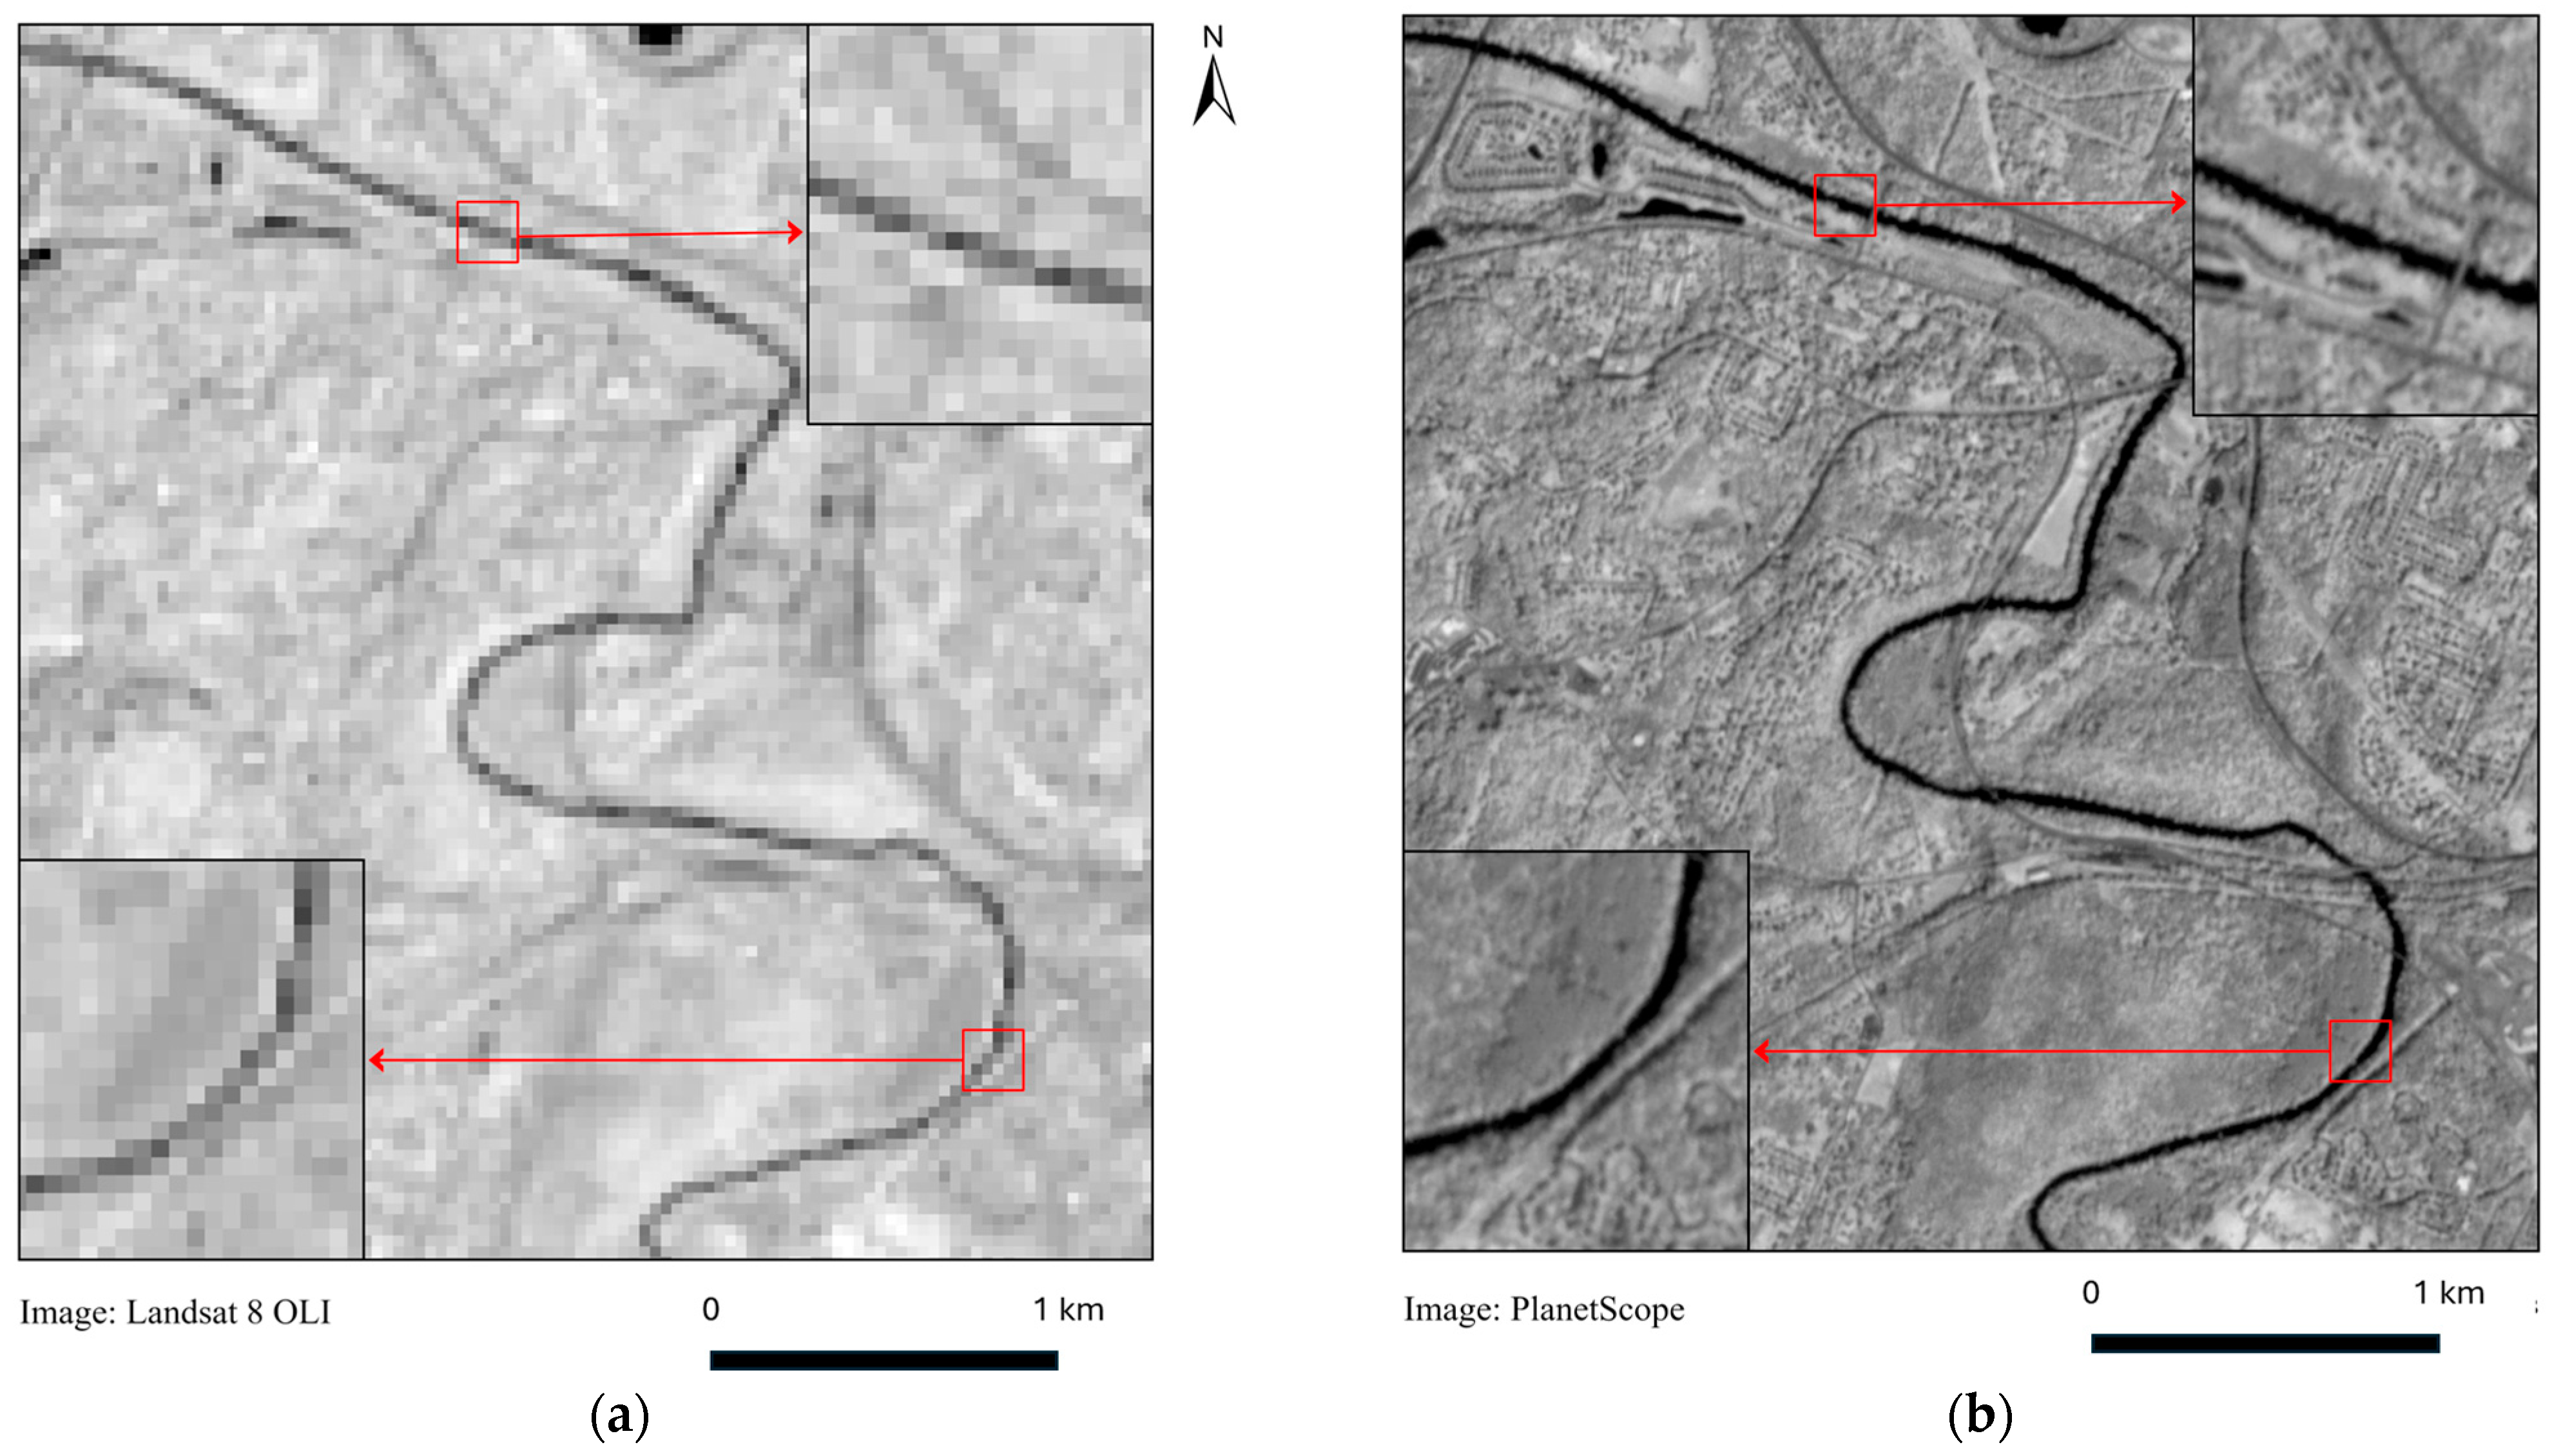
The imagery used in this study was sourced from Planet Labs PBC, San Francisco, California, USA, specifically for the year 2020. These images were obtained under a basic Education and Research program license [55]. This study utilized a multispectral satellite imagery product called PS-2 4-band MS analytic scene, with a ground resolution of 3 m and a radiometric resolution of 12 bits as input data. The Dove/PS2 satellite is equipped with four spectral bands covering the Blue (455–515 nm), Green (500–590 nm), Red (590–670 nm), and Near-Infrared (NIR) (780–860 nm) wavelength regions [43,45]. They can provide detailed information about ground objects, which is not feasible for Landsat. To show this, a pre-flood Landsat 8 OLI image (11 April 2020) was collected from the USGS Earth Explorer (https://earthexplorer.usgs.gov; accessed on 10 March 2024). As seen in Figure 3a,b, while the Landsat image captures the width of South Chickamauga Creek with just one or two pixels (in the top right corner), the PlanetScope image provides a higher level of detail, covering the width of the creek with multiple pixels.
Using PlanetScope imagery to analyze the affected areas, two images were utilized to create maps showing the areas before and after the flood event. A flood occurred in South Chickamauga Creek on 14 April 2020. PlanetScope images acquired on 5 April 2020 were utilized to depict the pre-flood conditions (Figure 4a), while images taken on 14 April 2020, were used to illustrate the post-flood situation (Figure 4b). Pre-flood images were selected at least one week before the onset of flooding in the study sites to better understand the water extent and land cover areas. In contrast, post-flood images were chosen immediately after the flooding to accurately assess the extent of flood inundation and evaluate the efficiency of PlanetScope imagery in detecting water and land areas, resulting in flood mapping. False color compositions of pre- and post-flood images are shown in Figure 4c,d.

2.4. Image Preprocessing

ERDAS Imagine software (version 2022) was used to carry out image preprocessing and feature selection of the study area. All pre- and post-flood images were imported into the ERDAS Imagine software for image preprocessing and area-of-interest selection. One of the major limitations of high-resolution PlanetScope imagery is that, due to various technical and processing issues, the images have inconsistent geometric and radiometric qualities, which has led to their underutilization in the earth science community [56,57]. In the preliminary data processing stage, each satellite image scene was then geometrically corrected and aligned to account for any non-systematic distortions that may have arisen, ensuring spatial continuity and consistency across the set of images. Then, multiple image scenes were mosaicked in ERDAS Imagine. One of the major advantages of using PlanetScope data is that all bands are available in a single image file. Therefore, layers are not required to be stacked. In the next stage, the studied region was manually delineated by drawing a rectangular bounding box encompassing the known geographic extents of the reference flood inundation area and developing the subset. The geographic extent of the study site was determined based on the confluence of the SCC with the Tennessee River and other creeks. The analysis extent was determined by the extent of the flood water observed on the mosaicked post-flood PlanetScope image, which allowed for the detection of the presence or absence of surface water in both pre- and post-flood images.

2.5. Image Processing and Image Classification

The image classification tools available in the Arc GIS Pro and ERDAS Imagine software were used to generate a two-class (land and water) land cover map from the satellite imagery acquired in this study.
Many studies have integrated remote sensing data with GIS to provide accurate flood mapping areas and hazard assessment [1,2,10]. The preprocessed satellite images were imported and used as inputs for performing the land cover classification process. This study was designed to accomplish the image classification process in two phases. In the first phase, the Normalized Difference Water Index (NDWI) was calculated, and the obtained index image was classified using a density slicing technique. In the second phase, a machine learning-based image classification technique was used to generate the flood map. The Iterative Self-Organizing Data Analysis Technique (ISODATA) algorithm was used to perform image classification. The flood maps generated in these two phases were compared and analyzed to evaluate the potential of PlanetScope imagery for flood mapping in SCC.

2.5.1. Normalized Difference Water Index (NDWI)

Many indices were developed using Landsat, Sentinel, and MODIS reflectance data under different climate and land cover conditions. The indices that were commonly used for flood mapping, risk assessments, and prediction include the Normalized Difference Vegetation Index (NDVI), Normalized Difference Water Index (NDWI), Modified Normalized Difference Water Index (MNDWI), and Revised Normalized Difference Vegetation Index (RNDWI) [18,19,30,34,58,59]. However, NDWI is the most widely accepted and utilized technique for flood-inundated area mapping [18,26,34,58,59,60]. NDWI utilizes satellite images’ green and near-infrared bands to identify open water areas. It enhances and amplifies water’s relatively higher reflectance values in the green spectral band while it suppresses and reduces the low reflectance values associated with water in the NIR band, as water absorbs radiation at NIR wavelengths and beyond [59]. It takes advantage of the distinct contrast and difference in reflectance between water and land surfaces present in the NIR band [26]. NDWI relies on a ratio of the green and NIR bands, effectively mitigating any inconsistencies in the imagery arising from sensor variations or image quality concerns, such as brightness or other sources of interference. The NDWI values can range from −1 to +1; higher values indicate the presence of open water. NDWI is calculated as follows:
N D W I = ρ G r e e n ρ N I R ρ G r e e n + ρ N I R
where ρ G r e e n = surface reflectance values of green band and ρ N I R = surface reflectance values of near infra-red band.
This study calculated NDWI using the surface reflectance values obtained from band 2 (green band) and band 4 (NIR band) of the acquired PlanetScope imagery. The following equation was used to do the calculation:
N D W I ( P S ) = ρ G r e e n ( P S ) ρ N I R   ( P S ) ρ G r e e n   ( P S ) + ρ N I R ( P S )
where ρ G r e e n   ( P S ) = surface reflectance values of green band of the PlanetScope imagery and ρ N I R   ( P S ) = surface reflectance values of near infra-red band of the PlanetScope imagery.

2.5.2. Density Slicing of NDWI Image

When utilizing spectral indices such as NDWI for water mapping, a critical step involves determining an appropriate threshold value to differentiate between water and non-water features (i.e., identifying the minimum index values). In this study, the density slicing technique was used to achieve this.
Density slicing is a digital data interpretation technique, which is used in analysis of remotely sensed imagery to enhance the information gathered from an individual brightness band [61]. It is achieved by dividing the range of brightness in a single band into intervals, then assigning each interval to a color [62,63,64].
Since no prior studies were conducted in this specific region, an experimental approach was taken to test different threshold values and find the best match against the reference flood data. This process determined threshold values of 0.255 for NDWI in pre-flood conditions and 0.205 in post-flood conditions, which produced flood maps that best aligned with the reference flood extents. The total area was divided into two classes for this research (Table 1).
Pre- and post-flood NDWI threshold values for water and land areas slightly varied based on the observation of the available true color composite of satellite images and NDWI-classified images. It also relied on the existing natural water bodies and flood extents. For pre-flood conditions, the NDWI values ranged from −0.591 to 0.597, with water-covered areas having NDWI values greater than 0.255. In post-flood conditions, NDWI values greater than 0.205 indicated water-covered areas, with the overall values ranging from −0.665 to 0.661. The range of NDWI values for post-flood conditions was higher than for pre-flood conditions. During flooding, water flew and spread over extensive areas, and satellite sensors calculated the water content in water-saturated vegetation, resulting in a high NDWI range. When using the same NDWI threshold values for image classification for pre- and post-flood situations, significant portions of flooded areas were incorrectly categorized as non-flooded or vice versa. The same threshold value for both pre-and post-flood images could include more non-flooded areas in flooded areas, which was not desirable for the study. As NDWI classified values were different for pre- and post-flood images, their threshold values also needed to be calculated based on the water extent areas shown on the true color images.
Using the obtained threshold values, the NDWI images were classified using the Raster Calculator tool of Spatial Analyst in ArcGIS Pro software.

2.5.3. Unsupervised Classification

Unsupervised classification allows the computer to determine image classes autonomously using a machine learning algorithm based on statistical variations in pixel spectral characteristics. No human interference occurs during initial classification, likely reducing the human bias in the result. The analyst then assigns these groups to informational classes. Unsupervised classification does not require extensive prior knowledge of the classified area for initial pixel separation, and the risk of human error/bias in the result is reduced, as the analyst makes fewer decisions during the classification process [65]. Numerous researchers have used unsupervised classification techniques integrated with remote sensing in various disciplines, including land use, land cover, landslide, heat island, and flood mapping [11,66,67,68,69]. ArcGIS Pro offers the Iterative Self-Organizing Data Analysis Technique (ISODATA) clustering algorithm for unsupervised classification [70]. Several studies used unsupervised classification for flood mapping [71,72,73]. Amitrano et al. [73] developed an unsupervised framework for rapid flood mapping. In this study, the pre- and the post-flood processed images were analyzed using ERDAS Imagine software and then imported into ArcGIS Pro. In ArcGIS Pro, the classification method involves the selection of major parameters, such as classification type, classification schema, classifier, maximum number of classes, and maximum number of iterations. The unsupervised classification method and pixel-based class type were selected for the initial classification. The classification schema was set to the National Landcover Database 2011. The main classifier was the ISODATA clustering algorithm. The total number of classes was 40, with iterations of 50, as there were four bands. The minimum class size value should be approximately ten times the number of layers in the input raster bands for better statistical analysis in unsupervised classification, as recommended by Environmental Systems Research Institute, Inc. ArcGIS Pro [74]. The minimum number of samples per cluster was 20. Then, 40 classified groups were reclassified into two categories: land and water. The ‘Recode’ tool available on ERDAS Imagine image processing software was used to accomplish this. The ‘Recode’ function is generally used to combine multiple classes into primary informational classes with thematic maps. Eroğlu et al. [75] utilized the Recode function to merge the classes into primary categories.

2.6. Accuracy Assessment

The flood events examined in this study occurred on a regional scale, encompassing a vast spatial geographic area. Consequently, gathering field data for validation posed significant challenges due to the extensive coverage. Since no prior studies were carried out in this specific region, validating the computed data with ground truth data published by other researchers was not possible. However, we utilized true color imagery from the satellite image to obtain image-derived reference data to assess the accuracy of image classification for pre- and post-flood conditions. Image-derived reference data based on true color is acceptable for accuracy assessment when ground truth data are unavailable to perform a detailed accuracy assessment. For example, Blanton and Hossain [76] utilized true color imagery to obtain image-derived reference data to accurately assess NDVI classification for vegetation growth in Copper Basin, Tennessee, when ground truth data were unavailable. The same pixels were used for the accuracy assessment of both NDWI and unsupervised classification.
Using the confusion matrix, several studies computed overall accuracy and Kappa coefficient for the accuracy assessment, which is acceptable and showed promising results for flood-affected area mapping [18,31,34,58,77]. The confusion matrix illustrates the reference pixels in columns and the classified pixels in rows. Diagonal elements represent pixels correctly classified according to the reference data, while off-diagonal elements indicate misclassifications. Overall accuracy is the sum of diagonal elements divided by total elements [78]. The Kappa coefficient measures overall statistical agreement within an error matrix, considering both diagonal and non-diagonal elements. Kappa coefficient values between 0.41 and 0.60 suggest moderate accuracy, 0.61 to 0.80 indicate high accuracy, and values exceeding 0.80 indicate very high accuracy [78].
This study calculated overall accuracy and Kappa coefficient based on reference and classified image pixels. A random stratified sampling technique was used to acquire 120 reference pixels, comprising 60 water pixels and 60 non-water pixels. Using ArcGIS Pro software, these pixels were employed to extract pixels from the classified NDWI image and unsupervised classified image. Table 2 displays the distribution of pixels across different classes. The pixels used for accuracy assessment in both pre- and post-flood conditions are shown in Figure 5a,b.
The following equations utilized the performance indices to calculate the classifications’ overall accuracy and Kappa coefficient [79,80].
O v e r a l l   A c c u r a c y = T p + T n T p + T n + F p + F n
K a p p a   C o e f f i c i e n t ,   K = P o P e 1 P e
where
True positive (Tp) = Number of classified NDWI water pixels matched with referenced pixels covered by water areas
True negative (Tn) = Number of classified NDWI non-water pixels data matched with referenced pixels covered by non-water areas
False positive (Fp) = Number of classified NDWI non-water pixels data matched with referenced pixels covered by water areas
False negative (Fn) = Number of classified NDWI water pixels data matched with referenced pixels covered by non-water areas
Po = Proportion of cases correctly classified (i.e., overall accuracy)
Pe = Expected proportion of cases correctly classified by chance
The overall accuracy for NDWI and unsupervised classification was calculated to be 93.33% and 90%, respectively. The Kappa coefficient for NDWI and unsupervised classification was almost 0.87 and 0.80, respectively.

3. Results

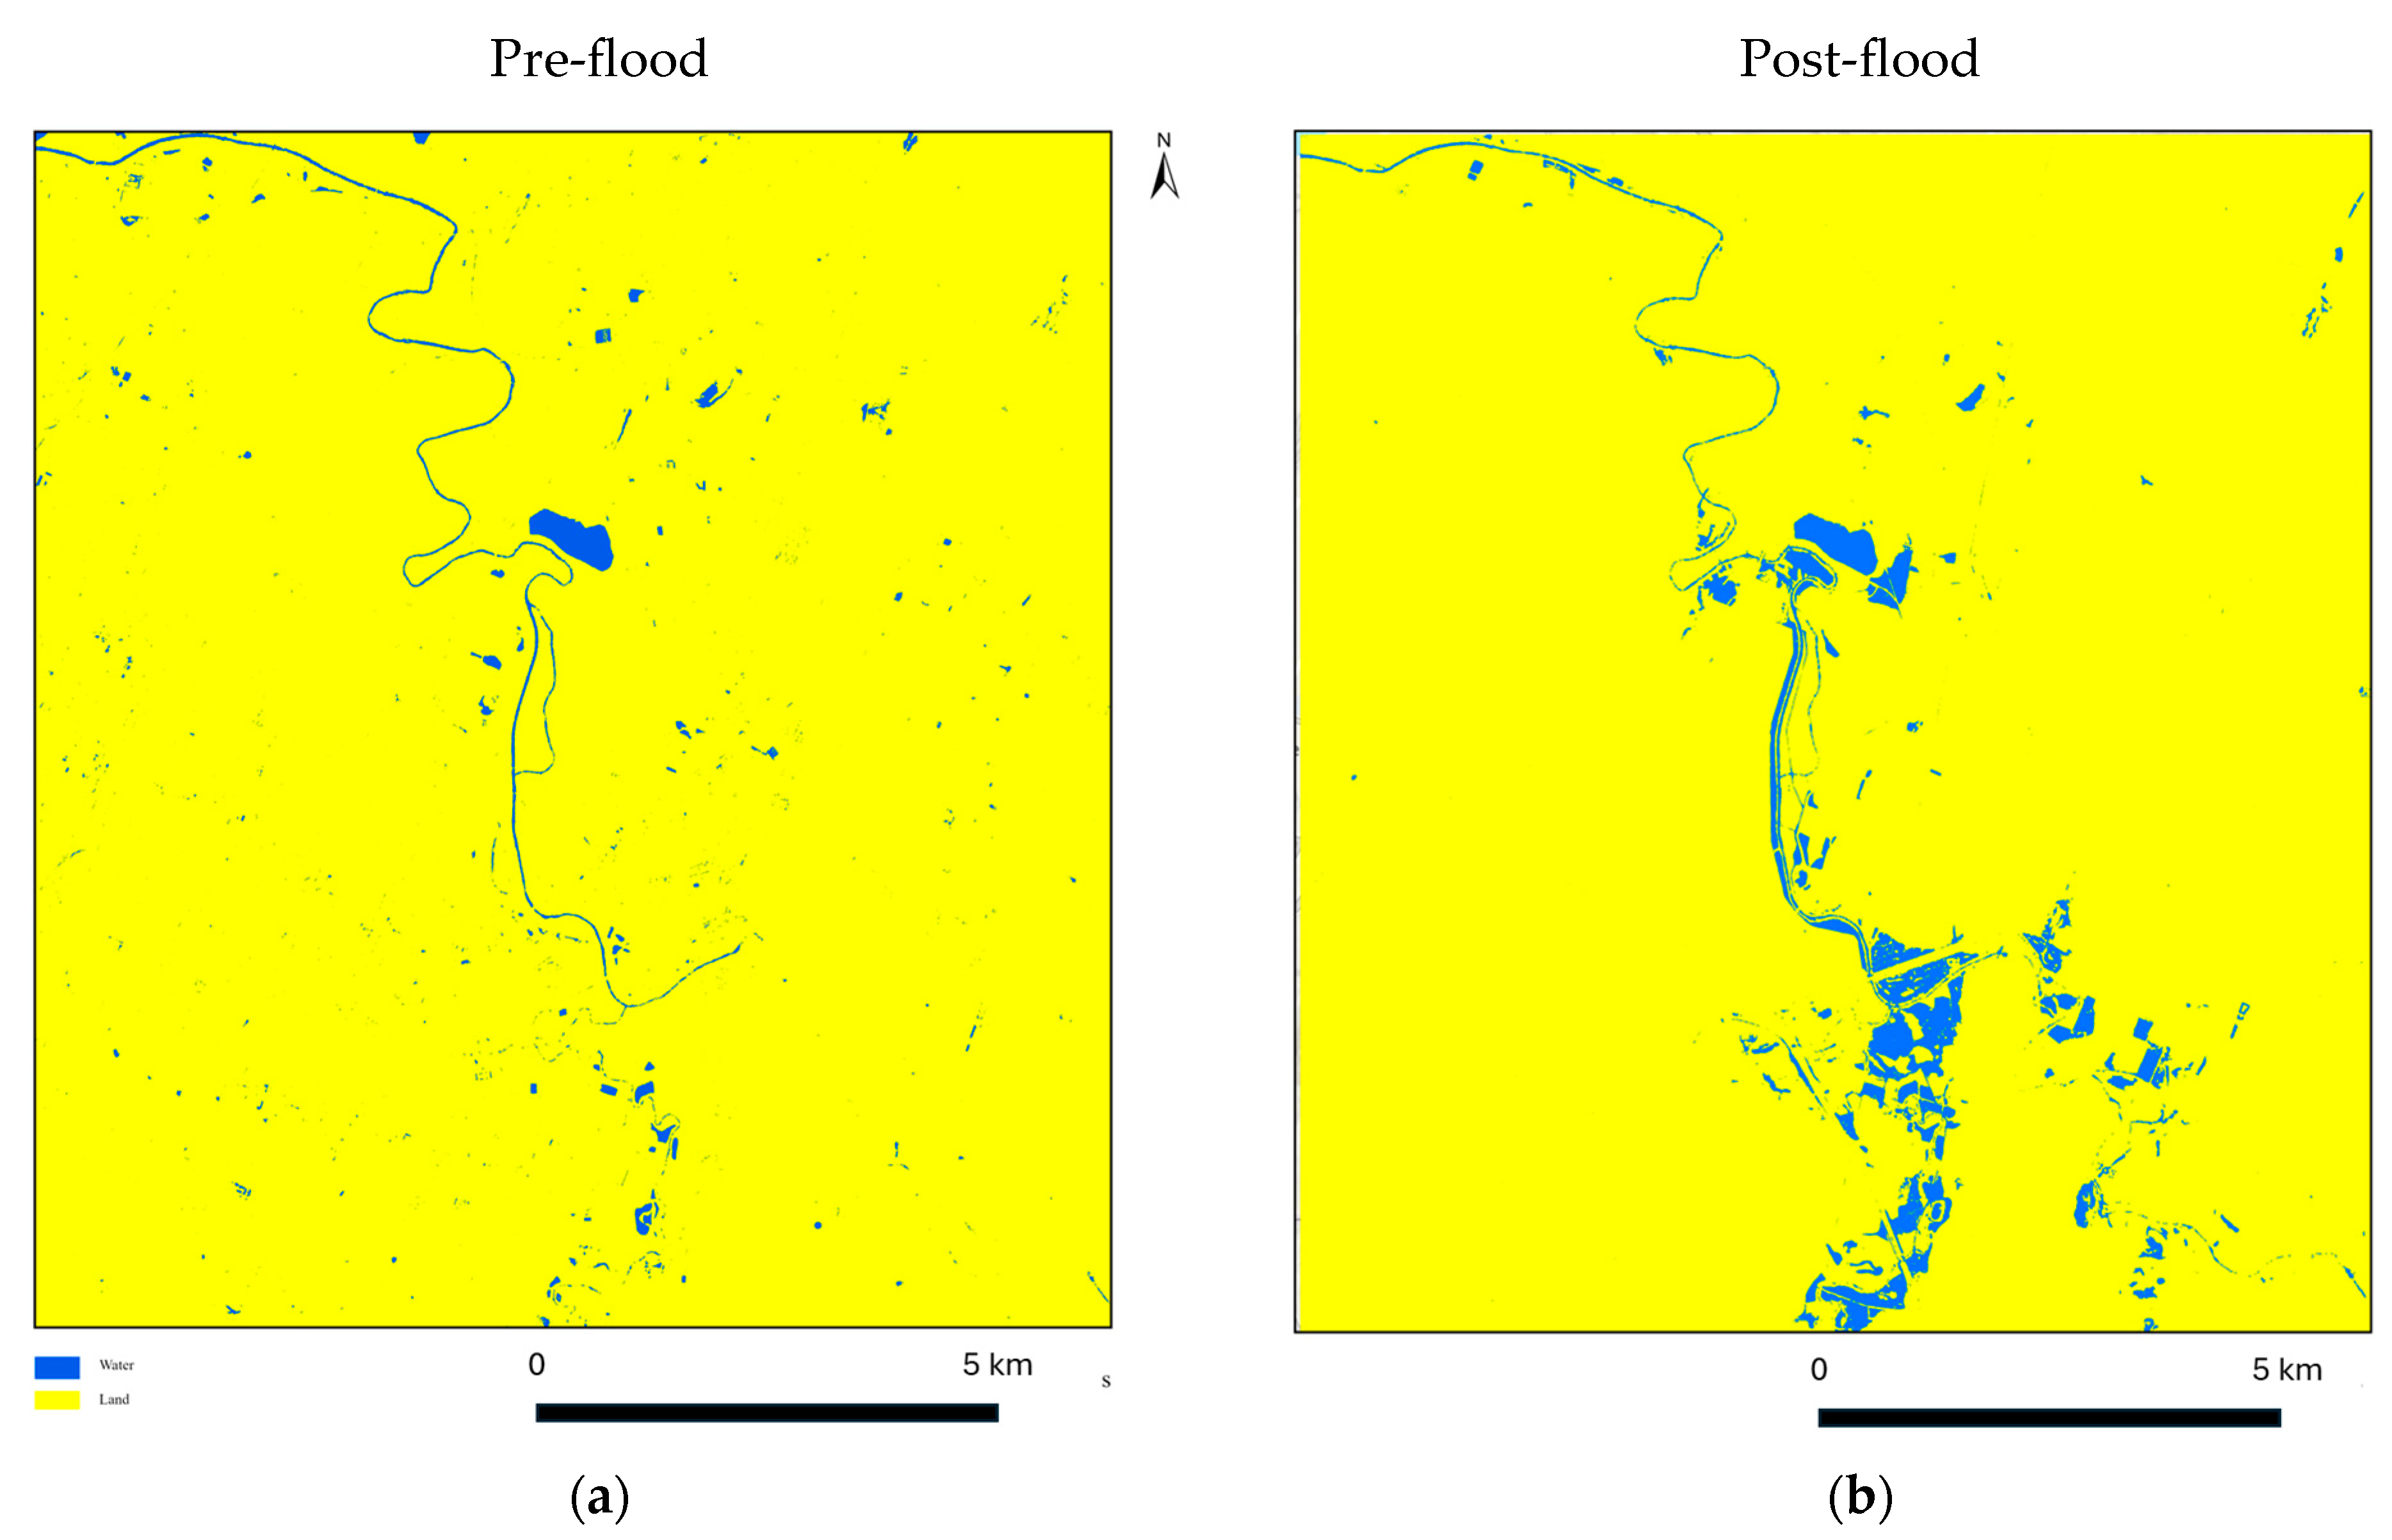
Pre-flood and post-flood maps were created to analyze the flood extent areas of the study site. Figure 6 shows the pre-flood and post-flood maps derived from NDWI image classification. Figure 7 shows the pre-flood and post-flood maps derived from unsupervised image classification.
These maps were utilized to identify and determine the spatial extent of flooded and non-flooded areas before and after flood events. Flood-inundated areas mapped by NDWI image classification show overall general agreement with the flood maps generated by unsupervised image classification using the ISODATA clustering algorithm, as seen in Figure 6 and Figure 7. However, as shown in Figure 8(iii(a),iv(a)), there are some small parts of the study site where NDWI and the ISODATA clustering algorithm produced different flood inundated areas.
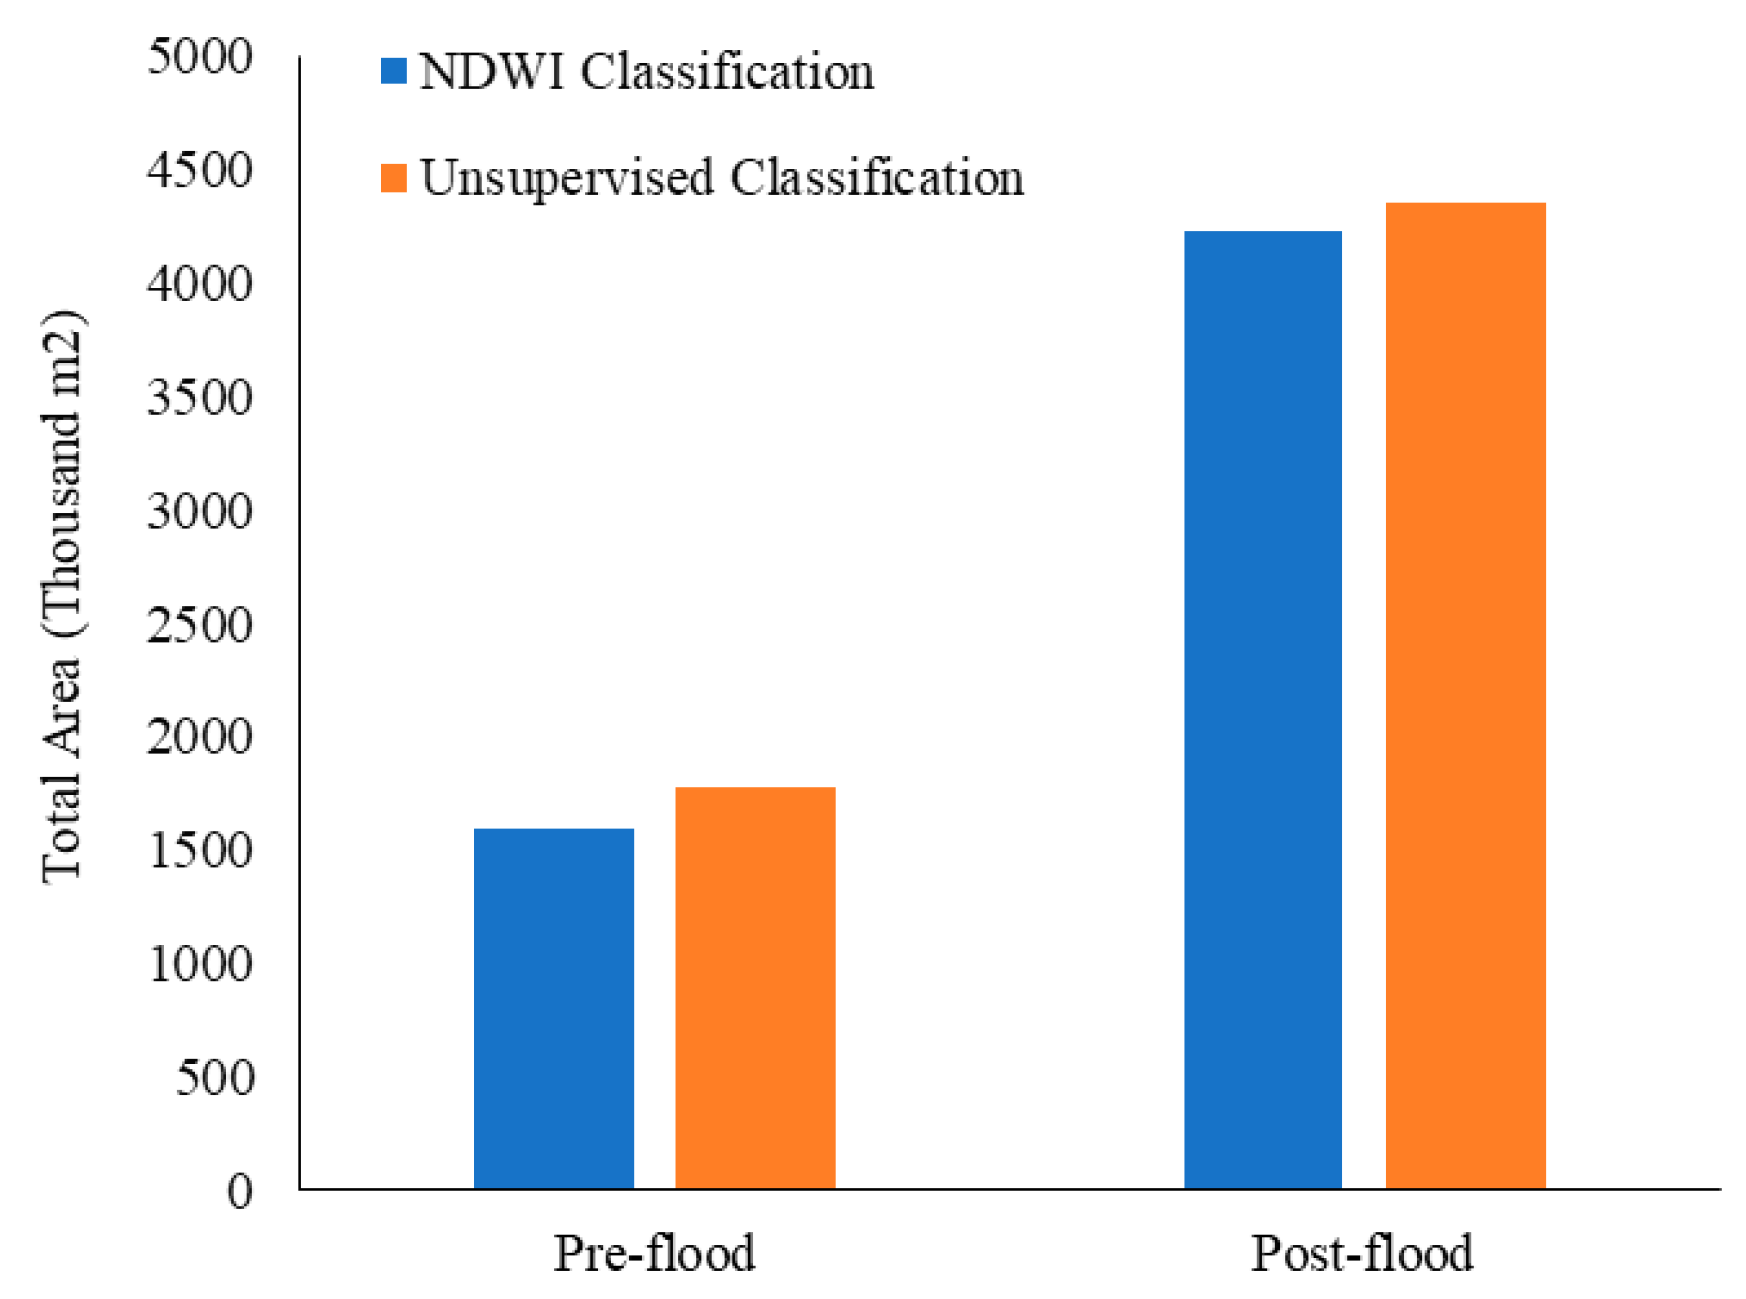
Using NDWI classification, the total water-covered areas in pre-flood conditions were almost 1.6 million m2, which became more than 4.0 million m2 in post-flood conditions (Figure 9). Flood-inundated areas were more than 2.5 million m2. Unsupervised classification showed a total flood-affected areas of around 2.6 million m2. After flooding, the creek width significantly increased, resulting in water entrances in the surrounding built-up areas. For example, most neighborhoods and streets near the creek experienced high flooding. A possible reason could be poor drainage or sewer systems in those areas due to impervious surfaces. It was noticeable that low-lying areas in the south part also experienced tremendous water extent due to natural water movement from mountainous areas.

4. Discussion

This study investigated the potential of high-resolution commercial optical satellite imagery for flood mapping through the case study of South Chickamauga Creek, TN. The limited spatial resolution of open-source remotely sensed imagery poses significant challenges in accurately capturing the flood extent of this small creek, which varies in width from less than 10 m to over 50 m. Figure 3 shows how difficult it is to detect the creek using Landsat 8 OLI imagery with its 30 m spatial resolution. The results obtained in this study clearly indicate that high-resolution PlanetScope imagery with a spatial resolution of 3 m can effectively delineate the flood extent of the creek. This was achieved using density slicing of normalized difference water index (NDWI) and unsupervised image classification coupled with ISODATA clustering algorithm.
In this study, both NDWI and the ISODATA clustering algorithm produced comparable results for flood mapping. However, NDWI requires carefully selecting thresholds, as they directly impact accuracy. Without ground truth data during the flood event, thresholds were based on the study site’s original satellite imagery. These thresholds differed between pre- and post-flood conditions due to variations in NDWI values. Studies show that thresholds for optical remote sensing indices like normalized difference vegetation index (NDVI) and NDWI vary depending on research goals, study sites, and imagery sources. Thus, establishing appropriate NDWI thresholds for each image is essential to distinguish water from non-water features accurately [81]. For instance, Ogashawara et al. [59] used two distinct NDWI threshold values for pre- and post-flood conditions with Landsat 5 TM images. Similarly, Blanton and Hossain [76] applied varying NDVI threshold values using Landsat 8 OLI imagery to analyze vegetation growth over time in Copper Basin, TN. Threshold selection also depends on image quality and resolution, as mixed pixels in coarse-resolution imagery like MODIS (250 m) can reduce classification accuracy [81].
Urban environments add complexity to NDWI image classification due to spectral similarities among features like grasslands, built-up areas, and orchards, which influence reflectance. SZABÓ et al. [82] found that orchards and gardens affected reflectance in built-up areas, making classification harder. Similarly, in our study, the high vegetation cover (75%) and residential gardens likely impacted NDWI thresholds. Building shadows also mimic water reflectance, complicating classification [83]. Post-flood conditions, including precipitation and soil saturation, further alter NDWI values.
NDWI thresholds are also influenced by sensor characteristics and environmental factors [56]. Variations in calibration, lighting, and atmospheric conditions affect reflectance values, as seen in Liu et al. [84], who observed temporal changes in NDWI thresholds in the Poyang Lake region. Seasonal changes and different imaging times further contribute to variability.
Cloud cover poses another challenge by obscuring ground features and altering spectral profiles. Cloud shadows often resemble water or vegetation, leading to classification errors. Although PlanetScope imagery provides clearer scenes than Landsat or Sentinel, clouds remain a concern. Developing algorithms to address cloud effects and applying adaptive thresholding methods can improve accuracy. Testing multiple thresholds and validating against ground truth data would further enhance flood mapping reliability.
Both NDWI and the ISODATA clustering algorithm produced very similar flood extent maps, demonstrating their effectiveness for flood mapping. The results highlight the potential of PlanetScope data, which, with its high-resolution imagery, enables precise identification of flooded areas, even in complex urban environments. The flood mapping achieved a mean overall accuracy of 91.65%, and the Kappa coefficient showed a strong agreement with reference data at a mean value of 0.833. While these results are promising, incorporating in situ measurements could further validate the method and improve its accuracy. Additionally, using evaluation techniques such as root mean square error (RMSE), mean absolute percentage error (MAPE), and F1 score could provide a more comprehensive assessment of accuracy and uncertainty.
The findings of this study are highly promising, as the methodology enables accurate large-scale flood mapping without requiring complex simulation models. While hydraulic models provide detailed representations of flooding, they require extensive parameterization. The delineated flooded zones in this study cover both banks of the creek, forming a continuous swath along the watercourse.
This study was limited to one site and a single flood event due to the unavailability of historical satellite data. However, it provides valuable insights for future flood planning and management. Future research could validate the methodology and the use of PlanetScope data in other regions to assess consistency with these findings. Incorporating more image scenes and advanced processing could improve flood hazard assessments. Dividing study areas into land use and land cover classes and applying advanced image processing could refine the identification of specific classes or objects. The inundation maps produced could also contribute to creating flood vulnerability and risk maps.
The study relied solely on satellite imagery for identifying submerged areas, without depth information. This limitation could reduce the method’s effectiveness. Using a Digital Elevation Model (DEM) before and after the flood would provide precise depth data, and integrating LIDAR technology could generate these DEMs. Subtracting post-flood DEM from pre-flood DEM would help calculate submerged depths.
Local news reports highlighted the significant impact of the flood, including property damage and water contamination, particularly for individuals living near the creek. A post-flood affected area map is crucial for planning evacuation and mitigation strategies, especially in areas that are difficult to access during disasters.
PlanetScope data offers detailed observations, allowing precise flood boundary delineation and identification of fine-scale features. These high-resolution data are valuable for accurate flood mapping, risk assessments, and analyzing impacts on specific land cover types and urban areas. It also supports the validation of hydrodynamic and numerical flood models, such as those by Veiga et al. [85], Adnan et al. [86], Chowdhury and Hassan [87], and Belvederesi et al. [88]. Additionally, PlanetScope’s high spatial resolution aids in informed decision-making for flood management, emergency response, and mitigation strategies. Continuous monitoring allows tracking flood progression over time, strengthening flood management practices. However, high-resolution PlanetScope data can be expensive and may have limited temporal resolution, restricting its accessibility for some regions or organizations. The large data volumes require significant storage and processing capabilities, posing additional challenges [56]. Optical data quality can also be affected by geometric, radiometric, and atmospheric conditions [56,57].
Combining PlanetScope data with other datasets can be challenging due to differences in scale and format. Solutions include forming partnerships, investing in cloud-based storage and processing, providing technical training, and using multiple data sources for better temporal coverage. Synthetic aperture radar (SAR) and UAV imagery can help address atmospheric interference. Standardized protocols for integrating data can further enhance the effective use of PlanetScope data in flood mapping.

5. Conclusions

This study, conducted in South Chickamauga Creek, Chattanooga, TN, demonstrates the effectiveness of high-resolution PlanetScope imagery for flood mapping. The methodology achieved an overall accuracy of 90% to 93.33%, with Kappa coefficients ranging from 0.80 to 0.87. By applying the density slicing of the normalized difference water index (NDWI) and the ISODATA clustering algorithm, this study offers a simpler alternative to more complex data-driven methods used in many other studies. For example, Mehmood et al. [58] used Landsat satellite imagery with the Google Earth Engine platform for regional flood mapping, achieving accuracies of 74% to 89%. Farhadi et al. [89] applied multi-criteria decision-making and remote sensing to map floods in Khuzestan, Iran, with accuracies of 93.65% (pre-flood) and 94.52% (post-flood) and Kappa coefficients of 0.923 and 0.935. Feng et al. [32] utilized UAV remote sensing and random forest classification for urban flood mapping in Yuyao, China, achieving 87.3% accuracy and a Kappa coefficient of 0.746. Munasinghe et al. [26] used NDWI and unsupervised classification methods for flood mapping with accuracies of 77.1% and 79.6%. Dao and Liou [18] used object-based flood mapping with Landsat satellite imagery in Cambodia, achieving 95–96% accuracy and Kappa coefficients of 0.90–0.93. Wang [90] analyzed coastal flooding from Hurricane Floyd in North Carolina using Landsat imagery, aerial photography, and DEM data, reporting accuracies of 84.6% and 87.0%.
This research marks the first application of high-resolution PlanetScope imagery for flood mapping in Chattanooga, TN, and provides a proof of concept of the application of remote sensing technology for mapping floods caused by narrow streams like South Chickamauga Creek.
Adopting this flood mapping methodology could significantly improve risk assessment, mitigation planning, and disaster response efforts. The use of satellite imagery enables researchers and policymakers to make informed, data-driven decisions to protect communities and enhance resilience against future flooding. As satellite technology advances, integrating high-resolution imagery into flood mapping will remain essential for managing flood risks and promoting sustainable development in vulnerable areas worldwide.

Author Contributions

M.C. processed and analyzed all the satellite imagery and data. He also wrote the original manuscript and edited the manuscript. A.K.M.A.H. acquired data, supervised the research, revised the manuscript, and served as the corresponding author. All authors have read and agreed to the published version of the manuscript.

Funding

This research received no external funding.

Data Availability Statement

The original contributions presented in the study are included in the article, further inquiries can be directed to the corresponding author.

Acknowledgments

Thanks are due to Planet Labs PBC for providing the required satellite imagery for the study at no cost. Thanks, are also due to the University of Tennessee at Chattanooga and the Department of Biology, Geology, and Environmental Science for providing access to geospatial software for this research. The authors also would like to thank Connor Firat for assisting in geospatial data processing.

Conflicts of Interest

The authors declare no conflicts of interest.

References

  1. Amen, A.R.M.; Mustafa, A.; Kareem, D.A.; Hameed, H.M.; Mirza, A.A.; Szydłowski, M.; Saleem, B.K.M. Mapping of flood-prone areas utilizing GIS techniques and remote sensing: A case study of Duhok, Kurdistan Region of Iraq. Remote Sens. 2023, 15, 1102. [Google Scholar] [CrossRef]
  2. Isma’il, M.; Saanyol, I.O. Application of remote sensing (RS) and geographic information systems (GIS) in flood vulnerability mapping: Case study of River Kaduna. Int. J. Geomat. Geosci. 2013, 3, 618–627. [Google Scholar]
  3. Statista. Economic Damage Caused by Floods and Flash Floods in the United States from 1995 to 2022. Available online: https://www.statista.com/statistics/237420/economic-damage-caused-by-floods-and-flash-floods-in-the-us/#statisticContainer (accessed on 20 September 2024).
  4. Domeneghetti, A.; Schumann, G.J.P.; Tarpanelli, A. Preface: Remote sensing for flood mapping and monitoring of flood dynamics. Remote Sens. 2019, 11, 943. [Google Scholar] [CrossRef]
  5. Kuenzer, C.; Guo, H.; Huth, J.; Leinenkugel, P.; Li, X.; Dech, S. Flood mapping and flood dynamics of the Mekong Delta: ENVISAT-ASAR-WSM based time series analyses. Remote Sens. 2013, 5, 687–715. [Google Scholar] [CrossRef]
  6. Wang, D.; Xie, Q.; Du, Y.; Wang, W.; Chen, J. The 1997–1998 warm event in the South China Sea. Chin. Sci. Bull. 2002, 47, 1221–1227. [Google Scholar]
  7. Idowu, D.; Zhou, W. Global Megacities and Frequent Floods: Correlation between Urban Expansion Patterns and Urban Flood Hazards. Sustainability 2023, 15, 2514. [Google Scholar] [CrossRef]
  8. Wang, G.; Hu, Z.; Liu, Y.; Zhang, G.; Liu, J.; Lyu, Y.; Gu, Y.; Huang, X.; Zhang, Q.; Tong, Z.; et al. Impact of expansion pattern of built-up land in floodplains on flood vulnerability: A case study in the North China Plain area. Remote Sens. 2020, 12, 3172. [Google Scholar] [CrossRef]
  9. Zhou, Q.; Leng, G.; Su, J.; Ren, Y. Comparison of urbanization and climate change impacts on urban flood volumes: Importance of urban planning and drainage adaptation. Sci. Total Environ. 2019, 658, 24–33. [Google Scholar] [CrossRef]
  10. Plate, E.J. Flood risk and flood management. J. Hydrol. 2002, 267, 2–11. [Google Scholar] [CrossRef]
  11. Halounova, L.; Holubec, V. Assessment of flood with regards to land cover changes. Procedia Econ. Financ. 2014, 18, 940–947. [Google Scholar] [CrossRef]
  12. Ekeu-wei, I.T.; Blackburn, G.A. Applications of open-access remotely sensed data for flood modelling and mapping in developing regions. Hydrology 2018, 5, 39. [Google Scholar] [CrossRef]
  13. Opolot, E. Application of remote sensing and geographical information systems in flood management: A review. Res. J. Appl. Sci. Eng. Technol. 2013, 6, 1884–1894. [Google Scholar] [CrossRef]
  14. Wang, X.; Xie, H. A review on applications of remote sensing and geographic information systems (GIS) in water resources and flood risk management. Water 2018, 10, 608. [Google Scholar] [CrossRef]
  15. Kumar, V.; Sharma, K.V.; Pham, Q.B.; Srivastava, A.K.; Bogireddy, C.; Yadav, S.M. Advancements in drought using remote sensing: Assessing progress, overcoming challenges, and exploring future opportunities. Theor. Appl. Climatol. 2024, 155, 4251–4288. [Google Scholar] [CrossRef]
  16. Chowdhury, T.R.; Faruk, O.; Chanda, M.; Falak, A.A.; Akter, A. Groundwater Table Variation in Rangunia Upazila Using GIS Application: A Case Study. In Proceedings of the International Conference on Planning, Architecture, & Civil Engineering (ICPACE), Rajshahi, Bangladesh, 9–11 September 2021. [Google Scholar]
  17. Tanguy, M.; Chokmani, K.; Bernier, M.; Poulin, J.; Raymond, S. River flood mapping in urban areas combining Radarsat-2 data and flood return period data. Remote Sens. Environ. 2017, 198, 442–459. [Google Scholar] [CrossRef]
  18. Dao, P.D.; Liou, Y.A. Object-based flood mapping and affected rice field estimation with Landsat 8 OLI and MODIS data. Remote Sens. 2015, 7, 5077–5097. [Google Scholar] [CrossRef]
  19. Notti, D.; Giordan, D.; Caló, F.; Pepe, A.; Zucca, F.; Galve, J.P. Potential and limitations of open satellite data for flood mapping. Remote Sens. 2018, 10, 1673. [Google Scholar] [CrossRef]
  20. Saha, A.K.; Agrawal, S. Mapping and assessment of flood risk in Prayagraj district, India: A GIS and remote sensing study. Nanotechnol. Environ. Eng. 2020, 5, 11. [Google Scholar] [CrossRef]
  21. Islam, A.S.; Bala, S.K.; Haque, M.A. Flood inundation map of Bangladesh using MODIS time-series images. J. Flood Risk Manag. 2010, 3, 210–222. [Google Scholar] [CrossRef]
  22. Chormanski, J.; Okruszko, T.; Ignar, S.; Batelaan, O.; Rebel, K.T.; Wassen, M.J. Flood mapping with remote sensing and hydrochemistry: A new method to distinguish the origin of flood water during floods. Ecol. Eng. 2011, 37, 1334–1349. [Google Scholar] [CrossRef]
  23. Brivio, P.A.; Colombo, R.; Maggi, M.; Tomasoni, R. Integration of remote sensing data and GIS for accurate mapping of flooded areas. Int. J. Remote Sens. 2022, 23, 429–441. [Google Scholar] [CrossRef]
  24. Dano, U.L.; Matori, A.N.; Hashim, A.M.; Chandio, I.A.; Sabri, S.; Balogun, A.L.; Abba, H.A. Geographic information system and remote sensing applications in flood hazards management: A review. Res. J. Appl. Sci. Eng. Technol. 2011, 3, 933–947. [Google Scholar]
  25. Hussain, E.; Shan, J. Mapping major floods with optical and SAR satellite images. In Proceedings of the IEEE Geoscience and Remote Sensing Symposium, Honolulu, HI, USA, 25–30 July 2010; pp. 25–30. [Google Scholar]
  26. Munasinghe, D.; Cohen, S.; Huang, Y.F.; Tsang, Y.P.; Zhang, J.; Fang, Z. Intercomparison of satellite remote sensing-based flood inundation mapping techniques. J. Am. Water Resour. Assoc. 2018, 54, 834–846. [Google Scholar] [CrossRef]
  27. Sadiq, R.; Akhtar, Z.; Imran, M.; Ofli, F. Integrating remote sensing and social sensing for flood mapping. Remote Sens. Appl. 2022, 25, 100697. [Google Scholar] [CrossRef]
  28. Syifa, M.; Park, S.J.; Achmad, A.R.; Lee, C.W.; Eom, J. Flood mapping using remote sensing imagery and artificial intelligence techniques: A case study in Brumadinho, Brazil. J Coast Res. 2019, 90, 197–204. [Google Scholar] [CrossRef]
  29. Bafitlhile, T.M.; Li, Z. Applicability of ε-support vector machine and artificial neural network for flood forecasting in humid, semi-humid and semi-arid basins in China. Water 2019, 11, 85. [Google Scholar] [CrossRef]
  30. Farhadi, H.; Najafzadeh, M. Flood risk mapping by remote sensing data and random forest technique. Water 2021, 13, 3115. [Google Scholar] [CrossRef]
  31. Shahabi, H.; Shirzadi, A.; Ghaderi, K.; Omidvar, E.; Al-Ansari, N.; Clague, J.J.; Geertsema, M.; Khosravi, K.; Amini, A.; Bahrami, S.; et al. Flood detection and susceptibility mapping using sentinel-1 remote sensing data and a machine learning approach: Hybrid intelligence of bagging ensemble based on k-nearest neighbor classifier. Remote Sens. 2020, 12, 266. [Google Scholar] [CrossRef]
  32. Feng, Q.; Liu, J.; Gong, J. Urban flood mapping based on unmanned aerial vehicle remote sensing and random forest classifier—A case of Yuyao, China. Water 2015, 7, 1437–1455. [Google Scholar] [CrossRef]
  33. Arabameri, A.; Saha, S.; Mukherjee, K.; Blaschke, T.; Chen, W.; Ngo, P.T.T.; Band, S.S. Modeling spatial flood using novel ensemble artificial intelligence approaches in northern Iran. Remote Sens. 2020, 12, 3423. [Google Scholar] [CrossRef]
  34. Uddin, K.; Matin, M.A.; Meyer, F.J. Operational flood mapping using multi-temporal Sentinel-1 SAR images: A case study from Bangladesh. Remote Sens. 2019, 11, 1581. [Google Scholar] [CrossRef]
  35. Sanyal, J.; Lu, X.X. Application of remote sensing in flood management with special reference to monsoon Asia: A review. Nat. Hazards 2004, 33, 283–301. [Google Scholar] [CrossRef]
  36. Hu, Q.; Zhu, Y.; Hu, H.; Guan, Z.; Qian, Z.; Yang, A. Multiple kernel learning with maximum inundation extent from MODIS imagery for spatial prediction of flood susceptibility. Water Resour. Manag. 2022, 36, 55–73. [Google Scholar] [CrossRef]
  37. Huang, M.; Jin, S. Rapid flood mapping and evaluation with a supervised classifier and change detection in Shouguang using Sentinel-1 SAR and Sentinel-2 optical data. Remote Sens. 2020, 12, 2073. [Google Scholar] [CrossRef]
  38. Zhang, F.; Zhu, X.; Liu, D. Blending MODIS and Landsat images for urban flood mapping. Int. J. Remote Sens. 2014, 35, 3237–3253. [Google Scholar] [CrossRef]
  39. Fayne, J.V.; Bolten, J.D.; Doyle, C.S.; Fuhrmann, S.; Rice, M.T.; Houser, P.R.; Lakshmi, V. Flood mapping in the lower Mekong River Basin using daily MODIS observations. Int. J. Remote Sens. 2017, 38, 1737–1757. [Google Scholar] [CrossRef]
  40. Chen, M.; Fahrner, D.; Arribas-Bel, D.; Rowe, F. A reproducible notebook to acquire, process and analyze satellite imagery: Exploring long-term urban changes. Region 2020, 7, R15–R46. [Google Scholar] [CrossRef]
  41. Tarpanelli, A.; Mondini, A.C.; Camici, S. Effectiveness of Sentinel-1 and Sentinel-2 for flood detection assessment in Europe. Nat. Hazards Earth Syst. Sci. 2022, 22, 2473–2489. [Google Scholar] [CrossRef]
  42. Roy, D.P.; Huang, H.; Houborg, R.; Martins, V.S. A global analysis of the temporal availability of PlanetScope high spatial resolution multi-spectral imagery. Remote Sens. Environ. 2021, 264, 112586. [Google Scholar] [CrossRef]
  43. Planet Team. Planet Imagery Product Specifications; Planet Labs Inc.: San Francisco, CA, USA, 2018; Volume 91, p. 170. [Google Scholar]
  44. Tunca, E.; Köksal, E.S.; Taner, S.Ç. Silage maize yield estimation by using PlanetScope, sentinel-2A and Landsat 8 OLI satellite images. Smart Agric. Technol. 2023, 4, 100165. [Google Scholar] [CrossRef]
  45. Miura, T.; Tokumoto, Y.; Shin, N.; Shimizu, K.K.; Pungga, R.A.S.; Ichie, T. Utility of commercial high-resolution satellite imagery for monitoring general flowering in Sarawak, Borneo. Ecol. Res. 2023, 38, 386–402. [Google Scholar] [CrossRef]
  46. Faxon, A. Studying Suspended Sediment Concentrations in the South Chickamauga Creek of Chattanooga, TN Using Satellite Imagery, Digital Image Processing, and Numeric Modeling. Honors Thesis, The University of Tennessee at Chattanooga, Chattanooga, TN, USA, 2022. [Google Scholar]
  47. Niroumand-Jadidi, M.; Bovolo, F.; Bruzzone, L.; Gege, P. Physics-based bathymetry and water quality retrieval using planetscope imagery: Impacts of 2020 COVID-19 lockdown and 2019 extreme flood in the Venice Lagoon. Remote Sens. 2020, 12, 2381. [Google Scholar] [CrossRef]
  48. Elkhrachy, I. Flash flood hazard mapping using satellite images and GIS tools: A case study of Najran City, Kingdom of Saudi Arabia (KSA). Egypt. J. Remote Sens. Space Sci. 2015, 18, 261–278. [Google Scholar] [CrossRef]
  49. Dey, P. Sensitivity and Uncertainty Analysis in Hydrological Modeling: A Case Study of South Chickamauga Creek Watershed Using BASINS/HSPF. Master’s Thesis, The University of Tennessee at Chattanooga, Chattanooga, TN, USA, 2021. [Google Scholar]
  50. South Chickamauga Creek near Chickamauga, TN. USGS Water Data for the Nation. Available online: https://waterdata.usgs.gov/monitoring-location/03567500/#parameterCode=00065&period=P7D&showMedian=false (accessed on 20 September 2024).
  51. Rain Causes Flooding at South Chickamauga Creek. 2021. Available online: https://www.local3news.com/rain-causes-flooding-at-south-chickamauga-creek/article_4f40c589-060a-5b91-8299-1f1b6fd75db7.html (accessed on 20 September 2024).
  52. Record Flooding of May 2003 Across East Tennessee. 2003. Available online: https://www.weather.gov/mrx/may03flood#:~:text=Heavy%20rains%20across%20the%20South,feet%20observed%20in%20February%201990 (accessed on 20 September 2024).
  53. Flood Damage up to $17 Million as 480 Structures Affected. Available online: https://www.chattanoogan.com/2003/5/8/36201/Flood-Damage-Up-To-17-Million-As-480.aspx (accessed on 20 September 2024).
  54. Uddin, K.; Matin, M.A. Potential flood hazard zonation and flood shelter suitability mapping for disaster risk mitigation in Bangladesh using geospatial technology. Prog. Disaster Sci. 2021, 11, 100185. [Google Scholar] [CrossRef]
  55. Veh, G.; Lützow, N.; Tamm, J.; Luna, L.V.; Hugonnet, R.; Vogel, K.; Geertsema, M.; Clague, J.J.; Korup, O. Less extreme and earlier outbursts of ice-dammed lakes since 1900. Nature 2023, 614, 701–707. [Google Scholar] [CrossRef]
  56. Frazier, A.E.; Hemingway, B.L. A technical review of planet smallsat data: Practical considerations for processing and using planetscope imagery. Remote Sens. 2021, 13, 3930. [Google Scholar] [CrossRef]
  57. Aati, S.; Avouac, J.P.; Rupnik, E.; Deseilligny, M.P. Potential and limitation of planetscope images for 2-D and 3-D earth surface monitoring with example of applications to glaciers and earthquakes. IEEE Trans. Geosci. Remote Sens. 2022, 60, 1–19. [Google Scholar] [CrossRef]
  58. Mehmood, H.; Conway, C.; Perera, D. Mapping of flood areas using landsat with google earth engine cloud platform. Atmosphere 2021, 12, 866. [Google Scholar] [CrossRef]
  59. Ogashawara, I.; Curtarelli, M.P.; Ferreira, C.M. The use of optical remote sensing for mapping flooded areas. J. Eng. Res. Appl. 2013, 3, 1956–1960. [Google Scholar]
  60. Li, C.; Dash, J.; Asamoah, M.; Sheffield, J.; Dzodzomenyo, M.; Gebrechorkos, S.H.; Anghileri, D.; Wright, J. Increased flooded area and exposure in the White Volta river basin in Western Africa, identified from multi-source remote sensing data. Sci. Rep. 2022, 12, 3701. [Google Scholar] [CrossRef]
  61. Hossain, A.K.M.A.; Jia, Y.; Chao, X. Estimation of Manning’s roughness coefficient distribution for hydrodynamic model using remotely sensed land cover features. In Proceedings of the IEEE 17th International Conference on Geoinformatics, Fairfax, VA, USA, 12–14 August 2009; pp. 1–4. [Google Scholar]
  62. Hall, J.; Hossain, A.K.M.A. Mapping urbanization and evaluating its possible impacts on stream water quality in Chattanooga, Tennessee, using GIS and remote sensing. Sustainability 2020, 12, 1980. [Google Scholar] [CrossRef]
  63. Hossain, A.K.M.A.; Easson, G. Mapping small reservoirs in semi-arid region using optical and microwave remote sensing. In Proceedings of the ASPRS 2007 Annual Conference, Tampa, FL, USA, 7–11 May 2007; pp. 7–11. [Google Scholar]
  64. Campbell, J.B. Introduction to Remote Sensing, 3rd ed.; Taylor & Francis Ltd.: Abingdon, UK, 2002. [Google Scholar]
  65. Enderle, D.I.; Weih, R.C., Jr. Integrating supervised and unsupervised classification methods to develop a more accurate land cover classification. J. Ark. Acad. Sci. 2005, 59, 65–73. [Google Scholar]
  66. Rahman, M.R.; Thakur, P.K. Detecting, mapping and analysing of flood water propagation using synthetic aperture radar (SAR) satellite data and GIS: A case study from the Kendrapara District of Orissa State of India. Egypt. J. Remote Sens. Space Sci. 2018, 21, S37–S41. [Google Scholar] [CrossRef]
  67. Hasmadi, M.; Pakhriazad, H.Z.; Shahrin, M.F. Evaluating supervised and unsupervised techniques for land cover mapping using remote sensing data. Geogr. Malays. J. Soc. Space 2009, 5, 1–10. [Google Scholar]
  68. Akter, T.; Gazi, M.Y.; Mia, M.B. Assessment of land cover dynamics, land surface temperature, and heat island growth in northwestern Bangladesh using satellite imagery. Environ. Process. 2021, 8, 661–690. [Google Scholar] [CrossRef]
  69. Chang, Z.; Du, Z.; Zhang, F.; Huang, F.; Chen, J.; Li, W.; Guo, Z. Landslide susceptibility prediction based on remote sensing images and GIS: Comparisons of supervised and unsupervised machine learning models. Remote Sens. 2020, 12, 502. [Google Scholar] [CrossRef]
  70. Nimbarte, N.; Nagpure, A.; Sanodiya, B.; Sevatkar, H.; Balamwar, S. Knowledge Based Classifier and Pattern Recognition Technique for Satellite Image Analysis. In Proceedings of the IEEE 3rd Global Conference for Advancement in Technology (GCAT), Bangalore, India, 7–9 October 2022; pp. 1–6. [Google Scholar]
  71. Anusha, N.; Bharathi, B. Flood detection and flood mapping using multi-temporal synthetic aperture radar and optical data. Egypt. J. Remote Sens. Space Sci. 2020, 23, 207–219. [Google Scholar] [CrossRef]
  72. Amitrano, D.; Di Martino, G.; Iodice, A.; Riccio, D.; Ruello, G. Unsupervised rapid flood mapping using Sentinel-1 GRD SAR images. IEEE Trans. Geosci. Remote Sens. 2018, 56, 3290–3299. [Google Scholar] [CrossRef]
  73. Landuyt, L.; Verhoest, N.E.; Van Coillie, F.M. Flood mapping in vegetated areas using an unsupervised clustering approach on sentinel-1 and-2 imagery. Remote Sens. 2020, 12, 3611. [Google Scholar] [CrossRef]
  74. Overview of Image Classification. Available online: https://pro.arcgis.com/en/pro-app/latest/help/analysis/image-analyst/overview-of-image-classification.htm#:~:text=Unsupervised%20classification%20is%20where%20you,class%20categories%20within%20your%20schema (accessed on 20 September 2024).
  75. Eroğlu, H.; Çakır, G.; Sivrikaya, F.; Akay, A.E. Using high resolution images and elevation data in classifying erosion risks of bare soil areas in the Hatila Valley Natural Protected Area, Turkey. Stoch. Environ. Res. Risk Assess. 2010, 24, 699–704. [Google Scholar] [CrossRef]
  76. Blanton, R.; Hossain, A.K.M.A. Mapping the recovery process of vegetation growth in the Copper Basin, Tennessee using remote sensing technology. GeoHazards 2020, 1, 31–43. [Google Scholar] [CrossRef]
  77. Costache, R.; Pham, Q.B.; Sharifi, E.; Linh, N.T.T.; Abba, S.I.; Vojtek, M.; Vojteková, J.; Nhi, P.T.T.; Khoi, D.N. Flash-flood susceptibility assessment using multi-criteria decision making and machine learning supported by remote sensing and GIS techniques. Remote Sens. 2019, 12, 106. [Google Scholar] [CrossRef]
  78. Gašparović, M.; Dobrinić, D.; Medak, D. Urban vegetation detection based on the land-cover classification of PlanetScope, RapidEye and worldview-2 satellite imagery. In Proceedings of the 18th International Multidisciplinary Scientific Geo-Conference SGEM2018, Albena, Bulgaria, 2–8 July 2018; pp. 249–256. [Google Scholar]
  79. Foody, G.M. Explaining the unsuitability of the kappa coefficient in the assessment and comparison of the accuracy of thematic maps obtained by image classification. Remote Sens. Environ. 2020, 239, 111630. [Google Scholar] [CrossRef]
  80. Du, L.; McCarty, G.W.; Zhang, X.; Lang, M.W.; Vanderhoof, M.K.; Li, X.; Huang, C.; Lee, S.; Zou, Z. Mapping forested wetland inundation in the Delmarva Peninsula, USA using deep convolutional neural networks. Remote Sens. 2020, 12, 644. [Google Scholar] [CrossRef]
  81. Ji, L.; Zhang, L.; Wylie, B. Analysis of dynamic thresholds for the normalized difference water index. Photogramm. Eng. Remote Sens. 2009, 75, 1307–1317. [Google Scholar] [CrossRef]
  82. Szabo, S.; Gácsi, Z.; Balazs, B. Specific features of NDVI, NDWI and MNDWI as reflected in land cover categories. Landsc. Environ. 2016, 10, 194–202. [Google Scholar] [CrossRef]
  83. Halder, T.; Chakraborty, D.; Pal, R.; Sarkar, S.; Mukhopadhyay, S.; Roy, N.; Karforma, S. A hybrid approach for water body identification from satellite images using NDWI mapping and histogram of gradients. Innov. Syst. Softw. Eng. 2024, 20, 111–120. [Google Scholar] [CrossRef]
  84. Liu, Y.; Song, P.; Peng, J.; Ye, C. A physical explanation of the variation in threshold for delineating terrestrial water surfaces from multi-temporal images: Effects of radiometric correction. Int. J. Remote Sens. 2012, 33, 5862–5875. [Google Scholar] [CrossRef]
  85. Veiga, V.B.; Hassan, Q.K.; He, J. Development of flow forecasting models in the Bow River at Calgary, Alberta, Canada. Water 2014, 7, 99–115. [Google Scholar] [CrossRef]
  86. Adnan, M.S.G.; Siam, Z.S.; Kabir, I.; Kabir, Z.; Ahmed, M.R.; Hassan, Q.K.; Rahman, R.M.; Dewan, A. A novel framework for addressing uncertainties in machine learning-based geospatial approaches for flood prediction. J. Environ. Manag. 2023, 326, 116813. [Google Scholar] [CrossRef]
  87. Chowdhury, E.H.; Hassan, Q.K. Use of remote sensing data in comprehending an extremely unusual flooding event over southwest Bangladesh. Nat. Hazards 2017, 88, 1805–1823. [Google Scholar] [CrossRef]
  88. Belvederesi, C.; Dominic, J.A.; Hassan, Q.K.; Gupta, A.; Achari, G. Predicting River flow using an AI-based sequential adaptive neuro-fuzzy inference system. Water 2020, 12, 1622. [Google Scholar] [CrossRef]
  89. Farhadi, H.; Esmaeily, A.; Najafzadeh, M. Flood monitoring by integration of Remote Sensing technique and Multi-Criteria Decision Making method. Comput. Geosci. 2022, 160, 105045. [Google Scholar] [CrossRef]
  90. Wang, Y. Using Landsat 7 TM data acquired days after a flood event to delineate the maximum flood extent on a coastal floodplain. Int. J. Remote Sens. 2004, 25, 959–974. [Google Scholar] [CrossRef]
Figure 1. The location map of the study site (referenced to Hamilton County, TN; Catoosa, and Walker County, GA) on an ESRI base map available on ArcGIS Pro software (version 3.1.3). The red color on the lower left side of the image indicates the study area and the right image presents the boundary of South Chickamauga Creek for this study.
Remotesensing 16 04437 g001
Figure 2. Schematic workflow of flood mapping using PlanetScope imagery.
Remotesensing 16 04437 g002
Figure 3. (a) Landsat 8 OLI and (b) PlanetScope satellite images of pre-flood conditions of the study site and a detailed pixel image of the creek width of SCC. Near-infrared bands were used to make maps for both Landsat and PlanetScope imagery.
Remotesensing 16 04437 g003
Figure 4. PlanetScope satellite images of pre- and post-flood conditions of the study site, respectively. (a,b): True color image display; (c,d): False color composite display (Green, Red, and NIR bands).
Remotesensing 16 04437 g004
Figure 5. The red color indicates the random pixel for accuracy assessment of (a) pre- flood (b) post-flood conditions. The background images are shown in true color.
Remotesensing 16 04437 g005
Figure 6. NDWI classified thematic maps of (a) pre- and (b) post-flood conditions of the study site.
Remotesensing 16 04437 g006
Figure 7. Unsupervised classified thematic maps of (a) pre- and (b) post-flood conditions of the study site.
Remotesensing 16 04437 g007
Figure 8. Major flood-affected areas of SCC using (i,iii) Density slicing of NDWI image and (ii,iv) unsupervised classification.
Remotesensing 16 04437 g008
Figure 9. Total water-covered areas of study site in pre-flood and post-flood conditions.
Remotesensing 16 04437 g009
Table 1. Descriptions of the classification categories for the study site images.
IDClassDescriptions
01WaterWater bodies—small water storage areas, retention ponds, lakes, and rivers.
02LandSurfaces without water bodies—bridges, buildings, crops, forests, industries, natural grass, pastures, roads, rocks, shrubs, and soils.
Table 2. Distribution of reference and classified pixels across different classes.
Reference PixelsNDWI Classified PixelsUnsupervised Classified PixelsTotal Pixels
WaterLandWaterLand
Water 58255560
Land65475360
Total64566258120
Disclaimer/Publisher’s Note: The statements, opinions and data contained in all publications are solely those of the individual author(s) and contributor(s) and not of MDPI and/or the editor(s). MDPI and/or the editor(s) disclaim responsibility for any injury to people or property resulting from any ideas, methods, instructions or products referred to in the content.