
Spatial-Temporal Evolution of Ecosystem Service Value in Guilin, China from 2000 to 2020: A Dual-Scale Perspective


Abstract
:1. Introduction
2. Materials and Methods
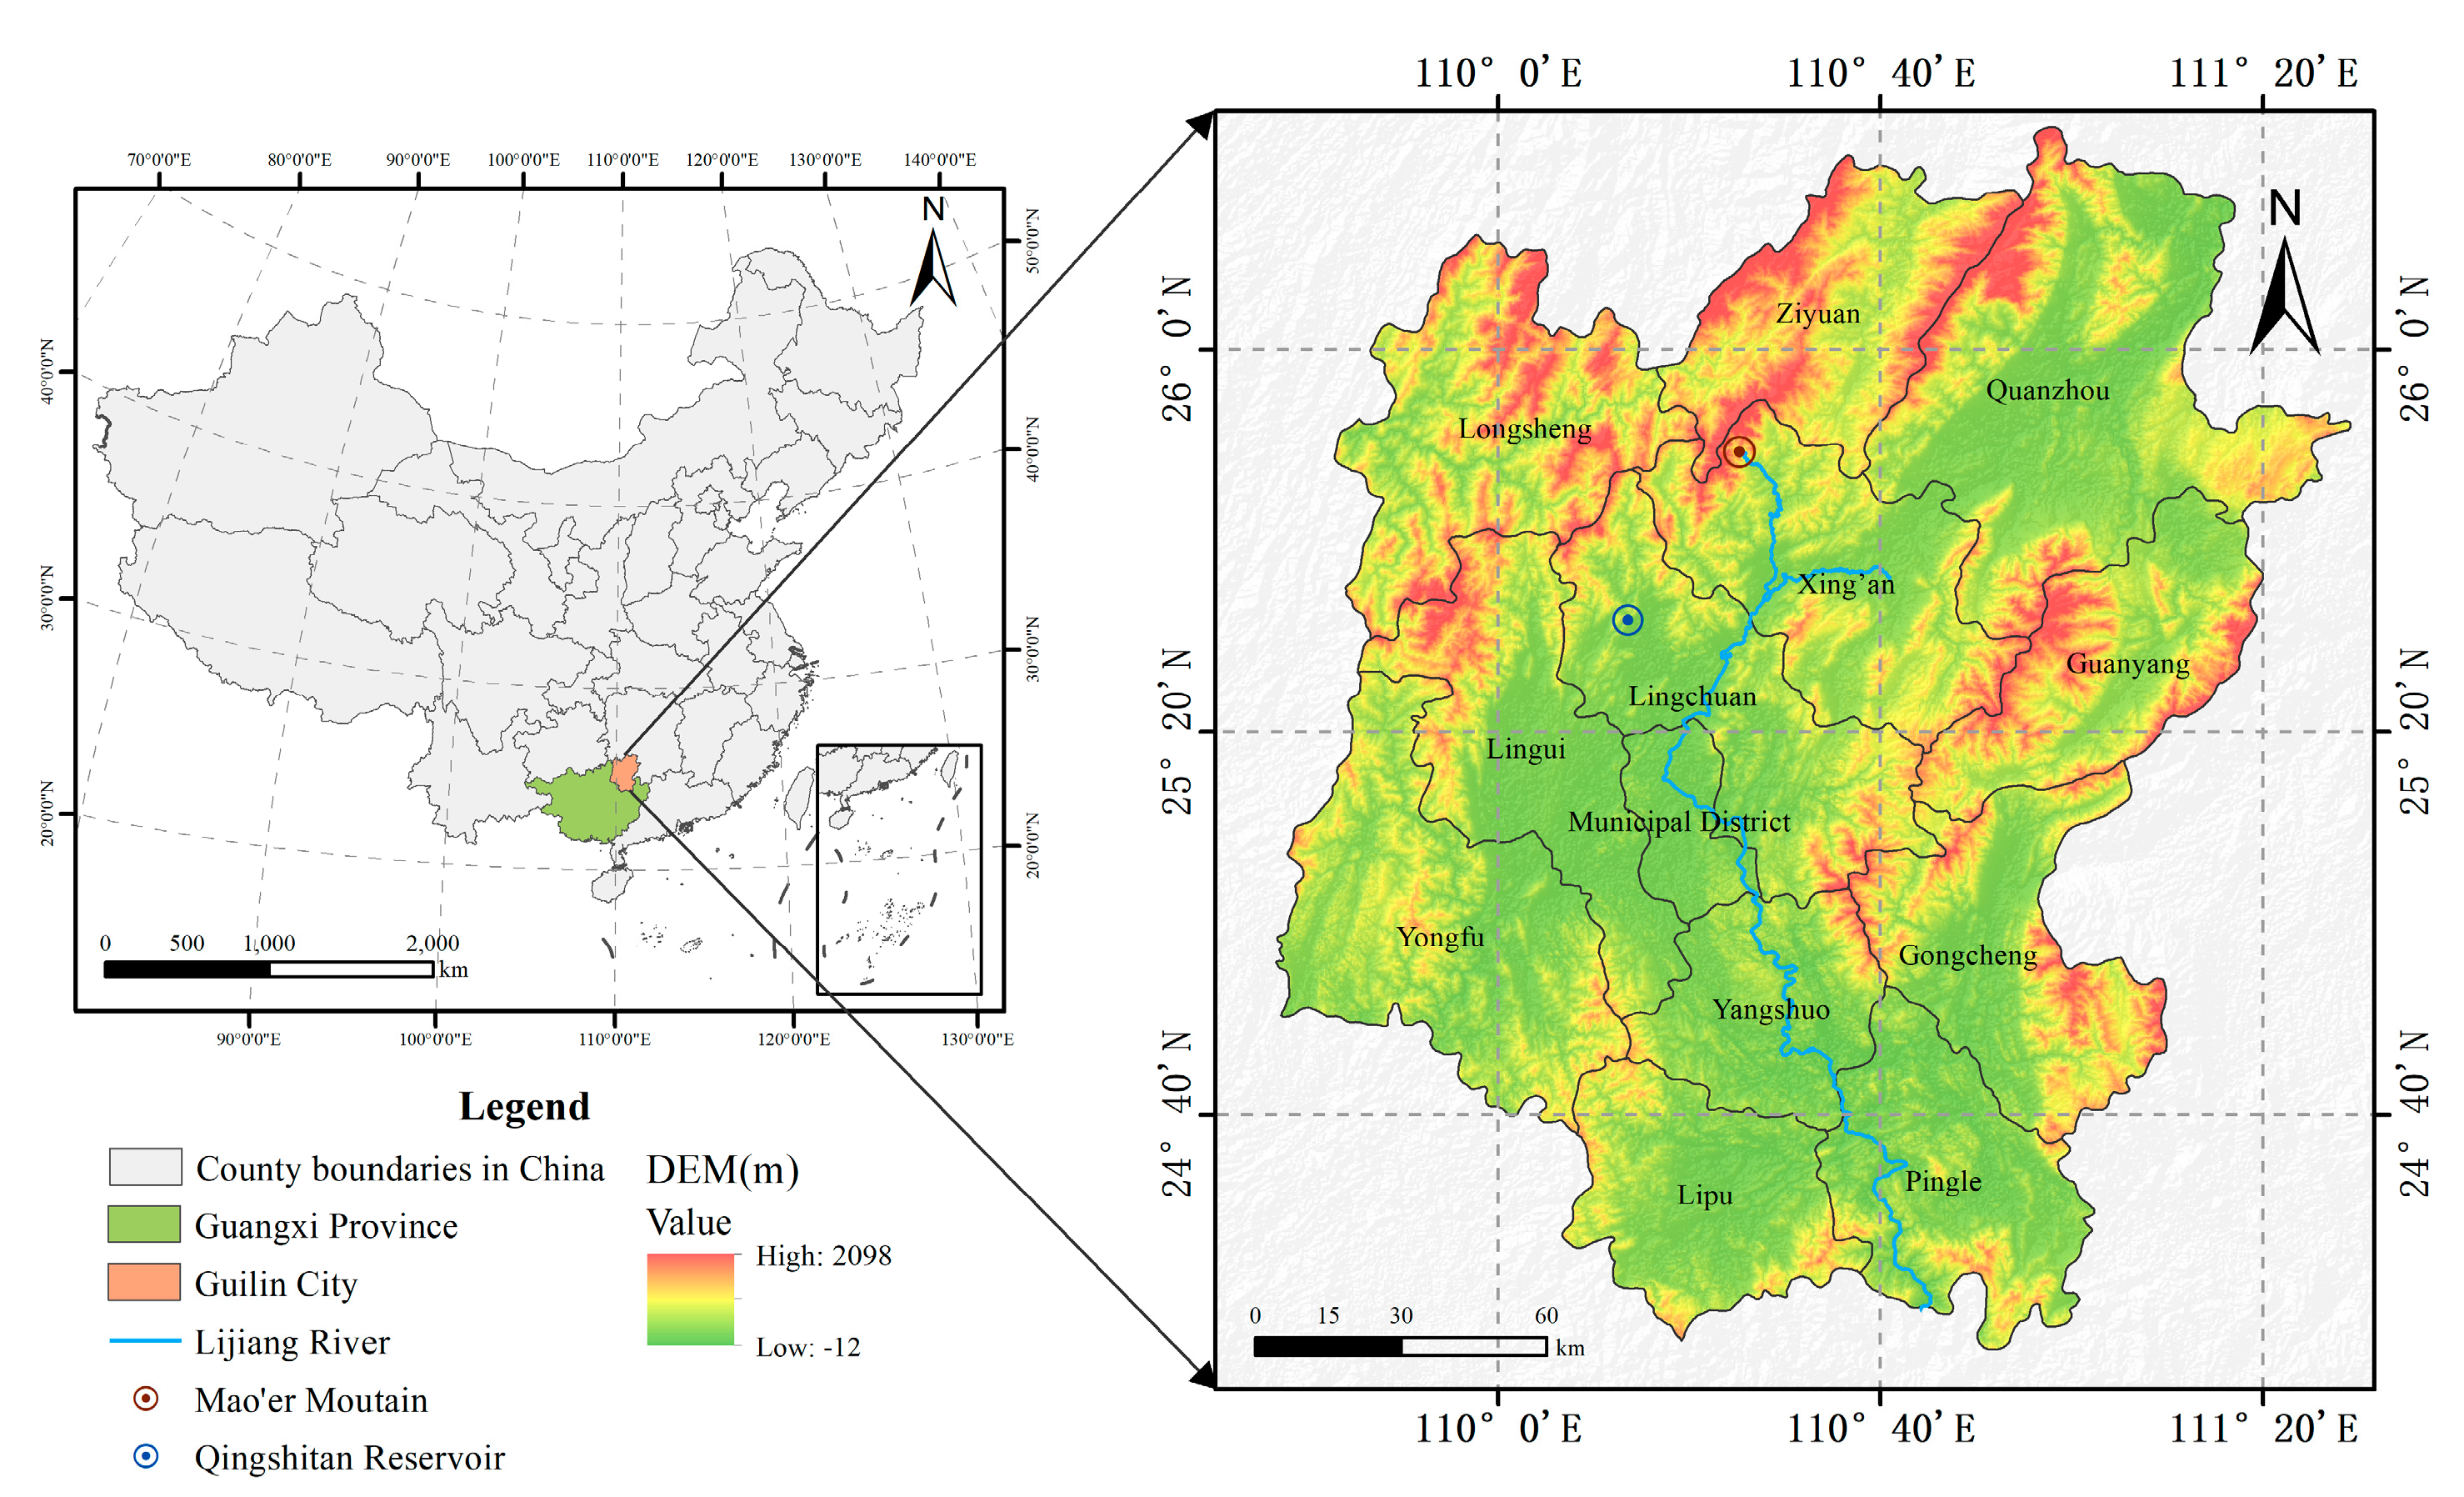
2.1. Study Area
2.2. Data Sources
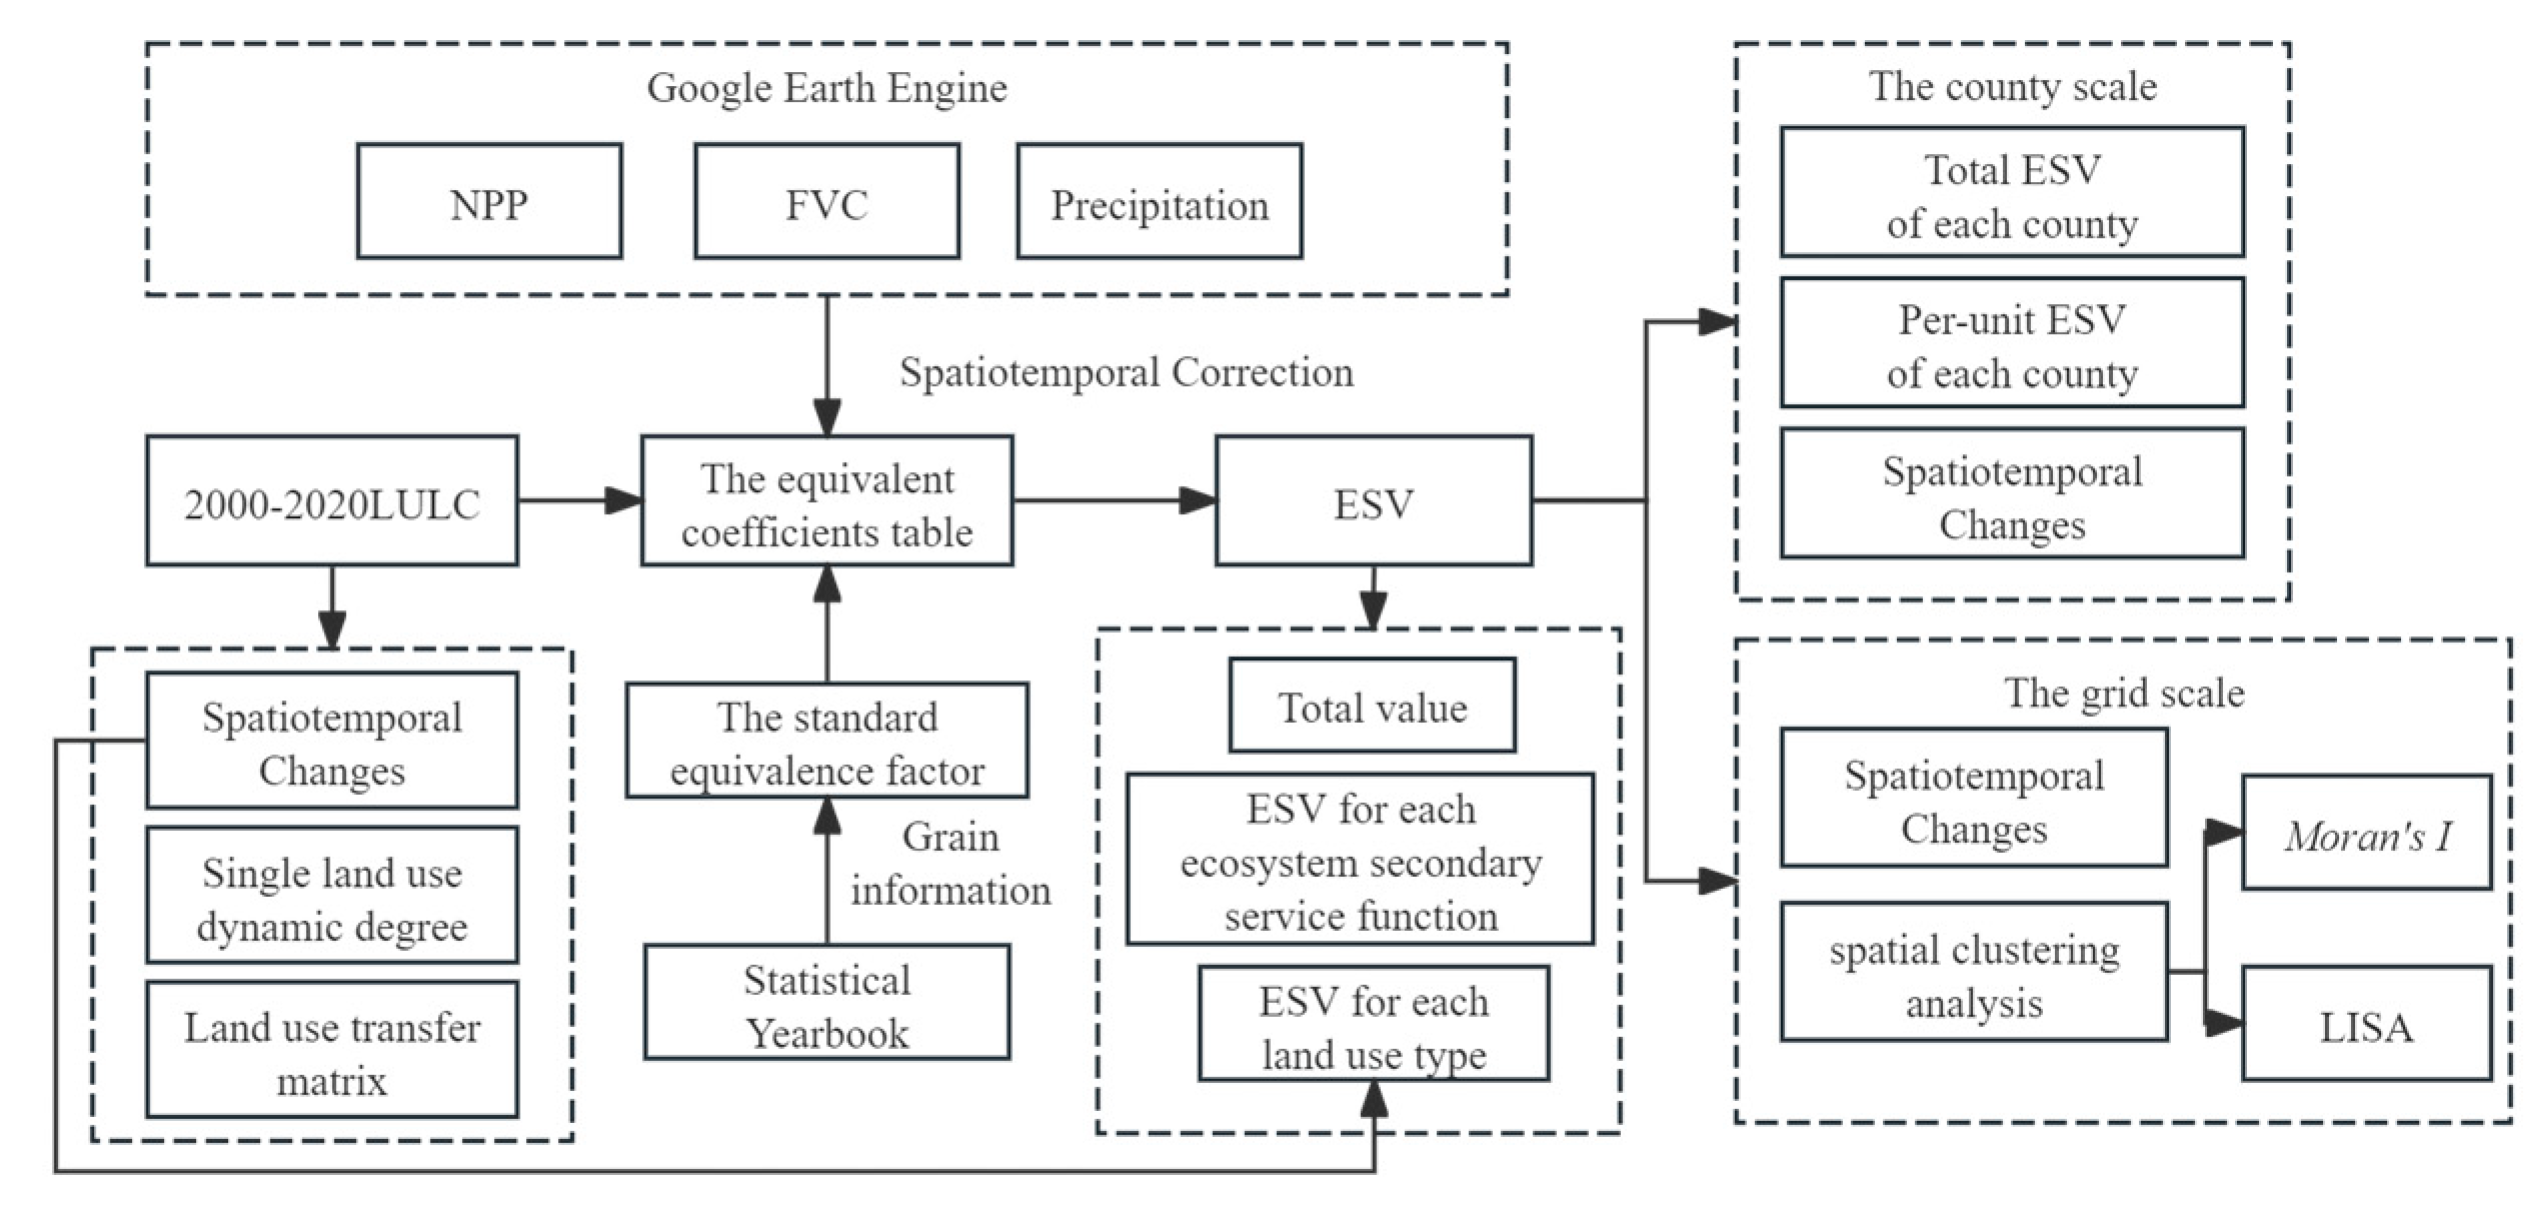
2.3. Methodology
2.4. Single Land Use Dynamic Degree
2.5. Land Use Transfer Matrix
2.6. Spatiotemporal Correction Coefficient
- NPP Spatiotemporal Correction Coefficient:
- 2.
- FVC Spatiotemporal Correction Coefficient:
- 3.
- Precipitation Spatiotemporal Correction Coefficient:
2.7. Calculation of Ecosystem Service Value
2.8. Coefficient Sensitivity Assessment
2.9. Exploratory Spatial Data Analysis
2.9.1. Global Spatial Autocorrelation
2.9.2. Local Indicators of Spatial Association
3. Results
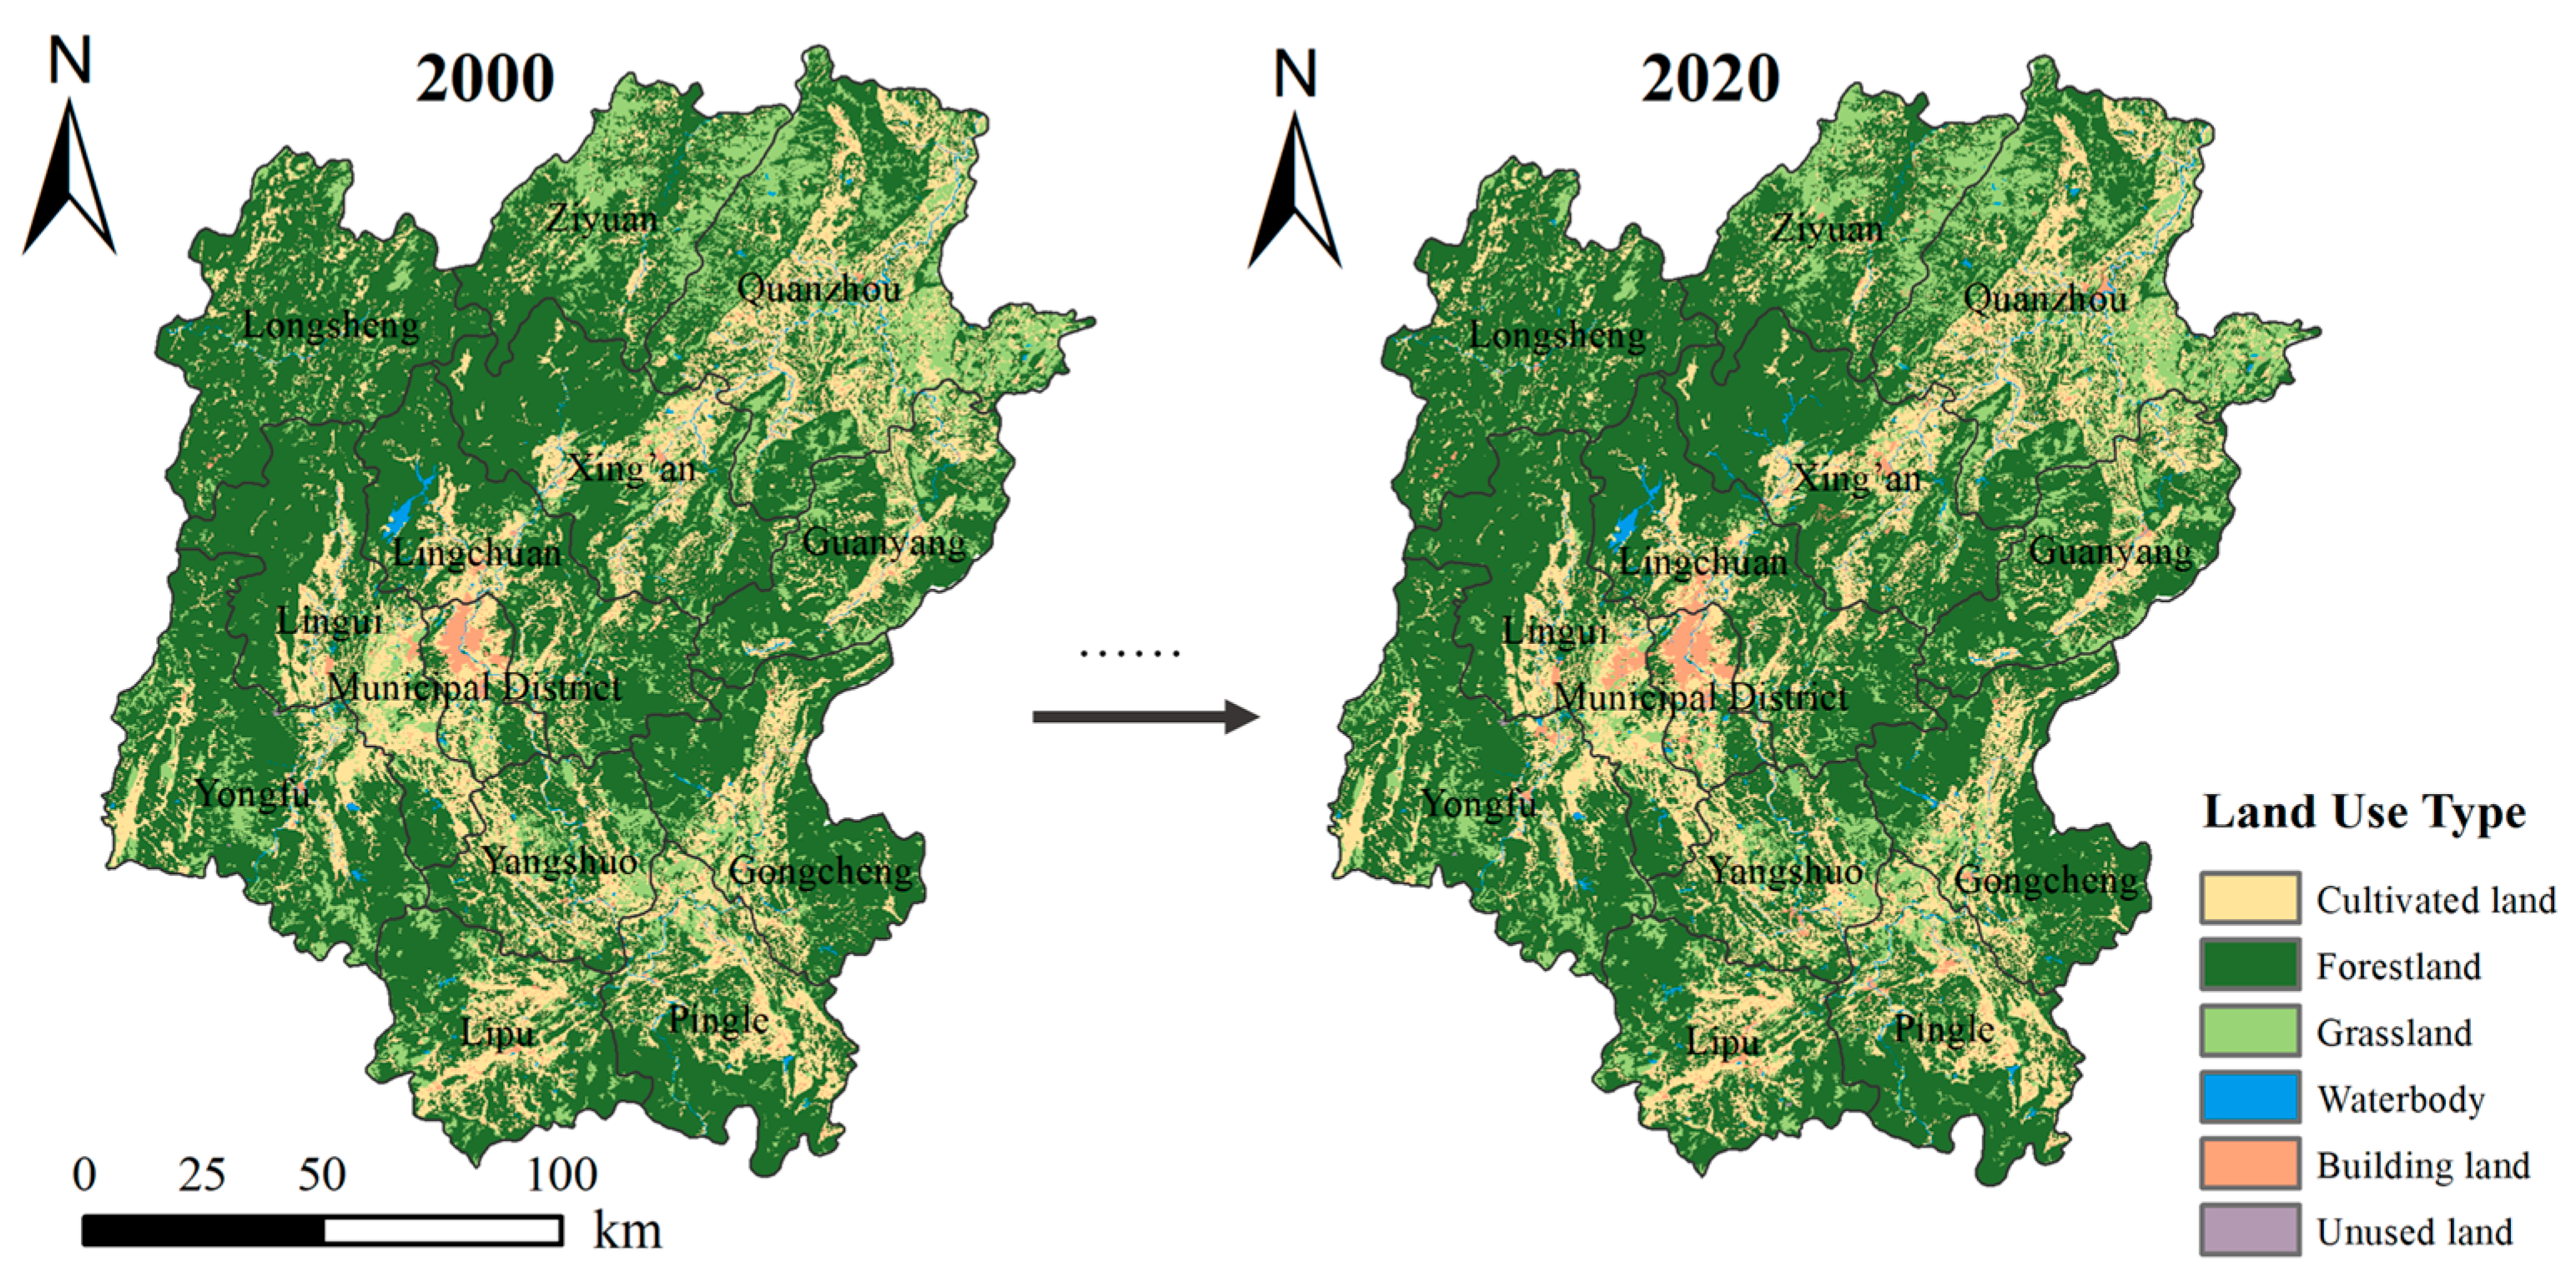
3.1. Land Use Change in Guilin
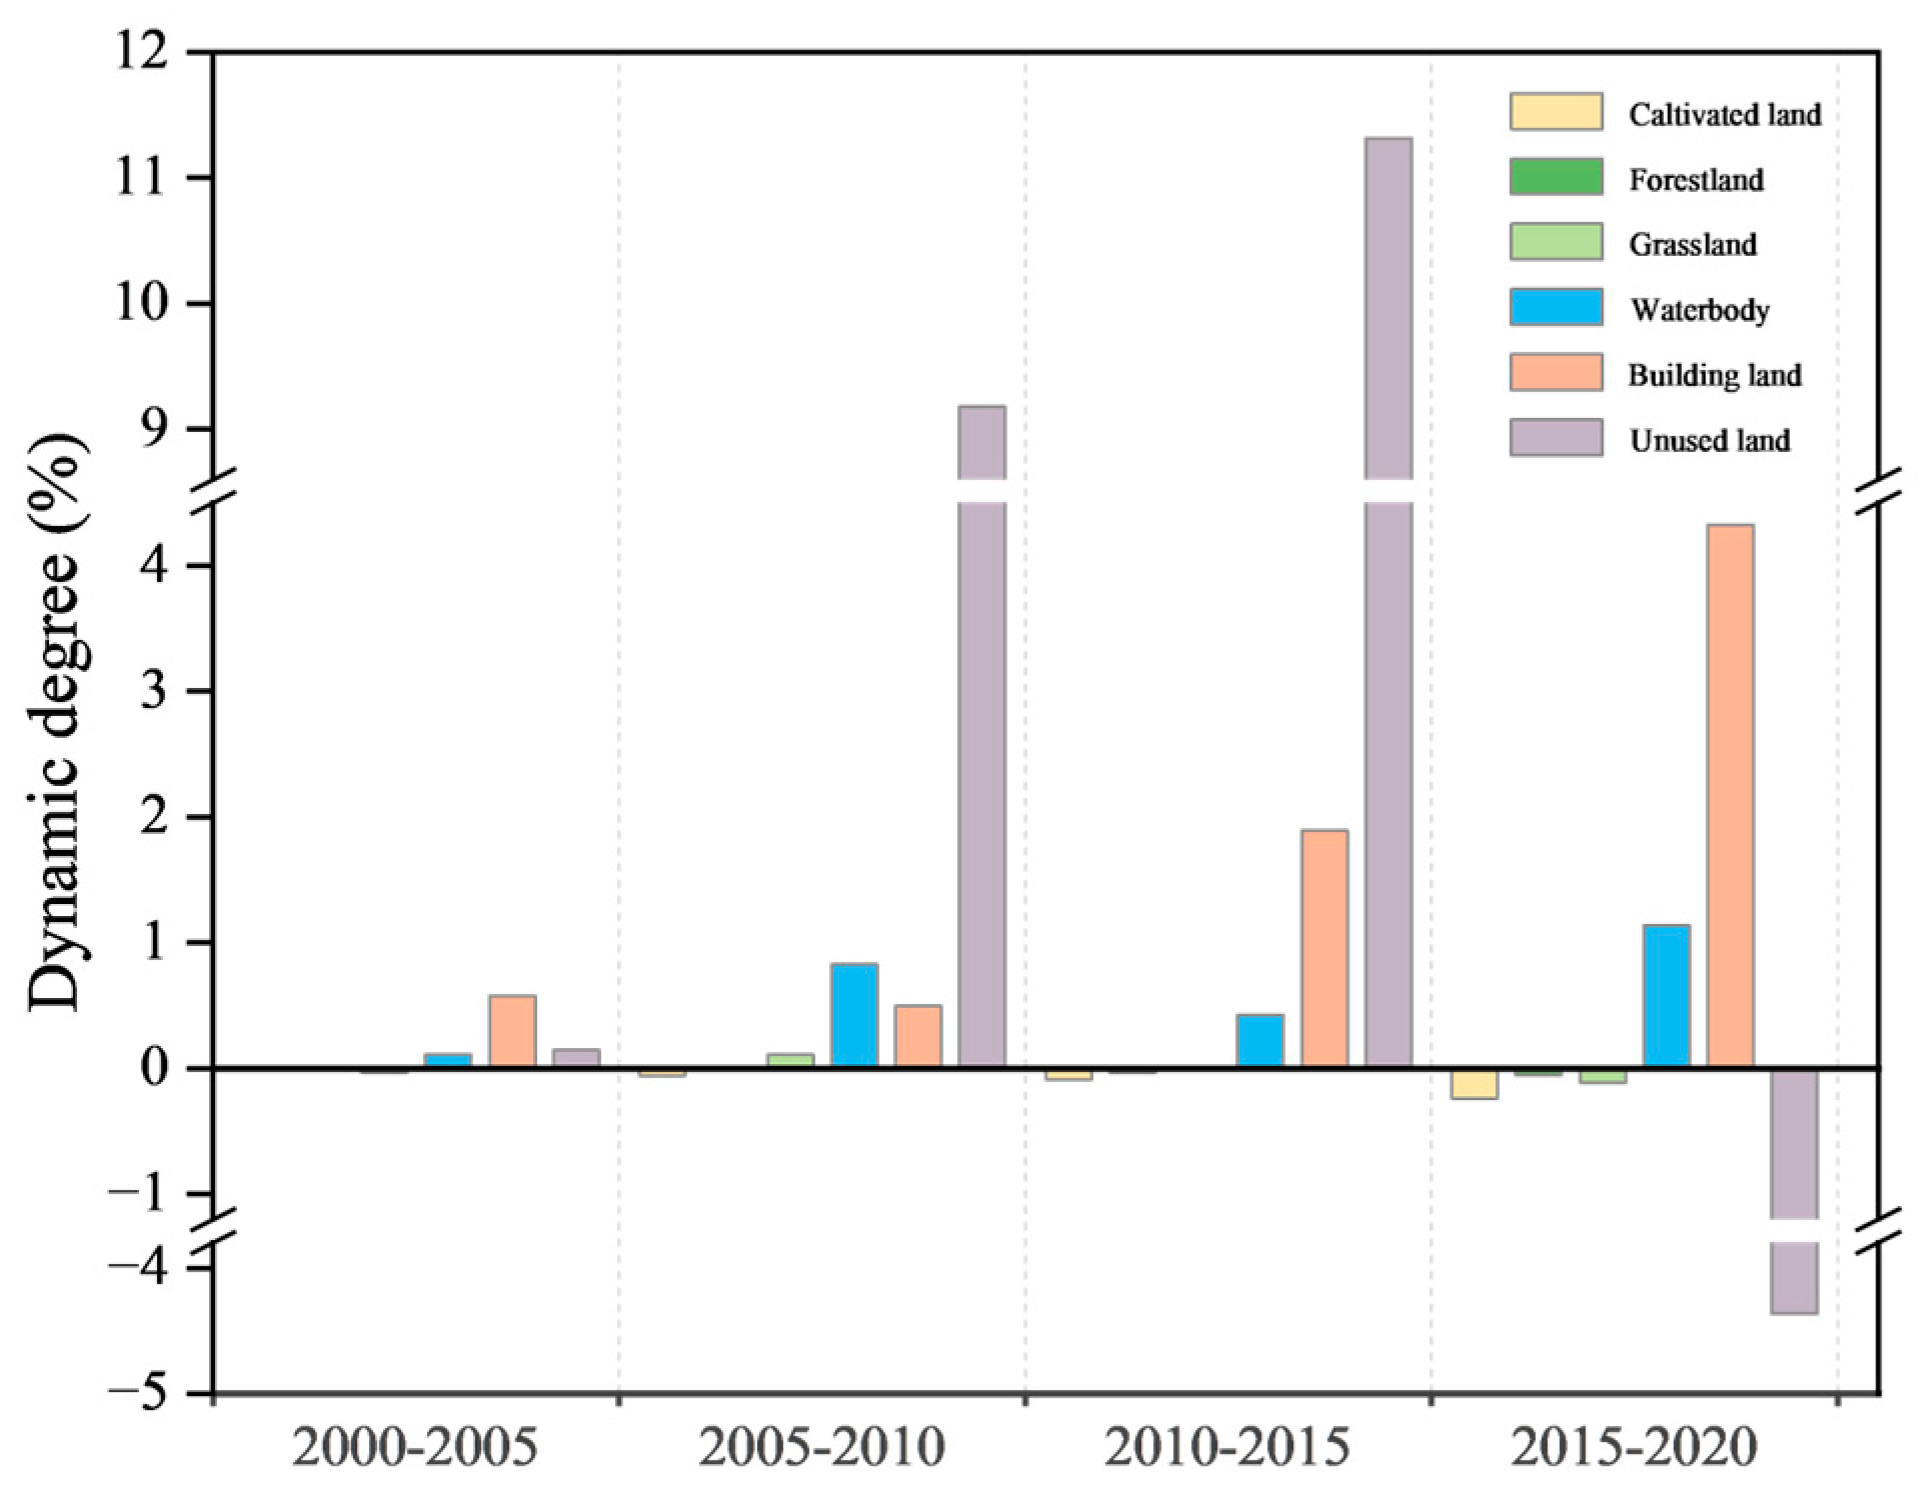
3.1.1. Land Use Status and Dynamics
3.1.2. Land Use Transfer Distribution and Quantity
3.2. Spatial and Temporal Characteristics of ESV
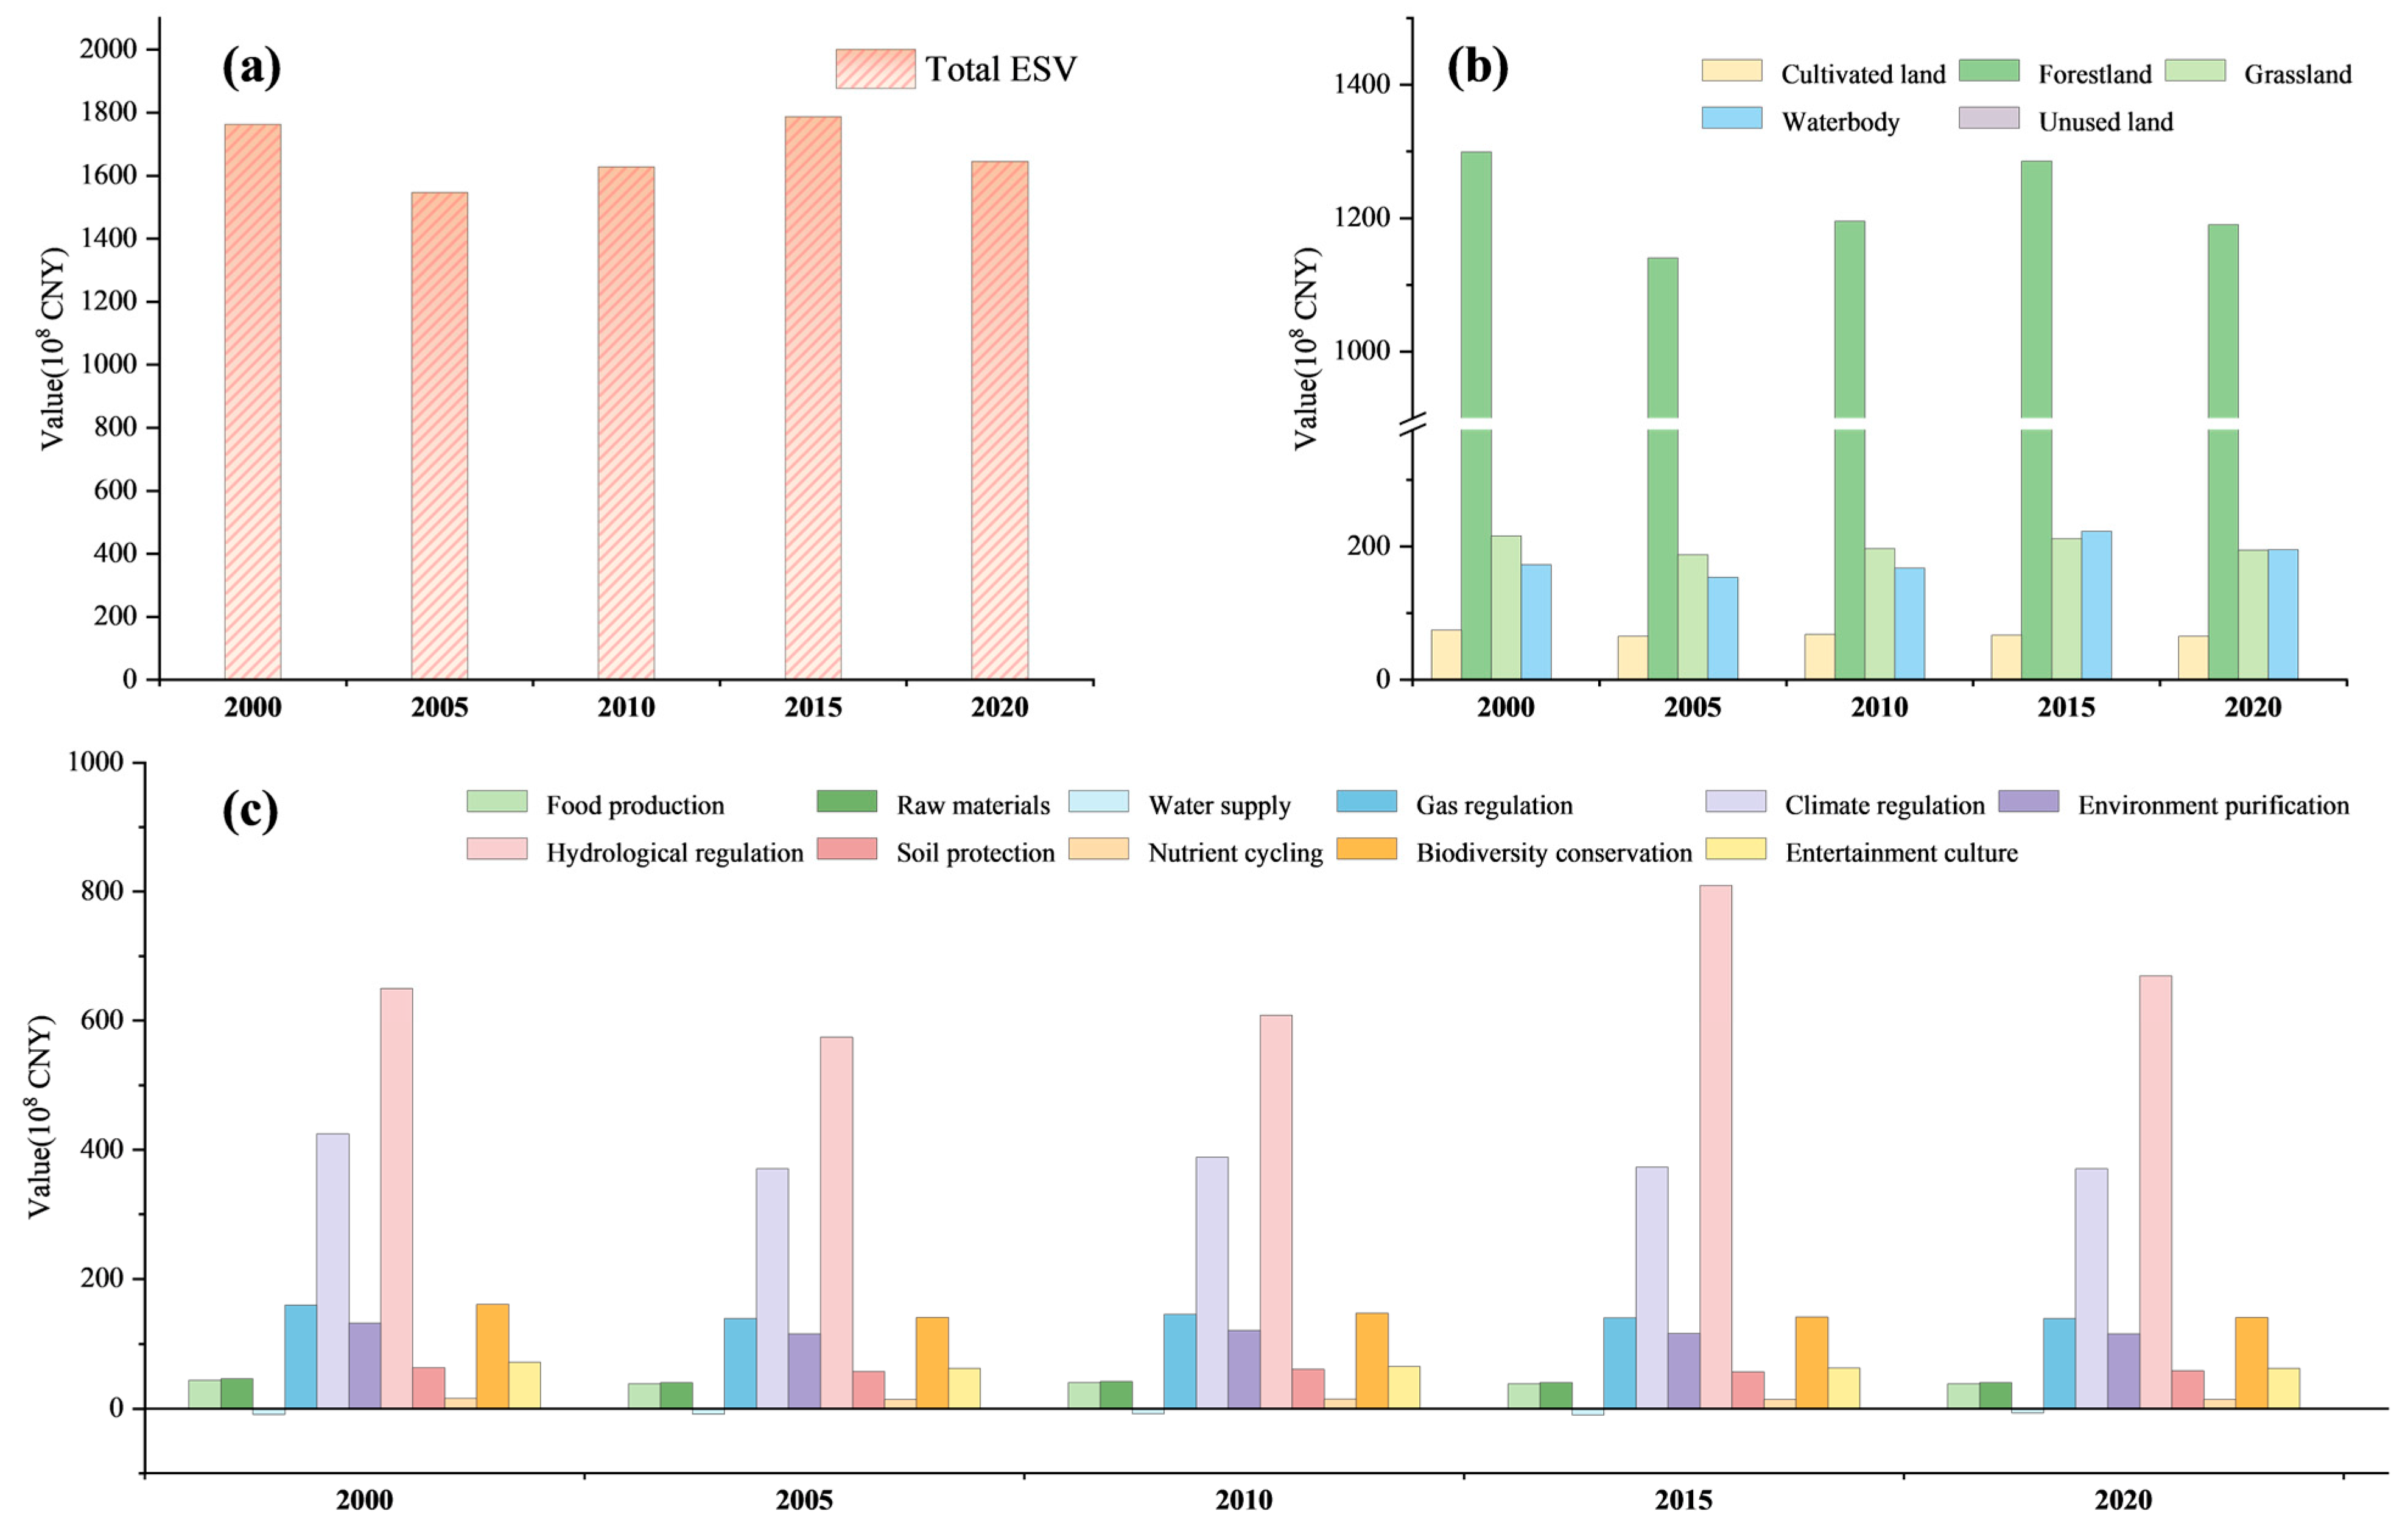
3.2.1. Characterization of Temporal Changes in ESV
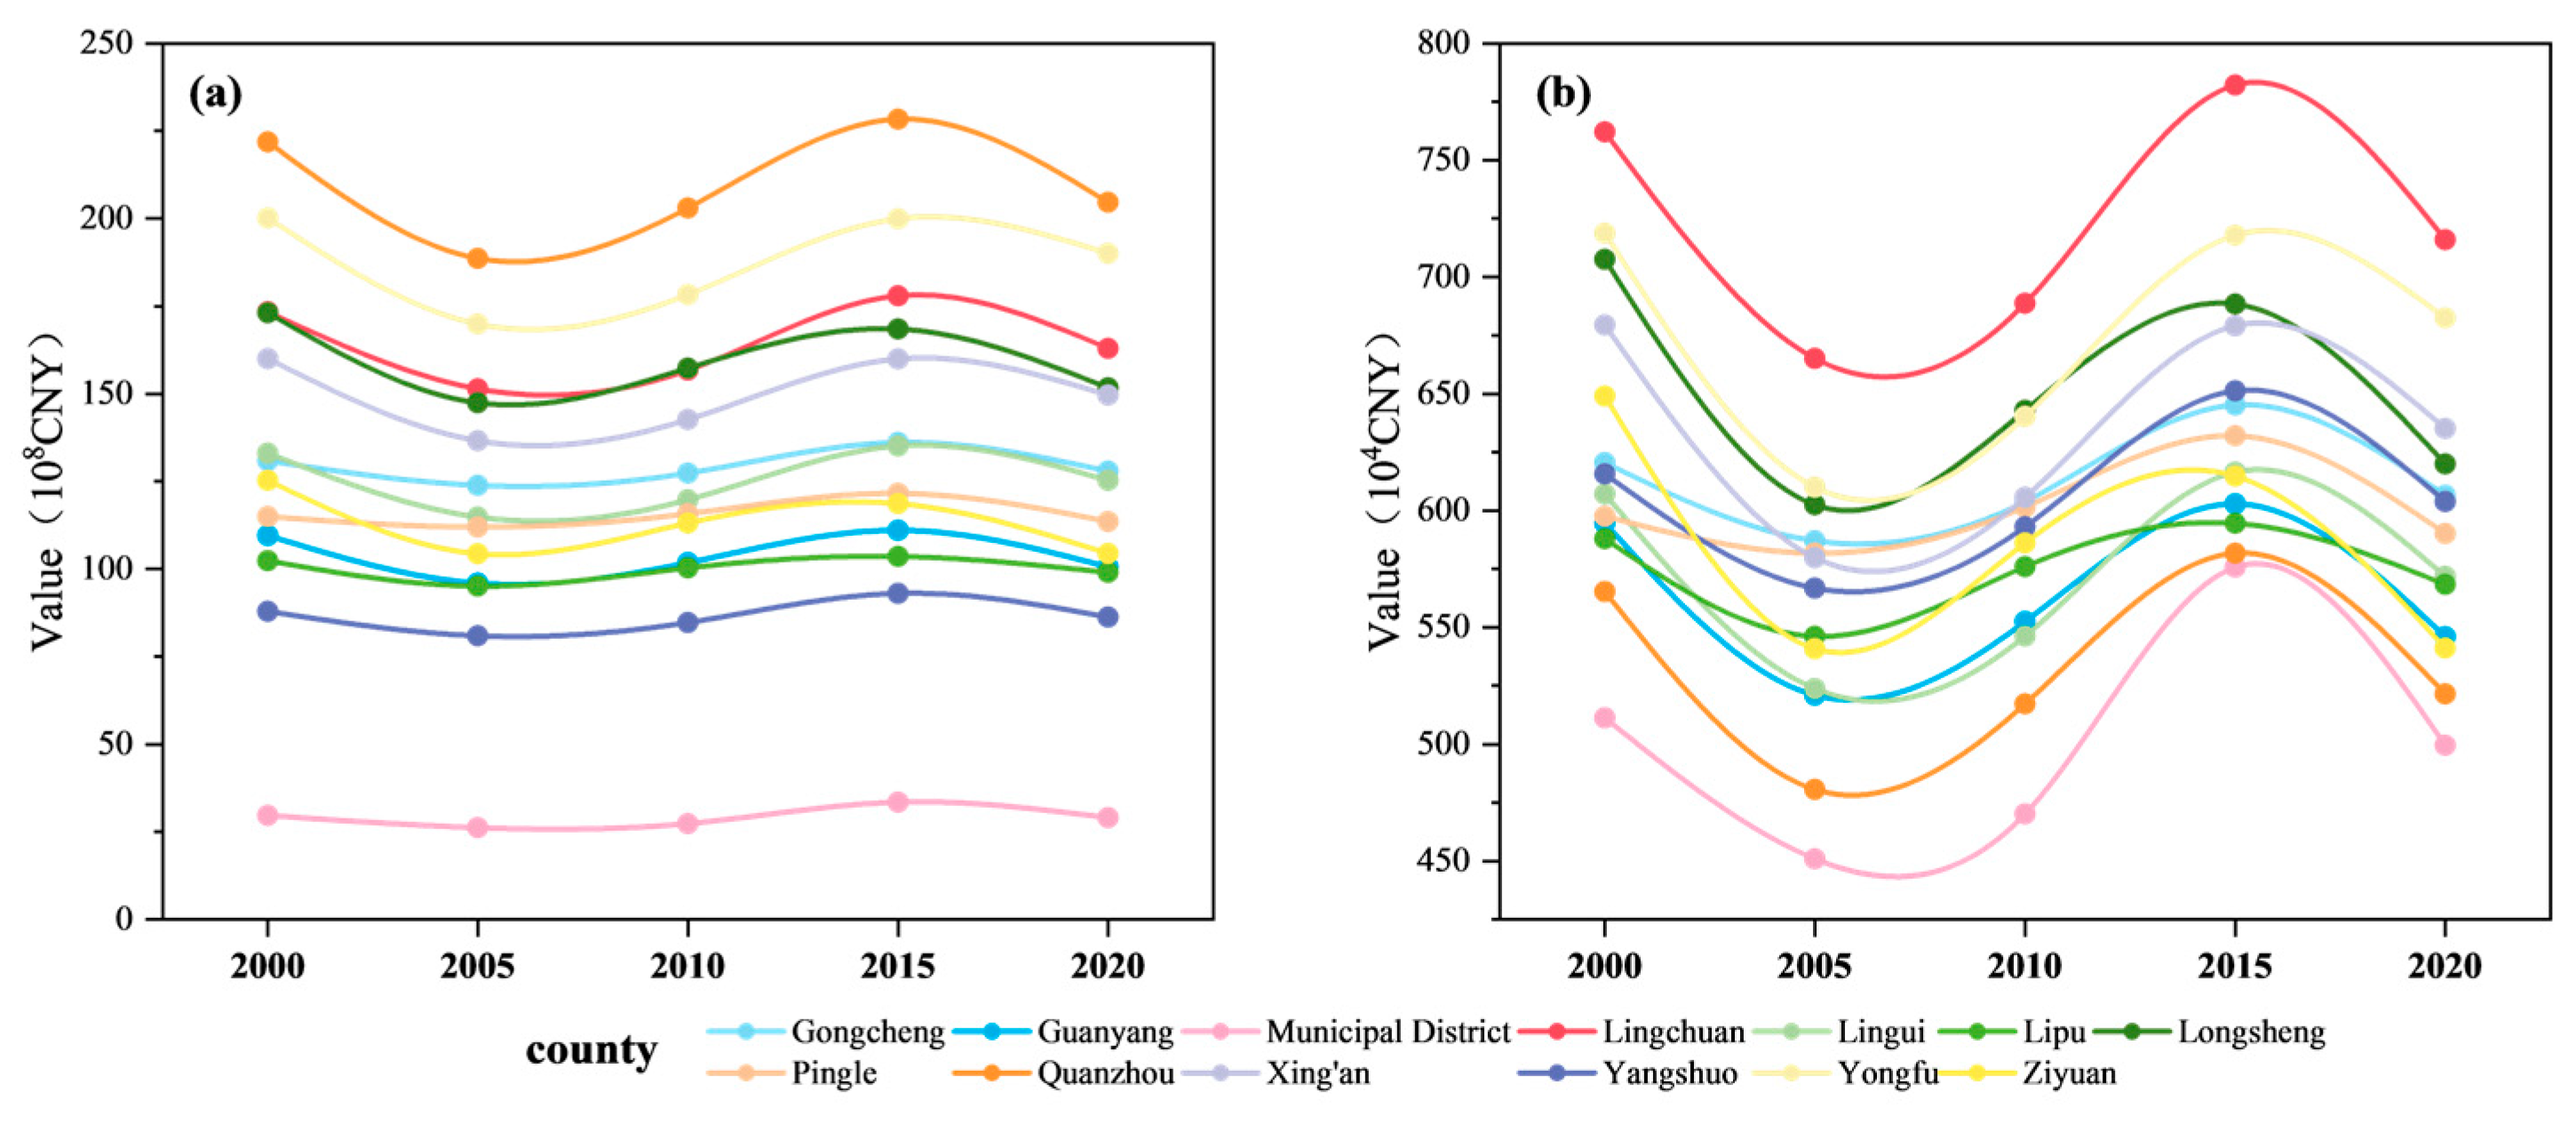
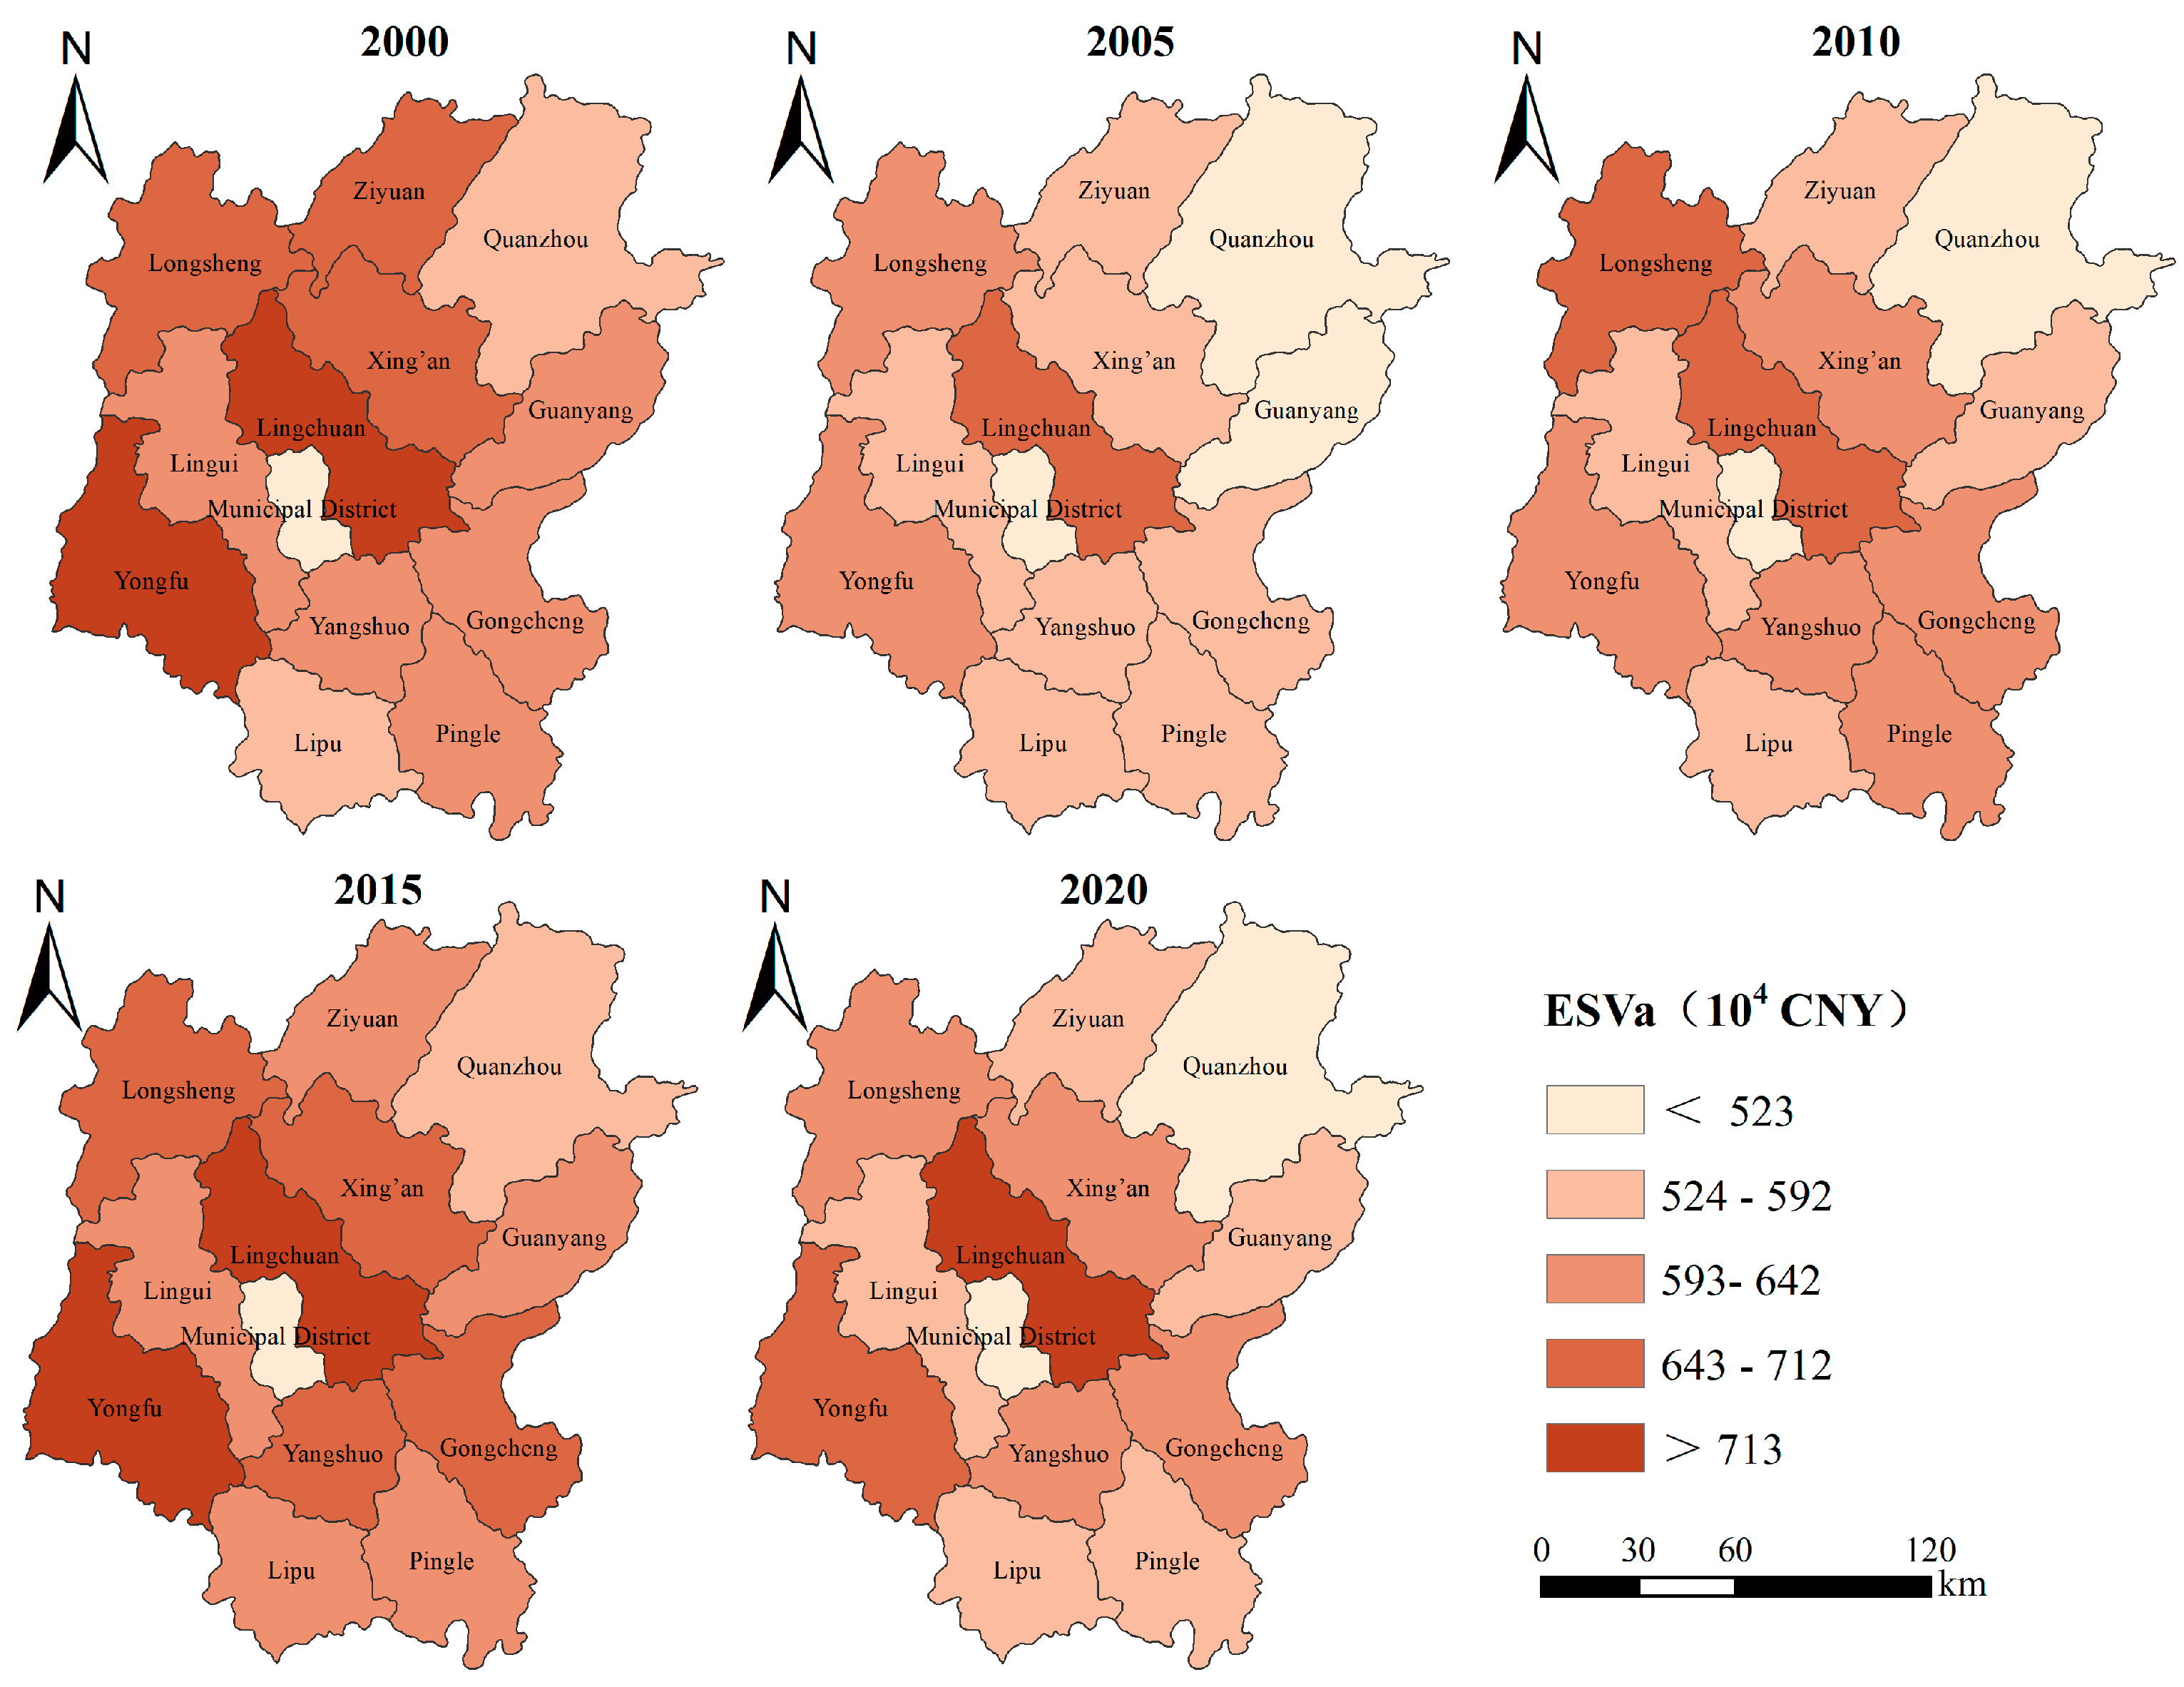
3.2.2. Spatial and Temporal Evolution of ESV at the County Scale
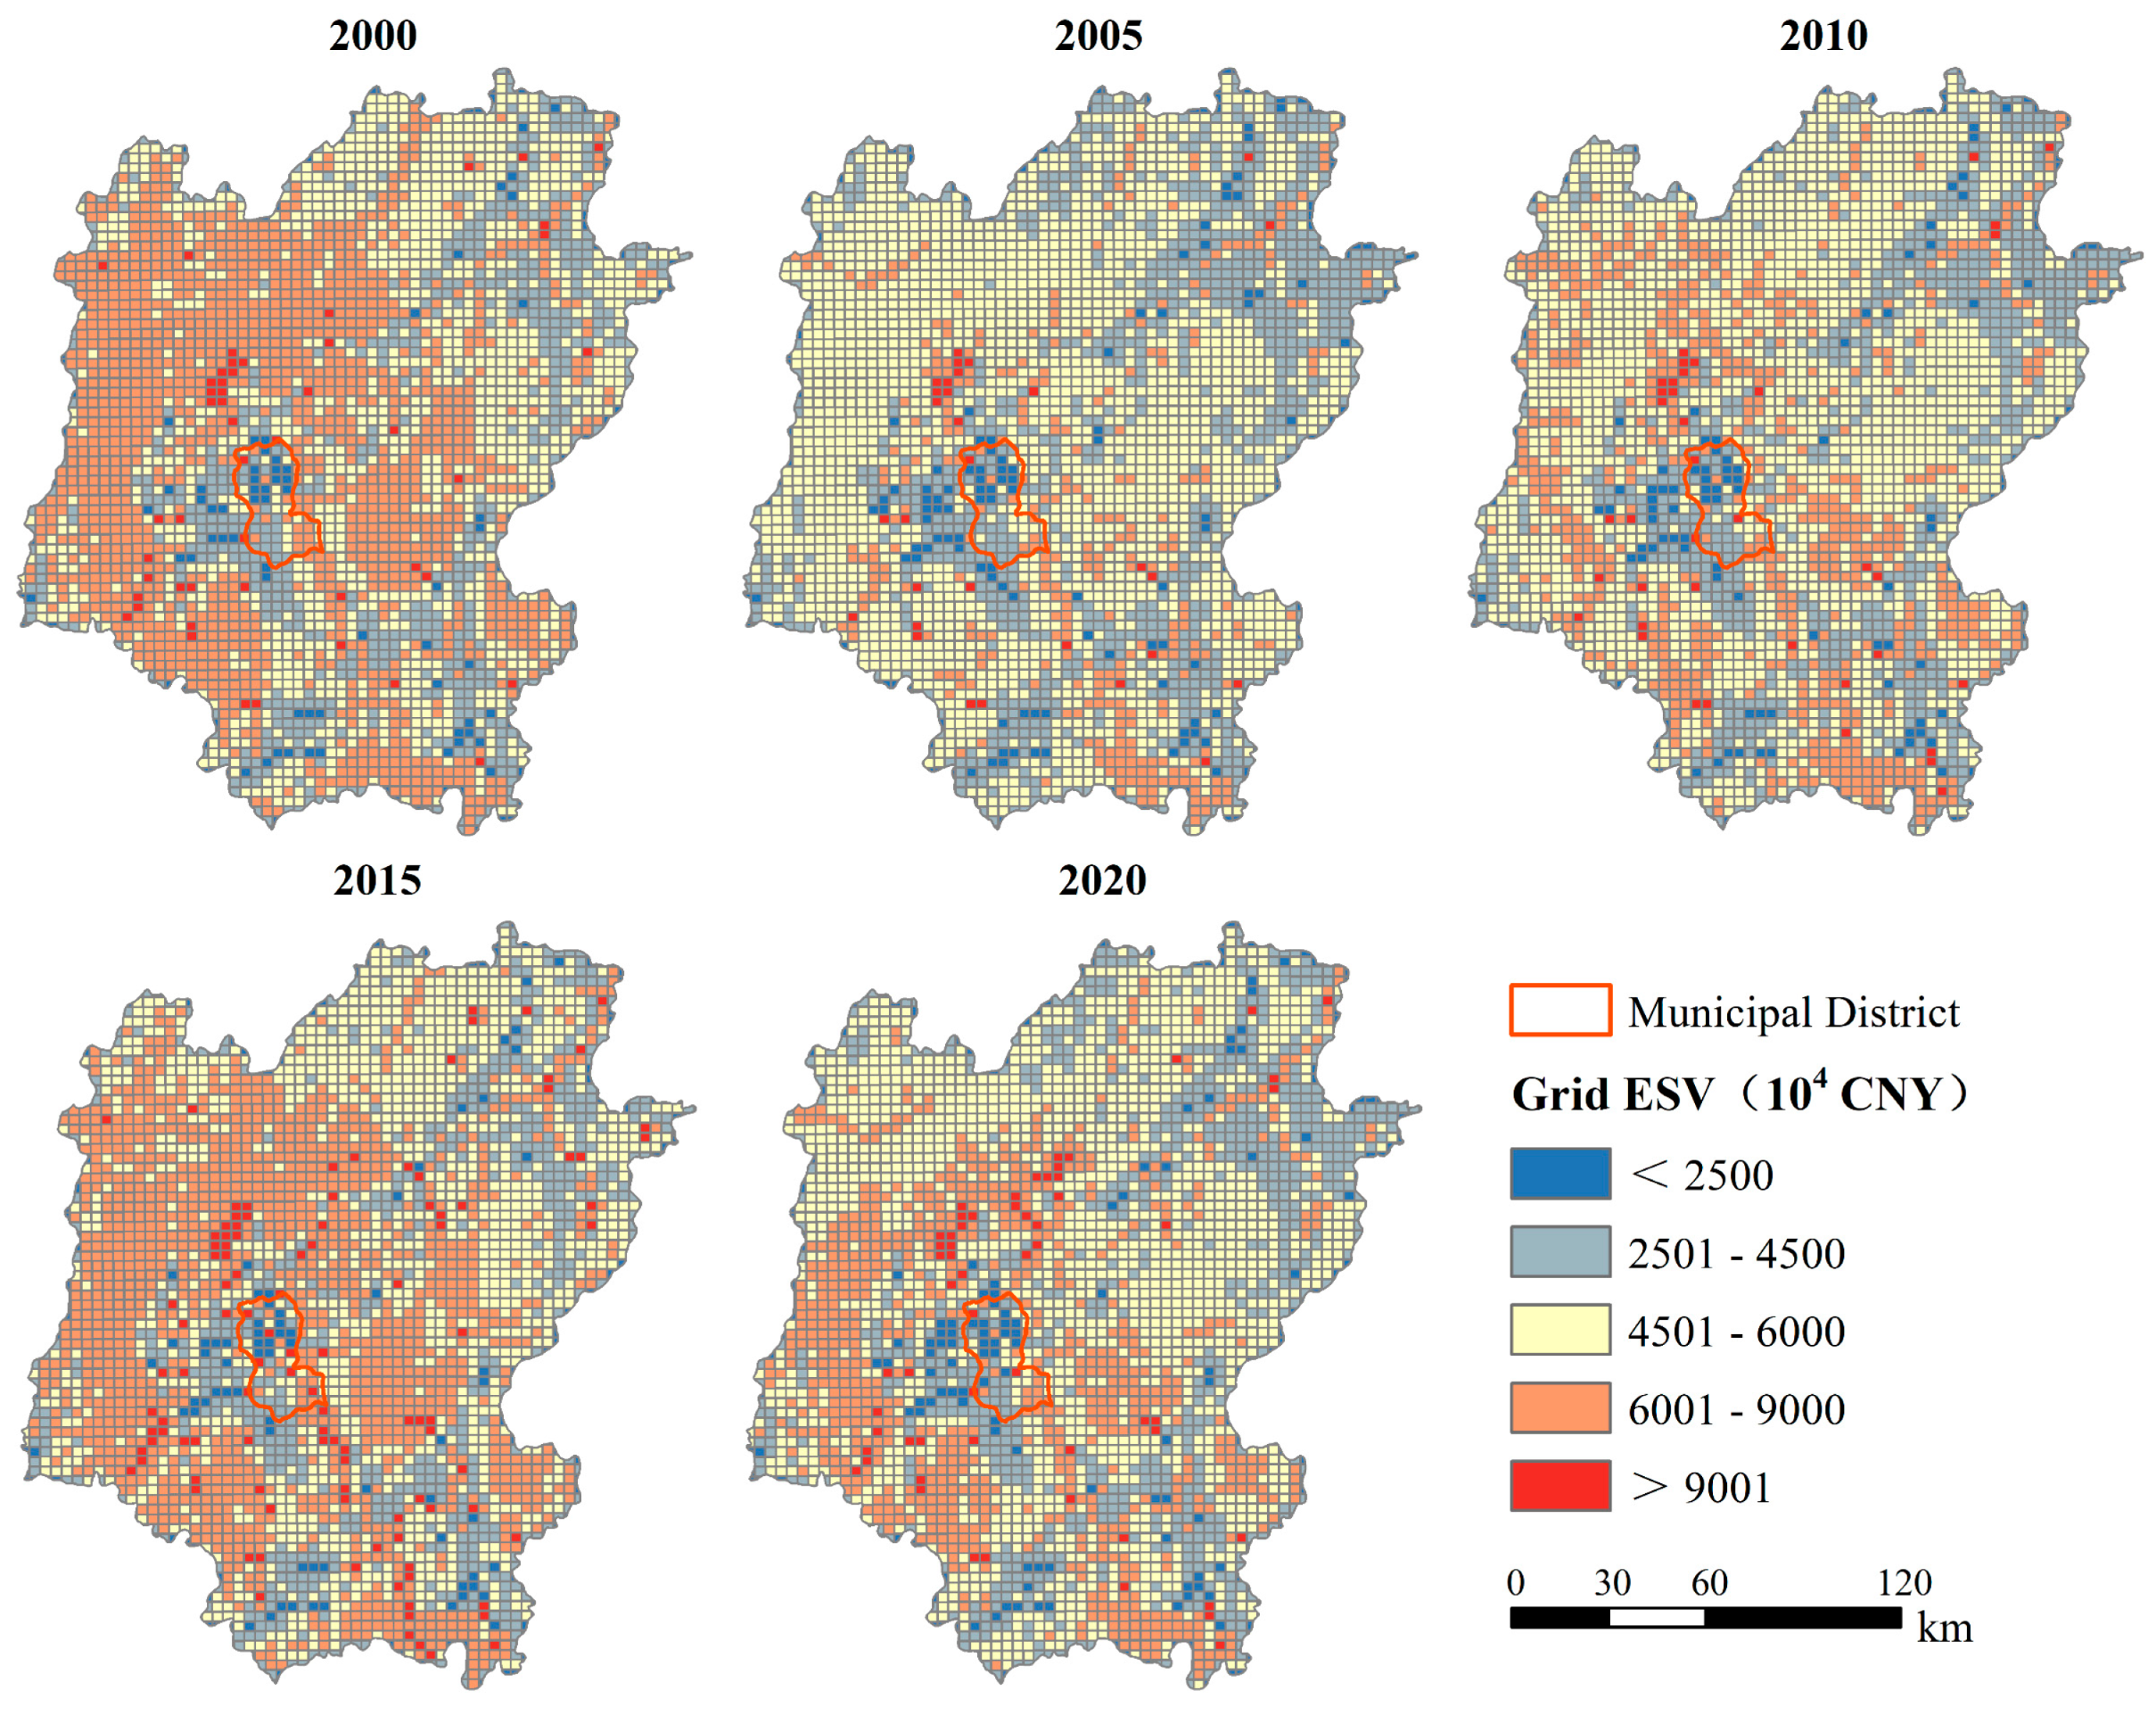
3.2.3. Spatial and Temporal Evolution of ESV at the Grid Scale
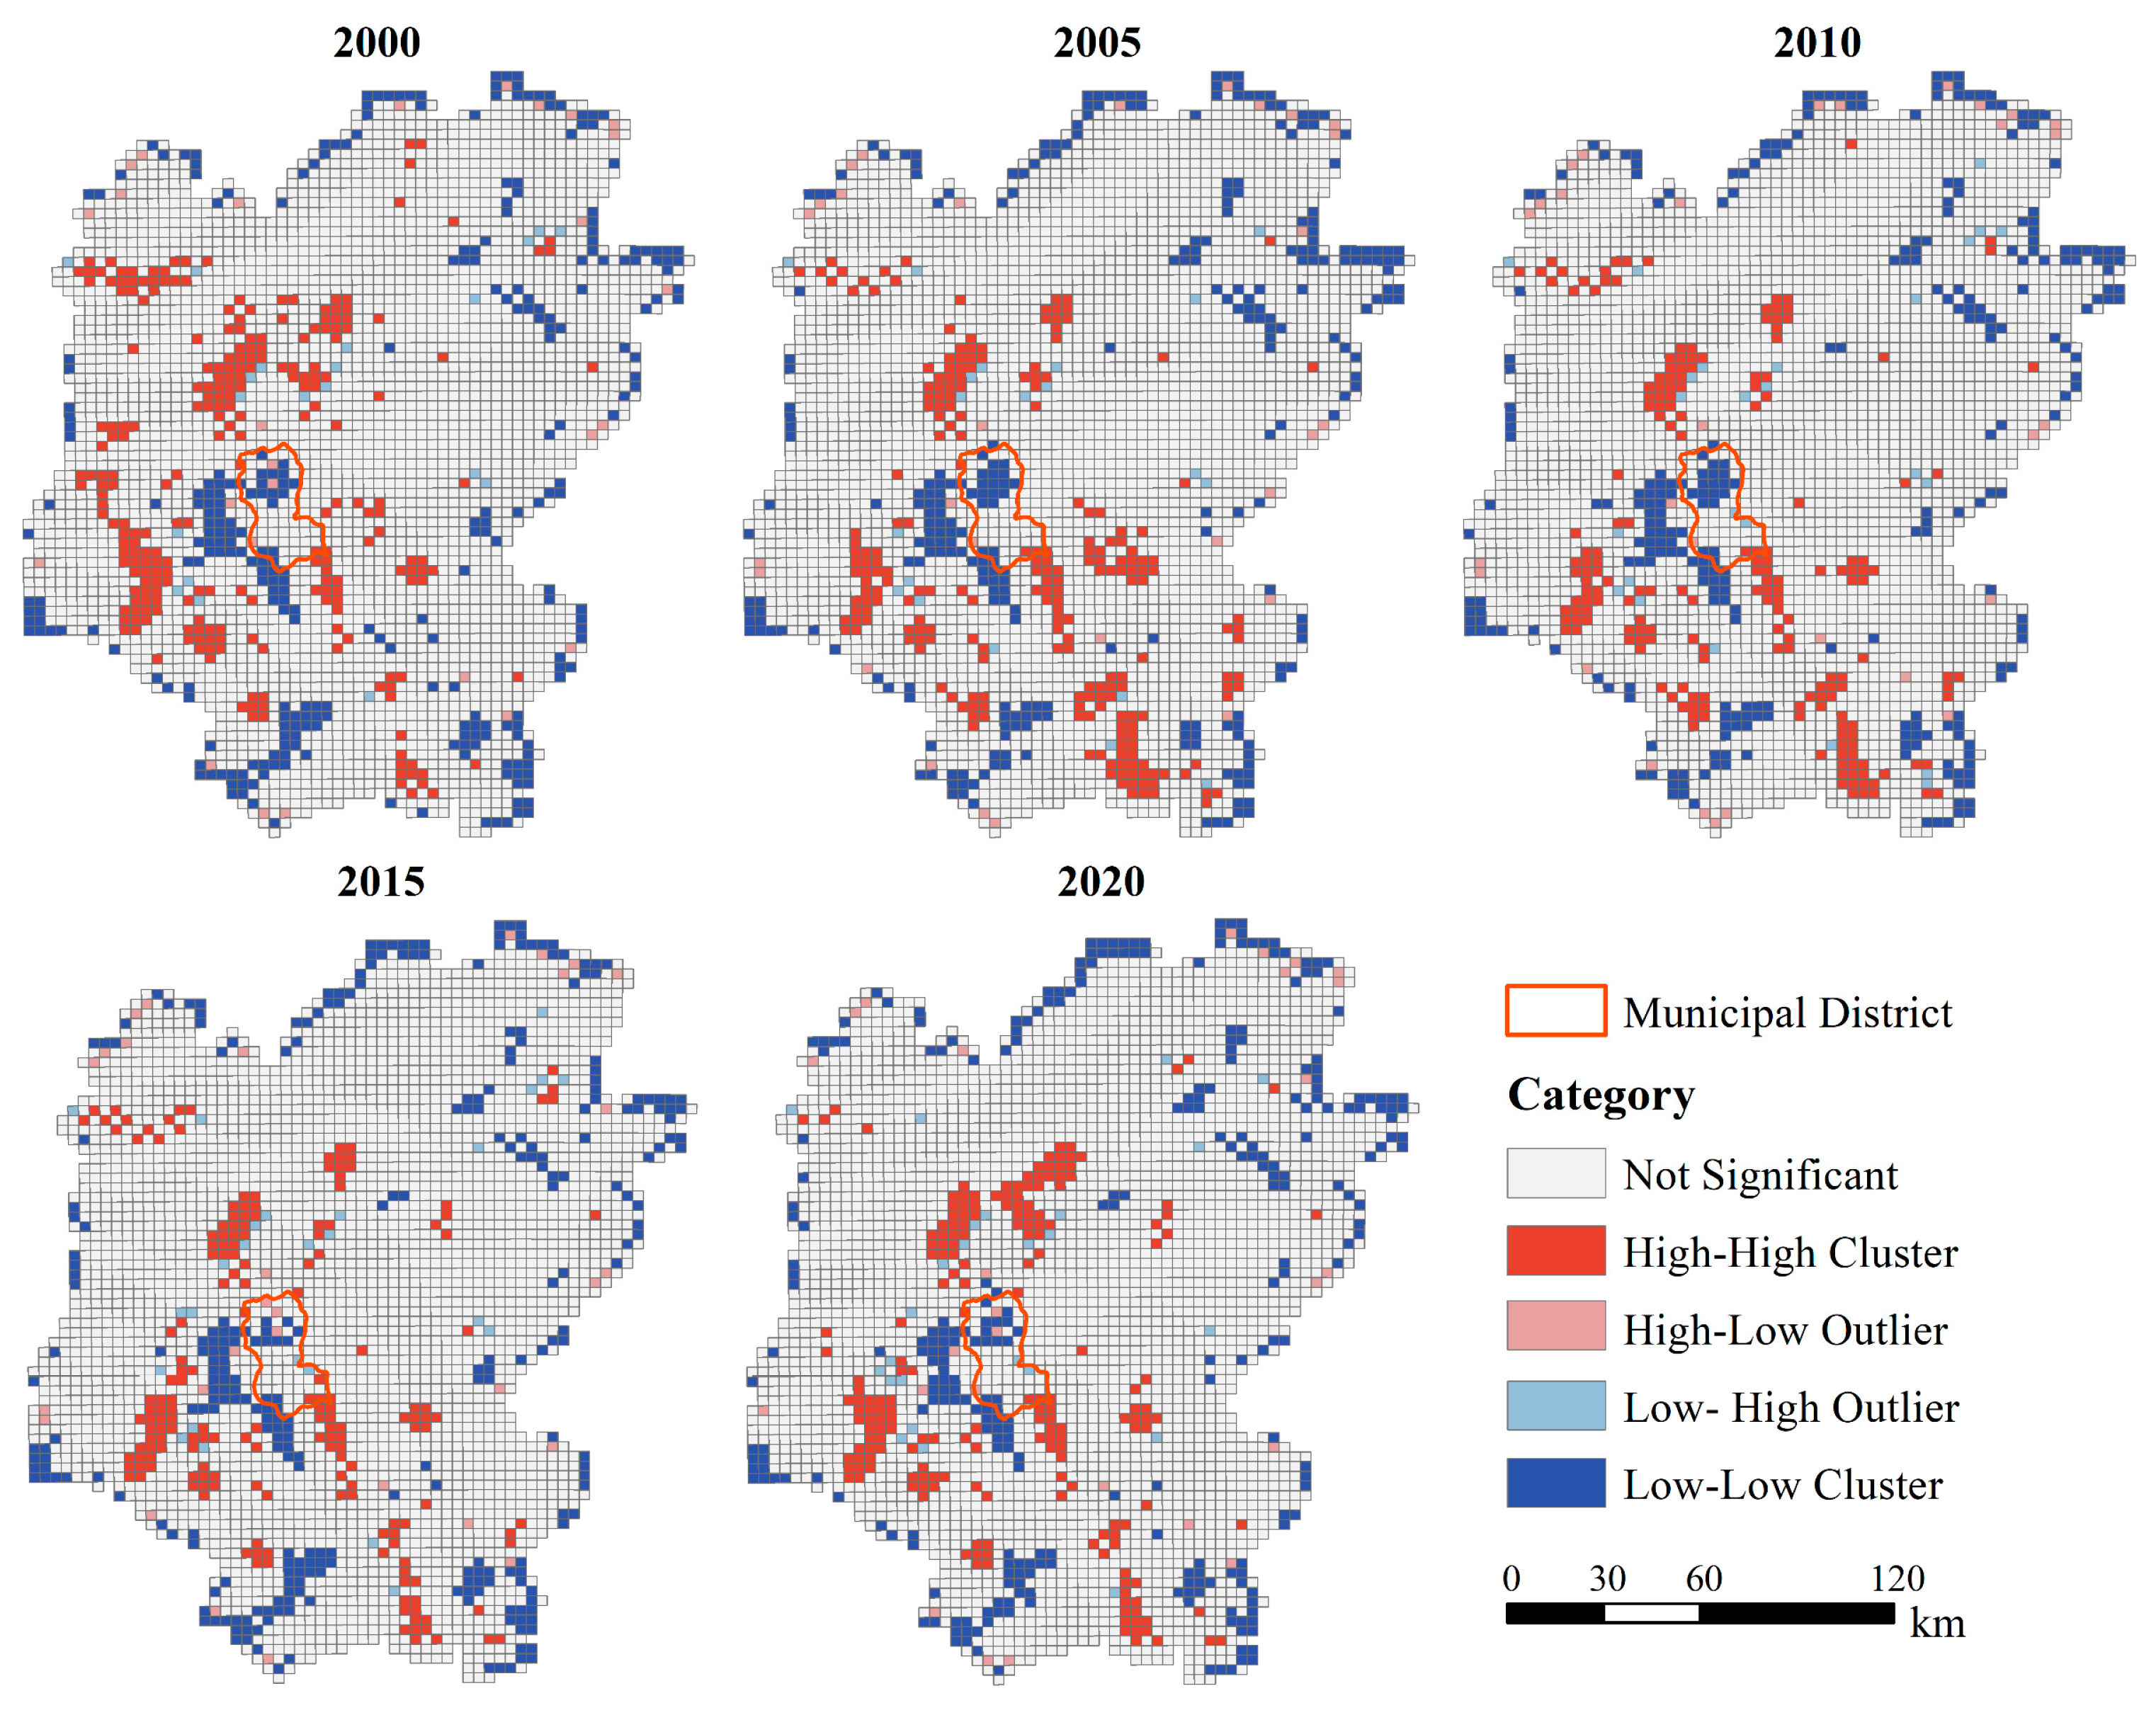
3.2.4. Spatial Autocorrelation Analysis of ESV in Guilin
4. Discussion
4.1. Spatial and Temporal Characteristics of Land Use
4.2. The Contribution of Land Use to ESV in Guilin
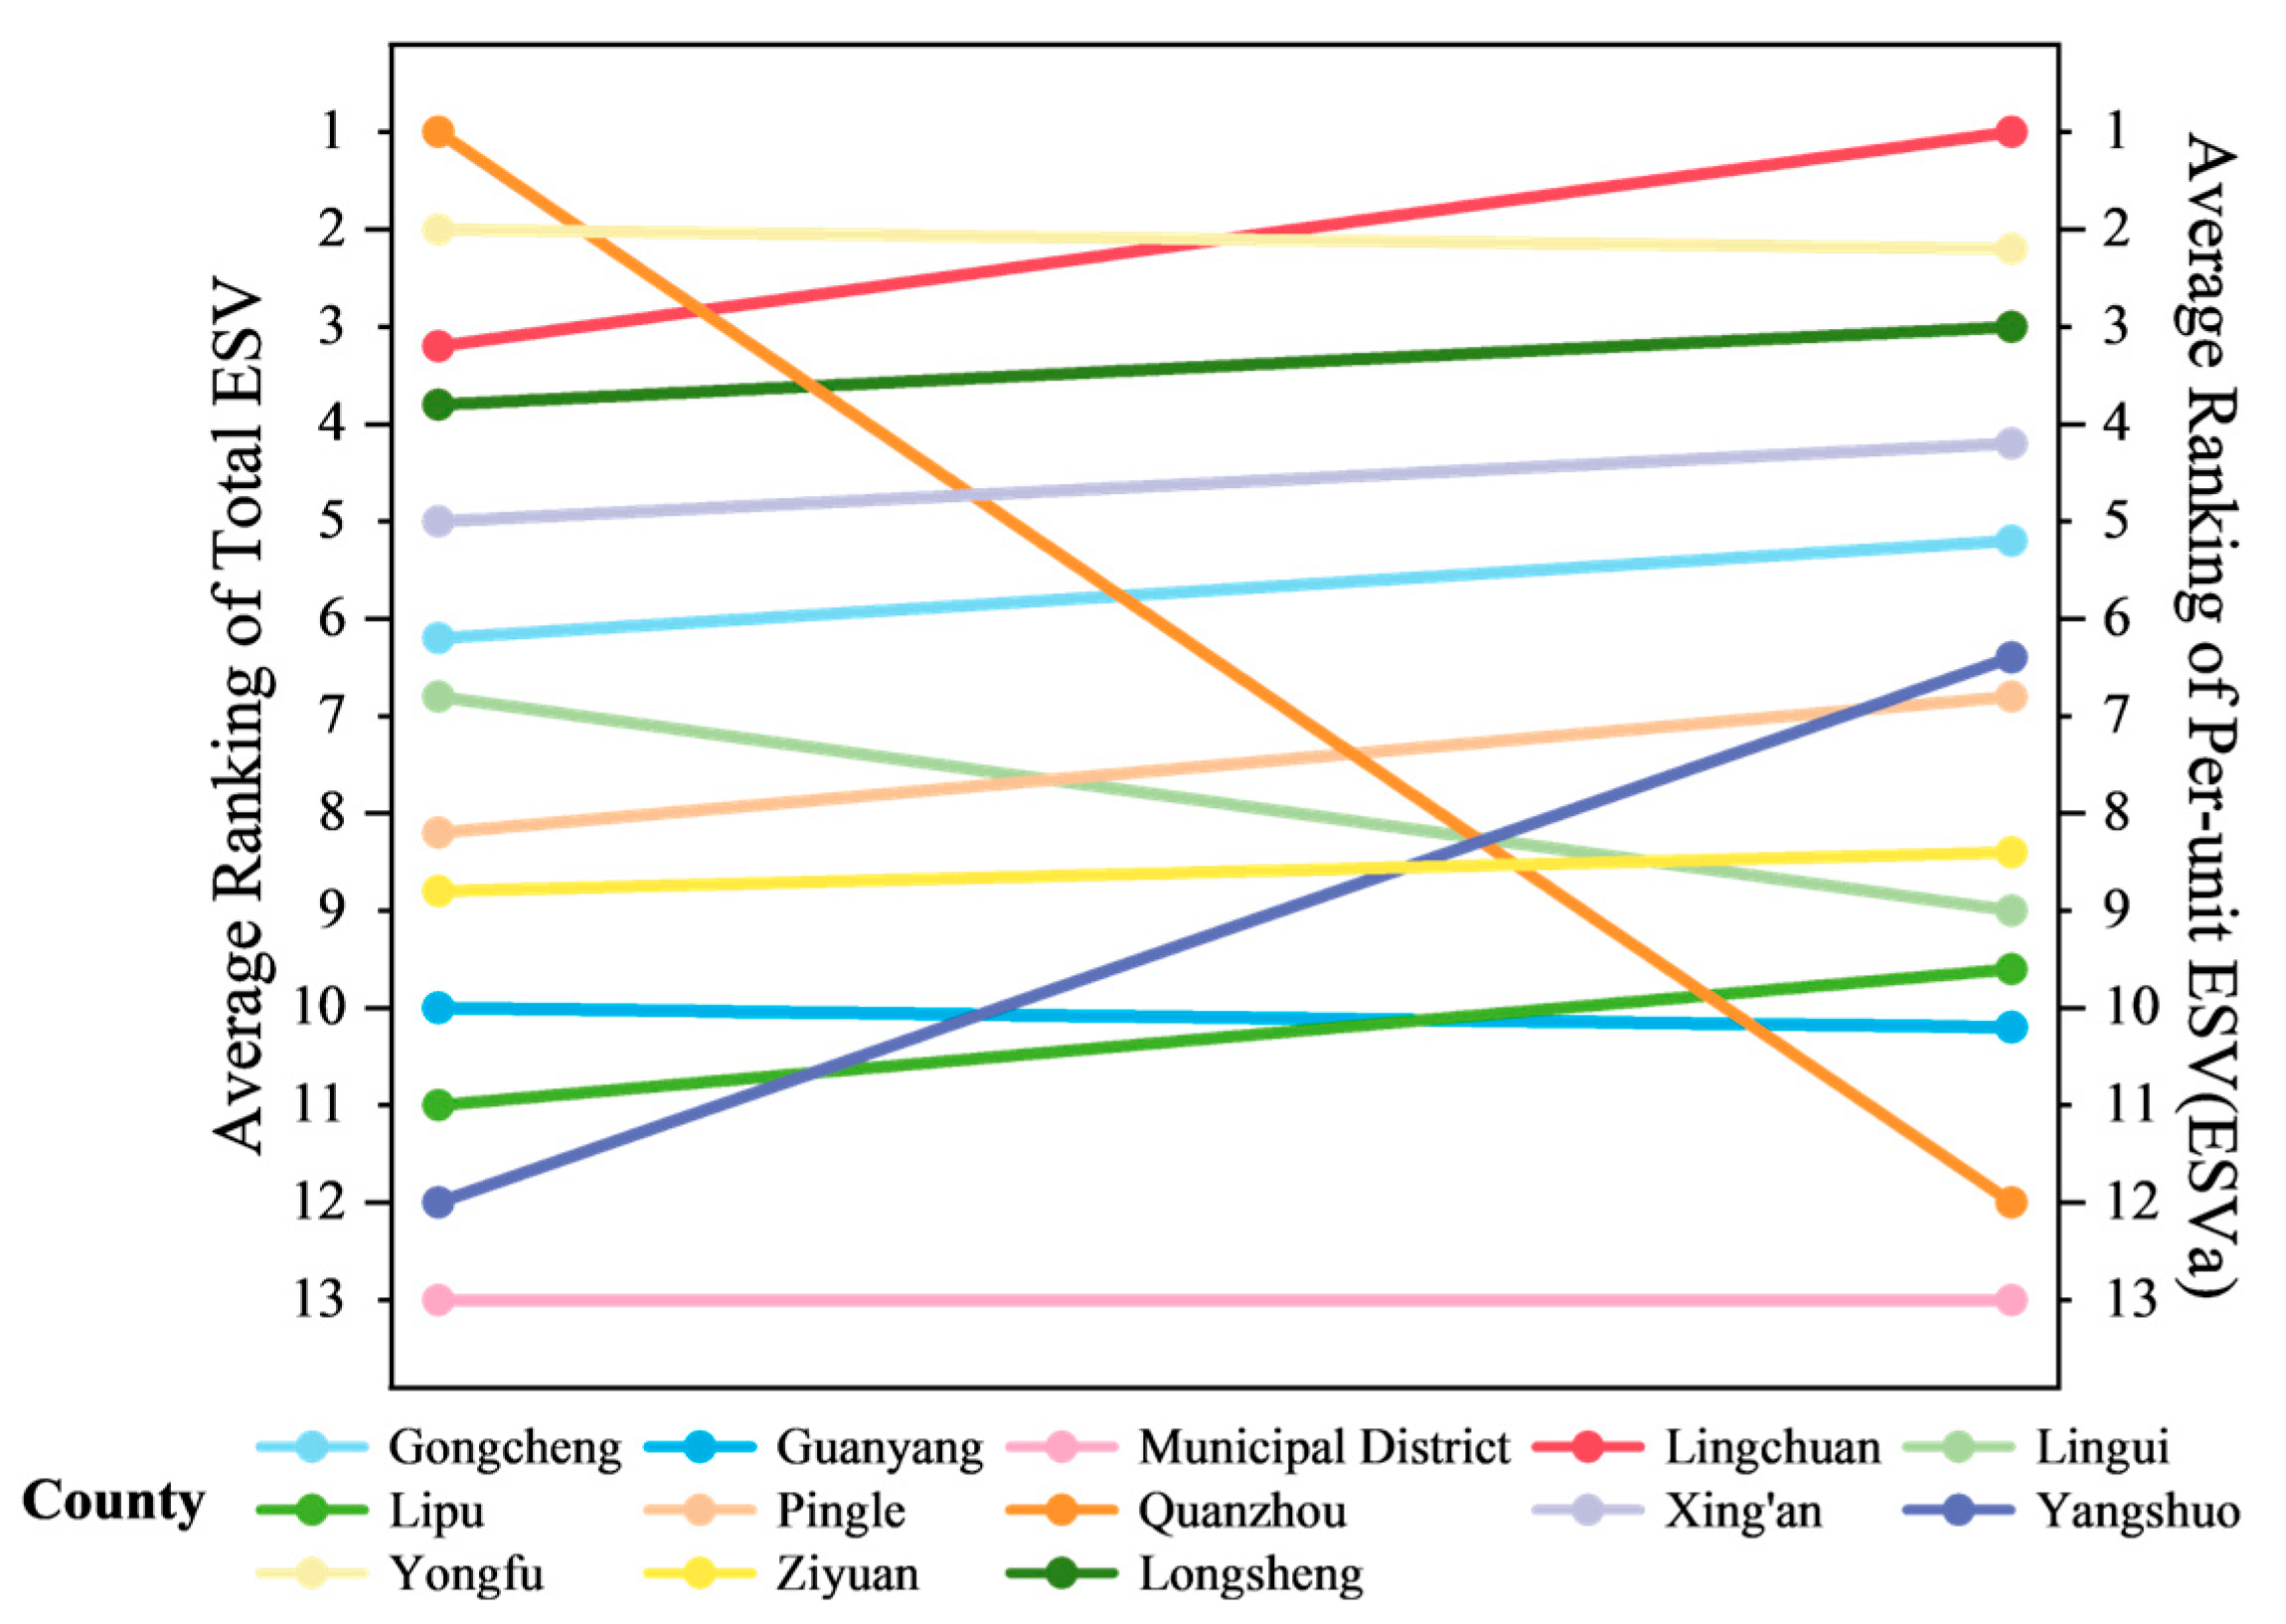
4.3. Analysis of ESV Effectiveness by County in Guilin
4.4. Spatial Patterns of ESV in Guilin from a Grid Perspective
4.5. Research Limitations and Future Research Directions
5. Conclusions
- (1)
- The improved ESV assessment methodology considered the spatiotemporal heterogeneous effects of biomass, soil conservation, and precipitation, adjusted equivalence factors on a cell-by-cell basis according to the specific characteristics of regional environments, revealing ESV results with higher accuracy and practical applicability;
- (2)
- The dual-scale perspective, which obtained a wide range of trends and detailed spatial characterization results, contributed to the exploration of ecosystem conditions and optimization of land allocation from different perspectives. The county scale identified high-value and low-value as well as high-efficiency and low-efficiency areas. The grid scale offered a more detailed view of the spatial pattern characterized by “high in the west and north, low in the east and south”, along with the phenomenon of “hollowing out” aggregation. High-value areas were predominantly located in counties such as Lingchuan and Yangshuo and near ecological zones like the Lijiang River and Mao’er Mountain;
- (3)
- From 2000 to 2020, Guilin showed the highest but decreasing trend in the proportion of forest land among land use types; the expansion of building land was noticeable, and the flow of each land use increased yearly. Forestland types and the hydrologic regulation service function contributed the most to Guilin’s ESV, with the waterbody being extremely dominant. There are significant differences in ESVs between counties, with consistently high values near waterbodies and ecological reserves and low values near industrial and commercial land and cultivated land. The total ESV showed S-shaped fluctuation, with the lowest value in 2005 (CNY 154.716 billion) and the highest in 2015 (CNY 178.719 billion). Although there was a trend of ecological recovery in the later period, there was still a gap between 2020 and 2000. Guilin was burdened with the responsibility of balancing ecological protection and development.
Author Contributions
Funding
Data Availability Statement
Acknowledgments
Conflicts of Interest
Appendix A

| Reclassified Land Types | Subclasses |
|---|---|
| Cultivated Land | 11 Paddy field, 12 Dry land |
| Forestland | 21 Forest, 22 Forest, 23 Sparse woods, 24 Other forestland |
| Grassland | 31 High-covered grassland, 32 Medium-covered grassland, 33 Low-covered grassland |
| Waterbody | 41 Rivers and canals, 42 Lakes, 43 Reservoir ponds, 46 Beach |
| Building land | 51 Urban residential areas, 52 Rural residential areas, 53 Other building land |
| Unused Land | 63 Saline land, 64 Marshland, 65 Bare land, 66 Bare rock, 67 Other unused land |
| Year | Cultivated Land | Forestland | Grassland | Waterbody | Building Land | Unused Land |
|---|---|---|---|---|---|---|
| 2000 | 0.0465 | 0.753 | 0.129 | 0.0722 | 0 | 0.00000515 |
| 2005 | 0.0465 | 0.753 | 0.128 | 0.0726 | 0 | 0.00000518 |
| 2010 | 0.0462 | 0.751 | 0.127 | 0.0754 | 0 | 0.00000754 |
| 2015 | 0.0460 | 0.750 | 0.127 | 0.0770 | 0 | 0.00001180 |
| 2020 | 0.0454 | 0.747 | 0.126 | 0.0813 | 0 | 0.00000922 |
| Parameter | 2000 | 2005 | 2010 | 2015 | 2020 |
|---|---|---|---|---|---|
| Moran’s I | 0.477 | 0.469 | 0.457 | 0.438 | 0.453 |
| p | 0.001 | 0.001 | 0.001 | 0.001 | 0.001 |
| z | 38.3481 | 37.8110 | 36.9244 | 35.3083 | 35.7871 |
References
- Halisçelik, E.; Soytas, M.A. Sustainable development from millennium 2015 to Sustainable Development Goals 2030. Sustain. Dev. 2019, 27, 545–572. [Google Scholar] [CrossRef]
- Vardon, M.; May, S.; Keith, H.; Burnett, P.; Lindenmayer, D. Accounting for ecosystem services—Lessons from Australia for its application and use in Oceania to achieve sustainable development. Ecosyst. Serv. 2019, 39, 100986. [Google Scholar] [CrossRef]
- Wood, S.L.; DeClerck, F. Ecosystems and human well-being in the Sustainable Development Goals. Front. Ecol. Environ. 2015, 13, 123. [Google Scholar] [CrossRef]
- Peng, K.; Jiang, W.; Ling, Z.; Hou, P.; Deng, Y. Evaluating the potential impacts of land use changes on ecosystem service value under multiple scenarios in support of SDG reporting: A case study of the Wuhan urban agglomeration. J. Clean. Prod. 2021, 307, 127321. [Google Scholar] [CrossRef]
- Gómez-Baggethun, E.; De Groot, R. Natural capital and ecosystem services: The ecological foundation of human society. Ecosyst. Serv. 2010, 30, 105–121. [Google Scholar]
- Wang, P.; Wang, Y.J.; Liu, X.P.; Wen, S.Q. Change of land use and landscape pattern in ecological resettlement area in central Ningxia. J. Arid. Land Resour. Environ. 2018, 32, 69–74. [Google Scholar]
- Wainger, L.A.; King, D.M.; Mack, R.N.; Price, E.W.; Maslin, T. Can the concept of ecosystem services be practically applied to improve natural resource management decisions? Ecol. Econ. 2010, 69, 978–987. [Google Scholar] [CrossRef]
- Lawler, J.J.; Lewis, D.J.; Nelson, E.; Plantinga, A.J.; Polasky, S.; Withey, J.C.; Helmers, D.P.; Martinuzzi, S.; Pennington, D.; Radeloff, V.C. Projected land-use change impacts on ecosystem services in the United States. Proc. Natl. Acad. Sci. USA 2014, 111, 7492–7497. [Google Scholar] [CrossRef]
- Bateman, I.J.; Harwood, A.R.; Mace, G.M.; Watson, R.T.; Abson, D.J.; Andrews, B.; Binner, A.; Crowe, A.; Day, B.H.; Dugdale, S. Bringing ecosystem services into economic decision-making: Land use in the United Kingdom. Science 2013, 341, 45–50. [Google Scholar] [CrossRef]
- Bai, Y.; Wong, C.P.; Jiang, B.; Hughes, A.C.; Wang, M.; Wang, Q. Developing China’s Ecological Redline Policy using ecosystem services assessments for land use planning. Nat. Commun. 2018, 9, 3034. [Google Scholar] [CrossRef]
- Costanza, R.; d’Arge, R.; De Groot, R.; Farber, S.; Grasso, M.; Hannon, B.; Limburg, K.; Naeem, S.; O’neill, R.V.; Paruelo, J. The value of the world’s ecosystem services and natural capital. Nature 1997, 387, 253–260. [Google Scholar] [CrossRef]
- Xie, G.D.; Lu, C.X.; Leng, Y.F.; Zheng, D.; Li, S.C. Ecological assets valuation of the Tibetan Plateau. J. Nat. Resour. 2003, 18, 189–196. [Google Scholar]
- Xie, G.-D.; Zhen, L.; Lu, C.-X.; Xiao, Y.; Chen, C. Expert knowledge based valuation method of ecosystem services in China. J. Nat. Resour. 2008, 23, 911–919. [Google Scholar]
- Xie, G.-D.; Zhang, C.-X.; Zhang, L.-M.; Chen, W.-H.; Li, S.-M. Improvement of the evaluation method for ecosystem service value based on per unit area. J. Nat. Resour. 2015, 30, 1243–1254. [Google Scholar]
- Song, W.; Deng, X. Land-use/land-cover change and ecosystem service provision in China. Sci. Total Environ. 2017, 576, 705–719. [Google Scholar] [CrossRef]
- Xie, G.; Zhang, C.; Zhen, L.; Zhang, L. Dynamic changes in the value of China’s ecosystem services. Ecosyst. Serv. 2017, 26, 146–154. [Google Scholar] [CrossRef]
- Xiaomin, G.; Chuanglin, F.; Xufang, M.; Dan, C. Coupling and coordination analysis of urbanization and ecosystem service value in Beijing-Tianjin-Hebei urban agglomeration. Ecol. Indic. 2022, 137, 108782. [Google Scholar] [CrossRef]
- Shrestha, S.; Poudyal, K.N.; Bhattarai, N.; Dangi, M.B.; Boland, J.J. An Assessment of the Impact of Land Use and Land Cover Change on the Degradation of Ecosystem Service Values in Kathmandu Valley Using Remote Sensing and GIS. Sustainability 2022, 14, 15739. [Google Scholar] [CrossRef]
- Wang, B.; Yang, T. Assessing Impact of Land Use Change on the Ecosystem Service Value in Yinchuan City from 1980 to 2018. Sustainability 2021, 13, 8311. [Google Scholar] [CrossRef]
- Pan, Y.; Dong, F.; Du, C. Is China approaching the inflection point of the ecological Kuznets curve? Analysis based on ecosystem service value at the county level. J. Environ. Manag. 2023, 326, 116629. [Google Scholar] [CrossRef]
- Zhang, J.; Qu, M.; Wang, C.; Zhao, J.; Cao, Y. Quantifying landscape pattern and ecosystem service value changes: A case study at the county level in the Chinese Loess Plateau. Glob. Ecol. Conserv. 2020, 23, e01110. [Google Scholar] [CrossRef]
- Wang, P.; Wang, J.; Zhang, J.; Ma, X.; Zhou, L.; Sun, Y. Spatial-temporal changes in ecosystem services and social-ecological drivers in a typical coastal tourism city: A case study of Sanya, China. Ecol. Indic. 2022, 145, 109607. [Google Scholar] [CrossRef]
- Zhang, S.; Jin, C.; Pan, X.; Wei, L.; Shao, H. Coastal land use change and evaluation of ecosystem services value enhancement under the background of Yangtze River protection: Taking Jiangyin coastal areas as an example. Front. Environ. Sci. 2023, 11, 1088816. [Google Scholar] [CrossRef]
- Zhou, Z.; Quan, B.; Deng, Z. Effects of Land Use Changes on Ecosystem Service Value in Xiangjiang River Basin, China. Sustainability 2023, 15, 2492. [Google Scholar] [CrossRef]
- Chen, X.; He, L.; Luo, F.; He, Z.; Bai, W.; Xiao, Y.; Wang, Z. Dynamic characteristics and impacts of ecosystem service values under land use change: A case study on the Zoigê plateau, China. Ecol. Inform. 2023, 78, 102350. [Google Scholar] [CrossRef]
- Jiang, W.; Fu, B.; Lü, Y. Assessing Impacts of Land Use/Land Cover Conversion on Changes in Ecosystem Services Value on the Loess Plateau, China. Sustainability 2020, 12, 7128. [Google Scholar] [CrossRef]
- Qiao, B.; Zhu, C.-X.; Cao, X.-Y.; Xiao, J.-S.; Zhaxi, L.-D.; Yan, Y.-Q.; Chen, G.-Q.; Shi, F.-F. Spatial autocorrelation analysis of land use and ecosystem service value in Maduo County, Qinghai Province, China at the grid scale. Ying Yong Sheng Tai Xue Bao J. Appl. Ecol. 2020, 31, 1660–1672. [Google Scholar]
- Shi, F.; Zhou, B.; Zhou, H.; Zhang, H.; Li, H.; Li, R.; Guo, Z.; Gao, X. Spatial autocorrelation analysis of land use and ecosystem service value in the Huangshui River basin at the grid scale. Plants 2022, 11, 2294. [Google Scholar] [CrossRef]
- Pan, N.; Guan, Q.; Wang, Q.; Sun, Y.; Li, H.; Ma, Y. Spatial Differentiation and Driving Mechanisms in Ecosystem Service Value of Arid Region:A case study in the middle and lower reaches of Shule River Basin, NW China. J. Clean. Prod. 2021, 319, 128718. [Google Scholar] [CrossRef]
- Cai, Y.; Zhang, P.; Wang, Q.; Wu, Y.; Ding, Y.; Nabi, M.; Fu, C.; Wang, H.; Wang, Q. How does water diversion affect land use change and ecosystem service: A case study of Baiyangdian wetland, China. J. Environ. Manag. 2023, 344, 118558. [Google Scholar] [CrossRef]
- Li, W.; Xiang, M.; Duan, L.; Liu, Y.; Yang, X.; Mei, H.; Wei, Y.; Zhang, J.; Deng, L. Simulation of land utilization change and ecosystem service value evolution in Tibetan area of Sichuan Province. Alex. Eng. J. 2023, 70, 13–23. [Google Scholar] [CrossRef]
- Zhao, L.; Fan, X. Effects of Land Use Changes on Ecosystem Service Values: A Case Study in Guilin, China. Pol. J. Environ. Stud. 2020, 29, 1483–1492. [Google Scholar] [CrossRef] [PubMed]
- Li, N.; Wang, J.; Wang, H.; Fu, B.; Chen, J.; He, W. Impacts of land use change on ecosystem service value in Lijiang River Basin, China. Environ. Sci. Pollut. Res. Int. 2021, 28, 46100–46115. [Google Scholar] [CrossRef]
- Xu, L.; He, G.; Chen, L. World natural heritage conservation integrates the sustainable development goals from the public perspective in Guilin, China. Environ. Sustain. Indic. 2024, 23, 100457. [Google Scholar] [CrossRef]
- Xu, X.; Liu, J.; Zhang, S.; Li, R.; Yan, C.; Wu, S. China’s Multi-Period Land Use Land Cover Remote Sensing Monitoring Data Set (CNLUCC); Resource and Environment Data Cloud Platform: Beijing, China, 2018. [Google Scholar]
- Wang, S.-Y.; Liu, J.-S.; Ma, T.-B. Dynamics and changes in spatial patterns of land use in Yellow River Basin, China. Land Use Policy 2010, 27, 313–323. [Google Scholar] [CrossRef]
- Wang, X.; Pan, T.; Pan, R.; Chi, W.; Ma, C.; Ning, L.; Wang, X.; Zhang, J. Impact of land transition on landscape and ecosystem service value in Northeast Region of China from 2000–2020. Land 2022, 11, 696. [Google Scholar] [CrossRef]
- Barrios, E. Soil biota, ecosystem services and land productivity. Ecol. Econ. 2007, 64, 269–285. [Google Scholar] [CrossRef]
- Sun, W.; Shao, Q.; Liu, J. Soil erosion and its response to the changes of precipitation and vegetation cover on the Loess Plateau. J. Geogr. Sci. 2013, 23, 1091–1106. [Google Scholar] [CrossRef]
- Zheng, D.; Wang, Y.; Hao, S.; Xu, W.; Lv, L.; Yu, S. Spatial-temporal variation and tradeoffs/synergies analysis on multiple ecosystem services: A case study in the Three-River Headwaters region of China. Ecol. Indic. 2020, 116, 106494. [Google Scholar] [CrossRef]
- Balmford, A.; Bruner, A.; Cooper, P.; Costanza, R.; Farber, S.; Green, R.E.; Jenkins, M.; Jefferiss, P.; Jessamy, V.; Madden, J. Economic reasons for conserving wild nature. Science 2002, 297, 950–953. [Google Scholar] [CrossRef]
- Lei, J. Effects of land use change on ecosystem services value of Xunwu County. Acta Ecol. Sin. 2019, 9, 3089. [Google Scholar]
- Lei, J.; Chen, Z.; Wu, T.; Li, X.; Yang, Q.; Chen, X. Spatial autocorrelation pattern analysis of land use and the value of ecosystem services in northeast Hainan island. Acta Ecol. Sin. 2019, 39, 2366–2377. [Google Scholar]
- Tolessa, T.; Senbeta, F.; Kidane, M. The impact of land use/land cover change on ecosystem services in the central highlands of Ethiopia. Ecosyst. Serv. 2017, 23, 47–54. [Google Scholar] [CrossRef]
- Kreuter, U.P.; Harris, H.G.; Matlock, M.D.; Lacey, R.E. Change in ecosystem service values in the San Antonio area, Texas. Ecol. Econ. 2001, 39, 333–346. [Google Scholar] [CrossRef]
- Li, Y.; Zhan, J.; Liu, Y.; Zhang, F.; Zhang, M. Response of ecosystem services to land use and cover change: A case study in Chengdu City. Resour. Conserv. Recycl. 2018, 132, 291–300. [Google Scholar] [CrossRef]
- You, G.; Liu, B.; Zou, C.; Li, H.; McKenzie, S.; He, Y.; Gao, J.; Jia, X.; Arain, M.A.; Wang, S. Sensitivity of vegetation dynamics to climate variability in a forest-steppe transition ecozone, north-eastern Inner Mongolia, China. Ecol. Indic. 2021, 120, 106833. [Google Scholar] [CrossRef]
- Liu, D.; Wang, X.; Li, C.; Cai, Y.; Liu, Q. Eco-environmental Effects of Hydrological Connectivity on Lakes: A Review. Resour. Environ. Yangtze Basin 2019, 28, 1702–1715. [Google Scholar]
- Wang, Y.; Ma, J. Effects of land use change on ecosystem services value in Guangxi section of the Pearl River-West River Economic Belt at the county scale. Acta Ecol. Sin. 2020, 40, 7826–7839. [Google Scholar]
- Zhang, X.-B.; Luo, J.; Shi, P.-J.; Zhou, L. Spatial-temporal evolution pattern and terrain gradient differentiation of ecosystem service value in Zhangye, Northwest China at the grid scale. Ying Yong Sheng Tai Xue Bao J. Appl. Ecol. 2020, 31, 543–553. [Google Scholar]
- Crouzat, E.; Mouchet, M.; Turkelboom, F.; Byczek, C.; Meersmans, J.; Berger, F.; Verkerk, P.J.; Lavorel, S. Assessing bundles of ecosystem services from regional to landscape scale: Insights from the French Alps. J. Appl. Ecol. 2015, 52, 1145–1155. [Google Scholar] [CrossRef]
- Guo, C.; Gao, S.; Zhou, B.; Gao, J. Effects of land use change on ecosystem service value in Funiu Mountain based upon a grid square. Acta Ecol. Sin. 2019, 39, 3482–3493. [Google Scholar]
- He, G.; Zhao, X.; Yu, M. Exploring the multiple disturbances of karst landscape in Guilin World Heritage Site, China. Catena 2021, 203, 105349. [Google Scholar] [CrossRef]
- Lan, Y.; Chen, J.; Yang, Y.; Ling, M.; You, H.; Han, X. Landscape Pattern and Ecological Risk Assessment in Guilin Based on Land Use Change. Int. J. Environ. Res. Public Health 2023, 20, 2045. [Google Scholar] [CrossRef] [PubMed]
- Yang, Y.P.; Chen, J.J.; Huang, R.J.; Feng, Z.H.; Zhou, G.Q.; You, H.T.; Han, X.W. Construction of Ecological Security Pattern Based on the Importance of Ecological Protection-A Case Study of Guangxi, a Karst Region in China. Int. J. Environ. Res. Public Health 2022, 19, 5699. [Google Scholar] [CrossRef]
- Ni, C.; He, W.; Yao, Y. Assessment of cultivated land use change in Guilin using the GeoSOS-FLUS model. Bull. Surv. Mapp. 2024, 5, 35–40. [Google Scholar]
- Grizzetti, B.; Lanzanova, D.; Liquete, C.; Reynaud, A.; Cardoso, A. Assessing water ecosystem services for water resource management. Environ. Sci. Policy 2016, 61, 194–203. [Google Scholar] [CrossRef]
- Fei, L.; Shuwen, Z.; Jiuchun, Y.; Liping, C.; Haijuan, Y.; Kun, B. Effects of land use change on ecosystem services value in West Jilin since the reform and opening of China. Ecosyst. Serv. 2018, 31, 12–20. [Google Scholar] [CrossRef]
- Chuai, X.; Huang, X.; Wu, C.; Li, J.; Lu, Q.; Qi, X.; Zhang, M.; Zuo, T.; Lu, J. Land use and ecosystems services value changes and ecological land management in coastal Jiangsu, China. Habitat Int. 2016, 57, 164–174. [Google Scholar] [CrossRef]
- Smith, P.; Calvin, K.; Nkem, J.; Campbell, D.; Cherubini, F.; Grassi, G.; Korotkov, V.; Le Hoang, A.; Lwasa, S.; McElwee, P. Which practices co-deliver food security, climate change mitigation and adaptation, and combat land degradation and desertification? Glob. Change Biol. 2020, 26, 1532–1575. [Google Scholar] [CrossRef]
- Kang, N.; Hou, L.; Huang, J.; Liu, H. Ecosystem services valuation in China: A meta-analysis. Sci. Total Environ. 2022, 809, 151122. [Google Scholar] [CrossRef]
- Liu, J.; Chen, L.; Yang, Z.; Zhao, Y.; Zhang, X. Unraveling the Spatio-Temporal Relationship between Ecosystem Services and Socioeconomic Development in Dabie Mountain Area over the Last 10 years. Remote Sens. 2022, 14, 1059. [Google Scholar] [CrossRef]
- Xiao, Y.; Huang, M.; Xie, G.; Zhen, L. Evaluating the impacts of land use change on ecosystem service values under multiple scenarios in the Hunshandake region of China. Sci. Total Environ. 2022, 850, 158067. [Google Scholar] [CrossRef] [PubMed]
- Liu, C.; Chen, Y.; Wei, Y.; Chen, F. Spatial Population Distribution Data Disaggregation Based on SDGSAT-1 Nighttime Light and Land Use Data Using Guilin, China, as an Example. Remote Sens. 2023, 15, 2926. [Google Scholar] [CrossRef]
- Mao, X.-Y.; Meng, J.-J.; Wang, Q. Tourism and land transformation: A case study of the Li River Basin, Guilin, China. J. Mt. Sci. 2014, 11, 1606–1619. [Google Scholar] [CrossRef]


| Data Type | Data Name | Spatial Resolution | Source | Data Provision |
|---|---|---|---|---|
| Land use | CNLUCC | 30 m | Landsat Series, CBERS-1 | Resource and Environment Science and Data Center (http://www.resdc.cn (accessed on 18 October 2023)) |
| NPP | MOD17A3H database | 500 m | Terra | The database in GEE (https://doi.org/10.5067/MODIS/MOD13A2.061 (accessed on 30 October 2023)) |
| NDVI | MOD13A2 | 1000 m | Terra | The database in GEE (https://doi.org/10.5067/MODIS/MOD17A3HGF.061 (accessed on 30 October 2023)) |
| Precipitation | CHIRPS Daily | 0.05° | multiple satellites and meteorological stations | The database in GEE (https://chc.ucsb.edu/data/chirps (accessed on 30 October 2023)) |
| County | EFNPP | EFFVC | EFP | ||||||||||||
|---|---|---|---|---|---|---|---|---|---|---|---|---|---|---|---|
| 2000 | 2005 | 2010 | 2015 | 2020 | 2000 | 2005 | 2010 | 2015 | 2020 | 2000 | 2005 | 2010 | 2015 | 2020 | |
| Gongcheng | 2.05 | 1.88 | 1.92 | 1.80 | 1.89 | 0.74 | 0.68 | 0.72 | 0.67 | 0.72 | 2.88 | 2.86 | 2.95 | 3.88 | 3.01 |
| Guanyang | 1.91 | 1.64 | 1.71 | 1.71 | 1.67 | 0.72 | 0.67 | 0.70 | 0.66 | 0.66 | 3.00 | 2.70 | 2.90 | 3.65 | 2.95 |
| Municipal district | 1.86 | 1.70 | 1.71 | 1.73 | 1.74 | 0.65 | 0.58 | 0.61 | 0.60 | 0.62 | 3.42 | 2.94 | 3.02 | 4.35 | 3.51 |
| Lingchuan | 2.12 | 1.86 | 1.89 | 1.81 | 1.82 | 0.75 | 0.68 | 0.71 | 0.66 | 0.67 | 3.40 | 2.93 | 3.08 | 4.21 | 3.45 |
| Lingui | 1.95 | 1.71 | 1.79 | 1.70 | 1.70 | 0.73 | 0.65 | 0.67 | 0.63 | 066 | 3.51 | 2.93 | 3.01 | 4.32 | 3.68 |
| Lipu | 2.17 | 1.96 | 2.07 | 1.89 | 2.04 | 0.74 | 0.67 | 0.70 | 0.64 | 0.70 | 2.74 | 2.72 | 2.82 | 3.65 | 2.74 |
| Longsheng | 2.14 | 1.85 | 1.98 | 1.87 | 1.74 | 0.79 | 0.71 | 0.75 | 0.73 | 0.68 | 3.14 | 2.57 | 2.73 | 3.66 | 3.10 |
| Pingle | 2.17 | 2.00 | 2.06 | 1.95 | 2.06 | 0.72 | 0.66 | 0.69 | 0.66 | 0.74 | 2.57 | 2.77 | 2.84 | 3.48 | 2.70 |
| Quanzhou | 1.94 | 1.64 | 1.72 | 1.81 | 1.70 | 0.71 | 0.65 | 0.69 | 0.67 | 0.68 | 2.79 | 2.34 | 2.60 | 3.23 | 2.71 |
| Xing’an | 2.11 | 1.78 | 1.83 | 1.80 | 1.78 | 0.74 | 0.67 | 0.70 | 0.66 | 0.64 | 3.22 | 2.78 | 2.98 | 3.95 | 3.18 |
| Yangshuo | 2.14 | 1.96 | 2.08 | 1.95 | 2.04 | 0.73 | 0.66 | 0.70 | 0.63 | 0.70 | 3.12 | 2.86 | 2.85 | 3.91 | 3.06 |
| Yongfu | 2.10 | 1.78 | 1.93 | 1.81 | 1.86 | 0.77 | 0.67 | 0.72 | 0.65 | 0.70 | 3.67 | 3.11 | 3.07 | 4.43 | 3.85 |
| Ziyuan | 2.07 | 1.73 | 1.84 | 1.77 | 1.65 | 0.75 | 0.67 | 0.74 | 0.68 | 0.67 | 2.92 | 2.39 | 2.68 | 3.33 | 2.67 |
| Primary Ecosystem Service Types | Secondary Ecosystem Service Types | Cultivated Land | Forestland | Grassland | Waterbody | Unused Land |
|---|---|---|---|---|---|---|
| Provisioning | Food production | 2274.08 | 455.95 | 565.22 | 1507.26 | 18.84 |
| Raw materials | 344.79 | 1051.32 | 838.42 | 433.34 | 56.52 | |
| Water supply | −3457.29 | 542.62 | 461.60 | 15,619.02 | 37.68 | |
| Regulating | Gas regulation | 1842.63 | 3447.87 | 2929.74 | 1450.74 | 207.25 |
| Climate regulation | 955.23 | 10,313.45 | 7752.99 | 4314.54 | 188.41 | |
| Environment purification | 280.73 | 3059.75 | 2562.34 | 10,456.64 | 584.06 | |
| Hydrological regulation | 3739.90 | 7351.68 | 5680.50 | 192,628.34 | 395.66 | |
| Supporting | Soil protection | 595.37 | 4197.73 | 3570.33 | 1752.19 | 244.93 |
| Nutrient cycling | 318.41 | 320.30 | 273.19 | 131.89 | 18.84 | |
| Biodiversity conservation | 350.44 | 3824.68 | 3250.03 | 4804.40 | 226.09 | |
| Culture | Entertainment culture | 152.61 | 1676.83 | 1431.90 | 3560.91 | 94.20 |
| Year | Cultivated Land | Forestland | Grassland | Waterbody | Building Land | Unused Land | ||||||
|---|---|---|---|---|---|---|---|---|---|---|---|---|
| km2 | % | km2 | % | km2 | % | km2 | % | km2 | % | km2 | % | |
| 2000 | 5361.14 | 19.49 | 17700.98 | 64.35 | 3735.86 | 13.58 | 260.08 | 0.95 | 448.77 | 1.63 | 2.12 | 0.01 |
| 2005 | 5357.92 | 19.48 | 17696.74 | 64.33 | 3729.02 | 13.56 | 261.54 | 0.95 | 461.70 | 1.68 | 2.13 | 0.01 |
| 2010 | 5342.28 | 19.42 | 17709.77 | 64.38 | 3708.59 | 13.48 | 272.35 | 0.99 | 473.15 | 1.72 | 3.11 | 0.01 |
| 2015 | 5319.10 | 19.34 | 17680.77 | 64.27 | 3708.23 | 13.48 | 278.15 | 1.01 | 517.91 | 1.88 | 4.87 | 0.02 |
| 2020 | 5255.74 | 19.11 | 17636.68 | 64.11 | 3687.86 | 13.41 | 294.04 | 1.07 | 629.87 | 2.29 | 3.80 | 0.01 |
Disclaimer/Publisher’s Note: The statements, opinions and data contained in all publications are solely those of the individual author(s) and contributor(s) and not of MDPI and/or the editor(s). MDPI and/or the editor(s) disclaim responsibility for any injury to people or property resulting from any ideas, methods, instructions or products referred to in the content. |
© 2024 by the authors. Licensee MDPI, Basel, Switzerland. This article is an open access article distributed under the terms and conditions of the Creative Commons Attribution (CC BY) license (https://creativecommons.org/licenses/by/4.0/).
Share and Cite
Shi, C.; Yin, W.; Lv, Z.; Xiang, B.; Dou, X.; Zhang, L. Spatial-Temporal Evolution of Ecosystem Service Value in Guilin, China from 2000 to 2020: A Dual-Scale Perspective. Remote Sens. 2024, 16, 4425. https://doi.org/10.3390/rs16234425
Shi C, Yin W, Lv Z, Xiang B, Dou X, Zhang L. Spatial-Temporal Evolution of Ecosystem Service Value in Guilin, China from 2000 to 2020: A Dual-Scale Perspective. Remote Sensing. 2024; 16(23):4425. https://doi.org/10.3390/rs16234425
Chicago/Turabian StyleShi, Chunhong, Weize Yin, Zhuoran Lv, Bo Xiang, Xinyu Dou, and Lu Zhang. 2024. "Spatial-Temporal Evolution of Ecosystem Service Value in Guilin, China from 2000 to 2020: A Dual-Scale Perspective" Remote Sensing 16, no. 23: 4425. https://doi.org/10.3390/rs16234425
APA StyleShi, C., Yin, W., Lv, Z., Xiang, B., Dou, X., & Zhang, L. (2024). Spatial-Temporal Evolution of Ecosystem Service Value in Guilin, China from 2000 to 2020: A Dual-Scale Perspective. Remote Sensing, 16(23), 4425. https://doi.org/10.3390/rs16234425