Abstract
The Yellow River Basin is rich in coal resources, but the ecological environment is fragile, and the ecological degradation of vegetation is exacerbated by the disruption caused by high-intensity mining activities. Analyzing the dynamic evolution of vegetation in the Henan section of the Yellow River Basin and its mining areas over the long term run reveals the regional ecological environment and offers a scientific foundation for the region’s sustainable development. In this study, we obtained a long time series of Landsat imageries from 1987 to 2023 on the Google Earth Engine (GEE) platform and utilized geographically weighted regression models, Sen (Theil–Sen median) trend analysis, M-K (Mann–Kendall) test, coefficient of variation (CV), and the Hurst index to investigate the evolution of vegetation cover based on the kNDVI (the normalized difference vegetation index). This index is used to explore the spatial and temporal characteristics of vegetation cover and its future development trend. Our results showed that (1) The kNDVI value in the Henan section of the Yellow River Basin exhibited a trend of fluctuating upward at a rate of 0.0509/10a from 1987 to 2023. The kNDVI trend in the mining areas of the region aligned closely with the overall trend of the Henan section; however, the annual kNDVI in each mining area consistently remained lower than that of the Henan section and displayed a degree of fluctuation, predominantly characterized by medium–high variability, with areas of moderate and high fluctuations accounting for 73.5% of the total. (2) The kNDVI in the study area showed a significant improvement in vegetation cover and its future development trends. We detected a significant improvement in the kNDVI index in the area; yet, significant improvement in this index in the future might cause vegetation degradation in 87% of the study area, which may be closely related to multiple factors such as the intensity of mining at the mine site, anthropogenic disturbances, and climate change. (3) The vegetation status of the Henan section of the Yellow River Basin shows a significant positive correlation with distance from mining areas, accounting for 90.9% of the total, indicating that mining has a strong impact on vegetation cover. This study provides a scientific basis for vegetation restoration, green development of mineral resources, and sustainable development in the Henan section of the Yellow River Basin.
1. Introduction
Vegetation plays an important role in maintaining ecological balance, promoting ecological restoration, and improving human living environments [1,2]. Extensive mining activities in mining areas have led to large-scale destruction and degradation of vegetation, thus affecting the local ecological balance and the stability of vegetation cover [3,4]. Henan Province, located in the middle and lower reaches of the basin, has an important strategic position, at it provides an important share of grain production in China [5,6]. The Henan section of the Yellow River Basin, as an important part of the middle and lower reaches of the Yellow River, plays a strategic role. It holds an important position not only in terms of natural resources and economic development but also by being a key area for ecological protection [7,8,9]. Excessive coal mining along the river in the Henan section of the Yellow River Basin not only consumes water resources but also destroys surface vegetation and soil structure. It also results in land degradation and soil erosion, while surface subsidence, ground collapse, and cracking induced by extensive coal mining further intensify ecological vulnerability, leading to environmental degradation [10,11]. Under the influence of climate change and human activities, the vegetation cover of the Yellow River Basin has been significantly improved in recent years, but the ecosystem has remained fragile [12,13]. Consequently, the investigation of the spatial and temporal dynamics of vegetation cover and its influencing factors in the mining regions of the Yellow River Basin holds substantial theoretical importance and value for the development of scientifically sound ecological protection initiatives, assessment of ecological security, and advancement of the Yellow River strategy. The findings of such studies provide useful references for the ecological protection and restoration in other similar areas.
Vegetation indices can effectively characterize the growth of vegetation. The normalized difference vegetation index (NDVI) is a crucial indicator for monitoring changes in surface vegetation cover, effectively reflecting the growth status of vegetation [14]. Since the introduction of the NDVI, it has received much attention for its stability and has become one of the most widely used vegetation indices [15]. However, the NDVI can only capture the differences in the near-infrared as well as in the red band linearly with the parameter of interest [16]. It has some other shortcomings, most notably the impact of atmospheric noise and soil background as well as saturation effect. However, there are many optimized vegetation indices that still suffer from saturation problems, such as the EVI and SAVI [17,18,19]. Other indices (e.g., the EVI, NIRV, NDMI, and NBR) also have some applications in monitoring vegetation. However, the EVI and NIRV are susceptible to changes in environmental conditions, which can cause errors [20,21]. The NDMI is mainly used to assess the moisture status of vegetation, and the NBR is aimed at monitoring the status of vegetation after fires, and both of them have limited effect in the comprehensive assessment of vegetation status [22,23,24]. In order to explain the higher-order relationships between spectral channels, Camps-Valls [10] proposed the kernel normalized vegetation index (kNDVI), which, unlike previous improved vegetation indices, applies the theory of the kernel method for the extraction and computation of the NDVI using the principles of machine learning. This study verified that the kNDVI outperforms the NDVI in many instances. The kNDVI captures all higher-order discrepancies between the near-infrared and red bands, exhibiting exceptional performance and greater resilience to saturation, bias, and intricate climatic cycles. It is appropriate for various research and monitoring applications, demonstrating enhanced sensitivity to vegetation, accurately capturing vegetation characteristics, and exhibiting superior performance in monitoring vegetation cover and chlorophyll content, surpassing other vegetation indices [25,26,27,28]. However, the abovementioned studies did not reveal at what threshold range can the kNDVI outperform the NDVI. Consequently, this study selected NDVI and kNDVI data to examine their spatial variations in order to determine the threshold at which the NDVI attains saturation and to identify the advantages of the kNDVI over the NDVI [29]. Analyzing the spatiotemporal pattern of vegetation dynamics using multivariate statistical methods based on the kNDVI in the Yellow River Basin from 1982 to 2022 showed a significant increase in vegetation cover [30]. This paper combined geographically weighted regression methods with trend analysis to better represent the characteristics of vegetation cover in the study area.
The attributes of vegetation change correspond with the application characteristics of the geographically weighted regression model, wherein various vegetation types exhibit distinct sensitivities to external disturbances based on their growth conditions and characteristics [31,32,33]. This variability results in divergent dynamic characteristics of vegetation influenced by disturbances at disparate spatial locations, thereby generating spatial heterogeneity in vegetation [34,35,36]. However, the spatial pattern and the correlations between the kNDVI and mine distance, among other local factors, have not been well studied. Therefore, the relationship between vegetation change and mine distance can be analyzed by geographically weighted regression method to explore the impact of mining activities on vegetation condition.
The spatial and temporal changes of the NDVI in the Shanxi section of the Yellow River Basin and its coal mine area using the NDVI dataset showed an improving trend in vegetation cover. Moreover, the effect of precipitation on the NDVI was found to be more significant than that of air temperature [37]. This study, however, did not clarify the specific mechanism of the influence of the mining disturbance on the vegetation status. The NDVI data used had also a certain effect on the inversion results of the vegetation changes. The Hurst exponent, which is an effective method to quantitatively detect the sustainability of time series data and to predict possible future change trends, has been widely used in hydrology, meteorology, remote sensing, and other fields [38,39,40]. Several previous studies have used the Hurst exponent to analyze future vegetation dynamics [41,42], but, to date, it has not been exploited for vegetation trend prediction in the Henan section of the Yellow River Basin.
In this study, a kNDVI dataset was measured on the GEE platform using the Landsat TM/ETM+/OLI data between 1987–2023 to characterize the spatial and temporal changes in vegetation cover in the Henan section of the Yellow River Basin and its mining areas. The spatial and temporal variations of vegetation cover in the Henan section of the Yellow River Basin and its mining area and their future development trends were analyzed using the Theil–Sen median slope analysis, the Mann–Kendall (M-K) test, geographically weighted regression, the Hurst index, and partial correlation analysis. Partial correlation was used to analyze the correlation between the vegetation characteristics and trends with precipitation and temperature in the study area and to provide scientific guidance for the ecological restoration and management of vegetation in the area.
2. Materials and Methods
2.1. Study Area
The Henan section of the Yellow River Basin is located in the middle and lower reaches of the Yellow River Basin and in the northern part of the central Henan Province. This region serves as the transitional zone between the second and third tiers of China’s topography, characterized by a complex and diverse surface morphology, featuring a variety of hills in the western mountainous terrain and plains in the eastern part of the country, with the entire area inclined from southwest to northeast. The study area spans from 33°41′ to 36°6′ N, and from 110°21′ to 116°6′ E. The river runs through eight cities, including Sanmenxia, Jiyuan, Luoyang, Jiaozuo, Zhengzhou, Xinxiang, Anyang, and part of Puyang, with a total length of 711 km, an area of about 36,200 km2, accounting for 5.5% of the total area of the Yellow River Basin [43]. The Henan section of the Yellow River Basin has a continental monsoon climate. Precipitation is mainly concentrated between May and September, and the average annual temperature is 13.0~14.5 °C The annual frost-free period is 210~220 d, the sunshine duration is 2300~2600 h, the annual rainfall is 600~700 mm, and the rainfall is unevenly distributed within the year. Broadleaf forests are prevalent in mountainous regions, while crop lands predominate in the east-central area. There are several mining areas in the Henan section of the Yellow River Basin, including Sanmenxia City, Luoyang City, and Zhengzhou City, as shown in Figure 1d.
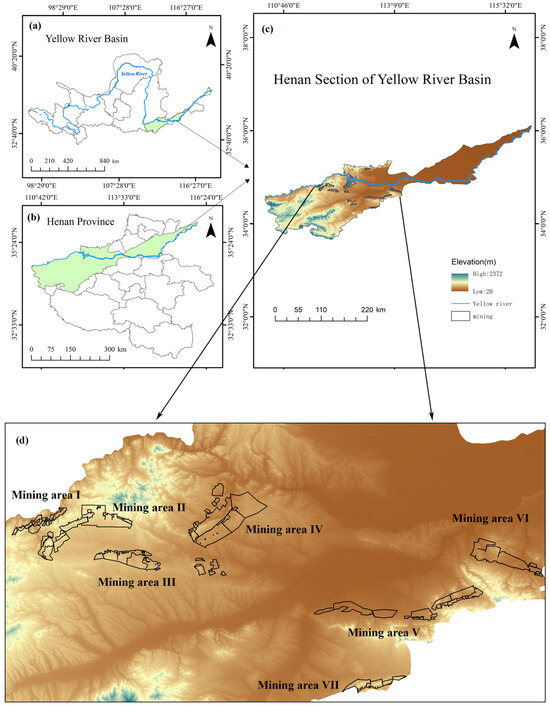
Figure 1.
Location of the Henan section of the Yellow River Basin: (a) the Yellow River Basin, (b) Henan Province, (c) topography, and (d) location of mining sites.
2.2. Data Sources and Preprocessing
The experimental data in this paper mainly consist of remote sensing images from Landsat TM/ETM+/OLI Level 2 surface reflectance (SR) provided by the United States Geological Survey (USGS). Landsat T1_L2 data for the growing season (June–September) from 1987–2023 were acquired on the GEE platform (Google Earth Engine) with an image resolution of 30 m and a temporal resolution of 16 d. Due to the failure of Landsat 7 since 2003, some of the data bands are unavailable. To mitigate the impact of these stripes, they were substituted with data from closest years. The images with a cloud cover of less than 20% were selected and preprocessed for atmospheric correction, removing the cloud effect, and then cropped to the boundary of the study area. A total of 4306 Landsat remote sensing images were acquired in the study area from 1987 to 2023. The satellite image data are presented in Figure 2a, while the number and specifications of particular Landsat images are detailed in Table 1. Figure 2b illustrates the percentage of image elements with valid observations (those free of contamination of clouds, shadows, snow, ice, etc.), indicating a higher level of contamination in pixels before 2000 and a more pronounced increase after 2013.
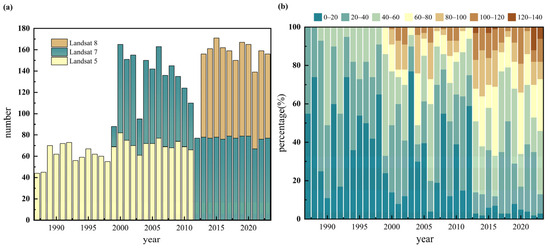
Figure 2.
Landsat data availability from 1987 to 2023 for the study area, (a) temporal distribution of Landsat images, and (b) effective observation pixels.

Table 1.
Sources of data for the study.
2.3. Research Methods
2.3.1. Kernel Normalized Difference Vegetation Index
The kNDVI is measured via kernel methods for the extraction and calculation of the NDVI through machine learning principles. It has been reported that the kNDVI is superior to the NDVI on different levels. The kNDVI effectively captures all higher-order differences between the near-infrared and red bands, showcasing its superior performance in addressing the saturation effect and mixed pixel issues [10]. The kNDVI is a nonlinear vegetation index with a more complex expression and higher precision. In order to explore the advantages of the kNDVI, we carried out a year-by-year comparison between kNDVI and NDVI values. The kNDVI is calculated using the following equation:
where is the reflectance in the near-infrared band; is the reflectance in the red light band; is the kernel function used to calculate the similarity between the two bands:
where is a length-scale parameter controlling the distance between the near-infrared and red bands, which can be tuned to capture the sensitivity of the kNDVI to vegetation density. allows for a better calculation of each pixel. This expression can hence be simplified:
2.3.2. Trend Analysis
In order to explore the trend in kNDVI time-series data, the trend of each raster cell was analyzed using the Theil–Sen median trend analysis method. Compared with linear regression trend analysis using the traditional least squares method, this method is computationally efficient, insensitive to outliers and measurement errors, can effectively overcome the effects of missing data in time series and their distribution patterns, and can effectively obviate the impact of outliers on series analysis [44,45]. The equation is as follows:
where is the time series trend of the kNDVI; and are the kNDVI values at the jth and ith moments, respectively. With > 0, there is an upward trend in the kNDVI, while negative values indicate a downward trend.
The significance of the changes in the trends was also tested using the Mann–Kendall (M-K) method, which is also known as the M-K test of significance and is used to test the significance of the slope of the data in a long time series [46]. Both the M-K test and the Sen slope estimation method do not require a normal distribution, so the results are less susceptible to outliers [47]. The statistical tests are as follows:
where is the test statistic, sgn is the sign function, refers to the length of the time series, and and are the jth and ith moments’ values, respectively. When > 10, the test statistic is close to the value of the standard normal test statistic (Z), which can be used to test the trend as shown below:
For a given significance level α, |Z| > Z (1 − α/2) rejects the lack of trend hypothesis. |Z| < Z (1 − α/2) proves the hypothesis of having a trend in the time series. In this study, α = 0.05 or 95% confidence level was defined as the significance level to determine the significance of the trend.
2.3.3. Analysis of Spatial Heterogeneity
Geographically weighted regression (GWR) was proposed by Prof. A. Stewart Fotheringham, a member of the National Academy of Sciences, in 1996 [48]. GWR is a local linear regression technique that models spatially varying relationships, yielding a regression model that delineates local relationships within distinct regions of the study area, thereby effectively elucidating local spatial relationships and the spatial heterogeneity of the variables [49,50]. This model quantifies the spatial distance point by point within a specified range by utilizing the location of each element. Subsequently, it employs this distance to derive a continuous decay function, which is then applied to compute the weight of each element’s value within the local regression equation, culminating in a final weighted regression equation:
where and are the spatial coordinates of the sampling point j; is the intercept at position j; is the local estimation coefficient of the independent variable ; is the error term, which is usually assumed to follow an normal distribution. The regression coefficients at each point in space are solved as follows:
where , are the independent and dependent variable matrices for each sample point; is the spatial weight matrix of sample point j. The spatial weight matrix of sample point j is its weight matrix:
Cross-validation (CV) is one of the common methods for solving the optimal bandwidth, mostly used in meteorology, oceanography, and other research but less used in the inversion of vegetation changes. CV is formulated as follows:
where denotes the predicted value of the model when the bandwidth is b, where ≠i denotes samples other than i. The optimal bandwidth b that minimizes is obtained by cross-validation using the predicted values.
2.3.4. Stability Analysis
Coefficient of variation (CV) can measure the relative fluctuation degree of vegetation over long time series, which can well reflect the degree of variation of spatial data in the observation series, and evaluate the stability of the time series [51]. Higher CV values signify increased disturbance and instability in inter-annual spatiotemporal vegetation changes, whereas lower values denote enhanced stability in these changes. A lower value indicates greater stability in inter-annual spatiotemporal vegetation changes [52]. CV is calculated as follows:
where denotes the kNDVI’s coefficient of variation, denotes the kNDVI value for the ith year, denotes the inter-annual average kNDVI, and n denotes the length of the time series. CV magnitude reflects the vulnerability of the ecological environment to a certain extent. Generally speaking, the ecological environment in areas with larger CV values is relatively more fragile and more prone to the impact of the outside world.
2.3.5. Hurst Index Analysis
The Hurst index is a rescaled polarity (R/S)-based analysis suitable for the detection of persistent changes in a long time series and can be used to quantitatively characterize the long-term dependence of vegetation time series data [53]. This method is able to predict the future vegetation trend based on the vegetation time series data. This study analyzes the persistence of the kNDVI trend in the study area via the Hurst index. The long time series { (τ = 1, 2, …, n) is divided into τ subsequences , t = 1, 2, …τ.
The average kNDVI time series is expressed as follows:
The cumulative deviation of the pixel-by-pixel averaged kNDVI is expressed as follows:
The range of polar deviation is expressed as follows:
The standard deviation S of the times series is obtained as follows:
The Hurst index for the kNDVI time series data is obtained as follows:
The Hurst exponent is obtained by least squares fitting as shown below:
where denotes the kNDVI in the ith year; is the relationship constant; is the Hurst index; and is the intercept moment. The Hurst index value can be divided into three categories: 0 < < 0.5 indicates a discontinued kNDVI time series. Therefore, the future kNDVI trend changes in the study area is opposite to that of the study period. H values approaching zero signify a more pronounced discontinuance. = 0.5 indicates a stochastic trend in the kNDVI time series with no obvious correlation. > 0.5 indicates a persistent NDVI time series where the future trend change is the same as the past.
3. Results
3.1. Characterization of kNDVI Spatiotemporal Changes from 1987 to 2023
3.1.1. kNDVI Advantage Analysis
In order to explore the advantages of the kNDVI over the NDVI, this study used histograms for statistical analysis. We chose to statistically analyze the kNDVI and the NDVI at five-year intervals for the period from 1987 to 2023, as shown in Figure 3.
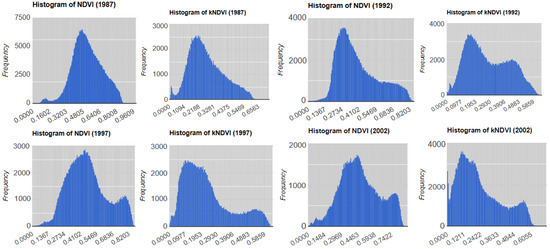
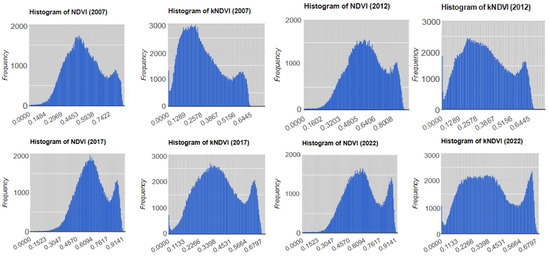
Figure 3.
kNDVI and NDVI histograms.
It was found that the distribution of NDVI values was more concentrated. Before 2010, the study area was mainly dominated by low-vegetation and medium-low-vegetation areas, as shown in Table 2. The majority of NDVI values ranged from 0.2 to 0.3, while values between 0 and 0.2 were less prevalent, comprising merely 2–7% of the total, inadequately representing medium–low-vegetation areas. After 2010, the study area was mainly dominated by medium–high-vegetation and high-vegetation areas, however. The majority of NDVI values ranged from 0.6 to 0.7, with a limited proportion of values between 0.8 and 1, constituting only 1–19%, which inadequately represented the high- and low-vegetation regions. In contrast, the distribution of kNDVI values was more uniform, effectively capturing the low- and high-vegetation areas along with the spatial variability of the study area. Because of the saturation problem, the average NDVI value in the study area shows a non-significant increasing trend in the time series, while the overall kNDVI change is more hierarchical than that of the NDVI, which can better reflect the trend in the time series. Figure 4 illustrates that the NDVI inadequately represents the distinctions between high- and low-vegetation areas, whereas the kNDVI more effectively delineates these differences.
Table 2.
NDVI classification.
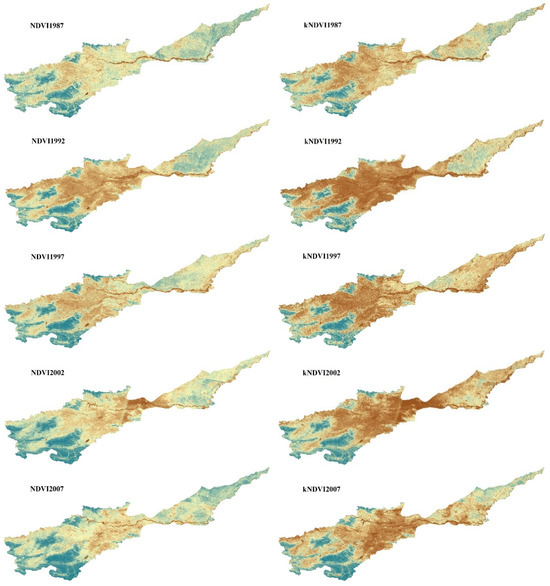
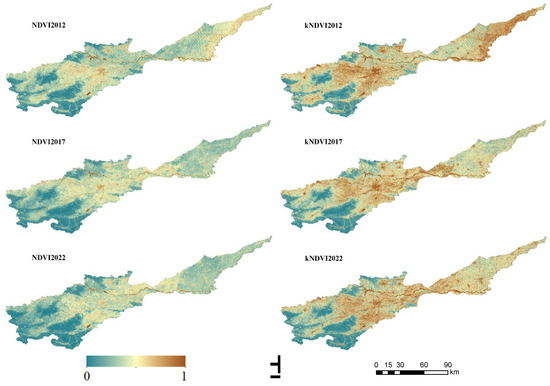
Figure 4.
Spatial distribution of changes in NDVI and kNDVI, 1987–2023.  is a compass.
is a compass.
The NDVI is saturated when the vegetation cover exceeds 80%. It is also susceptible to noise, especially over water bodies as well as near the urban construction area. The NDVI exhibits constrained processing capabilities regarding atmospheric and soil backgrounds, complicating the differentiation between areas of medium and low vegetation cover. However, the kNDVI demonstrates significant enhancement across all these dimensions. Therefore, in this study, the kNDVI was chosen for analysis.
3.1.2. Characterization of kNDVI Changes Across the Time Series
According to the interannual trend of kNDVI mean values in the study area from 1987 to 2023 (Figure 5), an upward trend can be seen during this period. Specifically, the average kNDVI value increased from 0.277 in 1987 to 0.442 in 2023, with an annual growth rate of 1.27%. The annual growth rates of the mining sites are all higher than those of the Henan section of the Yellow River Basin, which are 2.35%, 2.59%, 1.74%, 1.93%, 1.28%, 1.48%, and 1.72%, respectively. It is worth noting that the annual growth rate of the mining site II is the highest rising, from 0.133 to 0.343, while that of mining site V rose 1.28%, from 0.227 to 0.364. In general, the kNDVI change trend in the mining area is basically the same as that of the Henan section of the Yellow River Basin, exhibiting a variable growth trend prior to 2005, followed by an accelerated growth rate characterized by oscillations after 2005. Prior to 2005, the growth trend exhibited variability; subsequent to 2005, the growth rate accelerated, while fluctuations diminished. The kNDVI in the Henan section of the Yellow River Basin varies from 0.227 to 0.442, with an annual average value of 0.302, reaching its maximum value in 2023. As shown in Figure 5, the year-by-year kNDVI in the mining area is always lower than that in the Henan section of the Yellow River Basin. Collectively, these findings suggest that the vegetation and growth conditions in the mining area have been persistently inferior compared to those in the non-mining area, demonstrating that the vegetation in these regions is more adversely impacted by coal mining disturbances. In 1990, 2001, 2014, 2019, and 2021, the kNDVI in the Henan section of the Yellow River Basin showed an increasing trend, while it showed a decreasing trend in some mining areas. Mining areas II and III had decreasing kNDVI values in 1990. Mining areas I, II, III, and IV had lower kNDVI values in 2001. Mining areas III, IV, and VII had lower kNDVI values in 2014. The kNDVI values of mining area V and VI decreased in 2019 and 2021. The mining areas I–IV experienced frequent early mining activities, with kNDVI variations correlating to these operations. In contrast, mining areas V–VII only recently commenced mining, and their kNDVI changes are similarly aligned with these activities. Therefore, the poor vegetation condition of the mining areas is closely related to their dominant mining activities.
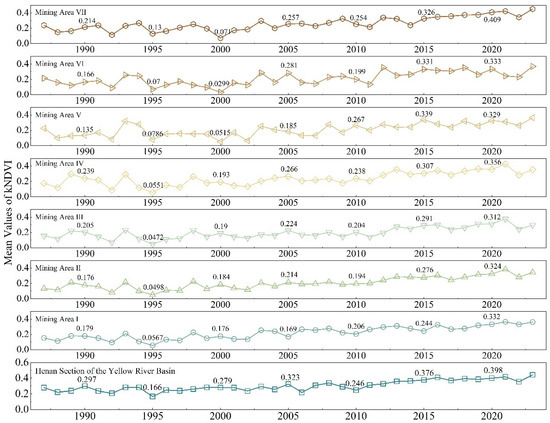
Figure 5.
Changes in the mean annual kNDVI value in the Henan section of the Yellow River Basin and the mining sites from 1987 to 2023.
3.2. Analysis of the Spatiotemporal Trends of Vegetation Growth in the Henan Section of the Yellow River Basin
In this paper, a combination of the Theil–Sen median trend method and the Mann–Kendall (M-K) test is used to investigate the spatial distribution characteristics of the kNDVI trend in the Henan section of the Yellow River Basin and its mining areas from 1987 to 2023. The kNDVI trends were classified as improving, degrading, and stabilizing. Those with slope values between −0.0005 and 0.0005 were classified as stabilizing, those with values greater than or equal to 0.0005 were classified as improving areas, and those with values less than −0.0005 were classified as degrading areas. The significance test results of the Mann–Kendall test at the 0.05 confidence level were categorized into two grades, in which Z > 1.96 or Z < −1.96 were categorized as significant change, and −1.96 ≤ Z ≤ 1.96 was categorized as non-significant change. Upon overlaying the significance test results onto the slope, the kNDVI change trend could be classified into five categories, as shown in Table 3.
Table 3.
kNDVI trend classification criteria.
As can be seen in Figure 6, the trend of vegetation change in the study area shows an overall improvement, especially in the western region, where the distribution of significantly improved areas is more concentrated. There is no mining activity in the eastern part of the region, and therefore, there is less vegetation degradation, and the recovery and growth of vegetation is excellent in this section. Slightly improved areas are mainly located in the central and western regions, with some of the slightly improved areas overlapping with mining areas II and III. The mining activities in these areas were finalized prior to the study period, exhibiting minimal impact from mining activities, which resulted in a less pronounced degradation of vegetation and a greater occurrence of slight improvements. The areas with stabilized vegetation are fewer and more dispersed. The majority of the degraded regions are situated within the concentrated zones of the mines and construction sites, with certain degradation indicators coinciding with the boundaries of mining areas I, V, and VII. This indicates that the mining activities of the four mines caused vegetation degradation, thus affecting the ecological environment of the area. Mining site I has the highest percentage of degradation, by 13.35 percent, indicating a serious environmental degradation. It may have experienced excessive exploitation of mineral resources or insufficient protective measures.
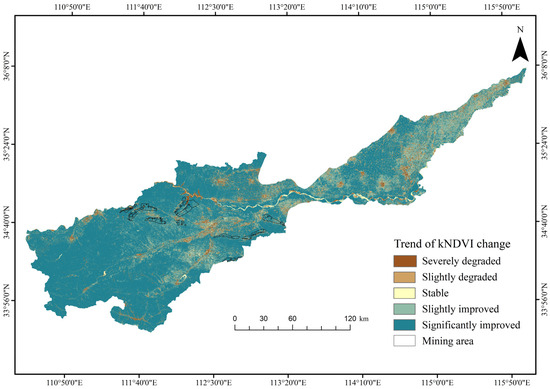
Figure 6.
Interannual kNDVI Trend in the Henan section of the Yellow River Basin from 1987 to 2023.
In the Henan section of the Yellow River Basin, the proportions of areas with significantly improved, slightly improved, relatively stable, slightly decreased, and severely decreased kNDVI change trends were 73.78%, 14.58%, 3.59%, 3.77%, and 4.28%, respectively. An analysis of Figure 6 and Table 4 reveals that the kNDVI characteristics in the mining area mirror those of the entire study area, with both exhibiting predominant trends of improvement, attributable to the vegetation restoration initiatives and ecological protection policies implemented in the region. According to Table 4 and Figure 7, during the 37 years from 1987 to 2023, the kNDVI of the study area was significant improved by as much as 70%. The findings indicate a substantial increase in vegetation cover in the mining areas across various domains of the Henan section of the Yellow River Basin, all exhibiting a notable improvement trend.
Table 4.
Results of statistical analysis of kNDVI trend.
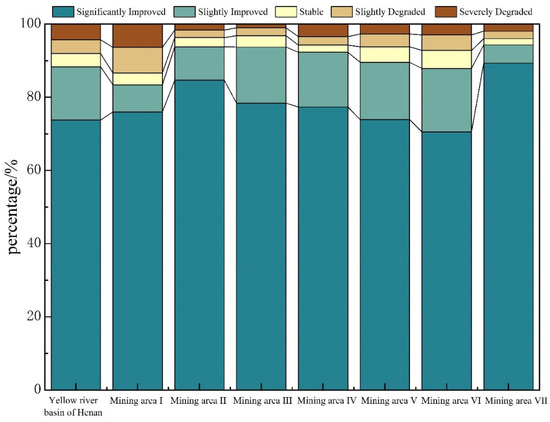
Figure 7.
kNDVI Trend in the Henan section of the Yellow River Basin and the mining sites.
3.3. Spatial Heterogeneity of Vegetation Growth Based on Geographically Weighted Regression
In this study, the slope of the interannual kNDVI changes was used to characterize the vegetation alterations. The minimal distance of vegetation changes from the mining sites indicated the capacity of mine development to impact vegetation. A geographically weighted regression model was employed to examine the effect of this distance on vegetation change. The magnitude of the regression coefficient indicates the strength of the effect, while its sign denotes the direction of the effect on the dependent variable. The positive correlation coefficient signifies that as the distance from the mining area increases, the regional kNDVI exhibits an improvement trend. In other words, the vegetation is in superior condition at a considerable distance from the mining area. The negative correlation coefficient signifies that as the distance from the mining area increases, the degradation of vegetation intensifies.
Figure 8 shows the correlation between the kNDVI trend in the Henan section of the Yellow River Basin and the distance from the mining sites. The correlation in this area is mainly positive, with a mean value of 0.04. The region exhibiting negative correlation coefficients constituted 9.1% of the total and was predominantly situated in the southwestern section of the study area. The vegetation trend in the area exhibited a decline with increasing distance from the mining site, indicating that the degradation of vegetation was correlated with the distance from the mining area. This suggests that the correlation between the vegetation degradation in this region and the proximity to the mine is minimal. The areas with correlation coefficients greater than 0 are more scattered. These areas can be categorized into three grades accounting for 60.8%, 25.9%, and 4.1% of the area, respectively. There are areas with both negative and positive correlations around the mining area V, with correlation coefficients ranging from −0.01 to 0.05. Vegetation in this area is less affected by the distance from the mining site. The correlation coefficients around the mining areas I, II, III, and VII range from 0 to 0.05, indicating more vegetation disturbance around these sites. The correlation coefficients around the mining site VI range from 0.05 to 0.12, indicating a more serious degradation around this site. The correlation coefficient around the mining site IV is the largest, ranging from 0.12 to 0.26. This mining site therefore has the most significant impact on the vegetation. The vegetation condition in the Henan section of the Yellow River Basin shows a significant positive correlation with the proximity to the mining site. Almost all correlation coefficients around the mining sites are positive, suggesting that the mining activities have had a significant impact on the surrounding vegetation.
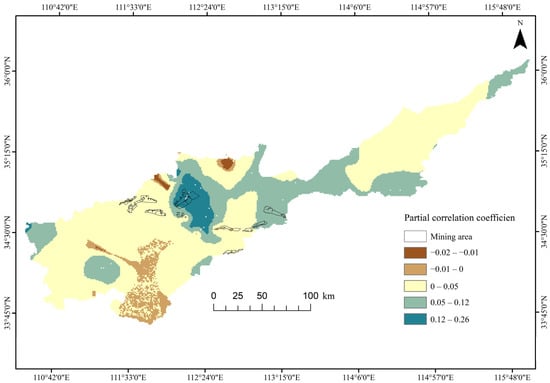
Figure 8.
Spatial correlation between the distance from the mining site and vegetation change trends.
3.4. Analysis of Vegetation Growth Volatility in the Henan Section of the Yellow River Basin
Based on the obtained results, CV values can be categorized into five classes: low fluctuation variation (CV ≤ 0.15), lower fluctuation variation (0.15 < CV ≤ 0.30), medium fluctuation variation (0.3 < CV ≤ 0.45), higher fluctuation variation (0.45 < CV ≤ 0.60), and high fluctuation variation (0.60 < CV). Figure 9 shows the spatial distribution of the coefficient of variation in the Henan section of the Yellow River Basin. From 1987 to 2023, the kNDVI value changes in the Henan section of the Yellow River Basin show a medium–high fluctuation accounting for 75.4% of the total area. The proportion of areas with medium fluctuation is 32.2%, with high fluctuation 29.6%, with very high fluctuation 13.6%, with low fluctuation change 10.8%, and with very low fluctuation 13.8%. The proportion of the low-fluctuation area is 10.8%, and the proportion of the lower-fluctuation change area is 13.8%. The medium–high-fluctuation area is located in the central and eastern part of the study area, which mainly includes the mining site, the built-up area, and the vicinity of the Yellow River. The kNDVI values show high fluctuations in the mining area, with the proportion of the high fluctuation change being 73.5%. The proportions for the medium-fluctuation area was 24.8%, and it was 1.7% for the low-fluctuation area, indicating obvious vegetation changes in the mining site. Mining activities have had a greater impact on vegetation changes. The area with low fluctuation is mainly located in the western part of the study area, where the vegetation is relatively denser, and fewer restoration measures are carried out. Consequently, the variability in vegetation change is minimal, suggesting that the ecological environment in this region is well preserved and stable, with natural factors exerting a greater influence than anthropogenic disturbances. The results show that the kNDVI value is mainly characterized by high fluctuations in the Henan section of the Yellow River Basin, and the areal proportion of the high-fluctuation category is more significant in the mining areas.
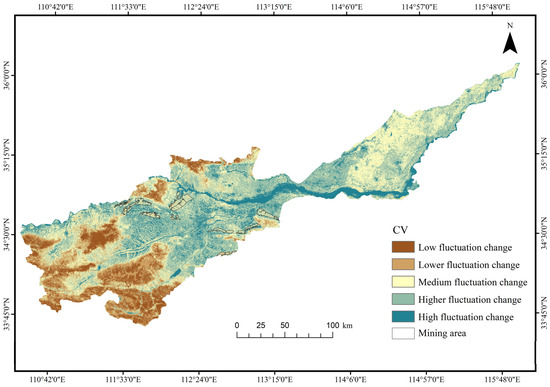
Figure 9.
Changes in kNDVI fluctuations in the Henan section of the Yellow River Basin.
3.5. Sustainability Analysis of Vegetation Growth in the Henan Section of the Yellow River Basin
In order to understand whether there is a persistent growth or decline trend in vegetation changes and to identify the strength of this trend, this study calculated the Hurst index of the kNDVI in the Henan section of the Yellow River Basin. The spatial distribution of the Hurst index is shown in Figure 10. The areas with a Hurst index of less than 0.5 accounted for 95% of the total, while the proportion of the areas with a Hurst index of greater than 0.5 was only 5%. This result shows that the region is widely characterized by a nonpersistent trend, i.e., the vegetation state is frequently disturbed, showing strong short-term fluctuations and instabilities. There are relatively few regions where the kNDVI change trend exhibits homogeneous characteristics in the future, indicating that human activities significantly impact kNDVI variations. Spatially, the regions with strong inverse persistence are mostly located in the central and eastern parts. Most of these regions are mining and construction sites, which are also the most vulnerable to the disturbance of human activities such as mining, suggesting that the kNDVI change trend in this region may contrast with historical patterns. Weakly nonpersistent and persistent zones are mostly distributed in the western part, which is far away from towns and cities and has only a few villages. This part is characterized with low population density, relatively few human activities, and low vegetation disturbance, indicating that the kNDVI change trends in this region exhibit a strong correlation with historical patterns.
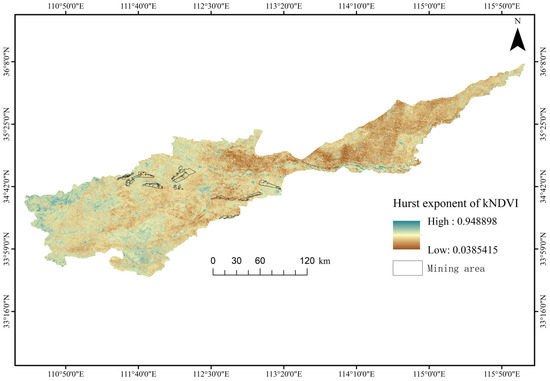
Figure 10.
Hurst index and spatial distribution in the Henan section of the Yellow River Basin.
In order to obtain the vegetation change trend and its persistence, the kNDVI change trend was superimposed on the results of the Hurst index using ArcGIS 10.7 superposition analysis (shown in Figure 11). To further reveal the future kNDVI change trend in the study area, the superimposed coupling results were divided into four classes, namely continuous decrease, continuous increase, current decrease and future increase, and current increase and future decrease. The continuous reduction in the kNDVI value in the study area implies a continuous and obvious downward trajectory. At the same time, the continuous increase in the kNDVI value indicates that the vegetation is in a continuous and stable upward trajectory. The current decrease and upcoming increase in the kNDVI value indicate that the vegetation condition is currently degrading but will improve in the future. The current improvement and upcoming kNDVI reduction indicates a positive vegetation condition that will tend to degradation in the future. The percentages of these four types were categorized as shown in Table 5. Some 0.90% and 3.00% of the area were continuously improving and degrading, respectively. Around 9.04% of the area was changed from degradation to improvement. The highest value was obtained for the past improvement and future degradation, accounting for 87.06% of the total. This result indicates that although the kNDVI value in many areas showed an improving trend in the past 37 years, if the study area continues to maintain the current mining intensity and anthropogenic disturbances, the vegetation may shift from an improving trend to a degrading trend in the future. As can be seen from Figure 12, the Hurst index characteristics of the kNDVI in the mining site are similar to those of the entire Henan section of the Yellow River Basin, mainly showing a shift from an improving trend to a degrading trend in the past. The ratio of areas exhibiting an improving trend in the past to those demonstrating a degrading trend in the mining area is more substantial. This transformation may be closely related to multiple factors, such as mining intensity, human interference, and climate change. Therefore, it is especially important to take effective management measures and execute timely restoration strategies to prevent further vegetation degradation in the future.
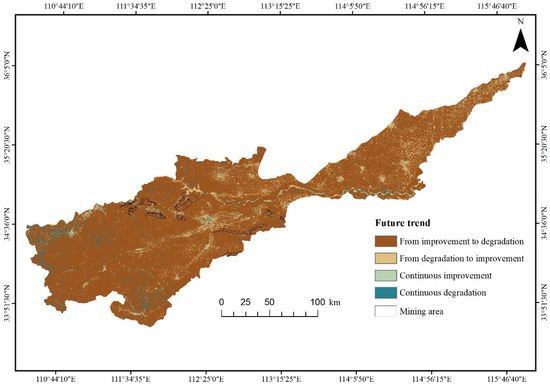
Figure 11.
Spatial distribution of areas with different kNDVI changes of in the Henan section of the Yellow River Basin.
Table 5.
Results of statistical analysis of kNDVI future development trends.
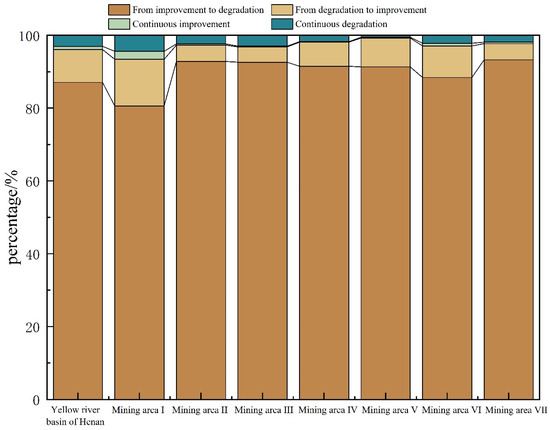
Figure 12.
kNDVI future development trend in the Henan section of the Yellow River Basin and the mining sites.
4. Discussion
In this study, the kNDVI data of the Henan section of the Yellow River Basin were analyzed using various methods such as trend analysis, geographically weighted regression, and the Hurst index. Through the analysis, the study identified the characteristics of the kNDVI trend and the influence of mining activities on the vegetation in the area from 1987 to 2023. Although the NDVI is a widely used vegetation index, its application is limited by the saturation problem in areas with high vegetation cover [18,54]. The NDVI is easily saturated in areas with high vegetation cover, mainly given the fact that the red light band easily becomes saturated. The NDVI is also affected by both soil background and atmospheric noise [16]. The results obtained in Section 3.1.1. of this paper show the superiority of the kNDVI. Although there have been scientists who have mentioned the superiority of the kNDVI over vegetation indices in their studies, there are no specific values to support this conclusion [55,56]. In this paper, a histogram was used to crystallize the superiority of the kNDVI and to further quantify the difference between the kNDVI and other vegetation indices in characterizing vegetation condition. In the analysis of spatial and temporal changes in vegetation, most of the existing studies focus on vegetation changes in a certain region over a long time period [53,57,58]. However, the lack of in-depth exploration of the factors leading to changes in vegetation is the main shortcoming of such studies. Existing studies on the spatial and temporal evolution of vegetation in mining areas mostly focus on vegetation response to climate change [29,59,60], but they fail to fully remove the impact of mining activities. The Yellow River Basin is an important economic zone and an important ecological barrier in China. The large-scale and high-intensity mining activities in the Henan section of the Yellow River Basin have triggered a series of ecological and environmental problems, such as the reduction in the ecological services and the aggravation of soil erosion. These have affected and constrained ecological protection and high-quality development in the area [61,62]. It is of great scientific significance to quantitatively characterize the vegetation characteristics in the complex environment of the mining area, to clarify the growth status of the vegetation in the mining area of the Yellow River Basin, and to reveal its spatial and temporal evolution patterns in order to promote the ecological protection and sustainable development of the mining area.
The spatial and temporal vegetation trends in the study area were revealed by applying the Sen+Mann–Kendall trend analysis. The kNDVI in the Henan section of the Yellow River Basin showed an increasing trend, which was consistent with the results of [63,64]. The kNDVI trend in the mining area was basically the same as the overall trend of the Henan section of the Yellow River Basin. The kNDVI in the mining area and the Henan section of the Yellow River Basin showed an increasing trend. This is mainly due to the implementation of a series of environmental protection and ecological restoration projects in the region, the promotion of large-scale afforestation and grassland restoration projects, and the gradual land reclamation and ecological restoration of the mine area, which led to an improvement in the vegetation cover around the mining sites [65,66]. The areas with large fluctuations in vegetation cover in the Henan section of the Yellow River Basin are mainly located in the central and eastern parts of the study area, which is consistent with the results of studies analyzing the stability of vegetation change in the Henan section of the Yellow River Basin [67].
Secondly, this study was conducted to analyze the correlation between the kNDVI trend and the distance from the mining area using geographically weighted regression model. The main objective was to explore the impact of mining activities on vegetation growth trend in the study area. The stability and sensitivity of geographically weighted regression method have been studied in related articles [68]. We visualized the effect of distance from the mining sites on vegetation growth in the region. These findings also verified the reason why the kNDVI within the mining area was lower than that in the non-mining area. Most of the existing studies have investigated the vegetation change trend in the Henan section of the Yellow River Basin or the influence of mining activities on vegetation conditions in the mining areas [6,8]. Yet, these studies lack quantitative analysis of the influence of the distance from the mining area on the vegetation condition.
In addition, the superposition of trend analysis with the Hurst index results provide a more comprehensive understanding and prediction of time-series data [69,70]. In this paper, the sustainability of vegetation changes was revealed by superimposing the kNDVI trends with the Hurst index. The findings indicated that the trend of vegetation change in the study area exhibits a degree of anti-persistence trend, further illustrating the ecosystem’s heightened sensitivity to environmental alterations and its inherent vulnerability. It also emphasizes the importance of long-term monitoring of vegetation changes in order to adjust management strategies in a timely manner to enhance the stability and resilience of the ecosystem. However, the Hurst index does not predict how long the identified vegetation trends will continue in the future. It only determines whether the vegetation change trends are persistent or not.
However, there are some limitations and shortcomings in this study. First, this paper only studied the mining areas in the Henan section of the Yellow River Basin; there are still many mining areas in the entire Yellow River Basin that have not been considered, and the impact caused by the mining areas in the Yellow River Basin may vary across space. Lack of research on mining areas in other regions may limit the generalizability and replicability of our findings. Moreover, there is also a lack of analysis on the effects of climatic factors on vegetation and the joint effect of human activities and climatic factors in the study area, which requires further analysis. A more detailed work is needed to analyze the vegetation changes in multiple vegetation communities and to explore the main driving factors of vegetation changes. In this study, only remotely sensed data were used to study the spatial and temporal changes of vegetation. The study could benefit from additional data collected from field surveys in the study area to provide a more complete picture.
5. Conclusions
In this study, the kernel normalized difference vegetation index (kNDVI) was calculated using Landsat data on the GEE platform. The spatial and temporal characteristics of vegetation in the Henan section of the Yellow River Basin and its mining areas were assessed using kNDVI values from 1987 to 2023. The vegetation response to climatic factors and the drivers behind vegetation changes were investigated using temperature and precipitation time series. The main conclusions are as follows:
- (1)
- When the vegetation cover is less than 20% or more than 80%, the kNDVI can better explain the vegetation cover condition than the NDVI. The kNDVI is more sensitive in areas with denser vegetation, which can better overcome the noise effect and saturation problem caused by atmosphere or soil reflectance;
- (2)
- The trend of kNDVI values in the mining area is basically consistent with the overall trend of the Henan section of the Yellow River Basin; i.e., the overall trend is upward, but both are dominated by medium–high fluctuations. The mining area consistently has a lower kNDVI value than the Henan section of the Yellow River Basin, and the disturbance caused by mining has a negative impact on vegetation growth;
- (3)
- The vegetation cover condition of the Henan section of the Yellow River Basin has improved significantly in general. The mining area’s kNDVI change mirrored that of the entire study area, with 73.78% of the area showing a significant increase. However, vegetation changes were also affected by the mining disturbance. The Hurst index showed that the abovementioned pattern was nonpersistent. Some 87% of the area showed a significant kNDVI improvement, while 87% showed no persistence. The trend of substantial enhancement in the kNDVI may deteriorate in the future;
- (4)
- The vegetation condition in the Henan section of the Yellow River Basin showed a significant positive correlation with the distance from the mining sites; i.e., the vegetation cover and health condition generally improved with the increase in distance from the mining sites. Therefore, mining activities have an important impact on the surrounding vegetation cover.
Author Contributions
Conceptualization, Z.C. and X.L.; methodology, X.L.; software, H.F.; validation, C.H. and X.L.; formal analysis, Z.C. and X.L.; investigation, X.L.; resources, Z.C.; data curation, X.L. and H.F.; writing—original draft preparation, Z.C.; writing—review and editing, X.L.; visualization, X.L.; supervision, H.W.; project administration, C.H.; funding acquisition, C.H. All authors have read and agreed to the published version of the manuscript.
Funding
This research was supported by the State Key Project of the National Natural Science Foundation of China-Key projects of joint fund for regional innovation and development (grant number U22A20566 and U22A20620), the Doctoral Science Foundation of Henan Polytechnic University (grant number B2021-20), the Surveying and mapping Science and Technology “double first-class” project (grant number BZCG202301), and the Key Scientific Research Projects of Colleges and Universities in Henan Province (grant number 23A610002).
Data Availability Statement
The original data presented in the study are openly available in United States Geological Survey at https://www.usgs.gov/ (accessed on 6 March 2024) or LANDSAT/LT05/C02/T1_L2, LANDSAT/LE07/C02/T1_L2, LANDSAT/LC08/C02/T1_L2.
Conflicts of Interest
The authors declare no conflicts of interest.
References
- Song, W.; Feng, Y.; Wang, Z. Ecological restoration programs dominate vegetation greening in, C.h.ina. Sci. Total Environ. 2022, 848, 157729. [Google Scholar] [CrossRef]
- Liu, X.; Yin, Q.; Xin, J.; Liu, W.; Xu, X.; Huang, Z.; An, R. Technology Research Progress and Prospects of Natural Vegetation Restoration and Its Artificial Promotion. Ecol. Environ. 2022, 31, 1476. [Google Scholar] [CrossRef]
- Chen, L.; Zhang, H.; Zhang, X.; Liu, P.; Zhang, W.; Ma, X. Vegetation changes in coal mining areas: Naturally or anthropogenically Driven? Catena 2022, 208, 105712. [Google Scholar] [CrossRef]
- Liu, Y.; Lei, S.; Li, X.; Lei, X.; Wang, C.; Gong, C. Ecological mechanisms underlying aridity thresholds in arid mining areas for vegetation guided restoration. J. China Coal Soc. 2023, 48, 2550–2563. [Google Scholar] [CrossRef]
- Wei, H.; Wang, Y.; Liu, J.; Zhang, J.; Cao, Y. Coordinated development of cultivated land use and ecological protection in cities along the main stream of the Yellow River in Henan Province, China. Ecol. Indic. 2023, 156, 111143. [Google Scholar] [CrossRef]
- Suping, P.; Yinli, B.I. Strategic consideration and core technology about environmental ecological restoration in coal mine areas in the Yellow River basin of China. J. China Coal Soc. 2020, 45. [Google Scholar] [CrossRef]
- Cheng, Y.; Li, C.; He, S.; Li, L.; Dong, L.; Wang, X. Coordinated Development Path of Cultivated Land Utilization in Henan Section of the Yellow River Basin. Land 2023, 12, 1342. [Google Scholar] [CrossRef]
- Zhang, S.; Wang, X. Spatial-temporal variation and driving factors of eco-environmental quality in Henan section of the Yellow River Basin. In Proceedings of the 2022 29th International Conference on Geoinformatics, Beijing, China, 15–18 August 2022; pp. 1–7. [Google Scholar] [CrossRef]
- Liu, T.; Zhou, J.; Li, S.; Wang, Y. Construction and Optimization of Ecological Security Pattern of the Henan Section in the Yellow River Basin. Acad. J. Environ. Earth Sci. 2023, 5, 49–60. [Google Scholar] [CrossRef]
- Camps-Valls, G.; Campos-Taberner, M.; Moreno-Martínez, Á.; Walther, S.; Duveiller, G.; Cescatti, A.; Mahecha, M.; Muñoz-Marí, J.; García-Haro, F.; Guanter, L.; et al. A unified vegetation index for quantifying the terrestrial biosphere. Sci. Adv. 2021, 7, eabc7447. [Google Scholar] [CrossRef]
- Zhou, J.; Li, P.; Zhang, H. Research status and prospect of ecological restoration technology for coal mines in the Yellow River basin. China Min. Mag. 2021, 30, 8–14. [Google Scholar] [CrossRef]
- Lin, M.; Hou, L.; Qi, Z.; Wan, L. Impacts of climate change and human activities on vegetation NDVI in China’s Mu Us Sandy Land during 2000–2019. Ecol. Indic. 2022, 142, 109164. [Google Scholar] [CrossRef]
- Wang, X.; Shi, S.; Chen, J. Change and driving factors of vegetation coverage in the Yellow River Basin. China Environ. Sci. 2022, 42, 5358–5368. [Google Scholar] [CrossRef]
- Xu, Z.; Li, Y.; Li, B.; Hao, Z.; Lin, L.; Hu, X.; Zhou, X.; Yu, H.; Xiang, S.; Pascal, M.; et al. A comparative study on the applicability and effectiveness of NSVI and NDVI for estimating fractional vegetation cover based on multi-source remote sensing image. Geocarto Int. 2023, 38, 2184501. [Google Scholar] [CrossRef]
- Wei, Y.; Sun, S.; Liang, D.; Jia, Z. Spatial–temporal variations of NDVI and its response to climate in China from 2001 to 2020. Int. J. Digit. Earth 2022, 15, 1463–1484. [Google Scholar] [CrossRef]
- Bai, Y.; Gao, J.; Zhang, B. Monitoring of crops growth based on NDVI and EVI. Trans. Chin. Soc. Agric. Mach 2019, 50, 153–161. [Google Scholar] [CrossRef]
- Mu, Y.; Cao, X.; Feng, Y.; Cao, X.; Gao, X. Comparison of Topographic Correction on Commonly Used Vegetation Indices in Rugged Terrain Area. J. Earth Inf. Sci. 2016, 18, 951–961. [Google Scholar]
- Huang, S.; Tang, L.; Hupy, J.P.; Wang, Y.; Shao, G. A commentary review on the use of normalized difference vegetation index (NDVI) in the era of popular remote sensing. J. For. Res. 2021, 32, 1–6. [Google Scholar] [CrossRef]
- Zhengxing, W.; Chuang, L.; Alfredo, H. From AVHRR-NDVI to MODIS-EVI: Advances in vegetation index research. Acta Ecol. Sin. 2003, 23, 979–987. [Google Scholar]
- Wang, Q.; Moreno-Martínez, Á.; Muñoz-Marí, J.; Campos-Taberner, M.; Camps-Valls, G. Estimation of vegetation traits with kernel NDVI. ISPRS J. Photogramm. Remote Sens. 2023, 195, 408–417. [Google Scholar] [CrossRef]
- Zhang, J.; Xiao, J.; Tong, X.; Zhang, J.; Meng, P.; Li, J.; Liu, P.; Yu, P. NIRv and SIF better estimate phenology than NDVI and EVI: Effects of spring and autumn phenology on ecosystem production of planted forests. Agric. For. Meteorol. 2022, 315, 108819. [Google Scholar] [CrossRef]
- Chen, R.; Yin, G.; Zhao, W.; Xu, B.; Zeng, Y.; Liu, G.; Verger, A. TCNIRv: Topographically corrected near-infrared reflectance of vegetation for tracking gross primary production over mountainous areas. IEEE Trans. Geosci. Remote Sens. 2022, 60, 1–10. [Google Scholar] [CrossRef]
- Tang, D.; Fan, H.; Zhang, Y. Review on Landsat Time Series Change Detection Methods. J. Geo-Inf. Sci. 2017, 19, 1069–1079. [Google Scholar] [CrossRef]
- Zhao, C.; Pan, Y.; Wu, H.; Ren, S.; Ma, G.; Gao, Y.; Zhu, Y.; Jing, G. A Novel Spectral Index for Vegetation Destruction Event Detection Based on Multispectral Remote Sensing Imagery. IEEE J. Sel. Top. Appl. Earth Obs. Remote Sens. 2024, 17, 11290–11309. [Google Scholar] [CrossRef]
- Bonney, M.T.; He, Y.; Myint, S.W. Contextualizing the 2019–2020 Kangaroo Island bushfires: Quantifying landscape-level influences on past severity and recovery with Landsat and Google earth engine. Remote Sens. 2020, 12, 3942. [Google Scholar] [CrossRef]
- Wang, Z.; Wang, B.; Zhang, Q.; Sa, R. Spatial and Temporal characteristics and Driving Force Analysis of Vegetation Cover Change in Greater Khingan Mountains Ecological Functional Area based on KNDVI. Environ. Sci. 2024, 45, 1–19. [Google Scholar] [CrossRef]
- Gu, Z.; Chen, X.; Ruan, W.; Zheng, M.; Gen, K.; Li, X.; Deng, H.; Chen, Y.; Liu, M. Quantifying the direct and indirect effects of terrain, climate and human activity on the spatial pattern of kNDVI-based vegetation growth: A case study from the Minjiang River Basin, Southeast China. Ecol. Inform. 2024, 80, 102493. [Google Scholar] [CrossRef]
- Guo, B.; Zhang, R.; Lu, M.; Xu, M.; Liu, P.; Wang, L. A New Large-Scale Monitoring Index of Desertification Based on Kernel Normalized Difference Vegetation Index and Feature Space Model. Remote Sens. 2024, 16, 1771. [Google Scholar] [CrossRef]
- Feng, X.; Tian, J.; Wang, Y.; Wu, J.; Liu, J.; Ya, Q.; Li, Z. Spatio-temporal variation and climatic driving factors of vegetation coverage in the Yellow River Basin from 2001 to 2020 based on kNDVI. Forests 2023, 14, 620. [Google Scholar] [CrossRef]
- Yu, H.; Yang, Q.; Jiang, S.; Zhan, B.; Zhan, C. Detection and Attribution of Vegetation Dynamics in the Yellow River Basin Based on Long-Term Kernel NDVI Data. Remote Sens. 2024, 16, 1280. [Google Scholar] [CrossRef]
- Kang, L.; Di, L.; Deng, M.; Shao, Y.; Yu, G.; Shrestha, R. Use of geographically weighted regression model for exploring spatial patterns and local factors behind NDVI-precipitation correlation. IEEE J. Sel. Top. Appl. Earth Obs. Remote Sens. 2014, 7, 4530–4538. [Google Scholar] [CrossRef]
- Li, J.; Yan, Q.; Hu, M. Spatial-Temporal Evolution of Vegetation and Dominant Factors in “Energy Golden Triangle” Region Based on Geographically Weighted Regression Model. J. Ecol. Rural Environ. 2018, 34, 700–708. [Google Scholar] [CrossRef]
- Wang, H.; Xu, Y.; Liu, C.; Hang, A.; Lu, L.; Zheng, W. Response of habitat quality to land use change based on geographical weighted regression. Beijing Da Xue Xue Bao 2019, 55, 509–518. [Google Scholar] [CrossRef]
- Foody, G.M. Geographical weighting as a further refinement to regression modelling: An example focused on the NDVI–rainfall relationship. Remote Sens. Environ. 2003, 88, 283–293. [Google Scholar] [CrossRef]
- Kupfer, J.A.; Farris, C.A. Incorporating spatial non-stationarity of regression coefficients into predictive vegetation models. Landsc. Ecol. 2007, 22, 837–852. [Google Scholar] [CrossRef]
- Long, Y.; Jiang, F.; Sun, H.; Wang, T.; Zou, Q.; Chen, C.S. Estimating vegetation carbon storage based on optimal bandwidth selected from geographically weighted regression model in Shenzhen City. Acta Ecol. Sin. 2022, 42, 4933–4945. [Google Scholar] [CrossRef]
- Chai, H.; Guan, P.; Hu, J.; Geng, S.; Ding, Y.; Xu, H.; Zhao, Y.; Xu, M. Temporal and Spatial Variations in the Normalized Difference Vegetation Index in Shanxi Section of the Yellow River Basin and Coal Mines and Their Response to Climatic Factors. Appl. Sci. 2023, 13, 12596. [Google Scholar] [CrossRef]
- Qu, S.; Wang, L.; Lin, A.; Yu, D.; Yuan, M. Distinguishing the impacts of climate change and anthropogenic factors on vegetation dynamics in the Yangtze River Basin, China. Ecol. Indic. 2020, 108, 105724. [Google Scholar] [CrossRef]
- Raubitzek, S.; Corpaci, L.; Hofer, R.; Mallinger, K. Scaling Exponents of Time Series Data: A Machine Learning Approach. Entropy 2023, 25, 1671. [Google Scholar] [CrossRef]
- Tran, T.V.; Tran, D.X.; Nguyen, H.; Latorre-Carmona, P.; Myint, S.W. Characterising spatiotemporal vegetation variations using LANDSAT time-series and Hurst exponent index in the Mekong River Delta. Land Degrad. Dev. 2021, 32, 3507–3523. [Google Scholar] [CrossRef]
- Chen, J.; Yan, F.; Lu, Q. Spatiotemporal variation of vegetation on the Qinghai–Tibet Plateau and the influence of climatic factors and human activities on vegetation trend (2000–2019). Remote Sens. 2020, 12, 3150. [Google Scholar] [CrossRef]
- Ahmad, A.; Zhang, J.; Bashir, B.; Mahmood, K.; Mumtaz, F. Exploring vegetation trends and restoration possibilities in Pakistan by using Hurst exponent. Environ. Sci. Pollut. Res. 2023, 30, 91915–91928. [Google Scholar] [CrossRef] [PubMed]
- Niu, H.; Zhao, X.; Xiao, D.; Liu, M.; An, R.; Fan, L. Evolution and Influencing Factors of Landscape Pattern in the Yellow River Basin (Henan Section) Due to Land Use Changes. Water 2022, 14, 3872. [Google Scholar] [CrossRef]
- Mu, S.; Tong, S.; Batunacun; Ah, R.; Mei, L.; Bao, G.; Huang, X.; Bao, Y. Identifying the drivers of vegetation changes in Inner Mongolia based on residual analysis and Hasse diagram technique. Ecosphere 2024, 15, e4769. [Google Scholar] [CrossRef]
- Zhang, Y.; Zhang, L.; Wang, J.; Dong, G.; Wei, Y. Quantitative analysis of NDVI driving factors based on the geographical detector model in the Chengdu-Chongqing region, China. Ecol. Indic. 2023, 155, 110978. [Google Scholar] [CrossRef]
- Kamal, N.; Pachauri, S. Mann-kendall, and sen’s slope estimators for precipitation trend analysis in north-eastern states of India. Int. Jour. Comput. Appl 2019, 177, 7–16. [Google Scholar] [CrossRef]
- Meng, X.; Gao, X.; Li, S.; Lei, J. Spatial and temporal characteristics of vegetation NDVI changes and the driving forces in Mongolia during 1982–2015. Remote Sens. 2020, 12, 603. [Google Scholar] [CrossRef]
- Fotheringham, A.S.; Brunsdon, C. Local forms of spatial analysis. Geogr. Anal. 1999, 31, 340–358. [Google Scholar] [CrossRef]
- Oshan, T.M.; Li, Z.; Kang, W.; Wolf, L.J.; Fotheringham, A.S. mgwr: A Python Implementation of Multiscale Geographically Weighted Regression for Investigating Process Spatial Heterogeneity and Scale. ISPRS Int. J. Geo-Inf. 2019, 8, 269. [Google Scholar] [CrossRef]
- Windle, M.J.S.; Rose, G.A.; Devillers, R.; Fortin, M.J. Exploring spatial non-stationarity of fisheries survey data using geographically weighted regression (GWR): An example from the Northwest Atlantic. ICES J. Mar. Sci. 2010, 67, 145–154. [Google Scholar] [CrossRef]
- Yan, Y.; Liu, H.; Bai, X.; Zhang, W.; Wang, S.; Luo, J.; Cao, Y. Exploring and attributing change to fractional vegetation coverage in the middle and lower reaches of Hanjiang River Basin, China. Environ. Monit. Assess. 2023, 195, 131. [Google Scholar] [CrossRef]
- Yu, S.; Du, W.; Zhang, X.; Hong, Y.; Liu, Y.; Hong, M.; Chen, S. Spatiotemporal changes in NDVI and its driving factors in the Kherlen River Basin. Chin. Geogr. Sci. 2023, 33, 377–392. [Google Scholar] [CrossRef]
- Jiang, W.; Yuan, L.; Wang, W.; Cao, R.; Zhang, Y.; Shen, W. Spatio-temporal analysis of vegetation variation in the Yellow River Basin. Ecol. Indic. 2015, 51, 117–126. [Google Scholar] [CrossRef]
- Ozyavuz, M.; Bilgili, B.C.; Salici, A. Determination of vegetation changes with NDVI method. J. Environ. Prot. Ecol. 2015, 16, 264–273. [Google Scholar]
- Chen, J.; Wang, S.; Shi, H.; Chen, B.; Wang, J.; Zheng, C.; Zhu, K. Radiation and temperature dominate the spatiotemporal variability in resilience of subtropical evergreen forests in China. Front. For. Glob. Change 2023, 6, 1166481. [Google Scholar] [CrossRef]
- Shi, M.; Lin, F.; Jing, X.; Li, B.; Qin, J.; Wang, M.; Shi, Y.; Hu, Y. Research on the Spatio-Temporal Changes of Vegetation and Its Driving Forces in Shaanxi Province in the Past 20 Years. Sustainability 2023, 15, 16468. [Google Scholar] [CrossRef]
- Yu, H.; Zahidi, I. Spatial and temporal variation of vegetation cover in the main mining area of Qibaoshan Town, China: Potential impacts from mining damage, solid waste discharge and land reclamation. Sci. Total Environ. 2023, 859, 160392. [Google Scholar] [CrossRef]
- Yu, H.; Zahidi, I.; Liang, D. Spatiotemporal variation of vegetation cover in mining areas of Dexing City, China. Environ. Res. 2023, 225, 115634. [Google Scholar] [CrossRef]
- Fang, A.; Dong, J.; Cao, Z.; Zhang, F.; Li, Y. Tempo-spatial variation of vegetation coverage and influencing factors of large-scale mining areas in Eastern Inner Mongolia, China. Int. J. Environ. Res. Public Health 2020, 17, 47. [Google Scholar] [CrossRef]
- Yue, M.; Geng, G.; Wang, T.; Yang, R.; Gu, Q. Spatiotemporal variation of vegetation NDVI and its driving factors in the Shaanxi section of the Yellow River basin from 2000 to 2019. Res. Soil Water Conserv. 2023, 30, 238–246. [Google Scholar] [CrossRef]
- Zou, Y. Monitoring and restoration of ecological damage in coal mining areas in the Yellow River Basin. Resour. Guide-Informatiz. Mapp. Ed. 2020, 9, 8–10. [Google Scholar]
- Pei, Y.; Sun, Y.; Yu, Q.; Ma, J.; Wang, H.; Yue, D. Optimization of ecological spatial network in typical mining areas of the Yellow River Basin: Take Ordos and Yulin areas of the Yellow River Basin as examples. China Coal. Soc. 2021, 46, 1541–1554. [Google Scholar] [CrossRef]
- Ya-shan, S.; Chong, D.; Chao, Y.; Chao, Q. Ecological environmental quality evaluation of Yellow River basin. Procedia Eng. 2012, 28, 754–758. [Google Scholar] [CrossRef][Green Version]
- Wang, L.; Li, N.; Wen, G.C.; Yang, Y.H. Vegetation coverage changes and driving forces in Henan section of the Yellow River basin. Bull. Soil. Water Conserv 2022, 42, 393–399. [Google Scholar] [CrossRef]
- Zhang, Y.; Zhao, X.; Gong, J.; Luo, F.; Pan, Y. Effectiveness and driving mechanism of ecological restoration efforts in China from 2009 to 2019. Sci. Total Environ. 2024, 910, 168676. [Google Scholar] [CrossRef] [PubMed]
- Liu, T.; Yu, L.; Chen, X.; Wu, H.; Lin, H.; Li, C.; Hou, J. Environmental laws and ecological restoration projects enhancing ecosystem services in China: A meta-analysis. J. Environ. Manag. 2023, 327, 116810. [Google Scholar] [CrossRef]
- Wang, R.; Wang, H.; Wang, C.; Duan, J.; Zhang, S. Spatial Scale Effect on Fractional Vegetation Coverage Changes and Driving Factors in the Henan Section of the Yellow River Basin. Remote Sens. 2024, 16, 2575. [Google Scholar] [CrossRef]
- Tiefelsdorf, M.; Griffith, D.A. Semivariance and robustness against spatial nonstationarity. Environ. Plan. A Econ. Space 2007, 39, 933–947. [Google Scholar]
- Zhang, H.; An, H. Analysis of NDVI variation characteristics and trend of Minqin Oasis from 1987 to 2019 based on GEE. J. Desert Res. 2021, 41, 28. [Google Scholar] [CrossRef]
- Fang, L.; Wang, W.; Jiang, W.; Chen, M.; Wang, Y.; Jia, K.; Li, Y. Spatio-temporal Variations of Vegetation Cover and Its Responses to Climate Change in the Heilongjiang Basin of China from 2000 to 2014. Sci. Geogr. Sin. 2017, 37, 1745–1754. [Google Scholar] [CrossRef]
Disclaimer/Publisher’s Note: The statements, opinions and data contained in all publications are solely those of the individual author(s) and contributor(s) and not of MDPI and/or the editor(s). MDPI and/or the editor(s) disclaim responsibility for any injury to people or property resulting from any ideas, methods, instructions or products referred to in the content. |
© 2024 by the authors. Licensee MDPI, Basel, Switzerland. This article is an open access article distributed under the terms and conditions of the Creative Commons Attribution (CC BY) license (https://creativecommons.org/licenses/by/4.0/).