Abstract
In the context of drought events caused by global warming, there is limited understanding of vegetation loss caused by drought and the subsequent recovery of vegetation after drought ends. However, employing a single index representing a specific vegetation characteristic to explore drought’s impact on vegetation may overlook vegetation features and introduce increased uncertainty. We applied the enhanced vegetation index (EVI), fraction of vegetation cover (FVC), gross primary production (GPP), leaf area index (LAI), and our constructed remote sensing vegetation index (RSVI) to assess vegetation drought in Central Asia. We analyzed the differences in drought experiences for different climatic regions and vegetation types and vegetation loss and recovery following drought events. The results indicate that during drought years (2012 and 2019), the differences in vegetation drought across climatic regions were considerable. The vegetation in arid, semiarid, and Mediterranean climate regions was more susceptible to drought. The different indices used to assess vegetation loss exhibited varying degrees of dynamic changes, with vegetation in a state of mild drought experiencing more significantly during drought events. The different vegetation assessment indices exhibited significant variations during the drought recovery periods (with a recovery period of 16 days: EVI of 85%, FVC of 50%, GPP of 84%, LAI of 61%, and RSVI of 44%). Moreover, the required recovery periods tended to decrease from arid to humid climates, influenced by both climate regions and vegetation types. Sensitivity analysis indicated that the primary climatic factors leading to vegetation loss varied depending on the assessment indices used. The proposed RSVI demonstrates high sensitivity, correlation, and interpretability to dry–wet variations and can be used to assess the impact of drought on vegetation. These findings are essential for water resource management and the implementation of measures that mitigate vegetation drought.
1. Introduction
Vegetation at different stages of growth usually undergoes structural and functional changes that affect the exchange of matter and energy between the atmosphere and the land [1,2,3]. It serves as a crucial indicator reflecting the status of terrestrial ecosystems [4]. Long-term and large-scale monitoring of vegetation through remote sensing has shown that vegetation activity has increased significantly both globally and regionally, which has had a profound impact on terrestrial ecosystems [5,6]. As a result, the quantitative study of dynamic changes in terrestrial vegetation has received much attention from scholars [7]. Climate factors are among the main driving factors behind changes in vegetation [8]. Studies have shown that climate change has intensified in recent decades along with an increase in extreme weather events, resulting in unprecedented losses to terrestrial vegetation, with drought having a particularly severe impact [9,10]. Therefore, assessing the losses inflicted upon terrestrial vegetation by drought and the subsequent recovery of vegetation after drought is an essential issue that cannot be overlooked.
Currently, under the trend of climate warming, drought events are becoming increasingly frequent [11]. Prolonged insufficient precipitation and extended high temperatures can lead to severe atmospheric moisture deficits, resulting in accelerated rates of water loss from vegetation and soil [12]. This can seriously affect the efficiency of vegetation water use, limiting its normal activity [13,14]. If vegetation remains in this state for a prolonged period, its risk of death increases [15,16]. Research on the impact of drought on vegetation has been carried out at both the regional and global levels, mainly using long time series data to analyze the changes in vegetation under drought stress. As is seen in the analysis by Chen et al., which examined the impact of meteorological drought (SPEI) and soil moisture (SM) on global vegetation greenness (SIF) and productivity (NPP) from 2001 to 2020 [17]. Fang et al. and Yuan et al. conducted studies on the probability of drought stress-induced vegetation loss in China and Central Asia, respectively, using SPEI and NDVI [18,19]. Xu et al. and Liu et al. each analyzed the cumulative and lag effects of drought on vegetation in Central Asia using long-term time series data [20,21]. Previous research focused more on the effects of long-term climate change on vegetation [10,22]. However, drought often occurs more severely in a certain year, and the degree of vegetation loss during this period may be greater. As a result, monitoring and assessing vegetation changes (degree of vegetation loss and recovery time) during a period or year when drought is more severe needs to be enhanced and supplemented.
Various vegetation indices derived from remote sensing data are used for large-scale vegetation monitoring [23], and the ecological significance of these indices differs. Specifically, indices commonly used include the normalized difference vegetation index (NDVI) and enhanced vegetation index (EVI) for vegetation greenness monitoring [24,25], the fraction of vegetation cover (FVC) for monitoring vegetation coverage after NDVI transformation [26], the gross primary production (GPP) and net primary production (NPP) for monitoring vegetation productivity and carbon storage [27,28], and the leaf area index (LAI) for monitoring canopy structure [29,30]. In utilizing these indices with varying ecological significance for vegetation monitoring and assessment, different outcomes are often observed [31,32]. In addition, different indices may also differ when characterizing the same ecological significance [33,34]. Overall, the diversity of index definitions, research periods, and other factors can all contribute to the uncertainty of vegetation change assessments [35,36]. The establishment of a novel index for vegetation assessment based on the ecological significance of different indices is warranted. In addition, vegetation drought changes with climatic region. Generally, arid regions exhibit sparse vegetation due to poor soil conditions; however, their contributions to these areas cannot be disregarded [37]. Similar to climatic regions, different vegetation types exhibit different sensitivities when subjected to drought [38]. Grasslands are the most responsive and vulnerable vegetation type [39], but there is still spatial heterogeneity in vegetation sensitivity to drought [40]. These phenomena are scientific issues of global concern to ecologists, necessitating further exploration and validation.
We focused on Central Asia, one of the largest arid regions in the Northern Hemisphere [41]. Due to sparse vegetation and poor soil, deserts and grasslands are the major land use types [42], and the ecosystem is extremely fragile and susceptible to environmental impacts [43,44]. Nevertheless, Central Asia’s economy is still primarily based on agriculture, making the region more vulnerable to drought events [45]. Furthermore, as the core region linking the Eurasian continent, the terrestrial ecosystem in this area is perennially plagued by drought stress, which may impact the achievement of Sustainable Development Goal (SDG) 15 (protect, restore, and promote sustainable use of terrestrial ecosystems; combat desertification) [46,47]. Therefore, in the context of escalating drought events driven by global climate change, it is imperative that we gain a thorough understanding of the losses and recovery of terrestrial ecosystems following drought as well as the primary causes contributing to these losses. This is also a prerequisite for guiding regional ecological and environmental management.
This study primarily attempts to construct a comprehensive vegetation assessment index in regard to drought conditions. By utilizing this index, the focus is on assessing post-drought vegetation loss and recovery under different climatic conditions and vegetation types and comparing it with single vegetation assessment indices. Therefore, the objectives of this study are (1) to utilize MODIS data to construct the temperature vegetation dryness index (TVDI) for the Central Asia region from 2000 to 2020 to monitor vegetation drought conditions; (2) to construct the remote sensing vegetation index (RSVI) based on four vegetation indices—EVI, FVC, GPP, and LAI—and evaluate its effectiveness in monitoring vegetation during drought periods; (3) to investigate the differences in post-drought vegetation loss and recovery times in different climatic regions and vegetation types in Central Asia using the RSVI and compare it with four other vegetation indices; and (4) to further analyze the relative sensitivity of vegetation change to climate factors. The research findings will provide new methodological support for quantitatively assessing post-drought vegetation loss and recovery in the arid regions of Central Asia, offering crucial theoretical groundwork for maintaining terrestrial ecosystem stability and promoting sustainable development of terrestrial ecosystems.
2. Materials and Methods
2.1. Study Area
Central Asia, located in the heart of the Eurasian continent (Figure 1a), is defined by its continental arid and semiarid climate. The region extends from east to west, encompassing Xinjiang, in China, as well as Turkmenistan, Uzbekistan, Kazakhstan, Kyrgyzstan, and Tajikistan, covering an area of roughly 5.61 × 10⁴ km2 [48]. Situated far from the ocean, this region receives minimal rainfall (less than 300 mm annually) and experiences significant temperature variations, with daily fluctuations ranging from 20 to 30 °C. High evaporation rates also contribute to its characteristic arid environment [20]. Most of Central Asia consists of arid and semiarid zones (Figure 1b) with varied and complex landscapes, including plains, basins, and mountains (Figure 1c). Vegetation in this area is primarily composed of shrubs, grasslands, and croplands, with grasslands covering the largest area, predominantly located in the more sensitive arid and semiarid zones (Figure 1d). Central Asia features a diverse and complex landscape with significant topographic variation. The southeastern region is characterized mainly by hills and plains, while the northwestern region predominantly consists of lowlands [49]. Soil types in Central Asia are diverse, but soils are low in organic matter and have a fragile soil structure.
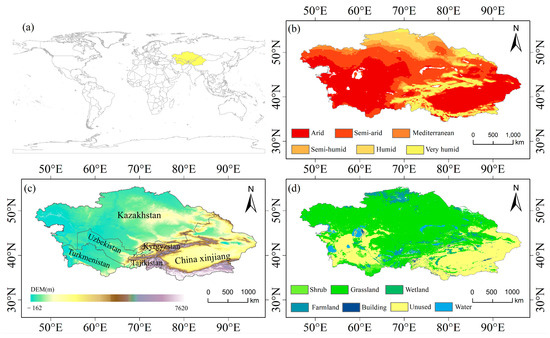
Figure 1.
Overview of the study area: (a) geographic location of Central Asia; (b) climate region distribution in Central Asia; (c) elevation in Central Asia; and (d) land use in Central Asia.
2.2. Data Sources
The technical flowchart of this study is shown in Figure 2.
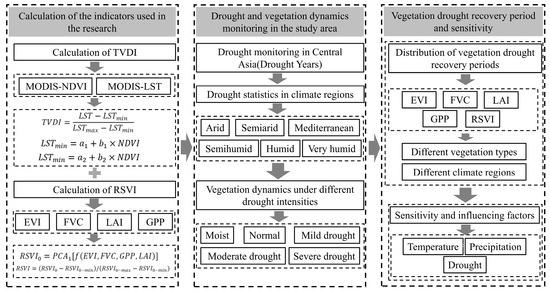
Figure 2.
Technical flowchart of this study.
2.2.1. Climate Data
Temperature and precipitation data from 2000 to 2020 were obtained from FLDAS (Famine Land Data Assimilation System), with temporal and spatial resolutions of monthly and 0.1°, respectively. Following the statistical analysis, the climate of Central Asia was classified.
2.2.2. Remote Sensing Data
The remote sensing data used in this study for 2000–2020 were all derived from MODIS products, namely, EVI, NDVI, GPP, LAI, LST, and land cover (Table 1). The EVI and NDVI were derived from MOD13A2 data, which were available every 16 days with a spatial resolution of 1 km. The gross primary productivity (GPP) and leaf area index (LAI) were obtained from MOD17A2 and MOD15A2H, respectively, both of which were provided every 8 days at a spatial resolution of 500 m. Land surface temperature (LST) data were extracted from MOD11A2, which was also provided every 8 days at a 500 m spatial resolution. The land cover information was sourced from the MCD12Q1 product, which was provided annually with a spatial resolution of 500 m. The data included 17 categories, with our research focusing on forest, grassland, and cropland vegetation types. The remaining categories were considered “others” and were not analyzed in this study. The soil moisture data used in this study were obtained from the ERA5-Land reanalysis dataset, covering the period from 2000 to 2020 on a monthly scale with a spatial resolution of 0.1°. We utilized bilinear interpolation to resample all datasets to 0.1°.

Table 1.
Climate and remote sensing data.
2.3. Climatic Classification
The De Martonne Index (I) [50] is a comprehensive metric capable of responding to the integrated impact of temperature and precipitation and has been widely applied in various studies for climate region classification [50,51,52]. Given that it can highlight the climatic types of basins and is suitable for basins in the Xinjiang region of China, we chose it for the classification of climatic regions in the study area [51]. The calculation method is as follows in Equation (1):
In the equation, I represents the calculated De Martonne index, while P and T denote the annual average precipitation (mm) and annual average temperature (°C), respectively, for 2000–2020. Table 2 presents the threshold values for different climatic regions.

Table 2.
Climatic regions based on the De Martonne index.
2.4. Calculation of the TVDI
To monitor the drought stress experienced by vegetation in Central Asia, we developed the temperature vegetation dryness index (TVDI). The TVDI is based on the triangular relationship between vegetation condition and land surface temperature (NDVI-LST) described in the literature (Figure 3) [53]. TVDI can be used as a vegetation moisture stress index in conjunction with other vegetation indices to establish productivity estimation models [54,55]. It exhibits a strong correlation with soil moisture, which is well demonstrated in our validation results (Figure 4). Due to the universality of its construction method, we can obtain more precise data on vegetation moisture stress (vegetation drought). This allows for greater accuracy in assessing vegetation drought [56,57]. Furthermore, this method is applicable to drought monitoring under different climatic and topographical conditions [58]. The formula for constructing the TVDI using the NDVI and LST is as follows in Equation (2):
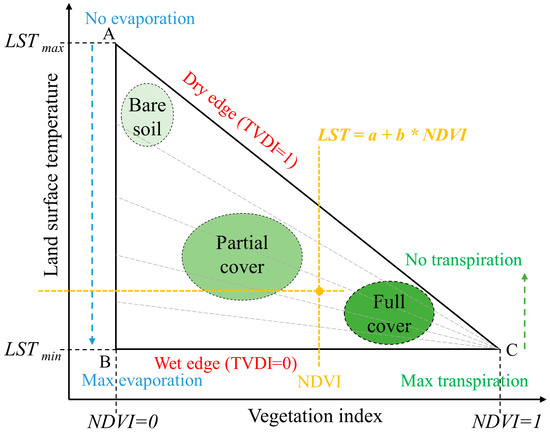
Figure 3.
Conceptual diagram of TVDI, adapted from Sandholt et al. [53].
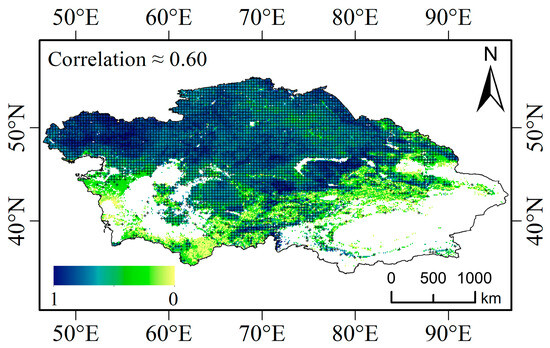
Figure 4.
The verification of the correlation between TVDI and soil moisture during the drought period with black crosses indicating the pixels that passed the significance test (p < 0.05).
In this equation, LST represents the land surface temperature of any given grid cell. LSTmin refers to the lowest land surface temperature, which defines the wet edge along the horizontal base of the triangle (Figure 3). LSTmax denotes the highest land surface temperature, defined as the dry edge.
Linear regression analysis was employed to determine the dry edge Equation (3) and wet edge Equation (4). The coefficients for the dry edge and wet edge are a1 and b1 and a2 and b2, respectively, representing the intercept and slope of their respective equations. The TVDI ranges from 0 to 1, with values closer to 1 indicating proximity to the dry edge and a higher degree of drought. The TVDI is classified into five categories based on its intensity (Table 3) [59]. The calculations are implemented in python 3.8. The relevant code and computational steps are sourced from https://gma.luosgeo.com/Introduce.html (accessed on 10 February 2024).

Table 3.
Climatic classification based on the TVDI.
2.5. Construction of the Remote Sensing Vegetation Index (RSVI)
The indices we selected for the RSVI primarily reflect vegetation characteristics such as greenness (EVI), coverage (FVC), productivity (GPP), and canopy structure (LAI). These components were chosen because they are directly relevant to monitoring vegetation health and dynamics. Greenness indices, for instance, are well-established indicators of photosynthetic activity and vegetation vigor [60]. Coverage indices help quantify the extent of vegetation, which is crucial for understanding spatial patterns [26]. Productivity and canopy structure indices provide insights into the biomass and physical characteristics of vegetation, which are critical for assessing ecosystem function [27,28,29,30]. The selection of these specific indices was guided by their established relevance in vegetation monitoring and by their ability to capture key aspects of vegetation condition across different climatic regions. However, there is a strong correlation among these four indices, making principal component analysis (PCA) an appropriate choice for construction. To prevent the impact of scale differences on the weights, each index must be standardized prior to performing PCA [61]. This is shown in Equations (5)–(7).
Due to the nonuniform dimensions of the EVI, FVC, GPP, and LAI, it is imperative to normalize each index before formulating the RSVI, guaranteeing that their values fall within the 0 to 1 range, as illustrated in Equation (5):
In this context, N represents the normalized value, V is the value of a specific grid cell, Vmin is the minimum value of the grid cells, and Vmax is the maximum value of the grid cells.
To ensure the comparability of the RSVI for the same study area across different years, it is necessary to establish consistent maximum and minimum values. PCA was subsequently performed on the normalized indices of greenness, coverage, productivity, and canopy structure. This can be represented by Equation (6):
The RSVI is standardized to values between 0 and 1 to facilitate measurement and differentiation of the indices. This is demonstrated in Equation (7):
2.6. Drought Recovery Time
The EVI, FVC, GPP, and LAI each provided insight into vegetation activity from different perspectives and were used to evaluate the level of ecosystem vitality recovery following drought events. We calculated the recovery period using daily values along with the 2000–2020 average (VI2000–2020mean) of five indices (EVI, FVC, GPP, LAI, and RSVI). The recovery period is defined as the number of days after the end of a drought when the values of all five indices are greater than or equal to their 2000–2020 average (VI ≥ VI2000–2020mean) [62]. To be cautious, we defined vegetation drought as a TVDI greater than 0.6, and drought was considered to have ended when the TVDI values, after reaching their maximum, started to decrease and did not exceed 0.6 [59].
2.7. Attribution Analysis of Climate and Drought on Vegetation Loss
First, we employed linear regression methods to estimate the contributions of climate factors (temperature, precipitation) and drought (TVDI) to vegetation losses during drought years (2012 and 2019) in Central Asia. The vegetation grid cells in Central Asia were categorized into two groups: (1) grid cells affected by drought events and (2) grid cells without drought occurrences. Losses in vegetation grid cells affected by drought events were predominantly caused by climate factors (temperature, precipitation) and drought conditions, as indicated in Equation (8). Losses in vegetation grid cells without drought occurrence were primarily driven by climate factors, as expressed in Equation (9). Consequently, the difference in vegetation loss between the two categories could be largely attributed to drought, as represented in Equation (10).
Next, we estimated the vegetation grid cells in Central Asia for drought years (ΔVI) using linear regression models. The independent variables included the mean changes in precipitation (ΔPmean, mm) and temperature (ΔTmean, °C) during the growing season, as well as their interaction (ΔPmean × ΔTmean) and the mean value of vegetation drought grid cells (ΔTVDI) between the reference years (2000–2020). Third, we constructed regression models separately for each grid cell using ΔPmean, ΔTmean, ΔTVDI, and their interactions during drought years, along with the vegetation index (ΔVI) during drought years, to assess the changes in Central Asian VI during drought years. We employed a stepwise approach, selecting only those variables with statistical significance for model construction, choosing the best model for computation, and ultimately deriving the equation presented in Table 4.

Table 4.
Attribution analysis of vegetation loss during drought years.
3. Results
3.1. Vegetation Drought Monitoring in Central Asia Based on the TVDI
In Central Asia, the temperature vegetation dryness index (TVDI) peaked in 2012 at 0.6398, followed closely by 2019 at 0.6377 (Figure 5a). In 2012, vegetation in Central Asia was primarily impacted by moderate drought conditions (56%), with drought-affected vegetation in arid regions experiencing the most severe impacts—severe and moderate droughts accounted for 37.28% and 57.55%, respectively. Approximately 77% of vegetation in semiarid areas was affected by moderate drought (Figure 5b,d). A similar pattern was observed in 2019, where moderate drought in affected regions reached 48.14%. Notably, in 2019, severe drought conditions were more pronounced in arid climate zones (42.69%), while around 75.64% of vegetation in semiarid regions experienced moderate drought (Figure 5c,e). The TVDI values for both 2012 and 2019 indicated a trend towards increasing moisture, reflecting a decrease in drought impacts on vegetation.
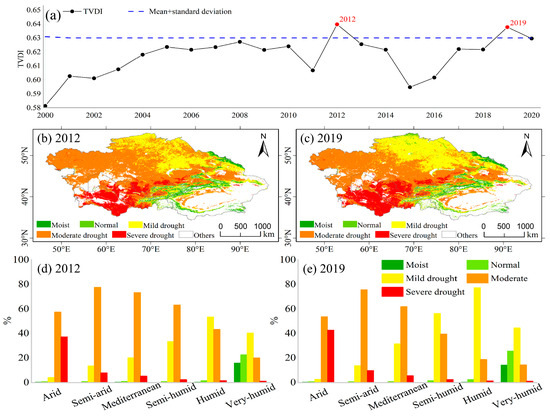
Figure 5.
(a) Average TVDI from 2000 to 2020, (b) Central Asian vegetation drought distribution based on the TVDI in 2012, and (c) Central Asian vegetation drought distribution based on the TVDI in 2019. Drought severity in the different climate regions: (d) 2012 and (e) 2019.
3.2. Vegetation Dynamics Under Different Drought Intensities
To illustrate the temporal variations in vegetation in Central Asia during the growing seasons of 2012 and 2019, we selected severe drought (0.8 < TVDI < 1), moderate drought (0.6 < TVDI < 0.8), mild drought (0.4 < TVDI < 0.6), normal (0.2 < TVDI < 0.4), and moist (0 < TVDI < 0.2) conditions (Figure 6a–j). The dynamics of the RSVI, EVI, FVC, GPP, and LAI for the drought year and the years preceding and following the drought (2012, 2011, and 2013) indicate that in 2011, the year prior to the drought, all five indicators reached their peak values during the growing season in July, specifically 0.28, 0.56, 0.32, 0.15, and 0.50, respectively. Under drought conditions, most indices peaked in July, including EVI (0.28), FVC (0.56), LAI (0.15), and RSVI (0.50). Only GPP reached its peak after the drought, in August 2013, with values of 0.30, 0.35, and 0.22. Under normal conditions, all indices peaked in May, while under wet conditions, they peaked in April. This pattern was similar during drought years around 2019, indicating that the timing of vegetation peaks fluctuates due to drought conditions.
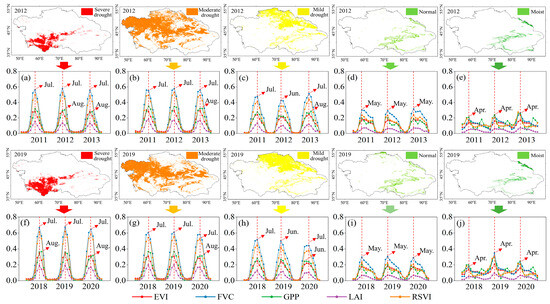
Figure 6.
(a–j) Represent vegetation dynamics under different drought conditions for the years 2012 and 2019, respectively: (a) severe drought, (b) moderate drought, (c) mild drought, (d) normal conditions, and (e) moist conditions for 2012; and (f) severe drought, (g) moderate drought, (h) mild drought, (i) normal conditions, and (j) moist conditions for 2019.
Based on the attribution analysis formulas presented in Table 4, it was evident that the extent of vegetation loss caused by drought in 2012 was significantly greater than that caused by drought in 2019. In 2012, drought resulted in losses of 0.019 for the EVI, 0.014 for the FVC, 0.016 for the GPP, 0.192 for the LAI, and 0.504 for the constructed RSVI. Conversely, in 2019, the corresponding losses were −0.003 for the EVI, 0.009 for the FVC, −0.007 for the GPP, 0.000 for the LAI, and −0.009 for the constructed RSVI. This also highlighted that when assessing vegetation losses using indices with different ecological meanings, the results may vary due to differences in the chosen indices. Compared to other indices, the RSVI constructed by us exhibited greater loss in the drought year of 2012, indicating a stronger response between the RSVI and drought.
3.3. Distribution of Vegetation Drought Recovery Periods
The distributions of drought recovery periods for the five indices in 2012 and 2019 are depicted in Figure 7 and Figure 8, respectively. Throughout the study period, the recovery period distribution characteristics for the five indices were not consistent. In 2012, areas with prolonged vegetation recovery periods or where recovery was impossible were primarily located in the southern part of the EVI region, the northwestern part of the FVC region, and small areas in the southern and northern parts of the GPP region. The distribution of LAI was limited to the central part of the region. On the other hand, the constructed RSVI did not exhibit any distinct spatial patterns and was distributed across the entire area. The distribution scale of regions in Central Asia with prolonged or irreversible vegetation recovery, as represented by five indices in 2019, was lower than in 2012. This corresponds with the fact that the drought intensity in 2012 was more severe than in 2019.
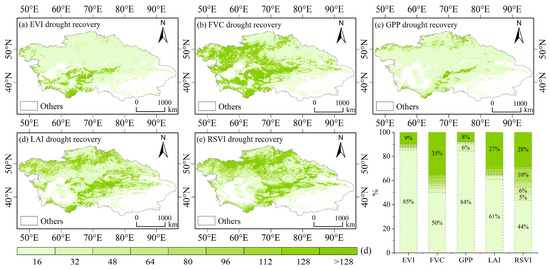
Figure 7.
Distribution of drought recovery times for different indices in 2012. (a–e) Represent the recovery time distributions for EVI, FVC, GPP, LAI, and RSVI during the drought year of 2012, respectively. The stacked bar chart shows the proportion of recovery periods for the five indices, with values below 5% not displayed numerically.
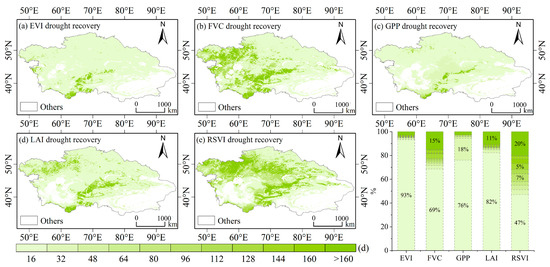
Figure 8.
Distribution of drought recovery times for different indices in 2019. (a–e) Represent the recovery time distributions for EVI, FVC, GPP, LAI, and RSVI during the drought year of 2019, respectively. The stacked bar chart shows the proportion of recovery periods for the five indices, with values below 5% not displayed numerically.
3.3.1. Drought Recovery Periods of Vegetation Under Different Climates
Figure 9 presents the proportions of drought recovery periods for the five indices under various climatic conditions. It was evident that under humid climatic conditions, vegetation exhibited a faster recovery period, while there was a declining trend in the required recovery periods from arid to humid climates. The semiarid and Mediterranean climates occupied an intermediate state, with recovery periods shorter than those in arid climates but longer than those in humid climates. The proportion of EVI recovery within 16 days varied from 68.26% under extremely arid conditions to 96.80% under extremely humid conditions. Conversely, the percentage of EVI recovery exceeding 128 days decreased from 18.41% under extremely arid conditions to 2.33% under extremely humid conditions. Similar patterns were observed for the other vegetation indices. In 2012, climates characterized as humid and extremely humid exhibited faster vegetation recovery periods, while in 2019, the vegetation recovery periods for humid and extremely humid climates were even faster than those in 2012 (Figure 10).
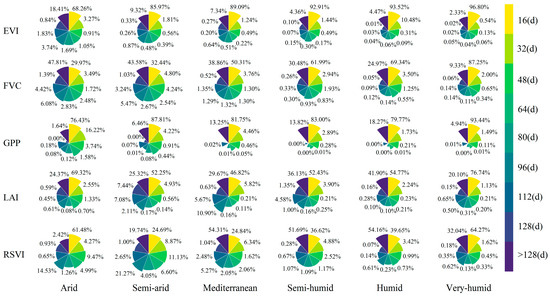
Figure 9.
Proportions of drought recovery periods for the five indices under different climate types in 2012.
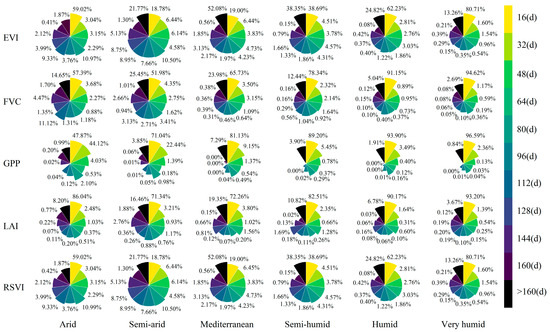
Figure 10.
Proportions of drought recovery periods for the five indices under different climate types in 2019.
3.3.2. Recovery Periods for Different Vegetation Types
Figure 11 shows the average drought recovery periods for the different vegetation types. Generally, the more severe the experienced drought was, the longer the required recovery period. Consequently, the vegetation drought recovery rate in 2012 was slower than that in 2019. In both 2012 and 2019, similar patterns were observed in the recovery periods for different vegetation types, with croplands exhibiting the shortest recovery period, followed by grasslands, and forests having the longest recovery period. Notably, significant variations were observed in the recovery periods for forests across different regions, while grasslands and croplands showed comparatively smaller differences.
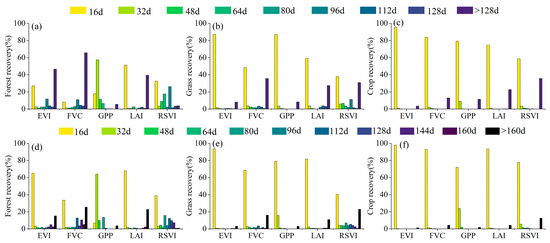
Figure 11.
Recovery periods for different vegetation types: (a–c) display the proportions of drought recovery periods for the five vegetation indices in forests, grasslands, and croplands, respectively, for 2012; (d–f) display the proportions of drought recovery periods for the five vegetation indices in forests, grasslands, and croplands, respectively, for 2019.
3.4. Vegetation Sensitivity and Influencing Factors
We quantified the sensitivity of Central Asian vegetation changes to temperature, precipitation, and the TVDI, as shown in Figure 12 and Figure 13. Due to significant interannual variability in climatic variables, we used the average values from 2011 to 2013 as a reference and calculated the differences between drought years and the average values (2011–2013). The relationships between the changes in the five vegetation indices and the variations in temperature, precipitation, and the TVDI in grids experiencing drought (TVDI > 0.6) are illustrated in Figure 12. Specifically, the relationship between the changes in the RSVI and TVDI (R2 = 0.1054, p < 0.01) was found to be the strongest among these indices, indicating a greater sensitivity of the RSVI to changes in the TVDI. On the other hand, the changes in the other four indices (EVI, FVC, GPP, and LAI) exhibited stronger correlations with precipitation. These findings suggest that the variations in the EVI, FVC, GPP, and LAI, which represent vegetation changes, are primarily influenced by precipitation and the TVDI. In the grids where no drought occurred (TVDI ≤ 0.6) (Figure 13), the relationships between the changes in the five vegetation indices and the variations in temperature, precipitation, and the TVDI in grids without drought (TVDI < 0.6) are illustrated in Figure 13. In comparison, the EVI, FVC, GPP, LAI, and RSVI displayed stronger relationships with both temperature and the TVDI. Additionally, the constructed RSVI consistently showed the strongest correlation with the TVDI. These findings further indicated that the variations in the five vegetation indices, which represented vegetation changes in the absence of drought, were primarily influenced by temperature and the TVDI. The analysis of grid cells affected by drought and those unaffected by drought in 2019 indicated that precipitation and the TVDI primarily influenced vegetation (Figures S1 and S2).
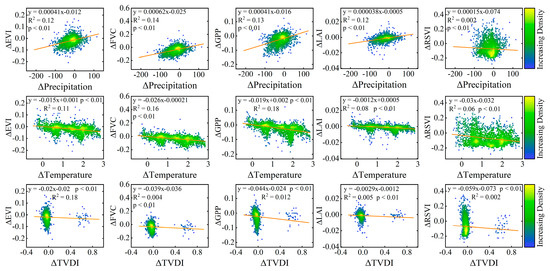
Figure 12.
Two-dimensional scatter plots of vegetation in the 2012 Central Asian region within grids affected by drought in relation to temperature, precipitation, and TVDI changes: ΔVI represents the difference between the average vegetation index (VI) during the 2012 growing season and the reference year (average VI from 2011 to 2013). Similarly, ΔTVDI represents the difference between the average temperature vegetation dryness index (TVDI) during the 2012 growing season and that during the reference year (the average TVDI from 2011 to 2013). Additionally, ΔPre and ΔTem represent the differences between the average precipitation and temperature in 2012 and those in the reference year (average precipitation and temperature from 2011 to 2013).
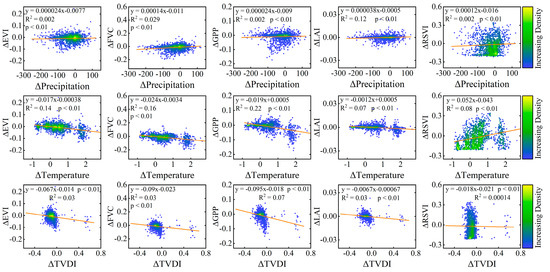
Figure 13.
Two-dimensional scatter plots of vegetation in grids in the 2012 Central Asian region where no drought occurred in relation to temperature, precipitation, and TVDI changes: ΔVI represents the difference between the average vegetation index (VI) during the 2012 growing season and the reference year (average VI from 2011 to 2013). Similarly, ΔTVDI represents the difference between the average temperature vegetation dryness index (TVDI) during the 2012 growing season and that during the reference year (the average TVDI from 2011 to 2013). Additionally, ΔPre and ΔTem represent the differences between the average precipitation and temperature in 2012 and those in the reference year (average precipitation and temperature from 2011 to 2013).
3.5. Advantages of the RSVI
Based on four vegetation indices representing different ecological significance, we developed an RSVI that demonstrated consistent variations in monitoring and assessing vegetation dynamics compared to the initial four indices (Figure 5). It exhibited greater sensitivity to dry–wet variations under both drought and nondrought conditions (Figure 12 and Figure 13). Furthermore, the RSVI we constructed exhibited a mean correlation of 0.5 with the TVDI. The significance test (p < 0.05) revealed that 81% of the raster cells achieved statistically significant correlations, indicating the strong potential of the RSVI in research related to vegetation and drought relationships (Figure 14).
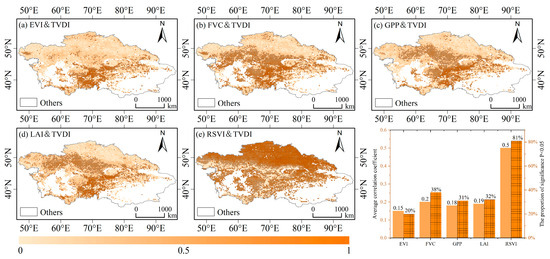
Figure 14.
The correlation between the EVI, FVC, GPP, LAI, RSVI, and TVDI in Central Asia is depicted in the figure. The black crosses indicate raster cells that achieved statistical significance through significance testing (p < 0.05).
4. Discussion
4.1. TVDI Drought Monitoring
Our study employed the TVDI to assess aridity in Central Asia and identified 2012 as the driest year between 2000 and 2020, with 2019 ranking as the second driest year. These findings were corroborated by the investigation by Shi et al. (2020) on drought monitoring across the Eurasian continent, which demonstrated a strong correlation between the TVDI and both the standardized precipitation evapotranspiration index (SPEI) and soil moisture [63]. Meanwhile, Oliver et al. (2019) applied TVDI to UAV imagery for estimating soil moisture, and the results demonstrated that this method performs well in complex mountainous terrains, generating soil moisture maps with a resolution of 50 cm, which showed strong correlation with field measurements (R2 values of 0.55 and 0.76) [64]. Ding et al. (2024) used TVDI to analyze drought across different climatic zones and vegetation types in the Yellow River Basin, identifying TVDI as an excellent drought index for monitoring the distribution and severity of agricultural droughts [65]. This validation provided substantial evidence for the effectiveness of the TVDI in drought monitoring and further confirmed that 2012 was the year most severely affected by drought, which is consistent with our research results.
In 2012 and 2019, the southern region of Central Asia experienced severe drought, while the central region experienced relatively milder drought conditions. This difference in drought severity could be attributed to the use of the TVDI in monitoring aridity in Central Asia, which is constructed based on the triangular relationship between the normalized difference vegetation index (NDVI) and LST (Figure 3). The southern part of Central Asia, including Turkmenistan, Uzbekistan, Tajikistan, and some areas of Kyrgyzstan, is predominantly characterized by desert land cover with a small portion of shrubs and grasslands (Figure 1d).
First, an increase in vegetation can lead to a reduction in air temperature [66]. This effect on surface temperature is achieved by simultaneously increasing surface roughness and conductivity, which in turn enhances the dissipation of turbulent energy flux, thereby lowering the surface temperature [67]. On the other hand, with the increase in vegetation, a greater amount of deeper soil moisture is utilized to replenish vegetation through transpiration, resulting in a decrease in surface temperature [68]. Therefore, the impact of sparse vegetation on surface temperature is limited, whereas regions with relatively more vegetation, such as Kazakhstan and certain parts of Xinjiang, China, tend to experience milder drought. The primary climate regions where drought and severe drought occur are arid, semiarid, and Mediterranean climates. This consensus is shared among numerous scholars, as these climate regions all have common characteristics, such as high summer temperatures, limited and unevenly distributed precipitation, and severe constraints on vegetation growth [69,70,71].
4.2. The Impact of Drought on Vegetation Loss
Many studies in the field of drought impact on vegetation have provided compelling evidence for the critical relationship between vegetation loss and drought in the context of climate change [72,73,74]. Generally, the impact of drought on vegetation varies with drought severity, wherein more severe drought conditions result in greater vegetation loss [75]. Our results showed that the vegetation dynamics under different drought intensities, whether during the more severe drought in 2012 or the relatively milder drought in 2019, exhibited minor variations in regions affected by drought and severe drought during 2011–2013 and 2018–2020 (Figure 5). However, in mild drought regions experiencing drought years (2012 and 2019), the vegetation exhibited a significant decline compared to the vegetation before and after the drought years (2011, 2013, 2018, and 2020) (Figure 5c). On the other hand, the vegetation in the normal and moist regions showed similar patterns to that in the drought-affected regions, with relatively small changes during both the drought years and the periods before and after the drought (Figure 5d,e,i,j).
In a previous study using SPEI to investigate the impact of drought on vegetation loss, it was found that vegetation loss was more sensitive to the duration of drought than to its severity and peak intensity and that there was no clear linear relationship between drought intensity and the degree of vegetation loss [76]. This finding is consistent with our results. This was because vegetation that has evolved to grow in arid environments for many years has developed strong adaptability to drought stress [77]. Plants in this region typically possess water-preserving mechanisms to counteract drought [78]. Moist regions typically receive more precipitation and have abundant water resources, which can satisfy the water requirements for vegetation growth and reproduction even during periods of drought [79]. This abundance of water resources mitigates the direct impact of drought on vegetation [80]. The humid climatic conditions in these regions endow the vegetation with greater growth potential and productivity, characterized by robust root systems and dense foliage [81,82]. Additionally, such regions tend to exhibit greater biodiversity and ecosystem complexity [83].
In comparison with our study, research utilizing SPEI similarly provides valuable insights into drought impacts. SPEI, which integrates variations in precipitation and evapotranspiration, is effective in accurately assessing drought effects on vegetation. Studies by Yuan and Han, using SPEI to analyze vegetation vulnerability in Central Asia and Xinjiang, showed that areas with lower SPEI values generally experienced greater vegetation loss, whereas more humid regions were less affected [19,84]. This finding aligns with our results, which indicate that the drought of 2012 had a significant impact on vegetation, while the relatively mild drought of 2019 resulted in less vegetation loss. SPEI analysis further supports the view that vegetation recovery is stronger in humid regions due to abundant water resources and favorable climatic conditions that facilitate recovery [85]. Different vegetation species may complement each other, with some demonstrating resilience under drought stress and others maintaining healthy growth to sustain ecosystem stability [86,87]. In addition, regions with relatively humid environments are also suitable for human habitation, and the additional water supplied by humans during vegetation drought is a significant factor in preventing vegetation loss [88].
4.3. The Impact of Climate Regions on Vegetation Restoration
Vegetation is prone to losses during periods of drought [89]. However, once drought conditions ameliorate, vegetation that has not undergone complete mortality typically exhibits a certain level of recovery capability [90]. We evaluated vegetation recovery in arid regions of Central Asia using four indices representing different ecological significance as well as our self-developed RSVI. The distributions of vegetation recovery during the post-drought periods in 2012 and 2019 showed a high degree of similarity (Figure 7 and Figure 8). However, the five indices exhibited inconsistent results in capturing the dynamics of vegetation recovery (Figure 7a–e and Figure 8a–e). This was primarily due to the varying sensitivities of the selected indices to different vegetation characteristics; for instance, the EVI and FVC are more sensitive to vegetation greenness and coverage, respectively [91,92]. Moreover, certain indices may be more suitable for early-stage vegetation monitoring, while others may be more appropriate for mid-to-late-stage monitoring [93]. This is related to the degree of alignment between the monitoring indices and the changing patterns of vegetation recovery during the post-drought restoration process. Furthermore, discrepancies in monitoring results can also arise from variations in data sources and spatial resolutions. In our study, all the indices utilized are based on MODIS data, and compared to other studies focused on large-scale regions or global analyses, the differences in spatial resolution are relatively minor. Therefore, errors in this regard are of less concern in our investigation.
Certainly, the vegetation recovery period after drought varies across different climatic regions. In our study, a gradual decrease in the vegetation recovery period was observed as we transitioned from arid to humid climates (Figure 9 and Figure 10). This is consistent with findings by Cao et al., who investigated meteorological and agricultural droughts in northwestern China. They reported differences in drought resilience across various climate zones and vegetation types and highlighted that vegetation recovery is closely linked to the specific sensitivities and unique characteristics of the local drought environment [94]. This observation aligns closely with our study results. This phenomenon could be attributed to the limited water supply in arid regions, where moisture constraints are more severe during drought, thereby hindering vegetation growth and metabolism [95,96]. Prolonged drought can lead to soil moisture deficits, soil erosion, and nutrient loss [97,98]. Even after drought ends and rainfall replenishes moisture, the soil requires ample time to recover to its original levels [99]. The survival strategies of vegetation during drought differ from those under well-watered conditions, and when the environmental conditions shift between dry and wet conditions, vegetation needs time to adjust its water balance and survival strategies, including its community structure [100]. Conversely, regions with humid climates receive sufficient precipitation and have strong soil water storage capacity, allowing them to retain some moisture even during drought periods [101]. Typically, humid areas have suitable temperatures and greater vegetation diversity, causing them to be better adapted to wetter environments [102,103]. After drought ends, these characteristics provide better growth conditions for vegetation, promoting photosynthesis and metabolism and thus accelerating the vegetation recovery process.
4.4. The Impact of Vegetation Type on Vegetation Recovery
When studying vegetation at regional or global scales, it is essential to consider the differences between vegetation types, as this factor significantly influences the vegetation recovery period after drought [104,105]. In our study, we observed that croplands had the shortest recovery period, followed by grasslands, while forests exhibited the longest recovery period (Figure 9). The results from Wu et al.‘s study, which used SPEI and NDVI to quantitatively assess the impact of meteorological drought on vegetation loss and recovery, are consistent with our findings. Specifically, their study found that grasslands required less time to recover from vegetation loss compared to forests [76]. The shorter recovery period observed in croplands was primarily attributed to human interventions, as croplands have strong economic significance, leading to increased attention given to their management. Soil improvement practices, such as enhancing fertility and water retention capacity, have been implemented in croplands [106]. Additionally, the selection of crop varieties with greater drought resistance [107] and the implementation of irrigation during drought periods contribute to reduced drought impact on crops and facilitate rapid recovery of drought-affected crops after drought ends [108,109]. The shorter recovery period of grasslands after drought was primarily due to the characteristics of herbaceous plants, which generally have shorter lifespans and faster growth rates. Grassland communities exhibit rich species diversity [110], providing them with strong adaptability to environmental changes and the ability to readily access direct rainfall replenishment, thereby leading to a shorter recovery period after drought [111,112]. In contrast, forests, which have relatively slower growth rates than regions with herbaceous plants, experience severe damage to the root systems of shrubs and trees under drought stress, necessitating a longer period to return to their original state [113,114]. The soil in forests is deeper but holds less water, making water reabsorption and utilization more challenging [115]. Moreover, forest ecosystems are complex and involve intricate relationships among plants, animals, and microorganisms. The restoration of ecological relationships within forests requires a longer recovery period [116,117,118] if they are to rely on their own capacities for repair.
4.5. The Main Factors Affecting Vegetation Change
In our analysis of vegetation sensitivity to drought and climate factors (temperature and precipitation) in Central Asia, we found that in the drier year of 2012, vegetation loss was primarily attributed to precipitation; whereas in 2019, the influence of temperature was more dominant. In their research investigating the effects of Central Asian drought and climate factors on vegetation from 1982 to 2020, Liu et al. (2023) concluded that both drought occurrences and climate variables (such as temperature and precipitation) significantly impacted vegetation [20]. These findings align with the results of our own drought attribution analysis conducted for 2012. However, one notable difference is that our analysis indicated a greater influence of climate factors, particularly in 2012. During severe drought, we speculate that the vegetation might have been subject to the influence of both internal and external factors. Vegetation that would have naturally perished could have been restrained by certain mechanisms, or the loss may have been compensated for by the proliferation of other vegetation. This phenomenon is more plausibly linked to human activities, specifically the implementation of irrigation measures and ecological conservation and restoration projects [119,120].
4.6. Limitations of the RSVI
The RSVI we developed shows great potential in terms of correlation and consistency, but there are also certain limitations in some aspects (Figure 14 and Figure 15). In regions with Mediterranean, subhumid, humid, and very humid climates, the RSVI exhibited better correlations with the TVDI. Conversely, in arid and semiarid climate regions, the correlation was relatively weak. We speculate that the sparse vegetation in arid and semiarid regions, primarily consisting of desert grasslands, is heavily influenced by soil background effects [121]. Moreover, among the different vegetation types, grasslands and croplands demonstrated stronger correlations, which could be attributed to reasons similar to those observed in arid regions, where forest samples were limited and mostly comprised sparsely growing shrubs highly impacted by the soil background. To address these limitations, incorporating indices such as the soil-adjusted vegetation index (SAVI) or the transformed soil-adjusted vegetation index (TSAVI), which can mitigate some of the soil background effects, may yield improved results [122]. These considerations are important for enhancing the applicability and accuracy of the RSVI in diverse environmental contexts.
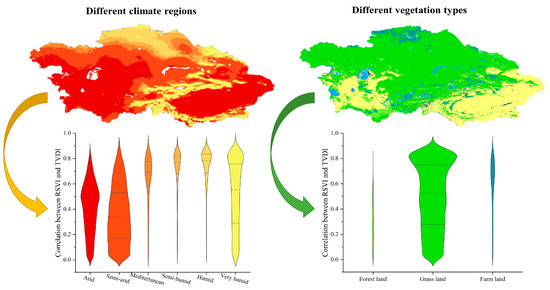
Figure 15.
Correlation performance of RSVI and TVDI in different climate regions and vegetation types.
While the RSVI has shown promise, it is important to recognize that its application may have limitations not only in arid and semiarid regions but also in other climatic regions and across various vegetation types. For instance, in tropical regions with dense forests, the index might be less effective due to the complex structure of the vegetation, which can obscure the soil–vegetation interactions that RSVI relies upon. Additionally, in temperate regions where seasonal variations significantly influence vegetation dynamics, the RSVI might need to be adjusted or complemented with other indices that account for seasonal phenology. For example, the integration of temporal data could help in differentiating between natural vegetation changes and stress-induced variations. Furthermore, the index might face challenges in wetlands or areas with significant water bodies, where the spectral signals could be confounded by water reflectance or sub-surface vegetation [123]. Addressing these limitations in future research will require a multifaceted approach. One potential solution is to tailor the RSVI by incorporating additional indices that are specifically sensitive to the unique environmental conditions of different regions. For example, in tropical regions, including indices that account for leaf area index (LAI) or canopy density could improve the performance of RSVI [124]. In temperate regions, incorporating phenological indices could help adjust for seasonal variations [125]. Additionally, the use of hyperspectral imagery, which offers finer spectral resolution, could allow for the detection of subtle vegetation and soil interactions that are not captured by traditional multispectral indices [126]. By refining the RSVI to account for these regional and vegetation-specific factors, its applicability and accuracy can be significantly enhanced.
Furthermore, an emerging area of interest in improving vegetation monitoring, particularly under drought conditions, is the use of Solar-Induced Fluorescence (SIF) remote sensing. SIF provides a direct measurement of photosynthetic activity, offering a valuable tool for assessing vegetation health under varying environmental conditions, including droughts [127]. In the study by Wu et al., which utilized SIF to track canopy photosynthesis under drought conditions in a semiarid grassland, the potential of SIF to enhance drought monitoring was highlighted [128]. The research demonstrated that SIF can effectively capture the physiological status of vegetation, particularly under stress conditions such as drought, where traditional indices like RSVI may not fully reflect the extent of vegetation stress. Integrating SIF data into the RSVI framework could increase its sensitivity to drought conditions, providing a more robust tool for monitoring vegetation health in regions prone to water scarcity. To summarize, the incorporation of multiple vegetation-related indices in constructing a novel evaluation index holds great potential to enhance monitoring effectiveness. This direction presents an area for further exploration in our future research endeavors.
5. Conclusions
This study is based on four widely used satellite-derived vegetation monitoring indices (EVI, FVC, GPP, and LAI) and proposes a novel vegetation index, the RSVI, constructed by considering the other four distinct ecological significance indices. The assessment focused on evaluating vegetation losses caused by aridity and the recovery period of vegetation after drought in Central Asia by employing the five indices. During drought years, vegetation experienced varying degrees of aridity, ranging from mild to severe, in arid, semiarid, and Mediterranean climates, while generally exhibiting mild aridity in wet and very wet climates. Vegetation that remained in a long-term state of mild drought exhibited the most pronounced response during drought events. Under moist climate conditions, the recovery period of vegetation was shorter, and there was a decreasing trend in the required recovery period when transitioning from arid to wet climates. Different vegetation types displayed characteristic recovery periods, with croplands showing the shortest recovery period and forests exhibiting the longest recovery period. The primary reason for vegetation loss in drought years is mainly attributed to the influence of climatic factors. The RSVI developed in this study demonstrates high sensitivity, correlation, and interpretability in dry–wet changing environments, showing great potential for assessing the impact of drought on vegetation.
Supplementary Materials
The following supporting information can be downloaded at: https://www.mdpi.com/article/10.3390/rs16224189/s1, Figure S1: Two-dimensional scatter plots of vegetation in the 2019 Central Asian region within grids affected by drought in relation to temperature, precipitation, and TVDI changes; Figure S2: Two-dimensional scatter plots of vegetation in grids in the 2019 Central Asian region where no drought occurred in relation to temperature, precipitation, and TVDI changes.
Author Contributions
W.H.: Conceptualization, methodology, software, writing—review and editing; J.Z.: writing—review and editing, visualization, supervision, funding; J.G.: resources, supervision; Y.L.: conceptualization, software; L.L.: methodology, resources, formal analysis, supervision; C.H.: data curation, investigation; J.L.: validation, project administration; C.L.: data curation; X.M.: formal analysis, software; R.T.: conceptualization, validation, project administration. All authors have read and agreed to the published version of the manuscript.
Funding
This research was funded by the Key Laboratory of Xinjiang Science and Technology Department (No. 2022D04009) and the Xinjiang ‘Tianshan Yingcai’ cultivation plan (No. 2023SNGGGGCC004). We are grateful for the support provided by the autonomous region’s joint industry–university–research postgraduate training base, China’s Xinjiang Grassland Station.
Institutional Review Board Statement
Not applicable.
Informed Consent Statement
Not applicable.
Data Availability Statement
The data presented in this study are available on request from the corresponding author.
Conflicts of Interest
The authors declare no conflicts of interest.
References
- Gaitán, J.J.; Oliva, G.E.; Bran, D.E.; Maestre, F.T.; Aguiar, M.R.; Jobbágy, E.G.; Buono, G.G.; Ferrante, D.; Nakamatsu, V.B.; Ciari, G.; et al. Vegetation Structure Is as Important as Climate for Explaining Ecosystem Function across Patagonian Rangelands. J. Ecol. 2014, 102, 1419–1428. [Google Scholar] [CrossRef]
- Hoek van Dijke, A.J.; Mallick, K.; Schlerf, M.; Machwitz, M.; Herold, M.; Teuling, A.J. Examining the Link Between Vegetation Leaf Area and Land–Atmosphere Exchange of Water, Energy, and Carbon Fluxes Using FLUXNET Data. Biogeosciences 2020, 17, 4443–4457. [Google Scholar] [CrossRef]
- Wortley, L.; Hero, J.-M.; Howes, M. Evaluating Ecological Restoration Success: A Review of the Literature. Restor. Ecol. 2013, 21, 537–543. [Google Scholar] [CrossRef]
- Forzieri, G.; Alkama, R.; Miralles, D.G.; Cescatti, A. Satellites Reveal Contrasting Responses of Regional Climate to the Widespread Greening of Earth. Science 2017, 356, 1180–1184. [Google Scholar] [CrossRef] [PubMed]
- Mottl, O.; Flantua, S.G.A.; Bhatta, K.P.; Felde, V.A.; Giesecke, T.; Goring, S.; Grimm, E.C.; Haberle, S.; Hooghiemstra, H.; Ivory, S.; et al. Global Acceleration in Rates of Vegetation Change over the Past 18,000 Years. Science 2021, 372, 860–864. [Google Scholar] [CrossRef]
- Zhao, L.; Dai, A.; Dong, B. Changes in Global Vegetation Activity and Its Driving Factors during 1982–2013. Agric. For. Meteorol. 2018, 249, 198–209. [Google Scholar] [CrossRef]
- De Keersmaecker, W.; Lhermitte, S.; Tits, L.; Honnay, O.; Somers, B.; Coppin, P. A Model Quantifying Global Vegetation Resistance and Resilience to Short-Term Climate Anomalies and Their Relationship with Vegetation Cover. Glob. Ecol. Biogeogr. 2015, 24, 539–548. [Google Scholar] [CrossRef]
- Clarke, B.; Otto, F.; Stuart-Smith, R.; Harrington, L. Extreme Weather Impacts of Climate Change: An Attribution Perspective. Environ. Res. Clim. 2022, 1, 012001. [Google Scholar] [CrossRef]
- Gampe, D.; Zscheischler, J.; Reichstein, M.; O’Sullivan, M.; Smith, W.K.; Sitch, S.; Buermann, W. Increasing Impact of Warm Droughts on Northern Ecosystem Productivity over Recent Decades. Nat. Clim. Change 2021, 11, 772–779. [Google Scholar] [CrossRef]
- He, L.; Guo, J.; Yang, W.; Jiang, Q.; Chen, L.; Tang, K. Multifaceted Responses of Vegetation to Average and Extreme Climate Change over Global Drylands. Sci. Total Environ. 2023, 858, 159942. [Google Scholar] [CrossRef]
- Yuan, X.; Wang, Y.; Ji, P.; Wu, P.; Sheffield, J.; Otkin, J.A. A Global Transition to Flash Droughts under Climate Change. Science 2023, 380, 187–191. [Google Scholar] [CrossRef] [PubMed]
- López, J.; Way, D.A.; Sadok, W. Systemic Effects of Rising Atmospheric Vapor Pressure Deficit on Plant Physiology and Productivity. Glob. Chang. Biol. 2021, 27, 1704–1720. [Google Scholar] [CrossRef] [PubMed]
- Grossiord, C.; Buckley, T.N.; Cernusak, L.A.; Novick, K.A.; Poulter, B.; Siegwolf, R.T.W.; Sperry, J.S.; McDowell, N.G. Plant Responses to Rising Vapor Pressure Deficit. New Phytol. 2020, 226, 1550–1566. [Google Scholar] [CrossRef] [PubMed]
- Yuan, W.; Zheng, Y.; Piao, S.; Ciais, P.; Lombardozzi, D.; Wang, Y.; Ryu, Y.; Chen, G.; Dong, W.; Hu, Z.; et al. Increased Atmospheric Vapor Pressure Deficit Reduces Global Vegetation Growth. Sci. Adv. 2019, 5, eaax1396. [Google Scholar] [CrossRef] [PubMed]
- Peters, A.J.; Walter-Shea, E.A.; Ji, L.; Vina, A.; Hayes, M.; Svoboda, M.D. Drought Monitoring with NDVI-Based Standardized Vegetation Index. Photogramm. Eng. Remote Sens. 2002, 68, 71–75. [Google Scholar]
- Wan, Z.; Wang, P.; Li, X. Using MODIS Land Surface Temperature and Normalized Difference Vegetation Index Products for Monitoring Drought in the Southern Great Plains, USA. Int. J. Remote Sens. 2004, 25, 61–72. [Google Scholar] [CrossRef]
- Chen, J.; Shao, Z.; Huang, X.; Zhuang, Q.; Dang, C.; Cai, B.; Zheng, X.; Ding, Q. Assessing the Impact of Drought-Land Cover Change on Global Vegetation Greenness and Productivity. Sci. Total Environ. 2022, 852, 158499. [Google Scholar] [CrossRef]
- Fang, W.; Huang, S.; Huang, Q.; Huang, G.; Wang, H.; Leng, G.; Wang, L.; Li, P.; Ma, L. Bivariate Probabilistic Quantification of Drought Impacts on Terrestrial Vegetation Dynamics in Mainland China. J. Hydrol. 2019, 577, 123980. [Google Scholar] [CrossRef]
- Yuan, Y.; Bao, A.; Jiang, P.; Hamdi, R.; Termonia, P.; De Maeyer, P.; Guo, H.; Zheng, G.; Yu, T.; Prishchepov, A.V. Probabilistic Assessment of Vegetation Vulnerability to Drought Stress in Central Asia. J. Environ. Manag. 2022, 310, 114504. [Google Scholar] [CrossRef]
- Liu, L.; Peng, J.; Li, G.; Guan, J.; Han, W.; Ju, X.; Zheng, J. Effects of Drought and Climate Factors on Vegetation Dynamics in Central Asia from 1982 to 2020. J. Environ. Manag. 2023, 328, 116997. [Google Scholar] [CrossRef]
- Xu, S.; Wang, Y.; Liu, Y.; Li, J.; Qian, K.; Yang, X.; Ma, X. Evaluating the Cumulative and Time-Lag Effects of Vegetation Response to Drought in Central Asia under Changing Environments. J. Hydrol. 2023, 627, 130455. [Google Scholar] [CrossRef]
- Li, P.; Liu, Z.; Zhou, X.; Xie, B.; Li, Z.; Luo, Y.; Zhu, Q.; Peng, C. Combined Control of Multiple Extreme Climate Stressors on Autumn Vegetation Phenology on the Tibetan Plateau under Past and Future Climate Change. Agric. For. Meteorol. 2021, 308–309, 108571. [Google Scholar] [CrossRef]
- Xue, J.; Su, B. Significant Remote Sensing Vegetation Indices: A Review of Developments and Applications. J. Sens. 2017, 2017, e1353691. [Google Scholar] [CrossRef]
- Higgins, S.I.; Conradi, T.; Muhoko, E. Shifts in Vegetation Activity of Terrestrial Ecosystems Attributable to Climate Trends. Nat. Geosci. 2023, 16, 147–153. [Google Scholar] [CrossRef]
- Li, H.; Li, K.; Zhao, X.; Zhao, J. Changes in Vegetation Greenness and Their Influencing Factors in Southern China. Remote Sens. 2022, 14, 3291. [Google Scholar] [CrossRef]
- Shi, S.; Wang, X.; Hu, Z.; Zhao, X.; Zhang, S.; Hou, M.; Zhang, N. Geographic Detector-Based Quantitative Assessment Enhances Attribution Analysis of Climate and Topography Factors to Vegetation Variation for Spatial Heterogeneity and Coupling. Glob. Ecol. Conserv. 2023, 42, e02398. [Google Scholar] [CrossRef]
- Bai, Y.; Li, S.; Liu, M.; Guo, Q. Assessment of Vegetation Change on the Mongolian Plateau over Three Decades Using Different Remote Sensing Products. J. Environ. Manag. 2022, 317, 115509. [Google Scholar] [CrossRef]
- Hu, Q.; Li, T.; Deng, X.; Wu, T.; Zhai, P.; Huang, D.; Fan, X.; Zhu, Y.; Lin, Y.; Xiao, X.; et al. Intercomparison of Global Terrestrial Carbon Fluxes Estimated by MODIS and Earth System Models. Sci. Total Environ. 2022, 810, 152231. [Google Scholar] [CrossRef]
- Parker, G.G. Tamm Review: Leaf Area Index (LAI) Is Both a Determinant and a Consequence of Important Processes in Vegetation Canopies. For. Ecol. Manag. 2020, 477, 118496. [Google Scholar] [CrossRef]
- Zou, X.; Zhu, S.; Mõttus, M. Estimation of Canopy Structure of Field Crops Using Sentinel-2 Bands with Vegetation Indices and Machine Learning Algorithms. Remote Sens. 2022, 14, 2849. [Google Scholar] [CrossRef]
- Berner, L.T.; Goetz, S.J. Satellite Observations Document Trends Consistent with a Boreal Forest Biome Shift. Glob. Change Biol. 2022, 28, 3275–3292. [Google Scholar] [CrossRef] [PubMed]
- Zhou, M.; Li, D.; Liao, K.; Lu, D. Integration of Landsat Time-Series Vegetation Indices Improves Consistency of Change Detection. Int. J. Digit. Earth 2023, 16, 1276–1299. [Google Scholar] [CrossRef]
- Chen, C.; Park, T.; Wang, X.; Piao, S.; Xu, B.; Chaturvedi, R.K.; Fuchs, R.; Brovkin, V.; Ciais, P.; Fensholt, R. China and India Lead in Greening of the World through Land-Use Management. Nat. Sustain. 2019, 2, 122–129. [Google Scholar] [CrossRef] [PubMed]
- Pan, N.; Feng, X.; Fu, B.; Wang, S.; Ji, F.; Pan, S. Increasing Global Vegetation Browning Hidden in Overall Vegetation Greening: Insights from Time-Varying Trends. Remote Sens. Environ. 2018, 214, 59–72. [Google Scholar] [CrossRef]
- Ding, Z.; Peng, J.; Qiu, S.; Zhao, Y. Nearly Half of Global Vegetated Area Experienced Inconsistent Vegetation Growth in Terms of Greenness, Cover, and Productivity. Earths Future 2020, 8, e2020EF001618. [Google Scholar] [CrossRef]
- Piao, S.; Wang, X.; Park, T.; Chen, C.; Lian, X.; He, Y.; Bjerke, J.W.; Chen, A.; Ciais, P.; Tømmervik, H.; et al. Characteristics, Drivers and Feedbacks of Global Greening. Nat. Rev. Earth Environ. 2020, 1, 14–27. [Google Scholar] [CrossRef]
- Liu, Y.; Zhou, R.; Wen, Z.; Khalifa, M.; Zheng, C.; Ren, H.; Zhang, Z.; Wang, Z. Assessing the Impacts of Drought on Net Primary Productivity of Global Land Biomes in Different Climate Zones. Ecol. Indic. 2021, 130, 108146. [Google Scholar] [CrossRef]
- Chen, Q.; Timmermans, J.; Wen, W.; van Bodegom, P.M. A Multi-Metric Assessment of Drought Vulnerability Across Different Vegetation Types Using High Resolution Remote Sensing. Sci. Total Environ. 2022, 832, 154970. [Google Scholar] [CrossRef]
- Liu, X.; Zhu, Z.; Yu, M.; Liu, X. Drought-Induced Productivity and Economic Losses in Grasslands from Inner Mongolia Vary across Vegetation Types. Reg. Environ. Change 2021, 21, 59. [Google Scholar] [CrossRef]
- Vicente-Serrano, S.M.; Gouveia, C.; Camarero, J.J.; Beguería, S.; Trigo, R.; López-Moreno, J.I.; Azorín-Molina, C.; Pasho, E.; Lorenzo-Lacruz, J.; Revuelto, J. Response of Vegetation to Drought Time-Scales across Global Land Biomes. Proc. Natl. Acad. Sci. USA 2013, 110, 52–57. [Google Scholar] [CrossRef]
- Cowan, P.J. Geographic Usage of the Terms Middle Asia and Central Asia. J. Arid Environ. 2007, 69, 359–363. [Google Scholar] [CrossRef]
- Hu, Y.; Hu, Y. Land Cover Changes and Their Driving Mechanisms in Central Asia from 2001 to 2017 Supported by Google Earth Engine. Remote Sens. 2019, 11, 554. [Google Scholar] [CrossRef]
- Li, Z.; Chen, Y.; Li, W.; Deng, H.; Fang, G. Potential Impacts of Climate Change on Vegetation Dynamics in Central Asia. J. Geophys. Res. Atmos. 2015, 120, 12345–12356. [Google Scholar] [CrossRef]
- Yao, J.; Hu, W.; Chen, Y.; Huo, W.; Zhao, Y.; Mao, W.; Yang, Q. Hydro-Climatic Changes and Their Impacts on Vegetation in Xinjiang, Central Asia. Sci. Total Environ. 2019, 660, 724–732. [Google Scholar] [CrossRef] [PubMed]
- Patrick, E. Drought Characteristics and Management in Central Asia and Turkey. In FAO Water Reports; Food and Agriculture Organization UN: Rome, Italy, 2017. [Google Scholar]
- Fan, Z.; Li, S.; Fang, H. Explicitly Identifying the Desertification Change in CMREC Area Based on Multisource Remote Data. Remote Sens. 2020, 12, 3170. [Google Scholar] [CrossRef]
- Li, S.; He, S. The Variation of Net Primary Productivity and Underlying Mechanisms Vary under Different Drought Stress in Central Asia from 1990 to 2020. Agric. For. Meteorol. 2022, 314, 108767. [Google Scholar] [CrossRef]
- Li, S.; He, S.; Xu, Z.; Liu, Y.; von Bloh, W. Desertification Process and Its Effects on Vegetation Carbon Sources and Sinks Vary under Different Aridity Stress in Central Asia during 1990–2020. CATENA 2023, 221, 106767. [Google Scholar] [CrossRef]
- Li, J.; Han, W.; Zheng, J.; Yu, X.; Tian, R.; Liu, L.; Guan, J. Grassland Productivity in Arid Central Asia Depends on the Greening Rate Rather than the Growing Season Length. Sci. Total Environ. 2024, 933, 173155. [Google Scholar] [CrossRef]
- Fathi-Taperasht, A.; Shafizadeh-Moghadam, H.; Kouchakzadeh, M. MODIS-Based Evaluation of Agricultural Drought, Water Use Efficiency and Post-Drought in Iran; Considering the Influence of Heterogeneous Climatic Regions. J. Clean. Prod. 2022, 374, 133836. [Google Scholar] [CrossRef]
- Charalampopoulos, I.; Droulia, F.; Tsiros, I.X. Projecting Bioclimatic Change over the South-Eastern European Agricultural and Natural Areas via Ultrahigh-Resolution Analysis of the de Martonne Index. Atmosphere 2023, 14, 858. [Google Scholar] [CrossRef]
- Wu, W.; Wang, D.; Zhang, D. Aridity Index and Quantile Regression Influences on the Maximum Size-Density Relationship for Coniferous and Broad-Leaved Mixed Forests. For. Ecol. Manag. 2023, 543, 121148. [Google Scholar] [CrossRef]
- Sandholt, I.; Rasmussen, K.; Andersen, J. A Simple Interpretation of the Surface Temperature/Vegetation Index Space for Assessment of Surface Moisture Status. Remote Sens. Environ. 2002, 79, 213–224. [Google Scholar] [CrossRef]
- Rodigheri, G.; Fontana, D.C.; da Luz, L.B.; Dalmago, G.A.; Schirmbeck, L.W.; Schirmbeck, J.; de Gouvêa, J.A.; da Cunha, G.R. TVDI-Based Water Stress Coefficient to Estimate Net Primary Productivity in Soybean Areas. Ecol. Model. 2024, 490, 110636. [Google Scholar] [CrossRef]
- Wan, W.; Liu, Z.; Li, J.; Xu, J.; Wu, H.; Xu, Z. Spatiotemporal Patterns of Maize Drought Stress and Their Effects on Biomass in the Northeast and North China Plain from 2000 to 2019. Agric. For. Meteorol. 2022, 315, 108821. [Google Scholar] [CrossRef]
- Shi, M.; Yuan, Z.; Shi, X.; Li, M.; Chen, F.; Li, Y. Drought Assessment of Terrestrial Ecosystems in the Yangtze River Basin, China. J. Clean. Prod. 2022, 362, 132234. [Google Scholar] [CrossRef]
- Wan, W.; Liu, Z.; Li, K.; Wang, G.; Wu, H.; Wang, Q. Drought Monitoring of the Maize Planting Areas in Northeast and North China Plain. Agric. Water Manag. 2021, 245, 106636. [Google Scholar] [CrossRef]
- Guo, Y.; Han, L.; Zhang, D.; Sun, G.; Fan, J.; Ren, X. The Factors Affecting the Quality of the Temperature Vegetation Dryness Index (TVDI) and the Spatial–Temporal Variations in Drought from 2011 to 2020 in Regions Affected by Climate Change. Sustainability 2023, 15, 11350. [Google Scholar] [CrossRef]
- Bian, Z.; Roujean, J.L.; Fan, T.; Dong, Y.; Hu, T.; Cao, B.; Li, H.; Du, Y.; Xiao, Q.; Liu, Q. An Angular Normalization Method for Temperature Vegetation Dryness Index (TVDI) in Monitoring Agricultural Drought. Remote Sens. Environ. 2023, 284, 113330. [Google Scholar] [CrossRef]
- Fan, F.; Xiao, C.; Feng, Z.; Yang, Y. Impact of Human and Climate Factors on Vegetation Changes in Mainland Southeast Asia and Yunnan Province of China. J. Clean. Prod. 2023, 415, 137690. [Google Scholar] [CrossRef]
- Zhang, Y.; She, J.; Long, X.; Zhang, M. Spatio-Temporal Evolution and Driving Factors of Eco-Environmental Quality Based on RSEI in Chang-Zhu-Tan Metropolitan Circle, Central China. Ecol. Indic. 2022, 144, 109436. [Google Scholar] [CrossRef]
- Schwalm, C.R.; Anderegg, W.R.L.; Michalak, A.M.; Fisher, J.B.; Biondi, F.; Koch, G.; Litvak, M.; Ogle, K.; Shaw, J.D.; Wolf, A.; et al. Global Patterns of Drought Recovery. Nature 2017, 548, 202–205. [Google Scholar] [CrossRef] [PubMed]
- Shi, S.; Yao, F.; Zhang, J.; Yang, S. Evaluation of Temperature Vegetation Dryness Index on Drought Monitoring Over Eurasia. IEEE Access 2020, 8, 30050–30059. [Google Scholar] [CrossRef]
- Wigmore, O.; Mark, B.; McKenzie, J.; Baraer, M.; Lautz, L. Sub-Metre Mapping of Surface Soil Moisture in Proglacial Valleys of the Tropical Andes Using a Multispectral Unmanned Aerial Vehicle. Remote Sens. Environ. 2019, 222, 104–118. [Google Scholar] [CrossRef]
- Ding, Y.; Zhang, L.; He, Y.; Cao, S.; Wei, X.; Guo, Y.; Ran, L.; Filonchyk, M. Spatiotemporal Evolution of Agricultural Drought and Its Attribution under Different Climate Zones and Vegetation Types in the Yellow River Basin of China. Sci. Total Environ. 2024, 914, 169687. [Google Scholar] [CrossRef] [PubMed]
- Feldman, A.F.; Short Gianotti, D.J.; Dong, J.; Trigo, I.F.; Salvucci, G.D.; Entekhabi, D. Tropical Surface Temperature Response to Vegetation Cover Changes and the Role of Drylands. Glob. Change Biol. 2023, 29, 110–125. [Google Scholar] [CrossRef]
- Chen, C.; Li, D.; Li, Y.; Piao, S.; Wang, X.; Huang, M.; Gentine, P.; Nemani, R.R.; Myneni, R.B. Biophysical Impacts of Earth Greening Largely Controlled by Aerodynamic Resistance. Sci. Adv. 2020, 6, eabb1981. [Google Scholar] [CrossRef]
- Katul, G.G.; Oren, R.; Manzoni, S.; Higgins, C.; Parlange, M.B. Evapotranspiration: A Process Driving Mass Transport and Energy Exchange in the Soil-Plant-Atmosphere-Climate System. Rev. Geophys. 2012, 50, R3002. [Google Scholar] [CrossRef]
- Dai, A. Drought under Global Warming: A Review. WIREs Clim. Change 2011, 2, 45–65. [Google Scholar] [CrossRef]
- Wilhite, D.A.; Glantz, M.H. Understanding: The Drought Phenomenon: The Role of Definitions. Water Int. 1985, 10, 111–120. [Google Scholar] [CrossRef]
- Zhang, Y.; Liu, X.; Jiao, W.; Wu, X.; Zeng, X.; Zhao, L.; Wang, L.; Guo, J.; Xing, X.; Hong, Y. Spatial Heterogeneity of Vegetation Resilience Changes to Different Drought Types. Earths Future 2023, 11, e2022EF003108. [Google Scholar] [CrossRef]
- He, Q.; Ju, W.; Dai, S.; He, W.; Song, L.; Wang, S.; Li, X.; Mao, G. Drought Risk of Global Terrestrial Gross Primary Productivity Over the Last 40 Years Detected by a Remote Sensing-Driven Process Model. J. Geophys. Res. Biogeosci. 2021, 126, e2020JG005944. [Google Scholar] [CrossRef]
- He, W.; Ju, W.; Schwalm, C.R.; Sippel, S.; Wu, X.; He, Q.; Song, L.; Zhang, C.; Li, J.; Sitch, S.; et al. Large-Scale Droughts Responsible for Dramatic Reductions of Terrestrial Net Carbon Uptake Over North America in 2011 and 2012. J. Geophys. Res. Biogeosci. 2018, 123, 2053–2071. [Google Scholar] [CrossRef]
- Lei, T.; Feng, J.; Lv, J.; Wang, J.; Song, H.; Song, W.; Gao, X. Net Primary Productivity Loss under Different Drought Levels in Different Grassland Ecosystems. J. Environ. Manag. 2020, 274, 111144. [Google Scholar] [CrossRef] [PubMed]
- Wang, Y.; Fu, Z.; Hu, Z.; Niu, S. Tracking Global Patterns of Drought-Induced Productivity Loss Along Severity Gradient. J. Geophys. Res. Biogeosci. 2022, 127, e2021JG006753. [Google Scholar] [CrossRef]
- Wu, C.; Zhong, L.; Yeh, P.J.-F.; Gong, Z.; Lv, W.; Chen, B.; Zhou, J.; Li, J.; Wang, S. An Evaluation Framework for Quantifying Vegetation Loss and Recovery in Response to Meteorological Drought Based on SPEI and NDVI. Sci. Total Environ. 2024, 906, 167632. [Google Scholar] [CrossRef]
- Craine, J.M.; Ocheltree, T.W.; Nippert, J.B.; Towne, E.G.; Skibbe, A.M.; Kembel, S.W.; Fargione, J.E. Global Diversity of Drought Tolerance and Grassland Climate-Change Resilience. Nat. Clim. Change 2013, 3, 63–67. [Google Scholar] [CrossRef]
- McDowell, N.; Pockman, W.T.; Allen, C.D.; Breshears, D.D.; Cobb, N.; Kolb, T.; Plaut, J.; Sperry, J.; West, A.; Williams, D.G.; et al. Mechanisms of Plant Survival and Mortality during Drought: Why Do Some Plants Survive While Others Succumb to Drought? New Phytol. 2008, 178, 719–739. [Google Scholar] [CrossRef]
- Alegre, J.C.; Rao, M.R. Soil and Water Conservation by Contour Hedging in the Humid Tropics of Peru. Agric. Ecosyst. Environ. 1996, 57, 17–25. [Google Scholar] [CrossRef]
- Sweet, S.K.; Wolfe, D.W.; DeGaetano, A.; Benner, R. Anatomy of the 2016 Drought in the Northeastern United States: Implications for Agriculture and Water Resources in Humid Climates. Agric. For. Meteorol. 2017, 247, 571–581. [Google Scholar] [CrossRef]
- Rahman, M.d.S.; Akter, S.; Al-Amin, M. Forest and Agro-Ecosystem Productivity in Bangladesh: A Climate Vegetation Productivity Approach. For. Sci. Technol. 2015, 11, 126–132. [Google Scholar] [CrossRef]
- Rishmawi, K.; Prince, S.D.; Xue, Y. Vegetation Responses to Climate Variability in the Northern Arid to Sub-Humid Zones of Sub-Saharan Africa. Remote Sens. 2016, 8, 910. [Google Scholar] [CrossRef]
- Fei, S.; Jo, I.; Guo, Q.; Wardle, D.A.; Fang, J.; Chen, A.; Oswalt, C.M.; Brockerhoff, E.G. Impacts of Climate on the Biodiversity-Productivity Relationship in Natural Forests. Nat. Commun. 2018, 9, 5436. [Google Scholar] [CrossRef] [PubMed]
- Han, W.; Guan, J.; Zheng, J.; Liu, Y.; Ju, X.; Liu, L.; Li, J.; Mao, X.; Li, C. Probabilistic Assessment of Drought Stress Vulnerability in Grasslands of Xinjiang, China. Front. Plant Sci. 2023, 14, 1143863. [Google Scholar] [CrossRef] [PubMed]
- Ma, M.; Wang, Q.; Zhao, Y.; Liu, R.; Li, E. The Counteracting Effects of Large-Scale Vegetation Restoration and Increased Precipitation on Drought in the Huang-Huai-Hai-Yangtze River Basin. J. Hydrol. 2023, 622, 129733. [Google Scholar] [CrossRef]
- López-Gómez, A.M.; Williams-Linera, G.; Manson, R.H. Tree Species Diversity and Vegetation Structure in Shade Coffee Farms in Veracruz, Mexico. Agric. Ecosyst. Environ. 2008, 124, 160–172. [Google Scholar] [CrossRef]
- Ursino, N.; Callegaro, C. Diversity without Complementarity Threatens Vegetation Patterns in Arid Lands. Ecohydrology 2016, 9, 1187–1195. [Google Scholar] [CrossRef]
- Maracchi, G. Agricultural Drought—A Practical Approach to Definition, Assessment and Mitigation Strategies. In Drought and Drought Mitigation in Europe; Vogt, J.V., Somma, F., Eds.; Progress in Research on Natural and Technological Hazards; Springer: Dordrecht, The Netherlands, 2000; pp. 63–75. ISBN 978-94-015-9472-1. [Google Scholar]
- Guo, W.; Huang, S.; Huang, Q.; Leng, G.; Mu, Z.; Han, Z.; Wei, X.; She, D.; Wang, H.; Wang, Z.; et al. Drought Trigger Thresholds for Different Levels of Vegetation Loss in China and Their Dynamics. Agric. For. Meteorol. 2023, 331, 109349. [Google Scholar] [CrossRef]
- Yang, X.; Xu, X.; Stovall, A.; Chen, M.; Lee, J.-E. Recovery: Fast and Slow—Vegetation Response During the 2012–2016 California Drought. J. Geophys. Res. Biogeosci. 2021, 126, e2020JG005976. [Google Scholar] [CrossRef]
- Liu, H.; Li, X.; Mao, F.; Zhang, M.; Zhu, D.; He, S.; Huang, Z.; Du, H. Spatiotemporal Evolution of Fractional Vegetation Cover and Its Response to Climate Change Based on MODIS Data in the Subtropical Region of China. Remote Sens. 2021, 13, 913. [Google Scholar] [CrossRef]
- Valtonen, A.; Korkiatupa, E.; Holm, S.; Malinga, G.M.; Nakadai, R. Remotely Sensed Vegetation Greening along a Restoration Gradient of a Tropical Forest, Kibale National Park, Uganda. Land Degrad. Dev. 2021, 32, 5166–5177. [Google Scholar] [CrossRef]
- Li, Z.; Chen, Z. Remote Sensing Indicators for Crop Growth Monitoring at Different Scales. In Proceedings of the 2011 IEEE International Geoscience and Remote Sensing Symposium, Vancouver, BC, Canada, 24–29 July 2011; pp. 4062–4065. [Google Scholar]
- Cao, S.; Zhang, L.; He, Y.; Zhang, Y.; Chen, Y.; Yao, S.; Yang, W.; Sun, Q. Effects and Contributions of Meteorological Drought on Agricultural Drought under Different Climatic Zones and Vegetation Types in Northwest China. Sci. Total Environ. 2022, 821, 153270. [Google Scholar] [CrossRef] [PubMed]
- Basu, S.; Ramegowda, V.; Kumar, A.; Pereira, A. Plant Adaptation to Drought Stress. F1000Research 2016, 5. [Google Scholar] [CrossRef] [PubMed]
- Reddy, A.R.; Chaitanya, K.V.; Vivekanandan, M. Drought-Induced Responses of Photosynthesis and Antioxidant Metabolism in Higher Plants. J. Plant Physiol. 2004, 161, 1189–1202. [Google Scholar] [CrossRef] [PubMed]
- Martínez-Mena, M.; Carrillo-López, E.; Boix-Fayos, C.; Almagro, M.; García Franco, N.; Díaz-Pereira, E.; Montoya, I.; de Vente, J. Long-Term Effectiveness of Sustainable Land Management Practices to Control Runoff, Soil Erosion, and Nutrient Loss and the Role of Rainfall Intensity in Mediterranean Rainfed Agroecosystems. CATENA 2020, 187, 104352. [Google Scholar] [CrossRef]
- Zhang, B.; Yang, Y.; Zepp, H. Effect of Vegetation Restoration on Soil and Water Erosion and Nutrient Losses of a Severely Eroded Clayey Plinthudult in Southeastern China. CATENA 2004, 57, 77–90. [Google Scholar] [CrossRef]
- Nicolai-Shaw, N.; Zscheischler, J.; Hirschi, M.; Gudmundsson, L.; Seneviratne, S.I. A Drought Event Composite Analysis Using Satellite Remote-Sensing Based Soil Moisture. Remote Sens. Environ. 2017, 203, 216–225. [Google Scholar] [CrossRef]
- Liu, Y.; Ding, Z.; Chen, Y.; Yan, F.; Yu, P.; Man, W.; Liu, M.; Li, H.; Tang, X. Restored Vegetation Is More Resistant to Extreme Drought Events than Natural Vegetation in Southwest China. Sci. Total Environ. 2023, 866, 161250. [Google Scholar] [CrossRef]
- Wang, X.; Xie, H.; Guan, H.; Zhou, X. Different Responses of MODIS-Derived NDVI to Root-Zone Soil Moisture in Semi-Arid and Humid Regions. J. Hydrol. 2007, 340, 12–24. [Google Scholar] [CrossRef]
- Fjeldsaå, J.; Lovett, J.C. Biodiversity and Environmental Stability. Biodivers. Conserv. 1997, 6, 315–323. [Google Scholar] [CrossRef]
- Márquez-García, M.; Vila, I.; Hinojosa, L.F.; Méndez, M.A.; Carvajal, J.L.; Sabando, M.C. Distribution and Seasonal Fluctuations in the Aquatic Biodiversity of the Southern Altiplano. Limnologica 2009, 39, 314–318. [Google Scholar] [CrossRef][Green Version]
- Fathi-Taperasht, A.; Shafizadeh-Moghadam, H.; Minaei, M.; Xu, T. Influence of Drought Duration and Severity on Drought Recovery Period for Different Land Cover Types: Evaluation Using MODIS-Based Indices. Ecol. Indic. 2022, 141, 109146. [Google Scholar] [CrossRef]
- West, H.; Quinn, N.; Horswell, M. Remote Sensing for Drought Monitoring & Impact Assessment: Progress, Past Challenges and Future Opportunities. Remote Sens. Environ. 2019, 232, 111291. [Google Scholar] [CrossRef]
- Bonanomi, G.; De Filippis, F.; Zotti, M.; Idbella, M.; Cesarano, G.; Al-Rowaily, S.; Abd-ElGawad, A. Repeated Applications of Organic Amendments Promote Beneficial Microbiota, Improve Soil Fertility and Increase Crop Yield. Appl. Soil Ecol. 2020, 156, 103714. [Google Scholar] [CrossRef]
- Luo, L.; Xia, H.; Lu, B.-R. Editorial: Crop Breeding for Drought Resistance. Front. Plant Sci. 2019, 10, 314. [Google Scholar] [CrossRef] [PubMed]
- Dong, X.; Zhang, H. Soil Hydrothermal Balance in Farmland System and Its Response to Human Activities. IOP Conf. Ser. Earth Environ. Sci. 2021, 643, 012007. [Google Scholar] [CrossRef]
- Xu, A.; Yang, L.E.; Yang, W.; Chen, H. Water Conservancy Projects Enhanced Local Resilience to Floods and Droughts over the Past 300 Years at the Erhai Lake Basin, Southwest China. Environ. Res. Lett. 2020, 15, 125009. [Google Scholar] [CrossRef]
- Grace, J.B.; Michael Anderson, T.; Smith, M.D.; Seabloom, E.; Andelman, S.J.; Meche, G.; Weiher, E.; Allain, L.K.; Jutila, H.; Sankaran, M.; et al. Does Species Diversity Limit Productivity in Natural Grassland Communities? Ecol. Lett. 2007, 10, 680–689. [Google Scholar] [CrossRef]
- Plue, J.; Van Gils, B.; De Schrijver, A.; Peppler-Lisbach, C.; Verheyen, K.; Hermy, M. Forest Herb Layer Response to Long-Term Light Deficit along a Forest Developmental Series. Acta Oecologica 2013, 53, 63–72. [Google Scholar] [CrossRef]
- Satyanti, A.; Liantoro, T.; Thomas, M.; Neeman, T.; Nicotra, A.B.; Guja, L.K. Predicting Effects of Warming Requires a Whole-of-Life Cycle Perspective: A Case Study in the Alpine Herb Oreomyrrhis Eriopoda. Conserv. Physiol. 2021, 9, coab023. [Google Scholar] [CrossRef]
- Chang-Yang, C.-H.; Needham, J.; Lu, C.-L.; Hsieh, C.-F.; Sun, I.-F.; McMahon, S.M. Closing the Life Cycle of Forest Trees: The Difficult Dynamics of Seedling-to-Sapling Transitions in a Subtropical Rainforest. J. Ecol. 2021, 109, 2705–2716. [Google Scholar] [CrossRef]
- Wright, S.J.; Kitajima, K.; Kraft, N.J.B.; Reich, P.B.; Wright, I.J.; Bunker, D.E.; Condit, R.; Dalling, J.W.; Davies, S.J.; Díaz, S.; et al. Functional Traits and the Growth–Mortality Trade-off in Tropical Trees. Ecology 2010, 91, 3664–3674. [Google Scholar] [CrossRef] [PubMed]
- Yao, Y.; Liu, Y.; Zhou, S.; Song, J.; Fu, B. Soil Moisture Determines the Recovery Time of Ecosystems from Drought. Glob. Chang. Biol. 2023, 29, 3562–3574. [Google Scholar] [CrossRef] [PubMed]
- Hisano, M.; Searle, E.B.; Chen, H.Y.H. Biodiversity as a Solution to Mitigate Climate Change Impacts on the Functioning of Forest Ecosystems. Biol. Rev. 2018, 93, 439–456. [Google Scholar] [CrossRef] [PubMed]
- Krishna, M.P.; Mohan, M. Litter Decomposition in Forest Ecosystems: A Review. Energy Ecol. Environ. 2017, 2, 236–249. [Google Scholar] [CrossRef]
- Yang, L.; Wei, W.; Chen, L.; Mo, B. Response of Deep Soil Moisture to Land Use and Afforestation in the Semi-Arid Loess Plateau, China. J. Hydrol. 2012, 475, 111–122. [Google Scholar] [CrossRef]
- Jiang, L.; ·Jiapaer, G.; Bao, A.; Guo, H.; Ndayisaba, F. Vegetation Dynamics and Responses to Climate Change and Human Activities in Central Asia. Sci. Total Environ. 2017, 599–600, 967–980. [Google Scholar] [CrossRef]
- Volis, S. Conservation-Oriented Restoration and Its Application to Central Asia. Plant Divers. Cent. Asia 2022, 1, 1–19. [Google Scholar]
- Eisfelder, C.; Kuenzer, C.; Dech, S. Derivation of Biomass Information for Semi-Arid Areas Using Remote-Sensing Data. Int. J. Remote Sens. 2012, 33, 2937–2984. [Google Scholar] [CrossRef]
- Zeng, Y.; Hao, D.; Huete, A.; Dechant, B.; Berry, J.; Chen, J.M.; Joiner, J.; Frankenberg, C.; Bond-Lamberty, B.; Ryu, Y.; et al. Optical Vegetation Indices for Monitoring Terrestrial Ecosystems Globally. Nat. Rev. Earth Environ. 2022, 3, 477–493. [Google Scholar] [CrossRef]
- Ma, S.; Zhou, Y.; Gowda, P.H.; Dong, J.; Zhang, G.; Kakani, V.G.; Wagle, P.; Chen, L.; Flynn, K.C.; Jiang, W. Application of the Water-Related Spectral Reflectance Indices: A Review. Ecol. Indic. 2019, 98, 68–79. [Google Scholar] [CrossRef]
- Fang, H. Canopy Clumping Index (CI): A Review of Methods, Characteristics, and Applications. Agric. For. Meteorol. 2021, 303, 108374. [Google Scholar] [CrossRef]
- Gao, M.; Wang, X.; Meng, F.; Liu, Q.; Li, X.; Zhang, Y.; Piao, S. Three-Dimensional Change in Temperature Sensitivity of Northern Vegetation Phenology. Glob. Chang. Biol. 2020, 26, 5189–5201. [Google Scholar] [CrossRef] [PubMed]
- Mutanga, O.; Masenyama, A.; Sibanda, M. Spectral Saturation in the Remote Sensing of High-Density Vegetation Traits: A Systematic Review of Progress, Challenges, and Prospects. ISPRS J. Photogramm. Remote Sens. 2023, 198, 297–309. [Google Scholar] [CrossRef]
- Wu, L.; Zhang, Y.; Zhang, Z.; Zhang, X.; Wu, Y.; Chen, J.M. Deriving Photosystem-Level Red Chlorophyll Fluorescence Emission by Combining Leaf Chlorophyll Content and Canopy Far-Red Solar-Induced Fluorescence: Possibilities and Challenges. Remote Sens. Environ. 2024, 304, 114043. [Google Scholar] [CrossRef]
- Wu, Y.; Zhang, Z.; Wu, L.; Zhang, Y. Solar-Induced Chlorophyll Fluorescence Tracks Canopy Photosynthesis under Dry Conditions in a Semi-Arid Grassland. Agric. For. Meteorol. 2024, 356, 110174. [Google Scholar] [CrossRef]
Disclaimer/Publisher’s Note: The statements, opinions and data contained in all publications are solely those of the individual author(s) and contributor(s) and not of MDPI and/or the editor(s). MDPI and/or the editor(s) disclaim responsibility for any injury to people or property resulting from any ideas, methods, instructions or products referred to in the content. |
© 2024 by the authors. Licensee MDPI, Basel, Switzerland. This article is an open access article distributed under the terms and conditions of the Creative Commons Attribution (CC BY) license (https://creativecommons.org/licenses/by/4.0/).