Article

What Is Beyond Hyperbola Detection and Characterization in Ground-Penetrating Radar Data?—Implications from the Archaeological Site of Goting, Germany


1
Institute of Geosciences, Christian-Albrechts-University of Kiel, Otto-Hahn-Platz 1, 24118 Kiel, Germany
2
Cluster of Excellence ROOTS, Christian-Albrechts-University of Kiel, 24118 Kiel, Germany
3
NihK—Institute for Historical Coastal Research, Viktoriastraße 26/28, 26382 Wilhelmshaven, Germany
*
Author to whom correspondence should be addressed.
Remote Sens. 2024, 16(21), 4080; https://doi.org/10.3390/rs16214080
Submission received: 10 September 2024 / Revised: 11 October 2024 / Accepted: 25 October 2024 / Published: 31 October 2024
(This article belongs to the Special Issue Advanced Ground-Penetrating Radar (GPR) Technologies and Applications)

Abstract

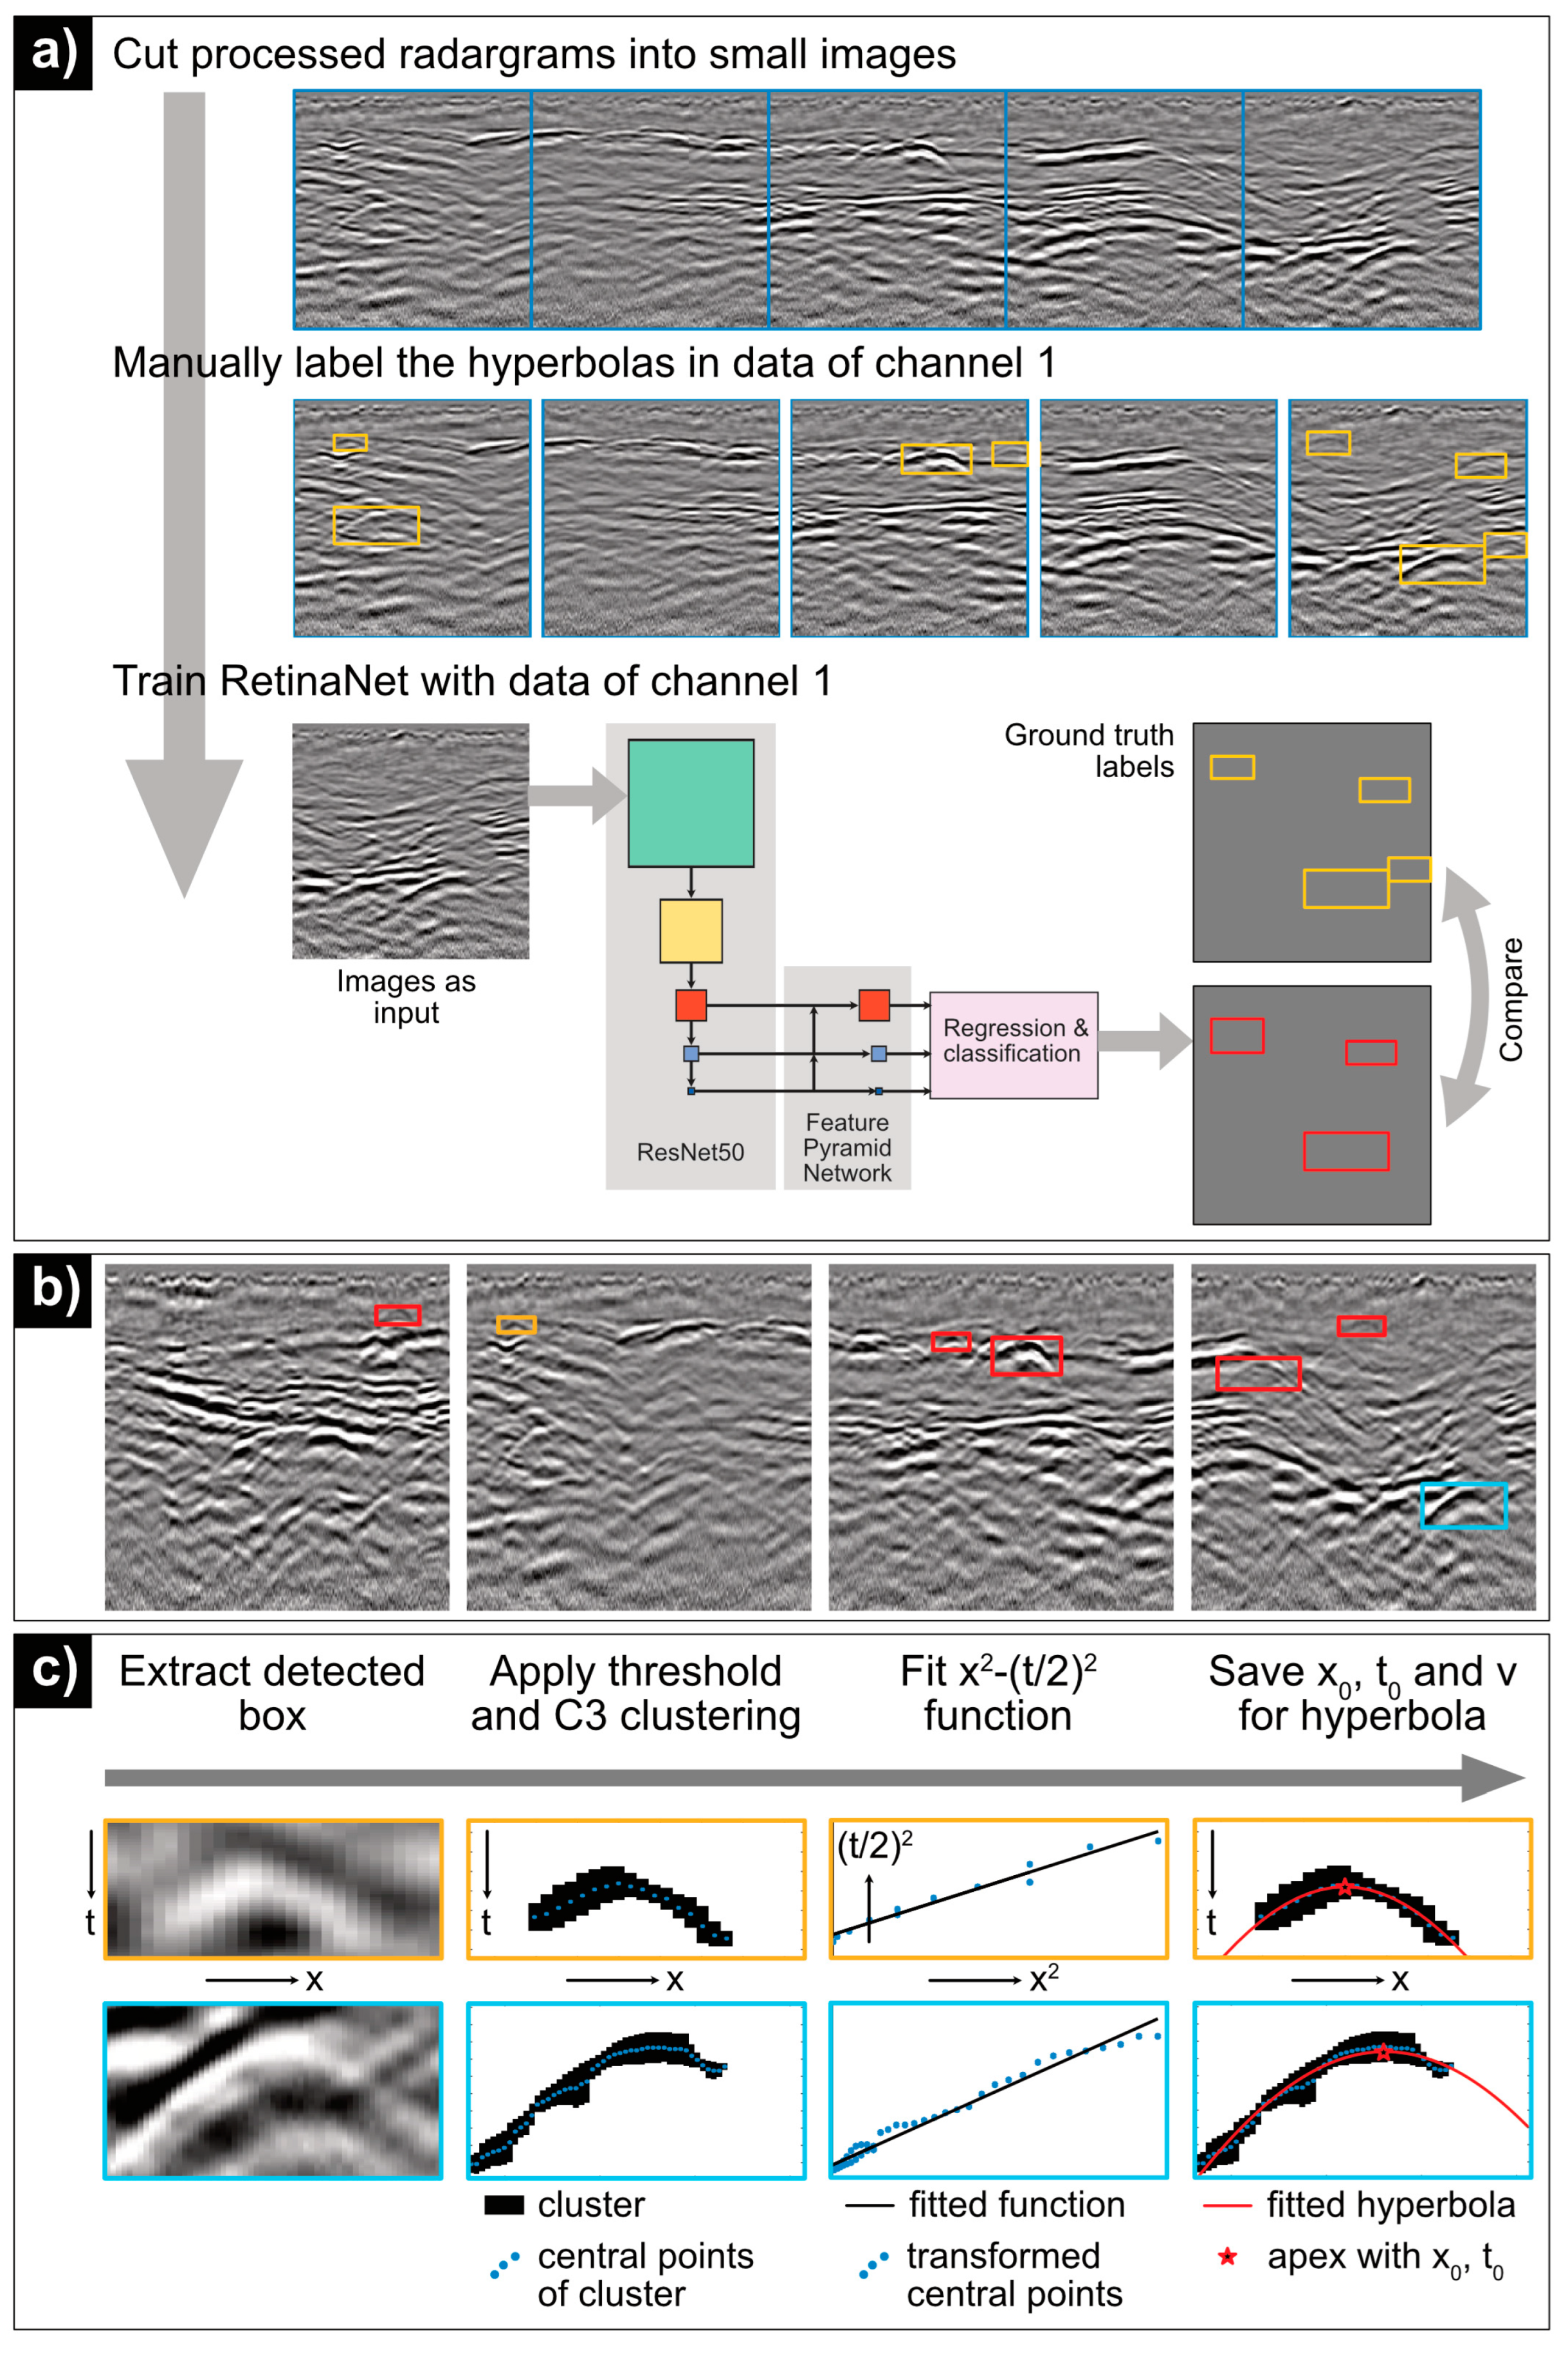
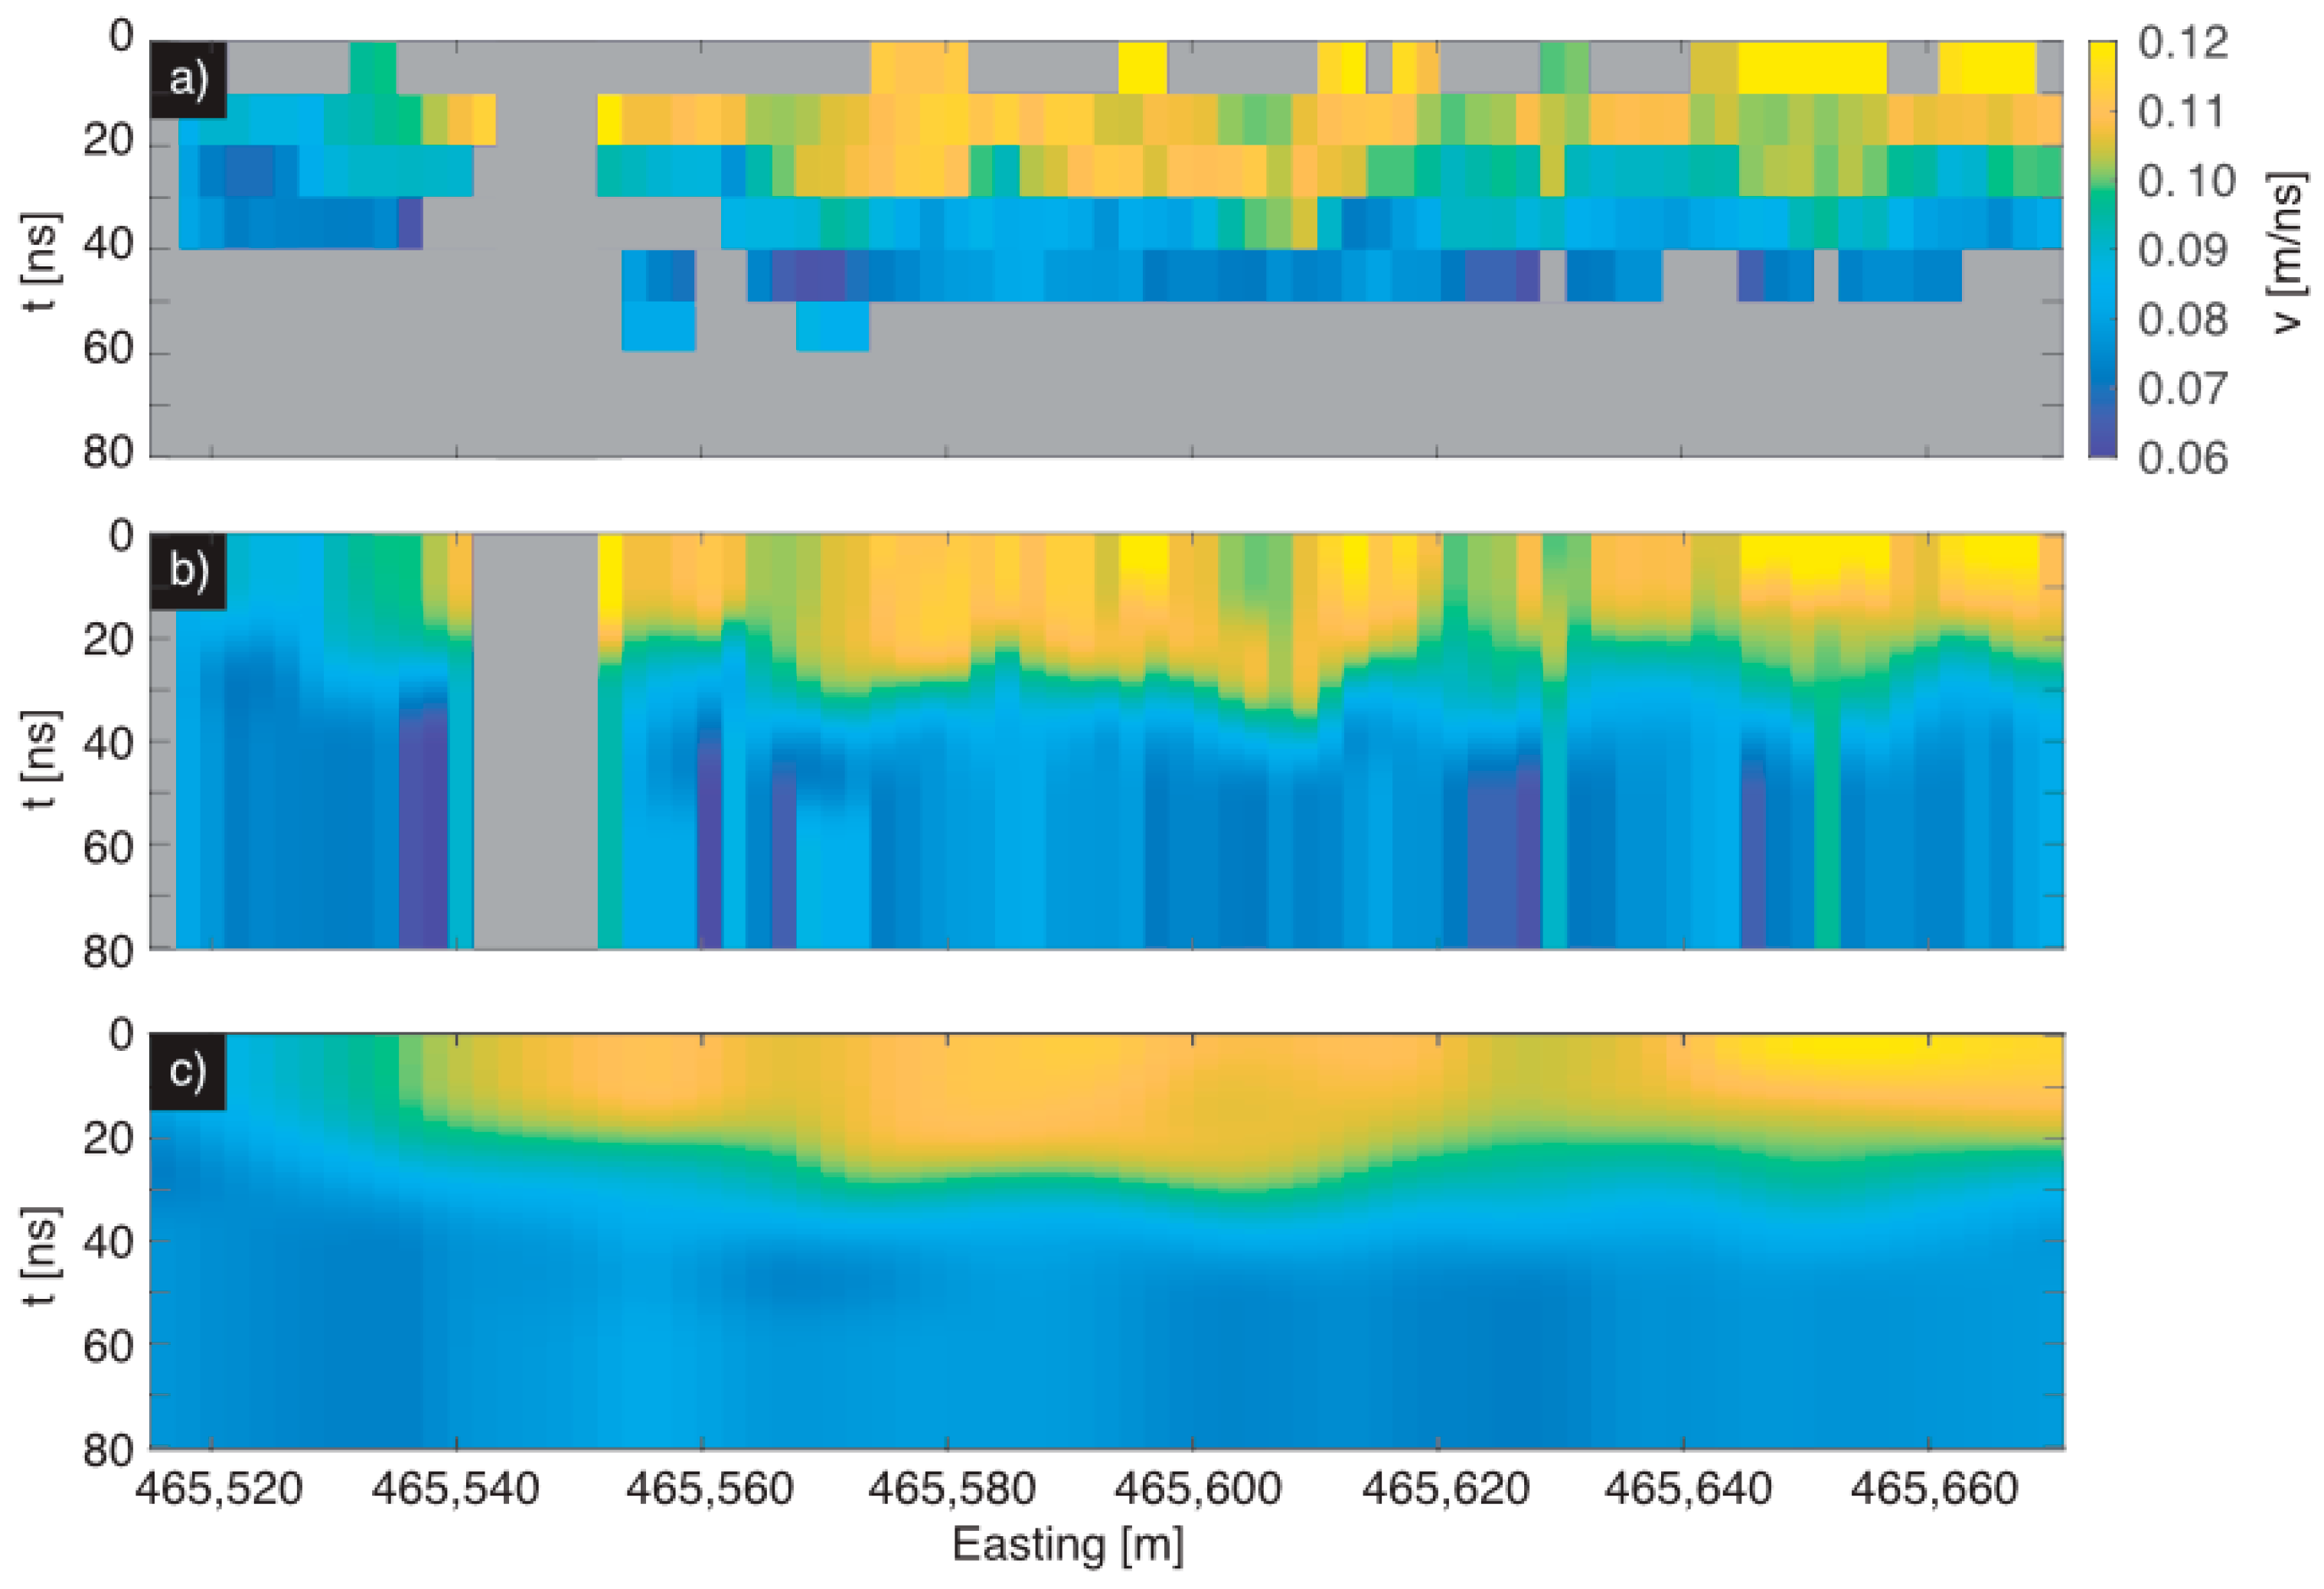
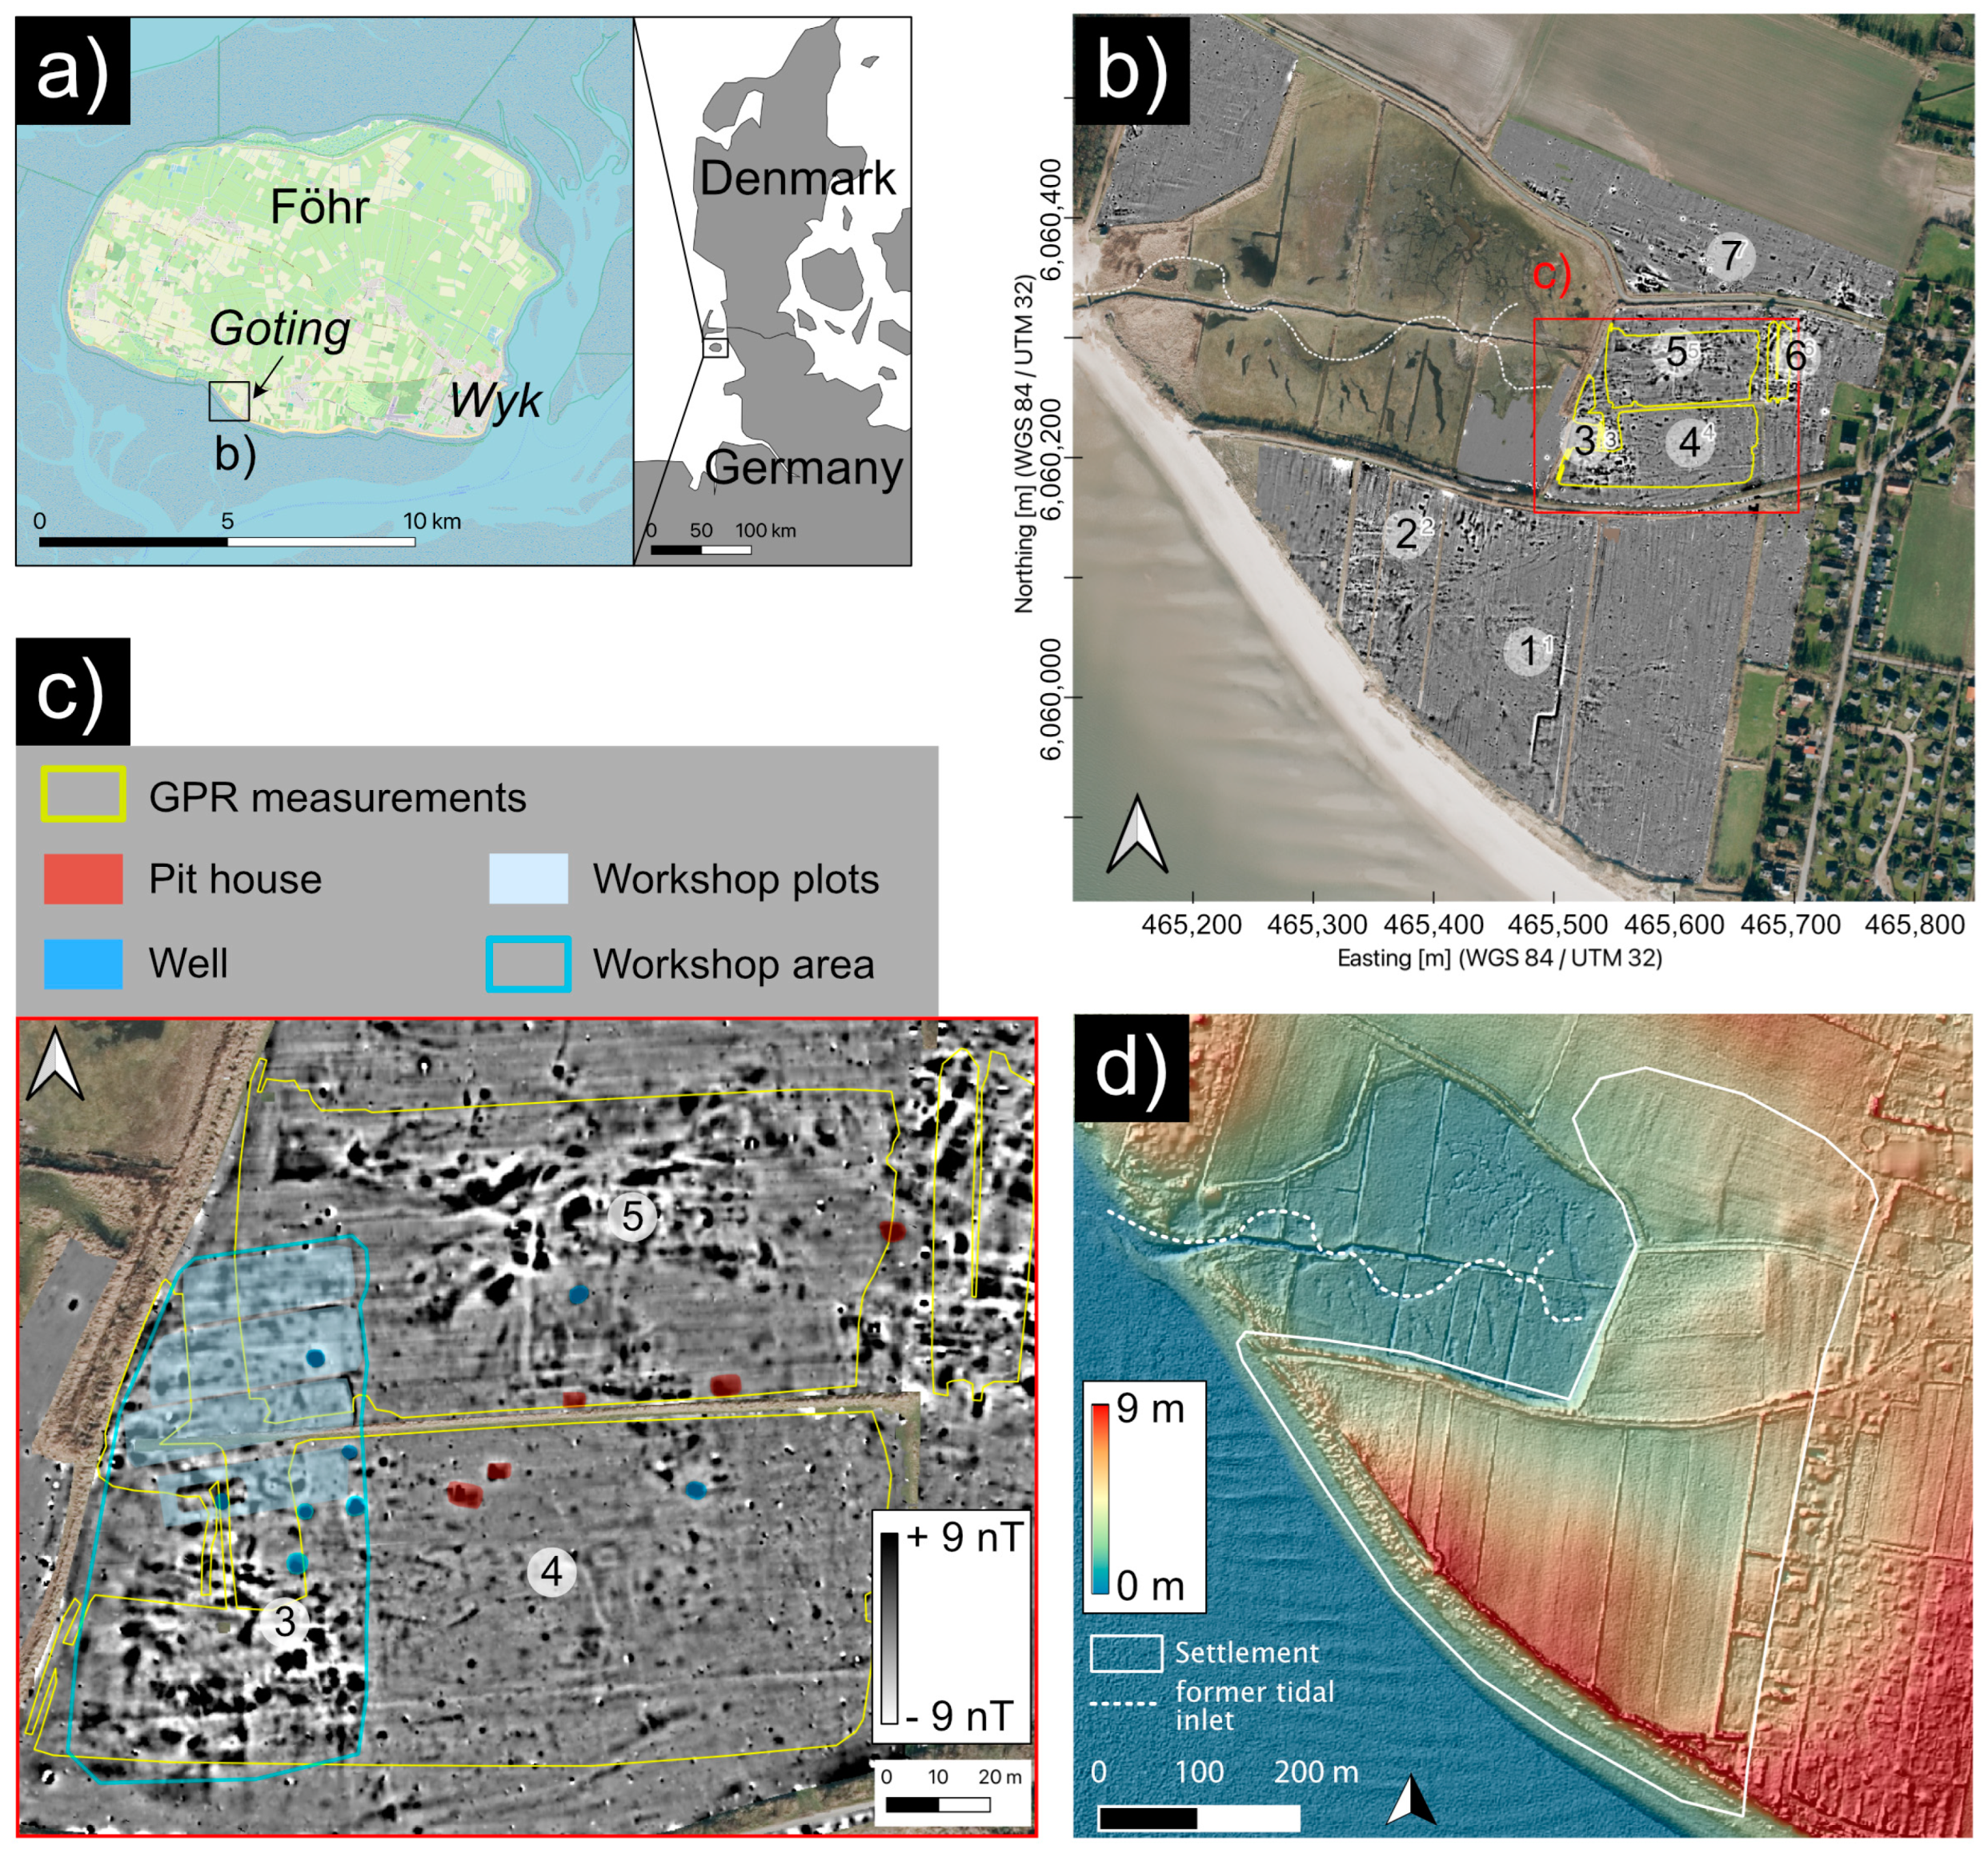
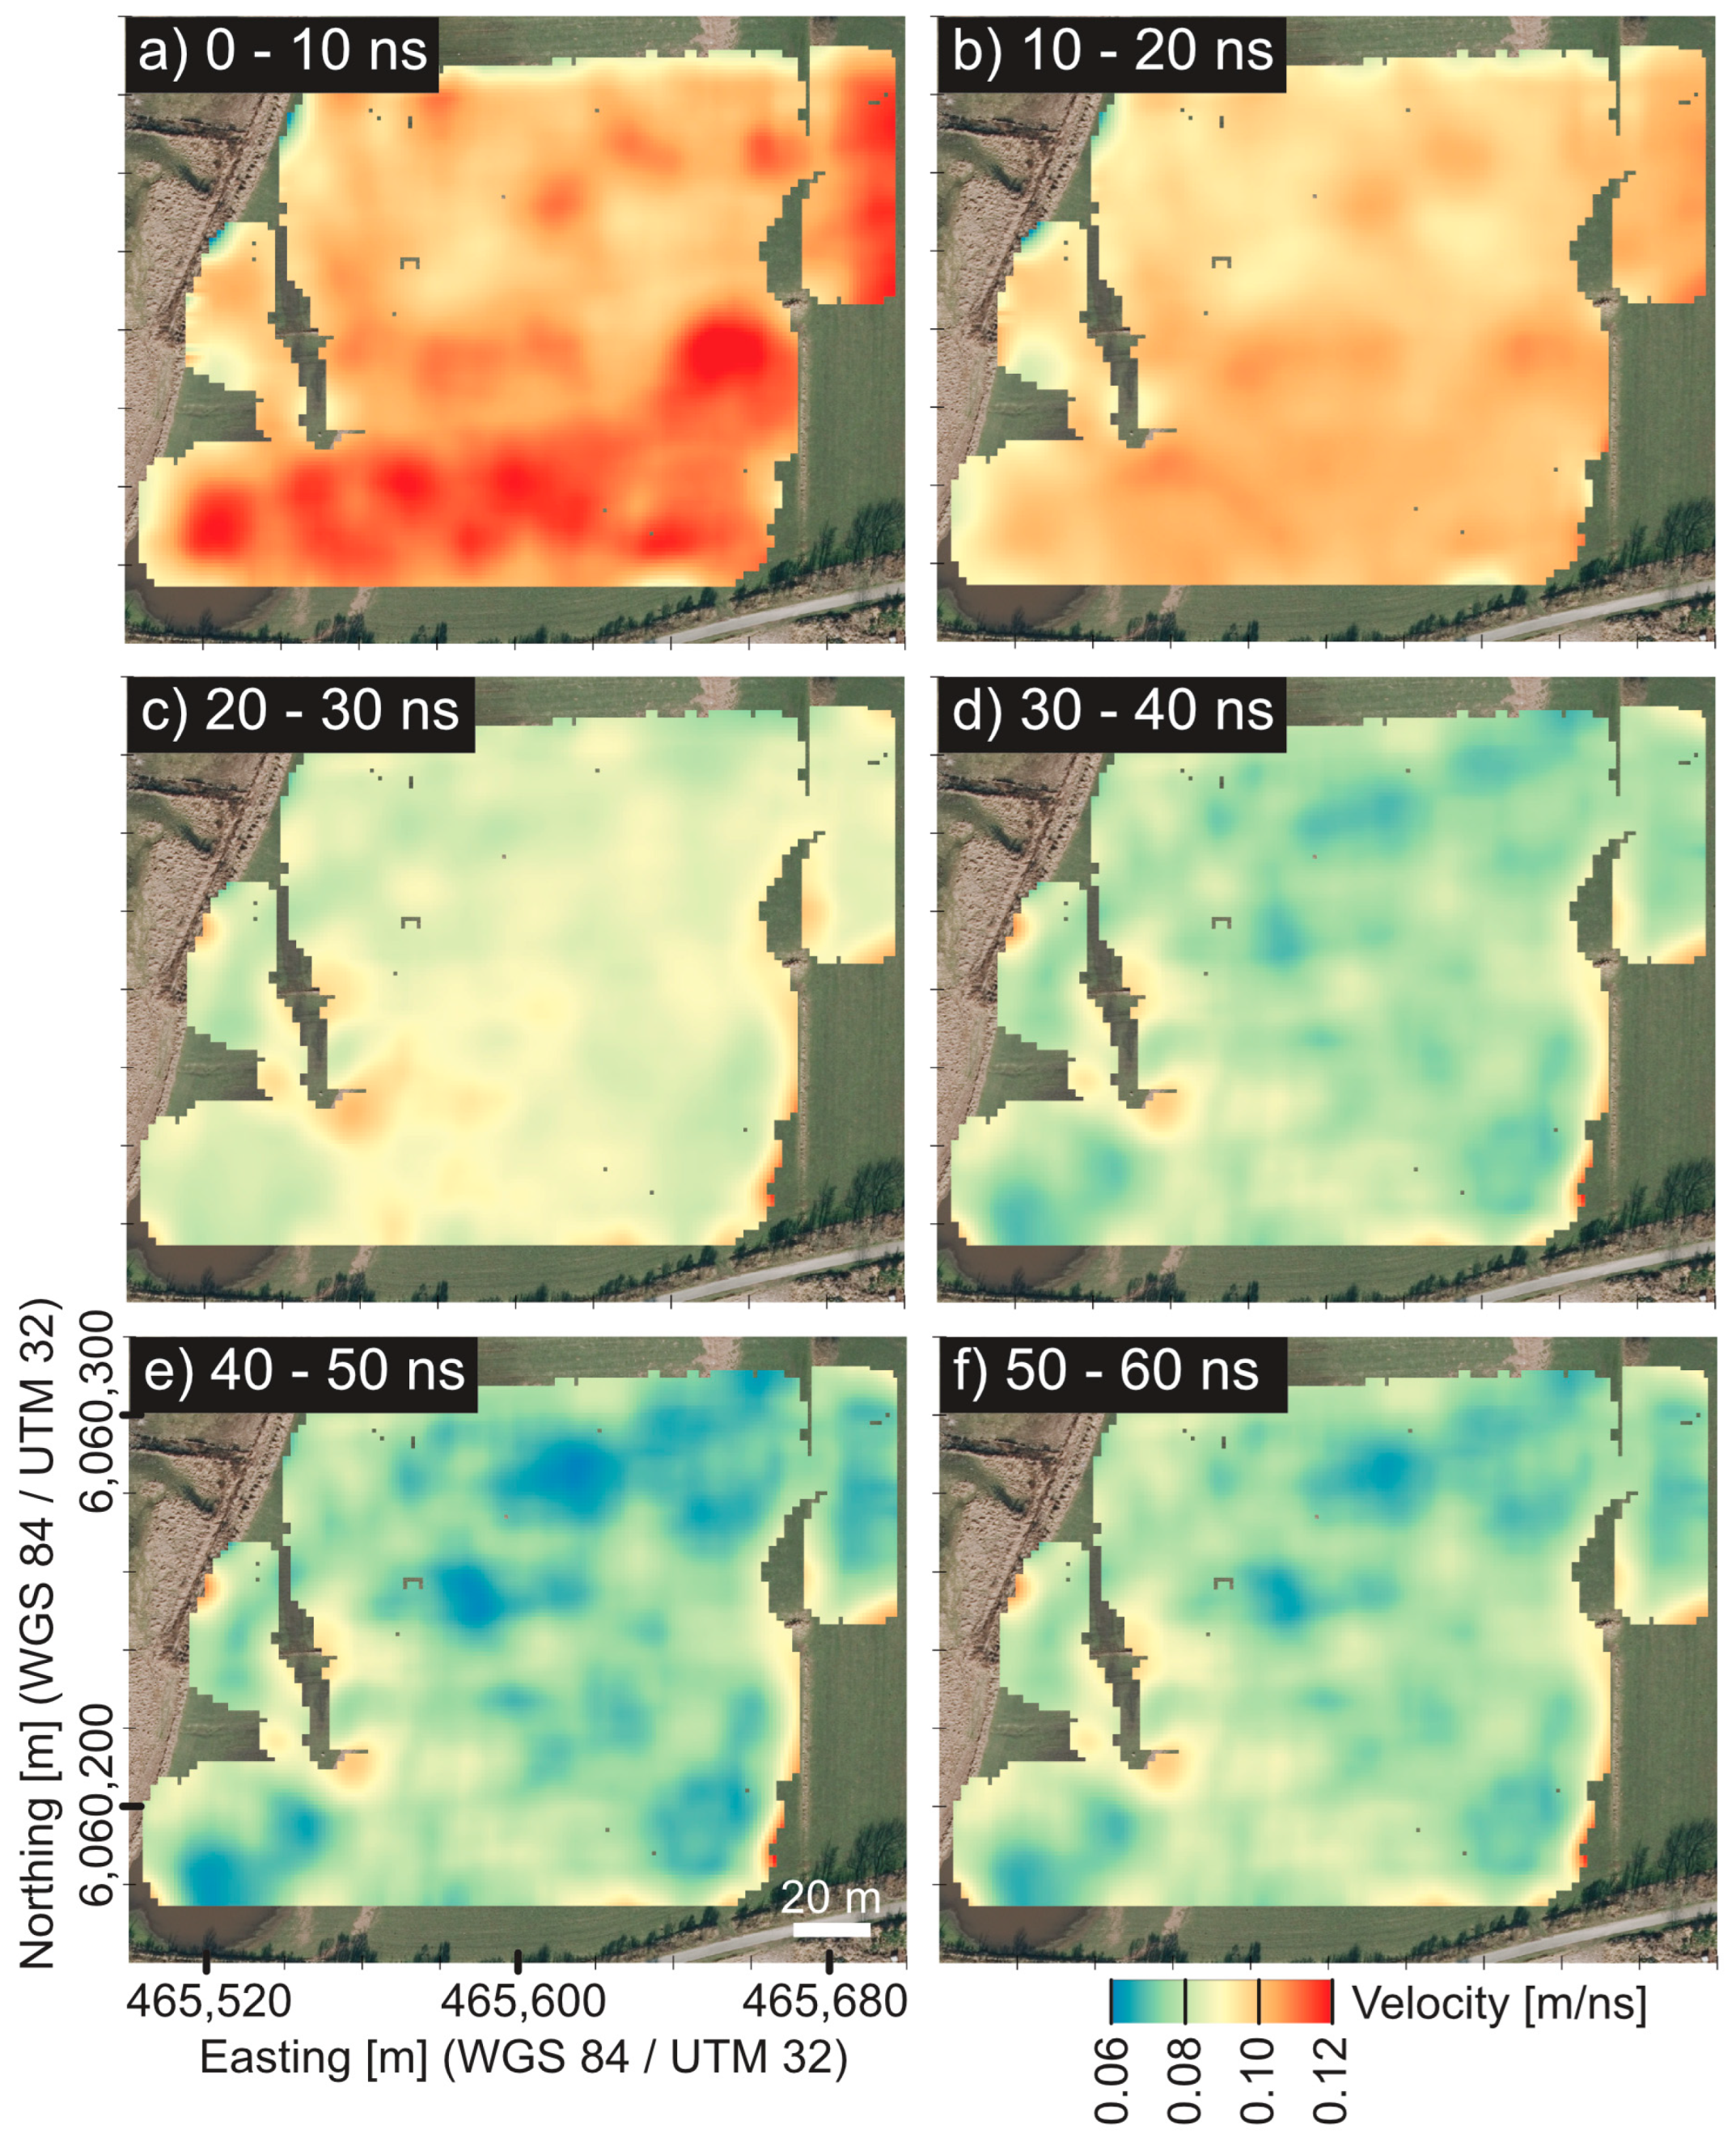
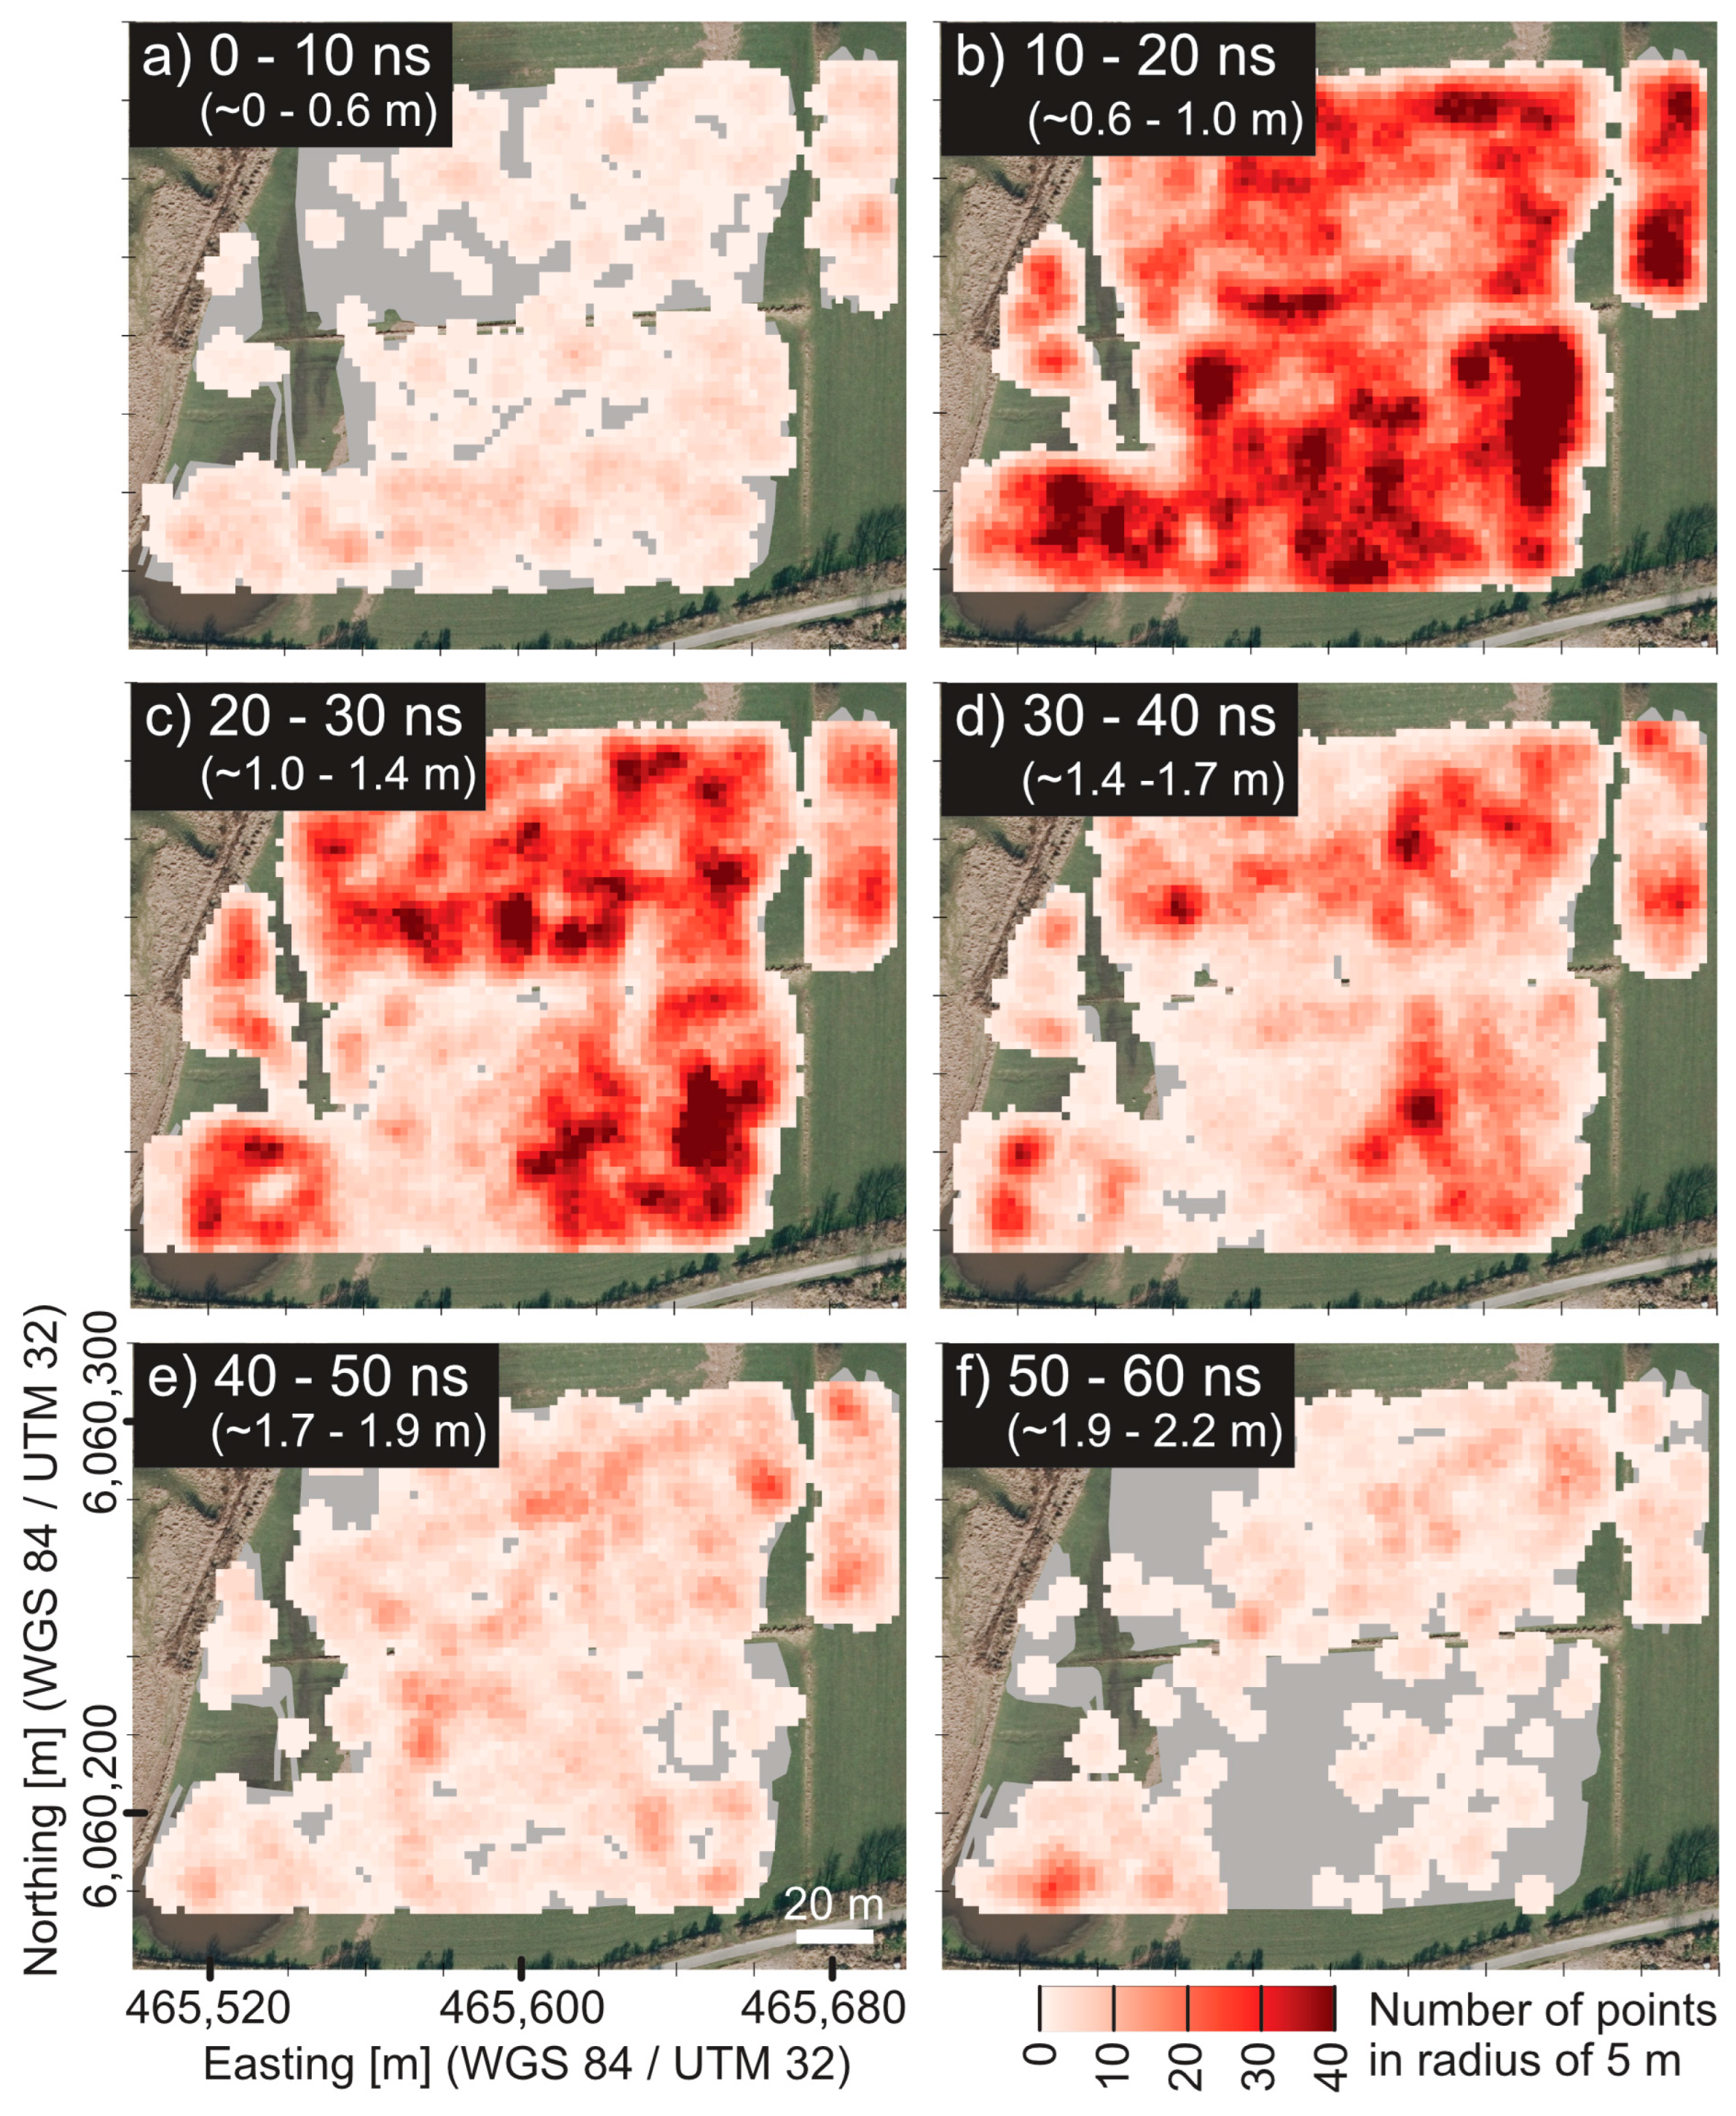
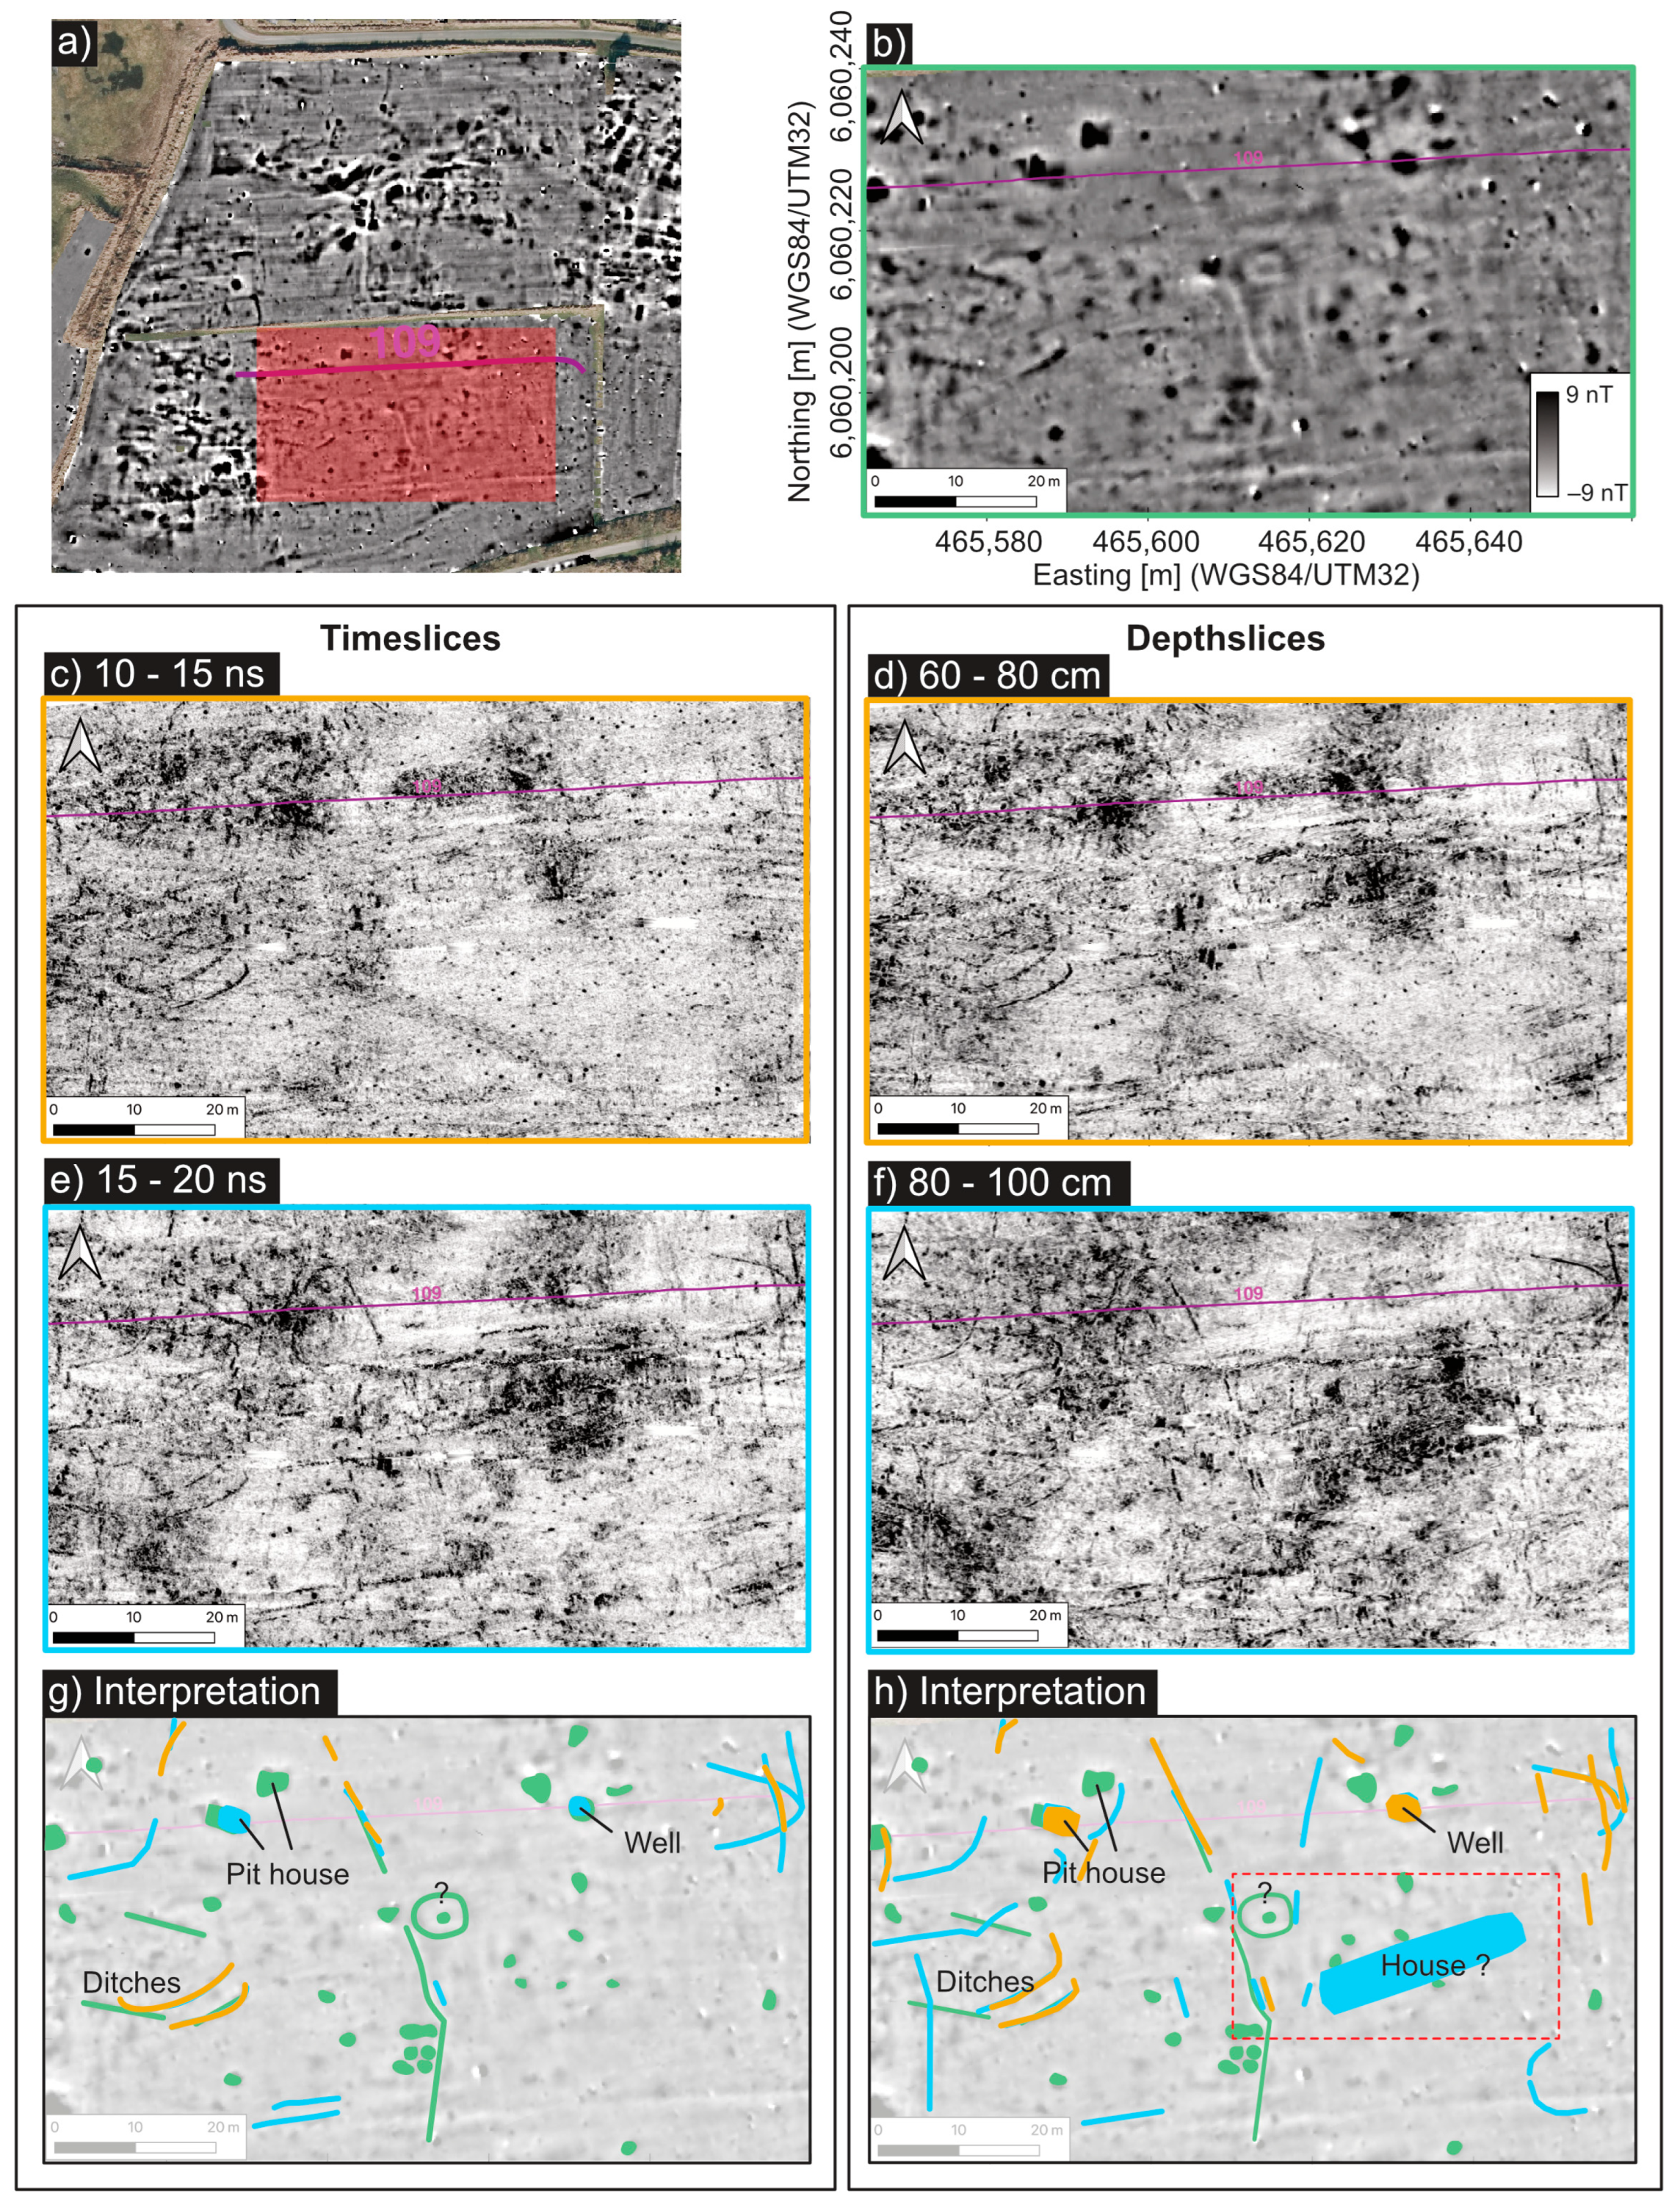
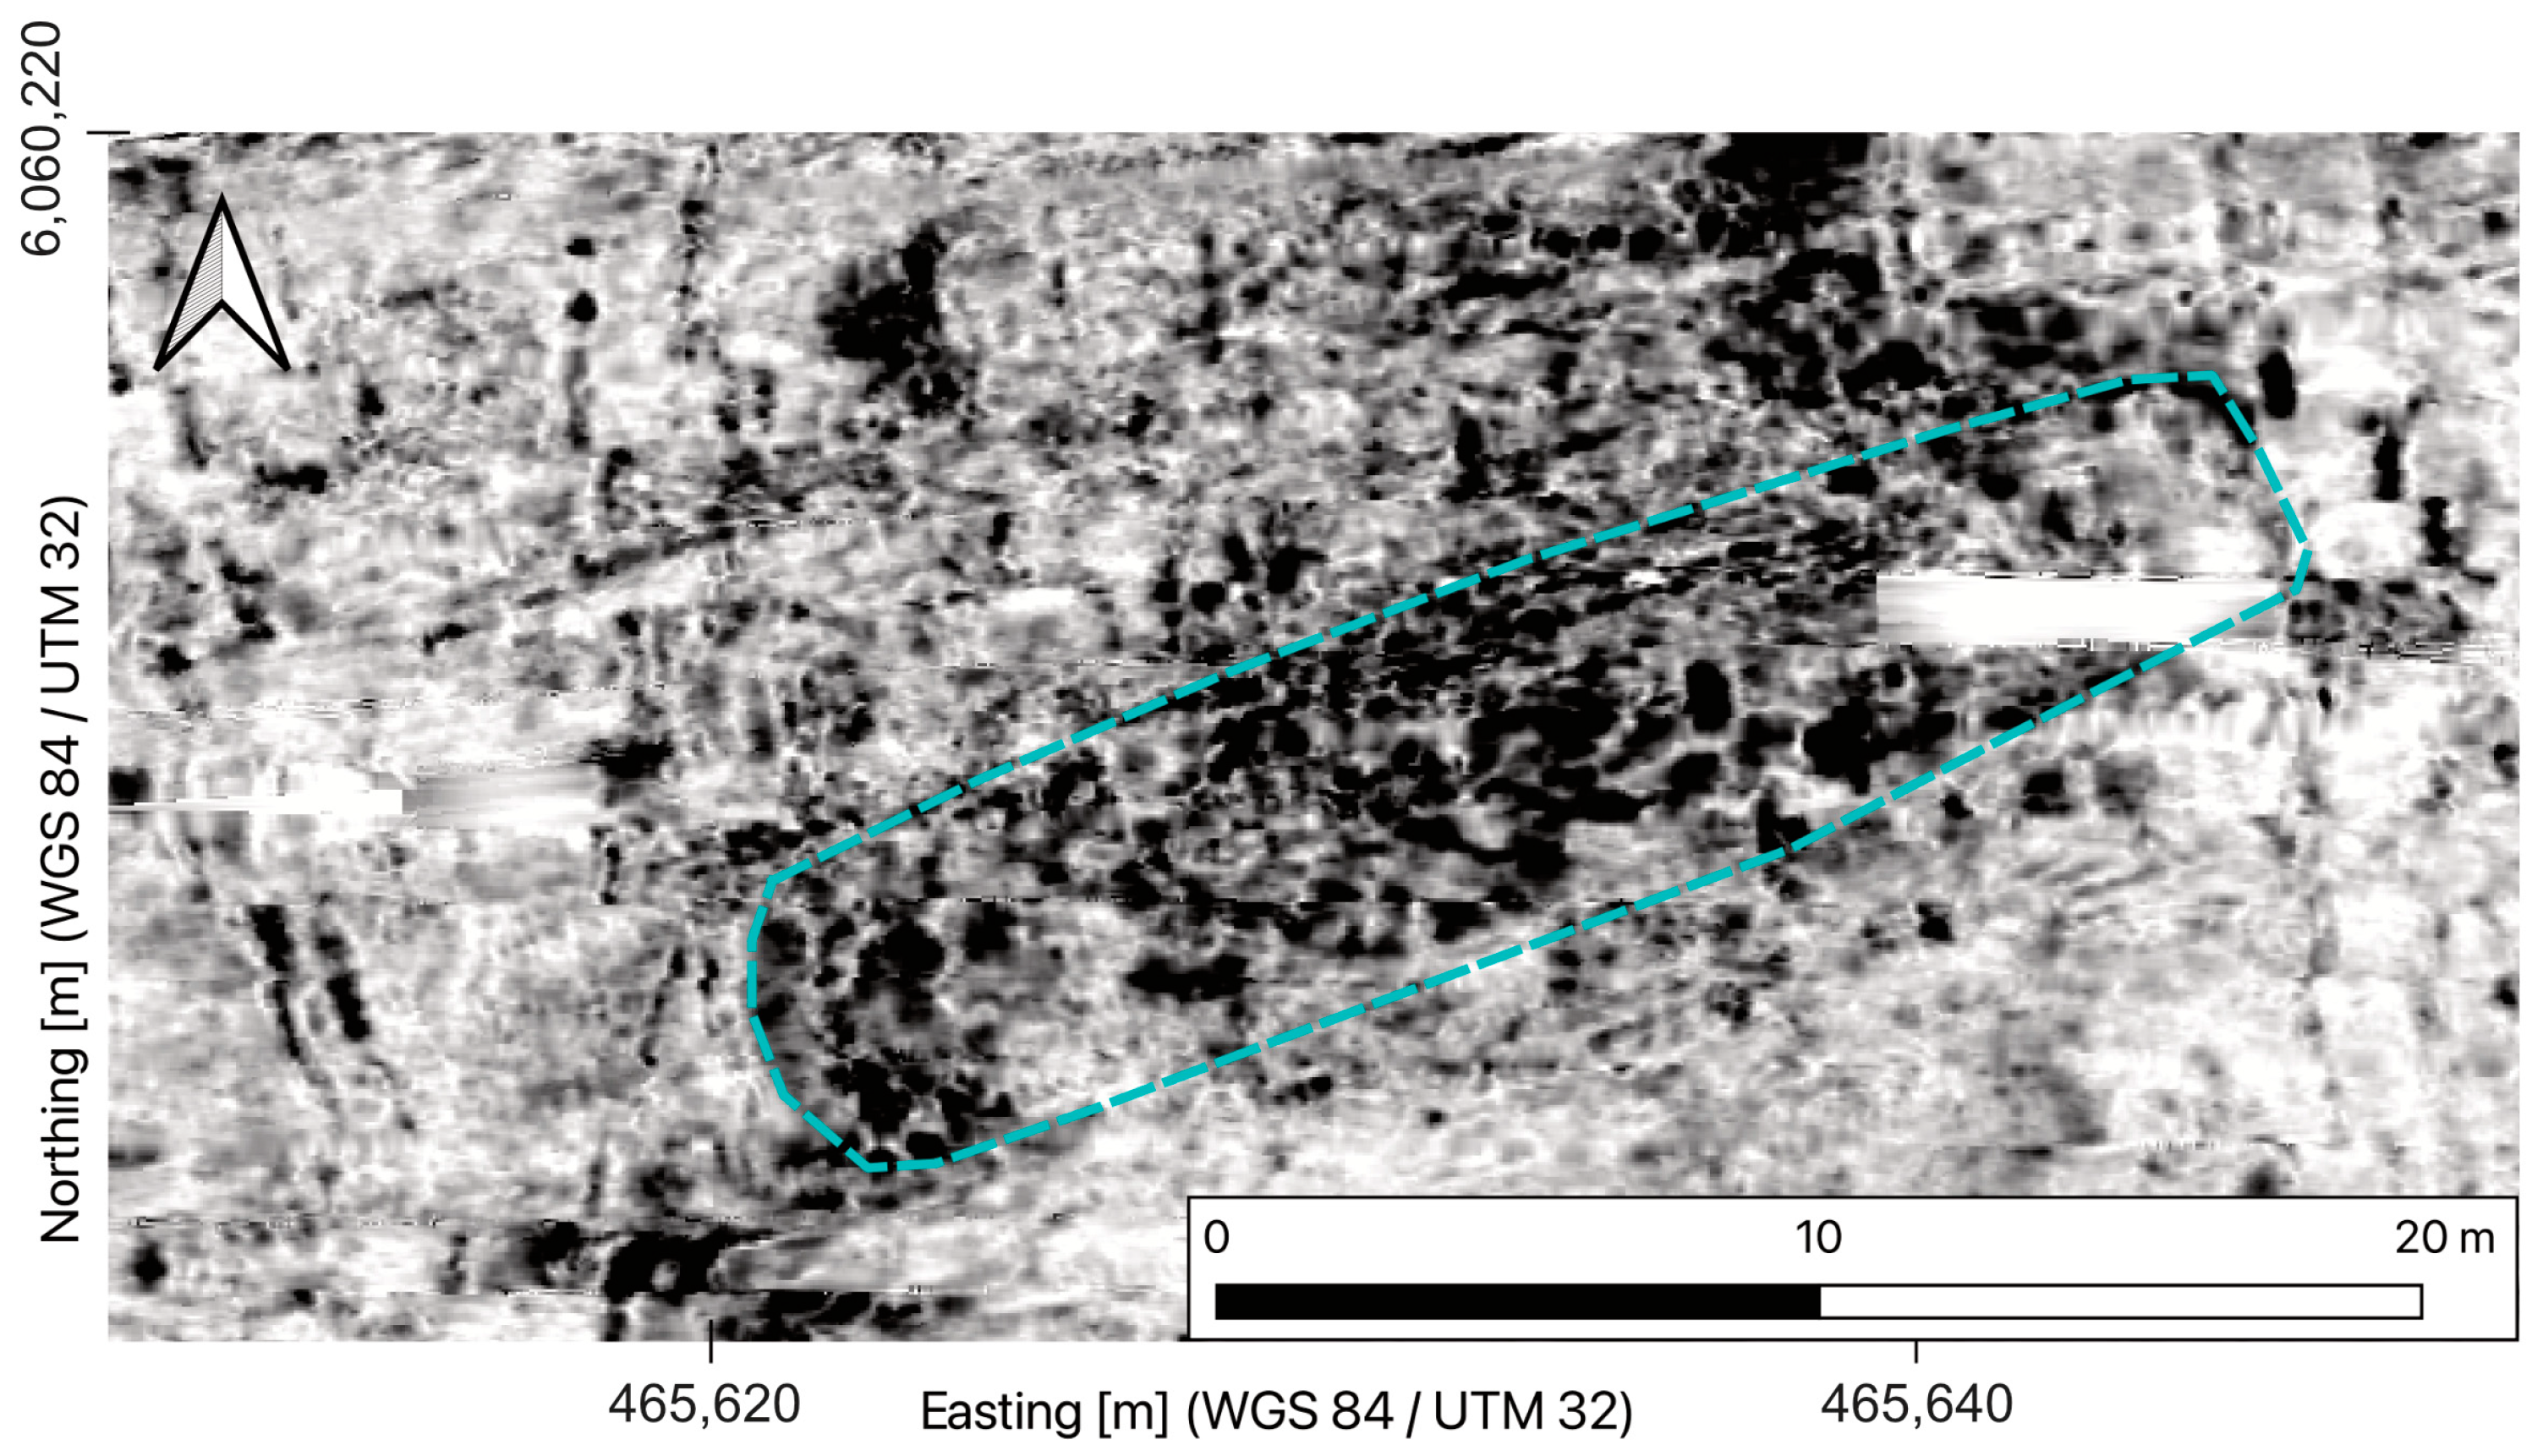
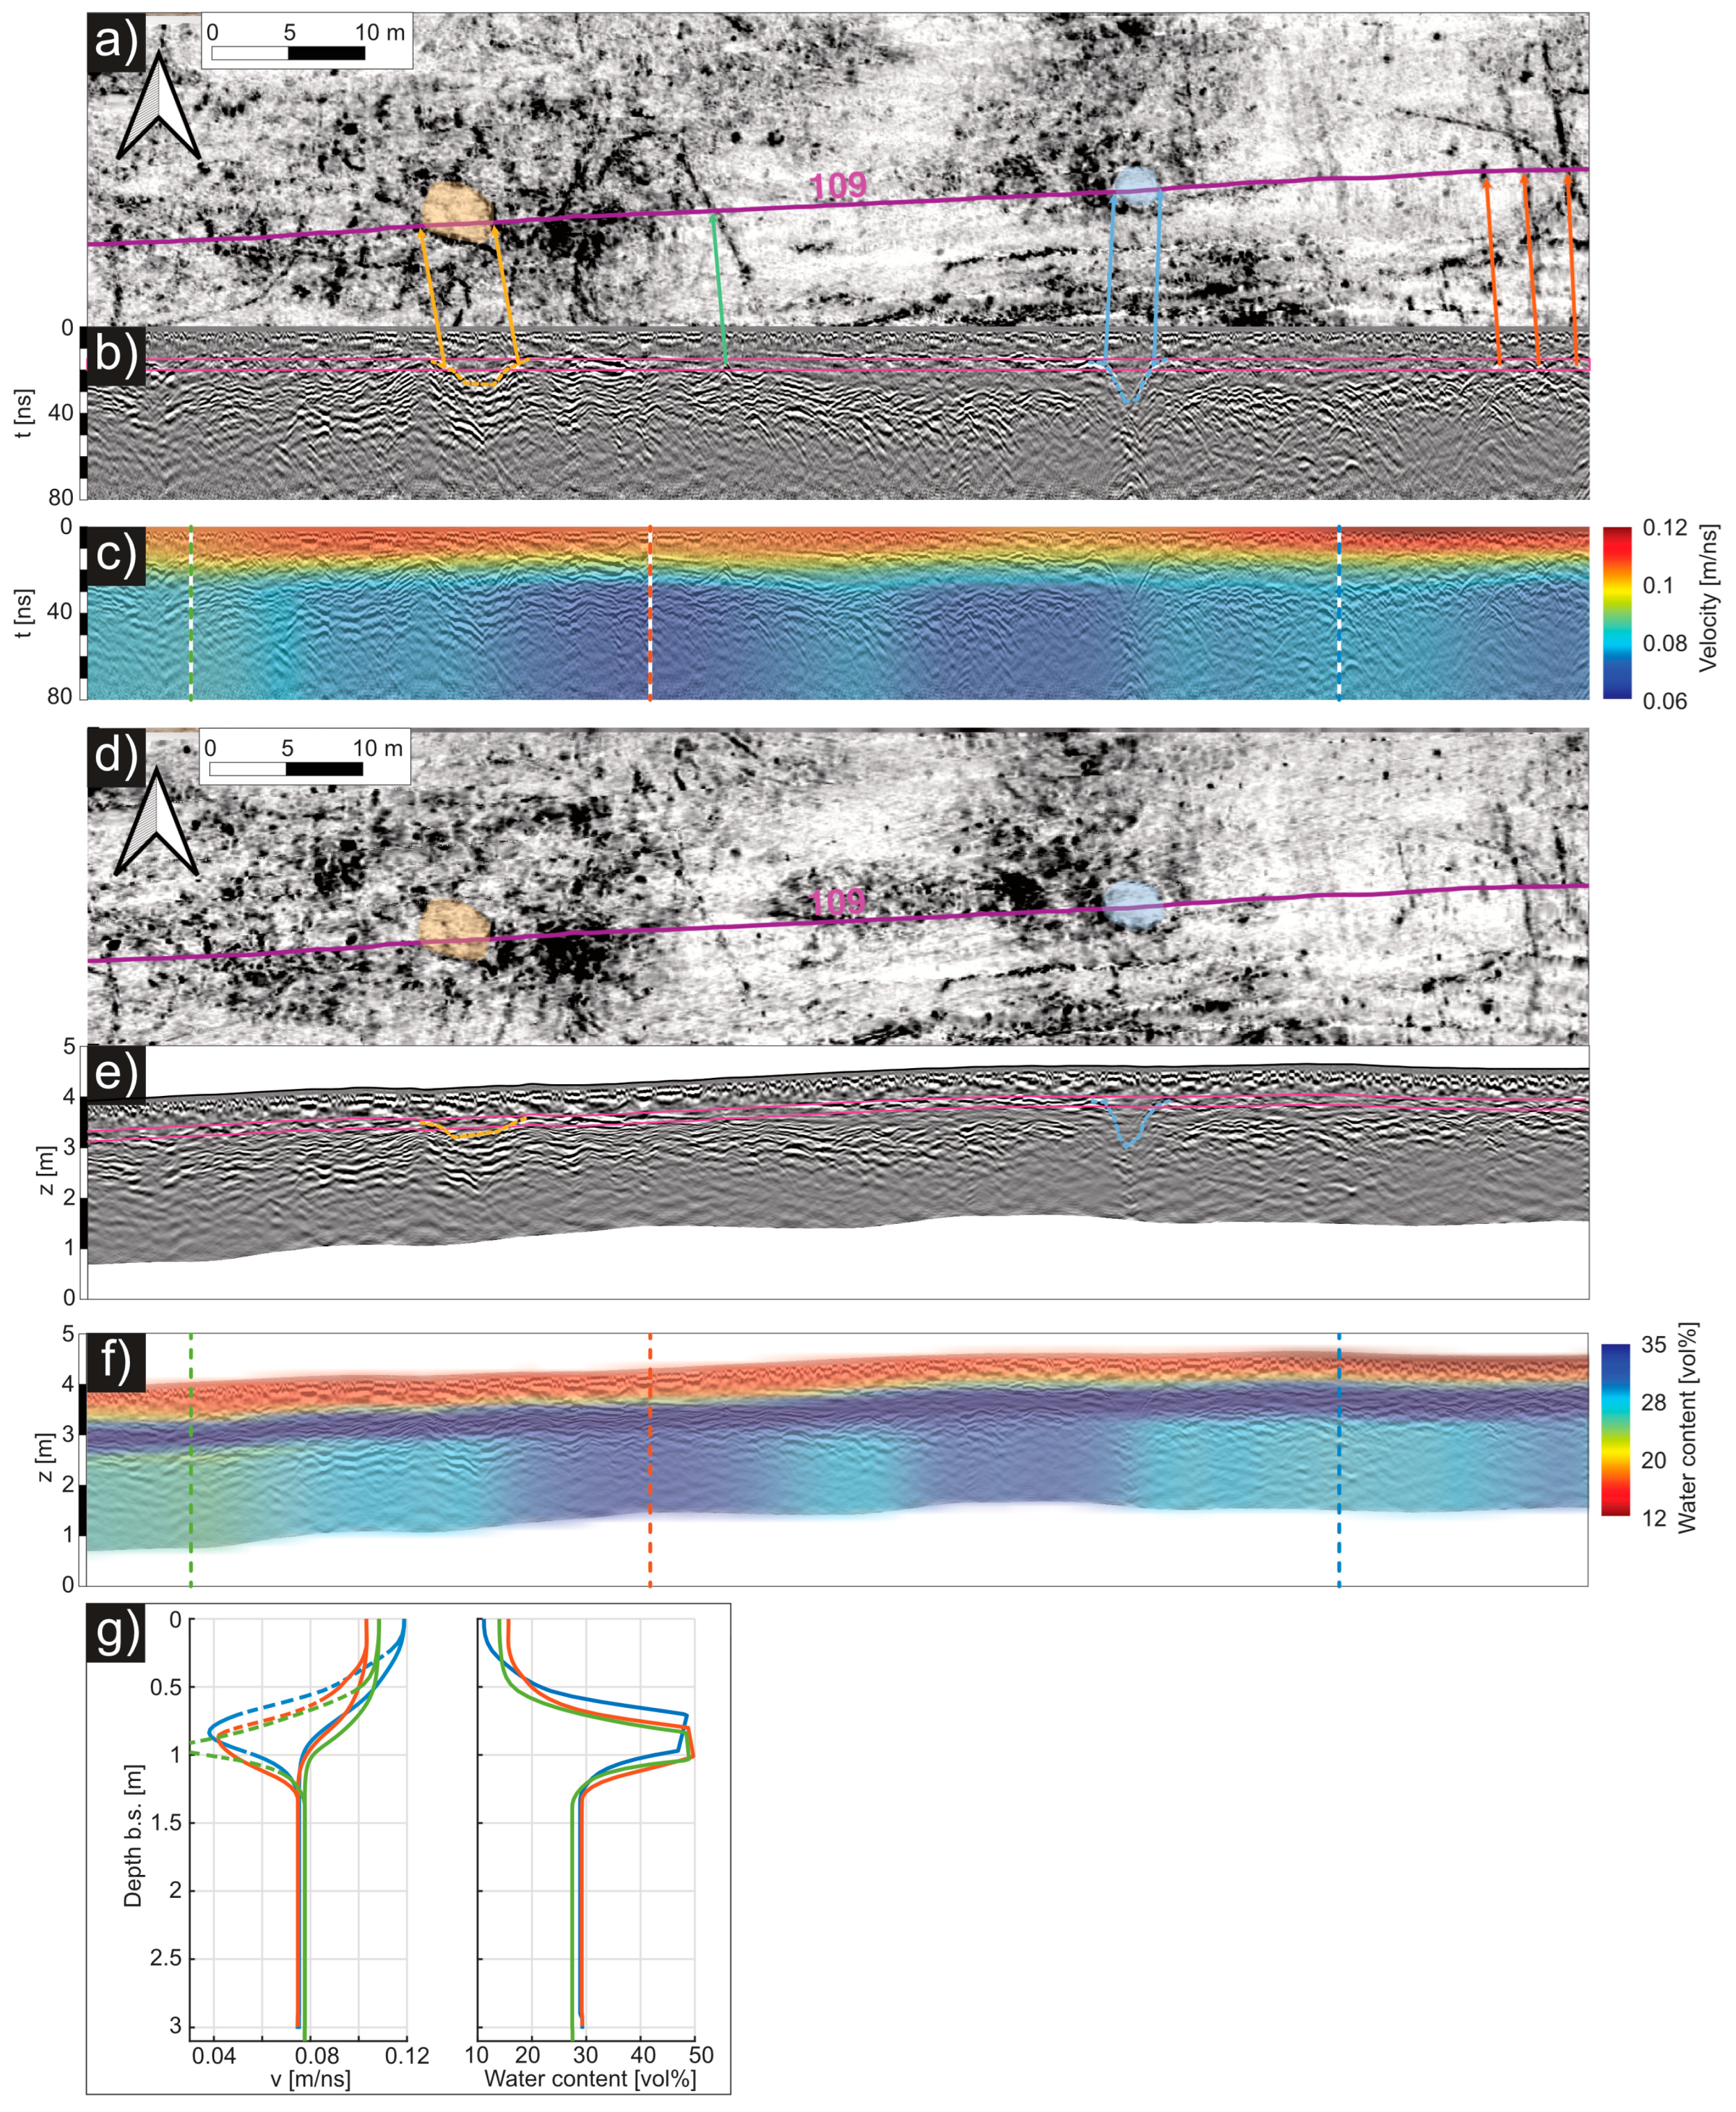
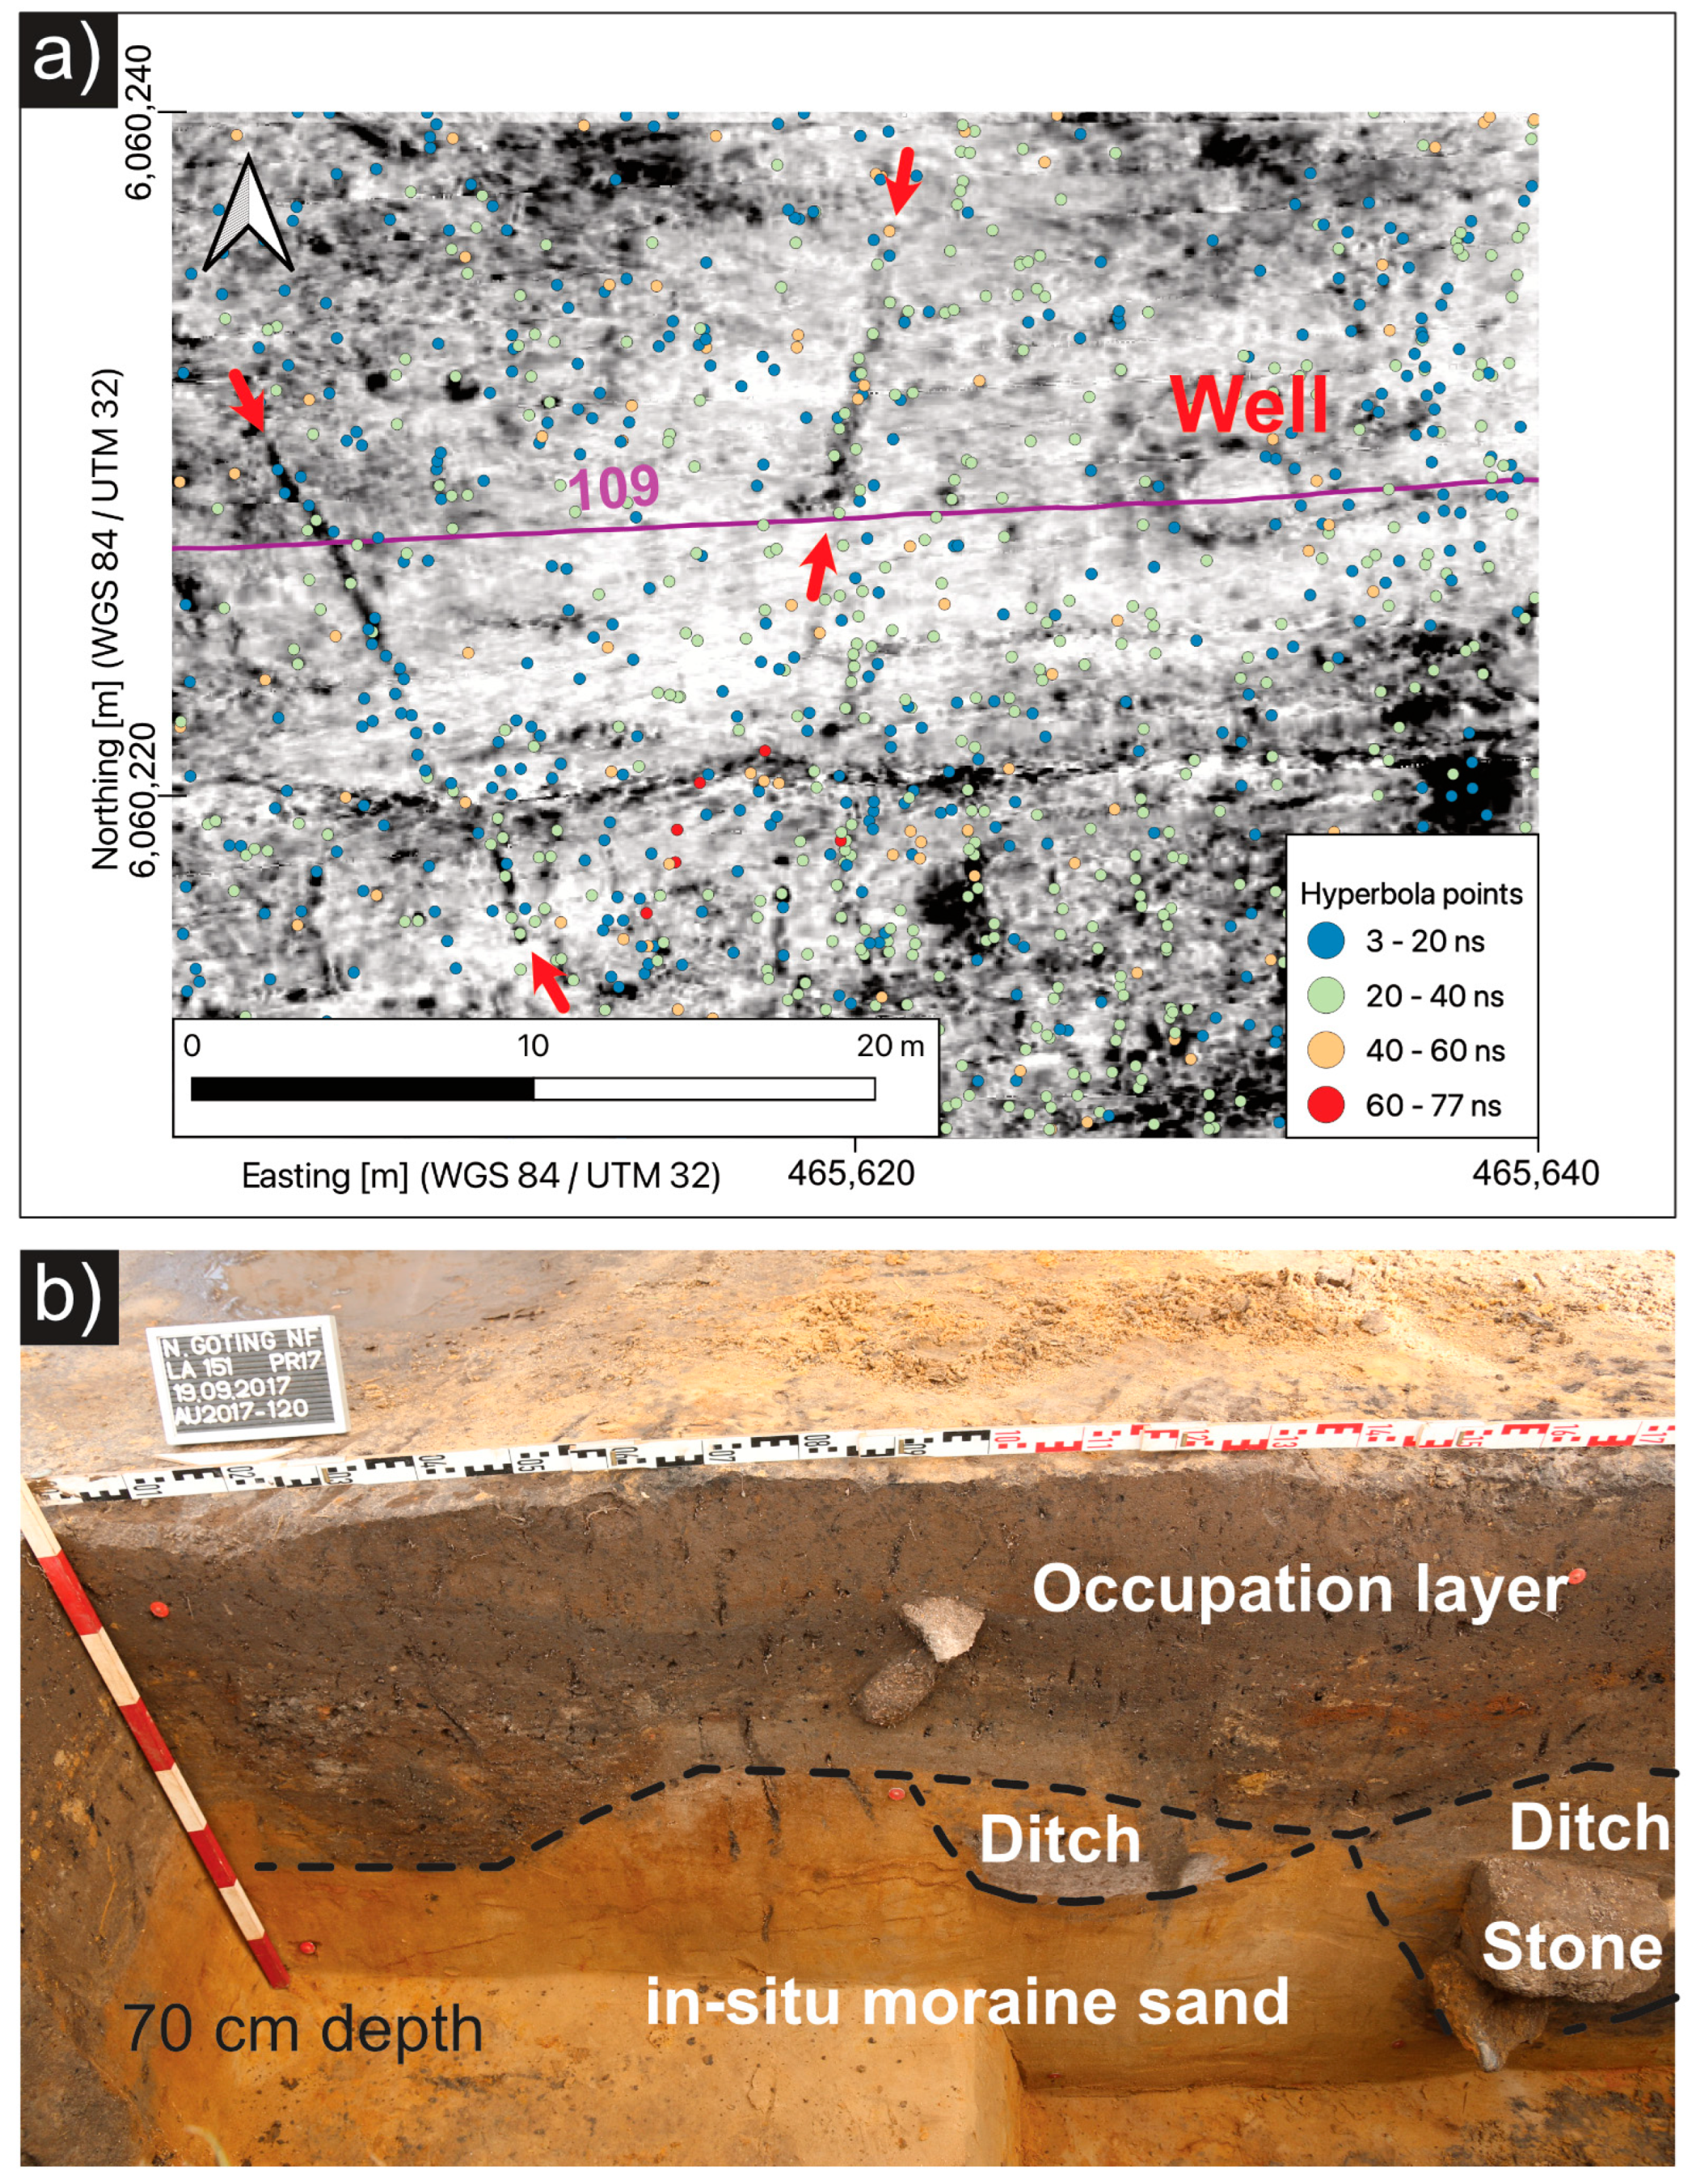
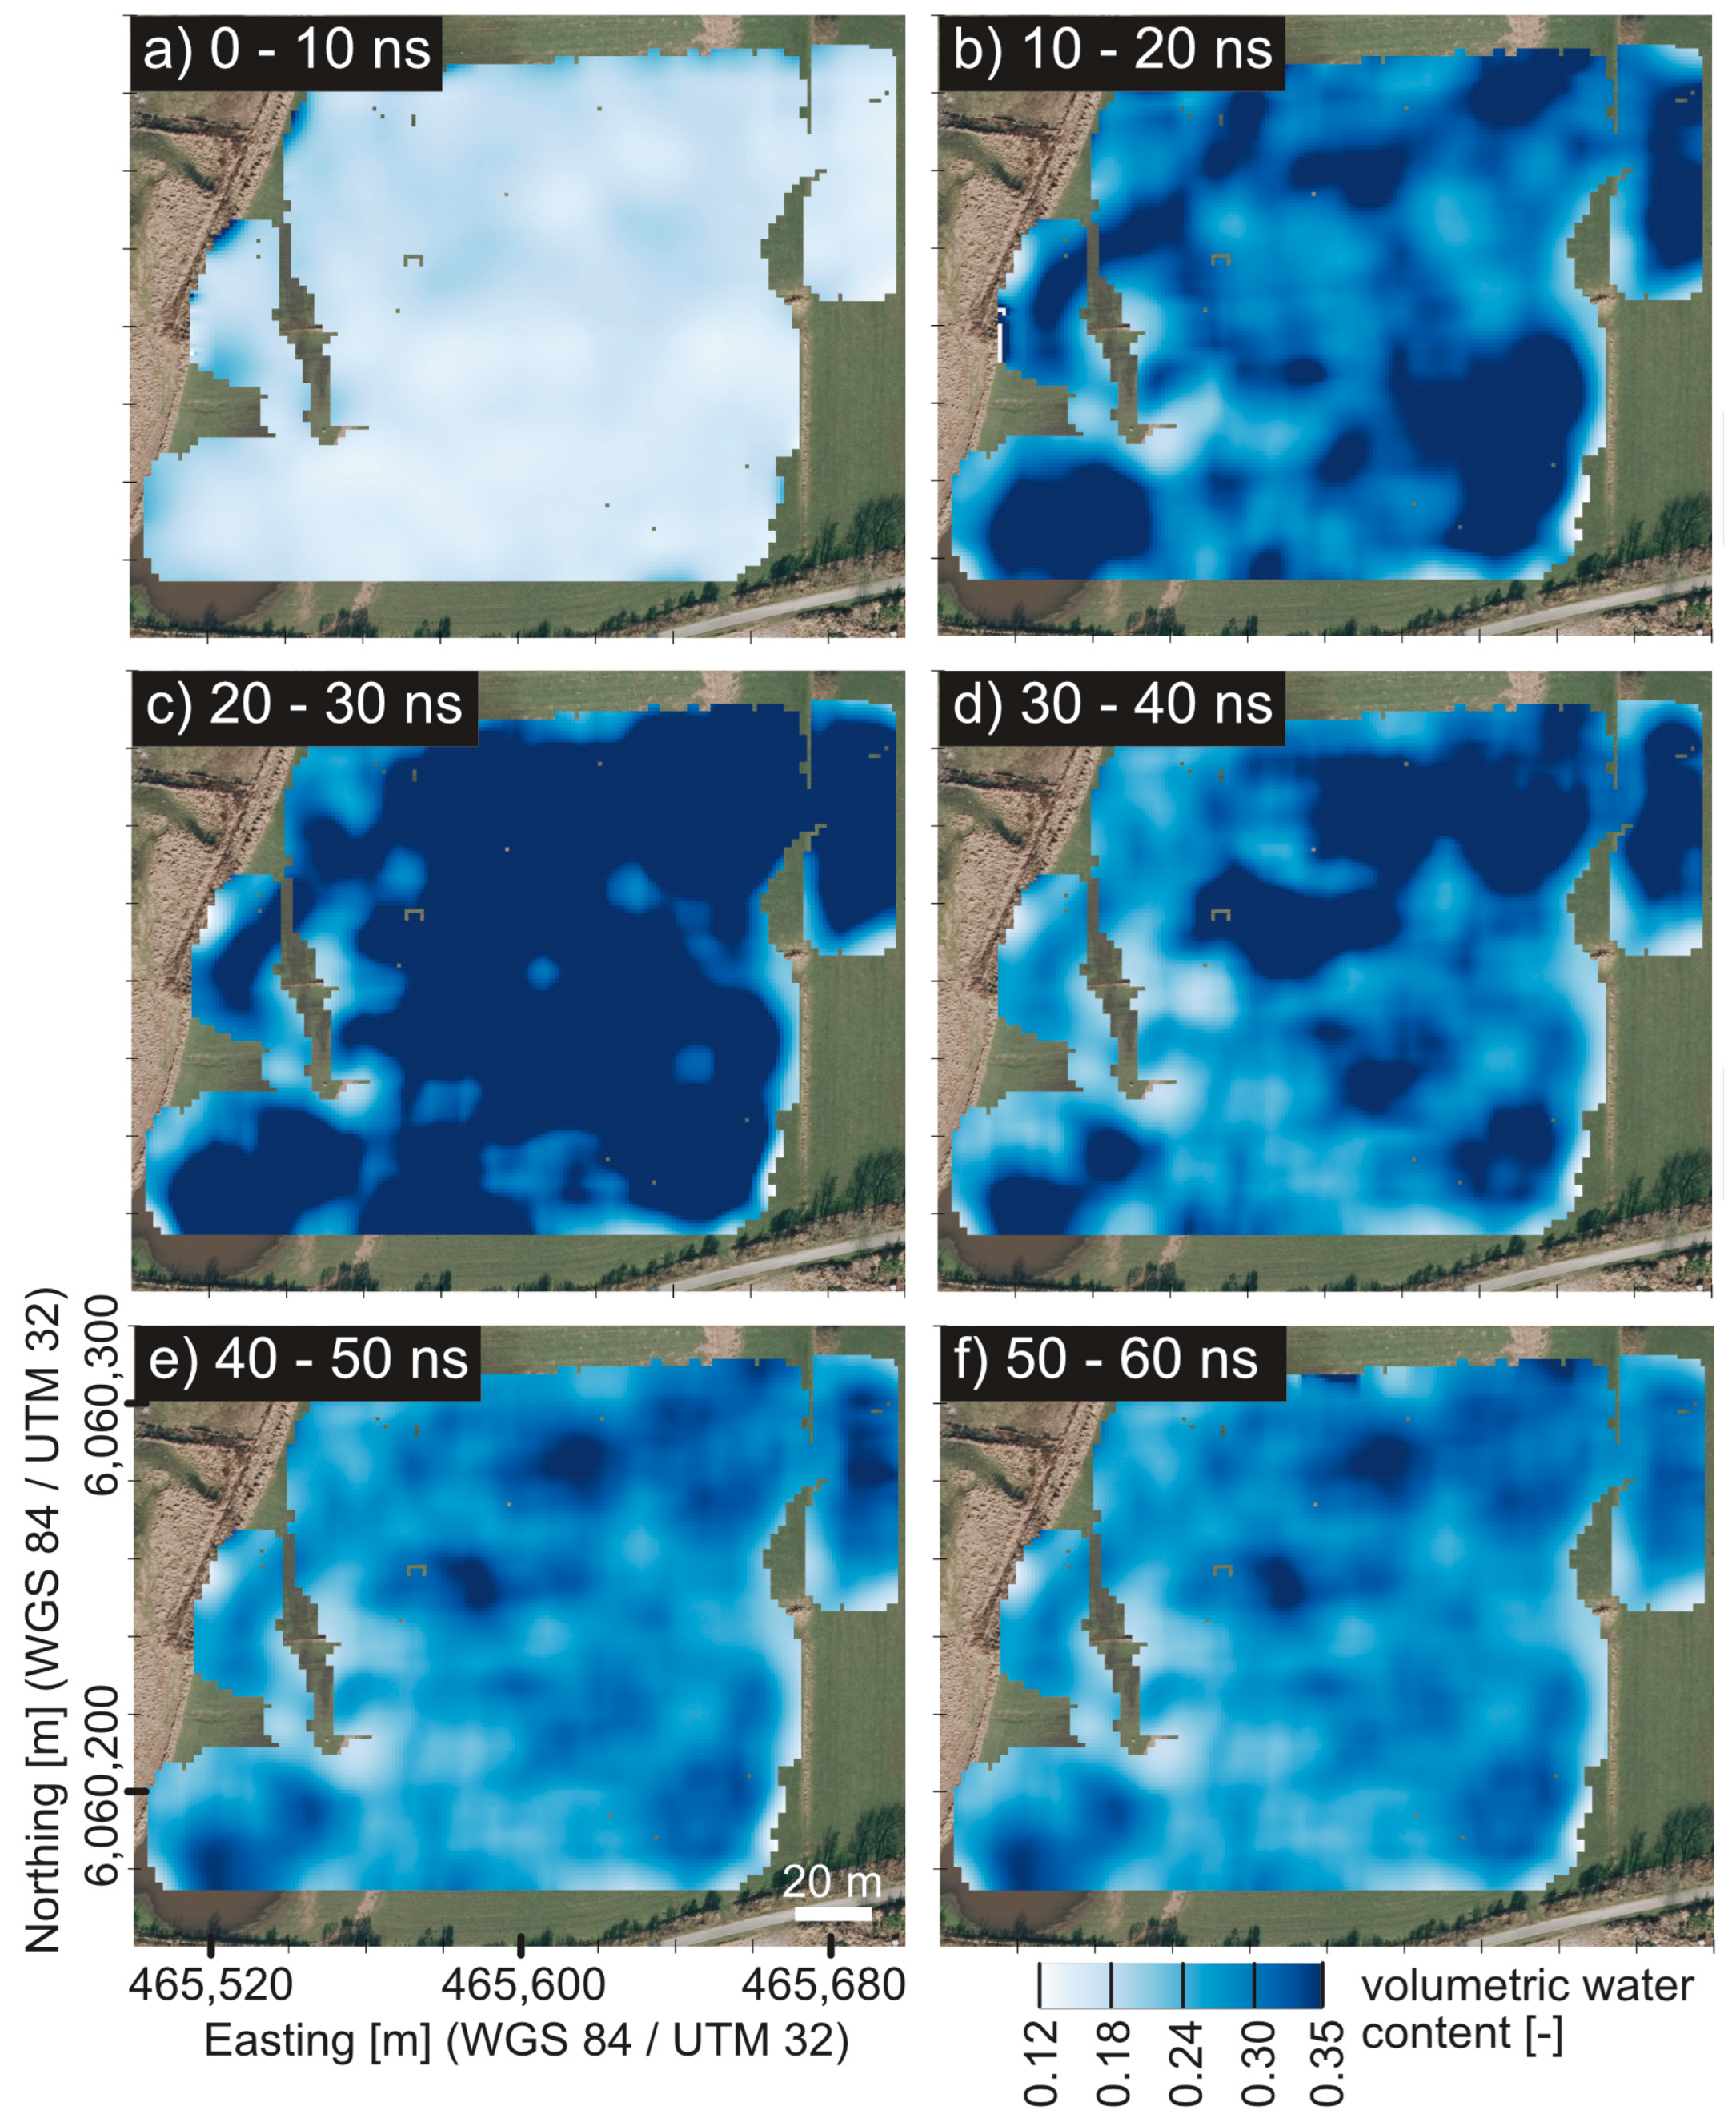
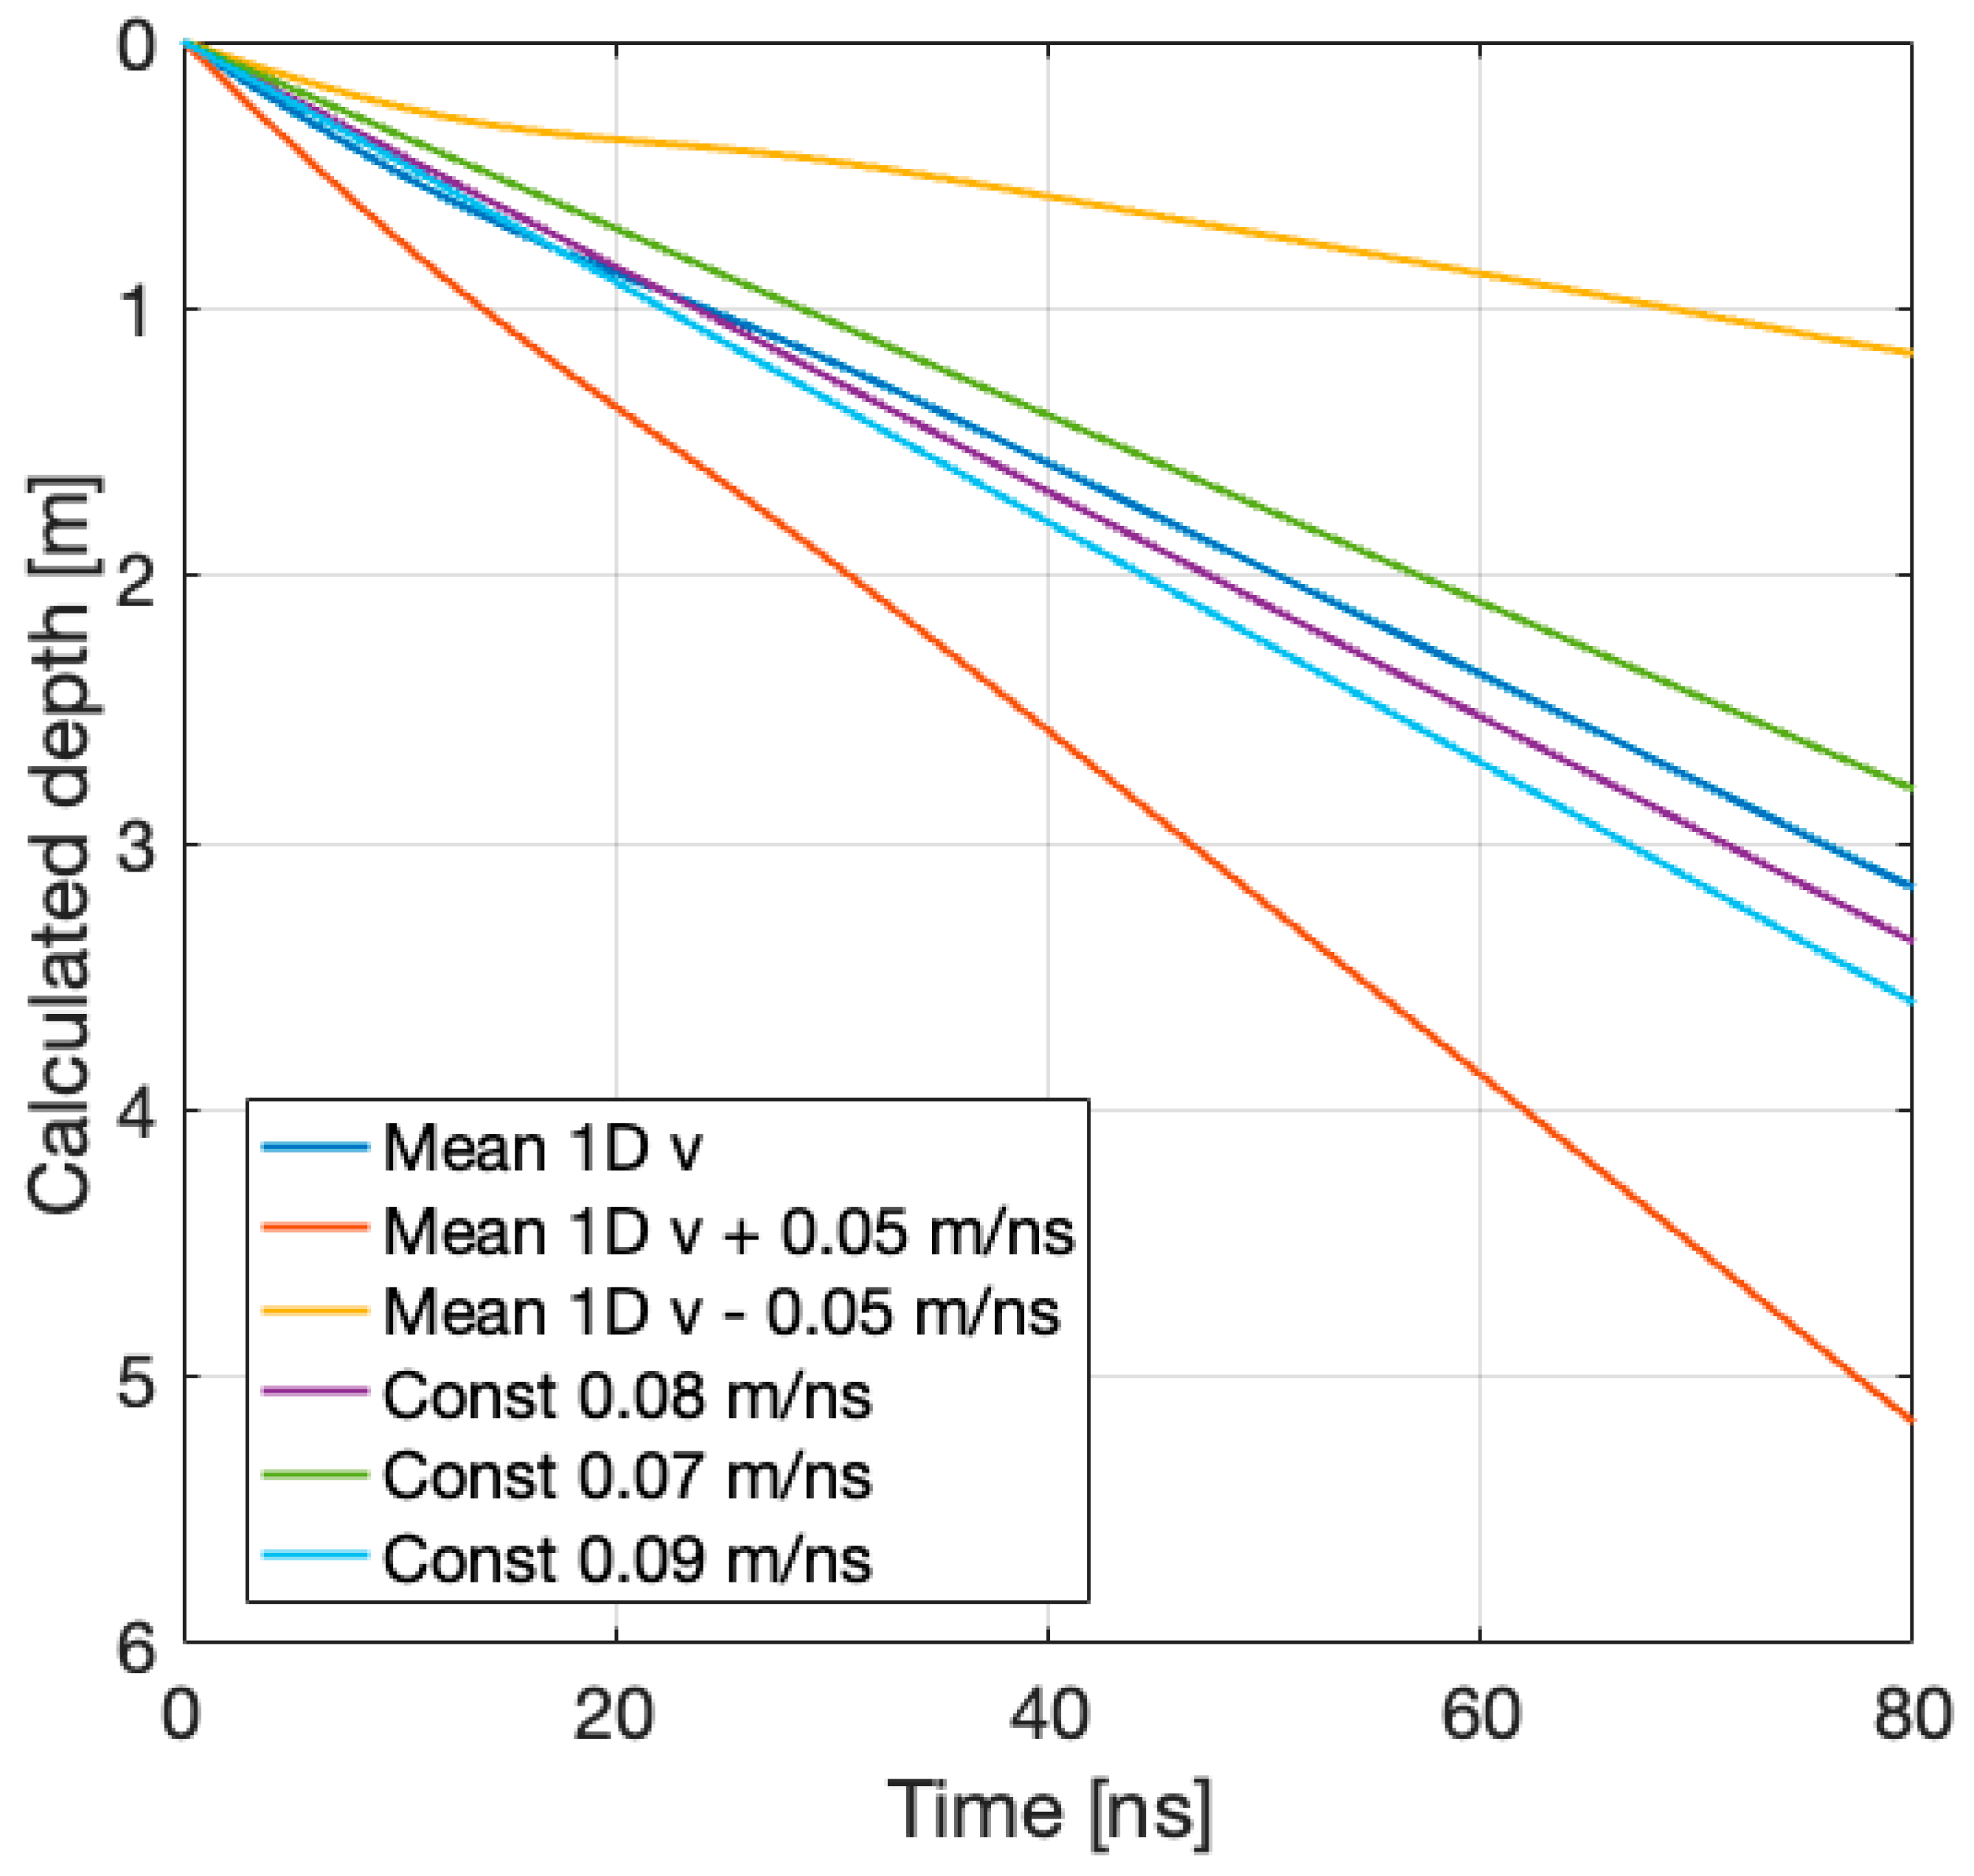
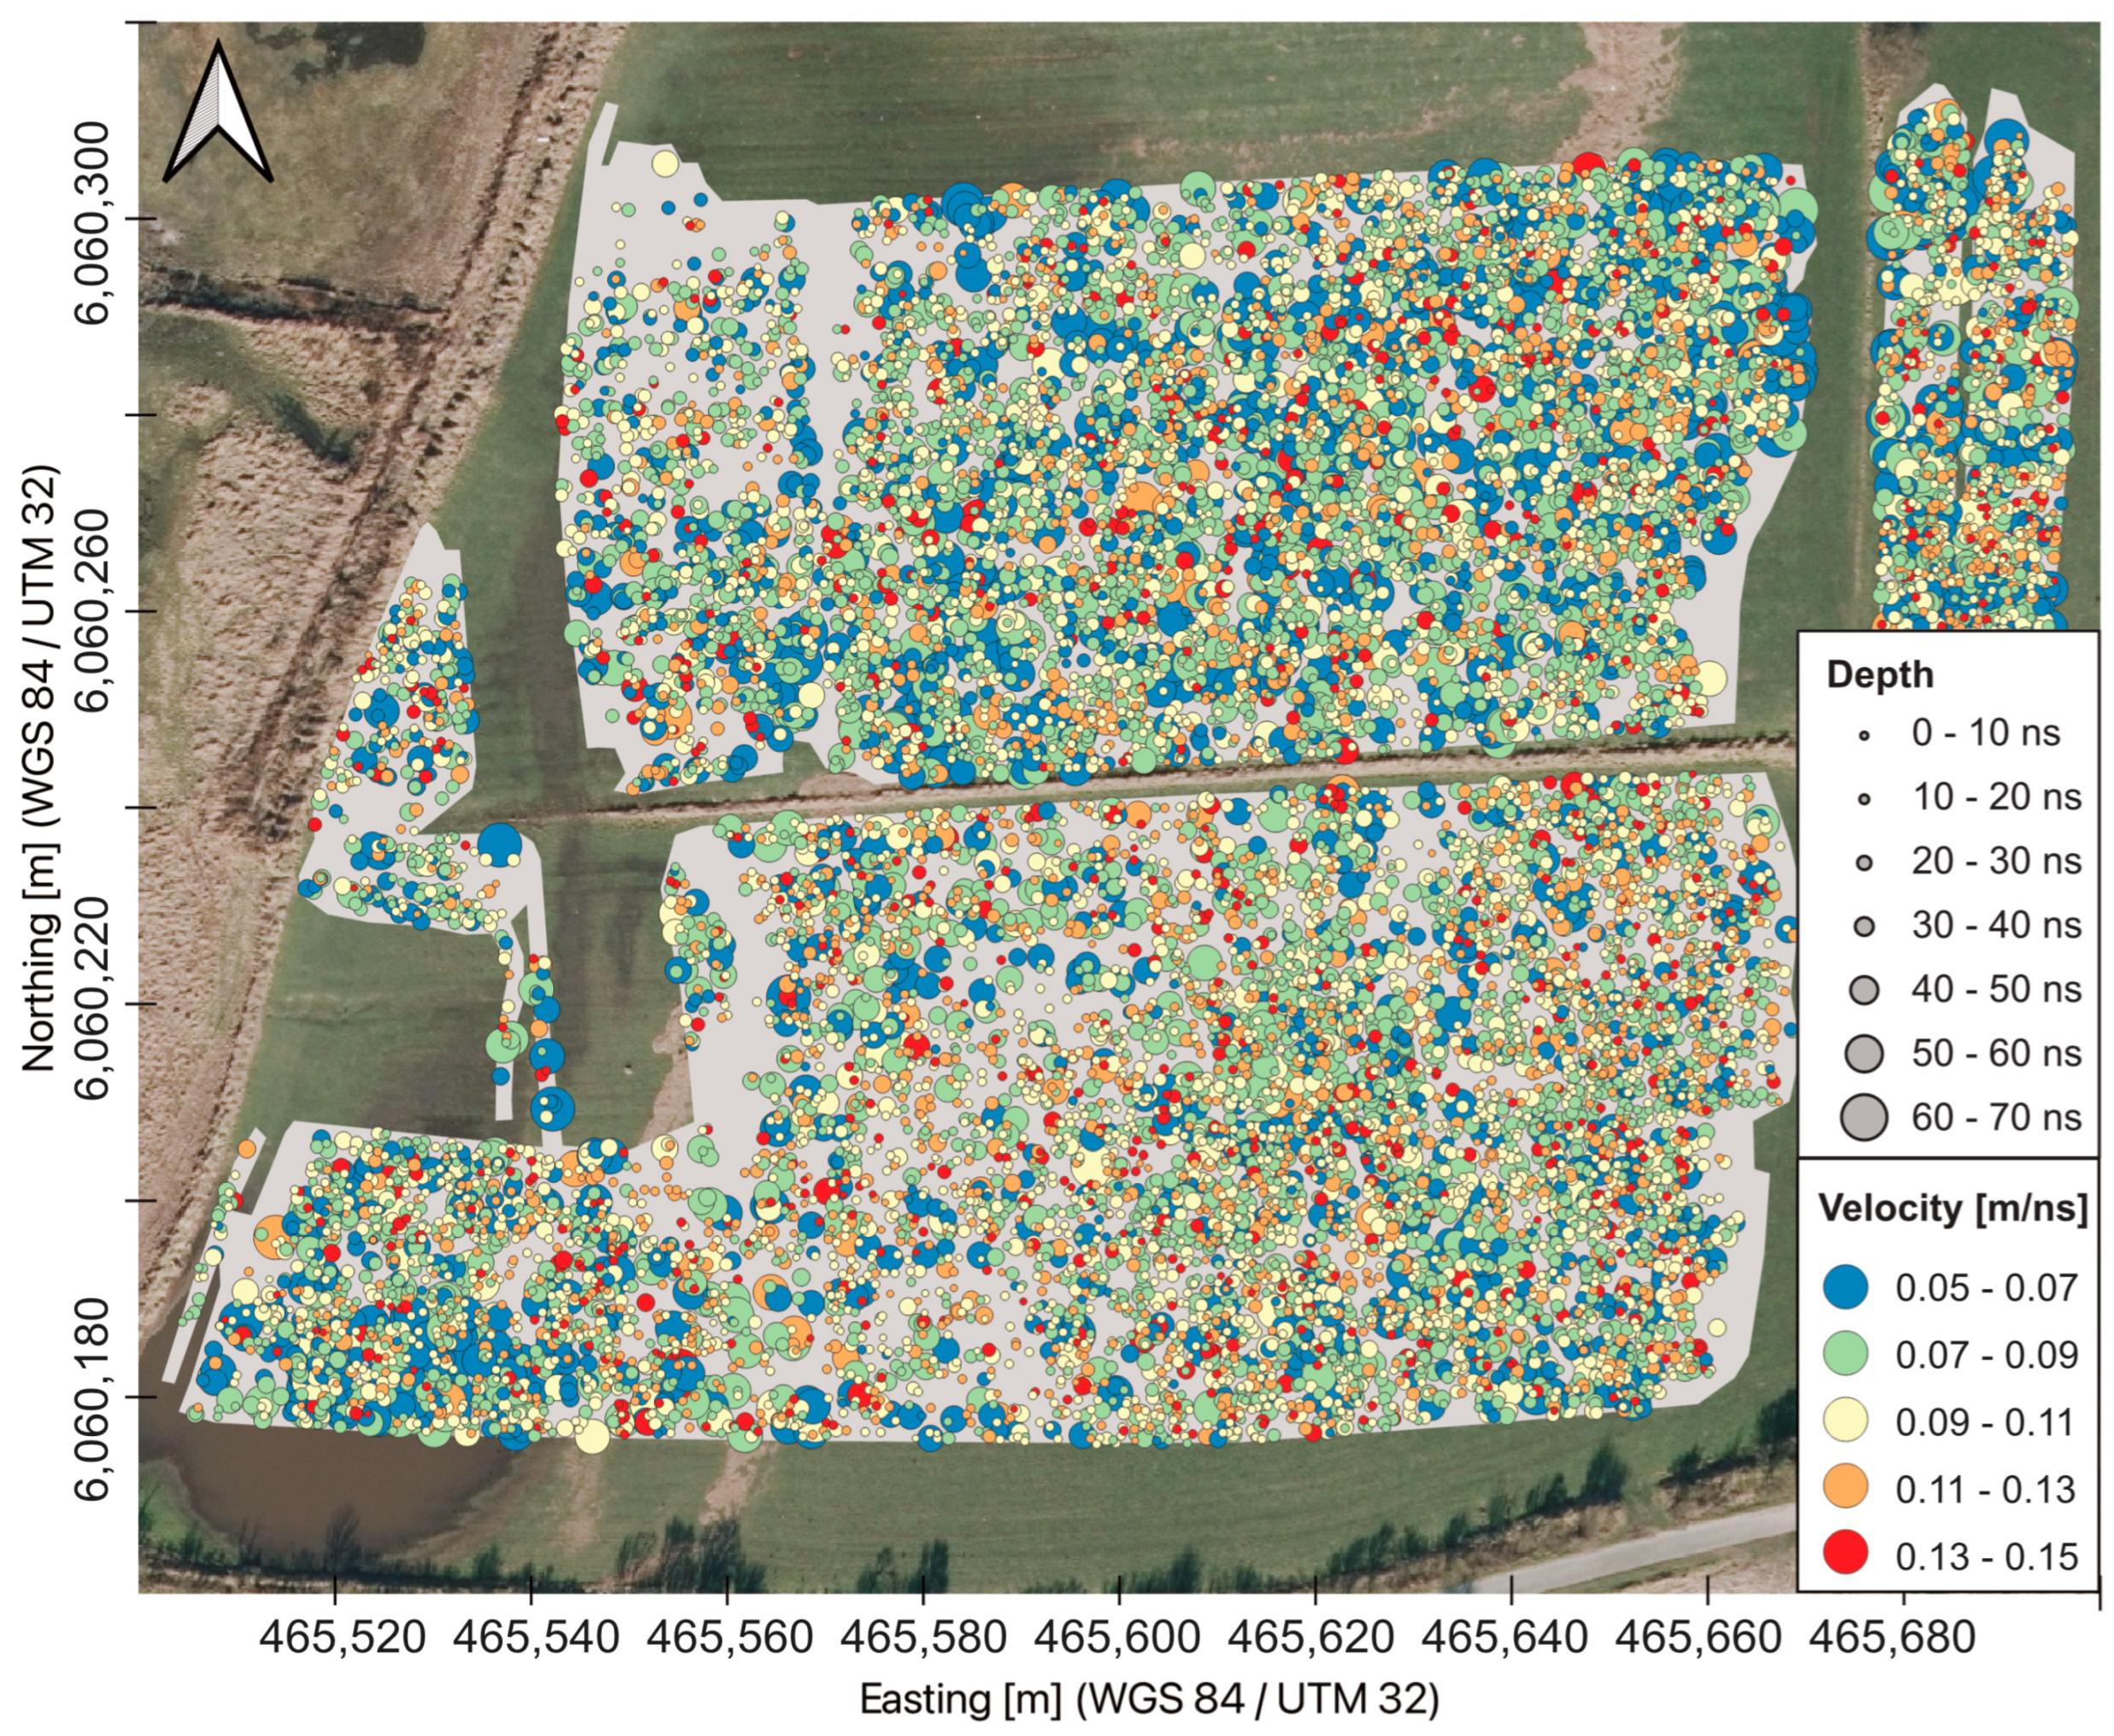
Hyperbolae in radargrams are caused by a variety of small subsurface objects. The analysis of their curvature enables the determination of propagation velocity in the subsurface, which is important for exact time-to-depth conversion and migration and also yields information on the water content of the soil. Using deep learning methods and fitting (DLF) algorithms, it is possible to automatically detect and analyze large numbers of hyperbola in 3D Ground-Penetrating Radar (GPR) datasets. As a result, a 3D velocity model can be established. Combining the hyperbola locations and the 3D velocity model with reflection depth sections and timeslices leads to improved archaeological interpretation due to (1) correct time-to-depth conversion through migration with the 3D velocity model, (2) creation of depthslices following the topography, (3) evaluation of the spatial distribution of hyperbolae, and (4) derivation of a 3D water content model of the site. In an exemplary study, we applied DLF to a 3D GPR dataset from the multi-phased (2nd to 12th century CE) archaeological site of Goting on the island of Föhr, Northern Germany. Using RetinaNet, we detected 38,490 hyperbolae in an area of 1.76 ha and created a 3D velocity model. The velocities ranged from approximately 0.12 m/ns at the surface to 0.07 m/ns at approx. 3 m depth in the vertical direction; in the lateral direction, the maximum velocity variation was ±0.048 m/ns. The 2D-migrated radargrams and subsequently created depthslices revealed the remains of a longhouse, which was not known beforehand and had not been visible in the unmigrated timeslices. We found hyperbola apex points aligned along linear strong reflections. They can be interpreted as stones contained in ditch fills. The hyperbola points help to differentiate between ditches and processing artifacts that have a similar appearance as the ditches in time-/depthslices. From the derived 3D water content model, we could identify the thickness of the archaeologically relevant layer across the whole site. The layer contains a lot of humus and has a high water retention capability, leading to a higher water content compared to the underlying glacial moraine sand, which is well-drained.
Keywords: GPR; deep learning; hyperbola; object detection; velocity determination; archaeological interpretation GPR; deep learning; hyperbola; object detection; velocity determination; archaeological interpretation