Article

Study on the Identification Method of Planar Geological Structures in Coal Mines Using Ground-Penetrating Radar

1
School of Artificial Intelligence, China University of Mining and Technology (Beijing), Beijing 100083, China
2
State Key Laboratory for Fine Exploration and Intelligent Development of Coal Resources, China University of Mining & Technology (Beijing), Beijing 100083, China
*
Author to whom correspondence should be addressed.
This author is the first author for this manuscript.
Remote Sens. 2024, 16(21), 3990; https://doi.org/10.3390/rs16213990
Submission received: 25 September 2024 / Revised: 22 October 2024 / Accepted: 25 October 2024 / Published: 27 October 2024
(This article belongs to the Special Issue Advanced Ground-Penetrating Radar (GPR) Technologies and Applications)

Abstract

:
The underground detection environment in coal mines is complex, with numerous interference sources. Traditional ground-penetrating radar (GPR) methods suffer from limited detection range, high noise levels, and weak deep signals, making it extremely difficult to accurately identify geological structures without stable feature feedback. During research, it was found that the detection energy of the same target significantly changes with the antenna direction. Based on this phenomenon, this paper proposes a geological radar advanced detection method using spatial scanning. This method overcomes constraints imposed by the underground coal mine environment on detection equipment, enhancing both detection range and accuracy compared to traditional approaches. Experiments using this method revealed pea-shaped response characteristics of planar geological structures in radar images, and the mechanisms behind their formation were analyzed. Additionally, this paper studied the changes in response characteristics under changes in target inclination, providing a basis for understanding the spatial distribution of geological structures. Finally, application experiments in underground coal mine environments explored the practical potential of this method. Results indicate that, compared to drilling data, this method achieves identification accuracies of 91.88%, 90.42%, and 78.72% for the depth and spatial extent of geological structures, providing effective technical support for coal mining operations.

1. Introduction

China’s energy structure is characterized by being ‘rich in coal, poor in oil, and scarce in gas’, with coal playing a dominant role in energy production and consumption. According to relevant studies, coal will continue to account for over 50% of China’s primary energy consumption from 2030 to 2050 [1]. In February 2020, China released Guiding Opinions on Accelerating the Development of Intelligent Coal Mines, emphasizing the need to achieve key technological breakthroughs in precise geological detection for coal mines, intelligent perception of major hazard sources, and early warning systems. The plan aims to establish a comprehensive set of technical standards for intelligent coal mining by 2025, thereby promoting high-quality development in the coal industry and accelerating its transformation and upgrading [2,3,4]. The fundamental premise of intelligent coal mine construction is a comprehensive and in-depth understanding of the geological environment of the mine, ensuring full transparency of the geological conditions at the working face [5,6]. In current coal mining operations, geological transparency primarily relies on the collection and analysis of geological data. Through various exploration techniques such as drilling and physical and chemical prospecting, geological data are deeply explored and thoroughly revealed to achieve a comprehensive understanding of the working face’s geological conditions, particularly in relation to key information on stratigraphy, geological structures, and geological anomalies [7,8]. However, due to various factors, different exploration techniques exhibit issues such as inaccurate detection results, low precision, and insufficient depth to meet the demands of mining operations, leading to significant differences in the transparency capabilities for the coal mine working face [9,10]. The main reasons for these issues include: (1) the complex underground environment in coal mines, especially at the tunneling face, which often faces harsh conditions such as high temperature, high humidity, high dust, high noise, and high gas levels; (2) difficult underground transportation and narrow working spaces impose strict constraints on the layout of geophysical systems and the size and weight of detection equipment; (3) the numerous interference sources at the working face, such as rail tracks, anchor nets, industrial electricity, and mechanical vibrations, coupled with the requirement for explosion-proof detection equipment and limited transmission power, resulting in weakened signals from deeper layers. In the absence of stable and reliable geological structural features, it becomes extremely challenging to effectively identify geological information from interference signals [11,12,13]; (4) the quasi-full-space conditions at the working face make it difficult to directly apply surface detection theories, thereby increasing the complexity of data processing and interpretation [14,15]. These challenges pose significant obstacles to achieving full geological transparency at the coal mine working face. Meanwhile, as deep mining accelerates, the demand for transparency in the coal mine geological environment continues to grow.
To achieve geological transparency at the coal mine working face, refined geological surveys of the working face conditions are necessary. Among various detection technologies, ground-penetrating radar (GPR) exhibits significant advantages due to its high resolution, strong anti-interference capabilities, and non-destructive detection characteristics [16,17,18]. In recent years, both domestic and international scholars have conducted studies on the application of GPR in the coal mining field. Domestic scholars, such as Peng S.P. and Feng Y. [19,20], have developed deep-penetration GPR systems and equipment to meet the requirements for explosion-proof operations and ultra-deep detection in mines, increasing the detection depth from several meters to tens of meters. Xu X.L. and colleagues improved the performance of antenna systems through a new microwave front-end design, optimizing the size of the antenna’s radiation surface and shielding cavity, making GPR systems more suitable for detecting geological hazards in coal mine tunnels [21]. In experiments on detecting coal–rock interfaces in fully mechanized mining faces, the detection error was within 1.2 cm, with an average error of 8.6%, demonstrating the superiority of the equipment in complex geological environments [22]. Additionally, a coal–rock stratigraphy positioning algorithm was proposed based on a two-dimensional mapping of relative coal thickness errors within the antenna’s main lobe extremum range, reducing the shallow coal–rock interface identification error to less than 7.6% [23]. Due to the lack of explosion-proof radar equipment abroad, surface radar systems are unsuitable for underground coal mine environments, with most foreign research focusing on detecting hazards in near-surface coal mines. For example, Strange et al. proposed a method for detecting thin coal thickness near the surface, and validated it in a laboratory environment using a 1.4 GHz radar antenna, with an effective detection range for coal seam thickness within 5 cm [24]. Jecny and others used GPR systems to scan the thickness of coal seams in open-pit mines, achieving detection results with errors within 5% of actual measurements [25]. Other scholars have also conducted research in areas such as subsurface geological structure surveys [26,27] and surface mineral resource assessments [28]. In summary, research on GPR detection in mine environments remains relatively scarce, with most studies focusing on the development and optimization of technical equipment. Given the limited working face space and extreme operating conditions in underground coal mines, accurately identifying geological structures and effectively obtaining spatial distribution information about geological structures continues to pose significant challenges for existing GPR technology and detection methods.
To address challenges associated with traditional GPR detection methods in underground coal mine environments, this study presents an innovative spatial scanning detection approach. Throughout the research process, significant planar geological structures, such as fault lines and coal seam thinning zones, were selected as subjects of investigation. Experiments were designed to analyze the response characteristics of these planar geological structures in GPR detection results. Additionally, detection experiments targeting different angles of geological structures were conducted to examine the spatial variation of target response characteristics. Finally, application experiments were carried out in a coal mining recovery area in Hebei Province, China. Through comparative analysis of detection results and drilling data, the feasibility of this method in actual production environments was validated.

2. Materials and Methods

The process of advanced detection using GPR in coal mines (Figure 1) involves directing high-frequency pulsed electromagnetic waves from a transmitting antenna (TX in Figure 1) towards the mining face. The reflected signals are then captured by a receiving antenna (TR in Figure 1), aiming to conduct a detailed investigation of the geological structures in the unknown areas ahead of the working face. During this process, electromagnetic waves penetrate through the coal mine medium and encounter various physical phenomena such as reflection, transmission, and refraction upon encountering significant differences in electrical characteristics of anomalous geological structures like aquifers, goafs, faults, fractured zones, and collapsed pillars [29]. Through thorough analysis of received electromagnetic signals, spatial attributes including types and shapes of anomalous geological structures within the coal mine can be estimated. The distance L between geological structures and observation points can be determined using Equations (1) and (2):
υ = c / ε r
L = υ t 2 d 2 2
In the equation, υ represents the propagation velocity of electromagnetic waves in a medium with a dielectric constant ε r (m/ns); t denotes the bidirectional travel time of the electromagnetic waves (ns); d is the distance between the transmitting and receiving antennas (m) (depth detection can be ignored); and c is the propagation velocity of electromagnetic waves in a vacuum (0.3 m/ns) [30].
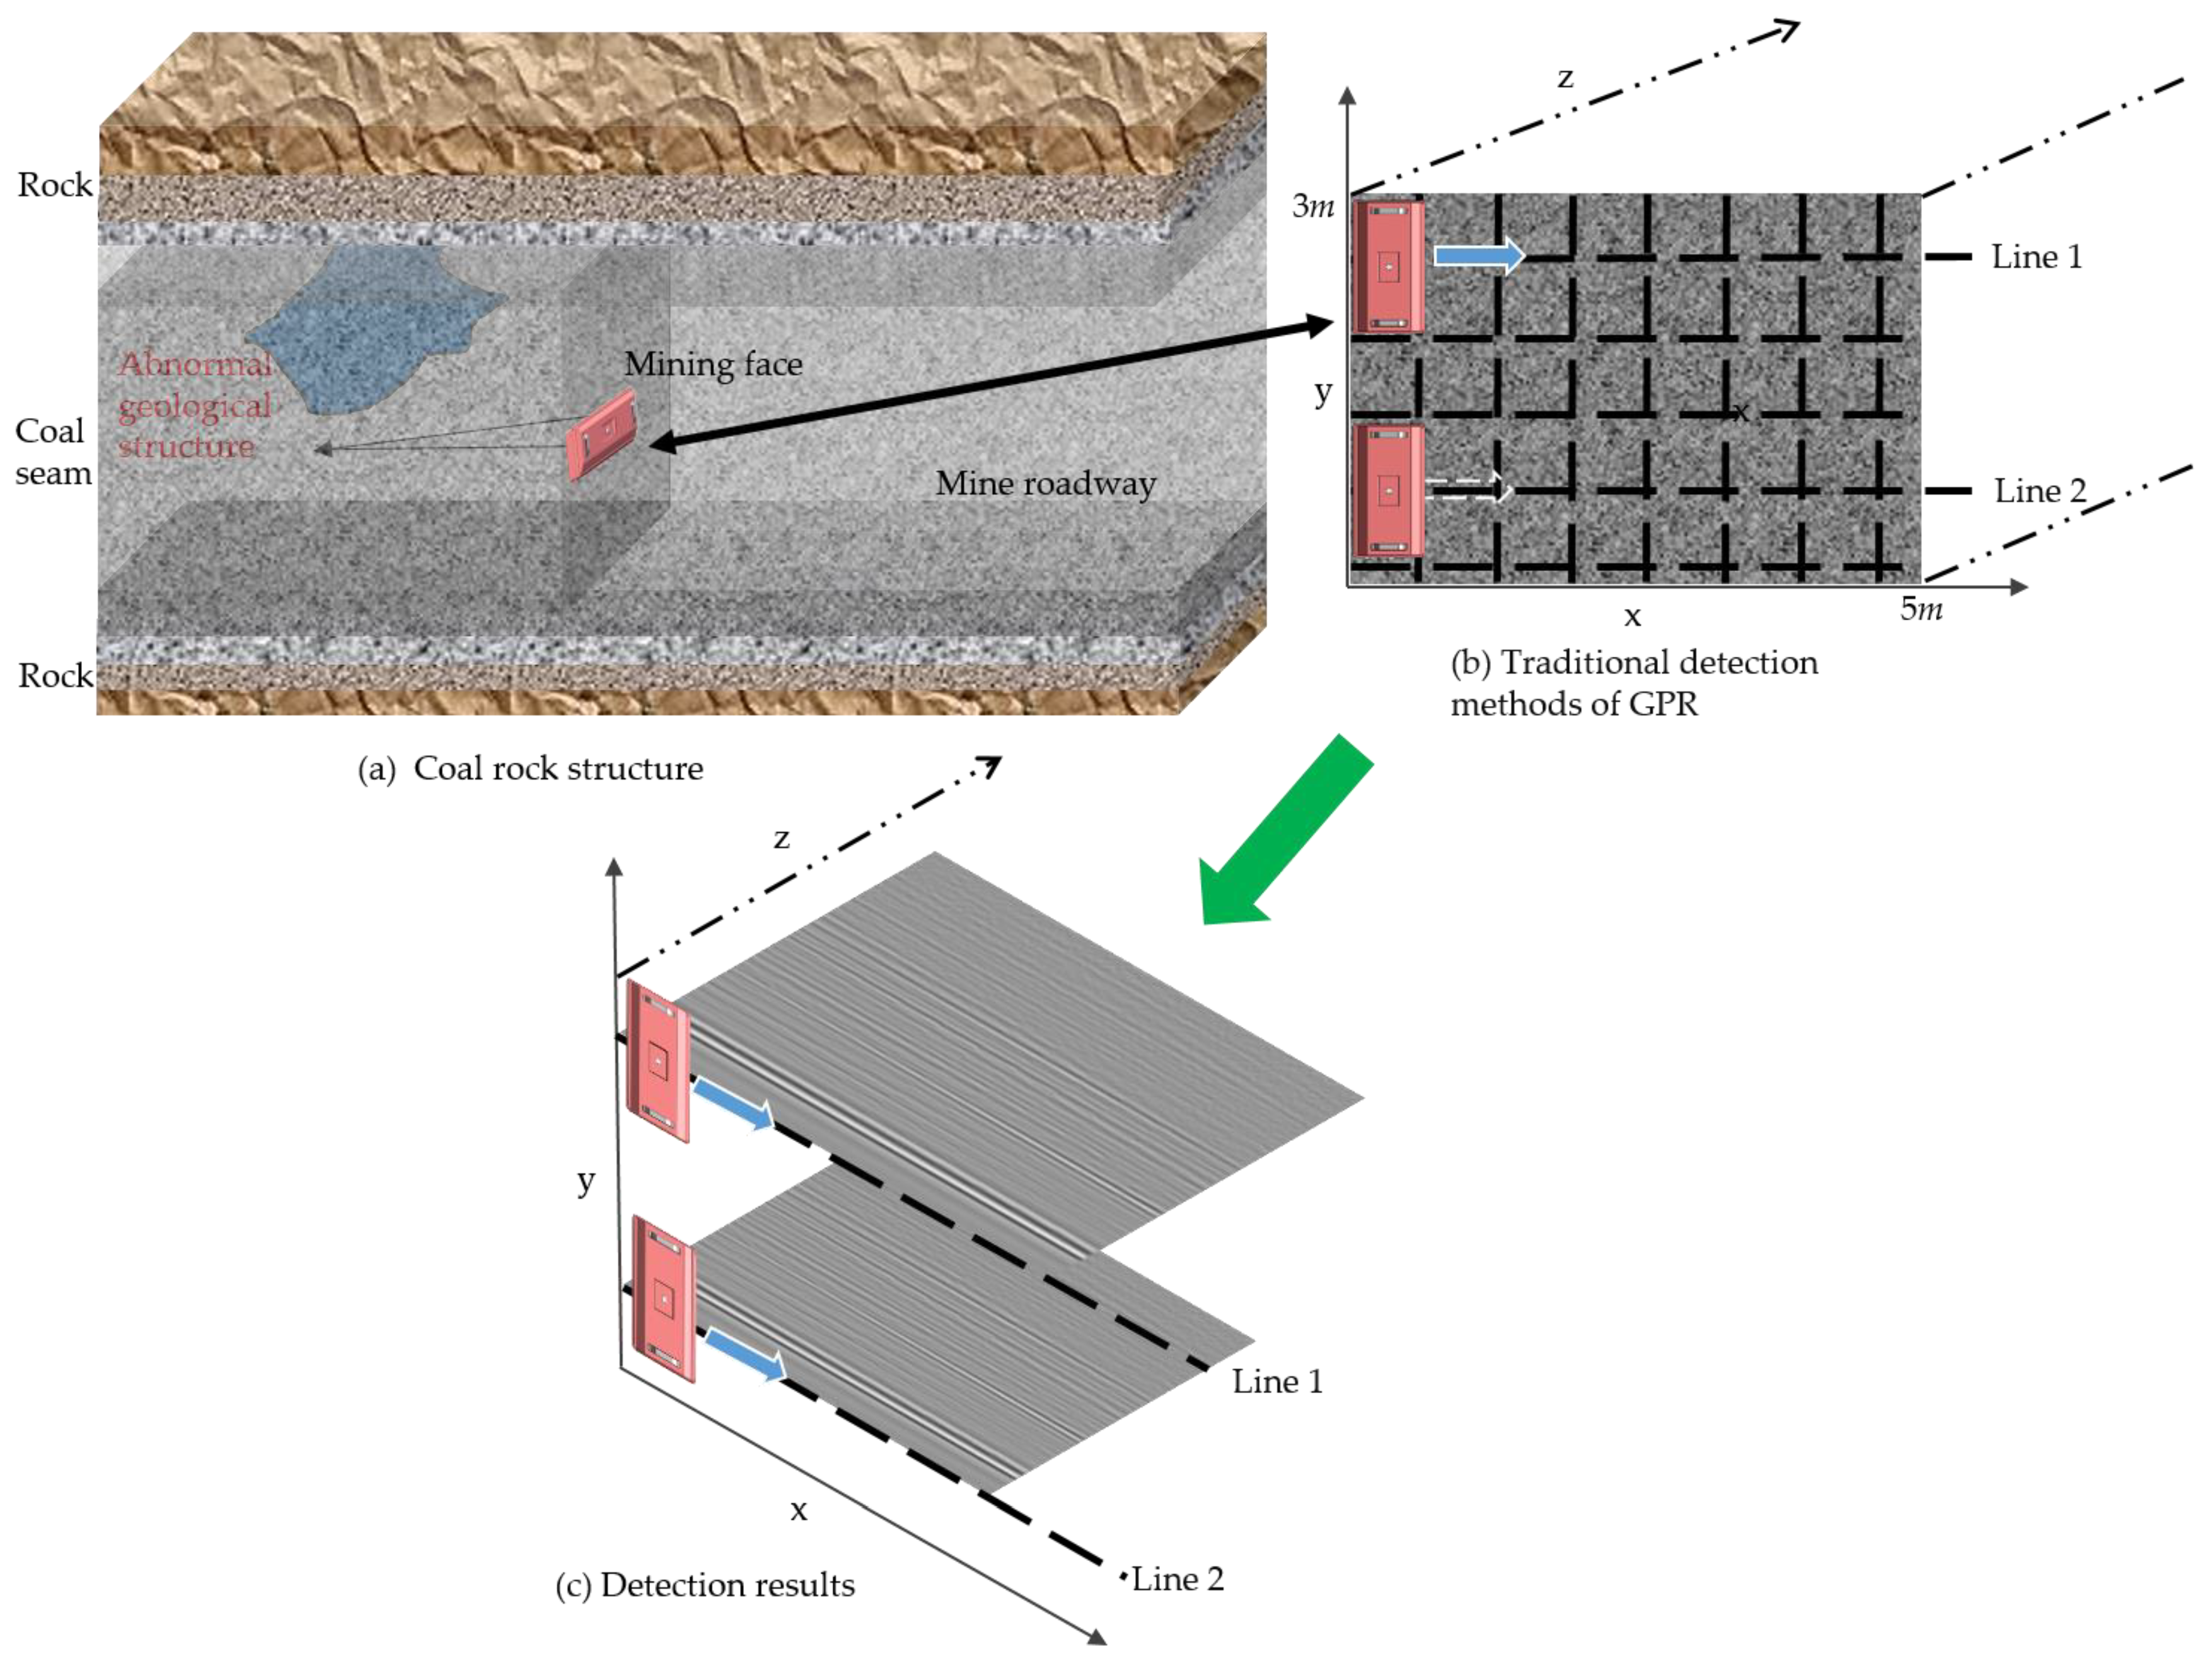
The traditional advanced detection method of GPR in coal mine environments (Figure 2b) typically involves laying survey lines on the mining face to detect and acquire geological information about the unknown areas ahead. However, this traditional approach presents several limitations:
  • Limited detection accuracy: As shown in Figure 2a, the coal mining face is a fully enclosed and confined space, with typical height and width dimensions of 3 m and 5 m, respectively. In extreme geological conditions, this space becomes even narrower, severely restricting the layout of survey lines. Due to these spatial constraints, only one or two survey lines can be arranged on the mining face, leading to highly limited spatial coverage and data acquisition (Figure 2c). This makes precise analysis of the unknown geological conditions ahead extremely difficult.
  • Limited detection range: As shown in Figure 2b, the survey lines are positioned on the mining face, allowing for detection only in the direction of mining operations. However, it is ineffective in detecting potential geological hazards in areas beyond the observation range, such as the roof of the coal mine roadway (Figure 2a).
  • Limited detection depth: While the theoretical detection depth of GPR in mine environments can reach tens of meters, the actual effective depth is limited to only a few meters to over ten meters. This is primarily due to the exponential attenuation of high-frequency electromagnetic waves as they propagate through the medium, weakening the strength of deep signals. Additionally, signals reflected by steel supports, metal mesh, and electromagnetic interference from mining equipment, along with scattered signals in confined spaces, are all captured by the receiving antenna, further reducing the signal-to-noise ratio of deep detections. In the absence of stable geological structure features and prior geological information, effectively distinguishing geological information from the interference signals becomes extremely difficult, presenting additional challenges for the processing, analysis, and interpretation of deep data.
  • Limited spatial information on geological structures: GPR is based on the principle of electromagnetic wave reflection and detects geological structures according to differences in dielectric properties. When geological structures develop in horizontal or vertical directions and are either parallel or at steep angles to the mining direction, their reflected signals may be directed into unknown areas and cannot be captured by the receiving antenna. This can result in suboptimal detection of geological structures, making it challenging to obtain critical geological information such as spatial distribution and extension direction.
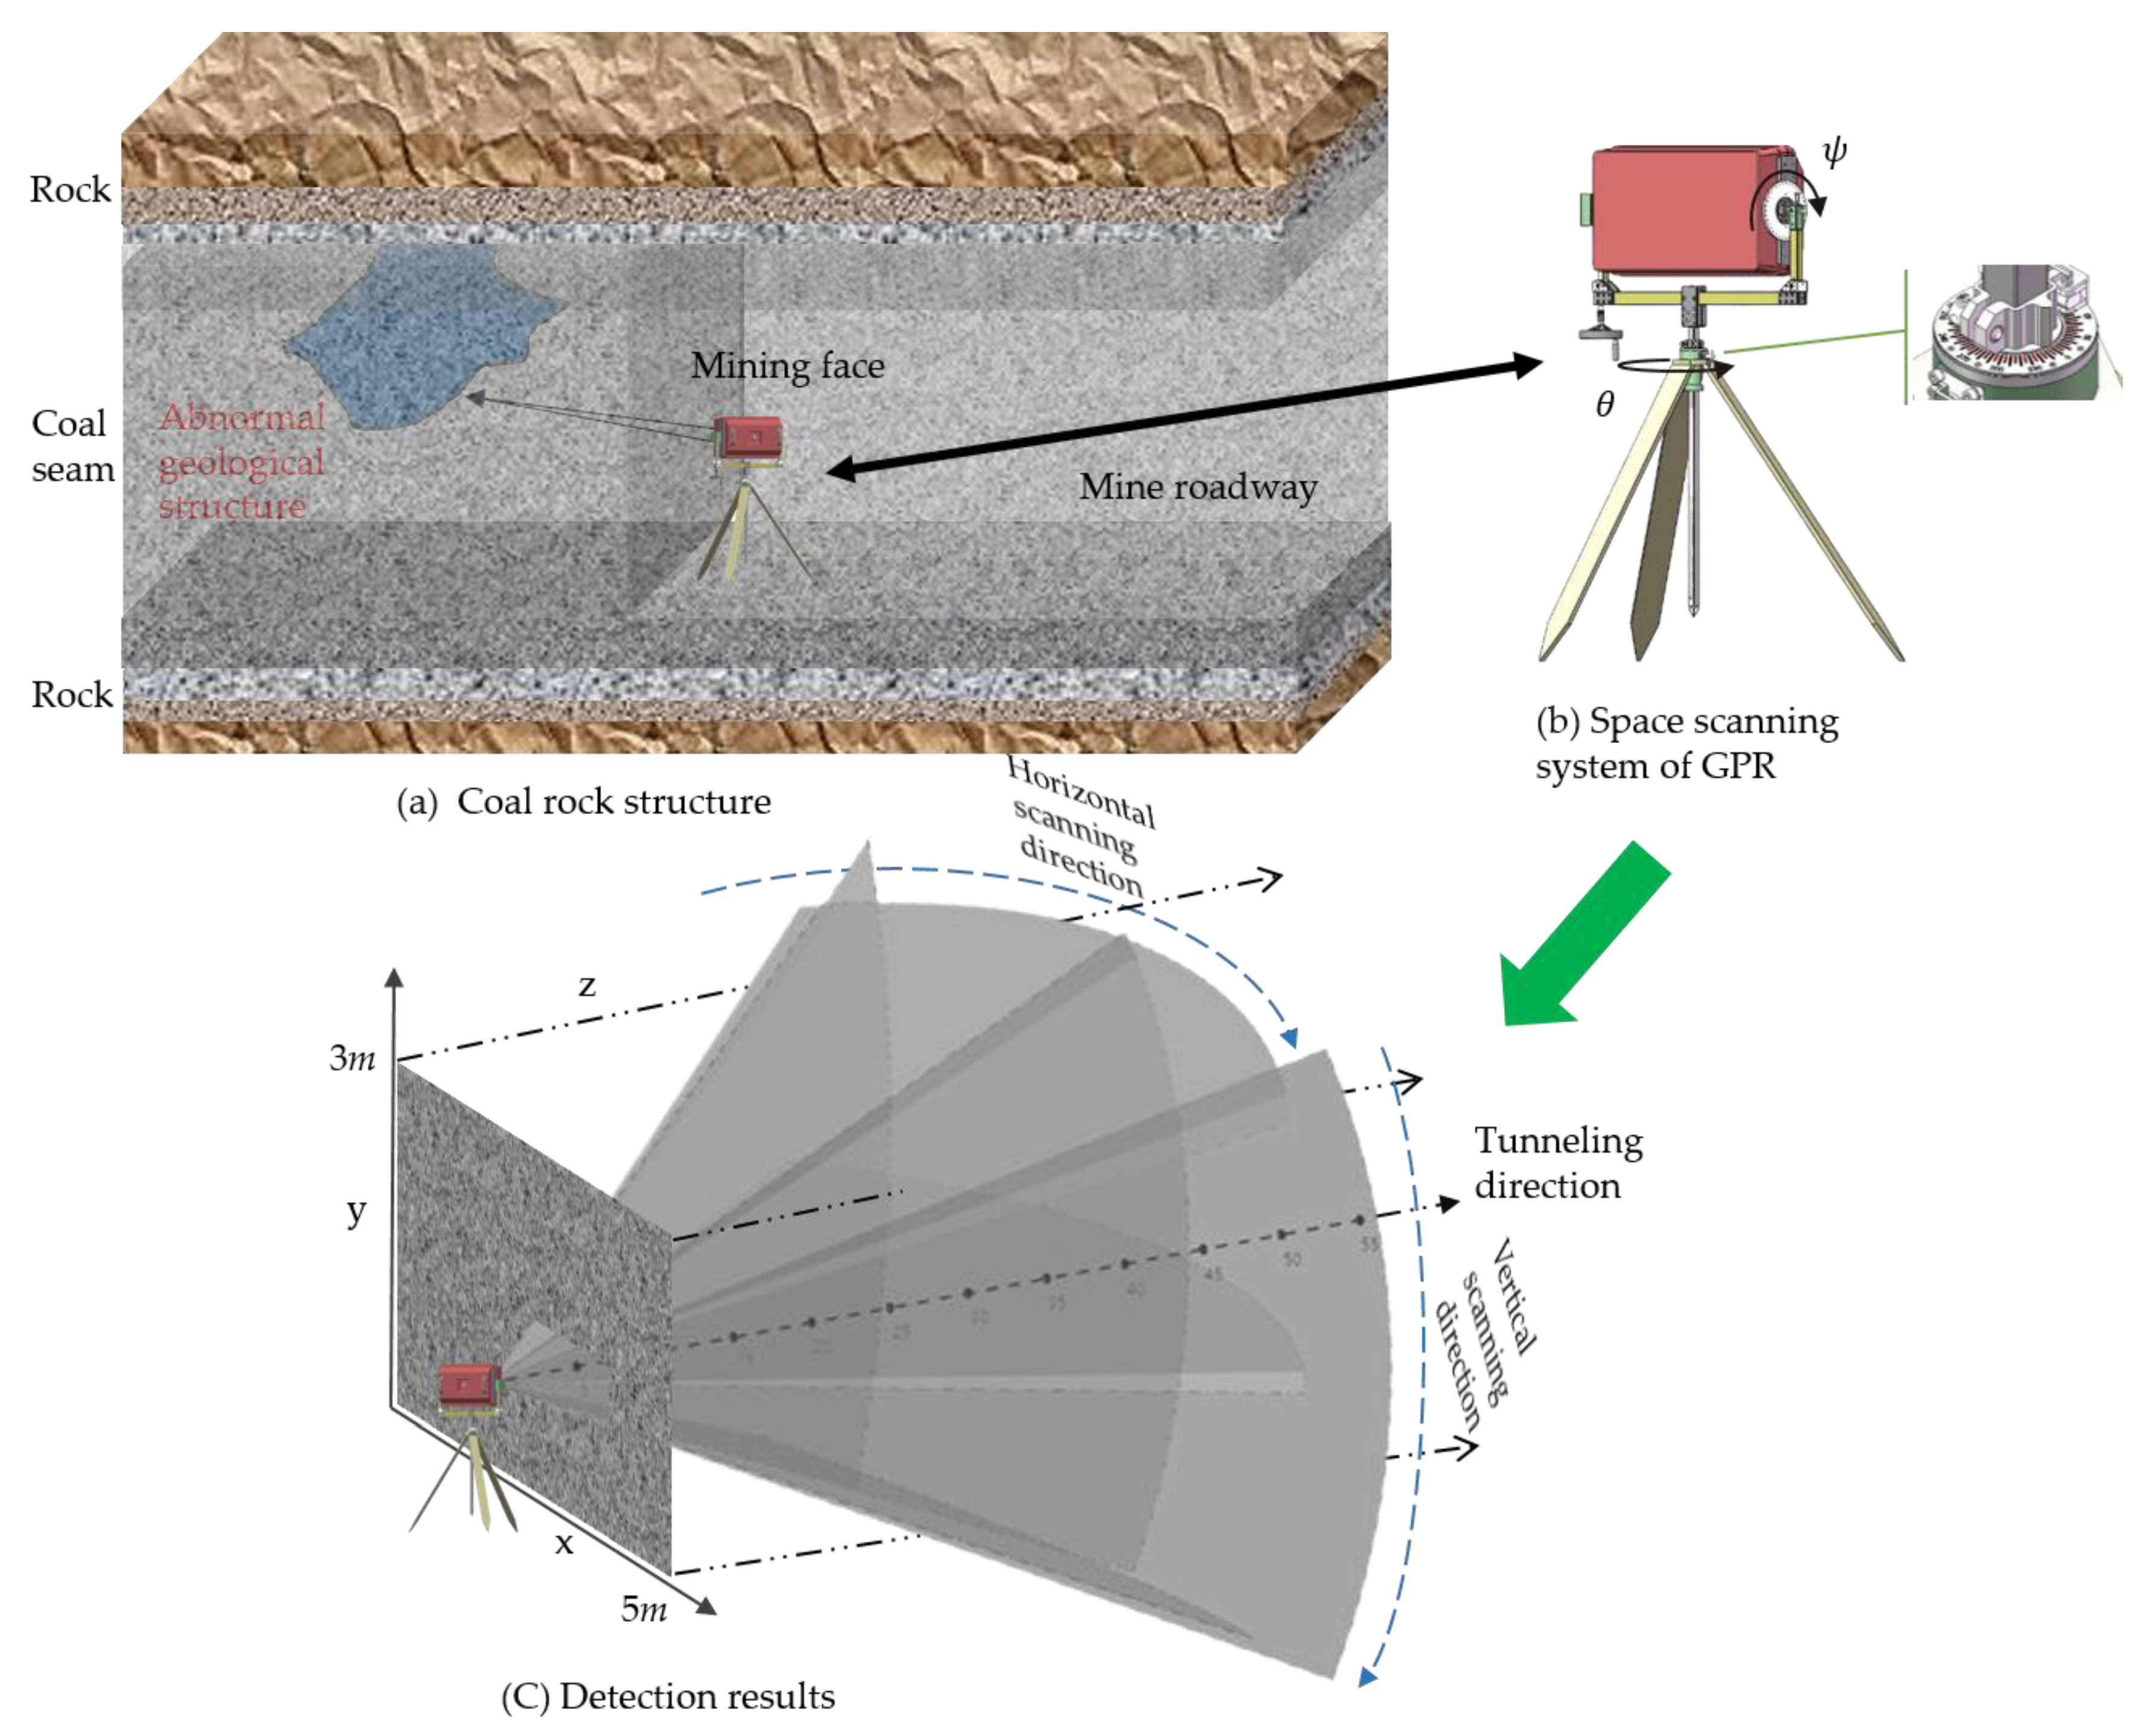
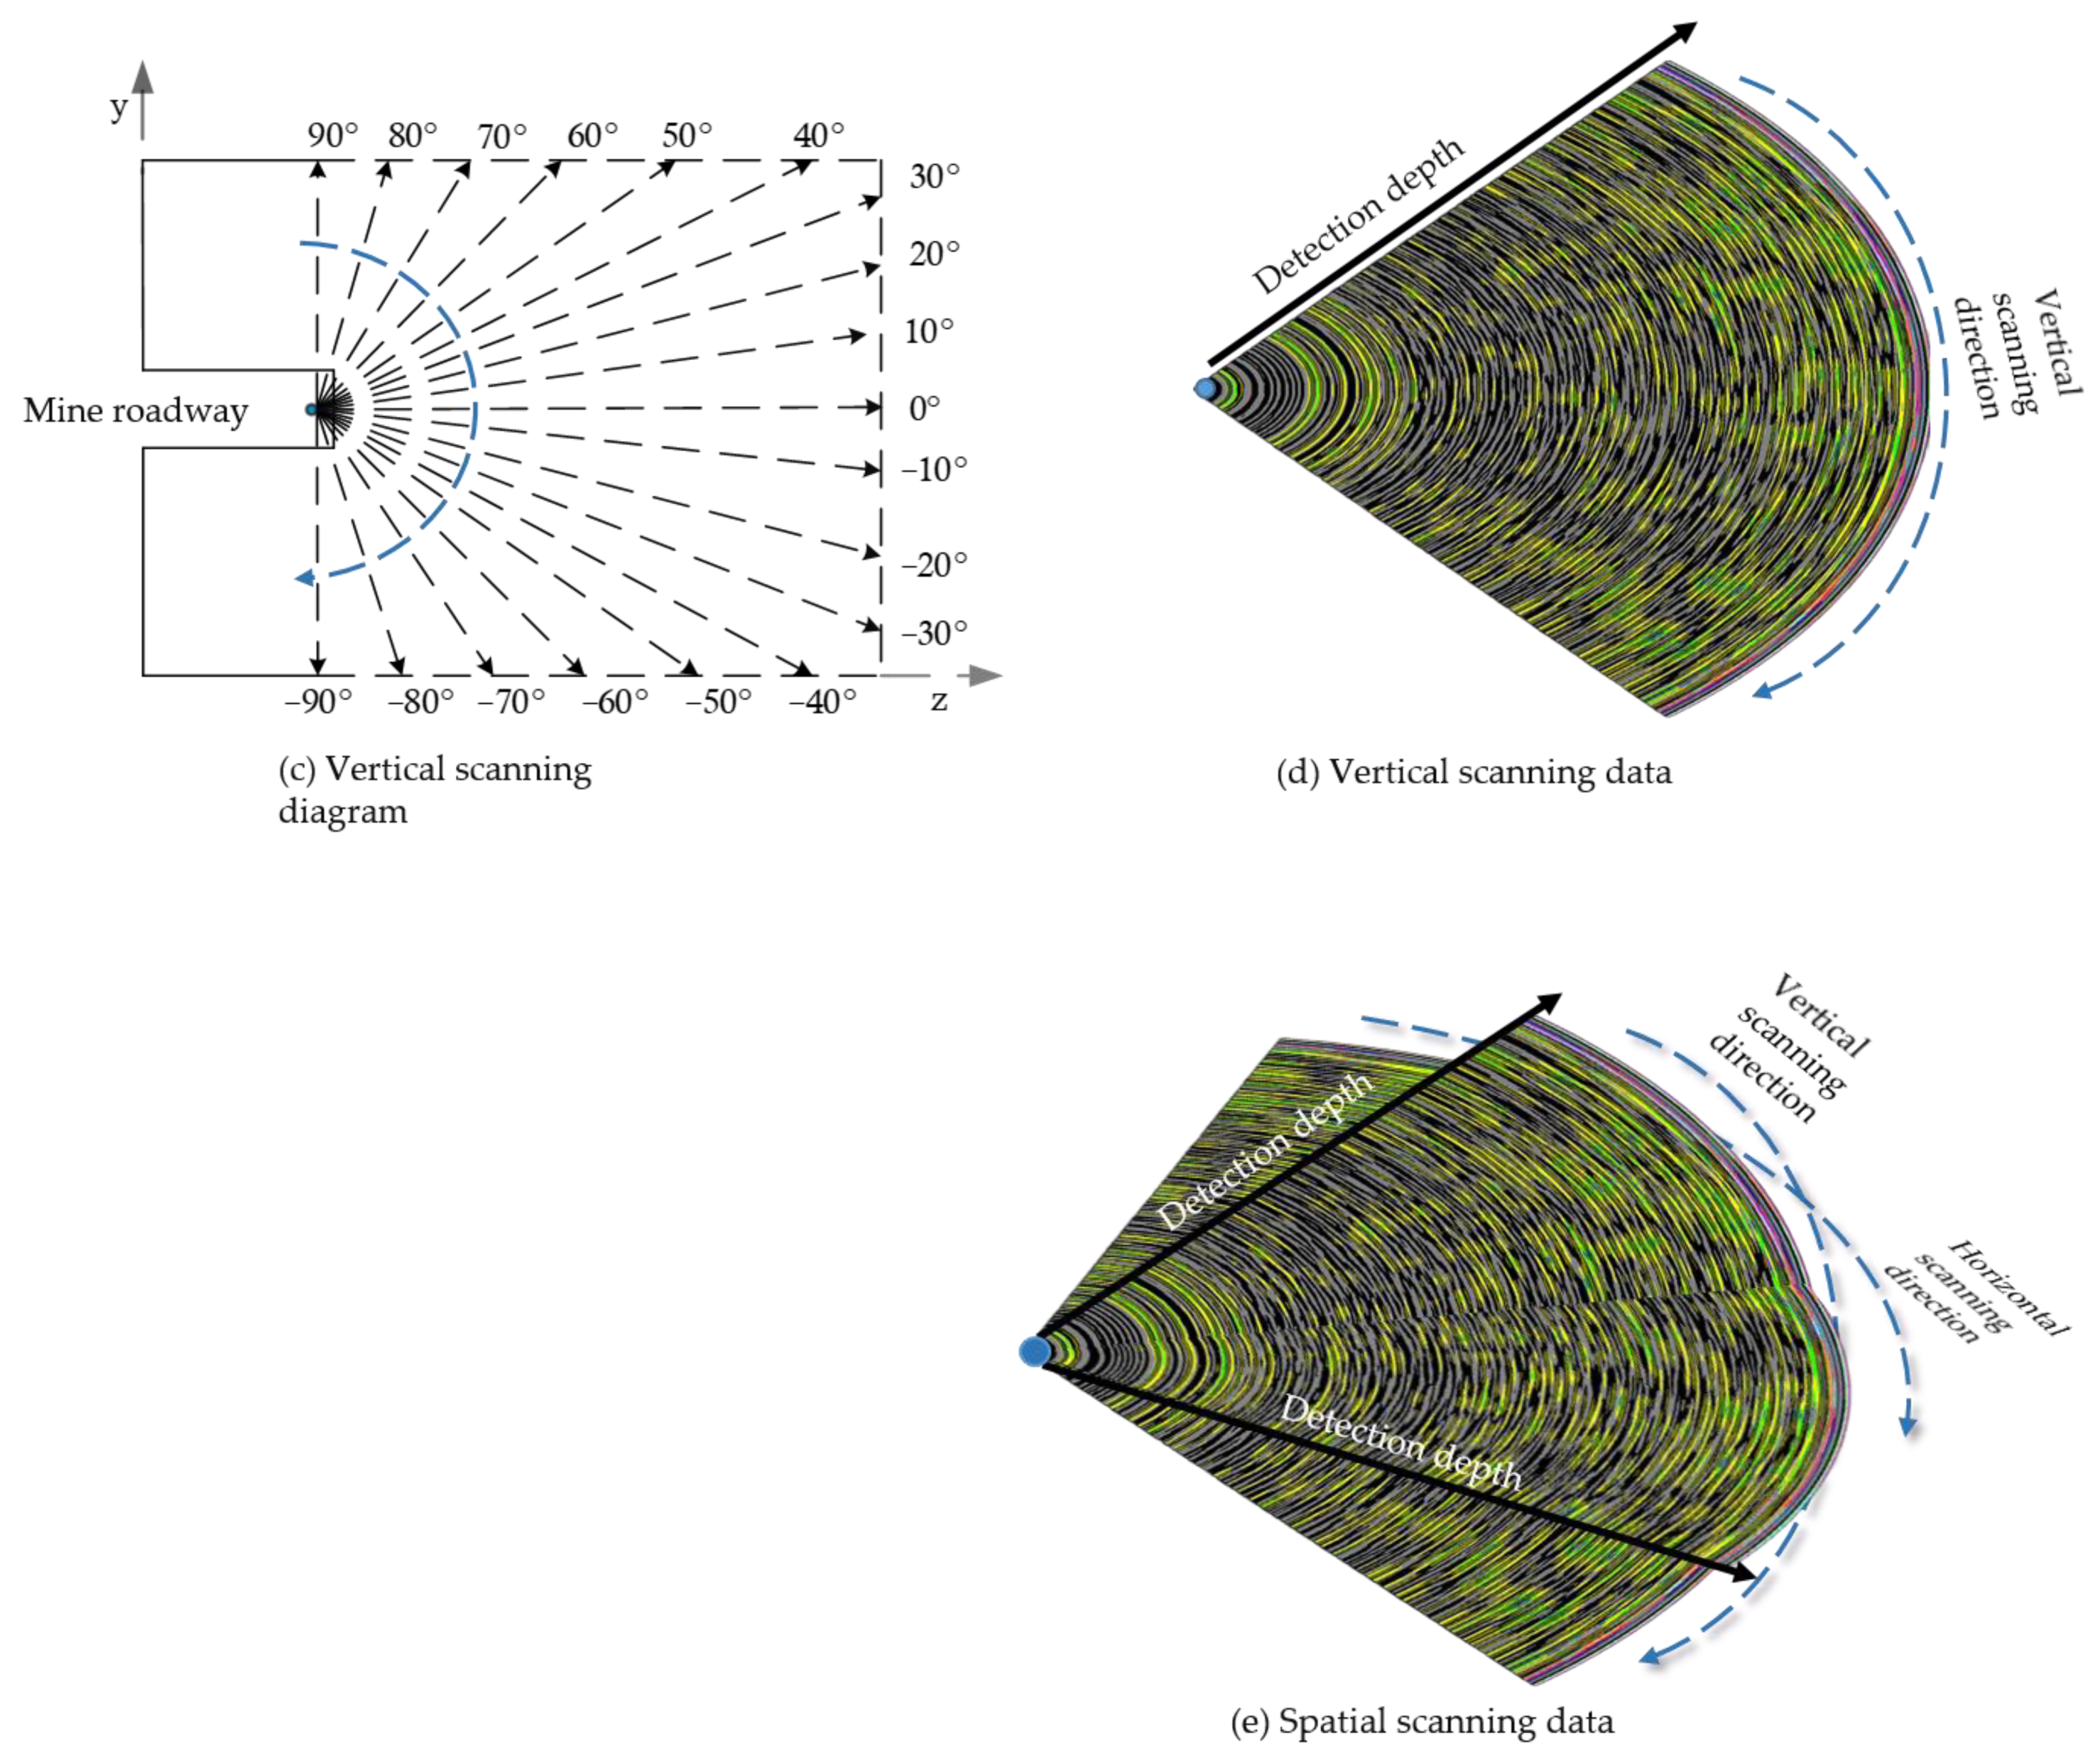
In response to the limitations of traditional advanced detection methods using GPR in underground coal mine environments, this study proposes a novel GPR-based advanced detection method utilizing spatial scanning, tailored to the actual working conditions of coal mining faces. As illustrated in Figure 3b, this method is implemented through a GPR spatial scanning system. During the detection process, the spatial scanning system is deployed at the coal mine working face (as shown in Figure 3a), and the antenna’s horizontal and vertical rotation angles, θ and ψ , are adjusted to control the antenna’s orientation. This adjustment modifies the transmission and reception directions of the antenna, thereby acquiring geological information from unknown spatial areas (Figure 3c and Figure 4e). Throughout the detection process, the antenna’s orientation and its transmission and reception directions are continuously changing. Let p and p b represent the antenna’s positions in the inertial and spatial coordinate systems, respectively, with the origins of both coordinate systems coinciding but differing in angular orientations [31]. In the initial state, the relationship between the spatial and inertial coordinate systems is p b 0 = p . The antenna performs horizontal scanning by rotating θ degrees around the y-axis (Figure 4a,b) and vertical scanning by rotating ψ degrees around the x-axis (Figure 4c,d). The rotation matrices for these two operations are R y θ and R x ψ , respectively. After rotation, the antenna’s posture in space, p b , can be expressed through matrix multiplication as shown in Equation (3):
p b = R x ψ R y θ p = cos θ 0 sin θ sin ψ sin θ cos ψ sin ψ cos θ cos ψ sin θ sin ψ cos ψ sin θ p = R y x θ , ψ   p
In the equation, R y x θ , ψ represents the rotation matrix after the antenna undergoes horizontal and vertical scanning, which is influenced by the order of rotation. Due to the limitations of the detection equipment (as shown in Figure 4), the angles θ and ψ are restricted to the range [−π/2,π/2]. Therefore, the rotation matrix is expressed as shown in Equation (4):
R y x θ , ψ = cos θ 0 sin θ sin ψ sin θ cos ψ sin ψ cos θ cos ψ sin θ sin ψ cos ψ sin θ p
In the process of the antenna scanning in space, its movement can be expressed by Equation (5):
p = p 0 + R y x θ , ψ T p b
In the equation, p 0 represents the initial orientation of the antenna. Given that the rotation axes are mutually orthogonal, the inverse of the rotation matrix R y x θ , ψ is equal to its transpose R y x θ , ψ T . Therefore, the reception of energy during the antenna’s spatial scanning process, including the reflection and refraction of electromagnetic waves, can be described by Equation (6):
P L θ , ψ = R e P t G 2 λ 2 64 π 2 L 2 e 2 a L   1 R a i r , c o a l 2 R c o a l , r o c k   R y x θ , ψ
In the equation, P L θ , ψ represents the received power of the electromagnetic wave reflected by the geological structure at a depth L . P t is the transmitted power of the antenna; G is the gain of the antenna’s main lobe in the direction of detection; λ is the wavelength of the electromagnetic wave in the medium, which is related to the antenna’s center frequency and the dielectric parameters of the medium; a is the attenuation factor of the electromagnetic wave in the lossy medium; and R a i r , c o a l and R c o a l , r o c k are the reflection coefficients at the air–coal and coal–rock interfaces, respectively.
In the underground coal mine environment, the aforementioned spatial scanning detection method offers significant advantages over traditional forward-looking detection techniques of GPR:
  • Higher detection accuracy: During the spatial scanning process, the detection area is divided into k × k sector scanning units, with the antenna transmitting and receiving signals at the center of each unit. As the rotation angles θ and ψ are adjusted, the transmission points Tri, where I = θ 1 ψ 1 , θ 1 ψ 2 ,…, θ 1 ψ k ,…, θ k ψ 1 , θ k ψ 2 ,…, θ k ψ k , and the corresponding reception points Rei, change accordingly. This method allows for fine-grained management of the scanning space, significantly increasing the amount of spatial detection data (as shown in Figure 3c) and enhancing detection accuracy. Additionally, this detection approach eliminates the need for laying detection lines along the working face, thus freeing the detection equipment from the constraints of the working surface.
  • Significant expansion of detection range: As illustrated in Figure 3a,b, there is no need to deploy survey lines above the mining working face for wall-attached detection, thereby removing spatial constraints imposed by the working face. By utilizing the spatial scanning system, comprehensive coverage from −90° to 90° in both horizontal and vertical directions (as shown in Figure 4a,d) can be achieved, facilitating the exploration of nearly all potential detection areas along the mining direction.
  • Capacity for obtaining spatial distribution information of geological structures: This method is especially suitable for planar geological structures (such as faults, thin coal layers, etc.), which exhibit stable response characteristics. Through detailed analysis of energy variation characteristics, geological structures can be accurately identified amidst numerous interference signals. Moreover, crucial geological information, including spatial distribution, can be obtained based on changes in rotation angles during the detection process. The subsequent sections of this paper will delve into how this method significantly enhances detection accuracy and retrieval of spatial distribution information.

3. Simulation Experiment and Result Analysis

3.1. Experimental Detection of Target Response Characteristics

3.1.1. Detection Process and Phenomena

To investigate the response characteristics of the proposed method and the imaging principles, simulated detection experiments were conducted at the South Plaza of China University of Mining and Technology (Beijing) Shahe Campus. In this experiment, as shown in Figure 5, two detection targets, f 1 and f 2 , were set up to simulate the spatial distribution of mining faces and planar geological structures. Specifically, f 1 was a solid wall, made of solid brick and concrete with dimensions of 6 m height, 12 m width, and 0.5 m thickness; while f 2 was tin foil with dimensions of 1 m height, 1 m width, and 0.002 m thickness. The targets f 1 and f 2 were arranged in parallel with a separation of 6.5 m between them. The antenna was positioned at point p 0 , 1 m away from target f 1 , with its radiation plane initially forming a perpendicular relationship with the planes of targets f 1 and f 2 . During the experiment, the antenna rotates clockwise (as shown in Figure 4a) with the vertical rotation angle fixed at 0°. The horizontal rotation occurs at intervals of 0.2°, covering a horizontal space from −90° to 90°. Additionally, the radar antenna is a 100 MHz shielded enhanced antenna from China University of Mining and Technology (Beijing), designed with explosion-proof capabilities for underground coal mines. The antenna operates at a central frequency of 100 MHz with a sampling frequency of 100 kHz, utilizing 1024 sampling points and a minimum sampling interval of 5 ps. The antenna’s preamplifier provides a gain of 48 dB. Notably, the radar antenna supports both single-point and time-domain sampling modes. For this experiment, the single-point sampling mode was chosen with a sampling window set to 150 ns. During the detection process, the horizontal rotation angle θ is adjusted manually using the dial (as shown in Figure 3b), triggering data sampling with each adjustment, thereby completing the collection of horizontal spatial data from −90° to 90°.
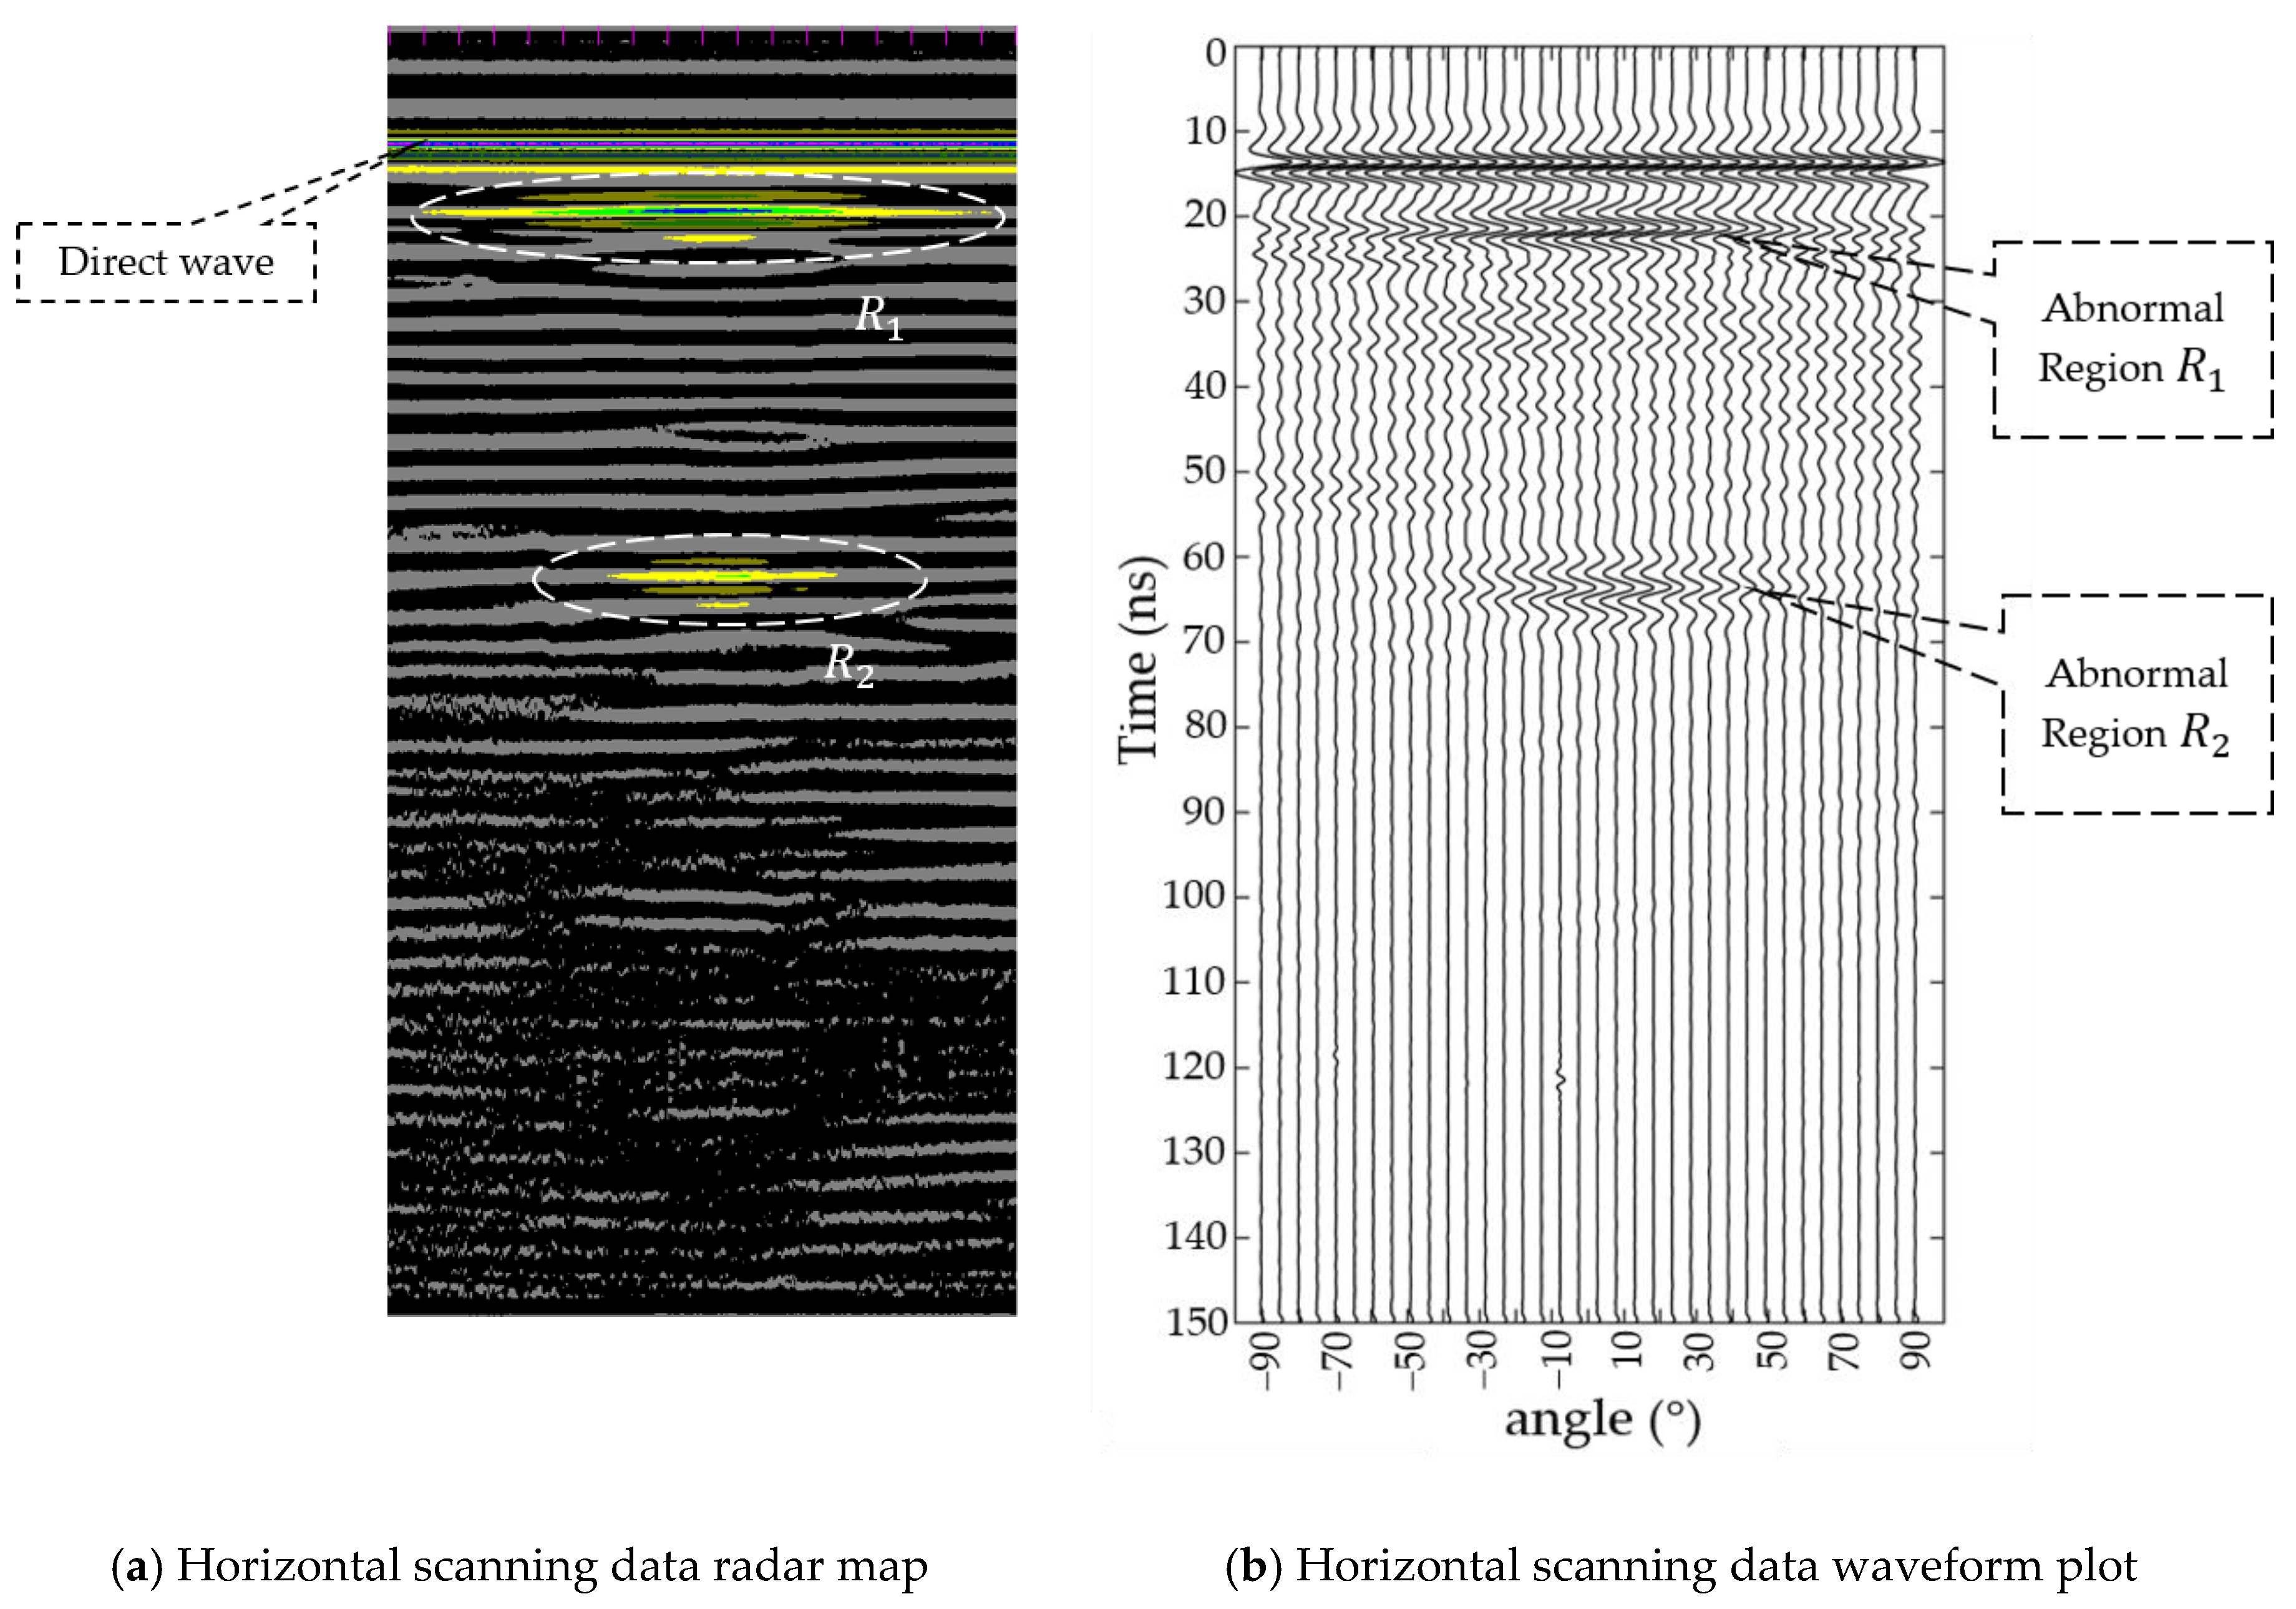
The detection data were processed using conventional methods such as filtering, background noise reduction, and gain adjustment to obtain detection results (Figure 6). In the detection results, the bidirectional travel time difference between the peak energy positions of the direct wave and the anomalous reflection region R 1 was approximately 7 ns. Considering the speed of electromagnetic waves in air as 0.3 m/ns, R 1 was calculated to be approximately 1.05 m from the antenna. Given the 1.0 m distance between target f 1 and the antenna, and ignoring errors during the detection process, R 1 was confirmed as the electromagnetic signal response from f 1 . Similarly, the bidirectional travel time difference between R 1 and R 2 was approximately 44 ns, estimating the distance between R 1 and R 2 to be around 6.6 m. Considering the 6.5 m distance between targets f 1 and f 2 , R 2 was identified as the electromagnetic signal response from f 2 . The characteristics of R 1 and R 2 differ from the traditional hyperbolic response features of GPR (Figure 6a). Specifically, the travel times of R 1 and R 2 remain stable regardless of the antenna’s rotation angle, and their responses exhibit a linear distribution overall. In the radar data image, R 1 and R 2 appear brighter at their central positions, gradually becoming darker towards both sides at the same travel time, displaying smooth and regular variations. The overall contour of R 1 and R 2 shows higher brightness at the center, lower brightness at the sides, a thicker center, narrower sides, and a symmetrical distribution resembling a pea-shaped pattern, highlighting their regular distribution characteristics.
Figure 6b depicts the vertical axis as bidirectional travel time and the horizontal axis as horizontal scanning angle. Within the reflected wave groups R 1 and R 2 , each component’s energy exhibits a trend of initial enhancement followed by attenuation over time, resulting in significantly higher energy peaks at the central positions of the reflected sub-wavelets, while the energy peaks at the upper and lower sides are relatively weaker. The reflected wave groups display a symmetric state at the central position. During horizontal rotation from −90° to 90°, the energy of the reflected wave groups demonstrates a spatial pattern of initial enhancement followed by decay, gradually diminishing from the central position towards both sides. Throughout this attenuation process, the energy of the wavelet peaks at the upper and lower sides of the reflected wave groups decays more prominently due to their initial weaker intensity, whereas the energy of the wavelet at the central position exhibits less noticeable decay despite its stronger initial intensity. This results in R 1 and R 2 displaying a pea-shaped pattern with a thicker center, narrower sides, brighter middle, and darker sides.

3.1.2. Analysis of Detection Results

The formation of target response characteristics is related to antenna motion. During the spatial scan process of the antenna, its radiation direction continuously changes, leading to variations in the antenna radiation field with movement. Since commonly used GPR antennas excite electric fields, the far-field radiation field strength E r , α , β distributed at a distance r from the antenna can be expressed as Equation (7):
E r , α , β = E m a x r , I A f α , β e j k r α ^
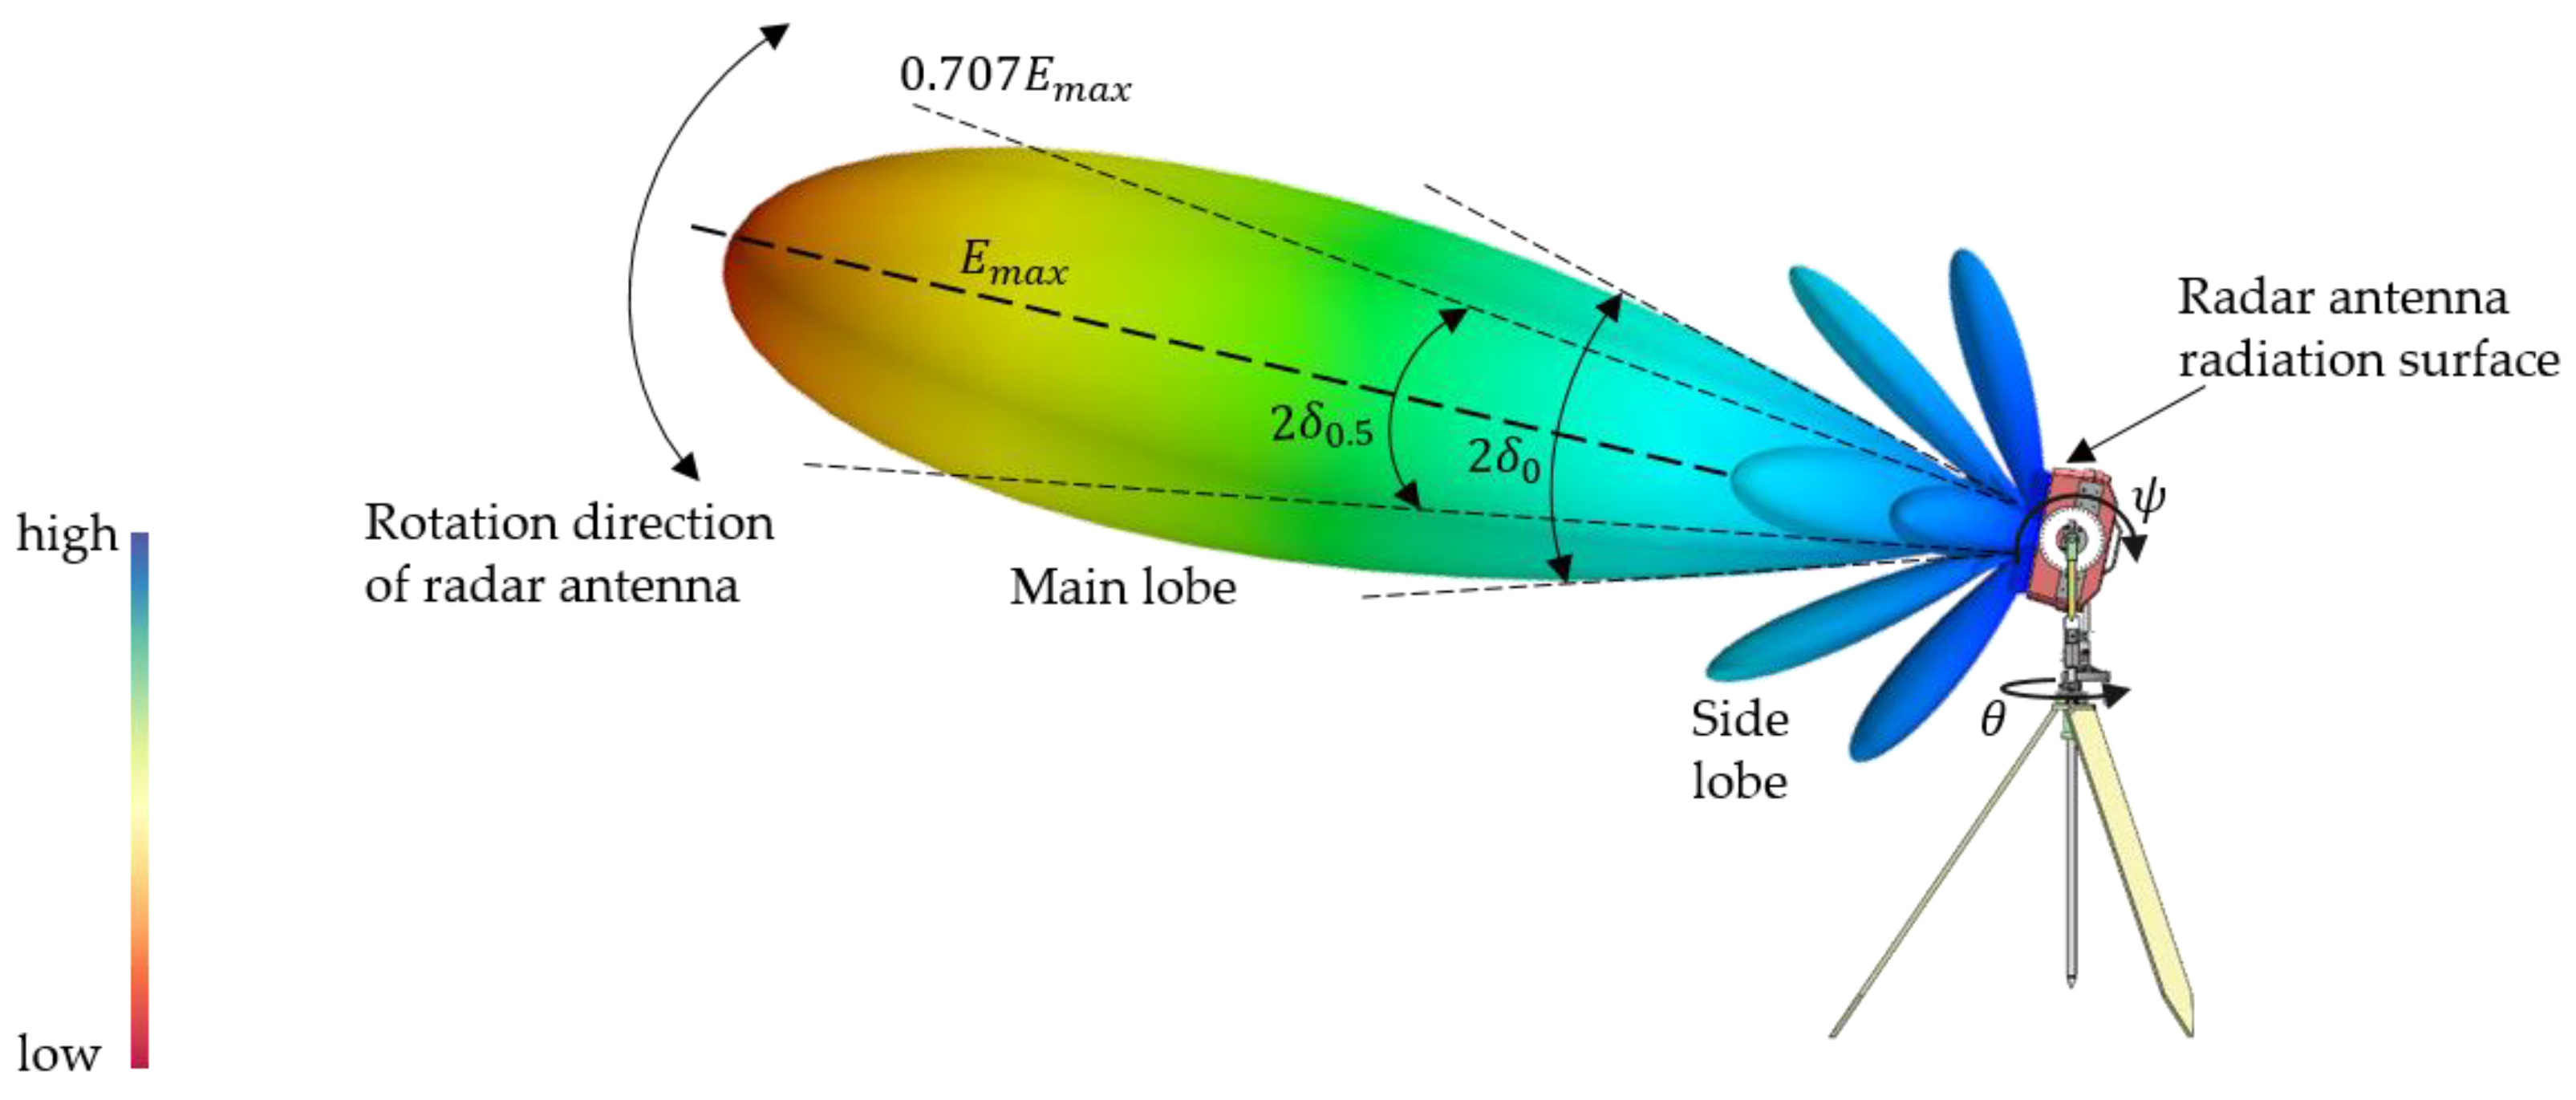
In the equation, α and β represent the horizontal and vertical angles between the observation point and the radiation direction, respectively; α ^ is the directional unit vector; e j k r denotes the phase change of electromagnetic waves, varying with distance; E m a x is the maximum electric field strength in the antenna’s main radiation direction; I A is the current amplitude; and f α , β is the antenna radiation pattern function, indicating the relative distribution of radiation intensity in the radiation space [32]. As depicted in Figure 7, the antenna directional radiation pattern was constructed using f α , β [33]; this illustrates the non-uniform distribution of electric field intensity in the radiation space. In the radiation pattern, the electric or magnetic field consists of multiple lobes, with the main lobe reflecting the antenna’s strongest radiation direction E m a x . The angle 2 δ 0.5 on either side of the main lobe peak represents the half-power attenuation region, where the power density decreases to half (electric field strength of 0.707 E m a x ). For GPR antennas, the range of half-power attenuation region typically spans approximately 60° to 90°.
Therefore, it can be inferred that as the antenna rotates (Figure 7), the radiation direction of the antenna also rotates in space around the coordinate axes, leading to a continuous change in the direction of the main lobe radiation. During this process, the central position of the antenna remains stable, and its relative position to the detection target does not change. Furthermore, the reflection wave groups from R 1 and R 2 exhibit a linear distribution in space (Figure 6b), indicating that the distance from the reflection points to the antenna has not changed significantly. The horizontal rotation angle of the energy peak at R 1 is −3.0°, and when the peak energy attenuates to 0.707 times, the range of horizontal rotation angles is −31.8° to 33.6°, which falls within the antenna’s half-power reduction range. Within this range, the reflection wave groups demonstrate a symmetrical distribution characteristic on either side of the energy peak position. Further analysis shows that in the R 1 and R 2 regions, the average correlation coefficient of the sub-waves at adjacent detection angles reaches 98.97%, with an average spectral similarity of 98.78%. In summary, the formation of the target response characteristics is attributed to the responses generated by wave lobes of varying energy intensities reflecting off the same vertical reflection area during the antenna’s rotation. Since these response characteristics originate from the same reflection area, the reflected sub-waves at different detection angles in the R 1 and R 2 regions exhibit significant similarity. Moreover, the formation mechanism of R 1 and R 2 is primarily induced by the antenna’s motion relationships, which also demonstrate an intrinsic correlation in the space of detection angles.

3.2. Experiment and Analysis of Target Spatial Distribution

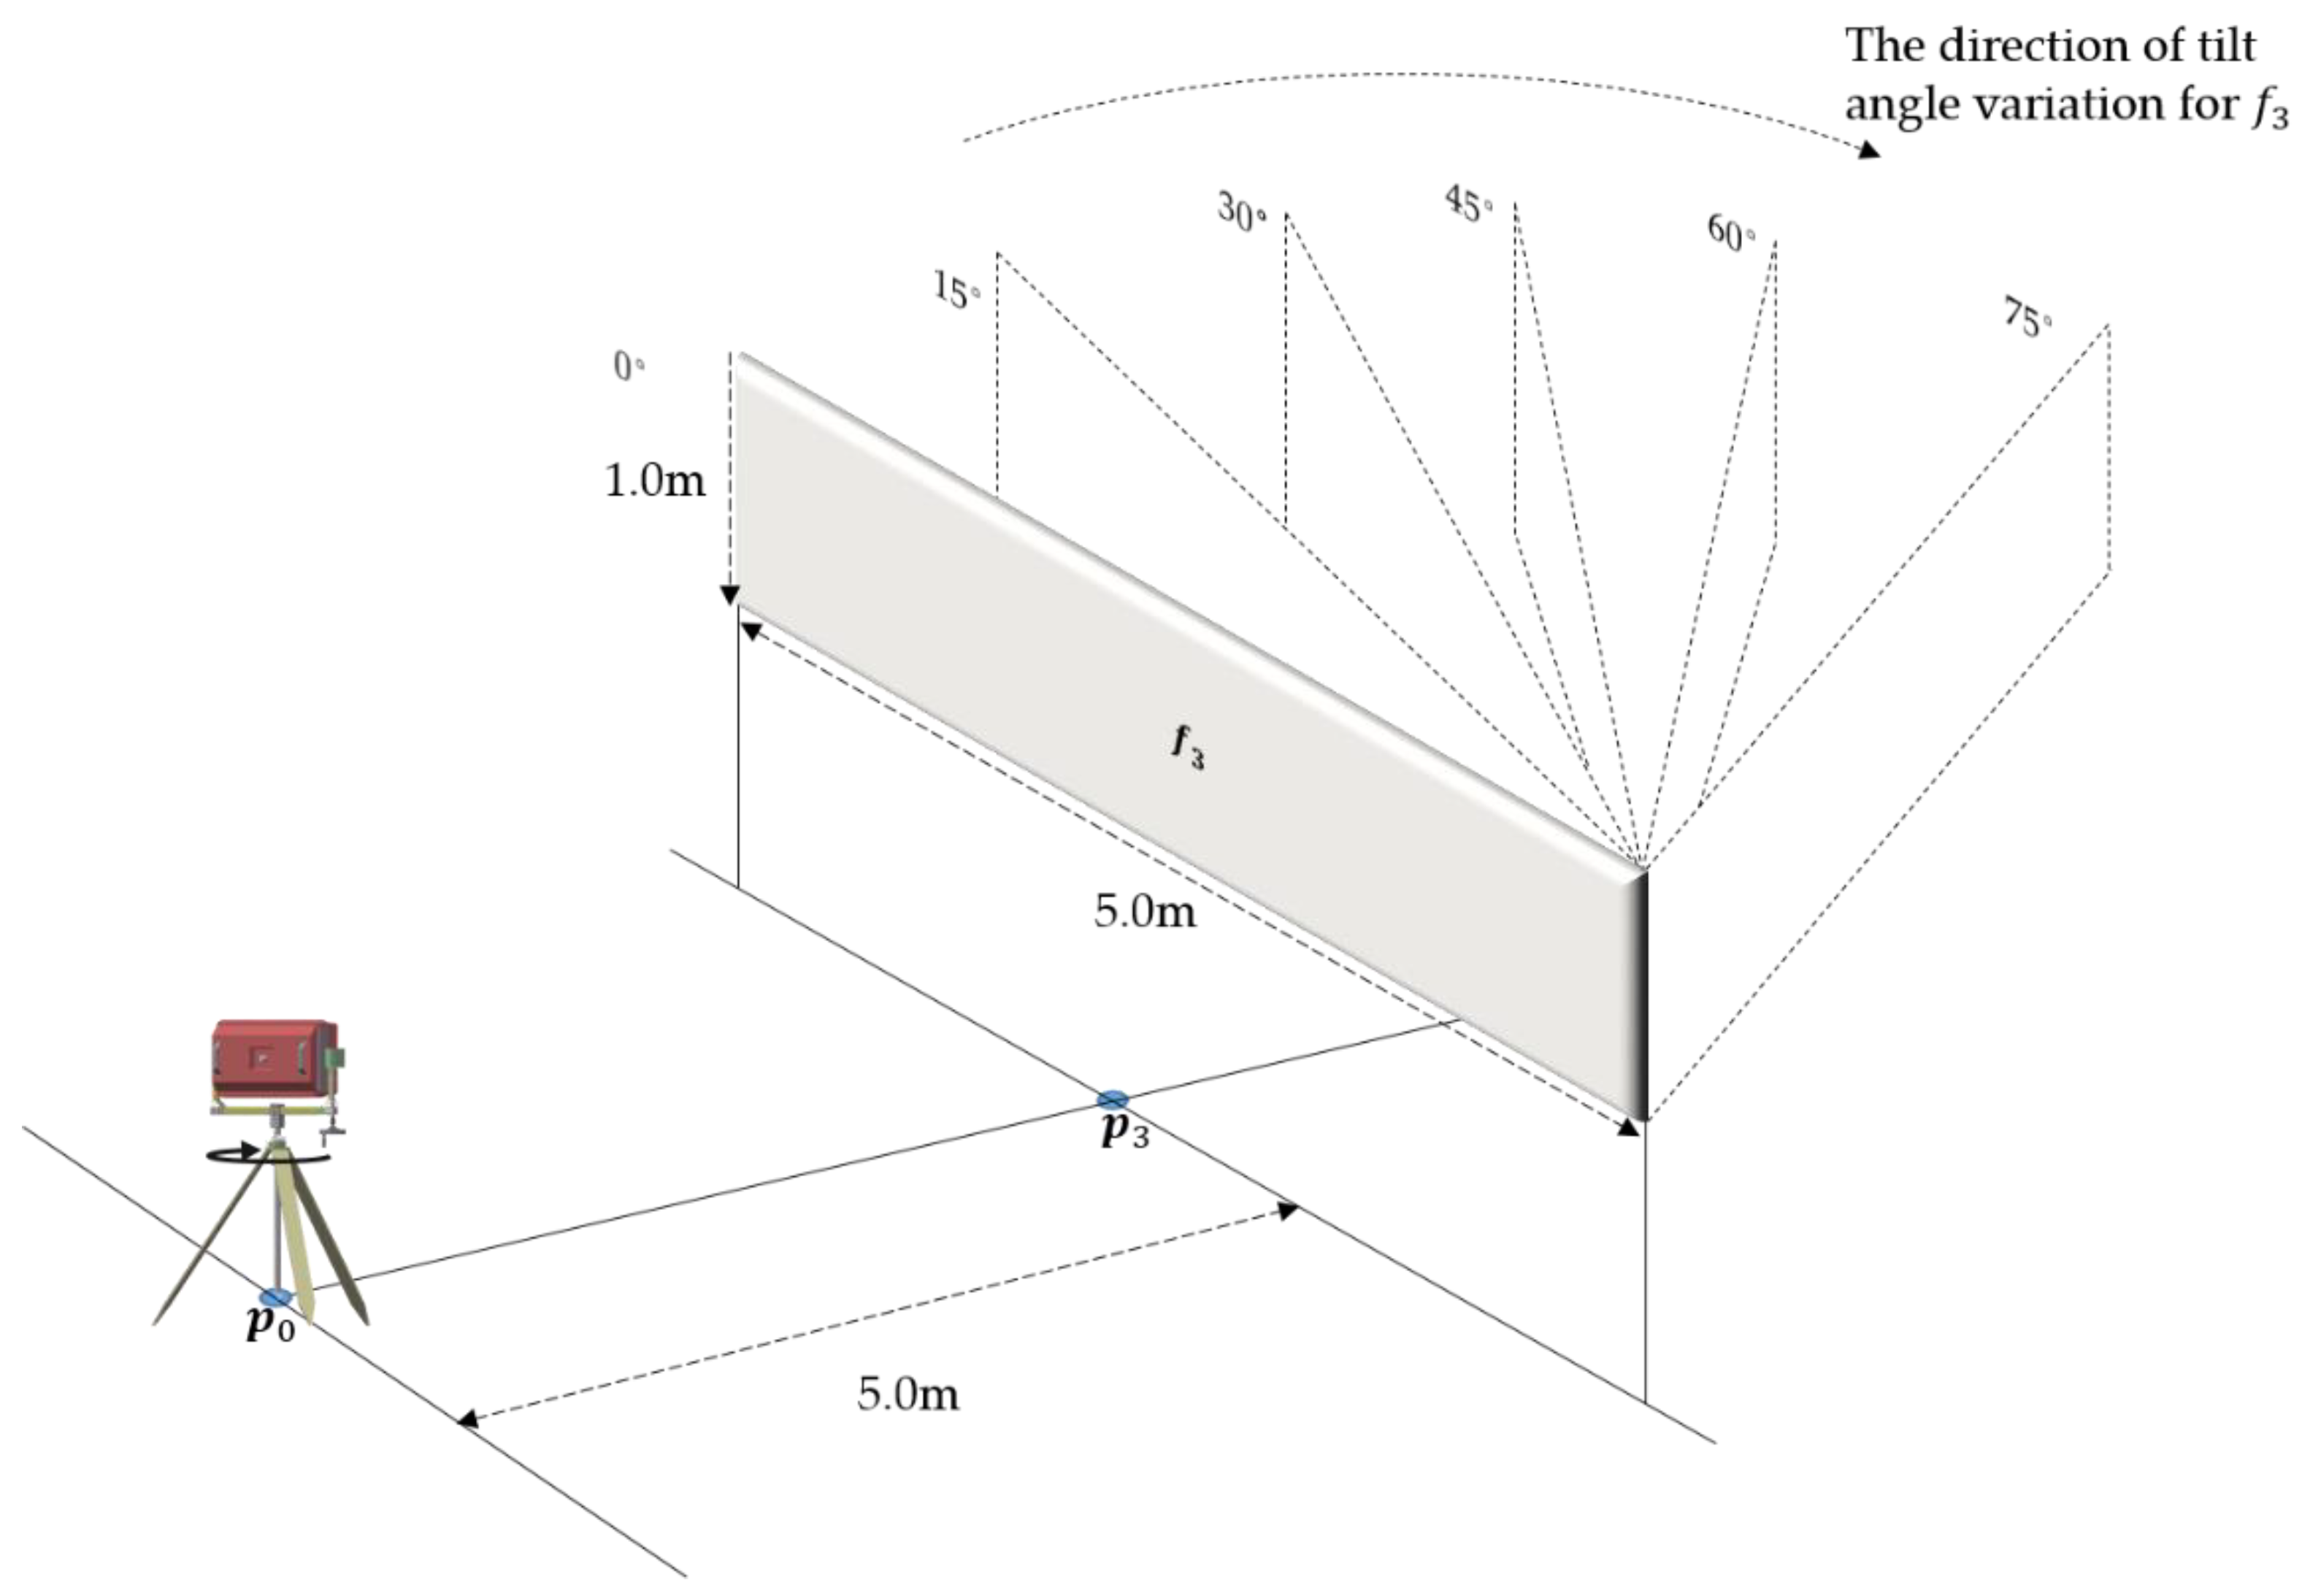
To further analyze the variation in response characteristics of geological structures with different spatial distributions, experiments were conducted using targets with varying tilt angles (Figure 8). Tin foil was selected as target f 3 , with dimensions of 1.0 m in height, 5.0 m in length, and 0.002 m in thickness. The antenna was positioned 5.0 m away from target f 3 , with its radiation plane initially perpendicular to the plane of f 3 . During the experiment, target f 3 was tilted at horizontal angles of 0°, 15°, 30°, 45°, 60°, and 75°. The antenna rotated clockwise with a fixed vertical rotation angle of 0°, and horizontal rotation angles were adjusted in 0.2° increments to cover the range from −90° to 90° of horizontal rotation angles.
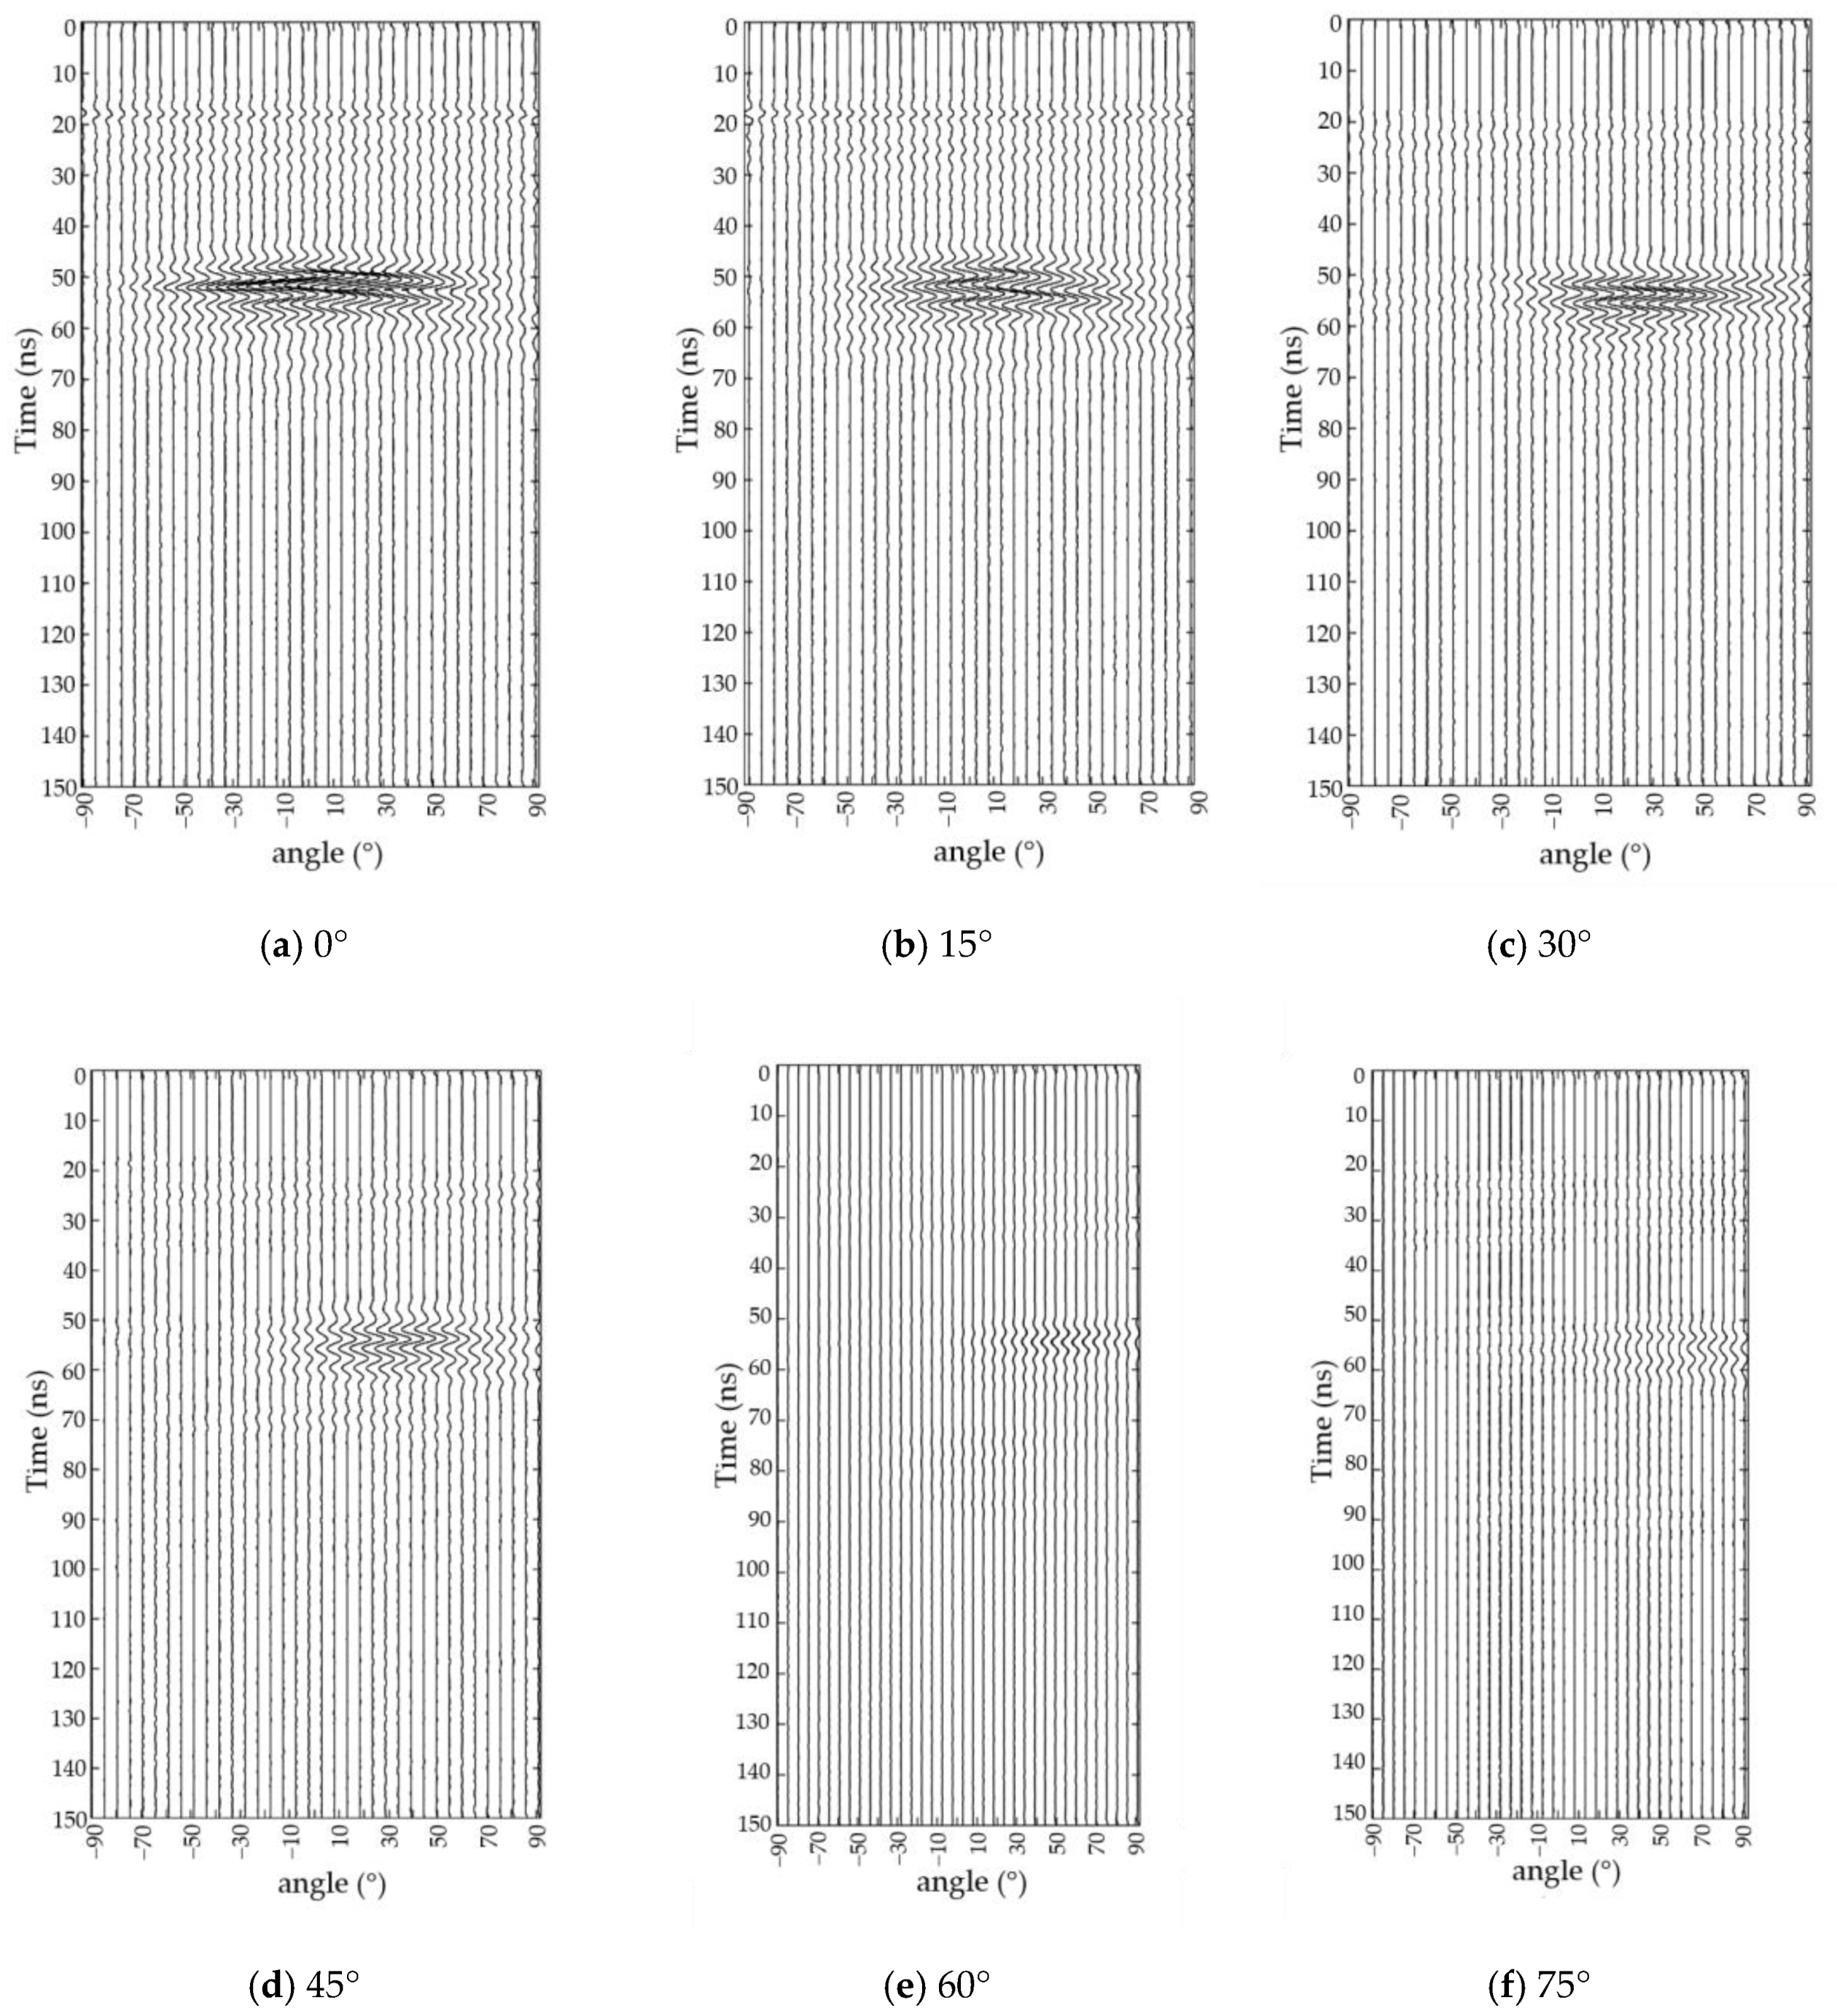
Figure 9a–f respectively show the waveform results when the tilt angle of target f 3 varies from 0° to 75°. The data are processed to remove direct waves. Observing the information in the figures, it can be noted that as the tilt angle of target f 3 changes from 0° to 75°, the corresponding response area of the target in the waveform also shifts. When the tilt angles are 0°, 15°, 30°, and 45°, the reflection energy is stronger, and the characteristics of the target response in the waveform are more pronounced. However, as the tilt angle increases to 60° and 75°, the reflection energy weakens, resulting in a more blurred response feature. According to the principle of electromagnetic wave reflection, when the receiving surface of the antenna is perpendicular to the reflecting surface of the target, the antenna can receive the reflection energy to the greatest extent [34]. When the tilt angle of the detection target is 0°, its reflecting surface is located at the center of the target. As the tilt angle of the detection target changes, the reflecting surface gradually shifts from the left to the right.
As shown in Table 1, the energy peak values and half-power decay angles of the target response regions in Figure 9 were statistically analyzed. The results indicate that with adjustments in the tilt angle of the detection target, the position of the energy peak in the horizontal scanning angle also correspondingly shifted. As the tilt angle of the detection target varied from 0° to 75°, the horizontal scanning angles where the energy peaks were located were −2°, 14.4°, 27.2°, 41.8°, 55.8°, and 72°, respectively. This indicates that the position of the energy peak has shifted spatially from left to right. There exists a linear relationship between the tilt angle of the target and the horizontal scanning angle where the energy peak is located, showing consistency between the two, disregarding potential errors in the detection process. This finding can provide a basis for determining the orientation of geological structures in the observed space. Furthermore, the half-power decay angles of the target response were 62.2°, 61.8°, 45°, 42.6°, 37.4°, and 41.2°, respectively, indicating that as the tilt angle of the detection target increases, the reflection of electromagnetic waves gradually weakens. In addition, based on practical detection data from Figure 9e,f, when the tilt angle of the target is too large, detection results may exhibit deviations, highlighting an aspect that deserves attention in future research.

4. Experimental in Underground Coal Mine Environment

4.1. Detection Process and Phenomena

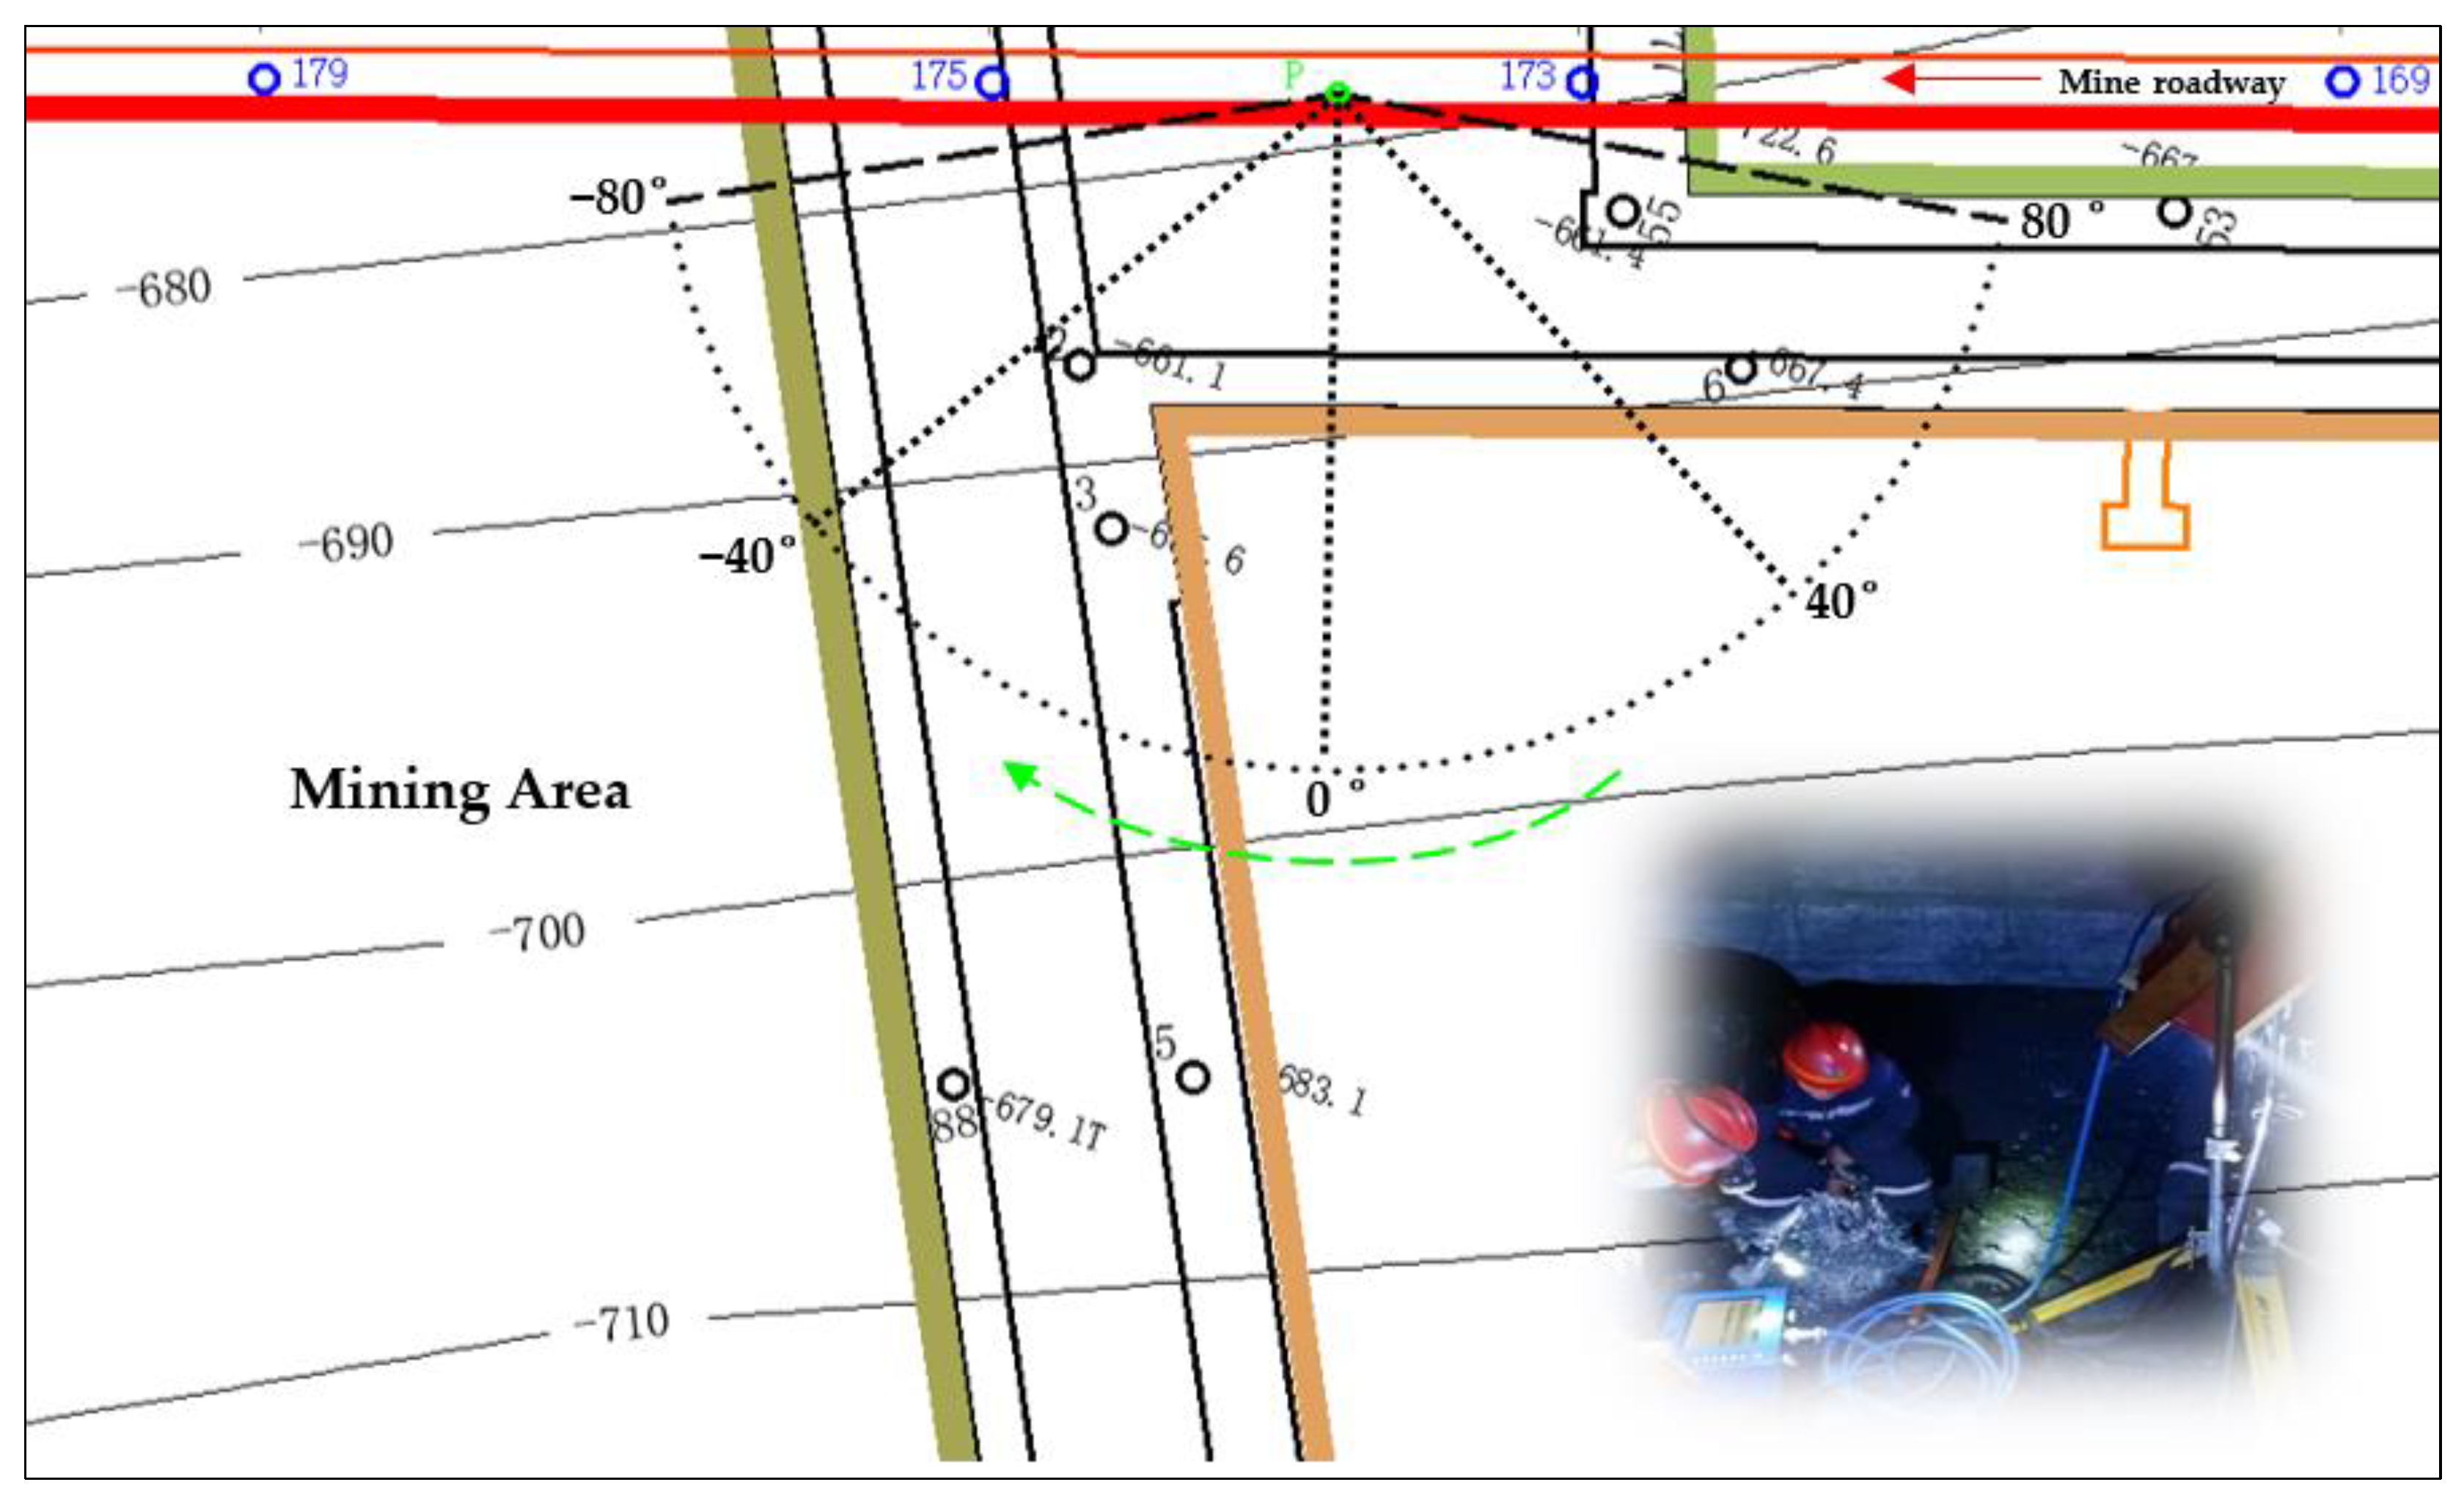
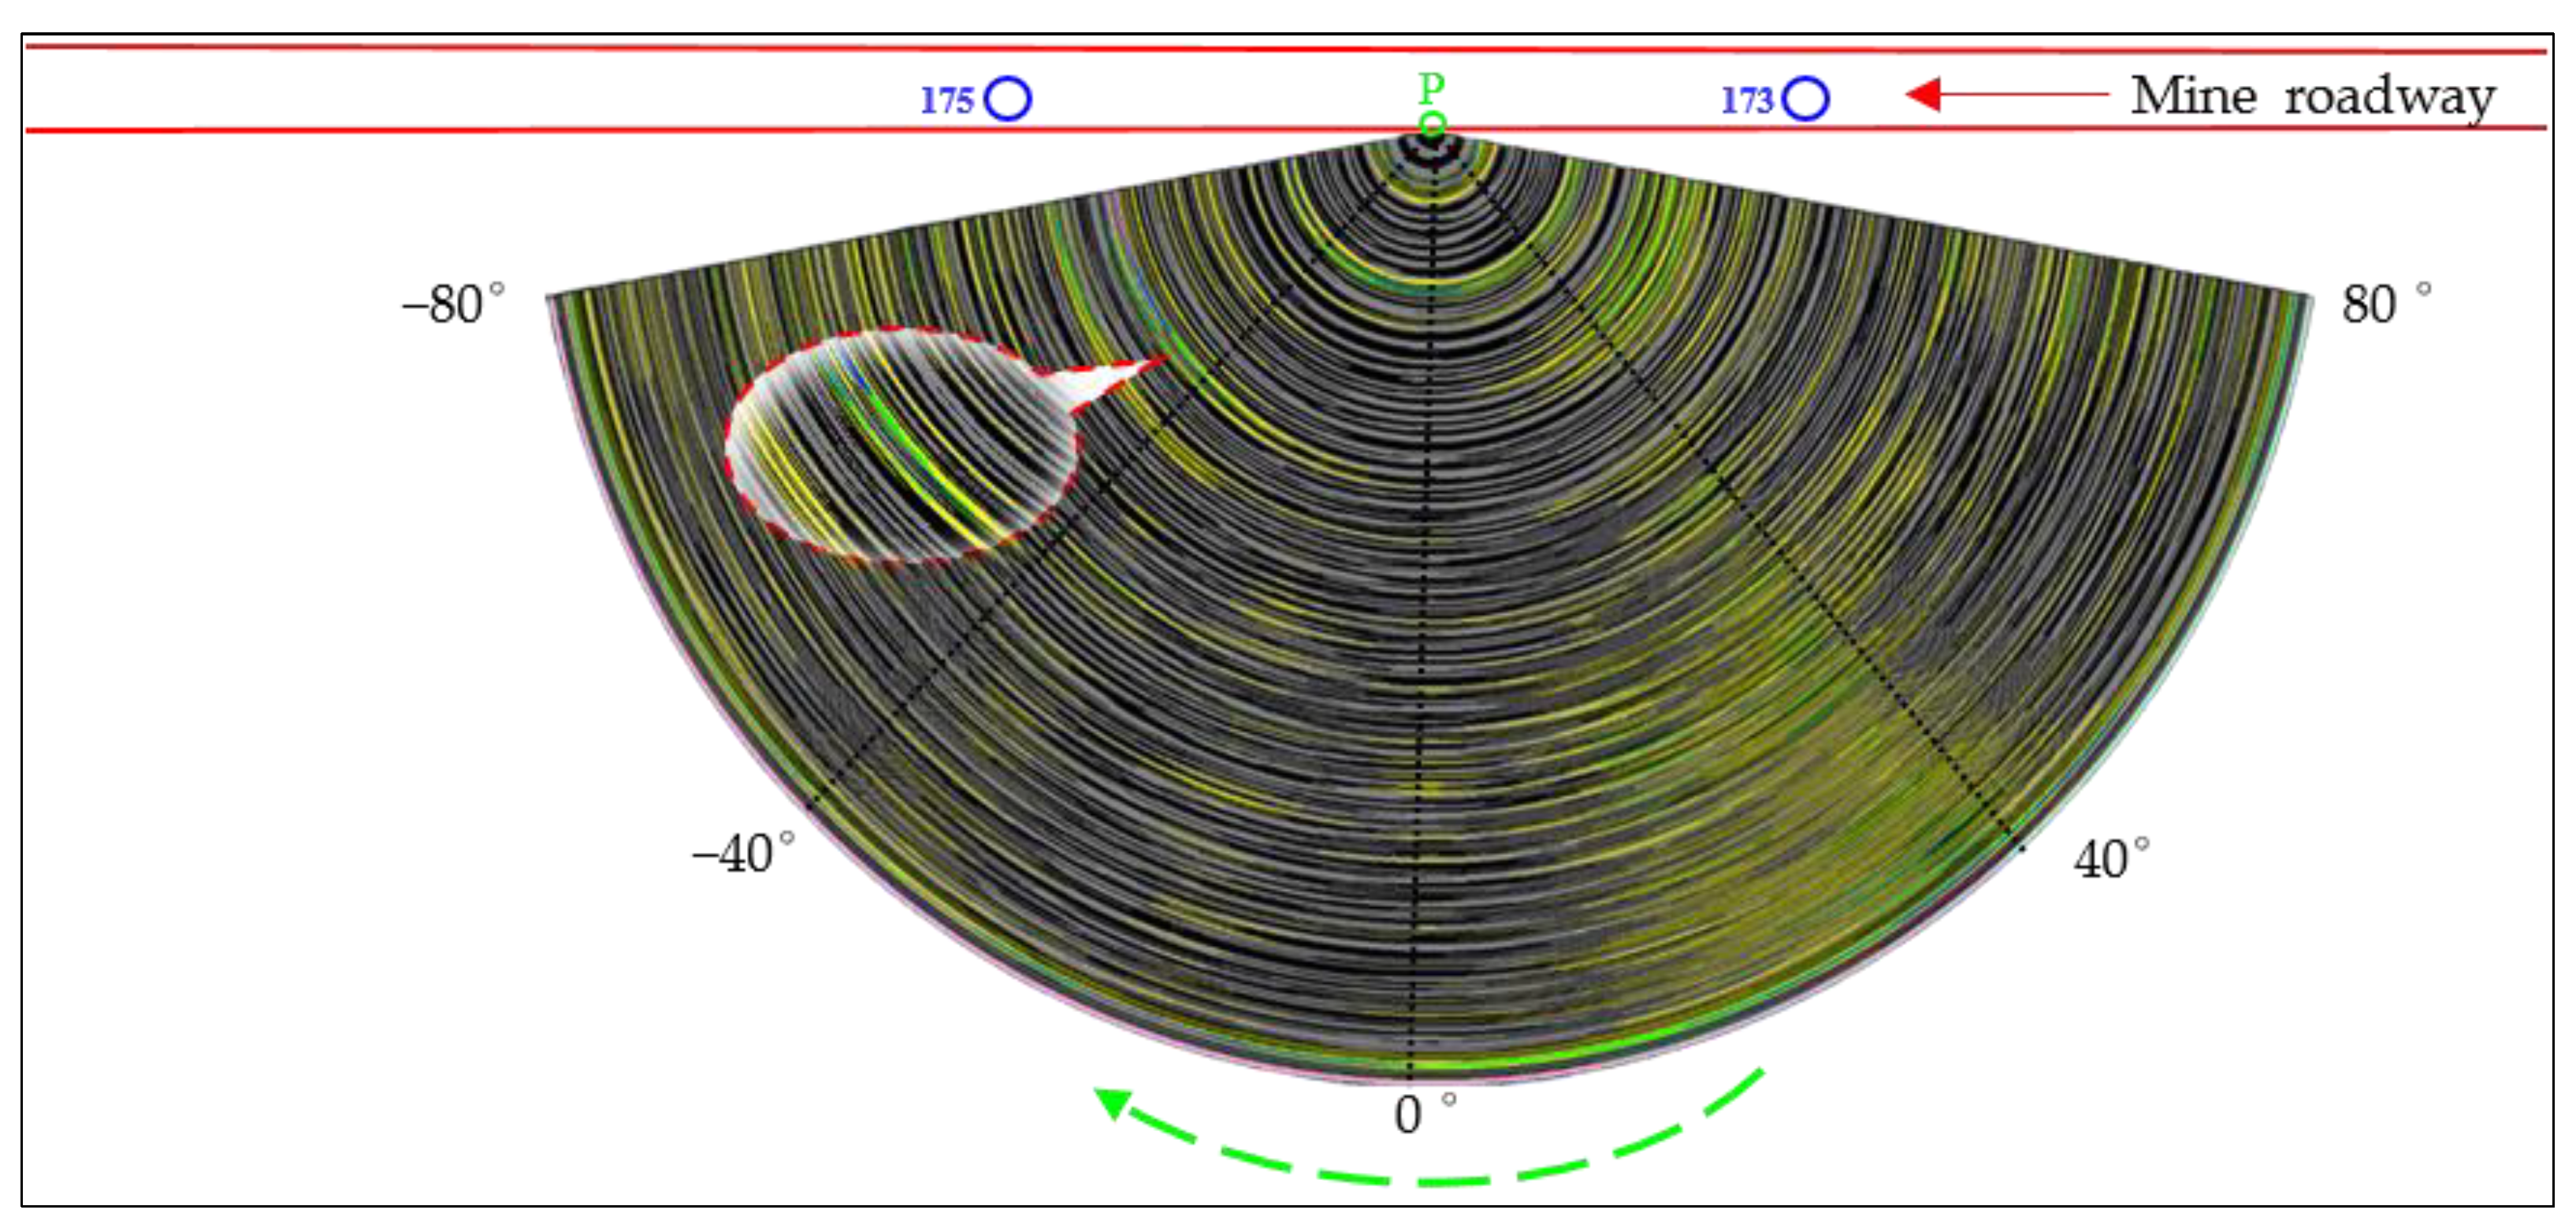
To investigate the method’s application effectiveness in underground coal mine production environments, a retreat mining area in a Hebei Province, China coal mine was selected as the experimental subject (Figure 10). Characterized by roadway roof and floor strata of sandy mudstone and siltstone, with an average coal seam thickness of 3.1 m, primarily consisting of bright coal within a medium-thick coal layer, this area presents a unique geological setting. Figure 10 illustrates that point P represents the detection location at a depth of −676.2 m, which is 18 m and 25.5 m from marked points 173 and 175 in the roadway, respectively. The black dashed line area indicates the detection range. The red solid line, orange solid line, and green solid line represent boundaries of mining areas at different depths. The green arc indicates the direction of antenna rotation, while the gray solid line represents depth contours. Experimentally, the antenna’s center frequency is set to 100 MHz, with a 1000 ns sampling time window and sampling number 1024, resulting in an effective detection depth of approximately 50 to 80 m. The horizontal and vertical scanning ranges are −80° to 80° and −50° to 50°, respectively, with intervals of 5° and 0.5°. During the detection process, the horizontal and vertical rotation angles θ and ψ are manually adjusted using the dial (as shown in Figure 3b). Specifically, the detection begins by manually adjusting the horizontal angle for one rotation interval. Subsequently, the vertical rotation angle is sequentially adjusted from −50° to 50°, with data collection performed after each adjustment of the vertical rotation angle. After completing one cycle of data collection, the process repeats, covering the entire spatial range of −80° to 80° for horizontal rotation and −50° to 50° for vertical rotation, thereby completing the spatial data acquisition.
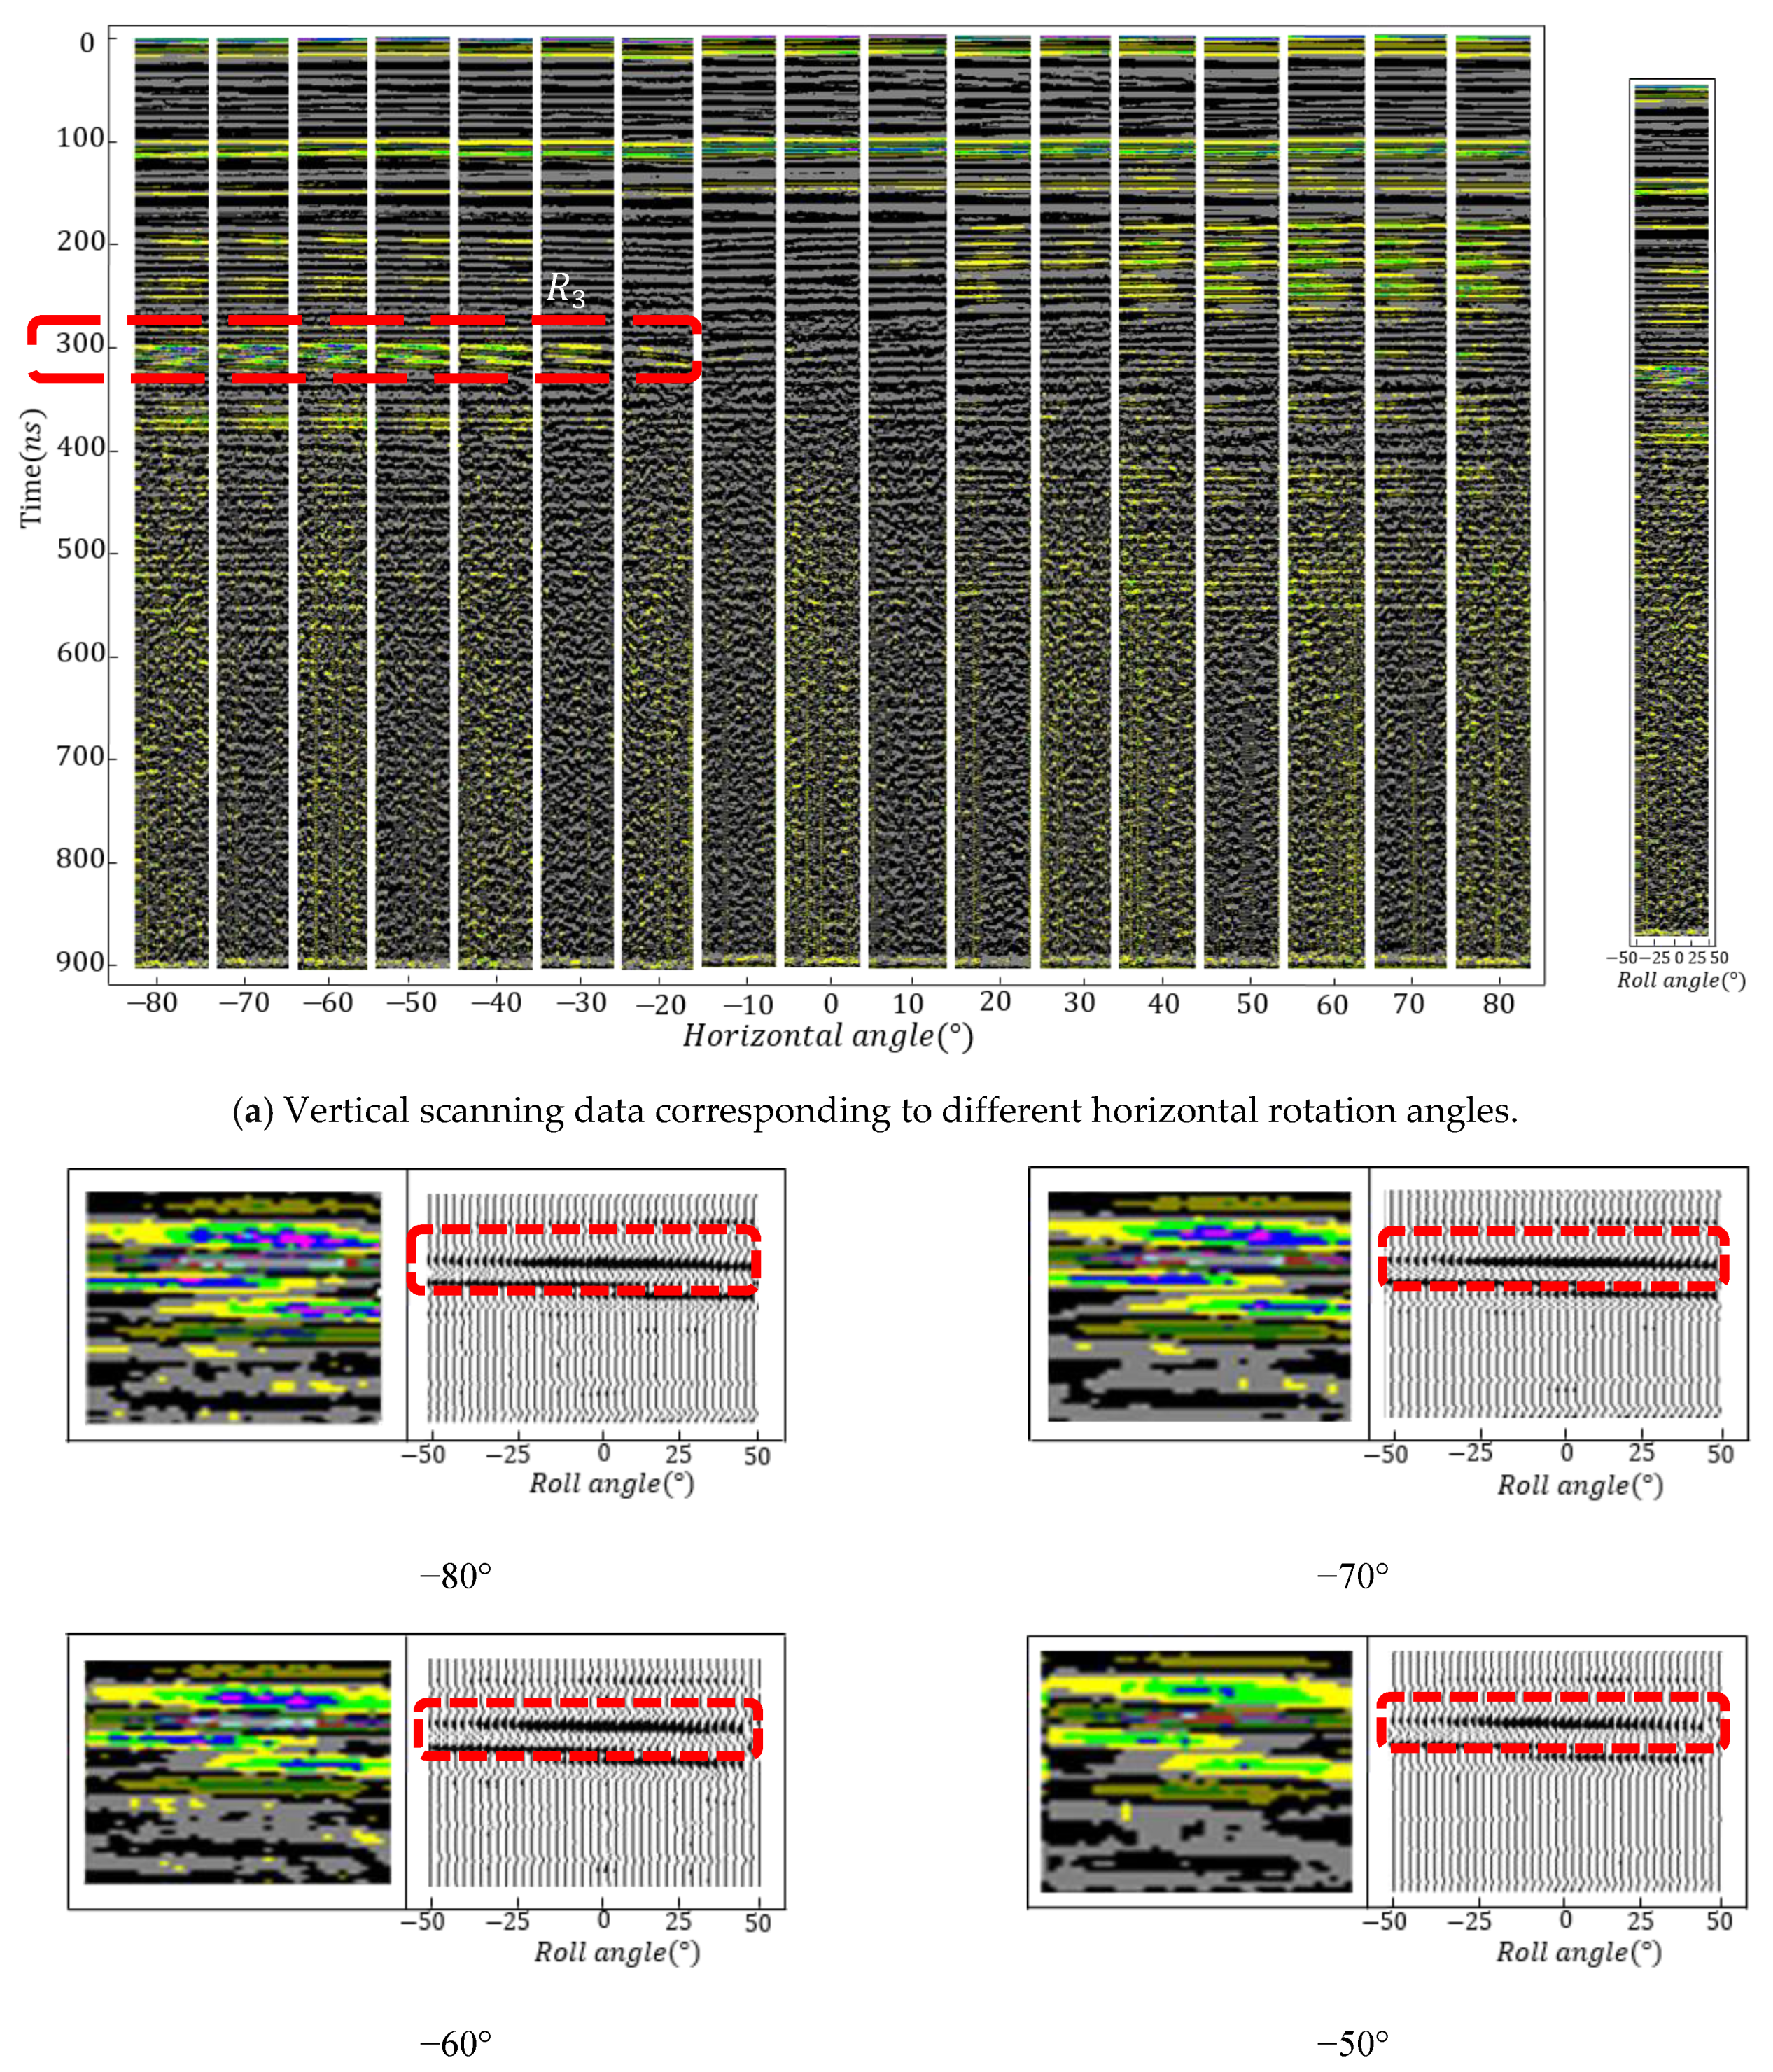
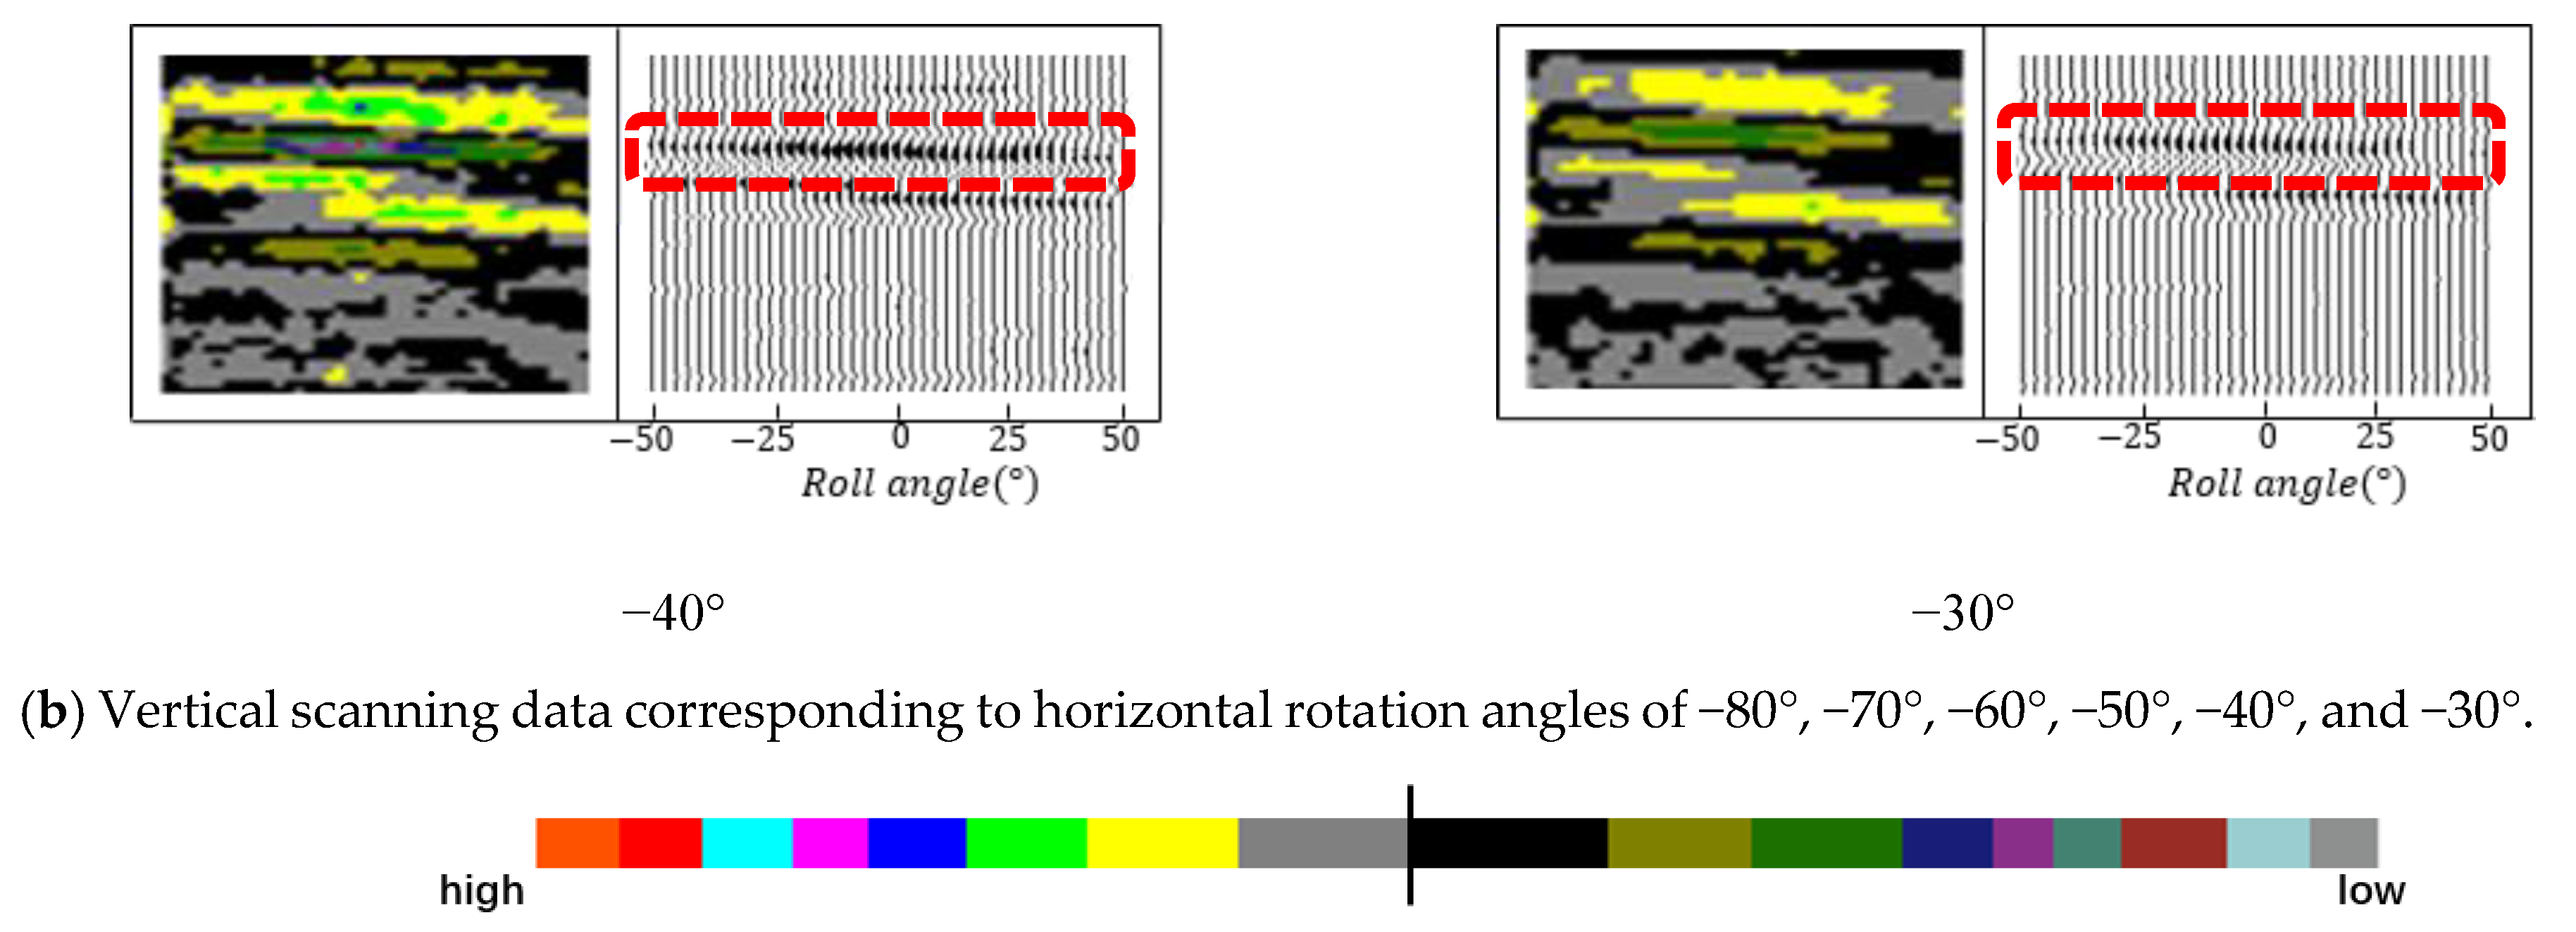
In the processing of raw data, the following steps were taken: (1) zero-point calibration was performed to correct any potential baseline offsets; (2) one-dimensional filtering and Wiener predictive filtering techniques were applied to suppress noise and enhance signal quality; (3) background noise elimination was conducted to further clean non-target signals in the data; (4) wavelet transform was employed to analyze signals at different scales, crucial for identifying and separating useful signal components; (5) considering the relatively weak nature of deep signals and significant differences in gain scales, a power-law gain curve was applied to enhance data accordingly, ensuring signal clarity and resolution [35,36]. It is noteworthy that during filtering, given the antenna’s central frequency of 100 MHz and bandwidth of 100 MHz, cutoff frequencies were set at 50 MHz and 200 MHz to meet frequency requirements for signal processing. As shown in Figure 11, this paper selects the vertically scanned data corresponding to a specific horizontal rotation angle at 10° intervals from the horizontal scanning range for in-depth analysis. Figure 11a presents the bidirectional travel time on the vertical axis and the horizontal rotation angle on the horizontal axis, corresponding to the vertically scanned data at various horizontal angles. The data were conventionally processed, removing direct waves. In Figure 11a, vertical scan data for each group are arranged from −50° to 50° in vertical angles. For each vertical scan angle, 1024 samples within 1000 ns are collected, and these samples are mapped to the RGB color space [37]. As shown in Figure 11, within the color spectrum, colors closer to the center represent lower reflection energy, while colors closer to the ends of the spectrum indicate stronger reflection energy. As the horizontal rotation angle changes from −80° to −10°, a prominent strong reflection zone R3 appears around the 300 ns position, with the reflection energy showing an overall increasing trend. Figure 11b analyzes six groups of vertically scanned data corresponding to horizontal angles from −80° to −30°, with two-way travel times ranging between 290 ns and 320 ns. Notably, within the −40° to 40° vertical scanning range, the anomalous area R3 exhibits energy significantly higher than the background, with uneven energy distribution. Localized strong reflections manifest as fine bright stripes, gradually attenuating from the center to the sides, displaying an energy distribution pattern of “strong in the center, weak on the sides.” The energy variation within the R3 area shows significant regularity, forming high-amplitude, high-frequency reflection wave groups, characterized by uniform waveforms without chaotic reflections or multiple waves. The radar image reveals clear parallel reflective co-phases, which, although slightly inclined, exhibit good continuity. In the −80° to −50° horizontal angle range, the corresponding data response characteristics are pronounced, while features at −40° and −30° weaken. In the R3 region, the average correlation coefficients of strong reflection sub-waves across adjacent detection angles are 98.97%, 99.67%, 97.34%, 89.35%, 81.67%, and 85.35%; the average frequency spectrum similarity is 98.67%, 98.40%, 93.53%, 88.32%, 79.41%, and 74.78%, indicating high similarity of response sub-waves. Furthermore, the characteristics in the R3 area exhibit a linear distribution trend with varying detection angles, forming an overall structure resembling a pea shape, thicker in the center and narrower on the sides. Additionally, the vertical rotation angles of the energy peaks for each group are −1.5°, −2.5°, −5.5°, −10°, −5.0°, and −8.5°.
Based on the above analysis, anomalous area R 3 exhibits distinct reflective interface characteristics, indicating the presence of two media with significant electrical differences. The absence of chaotic reflections and scattering phenomena suggests that the reflective interface between the two media is relatively smooth. Furthermore, as shown in Figure 12, horizontal scanning data corresponding to a vertical rotation angle of 0° indicate that the horizontal rotation angle range for anomalous area R 3 is approximately −80° to −15°, with the energy peak located around −44.5°.
In summary, it can be inferred that there is a distribution of coal–rock interfaces in the detection area, and the rock layers are overall uniformly developed, with intact, dry rock masses unaffected by groundwater. The strata of the roof and floor of the roadway in the detection area are primarily composed of sandy mudstone and siltstone. During the detection process, exposed coal seams were observed near the detection location, characterized primarily by bright coal, which is a mixture primarily composed of coking coal and lean coal. Based on Table 2, the electromagnetic wave velocity in bright coal is approximately 0.156 m/ns, allowing us to estimate the distance from the detection point to the center of the rock layer as 23.4 m. The development direction of the rock layer forms an angle of approximately 44.5° with the direction of the tunnel. Considering errors in the detection process and localized non-uniform coal seam distribution, the average peak energy change variation during vertical scanning indicates an inclination of the rock layer in the vertical direction of approximately 5.5°.

4.2. Analysis of Detection Results

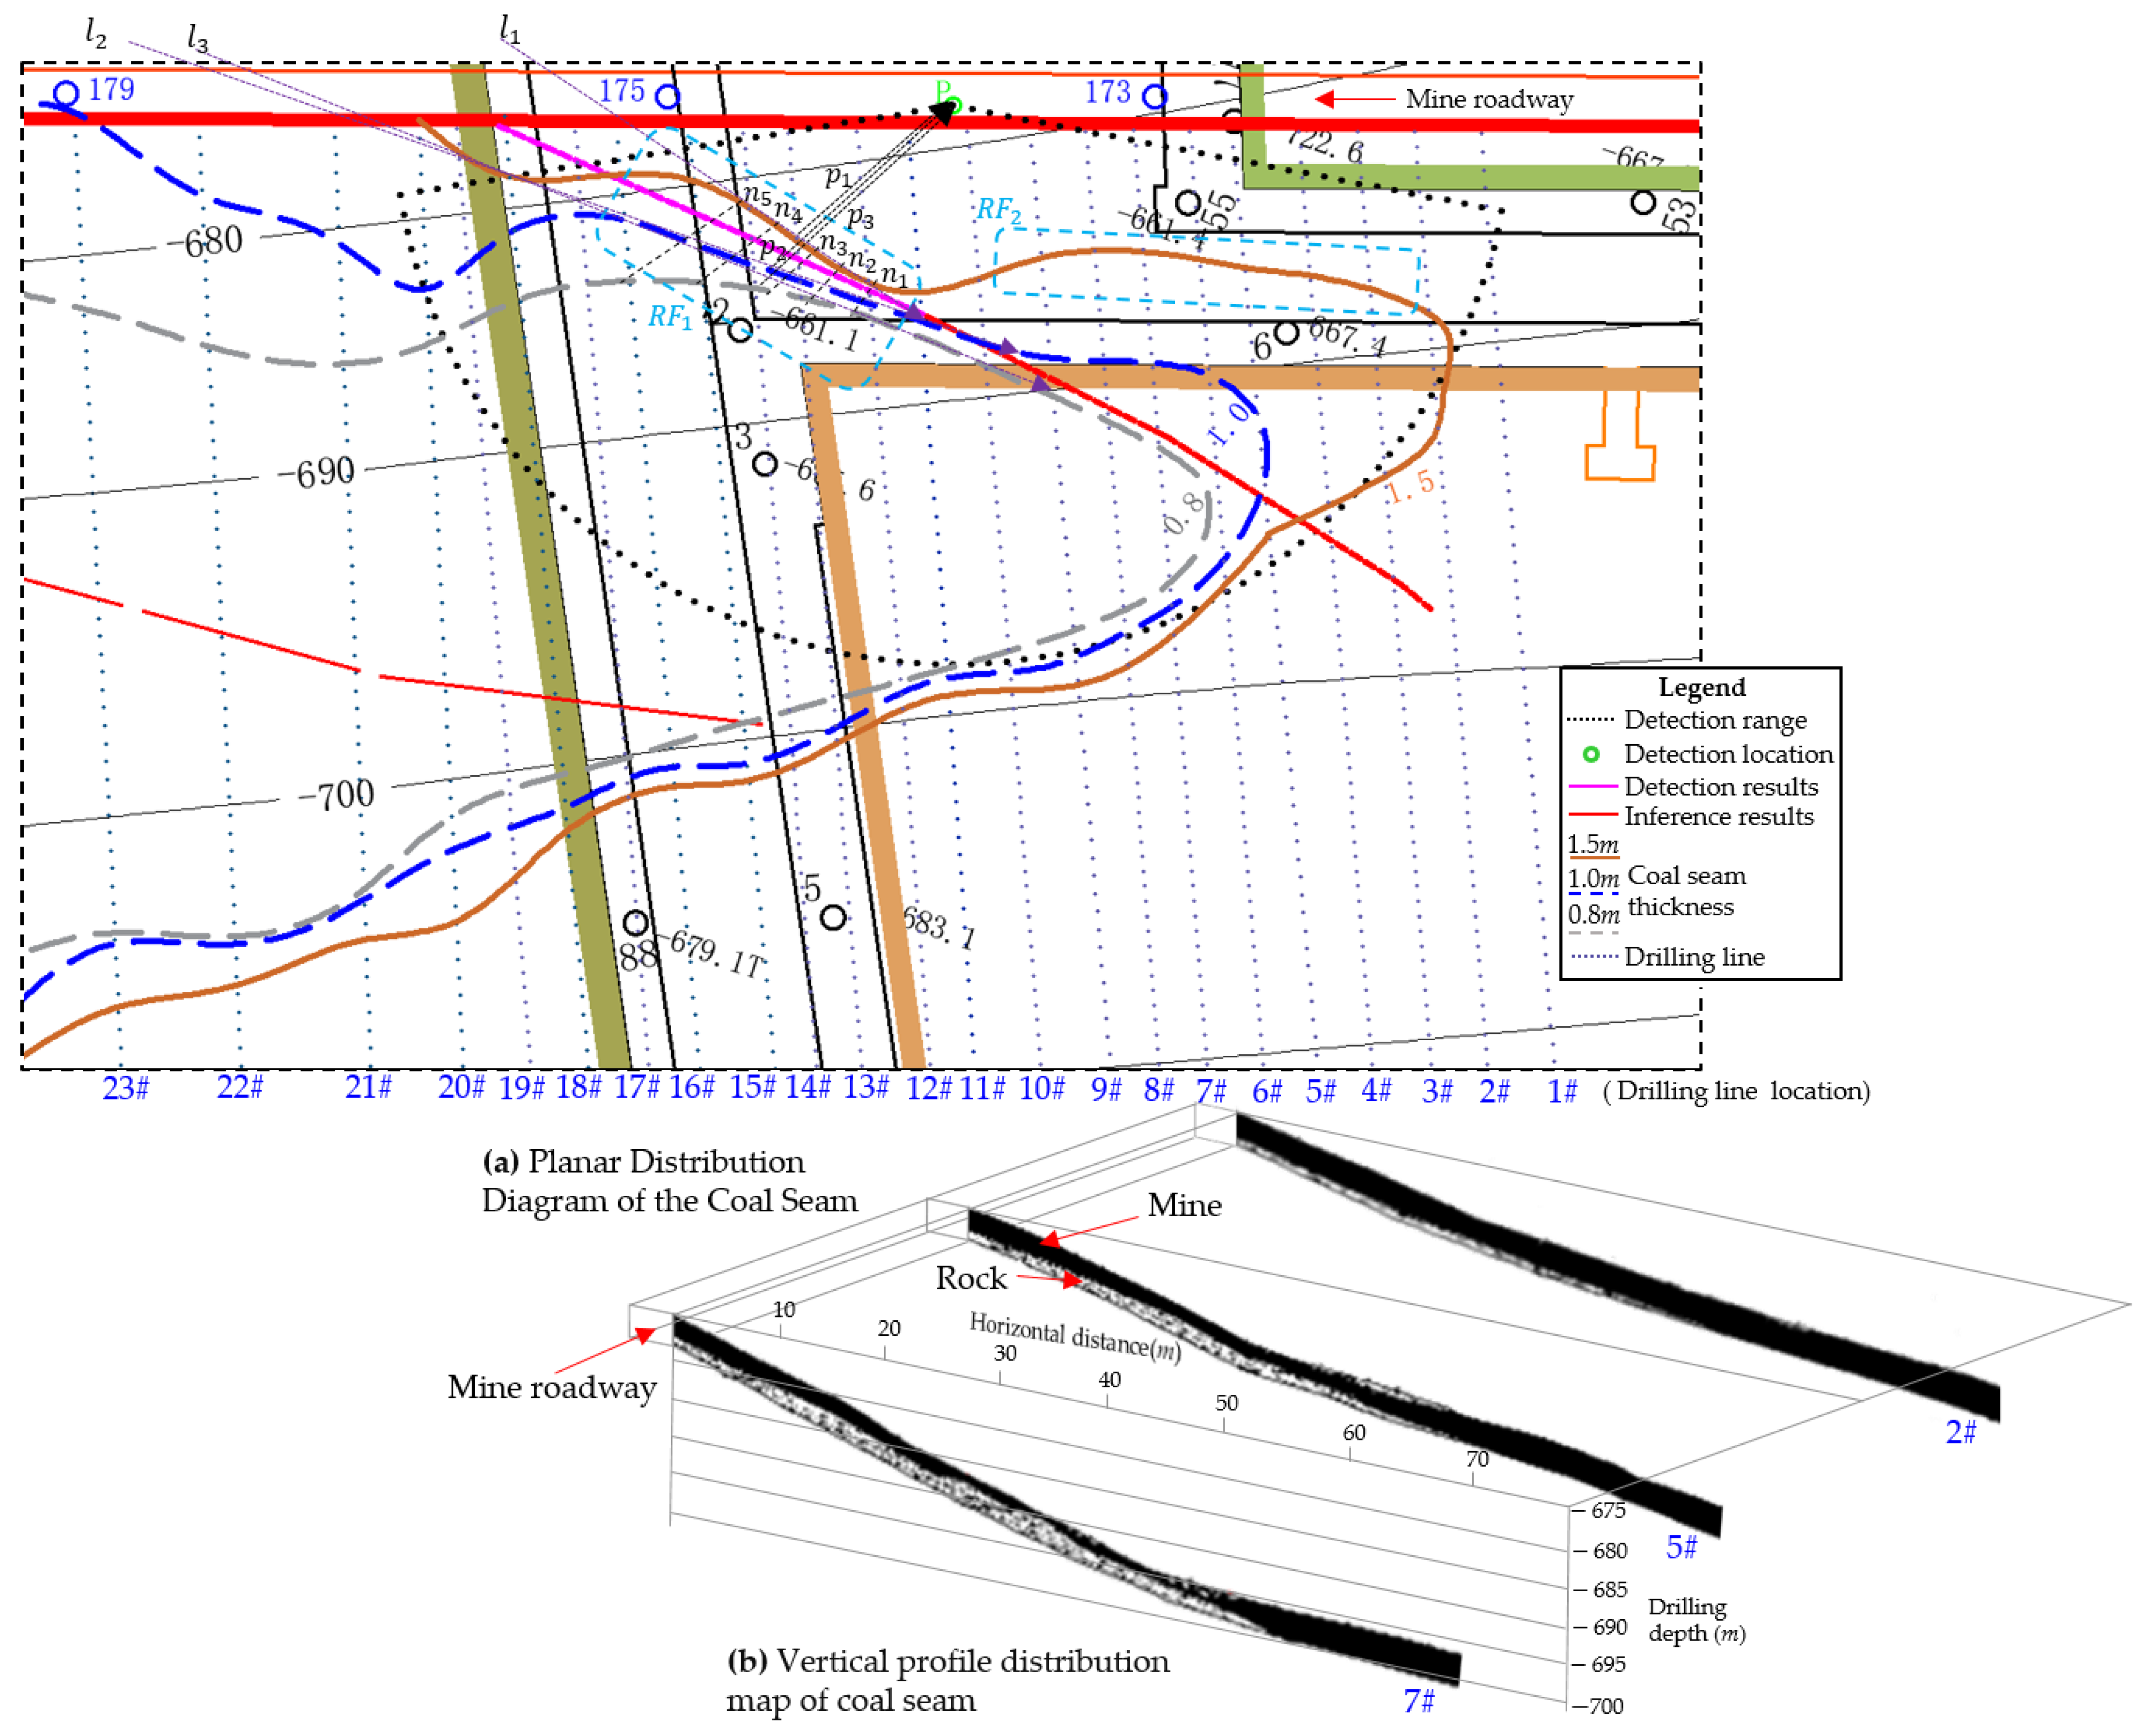
To validate detection results and investigate coal seam distribution in the detection area, drilling operations were conducted to accurately depict coal seam distribution. As shown in Figure 13a, the drilling area measures 150 m in length and 80 m in width, with points 1# to 23# indicating drilling lines on the detection area’s surface. Dense drilling points are found in regions with significant coal seam undulations. Drilling results indicate uneven coal seam thickness distribution in the detection area. Specifically, as illustrated in Figure 13a, brown solid, blue dashed, and gray dashed lines represent contour lines for coal seam thicknesses of 1.5 m, 1.0 m, and 0.8 m, respectively. The contour distribution clearly shows that coal seam thickness within the contours is significantly lower than the average thickness of 3.1 m in other regions, with contours indicating that coal seam thickness decreases from point 1# to point 23#. Figure 13b shows the representative drilling lines 2#, 5#, and 7#, selected to analyze vertical coal seam distribution, with the vertical axis denoting drilling depth and the horizontal axis indicating horizontal distance. It can be observed that rock layers intrude into coal seams from below. On drilling line 2#, coal seam thickness variation is relatively small. However, on drilling lines 5# and 7#, significant coal seam thickness changes occur within the horizontal distance range of 10 m to 60 m. Notably, on drilling line 7#, severe rock layer erosion occurs in the region from 30 m to 55 m, leading to near-extinct coal seams and ultra-thin coal layers. Additionally, along drilling lines 7# to 23#, local coal seam thickness is less than 0.8 m, indicating severe rock layer erosion and the presence of coal–rock boundary regions and coal-free zones.
In summary, drilling results for lines 1# to 23# in Figure 13 indicate that, as drilling progresses, the total thickness of the coal seam decreases from 1.5m to 1.0m and 0.8m. This suggests that rock strata invade the coal seam vertically from bottom to top and horizontally from 23# to 1#, forming a downward sloping intrusion surface, which is consistent with vertical detection results. Figure 13a shows two distinct coal–rock boundary regions, R F 1 and R F 2 , within the detection range. Region R F 1 has significant coal thickness variation, resulting in a relatively complete reflection interface. The detection results (solid pink line in Figure 13a) accurately reflect spatial coal thickness variation. To analyze errors in detection results, tangents l 3 , l 2 , l 1 for 0.8 m, 1.0 m, and 1.5 m coal seam contour lines at R F 1 were drawn. The angles between tangents and tunnel are 33.63°, 31.29°, and 55.81°, respectively, with an average angle of 40.24°, deviating 4.26° from the detection horizontal inclination. At the same time, the distance p 1 , p 2 , p 3 of the detection position P and the contours of 0.8 m, 1.0 m, and 1.5 m coal seams in the direction of the horizontal rotation angle of 44.5° are 16.5 m, 22.4 m and 25.6 m, respectively. The distance from the mean value is 21.5 m, and the error with the detection depth is 1.2 m. In addition, in the R F 1 region, n 1 , n 2 , n 3 , n 2 , n 5 are selected to calculate the vertical dip angle for the specific position of the coal seam drop of 0.7 m. The lengths of n 1 ~ n 5 are 3.4 m, 4.9 m, 6.4 m, 9.3 m, and 12.7 m, respectively. Therefore, the vertical dip angles are 11.63°, 8.12°, 6.24°, 4.3°, and 3.15° respectively, and the average dip angle is 6.67°, which gives a 1.17° error with the detection vertical dip angle. Considering localized non-uniform coal seam distribution and potential detection errors, the accuracy of recognizing depth and spatial extension in detection results for R F 1 is 91.88%, 90.42%, and 78.72%, respectively. In contrast, coal seam variations in R F 2 are more gradual, with a steeper reflection angle and weaker reflection energy, resulting in a less distinct response in the radar spectrum. Future adjustments to the antenna’s horizontal position and use of multi-point data energy superposition will enable clearer revelations of spatial information in R F 2 .

5. Discussion

This paper presents an innovative forward-looking detection method for coal mining working faces. Through a series of detection experiments, the response characteristics and imaging patterns of targets under this method are thoroughly investigated, and the mechanisms behind the formation of these response characteristics are analyzed. Detection experiments targeting different inclination angles are designed to examine the energy variation patterns of detected targets as the inclination changes, providing a basis for acquiring spatial distribution information of geological structures. Application experiments conducted underground in a coal mine validate the feasibility of this method for forward-looking detection in underground environments. The experimental results robustly demonstrate that this technology can provide strong technical support for tunneling and coal mining operations, showcasing its practical application value. In response to issues encountered during actual detection, future research will focus on the following aspects: building on existing findings, further exploring the response characteristics of geological radar signals related to different types, scales, and spatial distribution patterns of geological structures and their intrinsic relationships. Additionally, an intelligent extraction algorithm for target response characteristics will be developed to enhance the efficiency of geological radar signal feature analysis.

Author Contributions

Conceptualization, J.L., F.Y. and X.Q.; methodology, J.L., F.Y., X.T. and X.Q.; software, F.Y. and X.Q.; validation, J.L. and F.Y.; formal analysis, J.L. and F.Y.; investigation, J.L., F.Y., X.T. and X.Q.; resources, F.Y. and S.P.; data curation, J.L., F.Y. and X.Q.; writing—original draft preparation, J.L.; writing—review and editing, J.L., F.L., F.Y. and S.P.; visualization, J.L. and X.Q.; supervision, F.Y., X.Q., M.X., Y.F. and X.H.; project administration, J.L.; funding acquisition, S.P., F.Y. and X.Q. All authors have read and agreed to the published version of the manuscript.

Funding

This research was funded by the National Key Research and Development Program of China (grant number 2021YFC3090304) and the National Key Laboratory of Coal Resources and Safe Mining (grant number SKLCRSM19KFA07).

Data Availability Statement

Restrictions apply to the availability of these data. Data were obtained from the China University of Minning and Technology (Beijing) and are available from the authors with the permission of the China University of Minning and Technology (Beijing).

Conflicts of Interest

The authors declare no conflicts of interest.

References

  1. Song, D.; Hu, Z.; Yu, Y.; Zhang, F.; Sun, H. Assessing Ecological Impacts and Recovery in Coal Mining Areas: A Remote Sensing and Field Data Analysis in Northwest China. Remote Sens. 2024, 16, 2236. [Google Scholar] [CrossRef]
  2. Yuan, L.; Zhang, P.J. Key technology and path thinking of dynamic reconstruction of mine transparent geological model. J. China Coal Soc. 2023, 48, 1–14. [Google Scholar]
  3. Zhang, Q.; Zhang, R.; Liu, J.; Wang, C.; Zhang, H.; Tian, Y. Review on coal and rock identification technology for intelligent mining in coal mines. Coal Sci. Technol. 2022, 50, 1–26. [Google Scholar]
  4. Wang, G.; Xu, Y.; Ren, H. Intelligent and ecological coal mining as well as clean utilization technology in China: Review and prospects. Int. J. Min. Sci. Technol. 2019, 29, 161–169. [Google Scholar] [CrossRef]
  5. Cheng, J.; Li, F.; Peng, S. Research progress and development direction on advanced detection in mine roadway working face using geophysical methods. J. China Coal Soc. 2014, 39, 1742–1750. [Google Scholar]
  6. Siddiqui, M.A.H.; Akhtar, S.; Chattopadhyaya, S.; Sharma, S.; Kumar, A.; Abbas, M. 611 Universal Drilling Machine Reliability Modeling and Performance Evaluation in Subterranean Coal Mines. Rock Mech. Rock Eng. 2024, 57, 3559–3575. [Google Scholar] [CrossRef]
  7. Shuning, D.; Zaibin, L.; Jianyuan, C.; Baohui, C.; Zhenhua, D.; Dan, L. Technologies and prospect of geological guarantee for intelligent coal mining. Coal Geol. Explor. 2021, 49, 4. [Google Scholar]
  8. Peng, S. Current status and prospects of research on geological assurance system for coal mine safe and high efficient mining. J. China Coal Soc. 2020, 45, 2331–2345. [Google Scholar]
  9. Su, B.; Liu, S.; Deng, L.; Gardoni, P.; Krolczyk, G.M.; Li, Z. Monitoring direct current resistivity during coal mining process for underground water detection: An experimental case study. IEEE Trans. Geosci. Remote Sens. 2022, 60, 1–8. [Google Scholar] [CrossRef]
  10. Cheng, J.-L.; Song, G.-D.; Liu, T.-Y.; Hu, B.-X.; Wang, J.-Q.; Wang, J.-Y. High precision location of micro-seismic source in underground coal mine. Chin. J. Geophys. 2016, 59, 734–743. [Google Scholar]
  11. Anbazhagan, P.; Dixit, P.N.; Bharatha, T. Identification of type and degree of railway ballast fouling using ground coupled GPR antennas. J. Appl. Geophys. 2016, 126, 183–190. [Google Scholar] [CrossRef]
  12. Liu, C.; Song, C.; Lu, Q. Random noise de-noising and direct wave eliminating based on SVD method for ground penetrating radar signals. J. Appl. Geophys. 2017, 144, 125–133. [Google Scholar] [CrossRef]
  13. Song, J.; Wang, L.J. Study on the high precision detection of buried drill pipe by ground penetrating radar in the coal face. J. China Coal Soc. 2014, 39, 537–542. [Google Scholar]
  14. Wang, D.J.G.E. Ground penetrating radar and engineering geological exploration. Geophys. Equip. 2001, 11, 188–194. [Google Scholar]
  15. Li, S.C.; Zhou, Z.Q.; Ye, Z.H.; Li, L.P.; Zhang, Q.Q.; Xu, Z.H. Comprehensive geophysical prediction and treatment measures of karst caves in deep buried tunnel. J. Appl. Geophys. 2015, 116, 247–257. [Google Scholar] [CrossRef]
  16. Orlando, L.; Cardarelli, E.; Cercato, M.; De Donno, G.; Di Giambattista, L. Pavement testing by integrated geophysical methods: Feasibility, resolution and diagnostic potential. J. Appl. Geophys. 2017, 136, 462–473. [Google Scholar] [CrossRef]
  17. Cheng, J.; Lu, Z.; Xue, B.; Li, P.; Wang, P. The “long excavation and long exploration” technology of rapid excavation of coal mine roadway. J. China Coal Soc. 2022, 47, 404–412. [Google Scholar]
  18. Fernández-Álvarez, J.-P.; Rubio-Melendi, D.; Castillo, J.A.Q.; González-Quirós, A.; Cimadevilla-Fuente, D. Combined GPR and ERT exploratory geophysical survey of the Medieval Village of Pancorbo Castle (Burgos, Spain). J. Appl. Geophys. 2017, 144, 86–93. [Google Scholar] [CrossRef]
  19. Xu, X.; Peng, S.; Yang, F. Development of a ground penetrating radar system for large-depth disaster detection in coal mine. J. Appl. Geophys. 2018, 158, 41–47. [Google Scholar] [CrossRef]
  20. Xu, X.; Ma, Z.; Sun, T. A Whole closed space intrinsically safe GPR system for detection of geological hazard sources in coal mines. IEEE Geosci. Remote Sens. Lett. 2021, 19, 1–5. [Google Scholar] [CrossRef]
  21. Ma, Z.; Xu, X.; Peng, S.; Zhu, P.; Wang, Y. Development and application of air-coupled GPR antenna for coal-rock interface detection in mines. J. Appl. Geophys. 2023, 219, 105238. [Google Scholar] [CrossRef]
  22. Zhu, P.; Xu, X.; Ma, Z.; Wang, Y. Research on accuracy and error analysis of coal and rock strata detection based on air-coupled GPR. IEEE Geosci. Remote Sens. Lett. 2022, 19, 1–5. [Google Scholar] [CrossRef]
  23. Strange, A.D. Robust Thin Layer Coal Thickness Estimation Using Ground Penetrating Radar. Ph.D. Thesis, Queensland University of Technology, Brisbane, Australia, 2007. [Google Scholar]
  24. Strange, A.D.; Jecny, Z. Coal subsurface mapping for selective mining. In Proceedings of the 2018 17th International Conference on Ground Penetrating Radar (GPR), Rapperswil, Switzerland, 18–21 June 2018; pp. 1–4. [Google Scholar]
  25. Ralston, J.C.; Strange, A.D. An industrial application of ground penetrating radar for coal mining horizon sensing. In Proceedings of the 2015 International Symposium on Antennas and Propagation (ISAP), Hobart, Australia, 9–12 November 2015; pp. 1–4. [Google Scholar]
  26. Ralston, J.; Strange, A. 3D robotic imaging of coal seams using ground penetrating radar technology. In Proceedings of the 2016 16th International Conference on Ground Penetrating Radar (GPR), Hong Kong, China, 13–16 June 2016; pp. 1–6. [Google Scholar]
  27. Francke, J. Applications of GPR in mineral resource evaluations. In Proceedings of the XIII International Conference on Ground Penetrating Radar, Lecce, Italy, 21–25 June 2010; pp. 1–5. [Google Scholar]
  28. Ralston, J.C.; Hainsworth, D.W.; McPhee, R.J. Application of ground penetrating radar for coal thickness measurement. In TENCON'97 Brisbane-Australia. Proceedings of IEEE TENCON’97. IEEE Region 10 Annual Conference. Speech and Image Technologies for Computing and Telecommunications (Cat. No.97CH36162), Brisbane, QLD, Australia, 4 December 1997; IEEE: Piscataway, NJ, USA, 2002. [Google Scholar]
  29. Lai, W.W.; Chang, R.K.; Sham, J.F. A blind test of nondestructive underground void detection by ground penetrating radar (GPR). J. Appl. Geophys. 2018, 149, 10–17. [Google Scholar] [CrossRef]
  30. Yuan, W.; Liu, S.; Zhao, Q.; Deng, L.; Lu, Q.; Pan, L.; Li, Z. Application of Ground-Penetrating Radar with the Logging Data Constraint in the Detection of Fractured Rock Mass in Dazu Rock Carvings, Chongqing, China. Remote Sens. 2023, 15, 4452. [Google Scholar] [CrossRef]
  31. Zhang, J.; Wang, Y.; Zhang, T.; Yang, K.; Zhang, J.; Wang, X.J.S. A Study on Refraction Error Compensation Method for Underwater Spinning Laser Scanning Three-Dimensional Imaging. Sensors 2024, 24, 343. [Google Scholar] [CrossRef]
  32. Poljak, D.; Sesnic, S.; Susnjara, A.; Paric, D.; Drissi, K.E.K.; Lallechere, S. Direct time domain evaluation of the transient field transmitted into a lossy ground due to GPR antenna radiation. Eng. Anal. Bound. Elem. 2017, 82, 27–31. [Google Scholar] [CrossRef]
  33. Jiao, Y.; A McMechan, G.; Pettinelli, E. In situ 2-D and 3-D measurements of radiation patterns of half-wave dipole GPR antennas. J. Appl. Geophys. 2000, 43, 69–89. [Google Scholar] [CrossRef]
  34. Dhande, P. Antennas and Its Applications. DRDO Sci. Spectr. 2009, 66–78. [Google Scholar]
  35. Wang, W.; Hao, L.; Li, X.; Sun, J. Signal processing technology and its application research of ground penetrating radar (GPR). Proc. IOP Conf. Ser. Earth Environ. Sci. 2017, 69, 012077. [Google Scholar] [CrossRef]
  36. Abujarad, F. Ground Penetrating Radar Signal Processing for Landmine Detection; Otto-von-Guericke-Universität Magdeburg, Universitätsbibliothek: Magdeburg, Germany, 2007. [Google Scholar]
  37. Süsstrunk, S.; Buckley, R.; Swen, S. Standard RGB color spaces. In Proceedings of the Color and Imaging Conference, Scottsdale, AZ, USA, 16–19 November 1999; pp. 127–134. [Google Scholar]
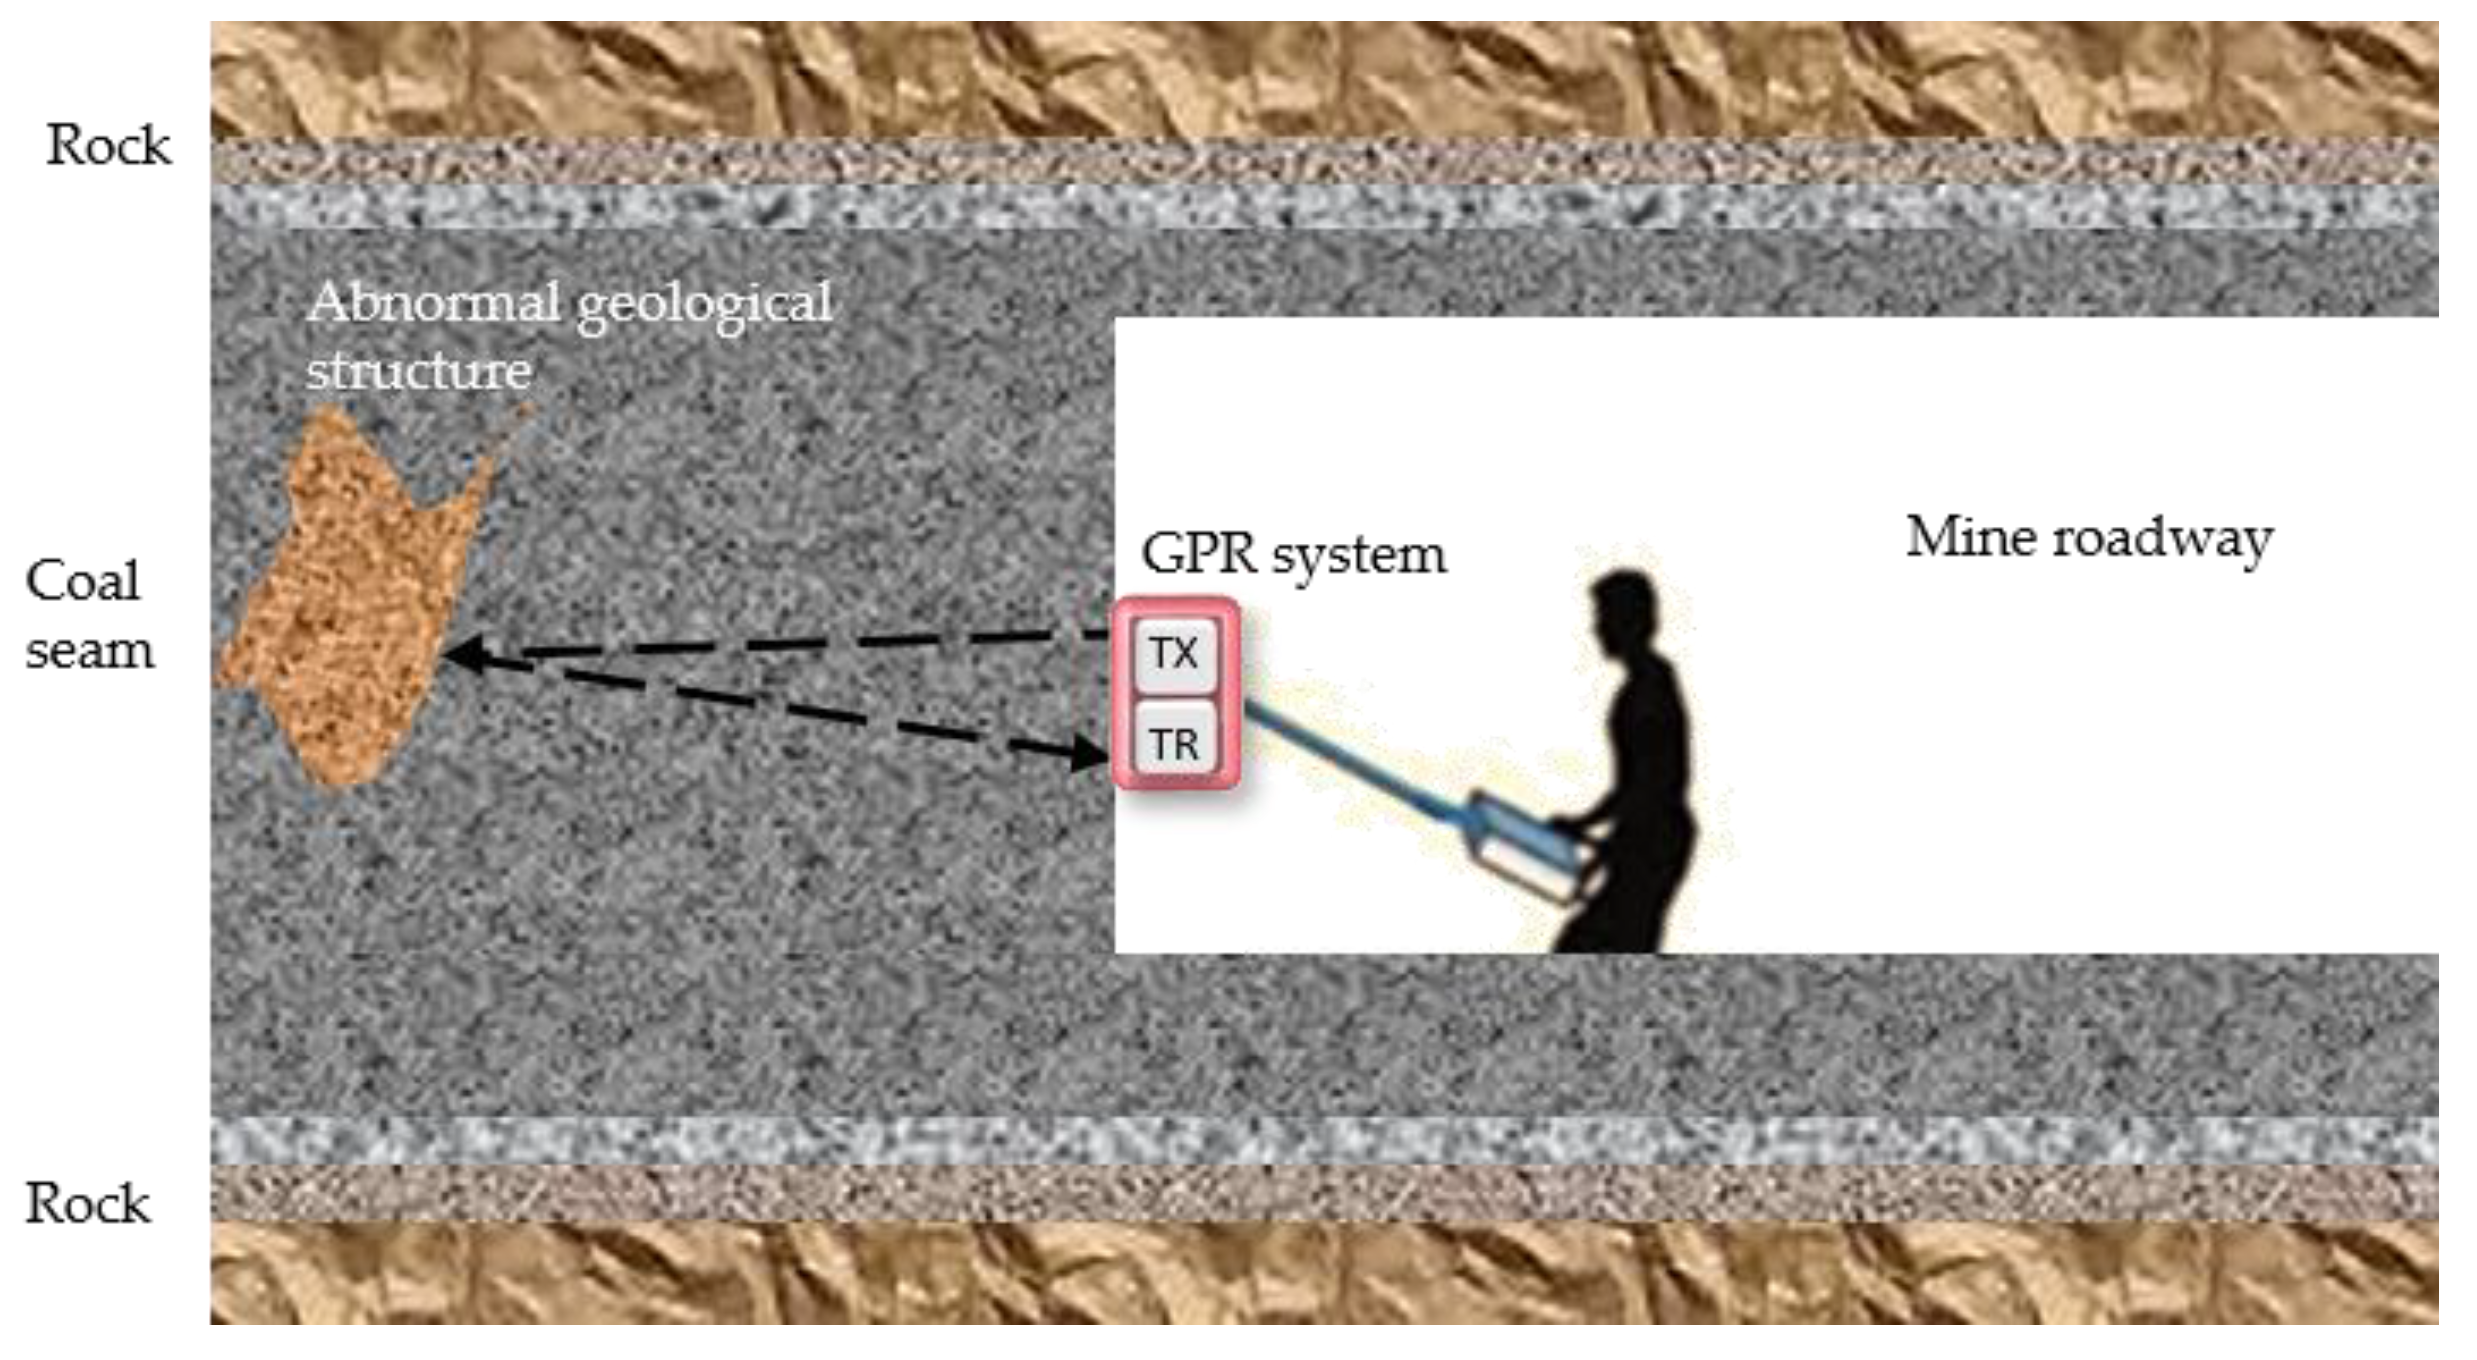
Figure 1. Advanced detection schematic of the coal mine working face.
Remotesensing 16 03990 g001
Figure 2. Schematic diagram of the application of the traditional GPR advanced detection method in the coal mine working face.
Remotesensing 16 03990 g002
Figure 3. Schematic diagram of spatial scanning detection using GPR at the coal mine working face.
Remotesensing 16 03990 g003
Figure 4. Schematic diagram of GPR horizontal and vertical scanning detection of the coal mine working face and the corresponding detection results.
Remotesensing 16 03990 g004aRemotesensing 16 03990 g004b
Figure 5. Diagram of spatial scan detection experiment using GPR.
Remotesensing 16 03990 g005
Figure 6. Schematic diagram of GPR horizontal scanning detection of the coal mine working face and the corresponding detection results.
Remotesensing 16 03990 g006
Figure 7. Antenna directional radiation pattern diagram.
Remotesensing 16 03990 g007
Figure 8. Experimental schematic of tilted target detection in GPR.
Remotesensing 16 03990 g008
Figure 9. Target detection data waveform plot.
Remotesensing 16 03990 g009
Figure 10. Schematic diagram of the application experiment in the retreat mining area of a coal mine in Hebei Province, China.
Remotesensing 16 03990 g010
Figure 11. Schematic diagram of the application experiment detection results in an underground coal mine environment (the locations of data anomalies are marked with red dotted box).
Remotesensing 16 03990 g011aRemotesensing 16 03990 g011b
Figure 12. Schematic diagram of the horizontal scanning results corresponding to a vertical rotation angle of 0°.
Remotesensing 16 03990 g012
Figure 13. Schematic diagram of coal seam distribution in the retreat mining area.
Remotesensing 16 03990 g013
Table 1. Information on energy peak and half-power decay range in detection results of targets with different tilt angles.
No.Tilt AnglePeak Energy PositionHalf-Power Decay Range
1−2°−31.4°~30.8°
215°14.4°−18.8°~43°
330°27.2°2.6°~47.6°
445°41.8°19.4°~62°
560°55.8°31.2°~68.6°
675°72°48.8°~90°
Table 2. Electrical characteristics of common coal and rock media at a frequency of 100 MHz.
No.MediumConductivity (S/m)Relative Permittivity (F/m)Electromagnetic Wave Speed (m/ns)
1Sand stone4 × 10−54.60.14
2Coking coal2.7 × 10−52.80.179
3Lean coal2.21 × 10−52.60.186
4Mud stone1 × 10−46.50.118
Disclaimer/Publisher’s Note: The statements, opinions and data contained in all publications are solely those of the individual author(s) and contributor(s) and not of MDPI and/or the editor(s). MDPI and/or the editor(s) disclaim responsibility for any injury to people or property resulting from any ideas, methods, instructions or products referred to in the content.