Abstract
Coastal forests in the eastern United States are increasingly threatened by hurricanes; however, monitoring their initial impacts and subsequent recovery is challenging across scales. Understanding disturbance impacts and responses is essential for sustainable forest management, biodiversity conservation, and climate change adaptation. Using Sentinel-2 imagery, we calculated the annual Normalized Difference Vegetation Index change (∆NDVI) of forests before and after Hurricane Michael (HM) in Florida to determine how different forest use types were impacted, including the initial wind damage in 2018 and subsequent recovery or reactive management for two focal areas located near and far from the coast. We used detailed parcel data to define forest use types and characterized multi-year impacts using sampling and k-means clustering. We analyzed five years of timberland logging activity up to the fall of 2023 to identify changes in logging rates that may be attributable to post-hurricane salvage efforts. We found uniform impacts across forest use types near the coast, where winds were the most intense but differences inland. Forest use types showed a wide range of multi-year responses. Urban forests had the fastest 3-year recovery, and the timberland response was delayed, apparently due to salvage logging that increased post-hurricane, peaked in 2021–2022, and returned to the pre-hurricane rate by 2023. The initial and secondary consequences of HM on forests were complex, as they varied across local and landscape gradients. These insights reveal the importance of considering forest use types to understand the resilience of coastal forests in the face of potentially increasing hurricane activity.
1. Introduction
Hurricanes are changing in intensity and frequency, with broad implications for developed areas and forest landscapes [1,2,3,4]. In particular, portions of the Atlantic and Gulf Coast of the southeast United States have experienced extensive ecological and economic damage to forests in recent decades [3,4,5]. Hurricanes directly affect forests through saltwater intrusion in coastal areas, inland flooding, and damage from high winds [6,7,8]. Long-term forest impacts include disruption of timber supply, altered wildlife habitat, changes in fuels that affect wildfire risks, altered carbon storage, and changes in stream hydrological regimes, among other factors [3,9,10,11].
Initial hurricane impacts are known to vary across the landscape due to differences in wind speed and duration, which are often related to the distance from the track and coast [12]. At local scales, topography, forest type, edge effects, stand age, and stand density can also affect the impacts [13,14]. This cross-scale complexity of contributing factors can make the initial impacts difficult to assess. Secondary impacts, including how forest managers respond to damage, can affect the rate of successional recovery and long-term forest viability; however, secondary responses and recovery can be difficult to resolve across different forest uses and types after a major event. The forests of the Southeast US have particularly complex patterns of forest use, as their provision of ecosystem services includes industrial- and woodlot-sourced timber, water supplies, flood and urban heat mitigation, and biodiversity, among others [15]. As a single strong hurricane can destabilize urban, woodlot, and industrial forest services for years, understanding forest dynamics across forest use types is essential to address the implications of these extreme events.
Monitoring how forest owners manage post-disturbance recovery remains a complex but critical problem [16,17]. After a severe hurricane, a rapid response is crucial to ensure that monetary value can be reclaimed from damaged trees to mitigate pine beetle infestations and wildfire risk [18]. This is especially important in the forests of the Southeast US because of the prevalence of commercial timberland and its importance for the economy. After a destructive storm, the active management of pine plantations can restore their economic viability and mitigate wildfire risks. Industrial forest owners may leverage capital more efficiently than small rural woodlot owners, and in urban areas, neighborhood responses may also vary according to socioeconomic factors [12,19,20]. In this sense, leveraging forest use and ownership data may help contextualize impacts according to socioeconomic factors that relate to a hurricane’s broader impacts and resilience.
Hurricane researchers have relied on a number of different satellites, grid resolutions, vegetation-sensitive indices, and temporal periods for analyses [10,21,22,23,24]. Although post-hurricane forest monitoring involves broad-scale and local questions at multiple time scales [12], cross-scale analyses are relatively uncommon. Recent post-hurricane studies have used remote sensing to assess vegetation impacts [25,26], and more specifically, to estimate changes in the basal area [27], assess post-storm debris [28], and assess impacts on watershed hydrology [10]. However, while remote sensing-based monitoring that relies on coarse spatial resolution is often adequate for capturing general impacts, such as recognizing gradational impacts at scale, such data can fail to meaningfully inform questions related to differences across vegetation or forest types, ownership and management in highly fragmented landscapes. Due to inherent differences in forest patch size and forest vulnerability, it is difficult to quantify changes across uses that are as disparate as urban parcels and industrial timberland. Regardless of resolution, the most commonly used remote sensing technique has been change-over-time analysis, which has become a particularly powerful approach for understanding hurricane impacts in near-real-time, across years, and for understanding recovery [21,22,23,24]. Analyses that rely on change over time must contend with seasonal phenological variability and non-targeted disturbances, such as silvicultural activity, wildfire, or land cover change, depending on the latitude or region. In many regions, anniversary dates are preferred over shorter-term change analyses because the vegetation is often in decline at the end of the growing season when hurricanes occur, making it difficult to isolate hurricane impacts. A tradeoff, however, is that anniversary assessments are more likely to include the cumulative effects of multiple disturbances. Because of this, there is a need to understand hurricane impacts in the context of these other changes. Several indices are particularly adept at tracking seasonal phenology and a variety of disturbances in temperate latitudes, particularly the Normalized Difference Vegetation Index (NDVI) [29].
The need to understand hurricane impacts in areas with complex background disturbances was well demonstrated by 2018’s Hurricane Michael (HM), one of the most powerful and destructive hurricanes in the history of the United States [30]. This category 5 hurricane made landfall on Mexico Beach, Florida, on October 10 and caused a range of forest impacts across the three states. The initial damage estimates were $25 billion, including $18.4 billion in Florida alone. A subsequent estimate of forest damage in Florida, using pre-storm Forest Inventory and Analysis (FIA) surveys, was $1.29 billion, but this was found to be an underestimate after extensive field surveys were completed [31]. Damage to urban forests was excluded from the latter estimate, yet the impacts extended across all forest types. As a result, knowledge of the initial and secondary hurricane impacts and their recovery across the entire urban-to-industrial forest gradient remains uncertain. To achieve this broader landscape insight, our study aims to assess pre-storm dynamics, initial storm impacts, and secondary responses on forests associated with HM through the use of high spatial-resolution remote sensing and parcel data.
2. Materials and Methods
2.1. Study Area
The 60 km-wide study area was centered on the HM track in Florida’s panhandle, falling entirely west of the Apalachicola River and extending 100 km inland (Figure 1). It comprises all or parts of the Gulf, Bay, Washington, Calhoun, and Jackson Counties. Within this area, we defined two focal areas: A, 0–50 km from the coast, and B, 51–100 km from the coast. According to the 2016 National Land Cover Dataset (NLCD) [32]. Focal area A includes 12% urban land cover, which includes Panama City (the principal urban settlement of the study area), 24% evergreen forest, 40% woody wetlands, 1% agriculture, and 23% other land cover types. Focal area B consists of 8% urban, 32% evergreen forest, 23% woody wetland, 16% agricultural, and 22% other cover types.
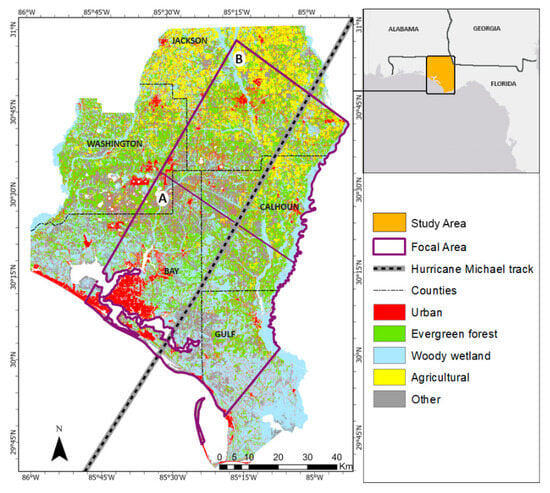
Figure 1.
The study area location is in northwestern Florida, USA. The letters on the map indicate focal areas: “A” near and “B” far from the coast.
Northwestern Florida’s coastal plain forests are disturbed by logging, thinning, prescribed fires, wildfires, insects, disease, and wind. Loblolly pine (Pinus taeda L.) and slash pine (P. elliottii Engelm.) are widely used in industrial pine stands. Non-industrial upland forests also include longleaf pine (P. palustris Mill.), sand pine in coastal areas (P. clausa (Chapm. ex Engelm.) Vasey ex Sarg.), and various species of hardwoods. Riparian and floodplain forests are dominated by swamp tupelo (Nyssa biflora Walter), swamp laurel oak (Quercus laurifolia Michx.), Cypress (Taxodium spp. L.), sweet bay (Magnolia virginiana L.) and sweetgum (Liquidambar styraciflua L.) among many other species [33]. Urban forests consist of a diverse mix of native and non-native tree species. Tree species can respond to hurricane winds quite differently due to their respective traits [5].
2.2. Mapping Pre-Hurricane Forest Cover
A map of the baseline forest cover is essential for isolating hurricane impacts on forests in this diverse landscape. Elsewhere, Coleman, et al. [34] combined the submeter National Aerial Imagery Program (NAIP) and 10 m Sentinel-2 imagery to map urban vegetation and land cover changes at a high resolution. Other studies have shown that the use of very high-resolution NAIP creates better maps than coarser-resolution approaches and allows rescaling [35]. The study area lacks a pre-hurricane forest cover classification other than the National Land Cover Dataset (NLCD), which was derived from Landsat at 30 m [32].
We created a high-resolution pre-hurricane forest cover mask using the 2017 NAIP [36]. The aerial data were collected during October and November 2017. Using Google Earth Engine [37], we then performed an unsupervised classification using the red, green, blue, and near-infrared bands and the derived Normalized Difference Vegetation Index (NDVI) at 1 m resolution using k-means clustering. We identified the classified types of tree cover based on visual observations in both urban and rural areas. For validation, we generated 300 random points for heavily urbanized Bay County and 300 points for the rest of the study area and evaluated every point as to its accuracy. The overall accuracy of the 2017 forest mask was 86.5%. Sensitivity was 85.9%, and precision was 81.05%, leading to an F1 score of 0.834. We then resampled the forest mask to derive the majority forest cover at a 10 m resolution for integration with other data used in this analysis. For a graphical depiction of the workflow, see Figure 2.
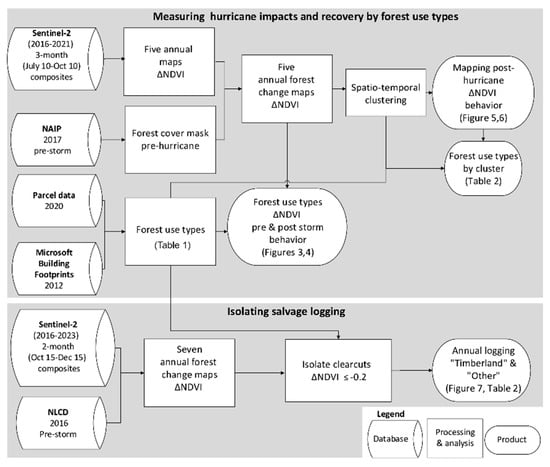
Figure 2.
Workflow diagram showing the methodological steps for this study.
2.3. Classifying Forest Use Types
The primary objective of this research was to understand how different forest use types were affected by HM and assess how they recovered or were subsequently managed. In particular, we sought to compare the dynamics of urban forests, privately owned woodlots, non-developed forest parcels, and industrial timberlands. To define these categories, we used the 2020 Florida parcel database from the University of Florida GeoPlan (https://fgdl.org/ accessed on 24 June 2022) and the 2012 Microsoft Building Footprints (MBF) from ArcGIS Hub (https://hub.arcgis.com/ accessed on 1 July 2022). The MBF dataset used deep learning to identify building footprints from high-resolution satellite imagery.
Using the 2017 forest cover mask defined in Section 2.2, we selected parcels that were at least 25% forest cover. The MBF provided a standardized way to define urban forests based on building structure density beyond what was possible using the parcel dataset alone. We converted buildings to points, then calculated the density with a 1-km moving window using ESRI’s ArcMap 10.7, and defined urban areas as having at least 50 building structures per km2. Using this threshold, the resultant urban patterns corresponded well with the general urban categories defined by the 2016 NLCD, while the patterns also corresponded to the precise locations of high-density urban parcels, such as single-family, multi-family, and commercial. We then used the parcel designation “timberland” to isolate commercial timberland forest use. Parcels were designated as “farm woodlots” when they were categorized as cropland, grazing, or improved agriculture in the parcel database. “Woodlots” were defined as vacant residential, mobile homes, or single family. All other parcels with forests were designated “other” and this often included parcels with descriptors such as governmental and commercial. For a graphical representation of the forest cover type classification and the resulting map, see Figure A1 and Figure A2 in Appendix A.
2.4. Analyzing Annual Forest Change
We sought to distinguish the effects of two predominant disturbance types: wind damage from HM and logging. Other disturbances, such as saltwater intrusion, wildfire, pine beetle mortality, and flooding, were localized to an extent. We measured annual changes in forest conditions for two years prior to HM and three years after using the NDVI. NDVI is commonly used to monitor forest conditions, disturbances, and recovery at this latitude, including those from wind and logging [10,29,38,39,40]. To calculate the NDVI annual change from two years before HM and three years after (2016 to 2021), we calculated 3-month (10 July–10 October) NDVI composites for every year from Sentinel-2 imagery using Google Earth Engine. This temporal window fell immediately before the anniversary date of HM. As clouds, cloud shadows, and haze are common in this landscape, we used maximum-NDVI-value compositing to efficiently derive a high-quality, robust NDVI value for each grid cell [41,42]. We examined the true color composites in GEE to ensure quality. Raster layers showing the change in NDVI (∆NDVI) were then masked using the resampled NAIP-derived forest cover to derive ∆NDVI for each parcel.
To isolate responses that related to parcels with sufficient forest cover, we selected a random subset of parcels that had at least 25% forest cover and sampled the forested portions of parcels with random points using the package SP in R 2023.06.1 software [43,44]. This step filtered out parcels that were not primarily forest use, as our unit of analysis was predominantly forested parcels, not trees, in this landscape. We extracted the forest use type and the five annual ∆NDVI values. For focal area A, the total sample size was 1475, and for focal area B, it was 2015 with their respective forest use type observations (Table 1). To compare annual ∆NDVI among forest use types and between focal areas, we then used the non-parametric Wilcoxon rank-sum test within the rstatix package in R software [43,45] and reported the adjusted p value using the Holm method to counteract the problem of multiple comparisons.

Table 1.
Number of observations by focal area and by forest use type.
To understand the variation in post-storm recovery, we graphed the distribution of responses by forest cover type for the 3 years post-storm, from 2019 to 2021. We standardized ∆NDVI to a pre-hurricane baseline condition by recalculating the values with respect to their 2018 values.
2.5. Classifying Post-Hurricane Forest NDVI Behavior
To generalize the multi-year patterns of disturbance and recovery across the five counties in and adjacent to the study area, we standardized changes according to each cell’s pre-hurricane NDVI value. Then, spatio-temporal clustering was performed using the annual ∆NDVI forest maps for 2018–2019, 2019–2020, and 2020–2021 using R and the packages Raster and RStoolbox [46,47]. Spatio-temporal clustering is a powerful method to empirically classify data to recognize and map areas sharing statistically similar forest-∆NDVI behavior across time [48,49]. We stacked the three forest ∆NDVI raster maps and ran an unsupervised classification using k-means non-hierarchical clustering. To ensure robust cluster initialization, the k-means algorithm was run with 10 random starts to define 10 distinct ∆NDVI profiles that reflect common behavioral patterns of NDVI decline and recovery over the three years. Clustering was based on a random sample of 1000 pixels from the input dataset, allowing for efficient computation while maintaining a representative cluster distribution. We iteratively explored different numbers of clusters, but we found that 10 sufficiently captured the range of annual behaviors that we could interpret and communicate with regard to initial hurricane impacts and secondary recovery or logging.
2.6. Isolating Post-Hurricane Salvage Logging Activity
In an entirely separate analysis (Figure 2), we isolated the variation in annual clear- cut logging activity, including salvage logging that occurred soon after the hurricane, by calculating the 1-year change in the fall period after the storm for the focal areas A and B. The anniversary dates used in the prior ∆NDVI analyses were problematic for isolating post-hurricane salvage logging because the first year of change (2018–2019) included both direct hurricane damage and secondary forest management. To isolate potential salvage logging, we calculated six new annual ∆NDVI rasters from Sentinel-2 in Google Earth Engine using a two-month (15 October to 15 December) NDVI-compositing window for five years post-HM and the one and only available pre-HM year, 2016–2017. This two-month window avoided the influence of standing flood water in the bottomland forests. We ignored 2017–2018 because this year includes HM damage. This approach allowed us to establish a 1-year baseline harvesting rate against which we could infer changes in the rate of logging activity across the non-urban forest sector. For this analysis, we masked the analysis to include only evergreen, deciduous, mixed, and woody wetland forest types using the 2016 NLCD [32]. We used NLCD 2016 rather than our prior-used 2017 forest mask to ensure that we had a robust measure of clearcut activity for the 2016–2017 baseline year. For each of the six annual maps, we isolated clear-cuts using a diagnostically severe decline in annual ∆NDVI below −0.20. We chose this threshold of change by comparing late-season NDVI changes with the 2017 NAIP imagery to isolate unmistakable clearcut activity from other disturbance impacts [39]. We examined the ∆NDVI within several dozen harvesting units and then examined the final map products for consistency with the footprints of clear-cuts using true color Sentinel-2 imagery. Visual examination of the imagery showed that such severe declines caused by non-clear-cut activity are exceedingly rare in the timberland type for this landscape. While this threshold does not reliably include selection logging or thinning, our intent was to have a standard indicator of large-patch salvage logging, which is consistent with the widely observed commercial sector’s response to reclaiming production after hurricane damage. We then compared temporal patterns of harvesting between industrial timberland and non-urban forests.
3. Results
3.1. NDVI Annual Change of Forests
During the two years prior to HM, forest disturbance and recovery were relatively low in both focal areas and across all land use types (Figure 3). There was a sharp decline across both focal areas immediately after the storm, with more within-use type variability than for any other year analyzed. For 2019–2020 and 2020–2021, recovery was the predominant response, but the distribution of NDVI changes remained broader than that for either of the two pre-HM years. For focal area A, near the coast, there was no difference among forest use types for the HM year 2018–19 (Figure 3a), but there was for focal area B for timberland and urban (adj. p value < 0.001), timberland and farm woodlots (adj. p value < 0.001), and urban and woodlot (adj. p value < 0.001) types (Figure 3b). A comparison of types across focal areas revealed no differences among forest use types for 2018–2019 (Figure 3a,b). However, during 2019–2020 and 2020–2021, the 1-year NDVI change was higher inland for timberland (adj. p value < 0.001).
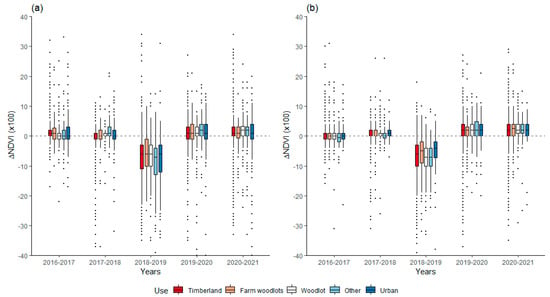
Figure 3.
Annual ∆NDVI by forest use type near (a) and far (b) from the coast for two years prior to Hurricane Michael, the year of the storm (2018–2019), and for two years after. The boxes represent the 25th and 75th percentiles of each distribution and the lines inside the boxes represent the medians.
When considered in context with the pre-hurricane condition, post-hurricane ∆NDVI shows progressive recovery of all forest use types through 2021 (Figure 4). Near the coast, there are no differences in recovery among forest use types for the three years post-storm (Figure 3a), but inland urban forests recovered faster compared to urban forests near the coast (adj. p value < 0.001) (Figure 4b). For 2019–2020, both inland urban (adj. p value < 0.001) and timberland forests (adj. p value < 0.001) recovered more than those of the corresponding forest use type near the coast. For 2020–21, these differences expanded to include urban and timberland forests as well.
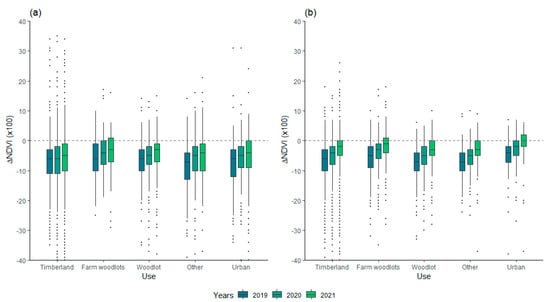
Figure 4.
Three-year recovery of forest use types standardized to the pre-HM condition for the coastal focal area (a) and inland focal area (b).
3.2. Post-Hurricane Forest Behavior
Mapped clusters of three-year ∆NDVI behavior show spatial aggregations over the three post-storm years (Figure 5). The technique reveals ∆NDVI behavior regardless of the forest patch size across the urban-to-industrial forest gradient (Figure 5b–d). Blue areas (clusters 9 and 10) are considerably more dominant farther from the track toward both the northwest and southeast.
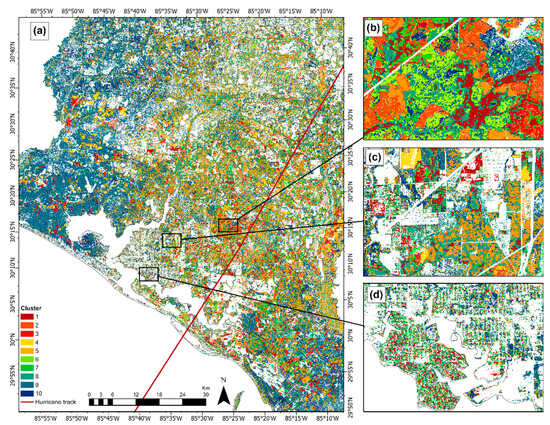
Figure 5.
Patterns of NDVI decline and recovery from spatio-temporal clustering over three years of annual post-hurricane ∆NDVI behavior (2018–2019 to 2020–2021). Note that warmer colors (clusters 1–6) mostly surround the track, indicating stronger declines in NDVI (see corresponding cluster numbers in Figure 6): (a) the southwest corner of the study area showing the hurricane track, (b) industrial forests, (c) interface forests (i.e., woodlot, farm-woodlot, and other), and (d) urban forests.
The mean values of the ten clusters show strong differences in three-year behavior relative to their pre-hurricane condition (Figure 6). Clusters 9 and 10 are relatively stable, while 7 increases during the first year before stabilizing. The other clusters show various magnitudes and timings of the decline and recovery responses over the analysis period. Clusters 3 and 6 are remarkable because declines continue for two years before starting to recover.
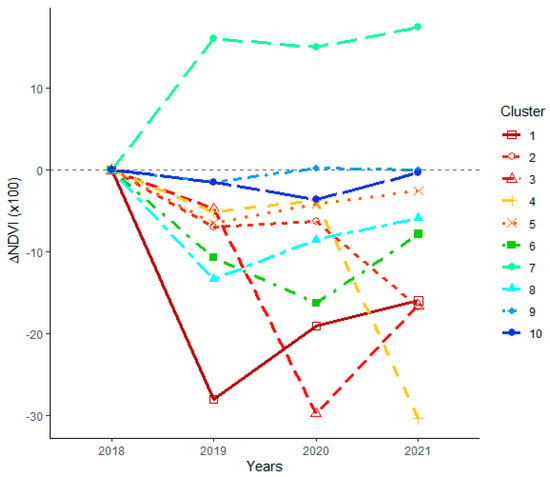
Figure 6.
Relative annual NDVI behavior of the 10 clusters with respect to the immediate pre-storm condition. The cluster numbers and colors in the legend correspond to the clusters shown in Figure 5.
Despite the patchy aggregation of behavioral clusters at fine scales that are shown in Figure 5, clusters do not closely correspond to individual forest use types at the landscape scale, as their representation within forest use types varies (Table 2). The most common behavior for all forest use types was cluster 5, which constituted nearly a third of the area’s forest overall (Table 2). As shown in Figure 6, cluster 5 exhibited a modest decline after the storm, which was followed by a gradual recovery over two years. The severe rapid decline exhibited by cluster 1 was more common in urban, timberland, and other forest use types than in the woodlot type, where cluster 8, having a similar but less intense initial drop, was prevalent (Table 2). This difference in first-year decline could reflect both the severity of hurricane damage and, when present, any early secondary management response.

Table 2.
Prevalence of post-hurricane forest behavioral clusters across forest use types.
3.3. Isolating Post-Hurricane Salvage Logging Activity
Compared to the baseline rate of 2016–2017, industrial timberland showed a strong and sustained increase in logging beginning in the first year after HM (Figure 7). Following a minor decline in 2020–2021 (during the COVID-19 pandemic), peak timberland harvesting occurred four years after the storm (2021–2022) when the area logged constituted 4% of the timberland use type of the study area (Table 3). By 2022–2023, timberland nearly returned to the baseline rate (Table 3). In contrast, the logging activity of all other non-urban forest use types fell below the baseline year for all five post-hurricane years that we analyzed (Figure 7), and by 2022–2023, harvesting constituted less than half of the baseline rate (Table 3).
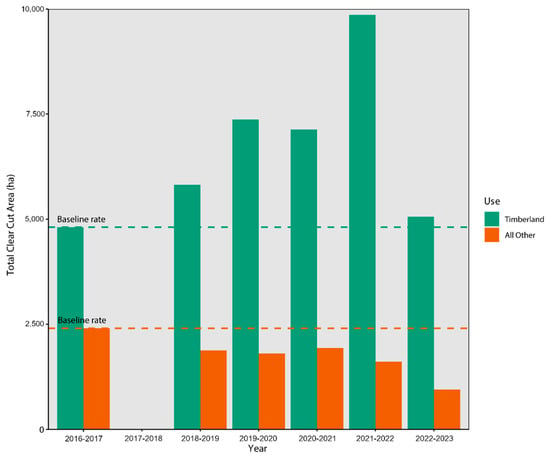
Figure 7.
Annual logging for timberland and all other non-urban forest use types within the study area for the pre-hurricane baseline of 2016–2017 and for five subsequent years.

Table 3.
Annual percentage of available forest use type logged for the study area compared to the pre-hurricane baseline year 2016–2017.
4. Discussion
At the broadest scale, our findings regarding the usefulness of remote sensing to capture immediate hurricane impacts and recovery are consistent with those of other studies. Remote sensing, and, in particular, change-over-time analysis, is a powerful method for monitoring hurricane impacts on the forest canopy across large areas. We documented high levels of immediate wind impact on forests within the HM footprint, which is consistent with the results of earlier studies [5,6,10,27,31]. Research that has addressed multi-year recovery has been relatively limited in scope, but [6] found a sustained reduction in productivity in longleaf pine woodlands up to two years after HM from field observations. Like prior post-hurricane research in the broader Atlantic region, we found that tracking conditions over time with remote sensing is consistent with the expectations of vegetation recovery [21,22]. Unlike prior studies, our analysis documented impacts at a fine resolution to better understand how impacts varied by forest use type across a complex urban-to-industrial forest landscape gradient.
Our analysis of forest impacts from this category 5 hurricane provides new insights into how the effects of this event were nuanced across scales. We demonstrated these cross-scale differences through the use of high-resolution remote sensing and parcel data. Broadly, we found no differences in 1-year impacts near and far from the coast, which may reflect the extreme wind speeds that extended well into Georgia through our study area [30]. Locally, initial impacts showed no difference among forest use types near the coast, but urban forests and farm woodlots were less impacted than timberlands or other woodlots inland (Figure 3 and Figure 4). Some of this heterogeneous first-year difference in severity may be related to the selective implementation of responsive management activities, including salvage logging in industrial timberlands, as suggested by Cluster 5 in Table 2 and Figure 6.
In subsequent years, we found complex gradational patterns of forest recovery after HM. While inland areas were not disturbed initially, NDVI recovery progressed further in the second year after the storm for most forest use types (Figure 4). Recovery patterns of urban forests are particularly remarkable, as we resolved the fine resolution and coast-to-inland differences in recovery behavior (Figure 4 and Figure 5). Overall, near-coast urban forests recovered more slowly than did those inland, and the former includes the Panama City metropolitan area, where most urban forest areas in the study area occurred. These coastal urban forests exhibited more diverse recovery (Figure 4), which is consistent with the fine texture of clusters that we mapped there (Figure 5), more fragmented ownership and individual forest owner responses, and the greater forest structural and compositional diversity that likely existed in Panama City’s varied neighborhoods prior to the storm. Urban forest disturbance and recovery are likely to be influenced by very fine-scale landowner decisions that are made on a tree-by-tree basis, such as removal, pruning, and replanting. This fine spatial texture may reduce the accuracy of our 10 m assessment more than for other forest use types that respond more uniformly (Figure 5).
This research highlights the importance of contextualizing post-disturbance observations in a socioeconomic context. Few studies have examined how forest owners, farmers, and rural communities differ in terms of preparedness or their capacity to respond to severe disturbances [50,51], and none of these have had a remote sensing component. This study also suggests that there can be substantial differences in how types of forest owners can effectively respond in the years following a catastrophic disturbance. The capacity to respond to forest disturbance expeditiously may affect when or if timber is salvaged, hazardous fuels are mitigated, or working forests are restored to production [12,52]. Unmitigated damage may mean that forests are more likely to fall out of commercial use or be converted to non-timber land use, such as development. The additional problem of unmanaged wildland fuels is of particularly high concern in this landscape, as was demonstrated by several post-hurricane wildfires. In March 2019, the 293 ha CR-2297-Allenton wildfire burned near the community of Appaloosa Way southeast of Panama City, and in April 2022, the 306 ha Adkins Avenue wildfire threatened the eastern fringe of Panama City, as the 9322 ha Bertha Swamp Road wildfire burned 15 km to the east. Prompt mitigation of hurricane-associated fuels can reduce the risk of wildfires in both communities and forests [53]. Multi-year monitoring efforts, such as ours, may capture these secondary or consequential events, which may also affect forest sustainability.
As climate changes, assuring the continued provision of ecosystem services is one of the most important challenges for sustainability [54]. However, it can be difficult to monitor precise impacts using measures that efficiently convey practical value. After any major disturbance, monitoring is especially important [12,22,24], and multi-year monitoring is readily captured by various remote sensing techniques [21,23,55]. However, our analysis suggests some limitations of NDVI behavior as a disturbance and recovery measure. At the spatial resolution addressed by our forest use classification, forest sustainability may be indicated by either rapid NDVI recovery or delayed NDVI recovery, as the latter may reflect salvage logging that sustains forest production over the long term, even when delayed for years. Hazardous fuel treatment may also delay NDVI recovery while providing greater community and ecological resistance. As these activities are inherently local, it can be challenging to make practical sense of the range of post-disturbance remote sensing indicators that define resilience at the landscape scale. In theory, the resilience concept has been defined by the terms absorbing, resisting, organizing, transforming, adapting, or bouncing back, but it also involves performance with respect to that which precedes it [56,57,58,59]. That is, destabilizing changes can be difficult to separate from the background dynamics. By framing expectations in terms of forest use types, monitors gain a context for understanding landscape dynamics, resilience, and sustainability more meaningfully.
Isolating and monitoring post-hurricane salvage logging is particularly important for this landscape, and we found substantial differences in post-HM activity among forest use types until late 2023. Industrial timber owners seem to have a more successfully restored commercial function than farms and other woodlots. Remarkably, non-timberland types saw a reduced rate of logging since the pre-storm period, and this was included in the first year after HM, when salvaging may have derived some commercial value from the damaged trees. The persistence of these differences in logging from 2018 to 2023 suggests that there may be disproportionate long-term consequences for industrial and private forest owners. These differences are especially enlightening because of the reported willingness of most affected private landowners to actively manage their forests after a hurricane [53]. This may reflect differences in the owner’s capacity to respond proportionately, as active management may already be constrained by issues like fractioned ownership of heirs’ property [60].
We detected a decrease in the wave of logging for timberland during 2020–2021, which could be related to the COVID-19 pandemic. We also observed a minor decline in the logging of other non-urban forest types that year. This decline is inconsistent with broader regional findings that COVID-19 has had a minimal effect on harvesting [61]. This may reflect the local challenges of harvesting due to the severity of hurricane damage two years earlier. As the post-hurricane activity lasted for years after the storm, the pandemic may have slowed the recovery of this forest sector.
This study makes several methodological contributions that help satisfy the cross-scale monitoring needs after severe disturbances. Reliance on the Google Earth Engine for processing high-resolution remote sensing products allowed us to address impacts efficiently at scale. Then, our use of spatio-temporal clustering demonstrated how multi-year NDVI behavior can help resolve both direct and secondary hurricane impacts at a high resolution. By then upscaling these data to the parcel level, we tied forest dynamics to forest ownership and forest use, which is critical for understanding the socioeconomic implications of this extreme weather event.
5. Conclusions
The systematic monitoring of coastal landscapes is becoming increasingly important as hurricanes become more intense and frequent. Satellite-based remote sensing is especially well-suited for this task, as it allows analysts to track the same location over multiple years with relatively uniform measures that cross ecological and socioeconomic gradients. Over time, continuous monitoring captures the background dynamic, the initial disturbance impact, and a range of secondary impacts. These secondary dynamics are especially important to track, but they can be difficult to interpret, as they often include both actioned responses like salvage logging, which is intended to restore long-term functional recovery in addition to successional recovery more generally.
Combining remote sensing measures with ancillary data, such as the parcel and building footprint data used in this study, provides a context critical for understanding landscape questions related to sustainable management and forest resilience. Using these datasets and their derivatives, we documented important differences across broad and local gradients related to storm intensity and types of forest use. We also found that the combined importance of these gradients varied, as initial impacts were more indiscriminate across types near the coast, while impacts were more likely to vary inland. We found important longer-term differences in the rate of recovery, particularly in the logging response across forest use types for up to five years after the storm. Our results suggest that to appreciate the implications of hurricanes more comprehensively, it is important to characterize how impacts are realized across spatial and temporal scales.
Although we focused on a single major hurricane in this study, such storms vary greatly in terms of wind intensity, duration, and the landscapes affected. Moreover, climate, vegetation, and socioeconomic factors may also vary regionally. This study highlights the importance of understanding these cross-scale factors and the implications of how disturbance impacts can be better characterized across complex landscapes. Such finer resolution analyses may lead to more effective strategies to monitor and mitigate the adverse effects of hurricanes on forest ecosystems.
Author Contributions
Conceptualization and methodology, S.P.N. and C.T.-P.; analysis and investigation, C.T.-P., S.P.N. and W.M.C.; data curation, C.T.-P., S.P.N. and W.M.C.; writing—original draft preparation, C.T.-P. and S.P.N.; writing—review and editing C.T.-P., S.P.N. and W.M.C.; visualization, C.T.-P. and S.P.N.; project administration: S.P.N. All authors have read and agreed to the published version of the manuscript.
Funding
This research received no external funding.
Data Availability Statement
The raw data supporting the conclusions of this article will be made available by the authors upon request.
Acknowledgments
This research was supported in part by an appointment to the United States Forest Service (USFS) Research Participation Program administered by the Oak Ridge Institute for Science and Education (ORISE) through an interagency agreement between the U.S. Department of Energy (DOE) and the U.S. Department of Agriculture (USDA) and Texas A&M Forest Service.
Conflicts of Interest
The authors declare that they have no commercial or associative interests that represent conflicts of interest in connection with the article submitted.
Appendix A
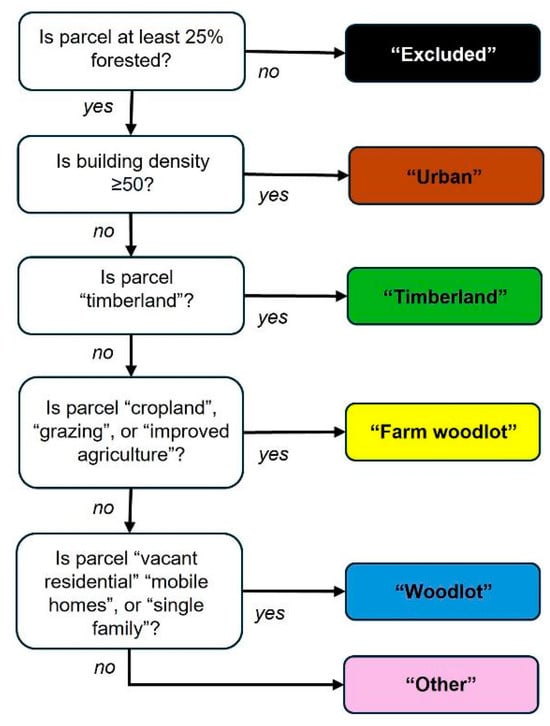
Figure A1.
Classification key used to define forest cover types from forest canopy cover, building density, and parcel data. The same colors are used in Figure A2.
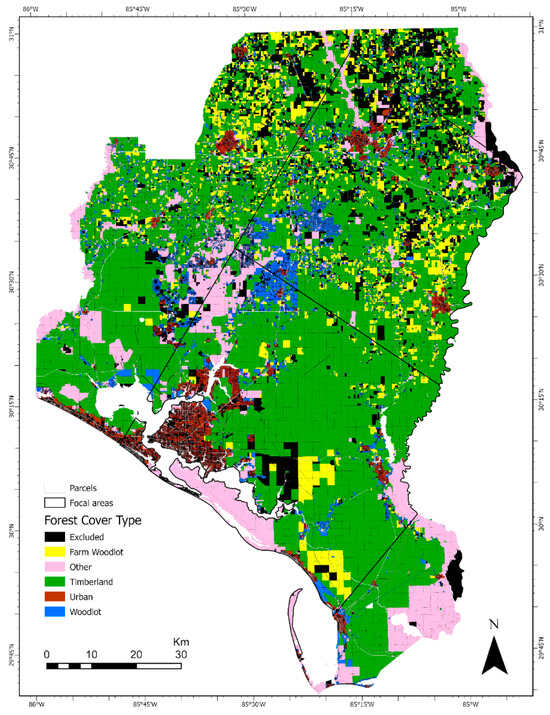
Figure A2.
Forest cover types derived from forest canopy cover, building density, and parcel data.
References
- Reed, K.A.; Wehner, M.F.; Zarzycki, C.M. Attribution of 2020 hurricane season extreme rainfall to human-induced climate change. Nat. Commun. 2022, 13, 1905. [Google Scholar] [CrossRef] [PubMed]
- Marsooli, R.; Lin, N.; Emanuel, K.; Feng, K. Climate change exacerbates hurricane flood hazards along US Atlantic and Gulf Coasts in spatially varying patterns. Nat. Commun. 2019, 10, 3785. [Google Scholar] [CrossRef] [PubMed]
- Sharma, A.; Ojha, S.K.; Dimov, L.D.; Vogel, J.G.; Nowak, J. Long-term effects of catastrophic wind on southern US coastal forests: Lessons from a major hurricane. PLoS ONE 2021, 16, e0243362. [Google Scholar] [CrossRef]
- Vecchi, G.A.; Landsea, C.; Zhang, W.; Villarini, G.; Knutson, T. Changes in Atlantic major hurricane frequency since the late-19th century. Nat. Commun. 2021, 12, 4054. [Google Scholar] [CrossRef]
- Rutledge, B.T.; Cannon, J.B.; McIntyre, R.K.; Holland, A.M.; Jack, S.B. Tree, stand, and landscape factors contributing to hurricane damage in a coastal plain forest: Post-hurricane assessment in a longleaf pine landscape. For. Ecol. Manag. 2021, 48, 118724. [Google Scholar] [CrossRef]
- Kenney, G.; Staudhammer, C.L.; Wiesner, S.; Brantley, S.T.; Bigelow, S.W.; Starr, G. Hurricane Michael Altered the Structure and Function of Longleaf Pine Woodlands. J. Geophys. Res. Biogeo. 2021, 126, e2021JG006452. [Google Scholar] [CrossRef]
- Mallin, M.A.; Corbett, C.A. How hurricane attributes determine the extent of environmental effects: Multiple hurricanes and different coastal systems. Estuar. Coast. 2006, 29, 1046–1061. [Google Scholar] [CrossRef]
- Cole, J.; Nowak, D.J.; Greenfield, E.J. Potential Hurricane Wind Risk to US Rural and Urban Forests. J. For. 2021, 119, 393–406. [Google Scholar] [CrossRef]
- McNulty, S.G. Hurricane impacts on US forest carbon sequestration. Environ. Pollut. 2002, 116, S17–S24. [Google Scholar] [CrossRef]
- Worley, E.; Liu, N.; Sun, G.; Norman, S.P.; Christie, W.M.; Gavazzi, M.; Boggs, J.; McNulty, S.G. Impacts of Hurricane Michael on Watershed Hydrology: A Case Study in the Southeastern United States. Forests 2022, 13, 904. [Google Scholar] [CrossRef]
- Zampieri, N.E.; Pau, S.; Okamoto, D.K. The impact of Hurricane Michael on longleaf pine habitats in Florida. Sci. Rep. 2020, 10, 8483. [Google Scholar] [CrossRef] [PubMed]
- Stanturf, J.A.; Goodrick, S.L.; Outcalt, K.W. Disturbance and coastal forests: A strategic approach to forest management in hurricane impact zones. For. Ecol. Manag. 2007, 250, 119–135. [Google Scholar] [CrossRef]
- Gong, Y.; Staudhammer, C.L.; Kenney, G.; Wiesner, S.; Zhang, Y.L.; Starr, G. Vegetation structure drives forest phenological recovery after hurricane. Sci. Total Environ. 2021, 774, 145651. [Google Scholar] [CrossRef]
- Dahal, D.; Liu, S.G.; Oeding, J. The Carbon Cycle and Hurricanes in the United States between 1900 and 2011. Sci. Rep. 2014, 4, 5197. [Google Scholar] [CrossRef] [PubMed]
- Landry, S.M.; Koeser, A.K.; Kane, B.; Hilbert, D.R.; McLean, D.C.; Andreu, M.; Staudhammer, C.L. Urban forest response to Hurricane Irma: The role of landscape characteristics and sociodemographic context. Urban For. Urban Green. 2021, 61, 127093. [Google Scholar] [CrossRef]
- vonHedeman, N.; Schultz, C.A. U.S. Family Forest Owners’ Forest Management for Climate Adaptation: Perspectives from Extension and Outreach Specialists. Front. Clim. 2021, 3, 674718. [Google Scholar] [CrossRef]
- Aslan, C.; Souther, S. The interaction between administrative jurisdiction and disturbance on public lands: Emerging socioecological feedbacks and dynamics. J. Environ. Manag. 2022, 319, 115682. [Google Scholar] [CrossRef]
- Singer, R. Recovering from the 2018 Storms. Hurricane Michael Brought Significant Losses -and Some Gains- to South Georgia’s Forest Owners. 2019. Available online: http://www.georgiaforestrymagazine.com/hurricanemichael.html (accessed on 15 July 2024).
- Aragon, A.; Gaither, C.J.; Madden, M.; Goodrick, S. The “Efficiency Concern”: Exploring Wildfire Risk on Heirs’ Property in Macon-Bibb County, Georgia, United States of America. Hum. Ecol. Rev. 2019, 25, 51–68. [Google Scholar] [CrossRef]
- Gan, J.B.; Jarrett, A.; Gaither, C.J. Landowner response to wildfire risk: Adaptation, mitigation or doing nothing. J. Environ. Manag. 2015, 159, 186–191. [Google Scholar] [CrossRef]
- de Beurs, K.M.; McThompson, N.S.; Owsley, B.C.; Henebry, G.M. Hurricane damage detection on four major Caribbean islands. Remote Sens. Environ. 2019, 229, 1–13. [Google Scholar] [CrossRef]
- Gang, C.C.; Pan, S.F.; Tian, H.Q.; Wang, Z.N.; Xu, R.T.; Bian, Z.H.; Pan, N.Q.; Yao, Y.Z.; Shi, H. Satellite observations of forest resilience to hurricanes along the northern Gulf of Mexico. For. Ecol. Manag. 2020, 472, 118243. [Google Scholar] [CrossRef]
- Wang, F.G.; D’Sa, E.J. Potential of MODIS EVI in Identifying Hurricane Disturbance to Coastal Vegetation in the Northern Gulf of Mexico. Remote. Sens. 2010, 2, 1–18. [Google Scholar] [CrossRef]
- Wang, W.T.; Qu, J.J.; Hao, X.J.; Liu, Y.Q.; Stanturf, J.A. Post-hurricane forest damage assessment using satellite remote sensing. Agric. For. Meteorol. 2010, 150, 122–132. [Google Scholar] [CrossRef]
- Cortes-Ramos, J.; Farfan, L.M.; Herrera-Cervantes, H. Assessment of tropical cyclone damage on dry forests using multispectral remote sensing: The case of Baja California Sur, Mexico. J. Arid. Environ. 2020, 178, 104171. [Google Scholar] [CrossRef]
- Liu, M.L.; Liu, X.N.; Wu, L.; Tang, Y.B.; Li, Y.; Zhang, Y.Q.; Ye, L.; Zhang, B.Y. Establishing forest resilience indicators in the hilly red soil region of southern China from vegetation greenness and landscape metrics using dense Landsat time series. Ecol. Indic. 2021, 121, 106985. [Google Scholar] [CrossRef]
- St Peter, J.; Anderson, C.; Drake, J.; Medley, P. Spatially Quantifying Forest Loss at Landscape-scale Following a Major Storm Event. Remote. Sens. 2020, 12, 1138. [Google Scholar] [CrossRef]
- Karaer, A.; Ulak, M.B.; Abichou, T.; Arghandeh, R.; Ozguven, E.E. Post-Hurricane Vegetative Debris Assessment Using Spectral Indices Derived from Satellite Imagery. Transp. Res. Rec. 2021, 2675, 504–523. [Google Scholar] [CrossRef]
- Hargrove, W.W.; Spruce, J.P.; Gasser, G.E.; Hoffman, F.M. Toward a National Early Warning System for Forest Disturbances Using Remotely Sensed Canopy Phenology. Photogramm. Eng. Remote. Sens. 2009, 75, 1150–1156. [Google Scholar]
- Beven, J.L.; Berg, R.; Hagen, A. National Hurricane Center. Tropical Cyclone Report Hurricane Michael; National Oceanic and Environmental Administration National Weather Service. 2018. Available online: https://www.nhc.noaa.gov/data/tcr/AL142018_Michael.pdf (accessed on 15 February 2023).
- Brandeis, T.; Turner, J.; Baeza Castro, A.; Brown, M.; Lambert, S. Assessing Forest Resource Damage Following Natural Disasters using national forest inventory plots: A case of Hurricane Michael. For. Serv. Res. Pap. 2022, 65, 1–30. [Google Scholar] [CrossRef]
- NLCD. National Land Cover Dataset. 2016. Available online: https://www.usgs.gov/data/nlcd-2016 (accessed on 25 July 2023).
- Iverson, L.R.; Prasad, A.M.; Peters, M.P.; Matthews, S.N. Facilitating Adaptive Forest Management under Climate Change: A Spatially Specific Synthesis of 125 Species for Habitat Changes and Assisted Migration over the Eastern United States. Forests 2019, 10, 989. [Google Scholar] [CrossRef]
- Coleman, R.W.; Stavros, N.; Yadav, V.; Parazoo, N. A Simplified Framework for High-Resolution Urban Vegetation Classification with Optical Imagery in the Los Angeles Megacity. Remote Sens. 2020, 12, 2399. [Google Scholar] [CrossRef]
- Erker, T.; Wang, L.; Lorentz, L.; Stoltman, A.; Townsend, P.A. A statewide urban tree canopy mapping method. Remote Sens. Environ. 2019, 229, 148–158. [Google Scholar] [CrossRef]
- NAIP. National Agriculture Imagery Program. 2017. Available online: https://www.usgs.gov/centers/eros/science/usgs-eros-archive-aerial-photography-national-agriculture-imagery-program-naip?qt-science_center_objects=0#qt-science_center_objects (accessed on 25 April 2024).
- Gorelick, N.; Hancher, M.; Dixon, M.; Ilyushchenko, S.; Thau, D.; Moore, R. Google Earth Engine: Planetary-scale geospatial analysis for everyone. Remote Sens. Environ. 2017, 202, 18–27. [Google Scholar] [CrossRef]
- Rodgers, J.C.; Murrah, A.W.; Cooke, W.H. The Impact of Hurricane Katrina on the Coastal Vegetation of the Weeks Bay Reserve, Alabama from NDVI Data. Estuar. Coast. 2009, 32, 496–507. [Google Scholar] [CrossRef]
- Norman, S.P.; Christie, W.M. Precise mapping of disturbance impacts to U.S. forests using high-resolution satellite imagery. In Forest Health Monitoring: National Status, Trends, and Analysis 2021; Potter, K.M., Conkling, B.L., Eds.; U.S. Department of Agriculture Forest Service, Southern Research Station: Asheville, NC, USA, 2022; p. 119. [Google Scholar]
- Giupponi, L.; Leoni, V.; Pedrali, D.; Giorgi, A. Restoration of Vegetation Greenness and Possible Changes in Mature Forest Communities in Two Forests Damaged by the Vaia Storm in Northern Italy. Plants 2023, 12, 1369. [Google Scholar] [CrossRef]
- Holben, B.N. Characteristics of Maximum-Value Composite Images from Temporal Avhrr Data. Int. J. Remote Sens. 1986, 7, 1417–1434. [Google Scholar] [CrossRef]
- Zhou, J.; Jia, L.; Menenti, M.; Gorte, B. On the performance of remote sensing time series reconstruction methods—A spatial comparison. Remote Sens. Environ. 2016, 187, 367–384. [Google Scholar] [CrossRef]
- R Core Team R: A Language and Environment for Statistical Computing; R Foundation for Statitical Computing: Vienna, Austria, 2023.
- Pebesma, E.; Bivand, R. sp: Classes and Methods for Spatial Data. R Package Version 2.1-4. Available online: https://cran.r-project.org/web/packages/sp/index.html (accessed on 30 April 2024)).
- Kassambara, A. Rstatix: Pipe-Friendly Framework for Basic Statistical Tests, 0.7.2. 2023. Available online: https://rpkgs.datanovia.com/rstatix/ (accessed on 25 July 2023).
- Leutner, B.; Horning, N.; Schwalb-Willmann, J. RStoolbox: Tools for Remote Sensing Data Analysis. R Package Version 0.3.0., R: 2022. Available online: https://bleutner.github.io/RStoolbox/ (accessed on 15 September 2022).
- Hijmans, R.J. Raster: Geographic Data Analysis and Modeling. R Package, Version 3.6-26. Available online: https://cran.r-project.org/web/packages/raster/index.html (accessed on 15 July 2023).
- Erguner, Y.; Kumar, J.; Hoffman, F.M.; Dalfes, H.N.; Hargrove, W.W. Mapping ecoregions under climate change: A case study from the biological "crossroads’ of three continents, Turkey. Landsc. Ecol. 2019, 34, 35–50. [Google Scholar] [CrossRef]
- Hargrove, W.W.; Hoffman, F.M. Potential of multivariate quantitative methods for delineation and visualization of ecoregions. Environ. Manag. 2004, 34, S39–S60. [Google Scholar] [CrossRef]
- Hovis, M.; Frey, G.; McGinley, K.; Cubbage, F.; Han, X.; Lupek, M. Ownership, Governance, Uses, and Ecosystem Services of Community Forests in the Eastern United States. Forests 2022, 13, 1577. [Google Scholar] [CrossRef]
- McGinley, K.A.; Gould, W.A.; Alvarez-Berrios, N.L.; Holupchinski, E.; Diaz-Camacho, T. READY OR NOT? Hurricane preparedness, response, and recovery of farms, forests, and rural communities in the US Caribbean. Int. J. Disaster Risk Reduct. 2022, 82, 103346. [Google Scholar] [CrossRef]
- Prestemon, J.P.; Holmes, T.P. Market dynamics and optimal timber salvage after a natural catastrophe. For. Sci. 2004, 50, 495–511. [Google Scholar] [CrossRef]
- Clarke, M.; Sharma, A.; Stein, T.; Vogel, J.; Nowak, J. Forest Disturbances and Nonindustrial Forest Landowners: Management of Invasive Plants, Fire Hazards and Wildlife Habitats After a Hurricane. J. For. 2023, 121, 419–431. [Google Scholar] [CrossRef]
- Turner, M.G.; Donato, D.C.; Romme, W.H. Consequences of spatial heterogeneity for ecosystem services in changing forest landscapes: Priorities for future research. Landsc. Ecol. 2013, 28, 1081–1097. [Google Scholar] [CrossRef]
- Kennedy, R.E.; Yang, Z.Q.; Cohen, W.B.; Pfaff, E.; Braaten, J.; Nelson, P. Spatial and temporal patterns of forest disturbance and regrowth within the area of the Northwest Forest Plan. Remote Sens. Environ. 2012, 122, 117–133. [Google Scholar] [CrossRef]
- Ibanez, I.; Acharya, K.; Juno, E.; Karounos, C.; Lee, B.R.; McCollum, C.; Schaffer-Morrison, S.; Tourville, J. Forest resilience under global environmental change: Do we have the information we need? A systematic review. PLoS ONE 2019, 14, e0222207. [Google Scholar] [CrossRef] [PubMed]
- Fisichelli, N.A.; Schuurman, G.W.; Hoffman, C.H. Is ‘Resilience’ Maladaptive? Towards an Accurate Lexicon for Climate Change Adaptation. Environ. Manag. 2016, 57, 753–758. [Google Scholar] [CrossRef] [PubMed]
- Gunderson, L. Ecological and Human Community Resilience in Response to Natural Disasters. Ecol. Soc. 2010, 15, 753–758. Available online: http://www.jstor.org/stable/26268155 (accessed on 27 March 2023). [CrossRef]
- Gunderson, L.H. Ecological resilience—In theory and application. Annu. Rev. Ecol. Syst. 2000, 31, 425–439. [Google Scholar] [CrossRef]
- Gaither, C.J.; Carpenter, A.; McCurty, T.L.; Toering, S. Heirs’ Property and Land Fractionation: Fostering Stable Ownership to Prevent Land Loss and Abandonment; SRS-244; U.S. Department of Agriculture Forest Service, Southern Research Station: Asheville, NC, USA, 2019; p. 105. [Google Scholar]
- Hilsenroth, J.; Grogan, K.A.; Crandall, R.M.; Bond, L.; Sharp, M. The Impact of COVID-19 on management of non-industrial private forests in the Southeastern United States. Trees For. People 2021, 6, 100159. [Google Scholar] [CrossRef]
Disclaimer/Publisher’s Note: The statements, opinions and data contained in all publications are solely those of the individual author(s) and contributor(s) and not of MDPI and/or the editor(s). MDPI and/or the editor(s) disclaim responsibility for any injury to people or property resulting from any ideas, methods, instructions or products referred to in the content. |
© 2024 by the authors. Licensee MDPI, Basel, Switzerland. This article is an open access article distributed under the terms and conditions of the Creative Commons Attribution (CC BY) license (https://creativecommons.org/licenses/by/4.0/).