Abstract
Forest degradation is a major issue in ecosystem monitoring, and to take reformative measures, it is important to detect, map, and quantify the losses of forests. Synthetic Aperture Radar (SAR) time-series data have the potential to detect forest loss. However, its sensitivity is influenced by the ecoregion, forest type, and site conditions. In this work, we assessed the accuracy of open-source C-band time-series data from Sentinel-1 SAR for detecting deforestation across forests in Africa, South Asia, and Southeast Asia. The statistical Cumulative Sums of Change (CuSUM) algorithm was applied to determine the point of change in the time-series data. The algorithm’s robustness was assessed for different forest site conditions, SAR polarizations, resolutions, and under varying moisture conditions. We observed that the change detection algorithm was affected by the site- and forest-management activities, and also by the precipitation. The forest type and eco-region affected the detection performance, which varied for the co- and cross-pol backscattering components. The cross-pol channel showed better deforested region delineation with less spurious detection. The results for Kalimantan showed a better accuracy at a 100 m spatial resolution, with a 25.1% increase in the average Kappa coefficient for the VH polarization channel in comparison with a 25 m spatial resolution. To avoid false detection due to the high impact of soil moisture in the case of Haldwani, a seasonal analysis was carried out based on dry and wet seasons. For the seasonal analysis, the cross-pol channel showed good accuracy, with an average Kappa coefficient of 0.85 at the 25 m spatial resolution. This work was carried out in support of the upcoming NISAR mission. The datasets were repackaged to the NISAR-like HDF5 format and processing was carried out with methods similar to NISAR ATBDs.
1. Introduction
Globally, forests are undergoing significant change and degradation due to constantly growing urban, agricultural, and industrial areas. Forests, after oceans, are the second major carbon sink and have a large impact on ecosystem dynamics [1]. Large-scale logging causes a loss of carbon [2,3] and also affects the biodiversity [4]. This poses the need to detect and map the deforested regions for early warnings and facilitate further planning [1,5,6,7,8]. Deforestation is a type of forest degradation; others include vertical structure thinning, selective logging, and lopping [9,10].
The tropical regions with the densest forests are also seeing the highest rates of deforestation [11,12]. The current methods for deforestation mapping heavily rely on optical satellite data [13,14,15]. Yearly change maps derived from Landsat data [13] provide information about the change in the forest cover. However, due to cloud cover obstructing optical data, it is difficult to curate a consistent time-series dataset, which is necessary for continuous monitoring. This, in turn, can have an adverse effect on the mapping accuracy [16].
Synthetic Aperture Radar (SAR) data have been extensively used for understanding forest ecosystems. Different applications include forest biomass estimation [17,18,19], forest height estimation [20,21], vertical structure dynamics [22,23], forest fire monitoring [24,25], and disturbance mapping [26,27,28].
SAR data have advantages in deforestation detection due to its nearly all-weather data collection capability, foliage penetration, and sensitivity to the structural and dielectric properties of the target [29,30,31]. Furthermore, SAR provides a more elaborate set of parameters or derivatives to work with, such as backscatter [5,32,33], coherence [20,33,34], and interferograms [35].
For deforestation detection with SAR data, bitemporal or multi-temporal data can be used. In the case of multi-temporal data, a time-series SAR dataset is required. Applications with a short-term study duration, such as a burn severity assessment, can be carried out with bitemporal data that are computationally less expensive [29,36,37,38,39]. However long-term studies, such as continuous forest disturbance monitoring, require multi-temporal data [40,41,42,43].
There are various methods for detecting changes using time-series SAR data, including statistical methods [34,36,44,45,46,47,48], physics-based methods [49,50], and machine learning approaches [6,51,52,53]. To identify the point of change in the multi-temporal data, statistical approaches involve the use of a statistical measure or test statistic, such as the Wishart test statistic [29,36,47], Cumulative Sums of Change (CuSUM) [40,48,54], and Omnibus Test [46,55]. Physics-based approaches include decomposition methods that aim at studying the scattering characteristics to deduce the target information [49,50]. Numerous studies explored deep learning and machine learning-based methods for change detection using a SAR time series, including the Gaussian process [30], CNN [52], Deep Learning [6,51], and Graph Convolutional Network [53,56].
Till the launch of the C-band Sentinel-1 (S-1) satellites, consistent SAR time-series datasets were not available globally. Most of the earlier works made use of bitemporal SAR data (ERS-1, ALOS-1) or time-series SAR acquired over a limited geographical region [8,44,46,57,58,59]. S-1 provides dual-pol time-series data with a revisit period of 12 days (24 days in some orbits since December 2021 due to the loss of S-1A) over the tropics, with the potential for continuous forest monitoring. The use of S-1 SAR data for deforestation mapping has been limited but promising [5,7,48]. SAR backscatter-based change detection algorithms are affected by SAR data’s sensitivity to changes in the forest phenology, vegetation, soil moisture content, and seasonal variations [60]. These variations are site-specific and can vary with the forest ecoregion, forest type, and forest management practices. Very limited studies were carried out to study the impacts of these factors on the accuracy of deforestation detection using time-series SAR data [28,33]. Most studies focused on the deforestation for a specific geographic region, such as forests in Indonesia [8,24,33,49,61], Congo basin forests [28,33], and the Amazon [33,62].
CuSUM finds out the point of change with the help of variation in statistical quantities derived from the backscatter time series. Since backscatter is heavily reliant on the site conditions, the algorithm parameters, i.e., the time-series data and thresholds, must be modified accordingly. This algorithm was tested in studies for deforestation mapping while focused on one forest site. These sites included those in Scotland [48], the Congo basin [7], and the Brazilian Amazon [63]. Nonetheless, this technique needs to be adapted to site-specific conditions in order to generate large-scale change maps.
To address this gap, we aimed to analyze the accuracy of the SAR-based change detection algorithm across multiple ecoregions, located across two continents. This work presents a comprehensive analysis of the performance of the CuSUM algorithm for three forests located in Africa, South Asia, and Southeast Asia. These forests represent seven distinct forest ecoregions and are characterized by unique seasonal weather patterns and forest- and site-management practices. This study assessed the performance of CuSUM for different forest types, soil moisture, and under-canopy conditions. This work was carried out in support of the upcoming NASA-ISRO SAR (NISAR) mission, which is expected to be launched in 2025. The S-1 SAR data are repackaged into NISAR-like HDF5 format, and the SAR data processing and algorithms applied in this study were similar to those of the NISAR ATBDs [64]. The forest sites and datasets used for the analysis are described in Section 2. The SAR data processing, the CuSUM algorithm, and the validation strategies employed are explained in Section 3. The results are presented and discussed in Section 4, and the work is summarized with key conclusions highlighted in Section 5.
2. Study Area and Dataset
2.1. Forest Sites
For this study, three forest sites in the tropical and subtropical regions were selected across two continents. Disturbance events have been reported for these sites in the past two decades [3,7,33,59,65,66]. The three forest sites lie in different ecoregions according to the terrestrial ecoregions classification [67]. These study sites are shown in Figure 1.
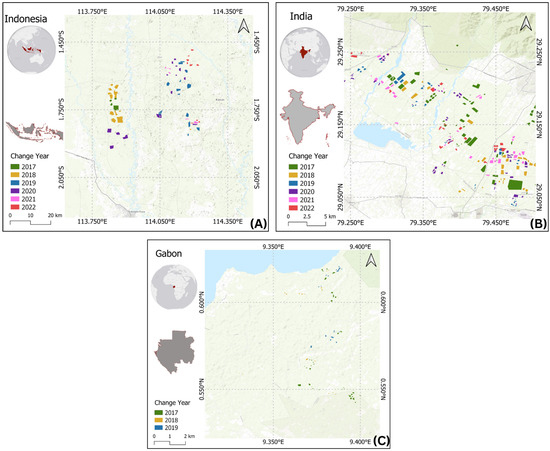
Figure 1.
Study area map showing three forest sites covered in this study: (A) Kalimantan forests in Indonesia, (B) Haldwani forests in India, and (C) forests near Libreville in Mondah. The polygons represent the ground truth (change area) for the years 2017 to 2022 for Kalimantan and Haldwani, and for 2017 to 2019 for Mondah.
The first study area was a part of the forests in Central Kalimantan, near the capital city of Palangka Raya centered around 114.007°E, 1.720°S. According to the world ecoregion classification, this study site consists of three ecoregions, i.e., Borneo lowland rainforests, Sundaland heath forests, and Southwest Borneo freshwater swamp forests. This area is located at an elevation of 70.48 meters above mean sea level, with a slope varying between 0° and 32.7° (average slope: 2.73°). The temperature ranges between 22.3° Celsius and 32.5° Celsius. Frequent floods occur in this area. It was chosen as one of the sites for this study, as it is an active degradation site and has recorded around a 29% decrease in tree cover from 2001 to 2022 [13]. Various sites in this area were studied to understand the loss of carbon stock, forest degradation, and deforestation, as well as agroforestry [33,50,61,68,69].
The second study site is the Haldwani forest range in the Uttarakhand state in India, centered around 79.400°E, 29.168°N. The world ecoregion classification has misclassified this area as Terai–Duar savanna and grasslands, whereas it is composed of three different ecoregions, i.e., Himalayan subtropical pine forests, Upper Gangetic Plains moist deciduous forests, and Terai–Duar savanna and grasslands. This is a managed forest, with frequent planned logging activities. The major tree species are Sal (Shorea robusta), Eucalyptus, and Teak (Tectona grandis). These forests are moderately dense tropical deciduous forests and are located at an elevation of 424 meters above mean sea level, with a mean ground slope of 2.67°. The Haldwani forest range experiences a temperature of 5° to 40° Celsius and has a relatively flat terrain. Several studies were carried out on this area for biomass estimation and forest height estimation [17,59,70,71,72].
The third study site lies in the Central African mangroves in northwestern Gabon, including the Akanda National Park centered around 9.438°E, 0.534°N. These forests lie in the Congo basin with an average elevation of 8m above mean sea level. The terrain is flat near the coast and undulating in the interior with a slope varying between 0° and 32.9° (average slope: 2.58°). The temperature here ranges between 23.5° Celsius and 28.6° Celsius. These forests have been going through small but significant changes over the past two decades [1,13,41,66]. Since this area is known for being one of the largest forest carbon sinks in the world, it is important to monitor and map the changes and degradation taking place.
2.2. Satellite Dataset
Dual-polarimetric SAR data from S-1 were used in this study. The S-1 mission by the European Space Agency (ESA) consists of two near-polar-orbiting satellites S-1A (operational) and S-1B launched on 3 April 2014 and 25 April 2016, respectively. The central frequency of operation is 5.405 GHz and data is acquired in two polarization channels—VV (Vertical transmit Vertical receive) and VH (Vertical transmit Horizontal receive). S-1B stopped operation on 23 December 2021.
Single Look Complex (SLC) data were downloaded from the Alaska Satellite Facility Distributed Active Archive Center (ASF DAAC) for the three study sites from 2017 to 2022. The number of acquisitions for each study site and year of analysis are listed in Table 1. A total of 490 scenes, which added up to approximately 2 TB of data, were downloaded and processed to carry out this study.

Table 1.
Annual summary of the S-1 data processed over the three sites between 2017 and 2022.
Soil moisture data acquired from the Advanced Scatterometer (ASCAT) by ESA was downloaded from Copernicus Land Monitoring Service in the form of the Soil Water Index (SWI). The SWI evaluates the water contents (m3/m3) of the soil layers at different depths. It is derived from the surface soil moisture using a water balance model and ranges from 0 to 100. These data were used to analyze the relationship between the surface soil moisture and the backscatter for deforested and unchanged areas in Kalimantan and Haldwani.
Rainfall data were acquired for the three study sites from the Integrated Multi-satellitE Retrievals for GPM (IMERG) by NASA. These data were used to calculate the monthly cumulative rainfall and hereby extract the wet months accordingly.
2.3. Validation Dataset
The validation data for this study were prepared using field data and analyzing satellite datasets from multiple sources. For Haldwani, the field data collected over the years 2017 to 2023 were used for marking the change/no-change polygons. Global forest/non-forest maps were used from TanDEM and Copernicus to rule out the non-forest areas. High- and moderate-resolution optical time-series satellite data from PlanetScope (3 m spatial resolution) and Sentinel-2 (10 m spatial resolution) were downloaded, pre-processed, and analyzed. For the period with significant cloud cover, S-1-processed backscatter was referred to. By photo interpretation of the layers from all the abovementioned sources, polygons for change and no-change areas were created to compile the validation dataset for all three study sites, as shown in Figure 1. A total of 396 polygons were created for the six years that covered the temporal range of this study. The change and no-change areas were marked yearly, ranging in size from 4 ha to 79 ha in Haldwani, and from 5 ha to 220 ha in Kalimantan. However, due to the persistent cloud cover over Mondah, validation data could only be created for three years, from 2017 to 2019, with polygons ranging from 0.10 ha to 1.03 ha.
For the seasonal analysis, a total of 266 polygons were created for Haldwani, in wet and dry seasons, ranging in size from 0.1 ha to 86 ha. The analysis was only carried out for Haldwani. Since Kalimantan consistently received a monthly cumulative rainfall above 75 mm, which made it indifferent to seasonal impact, it was omitted from the seasonal analysis. For Mondah, the analysis could not be carried out due to the unavailability of sufficient data for validation.
3. Methodology
This section describes the process workflow for carrying out this study. Section 3.1 explains the pre-processing steps followed to prepare the temporal data stack. Section 3.2 describes the change detection algorithm used in this study. Section 3.3 and Section 3.4 explain the way the dataset and algorithm were adapted to the site conditions. Section 3.5 and Section 3.6 discuss the post-processing and accuracy assessment techniques applied in this study.
3.1. S-1 Data Processing with ISCE
S-1 pre-processing was carried out using ISCE (InSAR Scientific Computing Environment) software by Jet Propulsion Laboratory (JPL) [73]. The data, when downloaded from ASF DAAC, were in a zipped file format. To maintain the type consistency with the upcoming NISAR mission, the downloaded data were first repackaged in NISAR data-like HDF5 containers, followed by standard SAR pre-processing steps. For each acquisition, an appropriate orbit file was downloaded from ASF DAAC, followed by unzipping the S1 data. The VV and VH data files (in tiff format) were extracted for the three sub-swaths. Calibration was carried out for noise removal and radiometric and geometric correction. Terrain correction was performed using NASADEM at 1 arcsec spatial resolution. The gamma-naught backscatter was estimated for the VV and VH polarizations and speckle filtering was carried out. Coregistration was carried out to ensure compatibility at the sub-pixel level and that each scene covered the same area on the ground. Temporal data stacks were generated for the years 2017 to 2022 for the VV and VH polarization channels at two different spatial resolutions, i.e., 25 m and 100 m. The open source PLAnT (Polarimetric-interferometric Lab and Analysis Tools) tool by JPL was used for data handling and processing, including subsetting to the area of interest, resampling, and average backscatter extraction. ISCE-PLAnT ensured a sub-pixel match between the 25 m and 100 m datasets.
3.2. Cumulative Sums of Change
The CuSUM algorithm was applied to the time-series data stacks to find the point of change in the temporal domain. This algorithm runs on the whole data stack and analyses the temporal signature for each pixel. In the case of any drastic change in the backscatter that is larger than the defined threshold, the corresponding date of acquisition is marked as the point of change. The methodology followed for this study is shown in Figure 2.
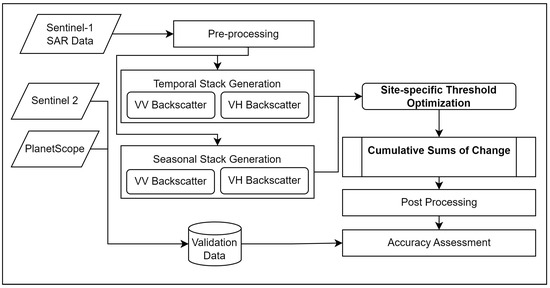
Figure 2.
Proposed workflow for change detection and validation.
CuSUM is a well-defined algorithm and was used in multiple applications for and apart from remote sensing [7,40,48,74,75]. Here, for the time-series data, the mean () was calculated for the pixel in a time series with i images, which subsequently gave the residuals (), i.e., the difference between each value and that of the mean. For these residuals, the cumulative sums () were computed and the difference between the minimum and maximum values of the cumulative sums of the residuals () was calculated, as shown in Equations (1) and (2):
Using the first percentile of this difference as the threshold , the residuals were masked and the cumulative sum was calculated again. Bootstrapping was carried out with different numbers of iterations to ensure the validity of change using the impact of the sequence of layers in the time-series data. With the sum of residuals () obtained from the bootstrap analysis, the confidence level () and change point significance () were calculated as shown in Equations (3) and (4):
where is the total number of bootstraps and is the number of bootstraps with greater than calculated with the original time series.
To find out the optimal number of bootstraps, tests were carried out with this number ranging from 50 to 300. Small variations in the accuracy assessment parameters were observed with the increasing number of bootstraps (a maxima of 0.09 and 0.25 in the overall accuracy at 25 m and 100 m spatial resolutions). It was observed that the values of the accuracy assessment parameters saturated above 50 bootstraps for all the sites and spatial resolution cases. Thus, the bootstraps for further processing and analysis were fixed at 50.
A change point threshold () of 0.1 was applied and a mask of change points was thus created, as shown in Equation (5). The default values used for the analysis are mentioned in Table 2. The cumulative sums were then masked with this change point mask and flattened to the maximum value. To obtain the exclusive change points in the time series, unique values were retained for generating change maps.

Table 2.
Values of the parameters for the CuSUM algorithm.
3.3. Adaptive Thresholding
The governs how the algorithm detects the change within the dataset. As shown in Equation (5), the detection of the change point depends on the results of the bootstrap analysis, , and set threshold. To make the algorithm robust, we selected the threshold according to the scene parameters based on the temporal dataset. The probability density function of the CPS was plotted to understand the different forest regions. We concluded that the 50th percentile of the , when considered as the (change point threshold), served as the optimal threshold for all the sites. Thus, to maintain a balance between the points classified as change/no-change while minimizing the false positives and false negatives, the 50th percentile of the was taken as the .
3.4. Seasonal Analysis
To overcome the problem of ambiguity in the change point due to the moisture content variations, seasonal analysis was carried out for the years 2017–2022. Precipitation data from IMERG were used to detect rainy days over the three sites. The days with more than 2.5 mm of rainfall were marked as rainy days [76]. The months with cumulative rainfall higher than 75 mm were identified as the wet season. The wet season was from June to September for Haldwani, and October to May for Mondah. Kalimantan recorded more than 75 mm of monthly rainfall throughout the year; hence, there was no seasonality for this site. For validation, we used the optical data as mentioned before. However, due to persistent cloud cover over Mondah, we did not obtain any optical data for validation during the wet season. Hence, the seasonal analysis was carried out only over the Haldwani site.
Seven dry and six wet seasons were identified between 2017 and 2022 for Haldwani. The durations of seasons are specified in Table 3. The seasonal sub-stacks of the temporal dataset were created according to the wet and dry seasons. The CuSUM algorithm was applied for each sub-stack and validation was carried out.

Table 3.
Temporal duration of seasonal sub-stacks for Haldwani.
3.5. Post-Processing
Since SAR data are sensitive to a range of target properties, such as the geometry, surface roughness, and moisture content (dielectric constant), the backscatter is affected, even if one of these properties changes. This leads to misclassification, and hence, results in an increase in false positives. To compensate for this random noise in the change maps, a median filter of 2 × 2 was applied to the change indices. Subsequently, a GDAL sieve filter (Geospatial Data Abstraction Library) was applied to eliminate the polygons with a threshold of 10 pixels using eight-connectedness.
3.6. Accuracy Assessment
The validation data were selected according to the year of study and clipped to the area of interest. Using the ground truth and the binary classified image, the confusion matrix was calculated. With the help of the elements of the confusion matrix (CM), i.e., True Positive (), True Negative (), False Positive (), and False Negative (), five accuracy assessment measures were calculated, i.e., overall accuracy (), user’s accuracy (), producer’s accuracy (), F1 score (), and Kappa coefficient (K). is the average Kappa coefficient value for complete temporal duration of the study. The structure of the confusion matrix and formulae for the calculation of the accuracy assessment parameters are given in Equations (6) to (12):
where () is the expected accuracy and is defined as Equation (7):
4. Results and Discussion
Table 4 shows the accuracies of the change detection for the three study sites obtained with different combinations of polarization channels and spatial resolution after the threshold optimization for the years 2017–2022. Table 5 shows the accuracy for the thirteen seasonal subsets with the VV and VH polarization channels and at the 25 m and 100 m spatial resolutions for the Haldwani forest site.

Table 4.
Accuracy metrics post-threshold optimization for each year and at two spatial resolutions. The gray cells highlight values more than 0.7.

Table 5.
Accuracy metrics for the seasonal analysis at two spatial resolutions over Haldwani. The gray cells highlight values more than 0.7.
The backscatter response of the S-1 showed a sudden jump in the values from 2022 onward. This was due to sensor calibration and not site conditions. Figure 3 shows that the increase in backscatter was consistent across different regions that covered urban, forested, and deforested areas.
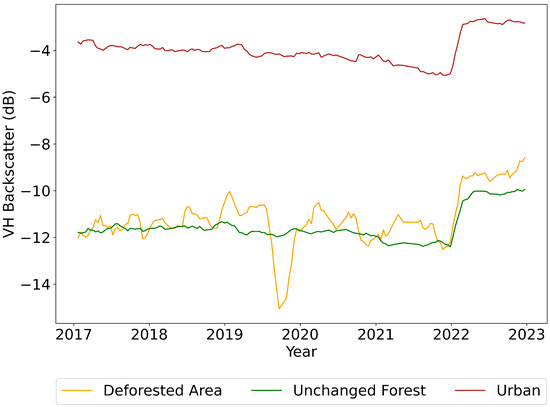
Figure 3.
Backscatter time-series plots for Kalimantan for urban (red), deforested (orange), and unchanged forest (green) areas at the 25 m spatial resolution.
In the subsequent subsections, we discuss the impacts of polarization, spatial resolution, soil moisture, seasonal analysis, eco-region, and management practice on the accuracy of the change detection.
4.1. Polarization Channel: Co-Pol vs. Cross-Pol
The results show that the VV and VH polarization channels show great agreement in terms of the accuracy assessment measures. These values lie in the same range with minor deviations in a few cases. However, VH gave more consistent results in terms of the salt and pepper noise and the homogeneity of the mapped change area. The cross-pol channel was associated with volumetric scattering, i.e., scattering from within the medium. Since we were working with C-band SAR, most of the interactions were with the vegetation canopy due to a lower penetration capability of the incident wavelength. This caused higher sensitivity to the changes in the vegetation canopy. As a result, the cross-pol channel performed better in the case of shorter wavelengths.
Figure 4 shows a significant backscatter drop in both the polarization channels for Kalimantan (B) and Haldwani (D). In the case of Kalimantan, the VV and VH backscatter decreased by 2 dB and 4 dB, respectively, on account of logging. The higher backscatter drop in the cross-pol channel could be associated with the dominance of the impact of the dense forest canopy. However, the drop in backscatter on account of logging in the case of Haldwani was comparable for both polarization channels.
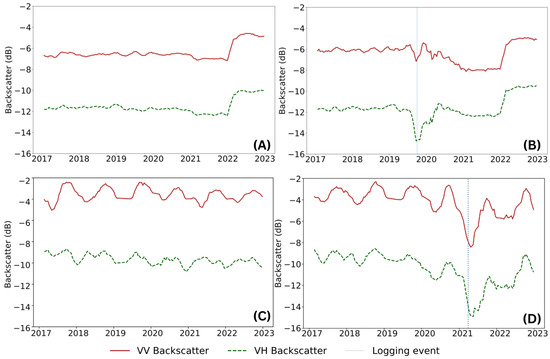
Figure 4.
Backscatter time-series plots at the 25 m spatial resolution: (A) Kalimantan—unchanged area, (B) Kalimantan—deforested area, (C) Haldwani—unchanged area, and (D) Haldwani—deforested. The red and green curves show the VV and VH backscatter, respectively. The blue vertical dotted line represents the date of felling.
The backscatter response for the unchanged area in Kalimantan (A) was stable throughout the temporal window of this study. However, seasonal variations were observed in the case of Haldwani (C). Similar observations were made from the accuracy assessment measures, where the cross-pol channel had a better performance in terms of the Kappa coefficient values for Kalimantan ( = 0.47 and = 0.44), Haldwani ( = 0.14 and = 0.13), and Mondah (25 m) ( = 0.85 and = 0.57).
Figure 5 shows two cases of deforested patches with areas of 375 ha and 830 ha in the years 2018 and 2022, respectively. It can be observed that the detected area with VH polarization was more homogenous in comparison with the VV polarization channel, and the shape of the patch was preserved. The noise in the mapped area was reduced to a large extent in the outputs at the 100 m spatial resolution. However in some cases, it also led to an increase in the number of false positives.
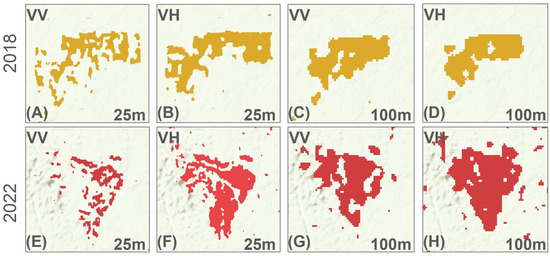
Figure 5.
Case: Logging of 375 ha and 830 ha forest regions in Kalimantan in the years 2018 and 2022. Images show the detected deforested area with the VV and VH polarizations at the 25 m and 100 m spatial resolutions for 2018 (A–D) and 2022 (E–H).
4.2. Spatial Resolution: 25 m vs. 100 m
Figure 6 shows a deforested region that covered an area of 63 ha in Haldwani, as detected with the VH polarization channel at the 25 m and 100 m spatial resolutions. The logged area can be observed in the optical and SAR data visualization. However, from the area mapped with the VH polarization channel, it was observed that there was an overestimation in terms of the spatial extent of the logged region at the 100 m spatial resolution. This led to poor delineation of the forest compartment.
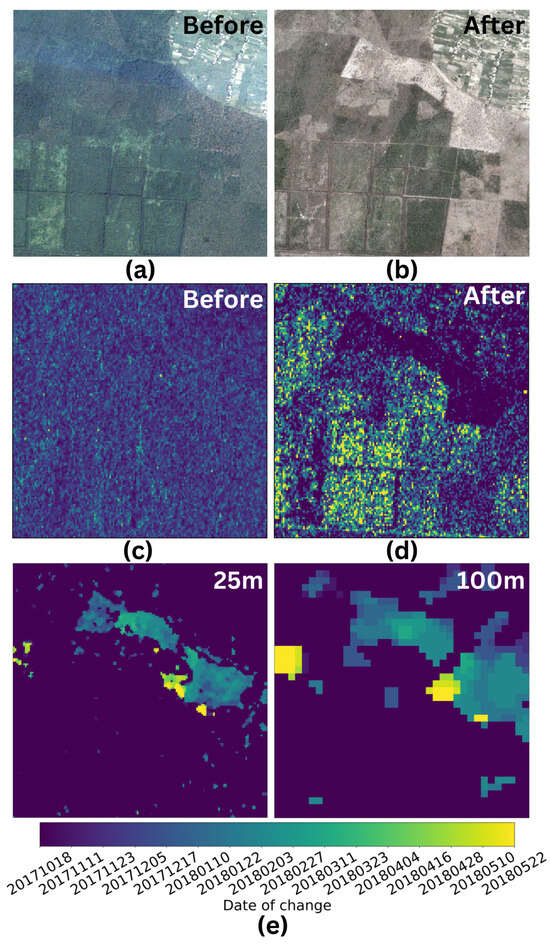
Figure 6.
Case: Logging of a 63 ha forest region in Haldwani. (a,b) show the PlanetScope true color images before and after the logging, respectively. (c,d) show the SAR VH backscatter of the same area, pre- and post-felling, respectively. (e) shows the change maps generated with VH backscatter at the 25 m and 100 m spatial resolutions. Colors show the date (YYYYMMDD) of change, as marked by the algorithm.
At the 100 m spatial resolution, a 19% drop was observed in the Kappa values for the VH polarization channel for Haldwani. The change areas in Haldwani were overestimated at the 100 m spatial resolution. Since the actual deforested regions were smaller, there was a significant mismatch in the change maps generated by the algorithm. This was due to the coarser spatial resolution, which led to a poor delineation and merged change areas. This, in turn, caused an increase in the false positives, and hence, deteriorated the user’s accuracy and Kappa coefficient.
For Kalimantan, the analysis at the 100 m spatial resolution led to a 25.1% increase in the Kappa value for the VH polarization. The highest Kappa coefficient value increased from 0.64 for the VH polarization and 0.55 for the VV polarization at the 25 m spatial resolution to 0.90 for the VH polarization and 0.78 for the VV polarization at the 100 m spatial resolution. This was because of the larger size of the change areas in Kalimantan and reduced noise in the form of false positives and false negatives. This led to homogeneous change area mapping, which, in turn, improved the accuracy.
For Mondah, the Kappa value dropped from 0.85 at the 25 m spatial resolution to a negative value (−0.17) and empty confusion matrices. Unlike Haldwani and Kalimantan, the logging events were not planned in Mondah’s case. Hence, the cleared areas were minimal. Some of these validation plots, being significantly smaller than the cell size, did not translate into the change maps at the 100 m spatial resolution. This led to an empty confusion matrix, and hence, no accuracy values in the five test cases, as shown in Table 4.
It can be observed that while the 100 m spatial resolution worked better for Kalimantan, the accuracy dropped in the cases of Haldwani and Mondah. This was due to the difference in the management practices in these forests. The variations in the logged areas in these forests led to different accuracies in the change mapping.
While working toward global forest change mapping, it is essential to consider the data volume and computational requirements. Hence, there is always a trade-off between the spatial resolution and the highest achievable precision.
4.3. Impact of Soil Moisture
The backscatter response of a forest is related to the phenology and condition of the constituent species and the soil moisture in the respective area. The SWI from ASCAT was retrieved for the deforested and unchanged areas in Kalimantan and Haldwani. The polygons for the changed and unchanged areas, which ranged between 6.2 ha and 35 ha, were used to extract the average SWI and VH backscatter using zonal statistics. These mean values were then plotted for each date of acquisition in the years 2017 to 2022. The backscatter vs. SWI plots for Kalimantan and Haldwani with the backscatter extracted from the 25 m and 100 m spatial resolution data are shown in Figure 7.
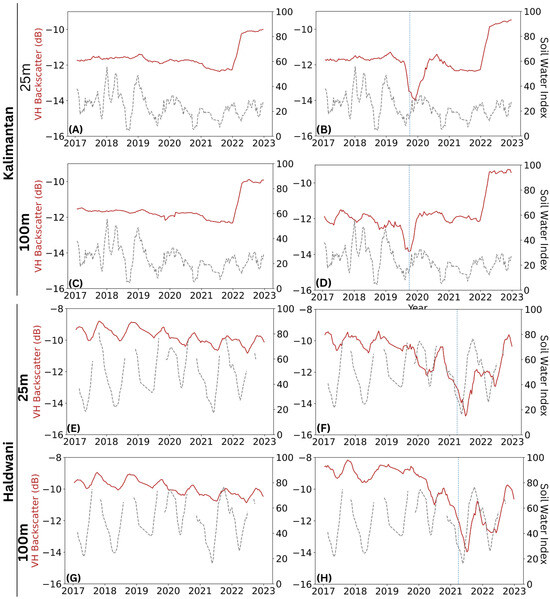
Figure 7.
Kalimantan—VH backscatter and SWI plot: (A) deforested area at the 25 m spatial resolution, (B) unchanged area at the 25 m spatial resolution, (C) deforested area at the 100 m spatial resolution, and (D) unchanged area at the 100 m spatial resolution. The grey region shows the duration of the understory flooding. Haldwani—VH backscatter and SWI plot: (E) deforested area at the 25 m spatial resolution, (F) unchanged area at the 25 m spatial resolution, (G) deforested area at the 100 m spatial resolution, and (H) unchanged area at the 100 m spatial resolution. The blue dotted line shows the date of felling.
The smooth curve in Figure 7A shows that the area remained unchanged throughout the years 2017–2022. From Figure 7B, the point of change in 2019 is visible as a significant dip of 2 dB in the VH backscatter. The very fine differences between the plots at 25 m and 100 m show that the area was homogeneous and the effect of the spatial resolution was not significant on the average backscatter of the area. Plots (A)–(D) show very high backscatter that might have been a result of the change in the calibration constants provided in the S-1 dataset.
In the case of Haldwani (plots (E) to (H)), larger variations were observed in the backscatter that were in agreement with the annual soil moisture cycle. This shows a higher impact of soil moisture on the backscatter in this area. On the other hand, these variations were significantly weaker than the drop in the backscatter due to felling. Thus, the algorithm was still able to detect the change in the year 2021 (H).
However, sudden changes in soil moisture, such as untimely rainfall, were the major reason for the lesser accuracy of the change mapping in Haldwani in comparison with Kalimantan and Mondah since they mimicked the drop in backscatter on account of logging. To reduce this effect, seasonal analysis was carried out, as described in Section 4.4.
4.4. Seasonal Analysis
With the seasonal analysis, the change areas were classified correctly with a significant improvement in accuracy. In Haldwani, logging is usually carried out from October to March since it is a managed forest. Hence, there are very few change areas with a small spatial stretch in the wet season. No sieve filtering was carried out for this analysis to retain the shape of the mapped areas since the change areas were smaller.
The results show consistently high accuracy assessment measures across all the test cases, which led to an accurate change map with good delineation of logged areas, homogeneous change areas, and lesser noise. The cross-pol channel has provided better results with an average Kappa coefficient of 0.85 (25 m) and 0.44 (100 m). The difference between accuracy at the 25 m and 100 m spatial resolutions shows confirms its dependence on the management practice and size of the logged area.
4.5. Impact of Eco-Region and Management Practice
It can be inferred from the results that a better accuracy was achieved in the case of the Kalimantan forests if we compared it to that obtained for the Haldwani forests. A good value of K was observed across all the years for both polarization channels, with a better performance at the 100 m spatial resolution.
In the case of Mondah, the change area was relatively small and random, as opposed to the planned deforestation in Haldwani and Kalimantan. As the deforestation that took place in the Mondah forests was lower in terms of the spatial stretch, a better accuracy was observed in the case of the 25 m spatial resolution with good Kappa coefficient values, which ranged between 0.40 and 0.88 across the different cases.
Small Kappa coefficient values were observed in the case of Haldwani, i.e., in the range of 0 to 0.2 for the yearly change maps. However, it was improved by a considerable extent for Kalimantan. The Kappa coefficient is calculated with the help of the observed and expected accuracy. Since it utilizes all the elements of the confusion matrix, it is also heavily dependent on false positives. Since, in Haldwani, the forest compartments were small and were heavily influenced by the soil moisture, the amount of noise was relatively greater. This caused poor Kappa coefficient values across all cases of polarization channel and spatial resolution in Haldwani. However, it was overcome by the seasonal analysis, wherein the change areas were mapped efficiently due to a reduction in noise that arose from the large variations in the backscatter because of the soil moisture.
4.6. Application to Other Tropical Sites
Since the tropical forests were diverse, the final algorithm was applied on two additional sites in Brazil and Congo for one year each. The site in Brazil fell into the category of the Xingu–Tocantins–Araguaia moist forests ecoregion, whereas the chosen site in Congo lay in the Northeast Congolian lowland forests ecoregion.
The results thus obtained were compared with Hansen’s change maps. Figure 8 and Figure 9 show the deforested areas in Brazil and Congo, respectively.
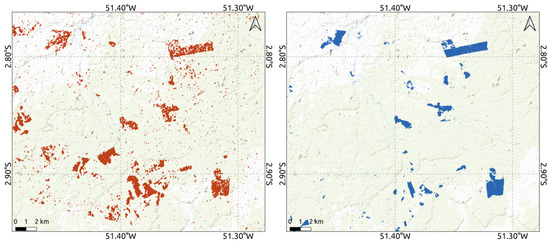
Figure 8.
Change maps showing the deforested areas in Brazil in the year 2020. The change map on the left was generated using the CuSUM algorithm with adaptive thresholding. The change map on the right was Hansen’s change map for 2020.
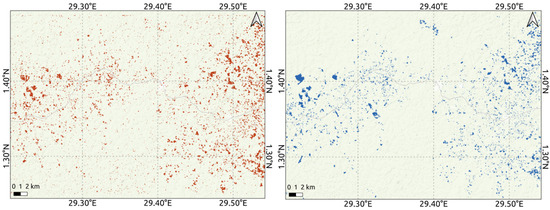
Figure 9.
Change maps showing the deforested areas in Congo in the year 2018. The change map on the left was generated using the CuSUM algorithm with adaptive thresholding. The change map on the right was Hansen’s change map for 2018.
From visual interpretation, it can be observed that there was an appreciable overlap between the deforested areas detected by the algorithm and those marked in Hansen’s change map. The overall accuracy achieved for Brazil was 0.951, with confusion matrix , while that for Congo was 0.943, with confusion matrix . It can be noted that there were areas that were detected by the algorithm that were not present in Hansen’s change map. This could have been due to its dependence on the optical datasets. If there was persistent cloud cover over the study area when logging took place, optical data-based methods could not detect these changes due to the gaps in the temporal dataset.
4.7. Final Result: Change Maps
The yearly change map obtained for the Kalimantan forests with VH polarization channels at the 25 m spatial resolution is shown in Figure 10. Figure 11 shows the change maps for the dry seasons for Haldwani with the VH polarization channels at the 25 m spatial resolution. Here, different colors show the different years of change. Figure 12 shows the change map obtained for Mondah forests with VH polarization at 25m spatial resolution.
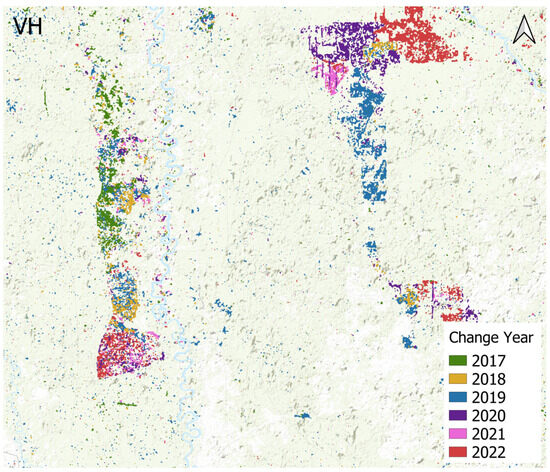
Figure 10.
Change map for Kalimantan forests for years 2017–2022 with S-1 VH polarization. The base map used was the Environmental Systems Research Institute (ESRI) topographic map.
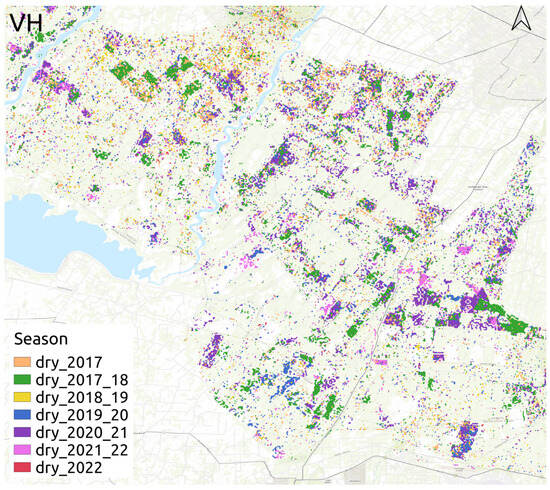
Figure 11.
Change map for dry seasons for the Haldwani forests for the years 2017–2022 with S-1 VH polarization. The base map used was the ESRI topographic map.
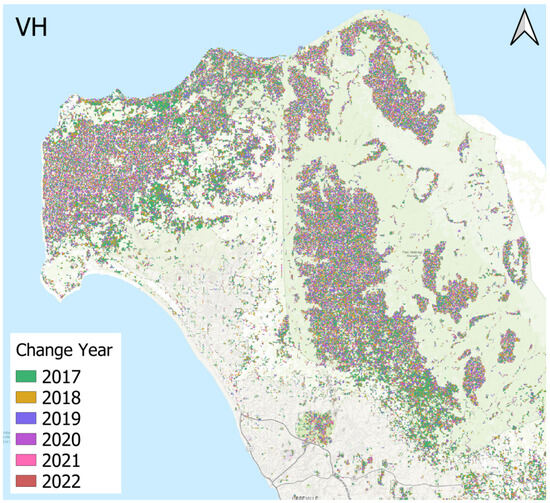
Figure 12.
Change maps for the Mondah forests for the years 2017–2022 with S-1 VH polarization. The base map used was the ESRI topographic map.
5. Conclusions
The present study showed the potential of time-series co-pol and cross-pol data for forest change detection using the CuSUM algorithm. The advantage of SAR data for change detection is evident from the consistent time-series dataset that can be formed for any study site for continuous monitoring, especially in the equatorial region. The three sites chosen for this study experience frequent logging activities that cannot be monitored using optical data since these areas are covered by clouds most of the year.
The key conclusions from this work were as follows:
- Threshold optimization: this was site specific, with Kalimantan showing an overall increase of 5.54% in the Kappa coefficient; however, it had no discernible effect on the accuracy for Haldwani and Mondah.
- Polarization: the cross-pol C-band SAR backscatter was more effective for logging detection in all three forest sites due to the dominance of volumetric scattering.
- Resolution: the results for Kalimantan were better at a coarser resolution of 100 m, in contrast with Haldwani and Mondah, where a better accuracy was observed at the 25 m spatial resolution.
- Forest management: the large difference in accuracy between the 25 m and 100 m spatial resolutions was due to the varied forest management practices at the three sites, which directly affected the logged area.
- Ecoregion: This study showed that the algorithm worked well for all three test sites, which covered different eco-regions. This confirmed the robustness of the method and also the scope of scalability.
- Frequency: Changes in the soil and vegetation moisture affect SAR backscatter, and is directly proportional to the frequency of SAR. As seen in this work, these changes affected the accuracy of deforestation detection algorithms. Thus, the impact would be much less with L-band time-series data.
- Seasonal analysis: The results for the Haldwani post-seasonal analysis show a high accuracy with an average Kappa coefficient of 0.85 for the VH polarization at the 25 m spatial resolution in the dry season. It is advisable to eliminate the wet season for change detection to reduce false positives. However, with this approach, errors may remain for the changes that occur throughout the rainy season.
Although there was a significant improvement in the performance when the seasonal analysis was carried out for Haldwani compared with the analysis for calendar years, some ambiguity in identifying the exact point of change within the dataset remained. This was due to the large variations in the backscatter due to the fluctuating soil moisture levels and could only be compensated for by suppressing the impact of soil moisture.
L-band data from the upcoming NISAR mission will help reduce the impact of soil and vegetation moisture variability, and provide more accurate change maps with a more elaborate temporal dataset at a greater observation frequency. The L-band is better at detecting forest changes due to the lower susceptibility to soil moisture. To facilitate the efficient monitoring of forest disturbance, including below-canopy inundation from natural and catastrophic flooding events for global forest ecosystems, NISAR will provide observations every 12 days (or 6 days ascending/descending).
Also, NISAR will be providing S-band data in addition to L-band data. The interactions of forests with S-band signals are similar to those with the C-band. Thus, we believe that the results obtained and conclusions drawn from this study will be helpful to the users working with S-band NISAR data in the future.
Author Contributions
Conceptualization, A.S. and U.K.; methodology, A.S. and U.K.; software, U.K. and M.L.; validation, A.S.; formal analysis, A.S.; investigation, A.S.and U.K.; resources, U.K. and M.L.; data curation, A.S.; writing—original draft preparation, A.S.; writing—review and editing, U.K., M.L. and H.S.S.; visualization, A.S. and U.K.; supervision, U.K.; project administration, U.K.; funding acquisition, U.K. and H.S.S. All authors read and agreed to the published version of this manuscript.
Funding
This work was supported under the ISRO RESPOND 2022 project number ISRO/RES/4/705/22-23. The authors thank the NISAR Project and Algorithm Definition Team (ADT) for providing the InSAR Scientific Computing Environment (ISCE3) software used for co-registering and radiometric terrain correcting the S-1 SLC data.
Data Availability Statement
The study is carried out using open source satellite data with sources mentioned in Section 2.2. Validation data presented in this study are available on request from the corresponding author.
Conflicts of Interest
The authors declare no conflicts of interest.
References
- Molua, E. Discourse on Climate-Smart Agriculture for REDD+ Strategy in the Congo Basin. J. Sustain. Dev. 2012, 5, 77–88. [Google Scholar] [CrossRef]
- Busch, J.; Ferretti-Gallon, K.; Engelmann, J.; Wright, M.; Austin, K.G.; Stolle, F.; Turubanova, S.; Potapov, P.V.; Margono, B.; Hansen, M.C.; et al. Reductions in emissions from deforestation from Indonesia’s moratorium on new oil palm, timber, and logging concessions. Proc. Natl. Acad. Sci. USA 2015, 112, 1328–1333. [Google Scholar] [CrossRef] [PubMed]
- Carlson, K.M.; Curran, L.M.; Asner, G.P.; Pittman, A.M.D.; Trigg, S.N.; Marion Adeney, J. Carbon emissions from forest conversion by Kalimantan oil palm plantations. Nat. Clim. Chang. 2013, 3, 283–287. [Google Scholar] [CrossRef]
- Malhi, Y.; Roberts, J.T.; Betts, R.A.; Killeen, T.J.; Li, W.; Nobre, C.A. Climate Change, Deforestation, and the Fate of the Amazon. Science 2008, 319, 169–172. [Google Scholar] [CrossRef]
- Hethcoat, M.G.; Carreiras, J.M.; Edwards, D.P.; Bryant, R.G.; Quegan, S. Detecting tropical selective logging with C-band SAR data may require a time series approach. Remote Sens. Environ. 2021, 259, 112411. [Google Scholar] [CrossRef]
- Wagner, F.H.; Dalagnol, R.; Silva-Junior, C.H.L.; Carter, G.; Ritz, A.L.; Hirye, M.C.M.; Ometto, J.P.H.B.; Saatchi, S. Mapping Tropical Forest Cover and Deforestation with Planet NICFI Satellite Images and Deep Learning in Mato Grosso State (Brazil) from 2015 to 2021. Remote Sens. 2023, 15, 521. [Google Scholar] [CrossRef]
- Ygorra, B.; Frappart, F.; Wigneron, J.; Moisy, C.; Catry, T.; Baup, F.; Hamunyela, E.; Riazanoff, S. Monitoring loss of tropical forest cover from Sentinel-1 time-series: A CuSum-based approach. Int. J. Appl. Earth Obs. Geoinf. 2021, 103, 102532. [Google Scholar] [CrossRef]
- Motohka, T.; Shimada, M.; Uryu, Y.; Setiabudi, B. Using time series PALSAR gamma nought mosaics for automatic detection of tropical deforestation: A test study in Riau, Indonesia. Remote Sens. Environ. 2014, 155, 79–88. [Google Scholar] [CrossRef]
- Vásquez-Grandón, A.; Donoso, P.J.; Gerding, V. Forest Degradation: When Is a Forest Degraded? Forests 2018, 9, 726. [Google Scholar] [CrossRef]
- Jiménez-Rodríguez, D.L.; Gao, Y.; Solórzano, J.V.; Skutsch, M.; Pérez-Salicrup, D.R.; Salinas-Melgoza, M.A.; Farfán, M. Mapping Forest Degradation and Contributing Factors in a Tropical Dry Forest. Front. Environ. Sci. 2022, 10, 912873. [Google Scholar] [CrossRef]
- Hermosilla, T.; Wulder, M.A.; White, J.C.; Coops, N.C.; Hobart, G.W. Regional detection, characterization, and attribution of annual forest change from 1984 to 2012 using Landsat-derived time-series metrics. Remote Sens. Environ. 2015, 170, 121–132. [Google Scholar] [CrossRef]
- Ortega, M.X.; Feitosa, R.Q.; Bermudez, J.D.; Happ, P.N.; De Almeida, C.A. Comparison of Optical and SAR Data for Deforestation Mapping in the Amazon Rainforest with Fully Convolutional Networks. In Proceedings of the 2021 IEEE International Geoscience and Remote Sensing Symposium IGARSS, Brussels, Belgium, 11–16 July 2021; pp. 3769–3772. [Google Scholar] [CrossRef]
- Hansen, M.C.; Potapov, P.V.; Moore, R.; Hancher, M.; Turubanova, S.A.; Tyukavina, A.; Thau, D.; Stehman, S.V.; Goetz, S.J.; Loveland, T.R.; et al. High-Resolution Global Maps of 21st-Century Forest Cover Change. Science 2013, 342, 850–853. [Google Scholar] [CrossRef] [PubMed]
- Du, Z.; Yu, L.; Yang, J.; Coomes, D.; Kanniah, K.; Fu, H.; Gong, P. Mapping Annual Global Forest Gain From 1983 to 2021 with Landsat Imagery. IEEE J. Sel. Top. Appl. Earth Obs. Remote Sens. 2023, 16, 4195–4204. [Google Scholar] [CrossRef]
- Ritchie, H. Deforestation and Forest Loss. Our World in Data 2021. Available online: https://ourworldindata.org/deforestation (accessed on 12 July 2024).
- Mermoz, S.; Réjou-Méchain, M.; Villard, L.; Le Toan, T.; Rossi, V.; Gourlet-Fleury, S. Decrease of L-band SAR backscatter with biomass of dense forests. Remote Sens. Environ. 2015, 159, 307–317. [Google Scholar] [CrossRef]
- Musthafa, M.; Singh, G. Improving Forest Above-Ground Biomass Retrieval Using Multi-Sensor L- and C- Band SAR Data and Multi-Temporal Spaceborne LiDAR Data. Front. For. Glob. Chang. 2022, 5, 822704. [Google Scholar] [CrossRef]
- Khati, U.; Lavalle, M.; Shiroma, G.H.X.; Meyer, V.; Chapman, B. Assessment of Forest Biomass Estimation from Dry and Wet SAR Acquisitions Collected during the 2019 UAVSAR AM-PM Campaign in Southeastern United States. Remote Sens. 2020, 12, 3397. [Google Scholar] [CrossRef]
- Li, Y.; Li, M.; Li, C.; Liu, Z. Forest aboveground biomass estimation using Landsat 8 and Sentinel-1A data with machine learning algorithms. Sci. Rep. 2020, 10, 9952. [Google Scholar] [CrossRef]
- Chen, W.; Zheng, Q.; Xiang, H.; Chen, X.; Sakai, T. Forest Canopy Height Estimation Using Polarimetric Interferometric Synthetic Aperture Radar (PolInSAR) Technology Based on Full-Polarized ALOS/PALSAR Data. Remote Sens. 2021, 13, 174. [Google Scholar] [CrossRef]
- Pourshamsi, M.; Xia, J.; Yokoya, N.; Garcia, M.; Lavalle, M.; Pottier, E.; Balzter, H. Tropical forest canopy height estimation from combined polarimetric SAR and LiDAR using machine-learning. ISPRS J. Photogramm. Remote Sens. 2021, 172, 79–94. [Google Scholar] [CrossRef]
- Cazcarra-Bes, V.; Tello-Alonso, M.; Fischer, R.; Heym, M.; Papathanassiou, K. Monitoring of Forest Structure Dynamics by Means of L-Band SAR Tomography. Remote Sens. 2017, 9, 1229. [Google Scholar] [CrossRef]
- Nguyen, L.V.; Tateishi, R.; Nguyen, H.T.; Sharma, R.C.; To, T.T.; Le, S.M. Estimation of Tropical Forest Structural Characteristics Using ALOS-2 SAR Data. Adv. Remote Sens. 2016, 5, 131–144. [Google Scholar] [CrossRef]
- Ban, Y.; Zhang, P.; Nascetti, A.; Bevington, A.R.; Wulder, M.A. Near Real-Time Wildfire Progression Monitoring with Sentinel-1 SAR Time Series and Deep Learning. Sci. Rep. 2020, 10, 1322. [Google Scholar] [CrossRef] [PubMed]
- Hosseini, M.; Lim, S. Burned area detection using Sentinel-1 SAR data: A case study of Kangaroo Island, South Australia. Appl. Geogr. 2023, 151, 102854. [Google Scholar] [CrossRef]
- Jiang, J.; Xing, Y.; Wei, W.; Yan, E.; Xiang, J.; Mo, D. DSNUNet: An Improved Forest Change Detection Network by Combining Sentinel-1 and Sentinel-2 Images. Remote Sens. 2022, 14, 5046. [Google Scholar] [CrossRef]
- Tomppo, E.; Ronoud, G.; Antropov, O.; Hytönen, H.; Praks, J. Detection of Forest Windstorm Damages with Multitemporal SAR Data—A Case Study: Finland. Remote Sens. 2021, 13, 383. [Google Scholar] [CrossRef]
- Hirschmugl, M.; Deutscher, J.; Sobe, C.; Bouvet, A.; Mermoz, S.; Schardt, M. Use of SAR and Optical Time Series for Tropical Forest Disturbance Mapping. Remote Sens. 2020, 12, 727. [Google Scholar] [CrossRef]
- Akbari, V.; Anfinsen, S.N.; Doulgeris, A.P.; Eltoft, T. A change detector for polarimetric SAR data based on the relaxed Wishart distribution. In Proceedings of the 2015 IEEE International Geoscience and Remote Sensing Symposium (IGARSS), Milan, Italy, 26–31 July 2015; pp. 3806–3809. [Google Scholar] [CrossRef]
- Bazi, Y.; Bruzzone, L.; Melgani, F. An unsupervised approach based on the generalized Gaussian model to automatic change detection in multitemporal SAR images. IEEE Trans. Geosci. Remote Sens. 2005, 43, 874–887. [Google Scholar] [CrossRef]
- Quin, G.; Pinel-Puyssegur, B.; Nicolas, J.M.; Loreaux, P. MIMOSA: An Automatic Change Detection Method for SAR Time Series. IEEE Trans. Geosci. Remote Sens. 2014, 52, 5349–5363. [Google Scholar] [CrossRef]
- Saatchi, S.S.; Harris, N.L.; Brown, S.; Lefsky, M.; Mitchard, E.T.A.; Salas, W.; Zutta, B.R.; Buermann, W.; Lewis, S.L.; Hagen, S.; et al. Benchmark map of forest carbon stocks in tropical regions across three continents. Proc. Natl. Acad. Sci. USA 2011, 108, 9899–9904. [Google Scholar] [CrossRef]
- Hoekman, D.; Kooij, B.; Quiñones, M.; Vellekoop, S.; Carolita, I.; Budhiman, S.; Arief, R.; Roswintiarti, O. Wide-Area Near-Real-Time Monitoring of Tropical Forest Degradation and Deforestation Using Sentinel-1. Remote Sens. 2020, 12, 3263. [Google Scholar] [CrossRef]
- Bovolo, F.; Bruzzone, L. A detail-preserving scale-driven approach to change detection in multitemporal SAR images. IEEE Trans. Geosci. Remote Sens. 2005, 43, 2963–2972. [Google Scholar] [CrossRef]
- Pardini, M.; Cantini, A.; Kugler, F.; Papathanassiou, K.; Lombardini, F. Monitoring dynamics in time of forest vertical structure with multibaseline PolInSAR data. In Proceedings of the 2014 IEEE Geoscience and Remote Sensing Symposium, Quebec City, QC, Canada, 13–18 July 2014; pp. 3366–3369, ISSN: 2153-7003. [Google Scholar] [CrossRef]
- Conradsen, K.; Nielsen, A.; Schou, J.; Skriver, H. A test statistic in the complex Wishart distribution and its application to change detection in polarimetric SAR data. IEEE Trans. Geosci. Remote Sens. 2003, 41, 4–19. [Google Scholar] [CrossRef]
- Noordermeer, L.; Økseter, R.; Ørka, H.O.; Gobakken, T.; Næsset, E.; Bollandsås, O.M. Classifications of Forest Change by Using Bitemporal Airborne Laser Scanner Data. Remote Sens. 2019, 11, 2145. [Google Scholar] [CrossRef]
- Yin, H.; Ma, C.; Weng, L.; Xia, M.; Lin, H. Bitemporal Remote Sensing Image Change Detection Network Based on Siamese-Attention Feedback Architecture. Remote Sens. 2023, 15, 4186. [Google Scholar] [CrossRef]
- Marsocci, V.; Coletta, V.; Ravanelli, R.; Scardapane, S.; Crespi, M. Inferring 3D change detection from bitemporal optical images. ISPRS J. Photogramm. Remote Sens. 2023, 196, 325–339. [Google Scholar] [CrossRef]
- Manogaran, G.; Lopez, D. Spatial cumulative sum algorithm with big data analytics for climate change detection. Comput. Electr. Eng. 2018, 65, 207–221. [Google Scholar] [CrossRef]
- Meli Fokeng, R.; Gadinga Forje, W.; Meli Meli, V.; Nyuyki Bodzemo, B. Multi-temporal forest cover change detection in the Metchie-Ngoum Protection Forest Reserve, West Region of Cameroon. Egypt. J. Remote Sens. Space Sci. 2020, 23, 113–124. [Google Scholar] [CrossRef]
- Rosa, R.A.S.; Fernandes, D.; Barreto, T.L.M.; Wimmer, C.; Nogueira, J.B. Change detection under the forest in multitemporal full-polarimetric P-band SAR images using Pauli decomposition. In Proceedings of the 2016 IEEE International Geoscience and Remote Sensing Symposium (IGARSS), Beijing, China, 10–15 July 2016; pp. 6213–6216, ISSN: 2153-7003. [Google Scholar] [CrossRef]
- Wu, L.; Li, Z.; Liu, X.; Zhu, L.; Tang, Y.; Zhang, B.; Xu, B.; Liu, M.; Meng, Y.; Liu, B. Multi-Type Forest Change Detection Using BFAST and Monthly Landsat Time Series for Monitoring Spatiotemporal Dynamics of Forests in Subtropical Wetland. Remote Sens. 2020, 12, 341. [Google Scholar] [CrossRef]
- Conradsen, K.; Nielsen, A.A.; Skriver, H. Determining the Points of Change in Time Series of Polarimetric SAR Data. IEEE Trans. Geosci. Remote Sens. 2016, 54, 3007–3024. [Google Scholar] [CrossRef]
- Inglada, J.; Mercier, G. A New Statistical Similarity Measure for Change Detection in Multitemporal SAR Images and Its Extension to Multiscale Change Analysis. IEEE Trans. Geosci. Remote Sens. 2007, 45, 1432–1445. [Google Scholar] [CrossRef]
- Nielsen, A.A.; Conradsen, K.; Skriver, H.; Canty, M.J. Visualization of and Software for Omnibus Test-Based Change Detected in a Time Series of Polarimetric SAR Data. Can. J. Remote Sens. 2017, 43, 582–592. [Google Scholar] [CrossRef]
- Nielsen, A.A.; Connetable, P.J.; Conradsen, K.; Skriver, H.; Krogager, E. Change Detection in Single- and Multi-Look Polarimetric SAR Data. In Proceedings of the 2020 IEEE Radar Conference (RadarConf20), Florence, Italy, 21–25 September 2020; pp. 1–6, ISSN 2375-5318. [Google Scholar] [CrossRef]
- Ruiz-Ramos, J.; Marino, A.; Boardman, C.; Suarez, J. Continuous Forest Monitoring Using Cumulative Sums of Sentinel-1 Timeseries. Remote Sens. 2020, 12, 3061. [Google Scholar] [CrossRef]
- Trisasongko, B.H. The Use of Polarimetric SAR Data for Forest Disturbance Monitoring. Sens. Imaging Int. J. 2010, 11, 1–13. [Google Scholar] [CrossRef]
- Sugimoto, R.; Kato, S.; Nakamura, R.; Tsutsumi, C.; Yamaguchi, Y. Deforestation detection using scattering power decomposition and optimal averaging of volume scattering power in tropical rainforest regions. Remote Sens. Environ. 2022, 275, 113018. [Google Scholar] [CrossRef]
- Gong, M.; Yang, H.; Zhang, P. Feature learning and change feature classification based on deep learning for ternary change detection in SAR images. ISPRS J. Photogramm. Remote Sens. 2017, 129, 212–225. [Google Scholar] [CrossRef]
- Li, L.; Ma, H.; Jia, Z. Change Detection from SAR Images Based on Convolutional Neural Networks Guided by Saliency Enhancement. Remote Sens. 2021, 13, 3697. [Google Scholar] [CrossRef]
- Wang, J.; Gao, F.; Dong, J.; Zhang, S.; Du, Q. Change Detection from Synthetic Aperture Radar Images via Graph-Based Knowledge Supplement Network. arXiv 2022, arXiv:2201.08954. [Google Scholar]
- Ruiz-Ramos, J. Continuous Monitoring of Environmental Disturbances by Cumulative Sums of Dense SAR Satellite Timeseries. Ph.D. Thesis, The Open University, Milton Keynes, UK, 2023. [Google Scholar] [CrossRef]
- Nielsen, A.A.; Conradsen, K.; Skriver, H. Omnibus test for change detection in a time sequence of polarimetric SAR data. In Proceedings of the 2016 IEEE International Geoscience and Remote Sensing Symposium (IGARSS), Beijing, China, 10–15 July 2016; pp. 3398–3401, ISSN 2153-7003. [Google Scholar] [CrossRef]
- Wu, J.; Li, B.; Qin, Y.; Ni, W.; Zhang, H.; Fu, R.; Sun, Y. A multiscale graph convolutional network for change detection in homogeneous and heterogeneous remote sensing images. Int. J. Appl. Earth Obs. Geoinf. 2021, 105, 102615. [Google Scholar] [CrossRef]
- Pantze, A.; Santoro, M.; Fransson, J.E. Change detection of boreal forest using bi-temporal ALOS PALSAR backscatter data. Remote Sens. Environ. 2014, 155, 120–128. [Google Scholar] [CrossRef]
- Nielsen, A.A.; Conradsen, K.; Henning, S. Change Detection in Full and Dual Polarization, Single- and Multifrequency SAR Data. IEEE J. Sel. Top. Appl. Earth Obs. Remote Sens. 2015, 8, 4041–4048. [Google Scholar] [CrossRef]
- Khati, U.; Kumar, V.; Bandyopadhyay, D.; Musthafa, M.; Singh, G. Identification of forest cutting in managed forest of Haldwani, India using ALOS-2/PALSAR-2 SAR data. J. Environ. Manag. 2018, 213, 503–512. [Google Scholar] [CrossRef]
- Masolele, R.N.; Marcos, D.; De Sy, V.; Abu, I.O.; Verbesselt, J.; Reiche, J.; Herold, M. Mapping the diversity of land uses following deforestation across Africa. Sci. Rep. 2024, 14, 1681. [Google Scholar] [CrossRef] [PubMed]
- Ferraz, A.; Saatchi, S.; Xu, L.; Hagen, S.; Chave, J.; Yu, Y.; Meyer, V.; Garcia, M.; Silva, C.; Roswintiart, O.; et al. Carbon storage potential in degraded forests of Kalimantan, Indonesia. Environ. Res. Lett. 2018, 13, 095001. [Google Scholar] [CrossRef]
- Nicolau, A.P.; Flores-Anderson, A.; Griffin, R.; Herndon, K.; Meyer, F.J. Assessing SAR C-band data to effectively distinguish modified land uses in a heavily disturbed Amazon forest. Int. J. Appl. Earth Obs. Geoinf. 2021, 94, 102214. [Google Scholar] [CrossRef]
- Ygorra, B.; Frappart, F.; Wigneron, J.P.; Catry, T.; Pillot, B.; Pfefer, A.; Courtalon, J.; Riazanoff, S. A near-real-time tropical deforestation monitoring algorithm based on the CuSum change detection method. Front. Remote Sens. 2024, 5, 1416550. [Google Scholar] [CrossRef]
- NISAR. NASA-ISRO SAR (NISAR) Mission Science Users’ Handbook; NASA Jet Propulsion Laboratory: Pasadena, CA, USA, 2018; 261p. [Google Scholar]
- Gaveau, D.L.A.; Kshatriya, M.; Sheil, D.; Sloan, S.; Molidena, E.; Wijaya, A.; Wich, S.; Ancrenaz, M.; Hansen, M.; Broich, M.; et al. Reconciling Forest Conservation and Logging in Indonesian Borneo. PLoS ONE 2013, 8, e69887. [Google Scholar] [CrossRef]
- Reiche, J.; Mullissa, A.; Slagter, B.; Gou, Y.; Tsendbazar, N.E.; Odongo-Braun, C.; Vollrath, A.; Weisse, M.J.; Stolle, F.; Pickens, A.; et al. Forest disturbance alerts for the Congo Basin using Sentinel-1. Environ. Res. Lett. 2021, 16, 024005. [Google Scholar] [CrossRef]
- Olson, D.M.; Dinerstein, E.; Wikramanayake, E.D.; Burgess, N.D.; Powell, G.V.N.; Underwood, E.C.; D’amico, J.A.; Itoua, I.; Strand, H.E.; Morrison, J.C.; et al. Terrestrial Ecoregions of the World: A New Map of Life on Earth: A new global map of terrestrial ecoregions provides an innovative tool for conserving biodiversity. BioScience 2001, 51, 933–938. [Google Scholar] [CrossRef]
- Silvianingsih, Y.A.; Hairiah, K.; Suprayogo, D.; Van Noordwijk, M. Kaleka Agroforest in Central Kalimantan (Indonesia): Soil Quality, Hydrological Protection of Adjacent Peatlands, and Sustainability. Land 2021, 10, 856. [Google Scholar] [CrossRef]
- Margono, B.A.; Potapov, P.V.; Turubanova, S.; Stolle, F.; Hansen, M.C. Primary forest cover loss in Indonesia over 2000–2012. Nat. Clim. Chang. 2014, 4, 730–735. [Google Scholar] [CrossRef]
- Khati, U.; Singh, G.; Ferro-Famil, L. Analysis of seasonal effects on forest parameter estimation of Indian deciduous forest using TerraSAR-X PolInSAR acquisitions. Remote Sens. Environ. 2017, 199, 265–276. [Google Scholar] [CrossRef]
- Khati, U.; Lavalle, M.; Singh, G. The Role of Time-Series L-Band SAR and GEDI in Mapping Sub-Tropical Above-Ground Biomass. Front. Earth Sci. 2021, 9, 752254. [Google Scholar] [CrossRef]
- Musthafa, M.; Singh, G. Forest above-ground woody biomass estimation using multi-temporal space-borne LiDAR data in a managed forest at Haldwani, India. Adv. Space Res. 2022, 69, 3245–3257. [Google Scholar] [CrossRef]
- Rosen, P.A.; Gurrola, E.M.; Agram, P.; Cohen, J.; Lavalle, M.; Riel, B.V.; Fattahi, H.; Aivazis, M.A.; Simons, M.; Buckley, S.M. The InSAR Scientific Computing Environment 3.0: A Flexible Framework for NISAR Operational and User-Led Science Processing. In Proceedings of the IGARSS 2018–2018 IEEE International Geoscience and Remote Sensing Symposium, Valencia, Spain, 22–27 July 2018; pp. 4897–4900, ISSN: 2153-7003. [Google Scholar] [CrossRef]
- Galeano, P. The use of cumulative sums for detection of changepoints in the rate parameter of a Poisson Process. Comput. Stat. Data Anal. 2007, 51, 6151–6165. [Google Scholar] [CrossRef][Green Version]
- Flynn, T.; Yoo, S. Change Detection with the Kernel Cumulative Sum Algorithm. arXiv 2019, arXiv:1903.01661. [Google Scholar] [CrossRef]
- Rajeevan, M. Northeast Monsoon of South Asia. Meteorol. Monogr. 2022, 27, 1–216. [Google Scholar]
Disclaimer/Publisher’s Note: The statements, opinions and data contained in all publications are solely those of the individual author(s) and contributor(s) and not of MDPI and/or the editor(s). MDPI and/or the editor(s) disclaim responsibility for any injury to people or property resulting from any ideas, methods, instructions or products referred to in the content. |
© 2024 by the authors. Licensee MDPI, Basel, Switzerland. This article is an open access article distributed under the terms and conditions of the Creative Commons Attribution (CC BY) license (https://creativecommons.org/licenses/by/4.0/).