Article

3D Modelling and Measuring Dam System of a Pellucid Tufa Lake Using UAV Digital Photogrammetry

by
Xianwei Zhang
1,2,
Guiyun Zhou
3,
Jinchen He
4 and
Jiayuan Lin
1,2,*
1
Chongqing Jinfo Mountain Karst Ecosystem National Observation and Research Station, School of Geographical Sciences, Southwest University, Chongqing 400715, China
2
Chongqing Engineering Research Center for Remote Sensing Big Data Application, School of Geographical Sciences, Southwest University, Chongqing 400715, China
3
School of Resources and Environment, University of Electronic Science and Technology of China, Chengdu 611731, China
4
School of Geospatial Engineering and Science, Sun Yat-sen University, Zhuhai 519082, China
*
Author to whom correspondence should be addressed.
Remote Sens. 2024, 16(20), 3839; https://doi.org/10.3390/rs16203839
Submission received: 17 August 2024 / Revised: 12 October 2024 / Accepted: 14 October 2024 / Published: 16 October 2024

Abstract

:
The acquisition of the three-dimensional (3D) morphology of the complete tufa dam system is of great significance for analyzing the formation and development of a pellucid tufa lake in a fluvial tufa valley. The dam system is usually composed of the dams partially exposed above-water and the ones totally submerged underwater. This situation makes it difficult to directly obtain the real 3D scene of the dam system solely using an existing measurement technique. In recent years, unmanned aerial vehicle (UAV) digital photogrammetry has been increasingly used to acquire high-precision 3D models of various earth surface scenes. In this study, taking Wolong Lake and its neighborhood in Jiuzhaigou Valley, China as the study site, we employed a fixed-wing UAV equipped with a consumer-level digital camera to capture the overlapping images, and produced the initial Digital Surface Model (DSM) of the dam system. The refraction correction was applied to retrieving the underwater Digital Elevation Model (DEM) of the submerged dam or dam part, and the ground interpolation was adopted to eliminate vegetation obstruction to obtain the DEM of the dam parts above-water. Based on the complete 3D model of the dam system, the elevation profiles along the centerlines of Wolong Lake were derived, and the dimension data of those tufa dams on the section lines were accurately measured. In combination of local hydrodynamics, the implication of the morphological characteristics for analyzing the formation and development of the tufa dam system was also explored.

1. Introduction

The travertine is formed by the precipitation of calcium carbonate through the combined effects of physical, chemical, and biological processes in a fluvial valley [1,2]. The fluvial travertine in ambient temperature fluvial systems is generally called tufa [3]. According to previous studies, the spatial distribution of tufa deposits was determined by various factors, such as local topography including the shape, width, and slope of the water channel, and hydrochemistry and biological processes occurring in the fluvial valley [4,5,6,7]. The irregular growth of tufa deposits drives the formation of intricate topography. When there are some tiny steps or other fixed protrusions (landslide rubble or woody debris) on the riverbed, the local hydrodynamic characteristics will be changed, thereby affecting the local tufa deposition process, continuously heightening the protrusions, and ultimately forming tufa dams [8]. Furthermore, the valley flow will be cut off by the tufa dams in some day, finally forming tufa lakes. Therefore, tufa dams were generally considered to be the crucial components and indicators of the formation and development of tufa lakes in a fluvial tufa valley [9]. The complete dam system of a tufa lake is generally constituted by the upstream dam, downstream dam, and a submerged low dam between them [10]. In the tufa dam system, some mottled transition zones formed by the complex depositional processes exist between the water and dam [3]. Typically, the upstream and downstream dams are partially exposed above-water, on which there are some vegetation growing. The tufa dam system holds both scientific and aesthetic values. On one hand, it serves as a precious geological archive for reconstructing terrestrial paleohydrology and paleoclimate [11]. On the other hand, together with the transparent water, it forms a beautiful tufa lake landscape [12]. Tufa lake is one of the major landscapes in those world-class karst scenic areas such as Jiuzhaigou National Nature Reserve, Yosemite National Park, and Plitvice Lakes National Park [1]. However, in recent years, the tufa dam system, as the critical component of a tufa lake, has faced varying degrees of degradation risk due to factors including global warming, geological hazards, and excessive tourism development [13,14,15]. Therefore, the routine measurement of the morphological dimensions of tufa dam systems and analyzing the changes are significant for conserving such natural landscape resources.
The traditional on-site measurement of a tufa dam system is mainly conducted with a total station for the above-water dam parts and a sounding rod or an immersed sonar for the underwater parts. However, on-site measurement is usually time-consuming and labor-intensive, and will inevitably cause a certain degree of disturbance and damage to the tufa dam system [16]. In addition, the limited number of measuring points will greatly restrict the accuracy and details of the constructed three-dimensional (3D) model of the dam system. Moreover, some inaccessible spots of local terrain exacerbate this situation [8,17]. In recent decades, remote sensing methods have been gradually applied for tufa dam measurement and mapping. Florsheim et al. employed QuickBird satellite imagery and SRTM digital elevation model (DEM) to acquire the channel gradients of a large-scale fluvial tufa model in Jiuzhaigou valley and constructed longitudinal profiles to study the spatial distribution of tufa dams [8]. Although satellite remote sensing technology has demonstrated unique advantages in the study of large-scale tufa systems, its spatial resolution is insufficient to accurately measure the morphology and dimensions of individual tufa dams. Profe et al. utilized one airborne bathymetric LiDAR to measure a small-scale tufa river in Germany, capturing tufa dams with total heights ranging from 0.3 m to 1.6 m to study the relationship between riverbed morphology and characteristics of tufa deposition [7]. However, this study principally focused on the measurement of the underwater tufa dams, ignoring those partially exposed above-water and covered by vegetation. For this purpose, another type of LiDAR for surveying and mapping of understory topography has to be applied. Surely, the prohibitive cost and strict technical requirements for combining these two types of LiDARs limit its wide applicability in measuring a tufa dam system [18]. Therefore, the composition of two types of dams makes it difficult to directly obtain the high-precision 3D model of the tufa dam system solely using an existing measurement technique.
In recent years, with the continuous development of unmanned aerial vehicle (UAV) technology [19] and the maturation of Structure-from-Motion and Multi-View Stereo (SfM-MVS) algorithm [20], UAV digital photogrammetry (UAV-DP) has found widespread applications in the fields of earth and environmental sciences [21,22,23]. However, due to the relatively low accuracy of traditional onboard GPS, it is necessary to collect sufficient ground control points (GCPs) within the surveying area to achieve high-precision terrain. However, this task is usually costly, time-consuming, and laborious, even infeasible in areas with complex terrain and dense vegetation. With the addition of a real-time kinematic (RTK) device, the accuracy of onboard GPS has been greatly improved. Under the support of onboard RTK GPS and SfM-MVS technology, the data products of UAV-DP directly georeferenced without GCPs achieved a horizontal accuracy of ~0.7 ground sampling distance (GSD) and a vertical accuracy of ~2.6 GSD [24]. Therefore, in most application scenarios, the GCP-free UAV-DP can soundly replace traditional GCP-based photogrammetric techniques [25]. In general, the UAV equipped with RTK GPS provides an economical and efficient means to acquire a high-precision 3D model of the earth surface [26,27].
However, despite the UAV-DP generating the initial 3D surface model of a tufa dam system, it still faces challenges related to inaccurate underwater terrain induced by water surface refraction and the inability to directly capture the terrain beneath vegetation. As for underwater terrain, it can be achieved using a photogrammetric approach or spectral-derived approach [28]. Photogrammetric measurement is contactless and usually necessary to combine a refraction correction model [29]. It has been widely employed in shallow riverbed depth measurements [30,31], coastal terrain/depth measurements [32,33], and tufa lake topo-bathymetric mapping [16]. The photogrammetric approach is typically applicable within a limited depth, and invalid in water areas with uniform texture. The spectral-based measurement is applicable to a wider range of water depths, but requires a large number of on-site depth measurements, which will inevitably bring serious disturbance to the water environment. Due to the convenient conversion between water depth and underwater terrain, it is feasible for UAV-DP to accurately measure underwater terrain of a pellucid and shallow tufa lake. As for understory terrain measurement, the surveying LiDAR is the best way in relatively dense vegetation. However, it is also workable for UAV-DP to obtain understory terrain in relatively sparse forests [34] or dense forests with some gaps [35].
In this study, we intend to solely utilize UAV-DP to obtain the accurate 3D model of a tufa dam system and analyze the morphological characteristics. The principal objectives include (1) stitching the underwater DEM processed by refraction correction and the above-water DEM removed of vegetation obstruction to obtain the complete 3D model of the tufa dam system; (2) measuring the dimension data and identifying the morphological characteristics of the tufa dams along the derived elevation profiles; (3) exploring the implications of the morphological characteristics for analyzing the formation and development of the tufa dam system.

2. Materials and Methods

2.1. Study Site and Data

2.1.1. Study Site

As shown in Figure 1a,b, the study site is located in the Shuzheng Valley of Jiuzhaigou National Nature Reserve, Sichuan Province, China. The reserve is characterized by high mountains and deep valleys, with elevations ranging from 2200 m to 4500 m, and the terrain is high in the south and low in the north. According to the records of the Zechawa Weather Station in the reserve from 2000 to 2018, the annual average temperature is about 7.1 °C, with July as the hottest month (23.3 °C) and January as the coldest one (−10.3 °C) [36]. The annual average precipitation is about 703 mm, and the precipitation is mainly concentrated from May to October. The runoff generally reaches its peak in October and the lowest point in April. There are various tufa landscapes such as tufa lakes and tufa waterfalls widely distributed in the valley. The morphological characteristics of these landscapes conform to the typical fluvial tufa landforms. As indicated in Figure 1b, Shuzheng Valley is a downstream sub valley of Jiuzhaigou Valley. The water in the Jiuzhaigou Valley converges from the Rize Valley on the left and the Zechawa Valley to the right of the Shuzheng Valley, and finally flows into the Baihe River, a tributary of the Yangtze River. As illustrated in Figure 1c, there are multiple tufa lakes divided by tufa dams in the Shuzheng Valley. Among them, Wolong Lake is one of the largest tufa lakes, with a length of approximately 253 m and a width of approximately 225 m. The lake water shows varying degrees of blue-green color, flowing in the south-north direction. In Wolong Lake, the submerged tufa dam (SD) in the middle and the principal tufa dams in the upstream dam (UD) and downstream dam (DD) form a typical tufa dam system. There is lush vegetation (trees, shrubs, and herbs) distributed on the above-water parts of the upstream and downstream tufa dams. The underwater tufa dam lurks like a giant Chinese dragon at the center of the lake bottom, which is the origin of the lake name ‘Wolong’ (transliteration for the Chinese word, meaning lying dragon). The pellucid water and typical tufa dam system of Wolong Lake provide an appropriate test site for the study on the complete 3D model acquisition and morphological analysis.

2.1.2. UAV Image Acquisition

It was close to noon on 9 December 2016 when a fixed-wing UAV equipped with a consumer-level digital camera (Sony ILCE-5100, Sony Group, Beijing, China ) was utilized to capture the aerial images of the study site. The weather was sunny and cloudless, with a gentle breeze blowing. The dimensions of the mirrorless camera were approximately 109.6 × 62.8 × 35.7 mm, with a weight of approximately 224 g. The focal length of the sensor was 20 mm, and the pixel resolution of each captured RGB image was 4000 × 6000. In the flight operation, the flight altitude was set to 500 m relative to the take-off spot. Hence, the GSD of the captured images was approximately 10 cm. The forward overlap was set to 80%, and side overlap was 70%. With the largest solar altitude in the day and vertical shooting direction of the camera, the acquired images were not affected by the mirror solar reflection of the lake surface. The color and texture information of the lake bottom was well recorded in the RGB image, and the underwater terrain of Wolong Lake including the submerged tufa dam could be clearly identified. Meanwhile, the elements of exterior orientation of each image (3D coordinates (x, y, z)) were measured using the onboard RTK GPS, with the reference frame of WGS84/UTM Zone 48N. The high-quality UAV-acquired images of the study site laid a solid foundation for subsequent auto-triangulation.

2.2. Methods

Before analysis of the morphological characteristics of the tufa dam system, the complete and true DEM of Wolong Lake must be obtained. First of all, one auto-triangulation software was used to process the overlapping images acquired by UAV, producing the digital orthophoto map (DOM) and initial digital surface model (DSM) of the study site. Next, the initial DSM of Wolong Lake was divided into the underwater and above-water parts. The refraction correction was applied to retrieving the underwater DEM of the submerged part, and the ground interpolation was adopted to eliminate vegetation obstruction to obtain the above-water DEM. Then, the complete DEM of the tufa dam system was obtained by stitching the two resulting DEM parts. Finally, the elevation profiles of the complete DEM were derived along the three centerlines of the fluvial channel, and the morphological characteristics of the tufa dam system were measured and analyzed. The schematic diagram for the workflow is shown in Figure 2.

2.2.1. Pre-Processing

The auto-triangulation will be first carried out to process the overlapping images captured by the UAV. In this study, the auto-triangulation software Agisoft Metashape 1.8.0 (https://www.agisoft.com/ (accessed on 15 August 2024)) implementing the SfM-MVS algorithm is used to produce the DOM and initial DSM of the study site. The UAV images and their recorded GPS coordinates are taken as the input data. In this process, image alignment and point cloud densification are the two pivotal steps. The aligning accuracy and point cloud reconstruction quality are the two key parameters of the two steps, respectively, which directly affect the accuracy and reliability of the resulting products. In this study, to obtain the most reliable products, both parameters were set to ‘high’. More details on the procedures and the corresponding parameter settings can be referred to the software manual and the alike work [37]. The resulting DOM and DSM will share the same reference frame as that recorded in the images, and their spatial resolutions will match the GSD of the images.
In order to obtain a complete and true terrain of the study site, the above-water and underwater parts of the initial DSM need to be treated separately. Therefore, accurate boundary delineation for the two DSM parts is of pivotal importance. Here, the boundaries are delineated based on the DOM through visual interpretation, and then are overlaid on the initial DSM to separate it into the underwater and above-water parts. The scope and shape of underwater tufa dams in the middle of Wolong Lake can be roughly seen from the DOM. Meanwhile, the slope map can more clearly show the slope extension on both sides of the underwater tufa dam. On these data bases, the spatial extent of the tufa dam will be extracted for the subsequent measurement of dam dimensions.

2.2.2. Refraction Correction

For the underwater part of the initial DSM, there is a certain deviation of the position due to the refraction of light occurring at the interface of the air and water. During auto-triangulation processing, the SfM-MVS algorithm just seeks tie points between adjacent images, being unaware of this deviation. Hence, the resulting underwater DSM is inaccurate. As shown in Figure 3, the reflection of light at point P1 refracts at the water surface and is recorded by the UAV-loaded camera. Following the principle of straight-line propagation of light, the auto-triangulation software attempts to trace back the position of P1 along the incident direction. Therefore, it wrongly identifies the position of P0 as that of P1. In order to obtain accurate underwater terrain, refraction correction must be applied to the initial DSM of the water-covered region. He et al. has demonstrated that refraction correction could yield reliable underwater terrain of a tufa lake, especially within a water depth range of 12 m [16]. As Wolong Lake and Spark Lake (the study object in [16]) have a similar water depth range, the simple refraction correction model (Equation (1)) can be soundly used to correct the underwater terrain of the study site. In the model, the refractive index of the air is generally defined as 1.0, and the refractive index 1.34 of natural water is usually used as that of tufa lake water due to their slight density difference.
h = n 2   n 1 × h 0  
where n 1 is the refractive index of the air, and n 2 represents the refractive index of the water; h 0 is the initial water depth, while h represents the water depth after correction.
The specific procedures of refraction correction were implemented in the geographic information system (ArcGIS 10.6). Since refraction correction cannot directly treat underwater terrain but rather correct the water depth, it is necessary to convert the elevation of the lake bottom into the water depth. The first step is to determine the water surface elevation. Some elevation points along the edge of Wolong Lake are evenly collected according to the method proposed by Bandini et al. [38]. Based on the average of these elevation points, the initial water surface elevation of the lake will be determined. Subsequently, the initial water depth will be obtained by subtracting the initial DSM of the water-covered region from the water surface elevation. Next, the water depth will be corrected using Equation (1). Finally, by subtracting the corrected water depth from the water surface elevation, the true underwater terrain will be achieved.

2.2.3. Ground Interpolation

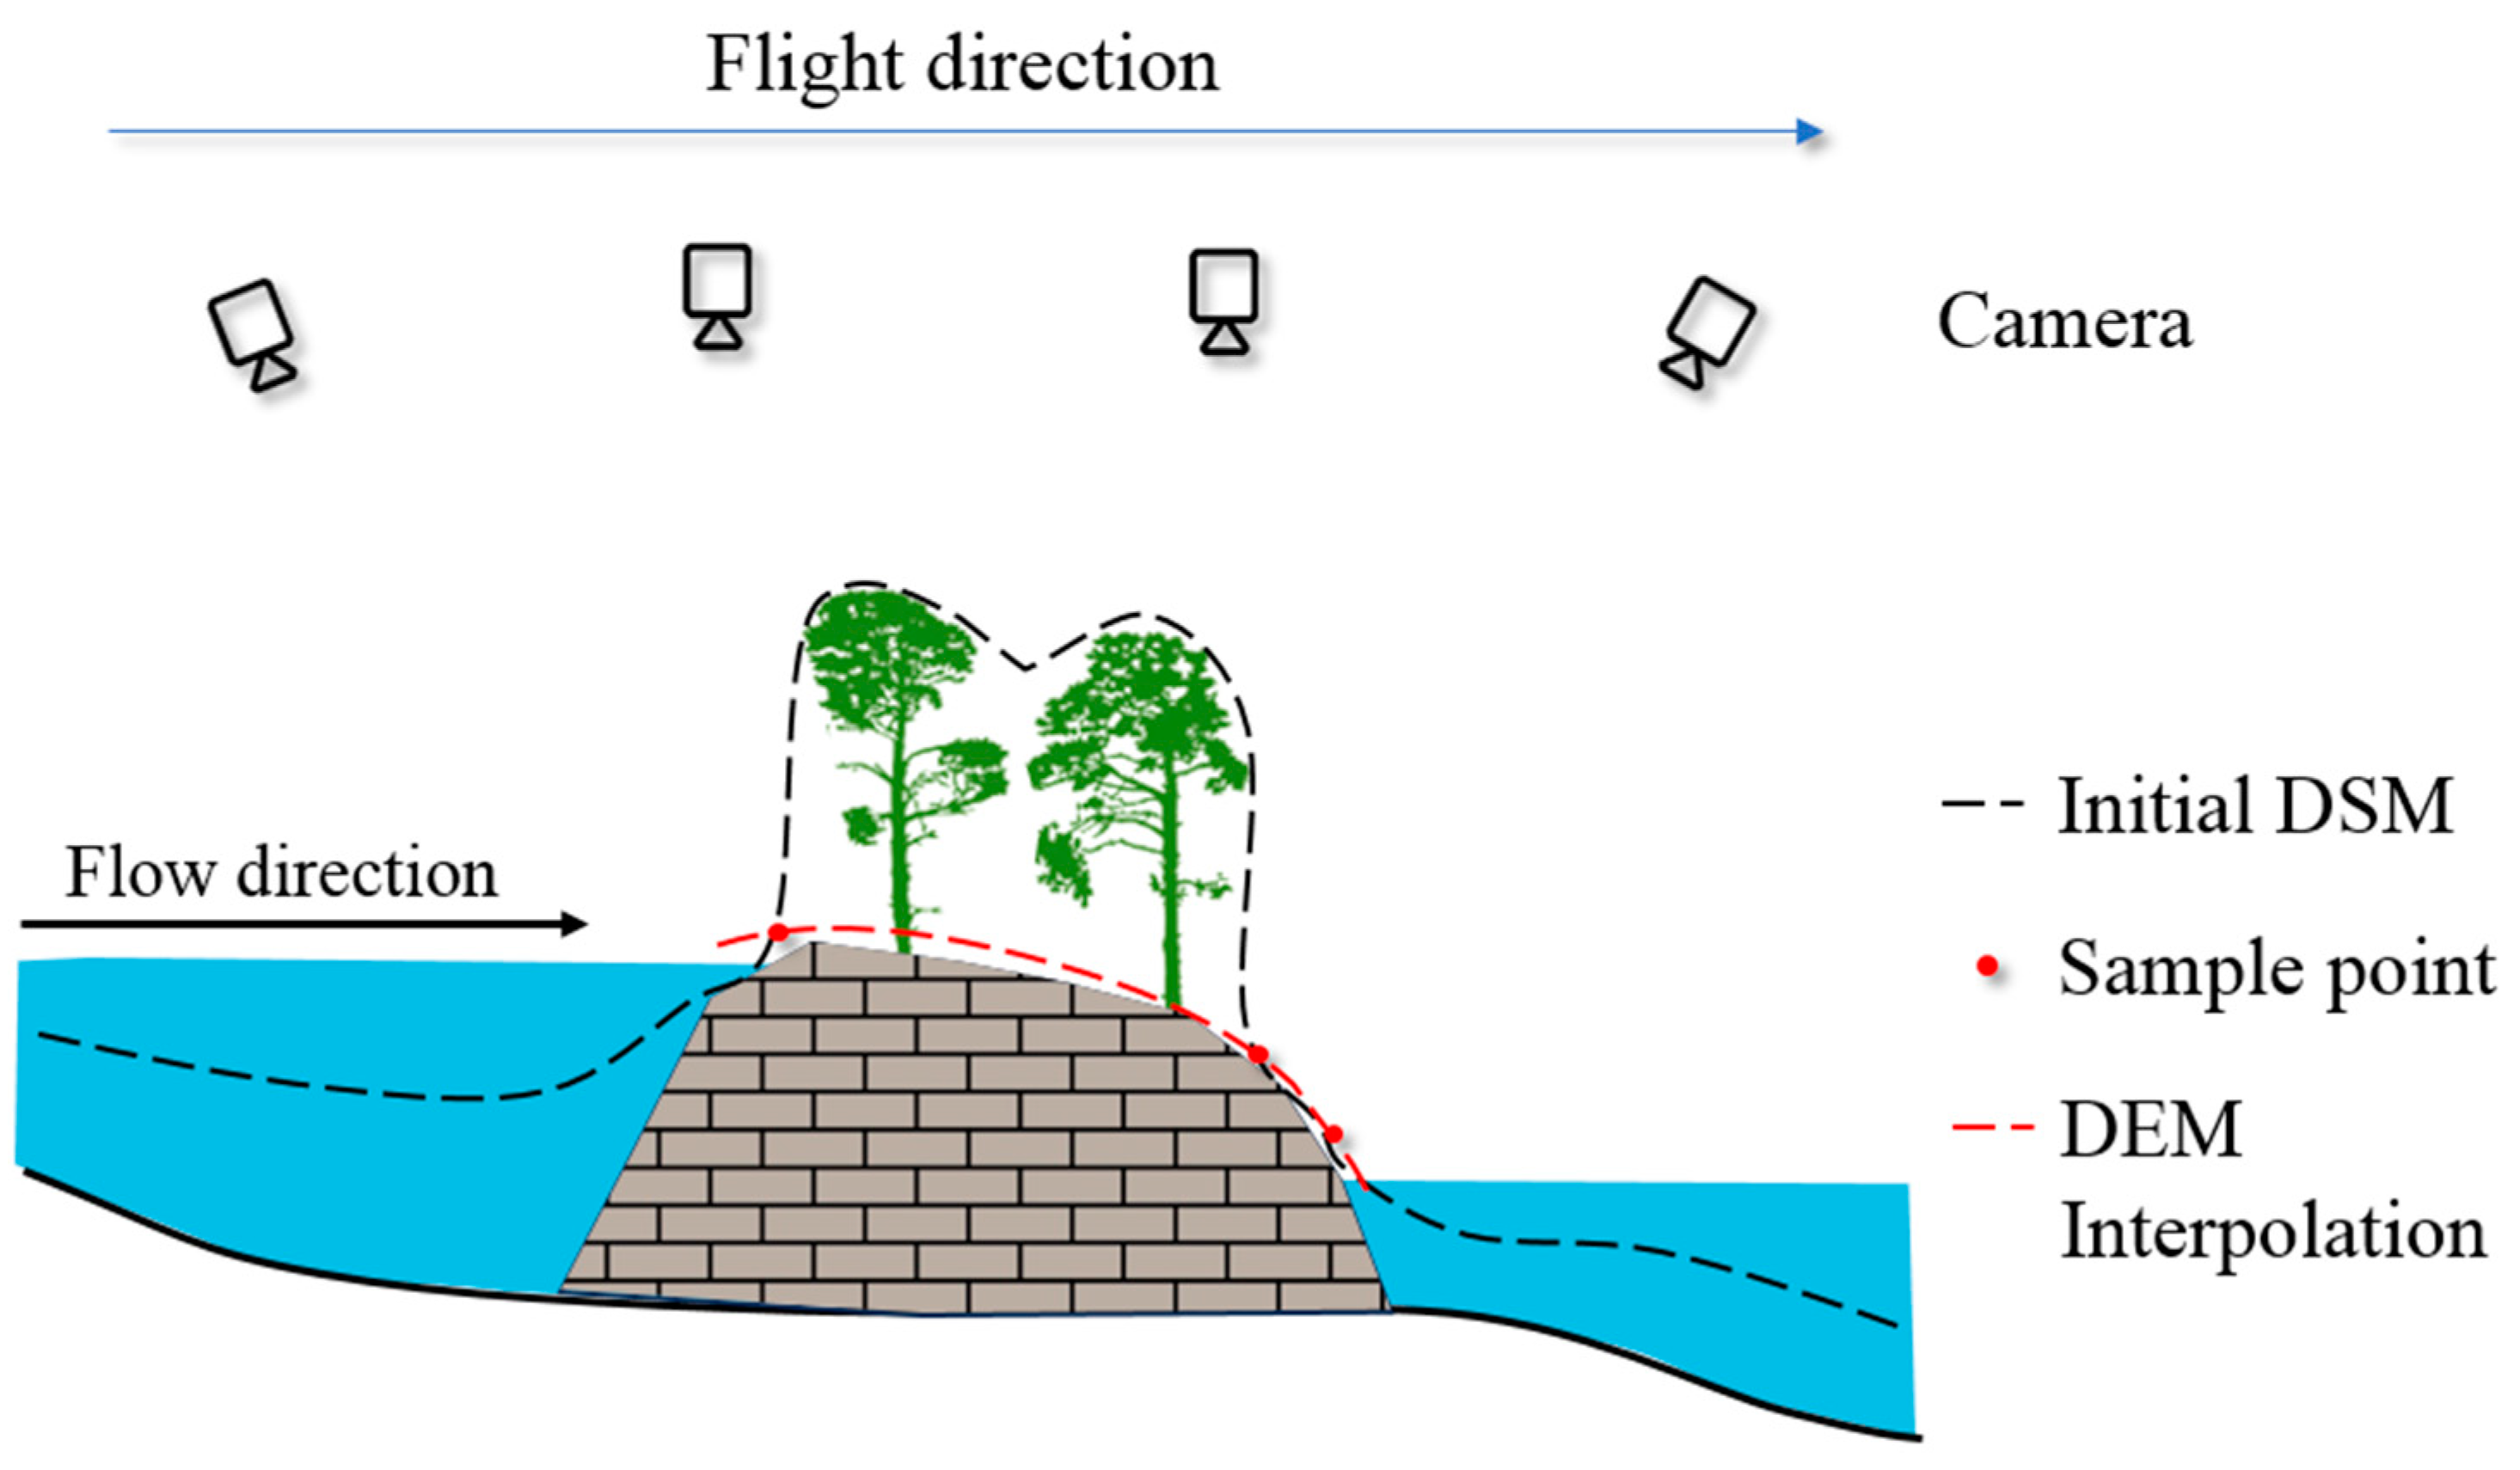
For the above-water part of the tufa dams, UAV-DP is also unable to directly obtain the true terrain due to the obstruction of vegetation. The usual practice is to employ a progressive TIN densification algorithm to filter out the vegetation based on the point cloud produced by SfM-MVS processing [34,39]. However, limited by the low spatial resolution of UAV-acquired images, this method cannot be soundly applied. Fortunately, the width of the tufa dam crest is relatively narrow, and the elevation variation on the dam crest is not significant. Furthermore, the vegetation does not completely cover the entire above-water dam body. As illustrated in Figure 4, our method is to sample some elevation points from the bare ground of the two sides of the above-water tufa dam, and then use the ANUDEM method to obtain the initial topography of the above-water dam crest via elevation interpolation. The ANUDEM interpolation is specifically designed for the creation of hydrologically correct terrain surfaces, which couples a drainage enforcement algorithm with an iterative finite difference interpolation technique [40,41]. The former removes spurious sinks or pits, while the latter achieves high-precision interpolation by minimizing a terrain-specific roughness penalty. With the support of the drainage enforcement algorithm and iterative finite difference interpolation technology, the DEM created by the ANUDEM method more closely represents a natural drainage surface. The ANUDEM method is implemented as the “topo to raster” tool in Spatial Analyst Tools of ArcGIS 10.6.
Furthermore, Equation (2) is used to preserve original details of the ground surface of above-water tufa dams as much as possible while removing vegetation. If the elevation value of a grid cell of the initial DSM is higher than that of the interpolated DEM, then the elevation value of the interpolated DEM will replace that of the initial DSM; otherwise, the elevation value of the initial DSM will be retained. Although it may not be highly accurate in terms of terrain details, the overall topography of the tufa dam crest can be achieved. Compared with other interpolation methods such as Kriging and spline function interpolation, the ANUDEM method demonstrated better alignment with real-world conditions [42].
D E M c o r r e c t e d = m i n   { D E M i n t e r p o l a t i o n ,   D S M }  
where D E M c o r r e c t e d is the resulting DEM via removing vegetation from the above-water tufa dam; D E M i n t e r p o l a t i o n is the resulting DEM by ground interpolation; D S M is the initial DSM obtained using SfM-MVS algorithm.

2.2.4. Derivation and Measurement of Elevation Profile

After refraction correction and ground interpolation, the resulting DEMs of the underwater and above-water parts will be stitched together to achieve the complete 3D topography of the study site. Based on the complete DEM, the longitudinal elevation profile along the water channel can be derived to assist in measuring dimensions of tufa dams and analyze their morphological characteristics.
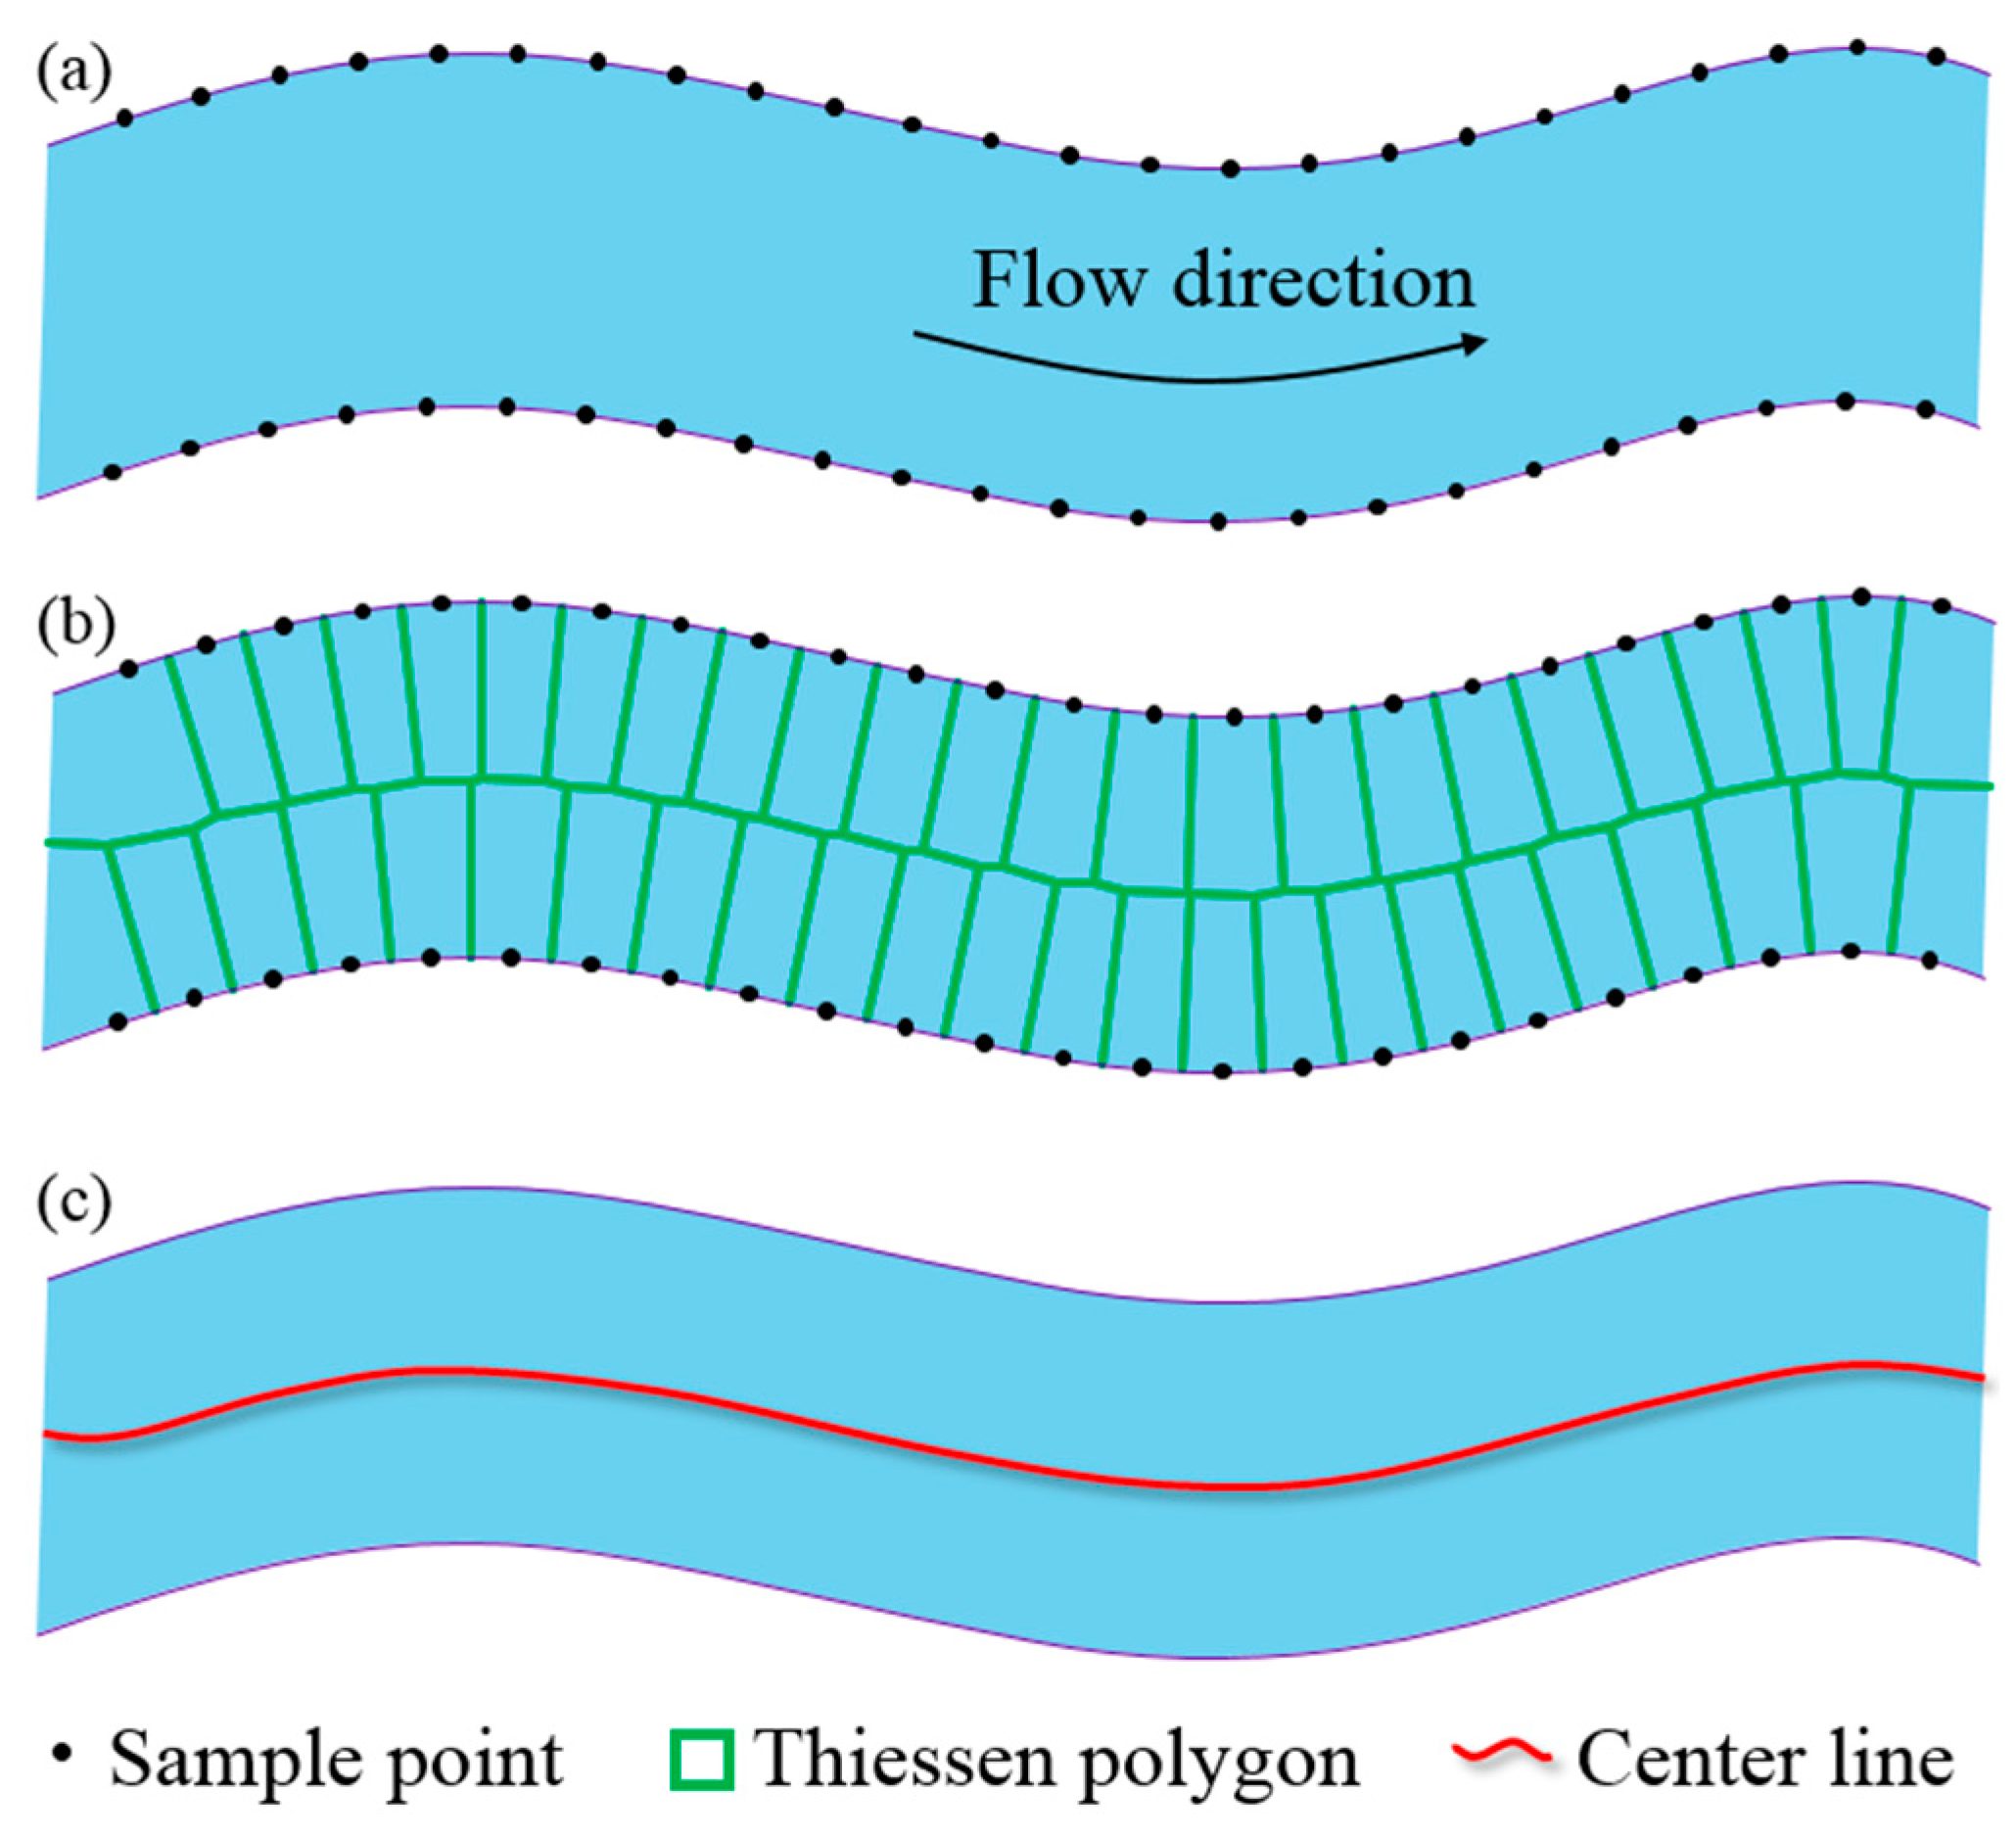
In the study, three centerlines of Wolong Lake will be extracted for deriving representative elevation profiles of the tufa dam system. As illustrated in Figure 5, the centerline of a water channel is obtained using the Voronoi-based median axis extraction algorithm. Some discrete points are first sampled on both sides of the water channel (Figure 5a), and then Thiessen polygons (Figure 5b) are generated based on pairs of adjacent points at both the same side and the other side of the water channel. Next, the edges along the flow direction that have equal distances to the two sides of the water channel are connected to achieve the median axis (centerline) of the water channel (Figure 5c). Here, the centerline extraction will be directly performed by adopting the centerline library implemented with the Python programming language (https://centerline.readthedocs.io/ (accessed on 15 August 2024)). Furthermore, with the extracted centerline as an imaginary boundary, the water channel will be further divided into the left and right sections along flow direction. Thus, the centerlines of the two sections will be obtained using the aforementioned method. In the end, three longitudinal elevation profiles will be derived along the three centerlines.
In general, tufa dams exhibit various morphological characteristics influenced by multiple topographical and environment factors [8]. Based on the section lines of the elevation profiles, the dimension data including dam height, dam width, distance from crest to water surface of the submerged tufa dam, and dam crest width and heights of the total drop wall (TDW) and exposed drop wall (EDW) of upstream and downstream dams will be measured. The drop wall generally refers to the downstream side of a tufa dam [3]. The EDW is the partial drop wall of the tufa dam exposed above the water surface. The TDW is the entire drop wall of the tufa dam. Typically, only the height of the EDW will be used as the metric for a tufa dam owing to its easy access [3]. In contrast, based on the complete DEM, the height of the TDW can also be measured, which will more accurately reflect the dimension of the tufa dam. In combination with the tufa deposition principles and local hydrodynamics, the formation and development of the tufa dam system of Wolong Lake will be investigated in an exploratory way.

3. Results

3.1. Complete DEM of Tufa Dam System

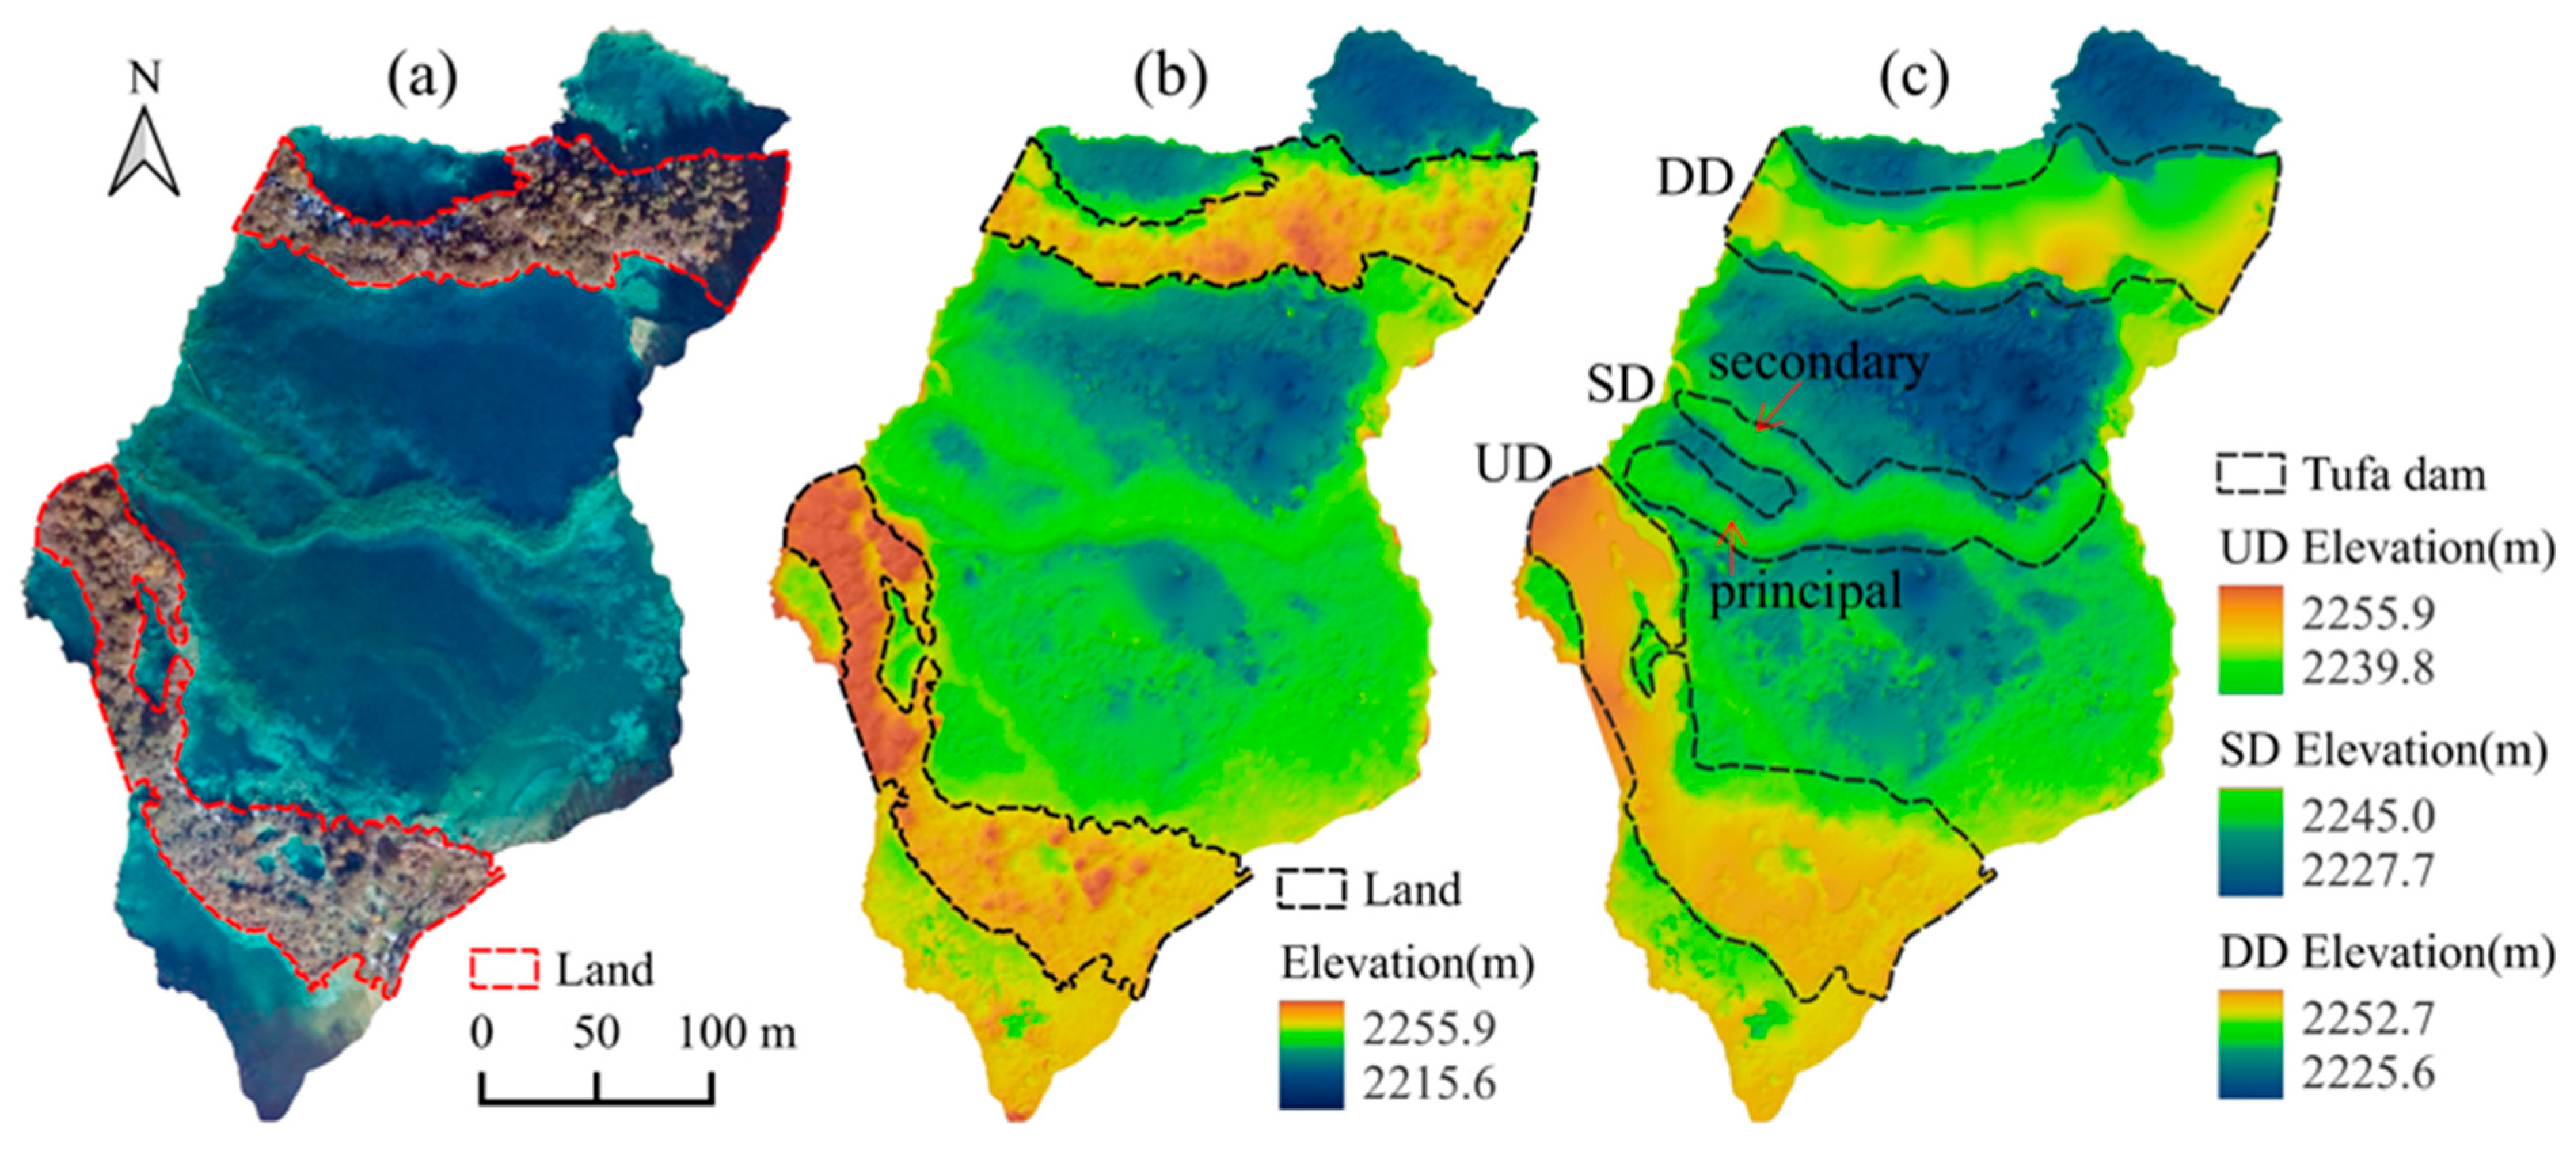
The DOM and initial DSM of the study site produced by auto-triangulation were shown as the base images of Figure 6a,b, respectively. Based on the DOM, the boundaries of the above-water and underwater parts were visually delineated and accurately overlaid on the initial DSM to divide it into two parts (Figure 7a,c).
The water surface elevation of Wolong Lake was determined to be 2247.1 m. Then, the initial DSM of the underwater part (Figure 7a) was converted into a water depth map, which was conducted with refraction correction using Equation (1). The corrected water depth map was then converted back into the DEM of the underwater part (Figure 7b). The initial DSM of the above-water part (Figure 7c) was first removed of vegetation using ground interpolation, and then the DEM of the above-water part (Figure 7d) was obtained using Equation (2). In the end, the complete DEM of the study site (Figure 7e) was achieved by stitching the two resulting DEMs (Figure 7b,d).
Compared with Figure 7e, the elevations of the underwater part in Figure 6b were overall subsiding, with the lowest elevation decreasing from 2223.6 m to 2215.6 m. As for the above-water part, the lowest elevations remained unchanged, while the highest elevations decreased by 6.5 m and 7.8 m in the upstream dam and downstream dam, respectively.
Based on Figure 7e, the spatial scopes of the three tufa dams of Wolong Lake were delineated out according to the natural slope extension of the dam bodies (Figure 6c). It was worth noting that the spatial scopes of upstream and downstream dams were somewhat larger than those of the above-water parts delineated in Figure 6b. It was because the upstream and downstream tufa dams were composed of the above-water part and underwater part. As indicated in Figure 6c, the submerged tufa dam was bifurcated into two sub ones (principal and secondary dam) on the left.

3.2. Dimension Data of Tufa Dams

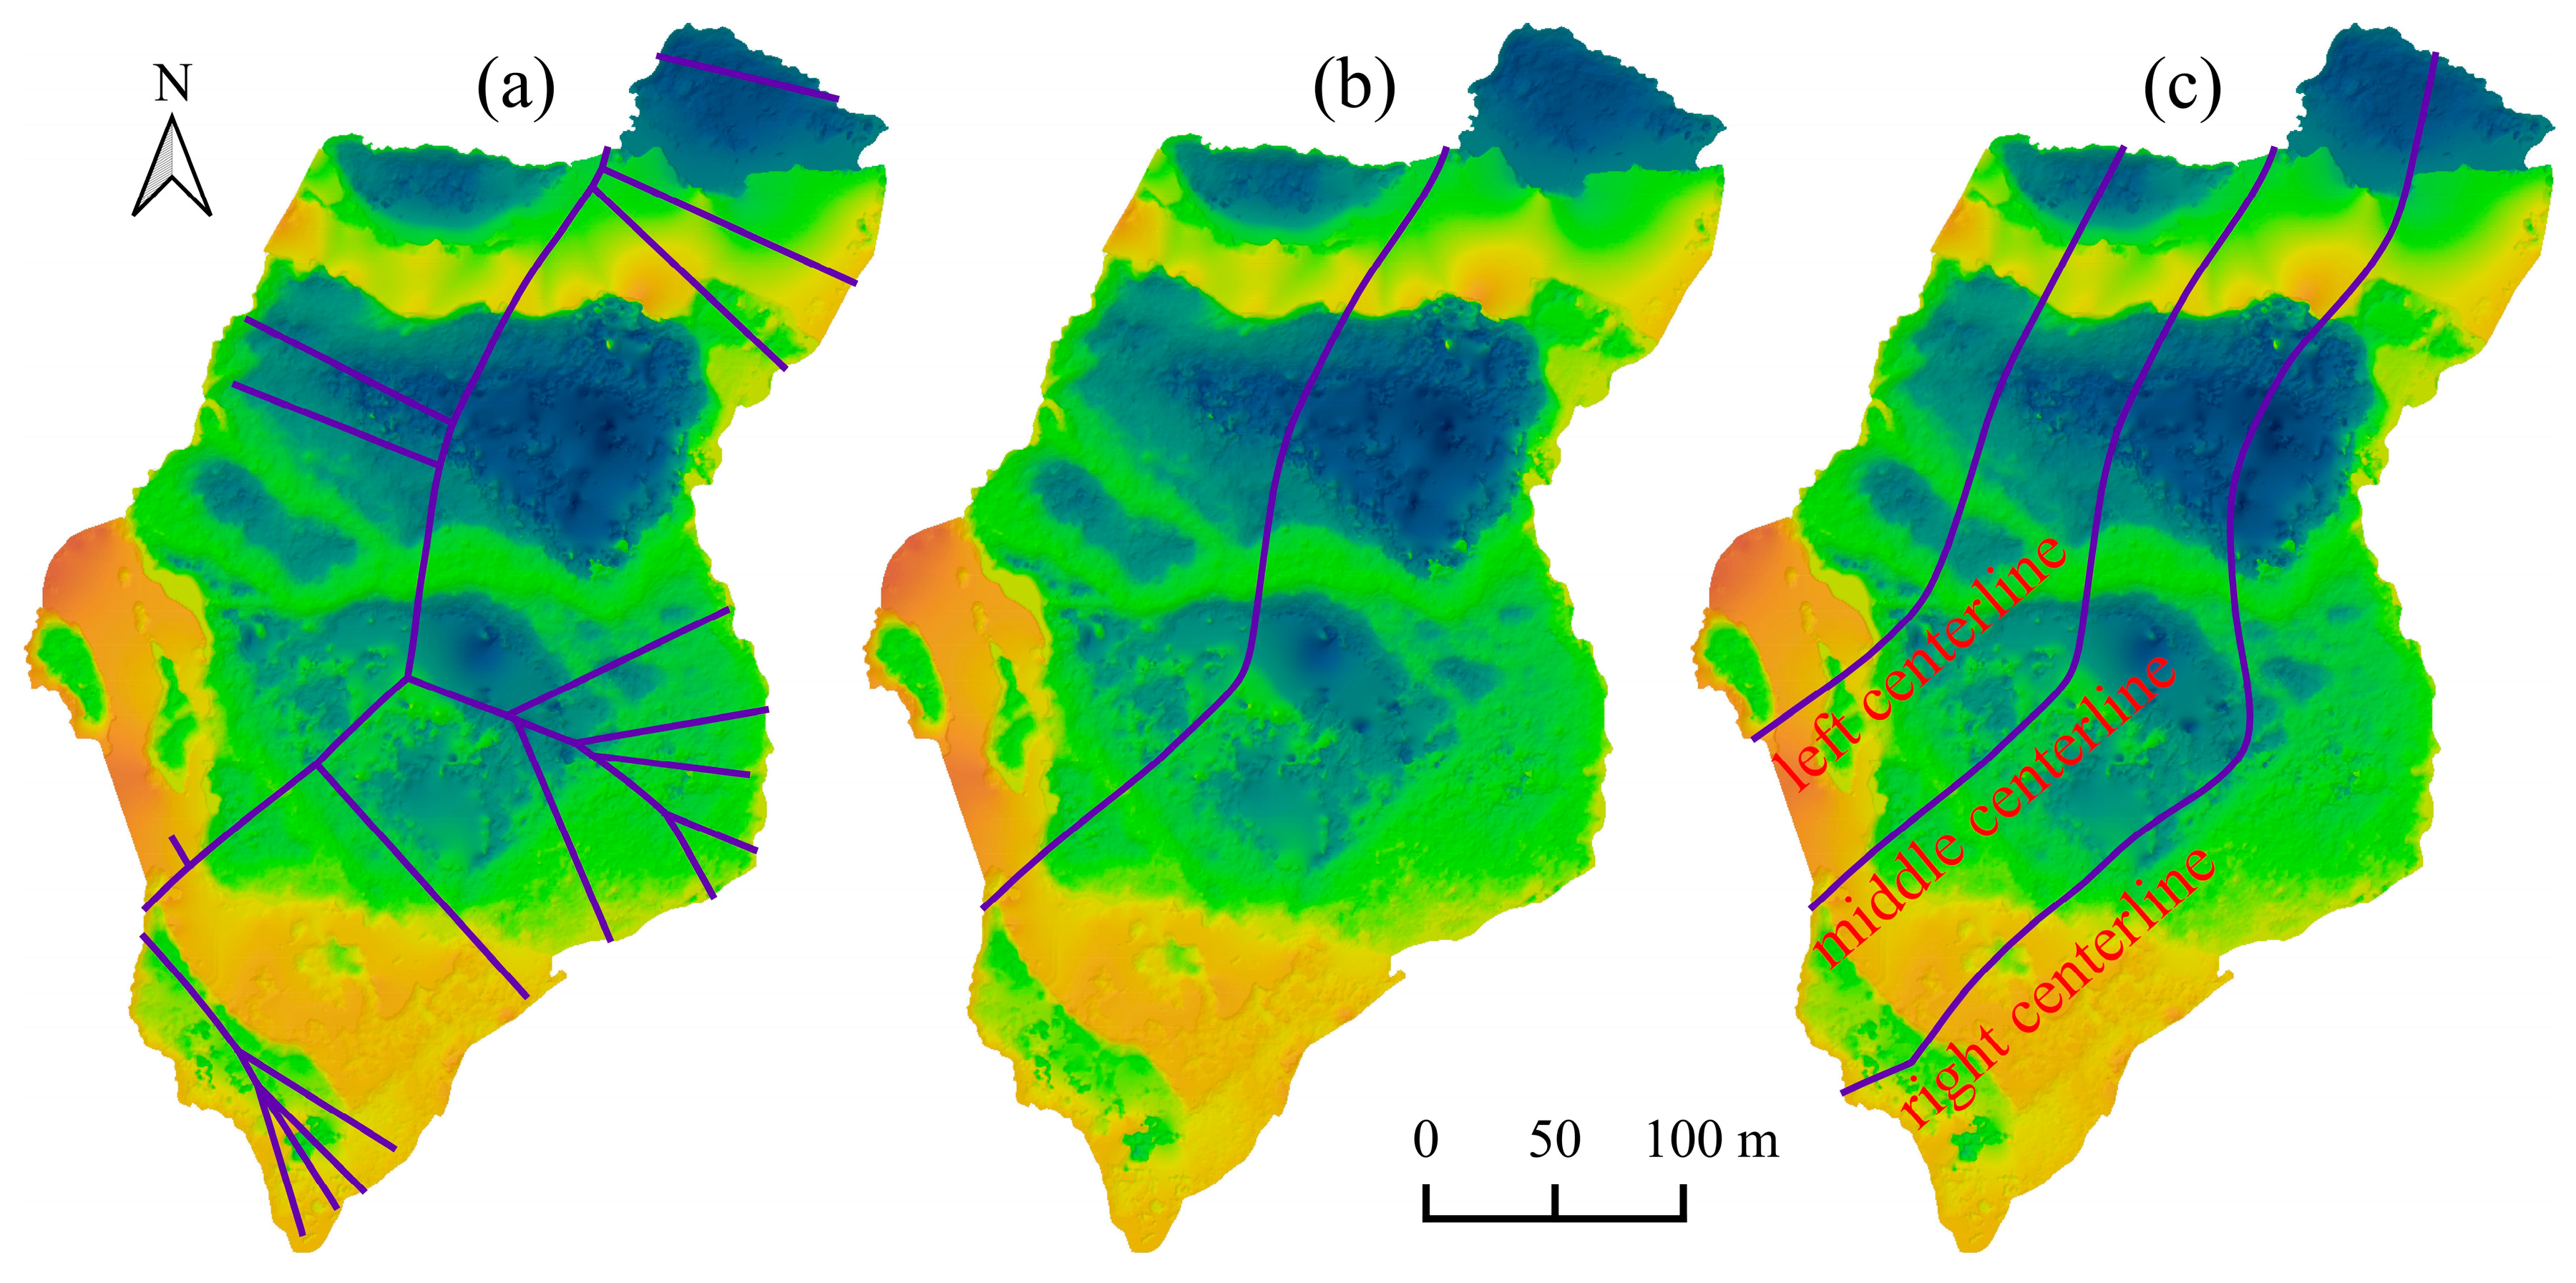
Based on the complete DEM of the study site, the Thiessen polygons (Figure 8a) were generated using the discrete points randomly sampled along the two banks. As indicated in Figure 8b, the centerline of the valley channel in Wolong Lake was achieved after removing redundant branches and smoothing the polyline. Then, the centerlines of the left and right sections of Wolong Lake were obtained reusing the Voronoi-based median axis extraction algorithm (Figure 8c). Finally, the three longitudinal elevation profiles were derived along the three centerlines, and their section lines were displayed in Figure 9.
In Figure 9, the submerged tufa dam was indicated with a gray background in the three elevation profiles, whose dimension data including dam height, dam width, and distance from dam crest to the water surface were listed in Table 1. According to the dimension data, the submerged tufa dam was narrower on both ends (approximately 20 m) and wider in the middle (over 30 m) in terms of dam width. This situation could be evidently observed from the DOM (Figure 6a). Regarding dam height, it indicated a rising trend from left to right (5.6 m, 10.4 m, and 12.2 m in the three profiles, respectively). However, the distance from the dam crest to the water surface did not exhibit the same trend. Instead, it was characterized by a central protrusion (3.0 m) and a slight depression on both ends (3.9 m and 3.6 m). The inconsistency in the elevation of the entire dam base may be a factor contributing to this difference.
Along the section lines in Figure 9, the dimension data of the upstream and downstream tufa dams including dam crest width and heights of the EDW and TDW were measured and listed in Table 2. According to Table 2, there were noticeable differences in the dam crest width between the upstream and downstream dams. The upstream dam was narrower in the middle, with a minimum width of 8.3 m, while the downstream tufa dam gradually widened from left to right, reaching a maximum width of 33.5 m on the right. The EDW heights of the upstream tufa dam decreased from 5.6 m on the left to 3.9 m on the right, and that of the downstream tufa dam exhibited an increase from 3.5 m on the left to 14.7 m on the right. In contrast, the TDW heights of the upstream dam on the three section lines had the opposite trend, indicating that the underwater terrain sloped downwards from left to right. For the downstream dam, the heights of EDW and TDW showed a consistent increase from left to right. As the height differences between TDW and EDW in the three section lines were all around 9.0 m, the local underwater terrain of downstream dam was relatively flat.

3.3. Morphological Characteristics of Tufa Dams

The two-dimensional morphological features of the tufa dam system of Wolong Lake can be clearly observed in Figure 6a. The tufa dam system had a typical structure and composition as a whole, but exhibited irregular spatial forms in detail. According to Figure 9, although it indicated various dimensions on the three section lines, the 3D morphology of the submerged tufa dam basically conformed to that of the downstream inclined dam described by Carthew et al. [43]. As shown in Figure 10a, the downstream side of the submerged dam formed a dipping ramp due to the long-term water erosion and tufa deposition. As seen in the orange circles in Figure 9a and Figure 9c, the downstream side of the upstream tufa dam exhibited an approximately vertical wall, which was a common structure in the upstream and downstream of deep lakes [44]. As for the downstream dam, limited by the overhead angle of UAV-DP, the typical overhanging crest with tufa stalactites (Figure 10b) could not be clearly observed in Figure 9a and Figure 9b. In contrast, within the red circle in Figure 9c, the dam crest slightly extended towards the downstream side, which suggested that the overhanging tufa stalactites possibly existed. This inference was confirmed by investigating the corresponding real scenery in Figure 10c. In addition, the micromorphology between the tufa dams could be further analyzed based on the detailed section lines in Figure 9.

4. Discussion

4.1. Reliabilities of Resulting Complete DEM

As mentioned in previous sections, with the support of onboard RTK GPS and SfM-MVS technology, the accuracy of the initial DSM of the study site obtained using GCP-free UAV-DP was fairly reliable. The focuses of our study were on removing vegetation from the dam crest and correcting the underwater terrain to obtain the real morphology of the tufa dam system.
On one hand, the understory terrain acquired using UAV-DP can generally achieve a relatively high accuracy. According to [22], the root mean square error (RMSE) of UAV-derived DEM data in a highly broken and vegetated terrain without GCPs was calculated as 0.57 m. With the support of RTK/PPK technology in UAV-DP, the horizontal (X and Y dimensions) and vertical (Z dimension) accuracies in mapping inaccessible forested areas attained RMSE of 0.026 m, 0.035 m, and 0.082 m, respectively [45]. As the UAV flight altitude in this study was much higher than those of the two previous studies, the measurement accuracy inevitably decreased to a certain extent. However, it was still sufficient to satisfy the requirement of measuring the above-water tufa dam. In addition, due to manual participation in sampling elevation points on both sides of the dam body, the reliability of the dam crest terrain obtained with the ANUDEM interpolation method had been further improved. On the other hand, the accuracy of refractive correction for retrieving the underwater terrain of a tufa lake had been evaluated using post-earthquake terrain of the lake drained out of water [16]. According to the evaluation results, the coefficient of determination (R2) was 0.88 and RMSE was 1.32 m, indicating fair reliability. As the UAV images of Spark Lake (the study object in [16]) and Wolong Lake were captured in the same flight operation, they shared consistent illumination and solar altitude. Therefore, the resulting accuracy of the underwater terrain of Spark Lake also applied to Wolong Lake. As indicated in Figure 7, the elevation range of the study site shifted from 2223.6–2262.4 m to 2215.6–2255.9 m. This indicated that the combined method had improved the overall terrain of the study site, making it closer to the real terrain as a whole. Thus, it was greatly beneficial for the subsequent accurate measurement of both above-water and underwater dam bodies and the analysis of the formation and evolution of tufa dams and lakes.

4.2. Exploration of Tufa Dam Formation and Development

The morphologies of tufa dams are generally determined by complex interactions of various topographical and environmental factors [3]. Florsheim et al. concluded that large tufa dams in Jiuzhaigou basically formed on watershed-scale steps in the longitudinal profile [8], while local tiny steps, landslide rubble, or woody debris played a key role in the formation and growth of relatively small tufa dams. As shown in Figure 10d, the local stepped terrain created favorable hydrodynamic conditions for rapid tufa deposition and carbon dioxide emission, forming initial downstream dams. It could be inferred that with the continuous increase of downstream dams, separated tufa lakes eventually formed. This might be considered as a basic formation and development mode for the series of tufa dams and lakes widely distributed in Jiuzhaigou Valley. Meanwhile, biochemical reactions also play an important role in the deposition process and accelerate the growth of tufa dams [46].
In a river, due to the friction between the flowing water and the riverbed, the flow velocity is usually slower at the bottom and edges of both banks, while it is relatively faster in the middle. In a suitable environment, the faster flow velocity commonly drives the faster tufa deposition rate [8]. According to Table 1, the submerged tufa dam was characterized by a central protrusion and a slight depression on both ends. Additionally, the middle part of the submerged tufa dam also had the maximum width. It was possibly because the faster flow velocity generated more complex turbulent currents in the middle of the dam body, producing lower fluid pressure. According to Bernoulli’s principle, the dissolved carbon dioxide may preferentially be released in this zone [47], and the tufa deposition rate was accordingly accelerated. With a tufa deposition rate of approximately 0.61–0.69 mm/year [48], the submerged tufa dam is expected to emerge from the water surface some day (400–500 years later), dividing Wolong Lake into two smaller lakes. This might be another formation and development mode of the tufa dam and lake.
Nevertheless, the real world is complex and dynamic, and any changes in environmental factors can potentially impact tufa deposition. For example, variations in water quantity caused by seasonal or interannual precipitation in Jiuzhaigou will inevitably affect the deposition of tufa [49]. Moreover, in recent years, global warming and atmospheric pollution as well as human activities have the potential to significantly reduce the tufa deposition rate and even lead to tufa degradation [2,50]. Additionally, strong geological activities and their associated secondary hazards can have a substantial mechanical impact on tufa dams. For instance, the 7.0-magnitude earthquake in 2017 has caused serious damage to some tufa landscapes in Jiuzhaigou Valley. Spark Lake, which is close to Wolong Lake, burst its banks and dried up after the earthquake. The secondary hazards such as landslides and debris flows triggered by the earthquake have exacerbated soil erosion in the watershed, leading to additional sedimentation and turbidity in the tufa lakes. The local water–chemical environment for tufa deposition was also affected [51].

4.3. Issues and Possible Solutions

In this study, UAV-DP was employed to obtain the complete DEM of the tufa dam system belonging to Wolong Lake. The results demonstrated that this method could effectively capture dimension data of the tufa dams and analyze the morphological characteristics. However, several issues could also be identified. First of all, there were some elevation discontinuities caused by shadows of various sizes. The shadows are usually casted when sunlight is obstructed by the tufa dams or vegetation above them, leading to some anomalies in the resulting DSM from SfM-MVS photogrammetry [16]. Secondly, the lakebed texture information captured by the UAV-based photography is the basis for producing the underwater terrain of a transparent tufa lake. When the local water depth exceeds a certain threshold, adjacent image matching errors may occur, resulting in abnormal underwater terrain measurements [28]. Thirdly, the degree of vegetation coverage on the tufa dam directly affects the number and spatial distribution of ground points collected for interpolation.
Some measures could be taken to address these issues in future applications. For example, it is recommended to conduct the UAV photogrammetric operation on an overcast day to minimize the impact of shadows and reflections caused by sunlight. For lake bottoms with water depths exceeding the detection threshold of UAV-DP, the spectral-based bathymetry [16] or specialized bathymetric LiDAR [52] could be employed to retrieve the accurate underwater terrain of the entire tufa lake. To eliminate the dense vegetation on the tufa dam, one method is to reduce the flying altitude of UAVs to improve the spatial resolution of acquired images. Another is to adopt a UAV-borne surveying LiDAR, which has strong penetration capability [53].

5. Conclusions

The tufa dams are the important components and indicators of the formation of a tufa lake in a fluvial tufa valley. In this study, we employed UAV-DP to acquire the complete 3D model of the tufa dam system. Based on this model, dimensions of tufa dams were measured and their morphological characteristics were analyzed. The results indicated
  • UAV-DP was a cost-effective technology to quickly acquire the images of the tufa lake and its neighborhood, and produce the DOM and initial DSM. These products were the data bases for retrieving an accurate DEM of study site.
  • The simple refraction correction was effective to obtain the underwater DEM of the submerged dam or dam part, and the ground interpolation was feasible to eliminate vegetation obstruction to achieve the DEM of the dam part above-water.
  • Based on the three elevation profiles derived from the complete DEM, the dimension data of the upstream dam, downstream dam, and submerged tufa dam in the middle were accurately measured, and their morphological characteristics were conveniently identified.
  • For partially exposed above-water tufa dams, the heights of TDW could more accurately reflect the morphological characteristics of the dam bodies than those of EDW. They were conducive to a more accurate exploration of the formation and development of tufa dams and lakes.
UAV-DP was effective for modeling the tufa dam system, and gaining an in-depth understanding of the morphological features and tufa deposition modes through detailed elevation profile analysis. However, its utility is limited and contingent upon various factors such as water transparency, water depth, and vegetation coverage on the above-water dam part. When the water transparency of the tufa lake is inadequate, local water depth exceeds the threshold, or the above-water dam body is densely covered with vegetation, the proposed methods may not achieve highly accurate results. In these cases, it may be necessary to employ other UAV-based technologies including bathymetric or surveying LiDAR, and a spectral-derived bathymetric model in combination with UAV-DP to satisfy application requirements. In addition, the tufa precipitation in a fluvial valley is the combined effects of physical, chemical, and biological processes. To accurately analyze the formation and development of the tufa dam system, it is necessary to take its current morphology and multiple other environmental factors into account.

Author Contributions

Conceptualization, J.L.; methodology, J.L. and X.Z.; validation, J.H.; formal analysis, G.Z. and J.H.; investigation, J.L., X.Z. and G.Z.; data curation, J.H.; writing—original draft preparation, X.Z.; writing—review and editing, J.L.; visualization, X.Z.; supervision, J.L.; project administration, J.L.; funding acquisition, G.Z., J.L. and X.Z. All authors have read and agreed to the published version of the manuscript.

Funding

This research was funded by the National Natural Science Foundation of China, grant numbers 42271427 and 32071678; and the Postgraduate Innovative Research Project of Chongqing, grant number CYS23196.

Data Availability Statement

The raw data supporting the conclusions of this article will be made available by the authors on request.

Acknowledgments

The authors would like to thank Jie Du from Jiuzhaigou Scenic Area Administration, China for kindly providing background data of the study site, and Yangchun Wang and Xiaolin Du from Institute of Mountain Hazards and Environments, Chinese Academy of Sciences for their help in UAV operations and data acquisition.

Conflicts of Interest

The authors declare no conflicts of interest.

References

  1. Ford, T.D.; Pedley, H.M. A review of tufa and travertine deposits of the world. Earth-Sci. Rev. 1996, 41, 117–175. [Google Scholar] [CrossRef]
  2. Liu, L.X. Factors Affecting Tufa Degradation in Jiuzhaigou National Nature Reserve, Sichuan, China. Water 2017, 9, 702. [Google Scholar] [CrossRef]
  3. Pentecost, A. Travertine; Springer Science & Business Media: Amsterdam, The Netherlands, 2005. [Google Scholar]
  4. Merz-Preiß, M.; Riding, R. Cyanobacterial tufa calcification in two freshwater streams: Ambient environment, chemical thresholds and biological processes. Sediment. Geol. 1999, 126, 103–124. [Google Scholar] [CrossRef]
  5. Pentecost, A.; Zhang, Z. A review of Chinese travertines. Cave Karst Sci. 2001, 28, 15–28. [Google Scholar]
  6. Fuller, B.M.; Sklar, L.S.; Compson, Z.G.; Adams, K.J.; Marks, J.C.; Wilcox, A.C. Ecogeomorphic feedbacks in regrowth of travertine step-pool morphology after dam decommissioning, Fossil Creek, Arizona. Geomorphology 2011, 126, 314–332. [Google Scholar] [CrossRef]
  7. Profe, J.; Höfle, B.; Hämmerle, M.; Steinbacher, F.; Yang, M.S.; Schröder-Ritzrau, A.; Frank, N. Characterizing tufa barrages in relation to channel bed morphology in a small karstic river by airborne LiDAR topo-bathymetry. P. Geologist. Assoc. 2016, 127, 664–675. [Google Scholar] [CrossRef]
  8. Florsheim, J.L.; Ustin, S.L.; Tang, Y.; Di, B.; Huang, C.; Qiao, X.; Peng, H.; Zhang, M.; Cai, Y. Basin-scale and travertine dam-scale controls on fluvial travertine, Jiuzhaigou, southwestern China. Geomorphology 2013, 180–181, 267–280. [Google Scholar] [CrossRef]
  9. Pedley, M.; Martín, J.A.G.; Delgado, S.O.; García Del Cura, M.Á. Sedimentology of Quaternary perched springline and paludal tufas: Criteria for recognition, with examples from Guadalajara Province, Spain. Sedimentology 2003, 50, 23–44. [Google Scholar] [CrossRef]
  10. Andrews, J.E. Palaeoclimatic records from stable isotopes in riverine tufas: Synthesis and review. Earth-Sci. Rev. 2006, 75, 85–104. [Google Scholar] [CrossRef]
  11. Guo, Y.Q.; Ge, Y.G.; Cui, P.; Chen, X.Q.; Mao, P.N.; Liu, T.; Zhou, L. Early and mid-Holocene hydroclimate change recorded in tufa deposits in the Jiuzhaigou gully, eastern Tibetan Plateau. CATENA 2021, 196, 104834. [Google Scholar] [CrossRef]
  12. Dong, F. China’s travertine-the most natural asset in karst landscape worthy of world research and protection. Carsol. Sin. 2021, 40, 1–3. [Google Scholar]
  13. Dabkowski, J. The late-Holocene tufa decline in Europe: Myth or reality? Quaternary Sci. Rev. 2020, 230, 106141. [Google Scholar] [CrossRef]
  14. Megerle, H.E. Calcerous Tufa as Invaluable Geotopes Endangered by (Over-)Tourism: A Case Study in the UNESCO Global Geopark Swabian Alb, Germany. Geosciences 2021, 11, 198. [Google Scholar] [CrossRef]
  15. Dong, F.Q.; Dai, Q.W.; Jiang, Z.C.; Chen, X.Q.; Xu, R.L.; Zhang, Q.; An, D.J.; Li, Q.F.; Zhang, T.; Andelka, P.M.; et al. Travertine/tufa resource conservation and sustainable development call for a world-wide initiative. Appl. Geochem. 2023, 148, 105505. [Google Scholar] [CrossRef]
  16. He, J.; Lin, J.; Ma, M.; Liao, X. Mapping topo-bathymetry of transparent tufa lakes using UAV-based photogrammetry and RGB imagery. Geomorphology 2021, 389, 107832. [Google Scholar] [CrossRef]
  17. Bangen, S.G.; Wheaton, J.M.; Bouwes, N.; Bouwes, B.; Jordan, C. A methodological intercomparison of topographic survey techniques for characterizing wadeable streams and rivers. Geomorphology 2014, 206, 343–361. [Google Scholar] [CrossRef]
  18. Mandlburger, G.; Pfennigbauer, M.; Schwarz, R.; Flöry, S.; Nussbaumer, L. Concept and performance evaluation of a novel UAV-borne topo-bathymetric LiDAR sensor. Remote Sens. 2020, 12, 986. [Google Scholar] [CrossRef]
  19. Colomina, I.; Molina, P. Unmanned aerial systems for photogrammetry and remote sensing: A review. ISPRS J. Photogramm. Remote Sens. 2014, 92, 79–97. [Google Scholar] [CrossRef]
  20. Tavani, S.; Granado, P.; Riccardi, U.; Seers, T.; Corradetti, A. Terrestrial SfM-MVS photogrammetry from smartphone sensors. Geomorphology 2020, 367, 107318. [Google Scholar] [CrossRef]
  21. Rusnák, M.; Sládek, J.; Kidová, A.; Lehotský, M. Template for high-resolution river landscape mapping using UAV technology. Measurement 2018, 115, 139–151. [Google Scholar] [CrossRef]
  22. Akturk, E.; Altunel, A.O. Accuracy assessment of a low-cost UAV derived digital elevation model (DEM) in a highly broken and vegetated terrain. Measurement 2019, 136, 382–386. [Google Scholar] [CrossRef]
  23. Devoto, S.; Macovaz, V.; Mantovani, M.; Soldati, M.; Furlani, S. Advantages of Using UAV Digital Photogrammetry in the Study of Slow-Moving Coastal Landslides. Remote Sens. 2020, 12, 3566. [Google Scholar] [CrossRef]
  24. Tang, L.; Qiao, G.; Li, B.; Yuan, X.; Ge, H.; Popov, S. GNSS-supported direct georeferencing for UAV photogrammetry without GCP in Antarctica: A case study in Larsemann Hills. Mar. Geod. 2024, 47, 324–351. [Google Scholar] [CrossRef]
  25. Liu, J.; Xu, W.; Guo, B.; Zhou, G.; Zhu, H. Accurate Mapping Method for UAV Photogrammetry Without Ground Control Points in the Map Projection Frame. IEEE Trans. Geosci. Remote Sens. 2021, 59, 9673–9681. [Google Scholar] [CrossRef]
  26. Cao, L.; Liu, H.; Fu, X.Y.; Zhang, Z.N.; Shen, X.; Ruan, H.H. Comparison of UAV LiDAR and Digital Aerial Photogrammetry Point Clouds for Estimating Forest Structural Attributes in Subtropical Planted Forests. Forests 2019, 10, 145. [Google Scholar] [CrossRef]
  27. Nesbit, P.R.; Hugenholtz, C.H. Enhancing UAV-SfM 3D Model Accuracy in High-Relief Landscapes by Incorporating Oblique Images. Remote Sens. 2019, 11, 239. [Google Scholar] [CrossRef]
  28. He, J.; Lin, J.; Liao, X. Fully-covered bathymetry of clear tufa lakes using UAV-acquired overlapping images and neural networks. J. Hydrol. 2022, 615, 128666. [Google Scholar] [CrossRef]
  29. Westaway, R.M.; Lane, S.N.; Hicks, D.M. Remote sensing of clear-water, shallow, gravel-bed rivers using digital photogrammetry. Photogram. Eng. Remote Sens. 2001, 67, 1271–1282. [Google Scholar]
  30. Kasvi, E.; Salmela, J.; Lotsari, E.; Kumpula, T.; Lane, S.N. Comparison of remote sensing based approaches for mapping bathymetry of shallow, clear water rivers. Geomorphology 2019, 333, 180197. [Google Scholar] [CrossRef]
  31. Gwon, Y.; Kwon, S.; Kim, D.; Seo, I.W.; You, H. Estimation of shallow stream bathymetry under varying suspended sediment concentrations and compositions using hyperspectral imagery. Geomorphology 2023, 433, 108722. [Google Scholar] [CrossRef]
  32. Brodie, K.L.; Bruder, B.L.; Slocum, R.K.; Spore, N.J. Simultaneous Mapping of Coastal Topography and Bathymetry From a Lightweight Multicamera UAS. IEEE Trans. Geosci. Remote Sens. 2019, 57, 6844–6864. [Google Scholar] [CrossRef]
  33. Tsukada, F.; Shimozono, T.; Matsuba, Y. UAV-based mapping of nearshore bathymetry over broad areas. Coast. Eng. J. 2020, 62, 285–298. [Google Scholar] [CrossRef]
  34. Wang, M.; Lin, J. Retrieving individual tree heights from a point cloud generated with optical imagery from an unmanned aerial vehicle (UAV). Can. J. Forest Res. 2020, 50, 1012–1024. [Google Scholar] [CrossRef]
  35. McNicol, I.M.; Mitchard, E.T.A.; Aquino, C.; Burt, A.; Carstairs, H.; Dassi, C.; Dikongo, A.M.; Disney, M.I. To what extent can UAV photogrammetry replicate UAV LiDAR to determine forest structure? A test in two contrasting tropical forests. J. Geophys. Res.-Biogeo. 2021, 126, e2021JG006586. [Google Scholar] [CrossRef]
  36. Laffitte, B. A Dendrochronological Study on Carbon Dioxide Fertilization Effect in Jiuzhaigou World Natural Heritage Site. Ph.D. Thesis, Sichuan University, Chengdu, China, 2021. [Google Scholar]
  37. Mandlburger, G. Through-Water Dense Image Matching for Shallow Water Bathymetry. Photogramm. Eng. Remote Sens. 2019, 85, 445–455. [Google Scholar] [CrossRef]
  38. Bandini, F.; Sunding, T.P.; Linde, J.; Smith, O.; Jensen, I.K.; Köppl, C.J.; Butts, M.; Bauer-Gottwein, P. Unmanned Aerial System (UAS) observations of water surface elevation in a small stream: Comparison of radar altimetry, LIDAR and photogrammetry techniques. Remote Sens. Environ. 2020, 237, 111487. [Google Scholar] [CrossRef]
  39. Iglhaut, J.; Cabo, C.; Puliti, S.; Piermattei, L.; O’Connor, J.; Rosette, J. Structure from Motion Photogrammetry in Forestry: A Review. Current Forestry Rep. 2019, 5, 155–168. [Google Scholar] [CrossRef]
  40. Hutchinson, M.F. A new procedure for gridding elevation and stream line data with automatic removal of spurious pits. J. Hydrol. 1989, 106, 211–232. [Google Scholar] [CrossRef]
  41. Zheng, X.; Hanjiang, X.; Yue, L.; Gong, J. An improved ANUDEM method combining topographic correction and DEM interpolation. Geocarto Int. 2015, 31, 492–505. [Google Scholar] [CrossRef]
  42. Arun, P.V. A comparative analysis of different DEM interpolation methods. Egypt. J. Remote Sens. 2013, 16, 133–139. [Google Scholar]
  43. Carthew, K.D.; Taylor, M.P.; Drysdale, R.N. Are current models of tufa sedimentary environments applicable to tropical systems? A case study from the Gregory River. Sediment. Geol. 2003, 162, 199–218. [Google Scholar] [CrossRef]
  44. Pedley, M.; Andrews, J.; Ordonez, S.; del Cura, M.A.G.; Martin, J.A.G.; Taylor, D. Does climate control the morphological fabric of freshwater carbonates? A comparative study of Holocene barrage tufas from Spain and Britain. Palaeogeogr. Palaeocl. 1996, 121, 239–257. [Google Scholar] [CrossRef]
  45. Tomaštík, J.; Mokroš, M.; Surový, P.; Grznárová, A.; Merganič, J. UAV RTK/PPK Method—An Optimal Solution for Mapping Inaccessible Forested Areas? Remote Sens. 2019, 11, 721. [Google Scholar] [CrossRef]
  46. Shiraishi, F.; Eno, Y.; Nakamura, Y.; Hanzawa, Y.; Asada, J.; Bahniuk, A.M. Relative influence of biotic and abiotic processes on travertine fabrics, Satonoyu hot spring, Japan. Sedimentology 2019, 66, 459–479. [Google Scholar] [CrossRef]
  47. Chen, J.; Zhang, D.D.; Wang, S.; Xiao, T.; Huang, R. Factors controlling tufa deposition in natural waters at waterfall sites. Sediment. Geol. 2004, 166, 353–366. [Google Scholar] [CrossRef]
  48. Qiao, X.; Xiao, Y.; Du, J.; Tang, Y.; Xiao, W.; Xinlei, Z.; Meng, Z. Tufa Landscapes in the Key Scenic Areas of the Jiuzhaigou Natural World Heritage Site: A Critical Review and Future Research Needs. J. Earth Environ. 2022, 50, 202–218. [Google Scholar]
  49. Lugli, S.; Tang, Y.; Reghizzi, M.; Qiao, X.; Schreiber, B.C.; Deng, G. Seasonal pattern in the high-elevation fluvial travertine from the Jiuzhaigou National Nature Reserve, Sichuan, southwestern China. J. Sediment. Res. 2017, 87, 253–271. [Google Scholar] [CrossRef]
  50. Qiao, X.; Du, J.; Lugli, S.; Ren, J.H.; Xiao, W.Y.; Chen, P.; Tang, Y. Are climate warming and enhanced atmospheric deposition of sulfur and nitrogen threatening tufa landscapes in Jiuzhaigou National Nature Reserve, Sichuan, China? Sci. Total Environ. 2016, 562, 724–731. [Google Scholar] [CrossRef]
  51. Zheng, X.; Tang, Y.; Du, J.; Lugli, S.; Xiao, Y.; Yang, Q.; Song, H.; Qiao, X. Enhanced soil erosion threatens fluvial tufa landscapes after an Ms 7.0 earthquake in the Jiuzhaigou World Heritage Site, southwestern China. Sci. Total Environ. 2022, 848, 157632. [Google Scholar] [CrossRef]
  52. Guo, K.; Li, Q.; Wang, C.; Mao, Q.; Liu, Y.; Zhu, J.; Wu, A. Development of a single-wavelength airborne bathymetric LiDAR: System design and data processing. ISPRS J. Photogramm. Remote Sens. 2022, 185, 62–84. [Google Scholar] [CrossRef]
  53. Lin, J.; Chen, D.; Yang, S.; Liao, X. Precise aboveground biomass estimation of plantation forest trees using the novel allometric model and UAV-borne LiDAR. Front. For. Glob. Change 2023, 6, 1166349. [Google Scholar] [CrossRef]
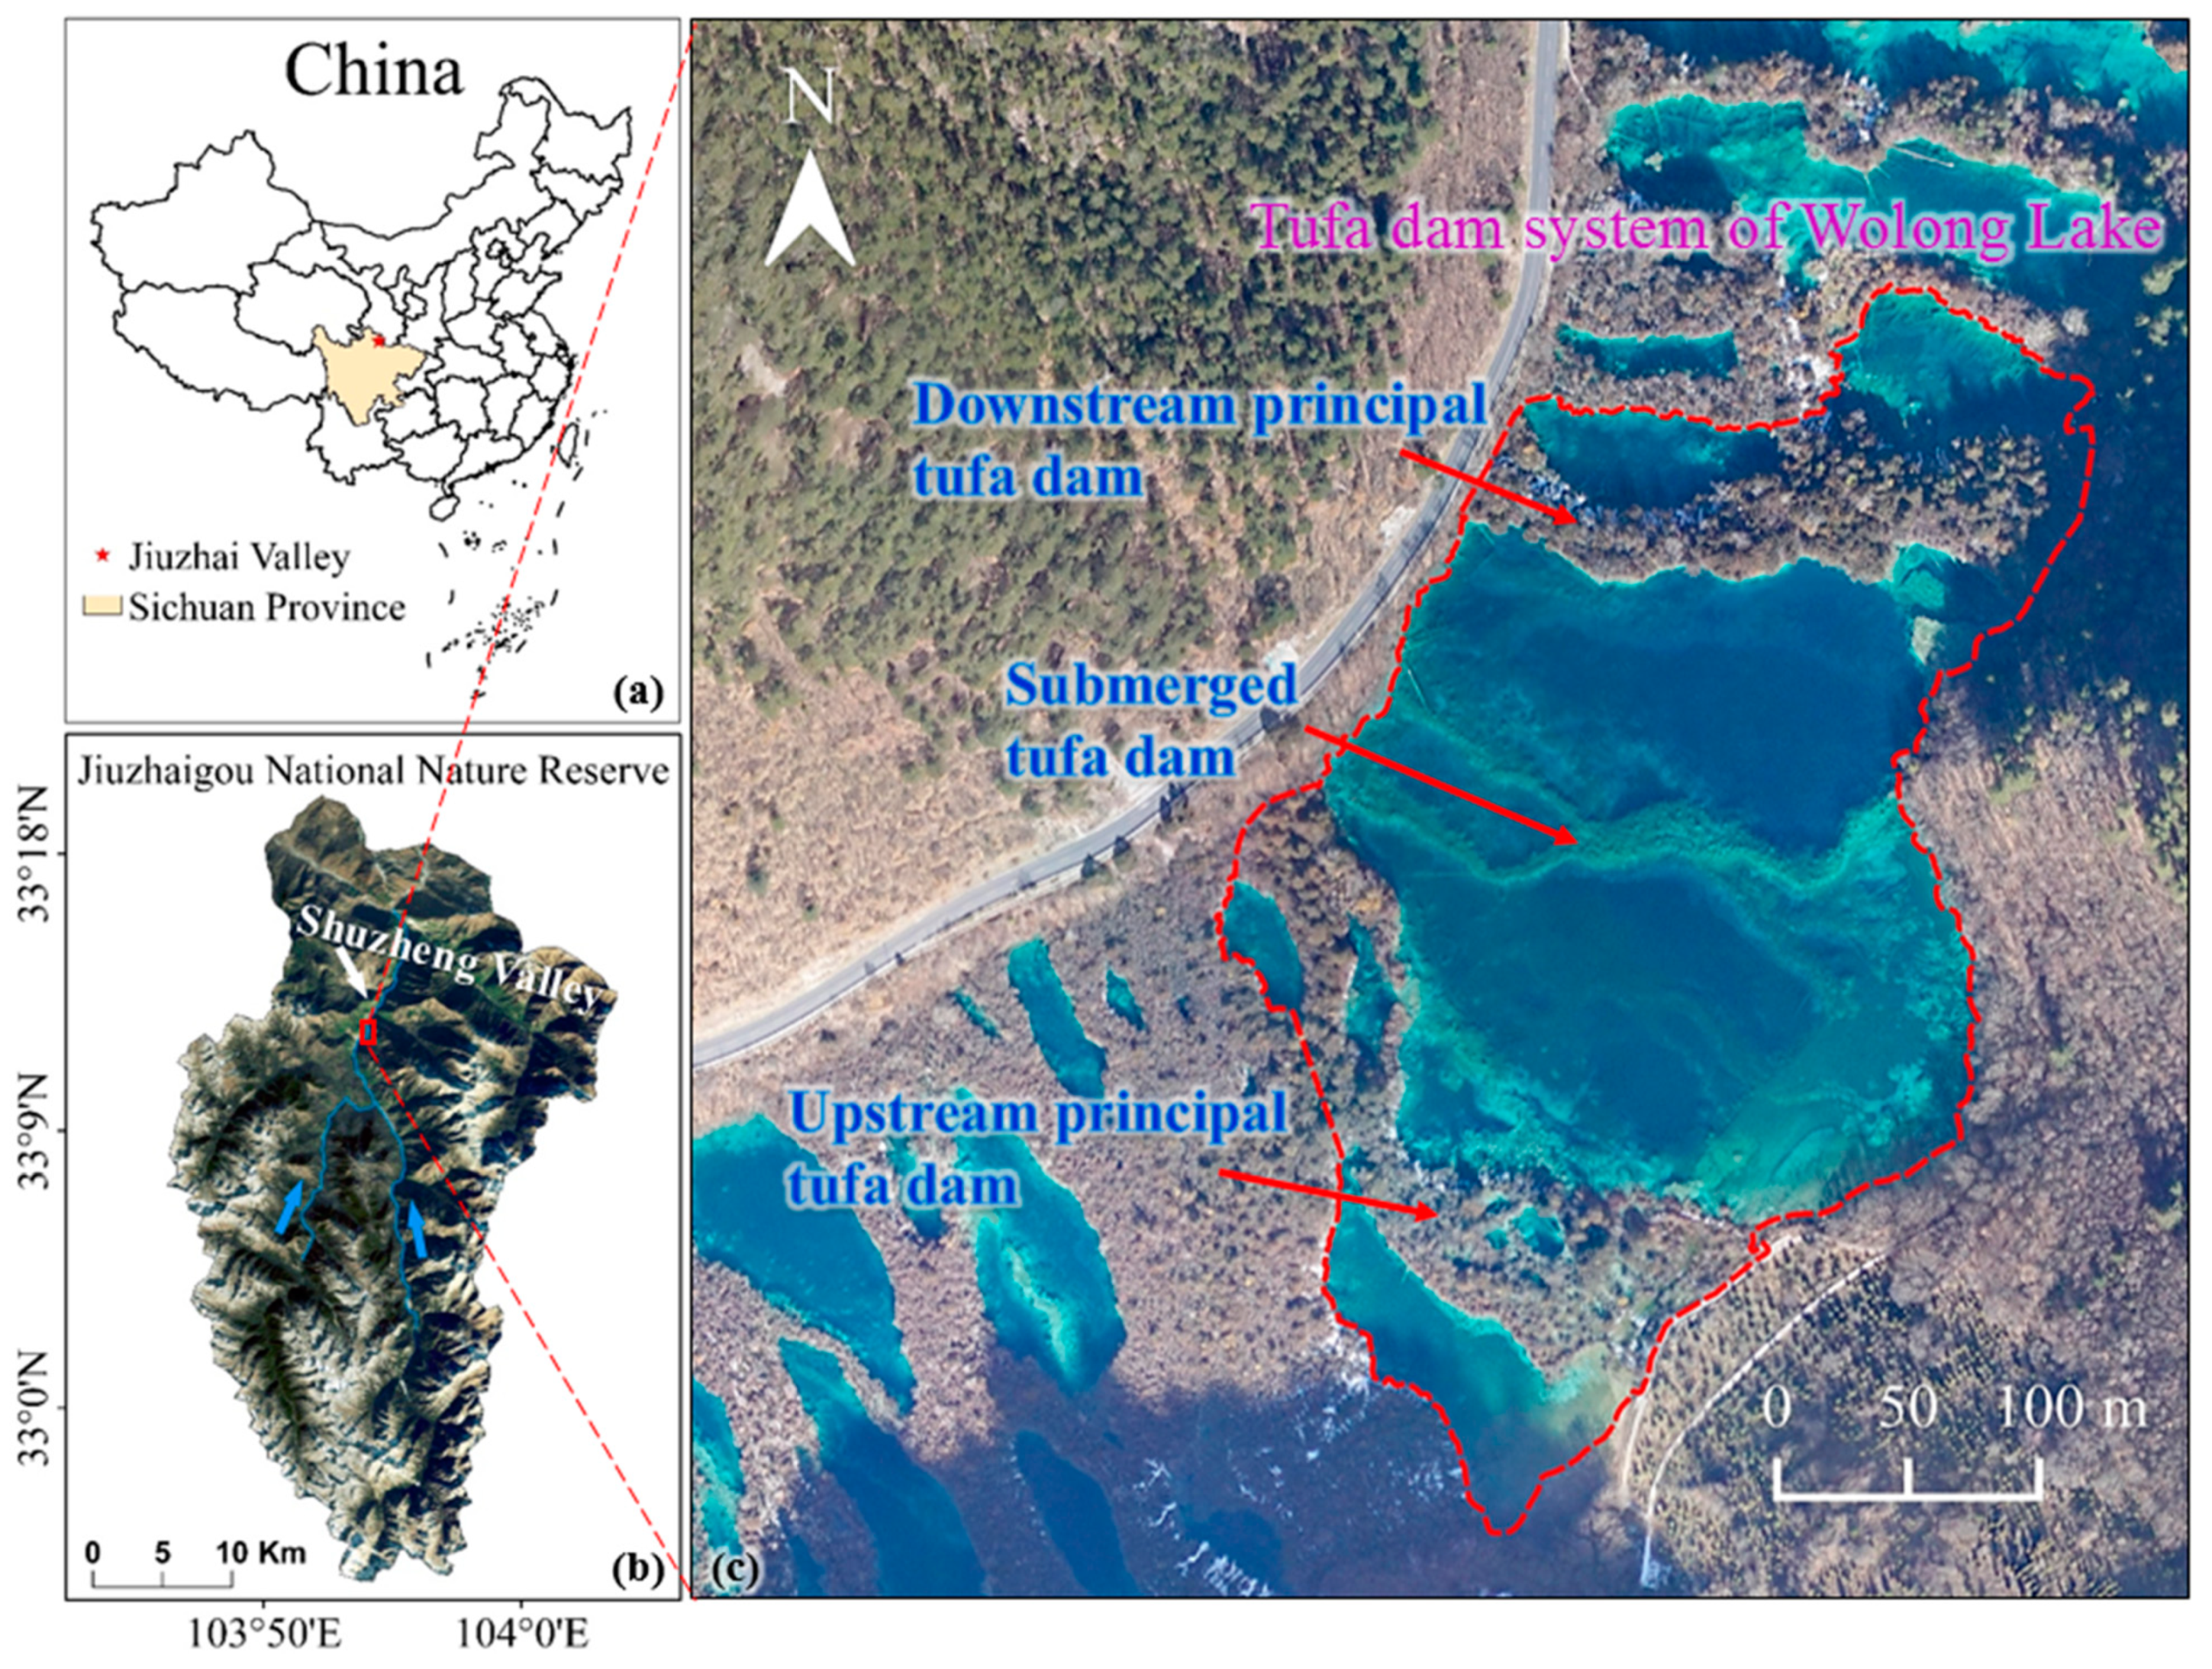
Figure 1. (a) The study site is located in Sichuan Province, China; (b) Jiuzhaigou National Nature Reserve; (c) the tufa dam system of Wolong Lake.
Remotesensing 16 03839 g001
Figure 2. The workflow for modelling and analyzing dam system of a tufa lake using UAV digital photogrammetry.
Remotesensing 16 03839 g002
Figure 3. Deviated underwater terrain caused by refraction of light at the interface of water and air.
Remotesensing 16 03839 g003
Figure 4. The resulting DEM of above-water tufa dam using ground interpolation based on the initial DSM from SfM-MVS processing.
Remotesensing 16 03839 g004
Figure 5. The centerline of a water channel is obtained using Voronoi-based median axis extraction algorithm. (a) The discrete points sampled on both sides of the water channel; (b) the generated Thiessen polygons; (c) the resulting centerline of the water channel.
Remotesensing 16 03839 g005
Figure 6. (a) Delineated boundaries of above-water and underwater parts of study site; (b) the initial DSM of study site were divided into above-water and underwater parts; (c) the spatial scopes of UD, SD, and DD delineated out on the complete DEM of study site.
Remotesensing 16 03839 g006
Figure 7. The complete DEM of the study site by stitching the resulting DEMs after refraction correction and ground interpolation. (a) The initial underwater DSM; (b) the resulting DEM via refraction correction; (c) the initial above-water DSM; (d) the resulting DEM removed of vegetation; (e) the complete DEM of the study site.
Remotesensing 16 03839 g007
Figure 8. (a) Thiessen polygons of the fluvial channel of Wolong Lake; (b) extracted centerline of the fluvial channel of Wolong Lake; (c) extracted three centerlines for deriving elevation profiles.
Remotesensing 16 03839 g008
Figure 9. Longitudinal elevation profiles of the tufa dam system belonging to Wolong Lake. (a) Elevation profile along the left centerline; (b) elevation profile along the middle centerline; (c) elevation profile along the right centerline.
Remotesensing 16 03839 g009
Figure 10. (a) Schematic diagram of downstream-dipping ramp; (b) schematic diagram of downstream-overhanging crest with tufa stalactites; (c) the real scenery of the downstream tufa dam of Wolong Lake; (d) the stepped terrain where the downstream tufa dams formed. (a,b) adapted from Carthew et al. [43].
Remotesensing 16 03839 g010
Table 1. Dimension data of the submerged tufa dam in the three elevation profiles.
Section of Submerged Tufa DamDam Height (m)Dam Width (m)Distance from Crest to Water Surface (m)
Left-principal5.619.33.9
Left-secondary3.418.75.0
Middle10.436.83.0
Right12.225.03.6
Table 2. Dimension data of the upstream and downstream tufa dam in the three elevation profiles.
Metrics for Tufa DamUpstream DamDownstream Dam
LeftMiddleRightLeftMiddleRight
Crest width (m) 24.78.356.715.929.433.5
Height of EDW (m)5.64.33.93.56.714.7
Height of TDW (m)10.610.411.012.315.723.9
Disclaimer/Publisher’s Note: The statements, opinions and data contained in all publications are solely those of the individual author(s) and contributor(s) and not of MDPI and/or the editor(s). MDPI and/or the editor(s) disclaim responsibility for any injury to people or property resulting from any ideas, methods, instructions or products referred to in the content.