Article

Experimental Analysis of Terahertz Wave Scattering Characteristics of Simulated Lunar Regolith Surface

1
Terahertz Technology Research Center, National Institute of Information and Communications Technology, 4-2-1, Nukui-Kitamachi Koganei, Tokyo 1848795, Japan
2
Graduate School of Education, Tokyo Gakugei University, 4-1-1, Nukui-Kitamachi Koganei, Tokyo 1848501, Japan
*
Author to whom correspondence should be addressed.
Remote Sens. 2024, 16(20), 3819; https://doi.org/10.3390/rs16203819
Submission received: 26 August 2024 / Revised: 25 September 2024 / Accepted: 12 October 2024 / Published: 14 October 2024
(This article belongs to the Special Issue Future of Lunar Exploration)

Abstract

:
This study investigates terahertz (THz) wave scattering from a simulated lunar regolith surface, with a focus on the Brewster feature, backscattering, and bistatic scattering within the 325 to 500 GHz range. We employed a generalized power-law spectrum to characterize surface roughness and fabricated Gaussian correlated surfaces from Durable Resin V2 using 3D printing technology. The complex dielectric permittivity of these materials was determined through THz time-domain spectroscopy (THz-TDS). Our experimental setup comprised a vector network analyzer (VNA) equipped with dual waveguide frequency extenders for the WR-2.2 band, transmitter and receiver modules, polarizing components, and a scattering chamber. We systematically analyzed the effects of root-mean-square (RMS) height, correlation length, dielectric constant, frequency, polarization, and observation angle on THz scattering. The findings highlight the significant impact of surface roughness on the Brewster angle shift, backscattering, and bistatic scattering. These insights are crucial for refining theoretical models and developing algorithms to retrieve physical parameters for lunar and other celestial explorations.

1. Introduction

Planetary surfaces are crucial boundaries where the outer layers of celestial bodies, whether solid or liquid, interact with the atmosphere or vacuum of space through complex processes [1]. To investigate these surfaces, a diverse array of remote sensing instruments, such as radars [2], radiometers [3,4], visible/infrared (IR) spectroscopy [5], and hyperspectral spectrometers [6], have been used to uncover their geomorphological and physicochemical properties. One of the most crucial features of planetary surfaces is their roughness, which significantly impacts observational datasets from radar backscattering [2], thermal emission [7], optical reflectivity [8], and spectral radiance [9]. Surface roughness does more than merely describe the texture of a planetary surface; it plays a pivotal role in shaping interactions between the surface and remote sensing technologies. Therefore, accurately accounting for the effects of surface roughness is essential when interpreting remote sensing data from planetary surfaces.
The search for lunar water ice is a key focus of global lunar exploration efforts. Recent research highlights how the roughness of the lunar surface, along with the shadows it casts, may serve as hidden reservoirs for water ice, potentially covering extensive areas [10]. Building on this hypothesis, Davidsson and Rickman [11] developed a thermophysical model that includes surface roughness to analyze the infrared spectral energy distributions of celestial bodies, including the Moon. This model demonstrates how surface roughness can affect the thermal emissions of various objects within the solar system, such as Main Belt Asteroids [12], the Martian moons Deimos and Phobos [13], Mercury [14], and near-Earth asteroids [15]. Additionally, Hayne [16] emphasized the role of surface roughness in revising the thermophysical models used to estimate water traps on the Moon. Parallel to these theoretical developments, Bandfield [17] analyzed observation data from the LRO Diviner radiometer, noting that the Moon’s anisothermal nature is largely due to its surface roughness. Beyond passive observations, active observations are also crucial for detecting lunar water ice. For example, Fa and Wieczorek [18] investigated the effect of surface roughness on scattering under Arecibo P-band radar observation. Liu [19] highlighted that surface roughness could influence anomalies in circular polarization ratio (CPR) data collected from mini-SAR and mini-RF instruments, indicating the presence of lunar water ice. Understanding the interaction of electromagnetic waves with the lunar surface, while considering surface roughness, is essential for accurately detecting and mapping water ice on the Moon.
The use of terahertz (THz) waves has gained significant attention in the search for water ice on the Moon [20], addressing a critical probing gap in lunar exploration. THz waves [21] are particularly advantageous due to their sensitivity to the dielectric properties of [22], making them suitable for detecting water ice and other subsurface features. By monitoring the THz wave brightness temperature and backscattering from the Moon, we can accurately retrieve key physical parameters of the lunar surface and subsurface, such as the dielectric constant, water ice content, and surface roughness. This study primarily focuses on exploring THz scattering from the simulated lunar regolith surface through experimental analysis, specifically examining the effects of surface roughness on both backscattering and bistatic scattering within the THz frequency range. Understanding THz wave scattering from rough surfaces is essential not only for planetary remote sensing but also for advancing future communication technologies [23]. While the application of THz sensing for planetary exploration and communication is still in its early stages, several experiments have already been conducted to evaluate selected scattering models for rough surfaces. These models include the Kirchhoff approximation (KA) [24], the integral equation model (IEM) [25], and the advanced integral equation model (AIEM) [26]. For instance, Grossman [27] investigated bistatic scattering from random rough surfaces and compared two selected scattering models, the (modified) integral equation method (IEM-B) [28] and the generalized Harvey–Shack (GHS) model [29], with experiments conducted over the 325–500 GHz range and at 650 GHz. Ma [30] explored diffuse bistatic scattering of a modulated THz beam on metallic rough surfaces to examine surface roughness effects on non-line-of-sight (NLOS) wireless data links at frequencies of 100 GHz and above. The dependence of the scattering patterns on surface roughness parameters, including RMS height and correlation length, was examined and found to be consistent with IEM predictions. Amarasinghe [31] studied THz wave propagation in snow both theoretically and experimentally, selecting Mie scattering to fit the measured data. Alissa [32] conducted experimental measurements of THz scattering from non-Gaussian rough surfaces and compared the results with full-wave simulations. Previous experimental research has advanced the understanding of THz scattering from rough surfaces through a comparison of selected scattering models. However, the necessity for a more comprehensive study of THz scattering from rough surfaces, including polarization analysis, Brewster features, backscattering, and bistatic scattering, serves as the motivation for this article.
In this article, we present an experimental analysis of THz wave scattering from simulated lunar regolith surface. Our long-term objective is to develop an experimental database to enhance the understanding of interactions between planetary surfaces and THz waves within the THz frequency range, thereby supporting the interpretation of remote sensing data in the near future. Specifically, we focus on Gaussian correlated surfaces, based on the dielectric properties of simulated lunar regolith samples returned from previous missions, and design surface roughness that spans a wide range of comparable THz wavelengths to investigate the THz characteristics of simulated lunar regolith surfaces. This article is structured as follows: Section 2 describes the roughness spectrum and dielectric properties used to characterize the simulated lunar regolith surface. Section 3 elaborates on THz scattering measurements on rough surfaces, including the preparation and validation of rough surfaces, system configuration, and calibration. Section 4 details the results and discussion. Finally, Section 5 summarizes the conclusions.

2. Lunar Regolith Surface Characterization

In characterizing the lunar surface [33], we focus on two primary factors: surface roughness and dielectric property. Both are pivotal in determining scattering behavior and surface emissivity.

2.1. Surface Roughness Spectrum

The generalized power law spectrum [34] is selected to characterize surface roughness due to it can naturally reduce to the spectra of Gaussian and exponential correlation functions. This adaptability allows it to cover a wider range of roughness scales, making it particularly suitable for describing the diverse geological features of lunar surfaces. For a given geological unit of the lunar surface, the generalized power law spectrum is given by the following:
S ( k ) = i = 1 N σ i 2 l x i l y i 4 π ( p i 1 ) a p i 2 b p i 2 1 + a p i 2 ( k x 2 l x i 2 + k y 2 l y i 2 ) 4 b p i 2 p i
where  σ i  denotes the RMS height for the i-th scale,  l x i  and  l y i  represent the correlation lengths in the x and y directions for the i-th scale,  k x  and  k y  are the wave numbers in the x and y directions,  p i  is the power index determining the type of spectra for the i-th scale, and  a p i  and  b p i  are parameters for the i-th scale given by the following:
a p i = Γ ( p i 0.5 ) Γ ( p i )
2 b p i a p i p i 0.5 K p i 0.5 2 b p i a p i = 2 p i 1.5 Γ ( p i 0.5 ) exp 1
where  K p i 0.5  is the modified Bessel function of the second kind.
The corresponding correlation function is given by the following:
C ( τ x , τ y ) = i = 1 N σ i 2 2 2 p i 2 Γ ( p i 1 ) 2 b p i τ x 2 + τ y 2 a p i l x i 2 + l y i 2 p i 1 K p i 1 2 b p i τ x 2 + τ y 2 a p i l x i 2 + l y i 2
where  τ x  and  τ y  are the lag distances in the x and y directions, respectively.

2.2. Dielectric Property

According to the experimental analyses of the Apollo lunar samples reported in the Lunar Sourcebook [33], the relative dielectric constant of lunar regolith is dependent on density, as expressed by the following:
ϵ z = 1 . 919 ρ z
where  ρ  is the bulk density in  g   c m 3 .
The loss tangent is related to both bulk density and the abundance S of the mineralogical composition (i.e.,  F e O + T i O 2 ) of the lunar regolith, as given by the following:
tan δ z = 10 0.038 S + 0.312 ρ z 3.26
where S ranges from 0% to 30% [33], reflecting typical compositional variations observed in lunar samples. This relationship is crucial for understanding how the regolith absorbs and dissipates electromagnetic energy, particularly in remote sensing applications where different wavelengths, including THz, are used to probe surface and subsurface features.

3. Experimental Measurements from the Rough Surface at 325 GHz to 500 GHz

In this section, we present experimental measurements conducted on rough surfaces within the frequency range of 325 GHz to 500 GHz. We begin by analyzing Gaussian-correlated surfaces characterized by specific statistical parameters. The surface roughness scales are designed to be comparable to the THz wavelength, typically ranging from  100 μ m  to  1 mm . The dielectric properties are approximated based on those of lunar regolith, with a real part of permittivity ( ε ) between 1.3 and 2.8, and a loss tangent ( tan δ ) of 0.01 to 0.05.

3.1. Wave Scattering Geometry

Figure 1 illustrates the geometry of wave scattering from a rough surface. The incident and scattered wave vectors are defined as follows:
k i x = k s i n θ i c o s ϕ i k i y = k s i n θ i c o s ϕ i k i z = k c o s θ i
k s x = k s i n θ s c o s ϕ s k s y = k s i n θ s c o s ϕ s k s z = k c o s θ s
where k is the wave number,  θ i  and  ϕ i  are the incident angles, and  θ s  and  ϕ s  are the scattering angles in spherical coordinates. Backscattering refers to the special case where the scattered wave returns in the same direction as the incident wave, i.e., when  θ i = θ s  and  ϕ i = ϕ s . Bistatic scattering, on the other hand, refers to when the scattered wave is reflected in a different direction, where  θ s θ i  or  ϕ s ϕ i .

3.2. Scattering Target

3.2.1. Rough Surface Generation

To simulate the surface roughness of the lunar regolith, we generate eight Gaussian-correlated surfaces using the Monte Carlo method, varying the RMS heights and correlation lengths. These surfaces follow a power-law spectrum, which naturally reduces to a Gaussian correlation function by assigning infinite values to  a p i  and  b p i . For a rough surface with dimensions  L x × L y , the height distribution is expressed as follows:
h ( x i , y j ) = 1 L x L y m = M 2 + 1 M 2 n = N 2 + 1 N 2 H ( k m , k n ) e i ( k m x i + k n y j )
where  k m = 2 π m L x  and  k n = 2 π n L y ; M and N are the sampling points in the x and y directions, respectively.
The Fourier coefficients  H ( k m , k n )  are determined as follows:
H ( k m , k n ) = 2 π L x L y P ( k m , k n ) · [ G ( 0 , 1 ) + i G ( 0 , 1 ) ] 2 , if m 0 or n 0 G ( 0 , 1 ) + i G ( 0 , 1 ) , if m = 0 and n = 0
where  G ( 0 , 1 )  is a standard Gaussian random variable.  P ( k m , k n )  represents the power spectral density PSD of the surface roughness in the frequency domain.
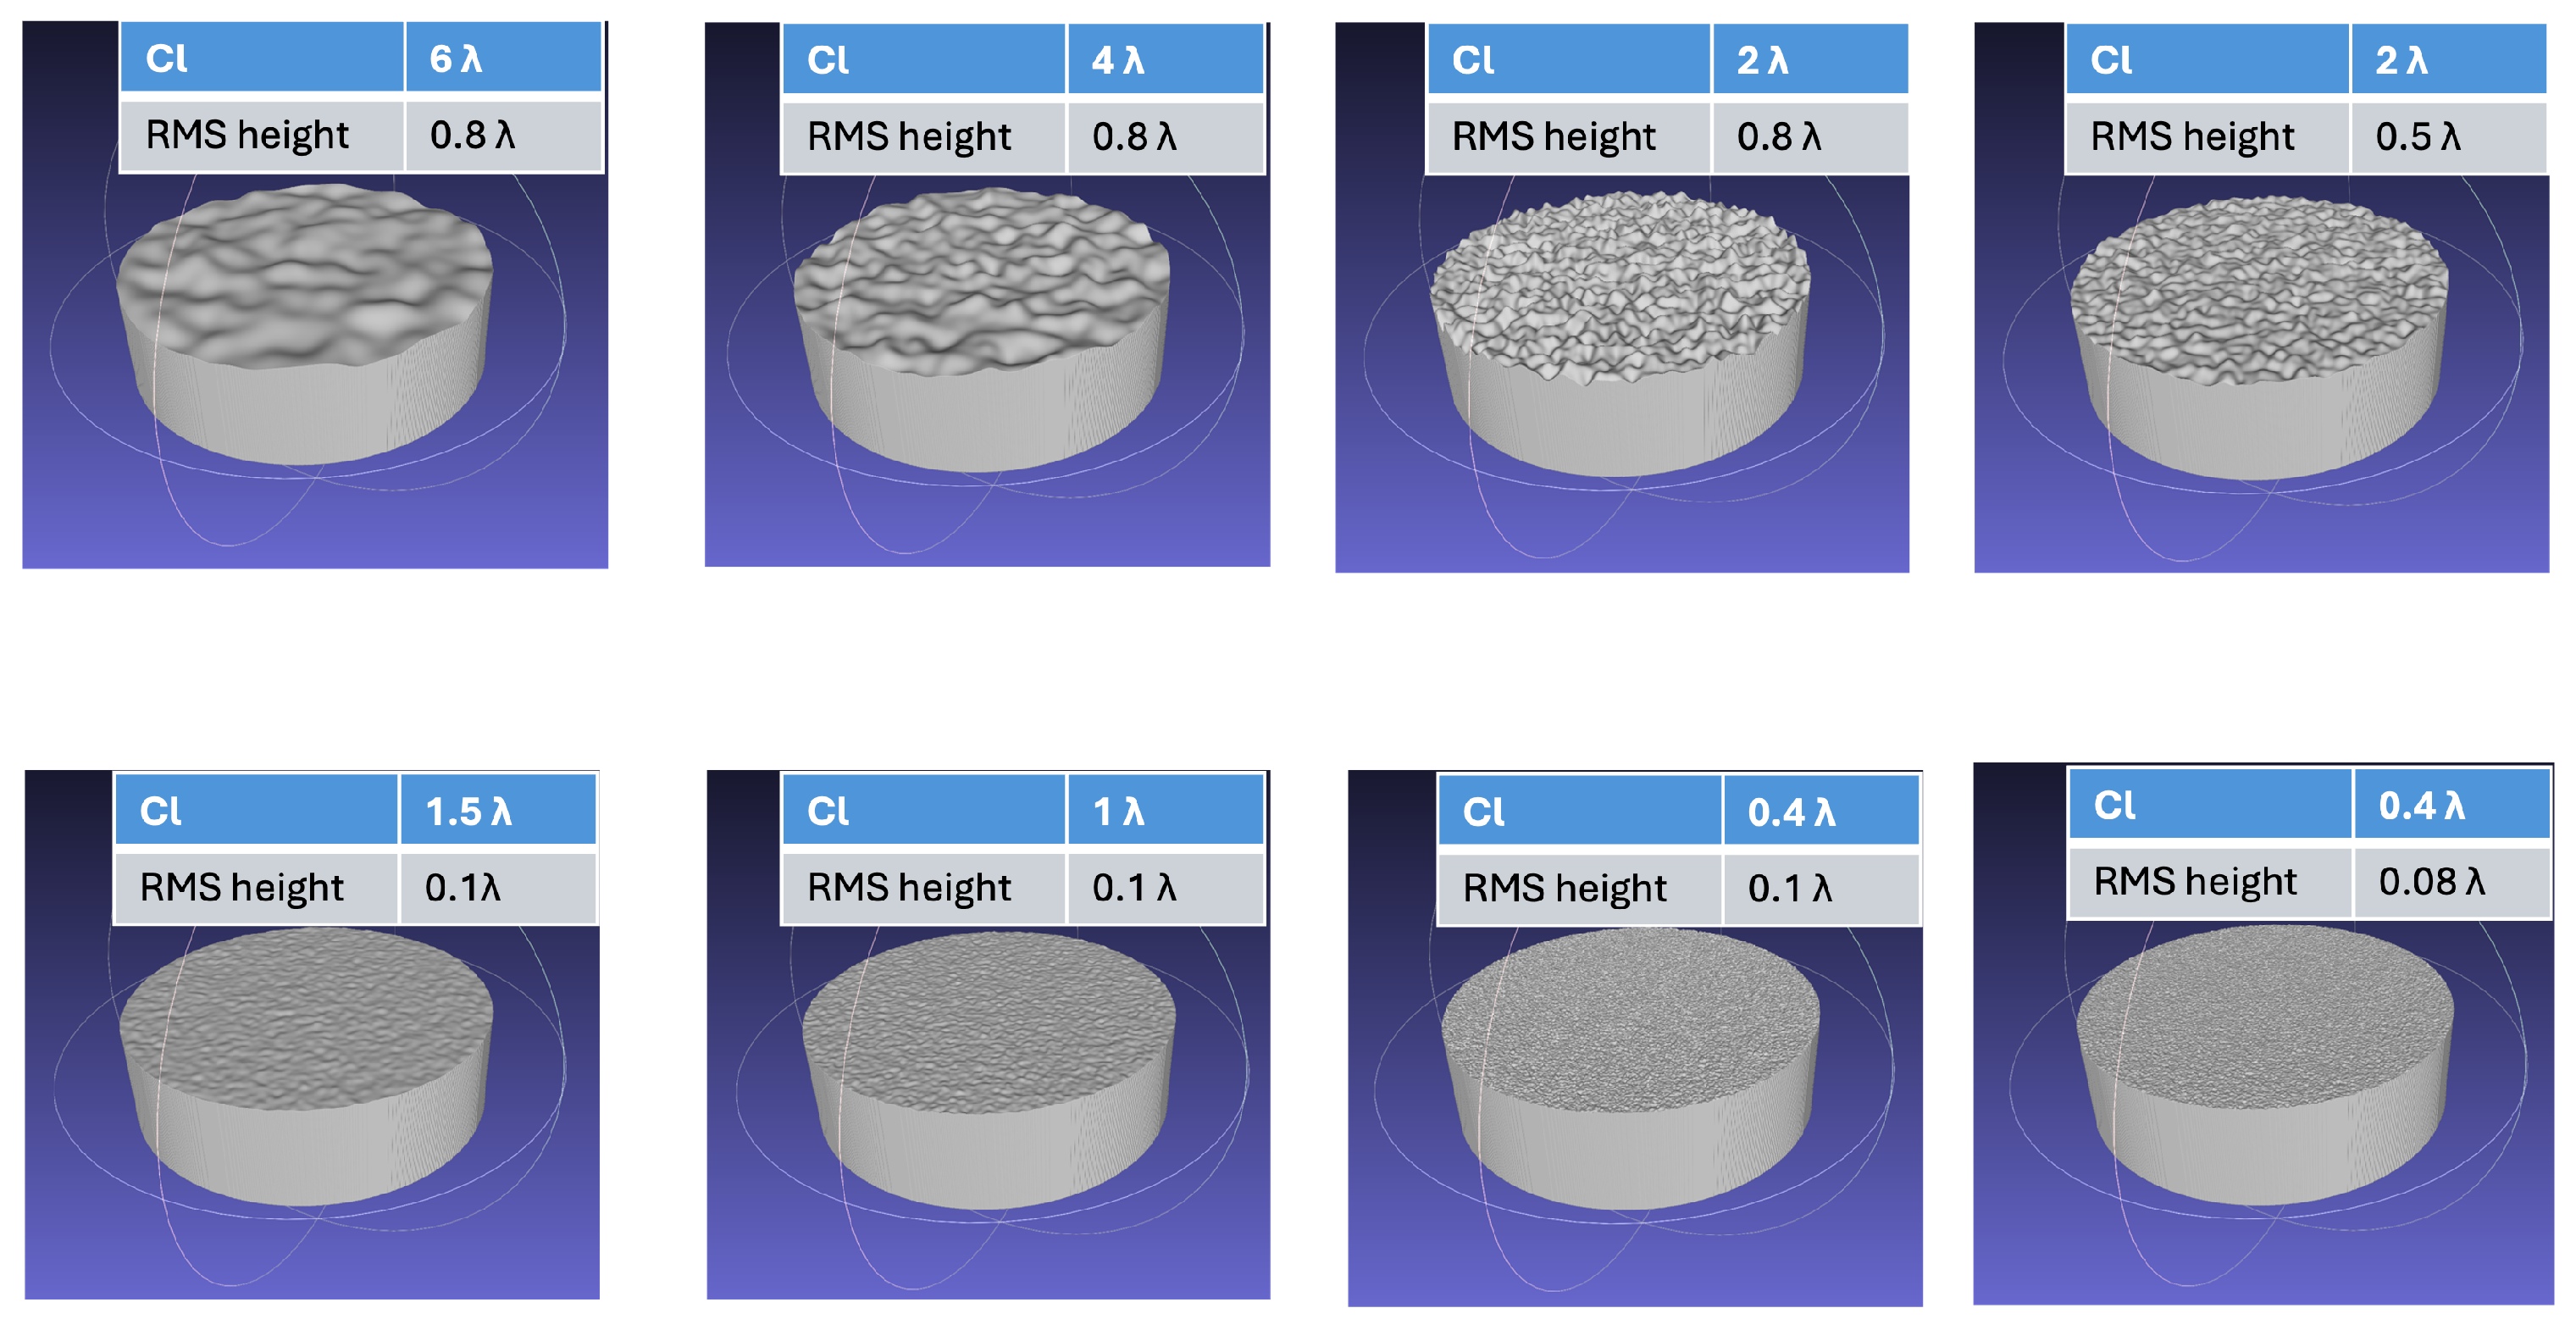
Rough surfaces simulating lunar regolith are generated using the power spectral density function through digital filtering techniques. The roughness parameters of these surfaces, expressed in wavelengths  λ , are presented in Figure 2. We focus on THz scattering from Gaussian-correlated surfaces at 480 GHz, corresponding to a wavelength of 0.625 mm. To facilitate the experiment, we shape the rough surface samples into cylinders, as illustrated in Figure 2. These samples, which simulate the surface roughness of lunar regolith, are then converted into stereolithography 3D models, enabling their fabrication through 3D printing technology.

3.2.2. Validation of Dielectric Property and Surface Roughness

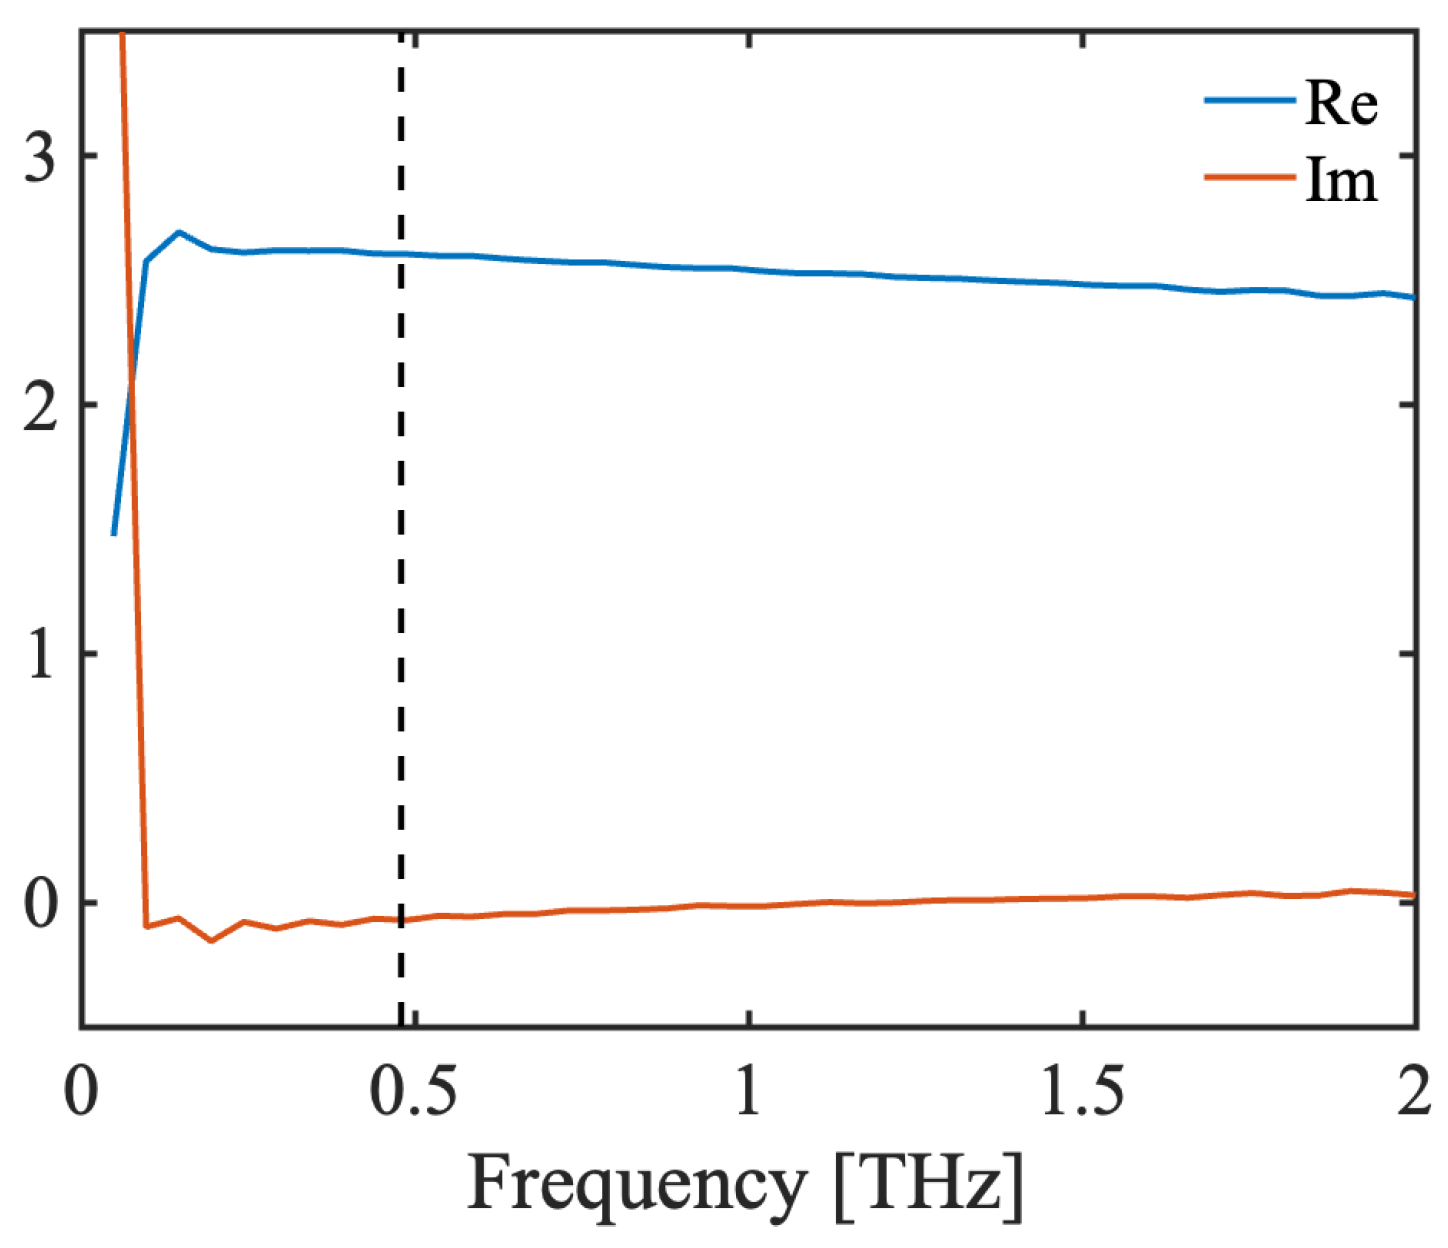
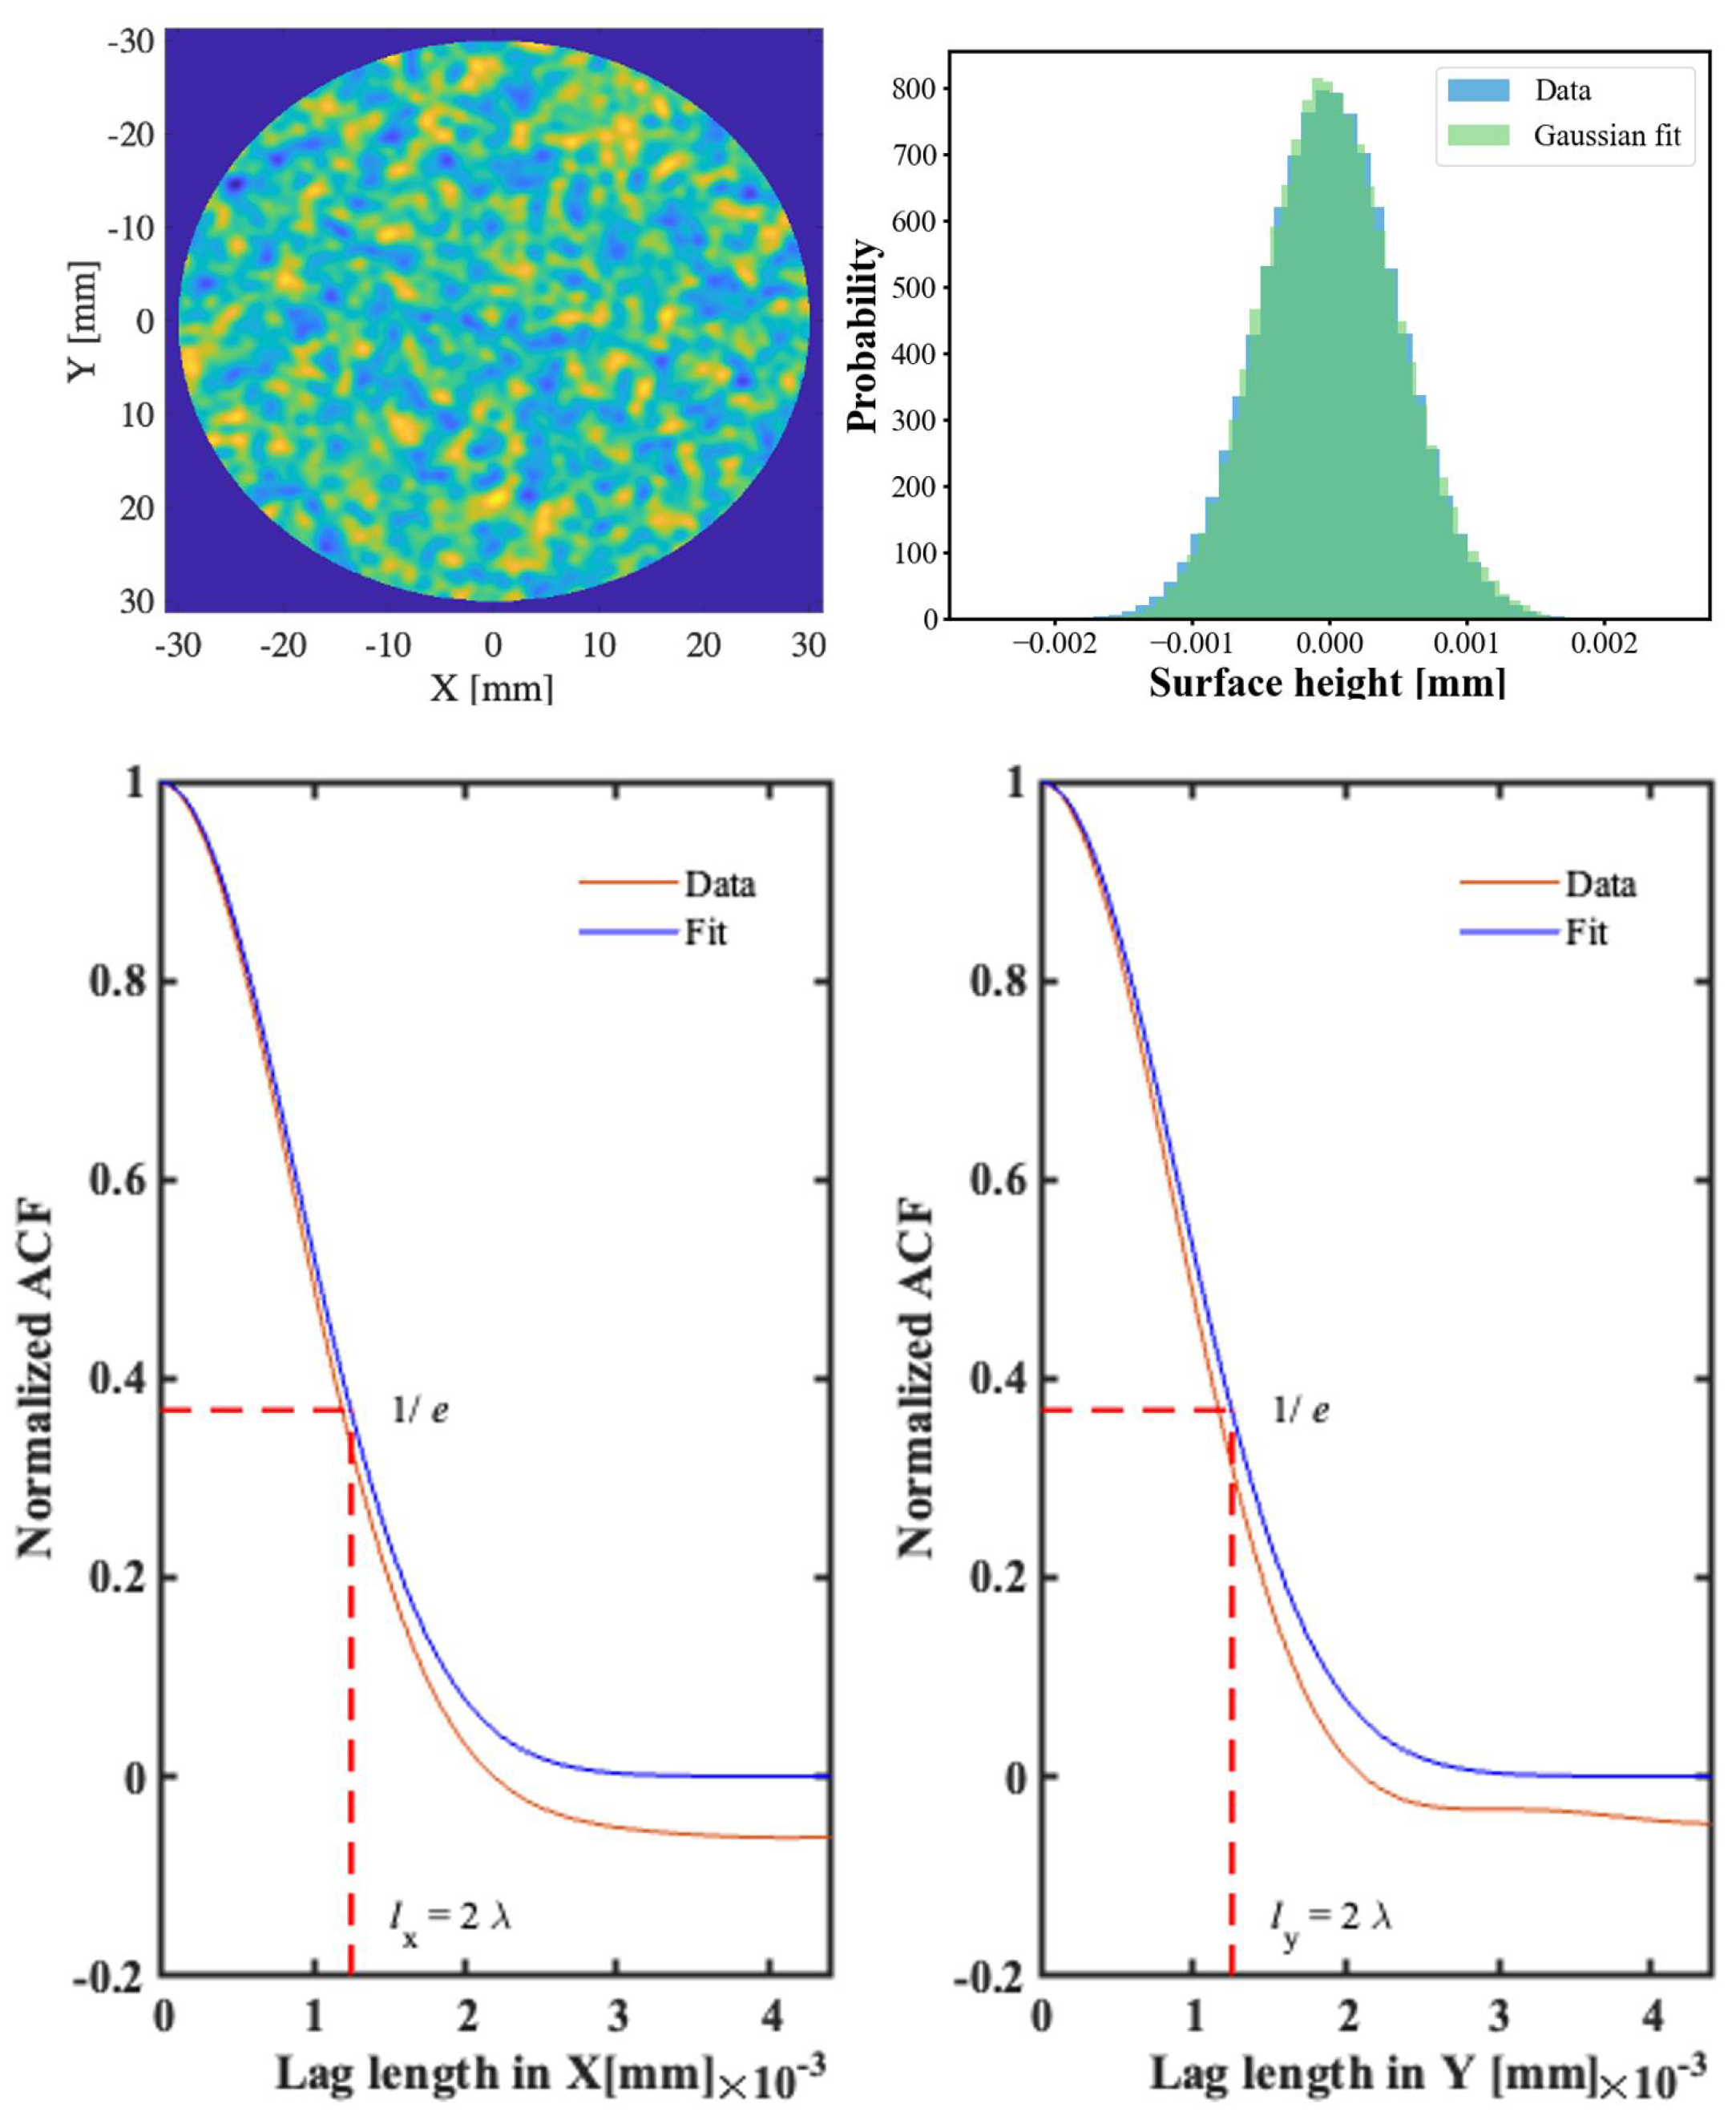
To ensure the reliability of our experiment, we rigorously validate the rough surface samples, focusing on both their dielectric properties and surface roughness. First, we determine the dielectric constant of the material using THz-TDS [35], a reliable method for measuring the dielectric properties of homogeneous materials by analyzing how THz pulses interact with the sample. Each measurement is conducted three times to guarantee robustness and reliability. The averaged real and imaginary parts of the measured dielectric constant at 480 GHz are 2.59 and 0.16, respectively, closely matching the dielectric properties of lunar regolith as recorded by the Luna, Apollo, and Chang’E missions, as depicted in Figure 3, where the orange line represents the imaginary part of the dielectric constant for the material under test, while the blue line corresponds to the real part. Following the validation of dielectric properties, we perform statistical comparisons between the generated Gaussian-correlated surfaces and their theoretical Gaussian fits to ensure accuracy. Additionally, we calculate the auto-correlation function in both the x- and y-directions and compare it with the theoretical correlation length. For clarity, we present the roughness validation results of one selected Gaussian-correlated surface with an RMS height of 0.8 λ  and a correlation length of 2 λ  in Figure 4. Once validated, we use a 3D printer to manufacture the prescribed rough surface samples using Durable Resin V2, a photopolymer material specifically engineered for stereolithography 3D printing. With a density of approximately 1.3  g   c m 3 , Durable Resin V2 ensures material homogeneity rather than a composite [36]. This comprehensive validation process ensures that the dielectric properties and surface roughness of our samples closely approximate those of the lunar regolith, making them suitable for investigating the THz wave characteristics of the lunar surface.

3.3. Experimental Setup

3.3.1. System Configuration

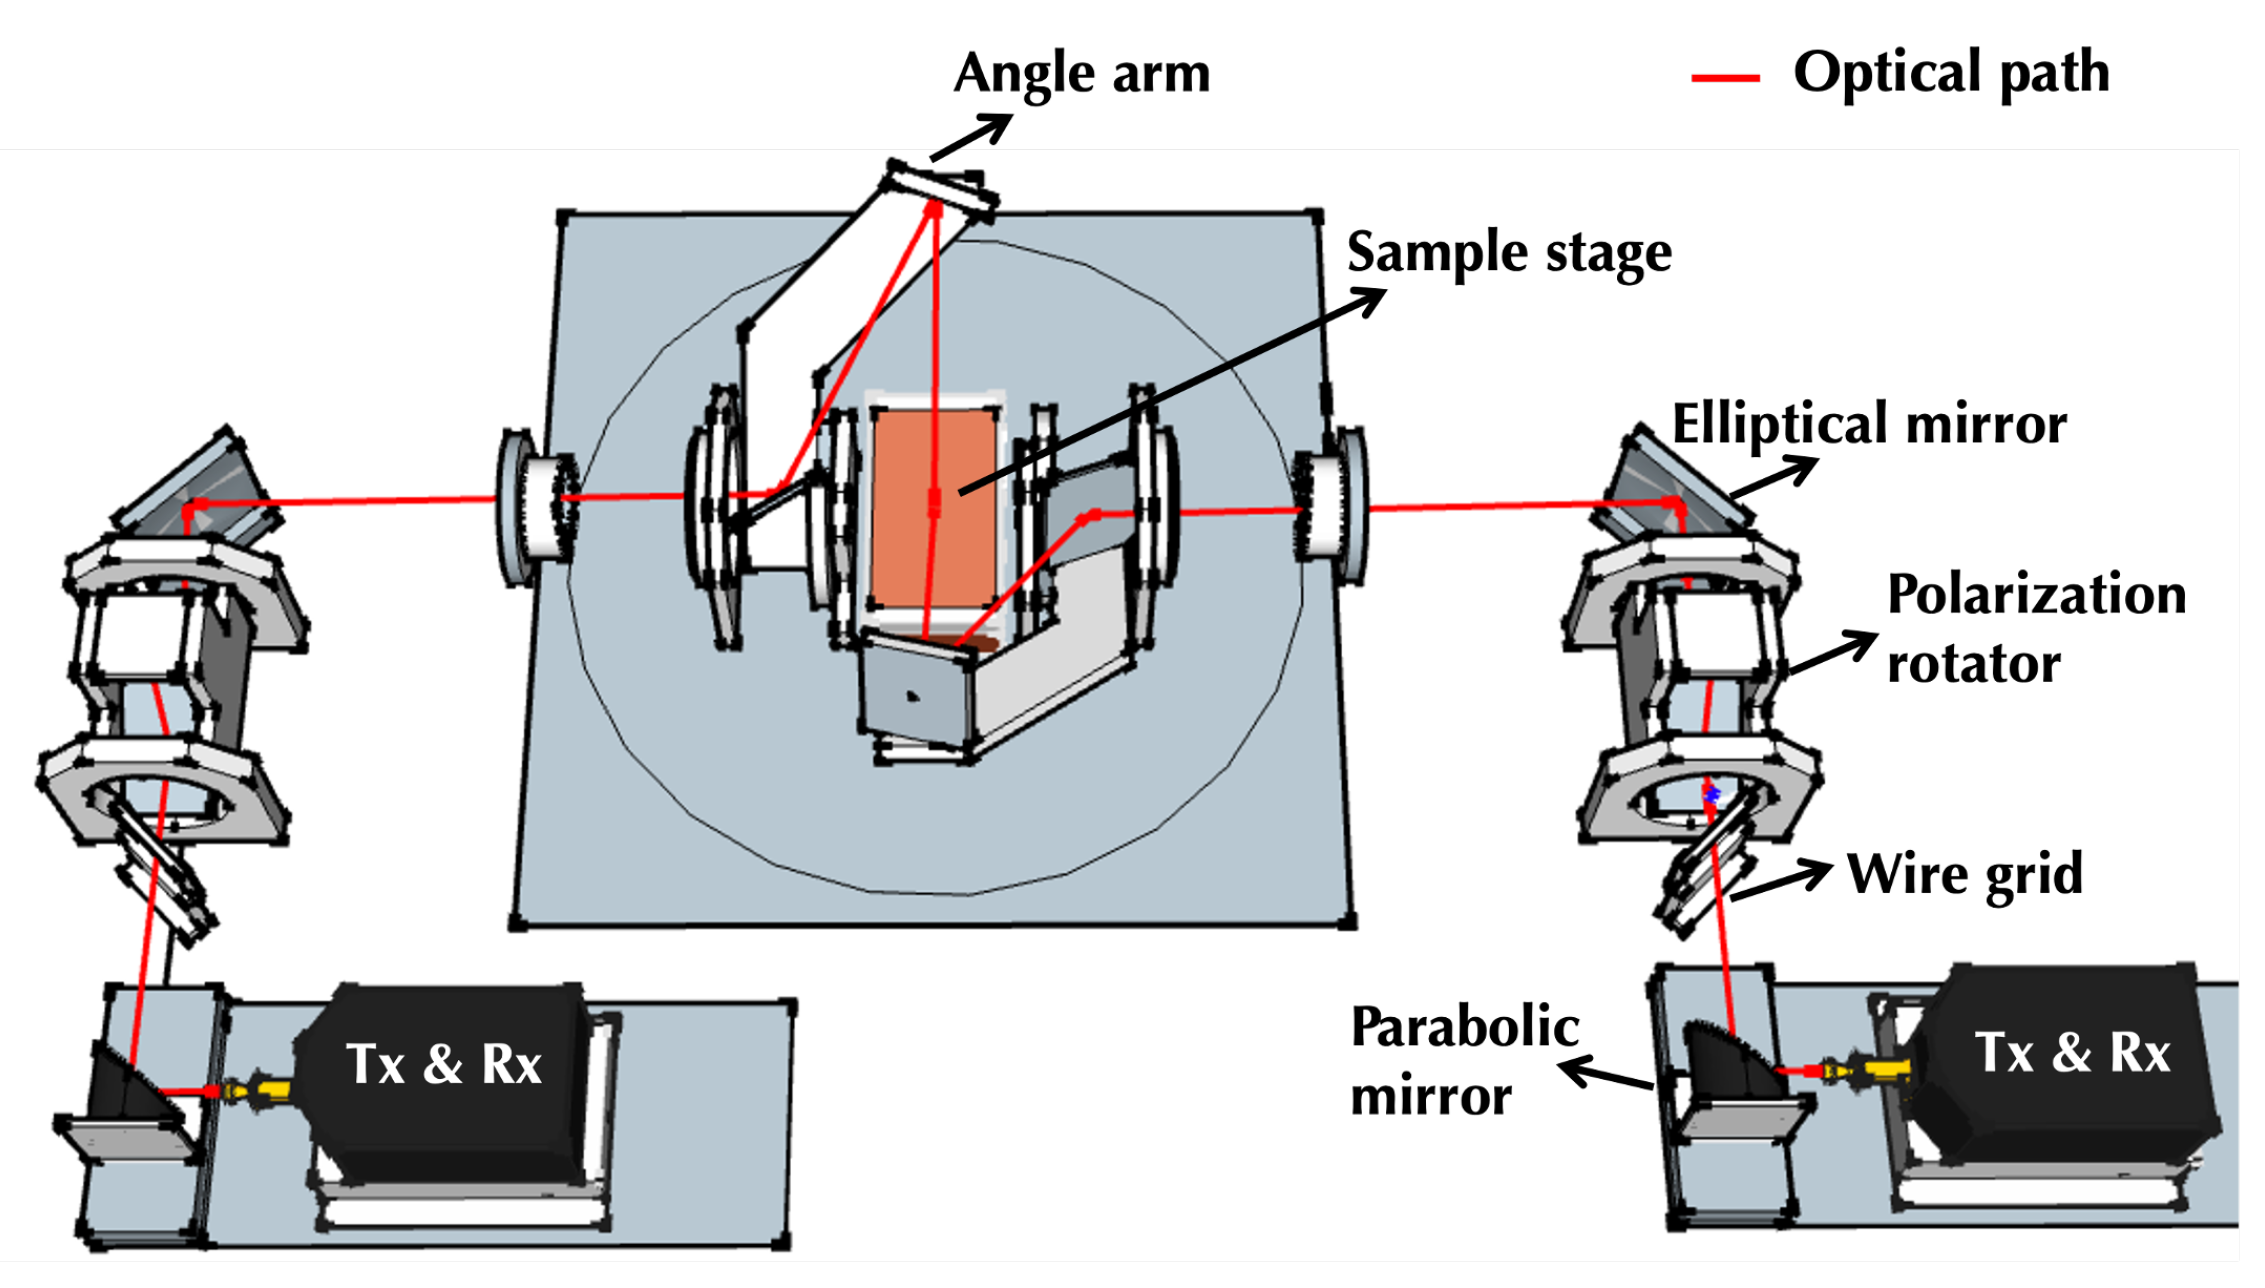
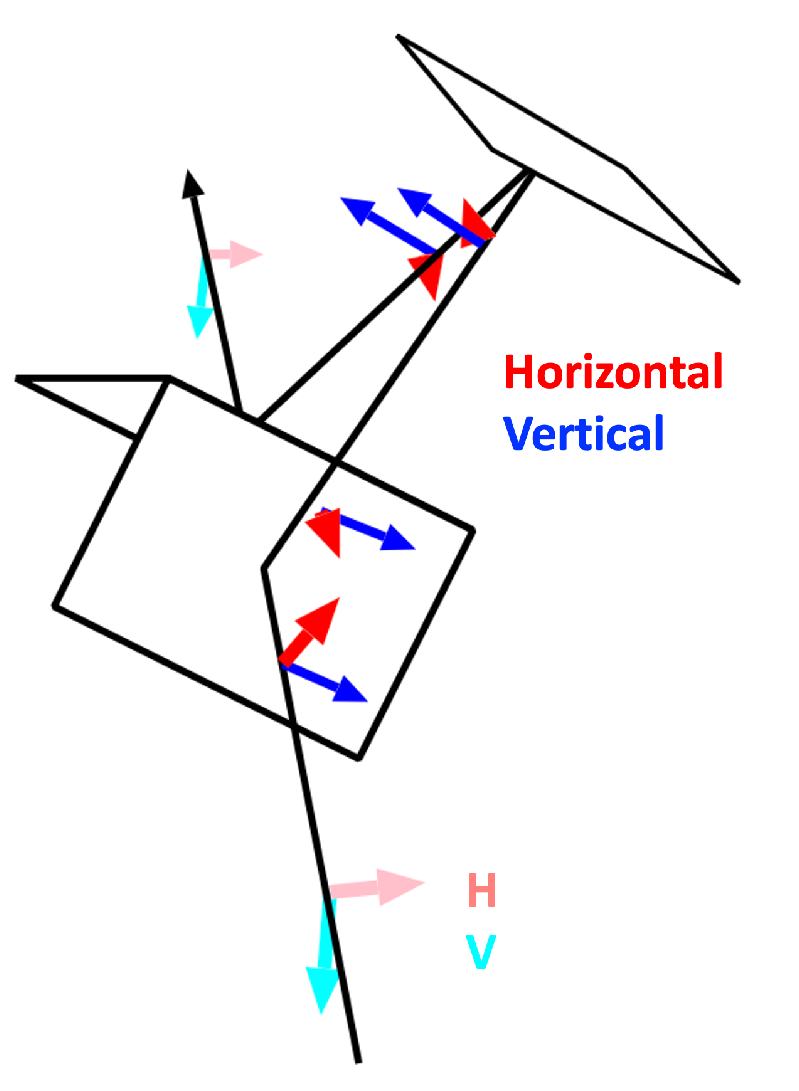
Figure 5 presents a schematic overview of the scattering system utilized in our study. This system employs a PNA-X network analyzer (Keysight Technology, Santa Rosa, CA, USA, N5247A) equipped with dual waveguide frequency extenders for the WR-2.2 band, covering a frequency range of 325 to 500 GHz. For transmission and reception, two standard gain horn antennas focus the beam spot through an off-axis parabolic mirror with a diameter of 50.8 mm and a focal length of 50.8 mm. The beam spot size, approximately 3.26 mm, was determined using the knife-edge profiling method. To enable the polarization feature of the system, a polarizer consisting of two components was utilized: a primary wire grid and a secondary polarization rotator. The wire grid permits upward polarization to pass through, while the polarization rotator, comprising three reflectors, can be simultaneously rotated around the axis of the beam to adjust the polarization direction. As depicted in Figure 6, configuring the rotation angle to 0° aligns the input and output polarizations, facilitating the generation of Horizontal transmit Horizontal receive (HH), Vertical transmit Vertical receive (VV), Horizontal transmit Vertical receive (HV), and Vertical transmit Horizontal receive (VH) polarization configurations. The system allows fine-tuning of the angle arm in both incident and scattering directions, achieving an angular resolution with a mechanical error between 0.1 and 0.2 degrees, thereby ensuring high precision in polarization control and measurement accuracy.
We implemented two types of measurement configurations with our designed system to investigate THz scattering from rough surfaces. The first approach involved utilizing a monostatic configuration to examine backscattering of rough surfaces at THz frequencies, with a particular focus on the Brewster angle feature of THz polarimetric measurements. The waveform used in these measurements was linear frequency modulation (LFM), with a broad bandwidth ranging from 325 GHz to 500 GHz. The experimental parameters for this setup are detailed in Table 1. We set the sampling frequencies as 8001 and conducted 10 measurements for each run to ensure high resolution. To mitigate randomness, we rotated the rough surface sample in 10° increments for each measurement, averaging 36 measurements in total. The range for both incident and scattering angles was set from 20° to 70° at 10° intervals, with a more detailed interval of 1° between 56° and 60° to closely examine the Brewster phenomena. While our measurements are fully polarimetric, this article primarily discusses the results in the HH and VV polarizations. In the second setup, we performed bistatic measurements to further analyze THz scattering from rough surfaces. Here, the incident angle was fixed at 30°, 45°, and 60°, while the scattering angle varied from 10° to 80° in 2° intervals. Additionally, measurements were conducted using a flat surface as a reference to compare against the results from the rough surfaces. This approach allowed us to capture a wide spectrum of scattering behaviors and refine our understanding of THz wave interactions with various surface roughness conditions.

3.3.2. System Calibration

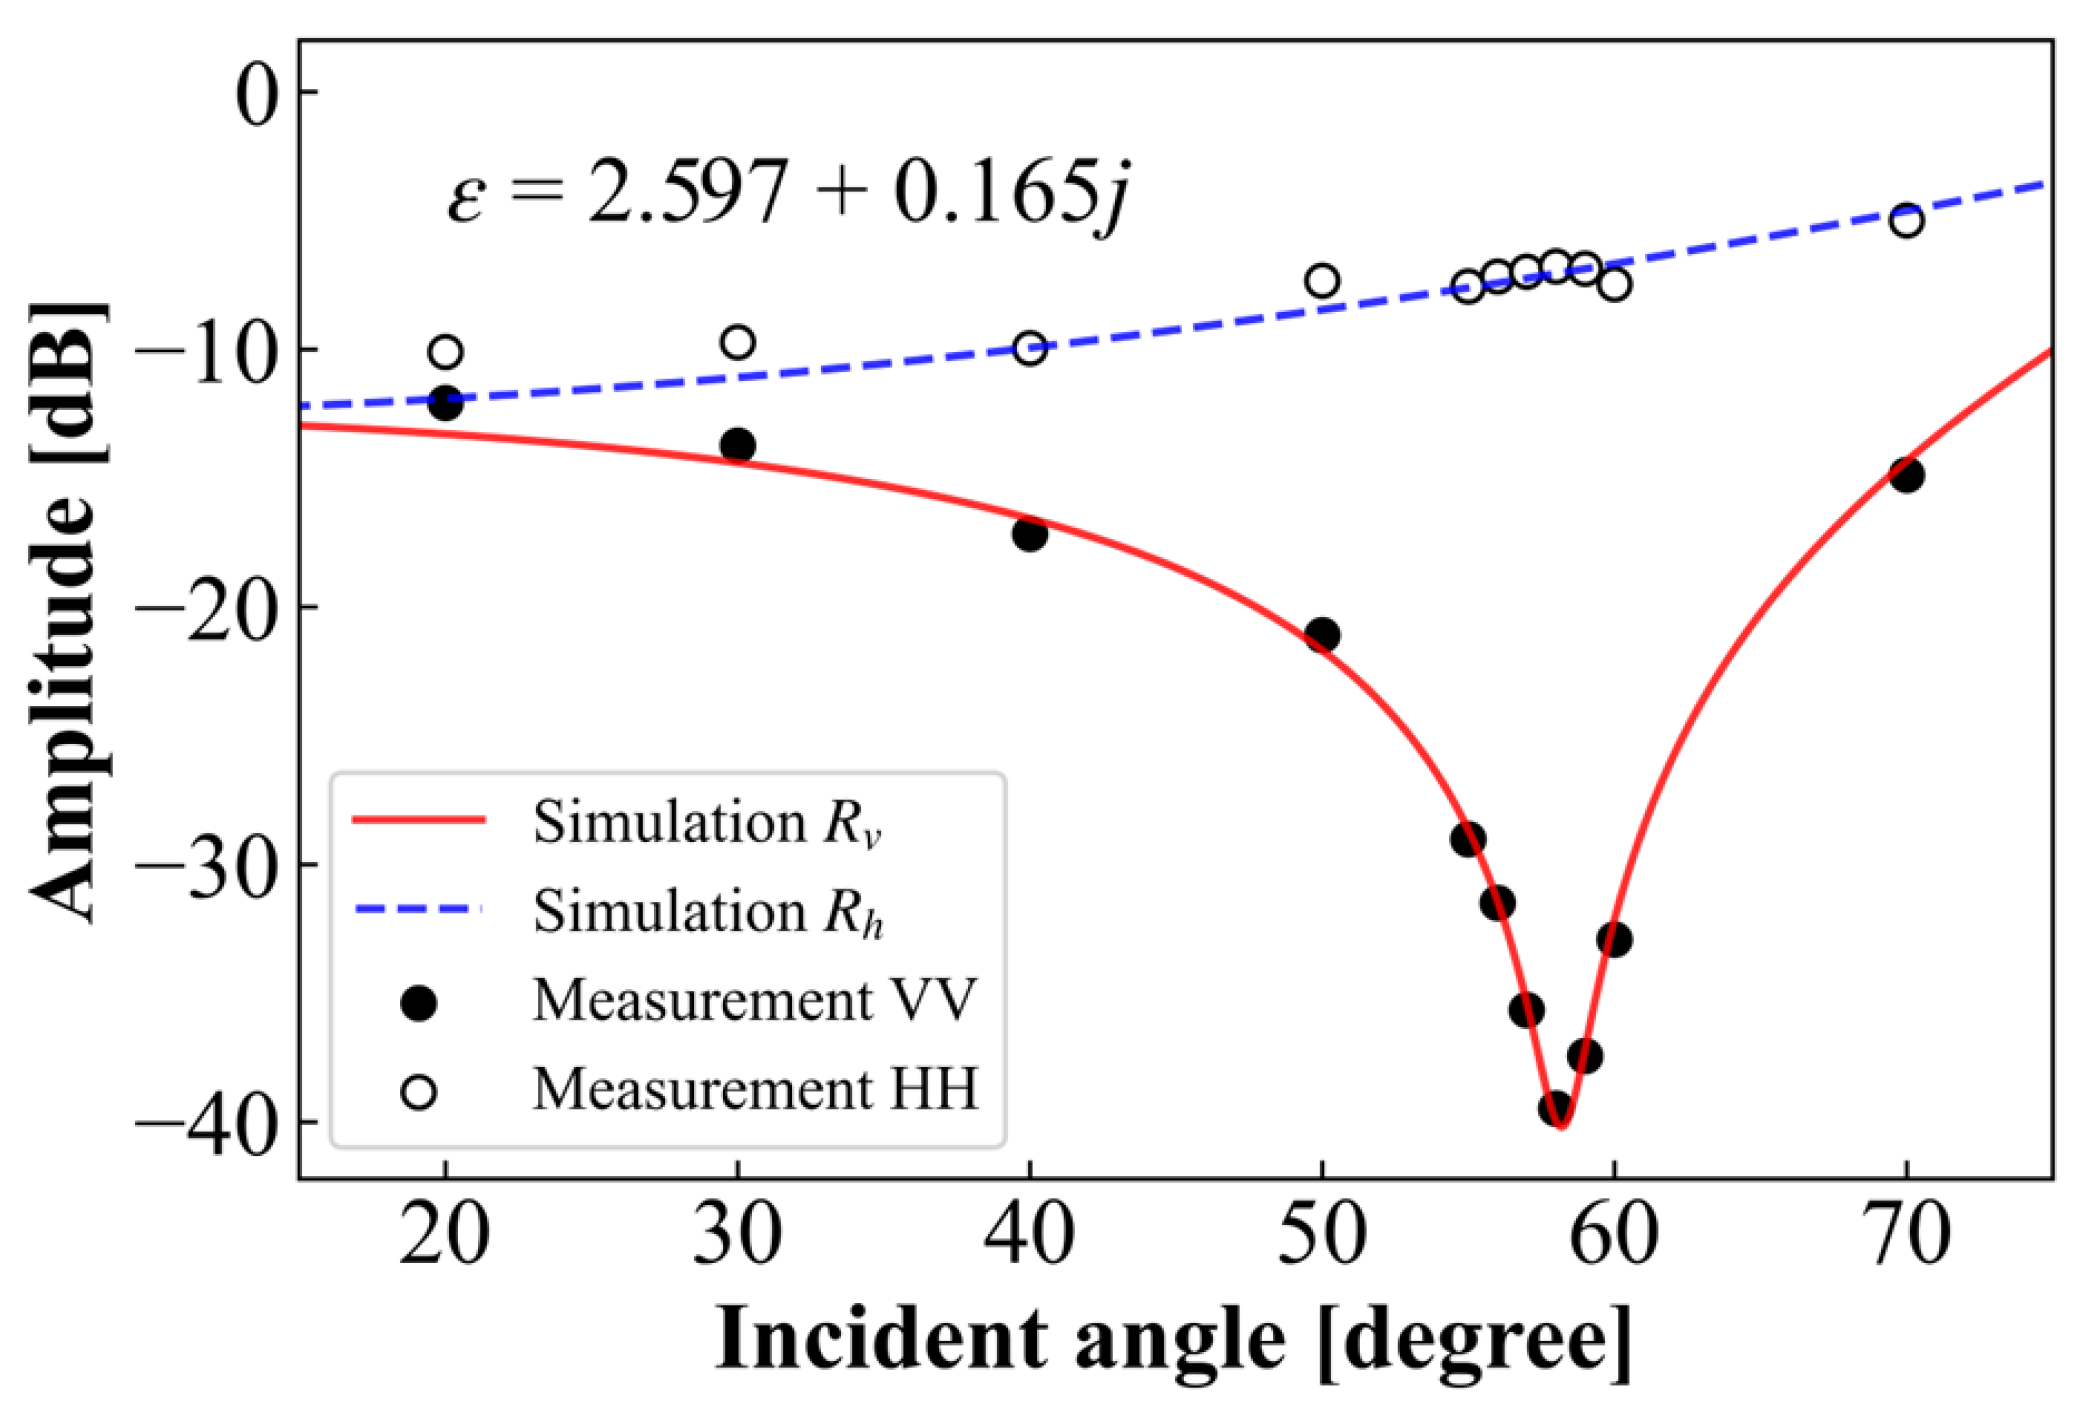
To ensure the reliability of the measurements, we calibrated the system through a two-phase process. Initially, the calibration accounted for the characteristics of the waveguide hardware up to the antenna interface, along with the system loss attributed to the frequency extenders. This was accomplished by implementing a one-path, two-port calibration strategy. Subsequently, we utilized an open-short-load (OSL) 1-port calibration and a bounded  S 21  approach for further characterization.  S 21  is a scattering parameter that measures the ratio of the reflected signal power received at port 2 to the signal sent from port 1. To ensure proper collimation of the system, we compared the  | S 21 | 2  reference data at a 45° incidence angle without any sample against the  | S 21 | 2  data obtained from specular reflection off a metallic plate. The magnitude of  S 21  was carefully monitored to ensure consistency and mitigate potential reflection losses across the system. This experiment covered a wide range of incident angles, from 10° to 80°, achieving measurements with a dynamic range greater than 80 dB. Through this rigorous evaluation process, we limited the variations to an exceptionally minimal amplitude of less than 0.1 dB. Additionally, we measured a flat surface with a dielectric constant of  2.597 + j 0.165  as a reference, as shown in Figure 7. We chose the Fresnel reflectivity model to compare with the measurements, which were found to be in good agreement, affirming the precision and accuracy of the system’s alignment and calibration.

4. Results and Discussion

In this section, we present the experimental results and discussion. We evaluate the impacts of several key parameters: RMS height, correlation length, dielectric constant, frequency, polarization, and observation angle. This comprehensive analysis aims to elucidate the underlying physical mechanisms governing THz scattering from rough surfaces.

4.1. Backscattering

4.1.1. Frequency Dependence

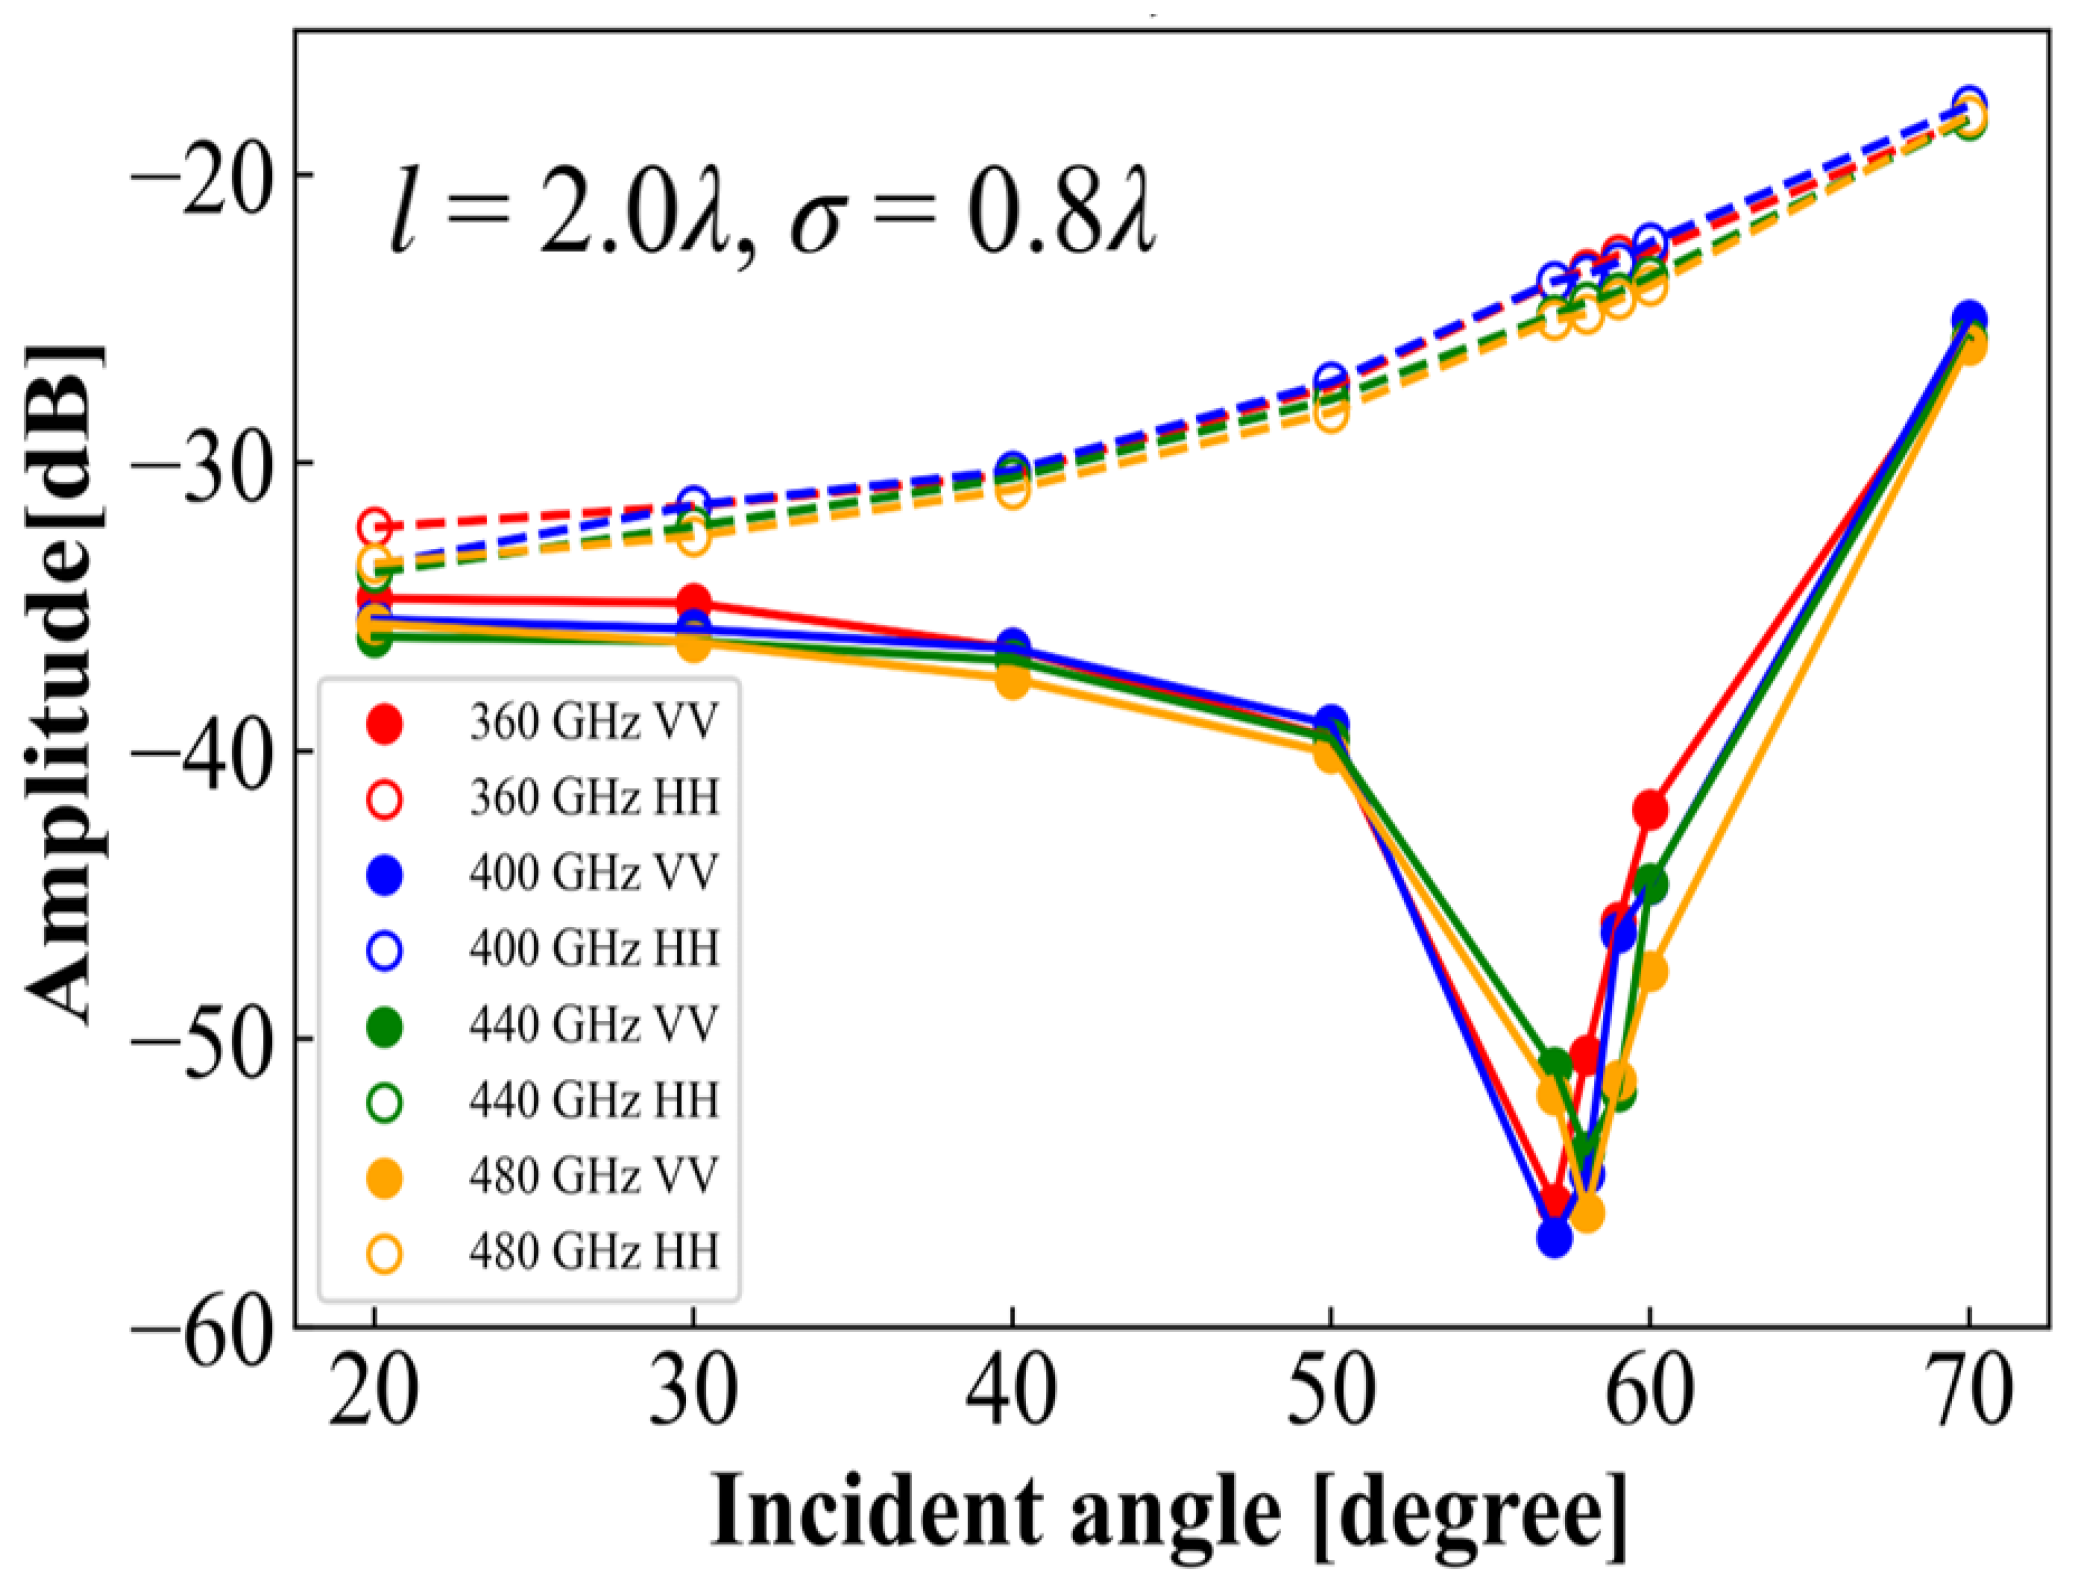
To investigate the effect of frequency on THz scattering from rough surfaces, we selected four frequencies—360 GHz, 400 GHz, 440 GHz, and 480 GHz—across the entire frequency bandwidth from 325 GHz to 500 GHz, as shown in Figure 8, for a rough surface with an RMS height of 0.8 λ  and a correlation length of 2.0 λ . It is important to note that all rough surfaces were initially designed at 480 GHz. The experimental results indicate that the scattering patterns remain consistent across these frequencies, with discernible differences in the Brewster angle region attributable to surface roughness. Consequently, we chose to focus our subsequent analysis on 480 GHz.

4.1.2. Angular Dependence

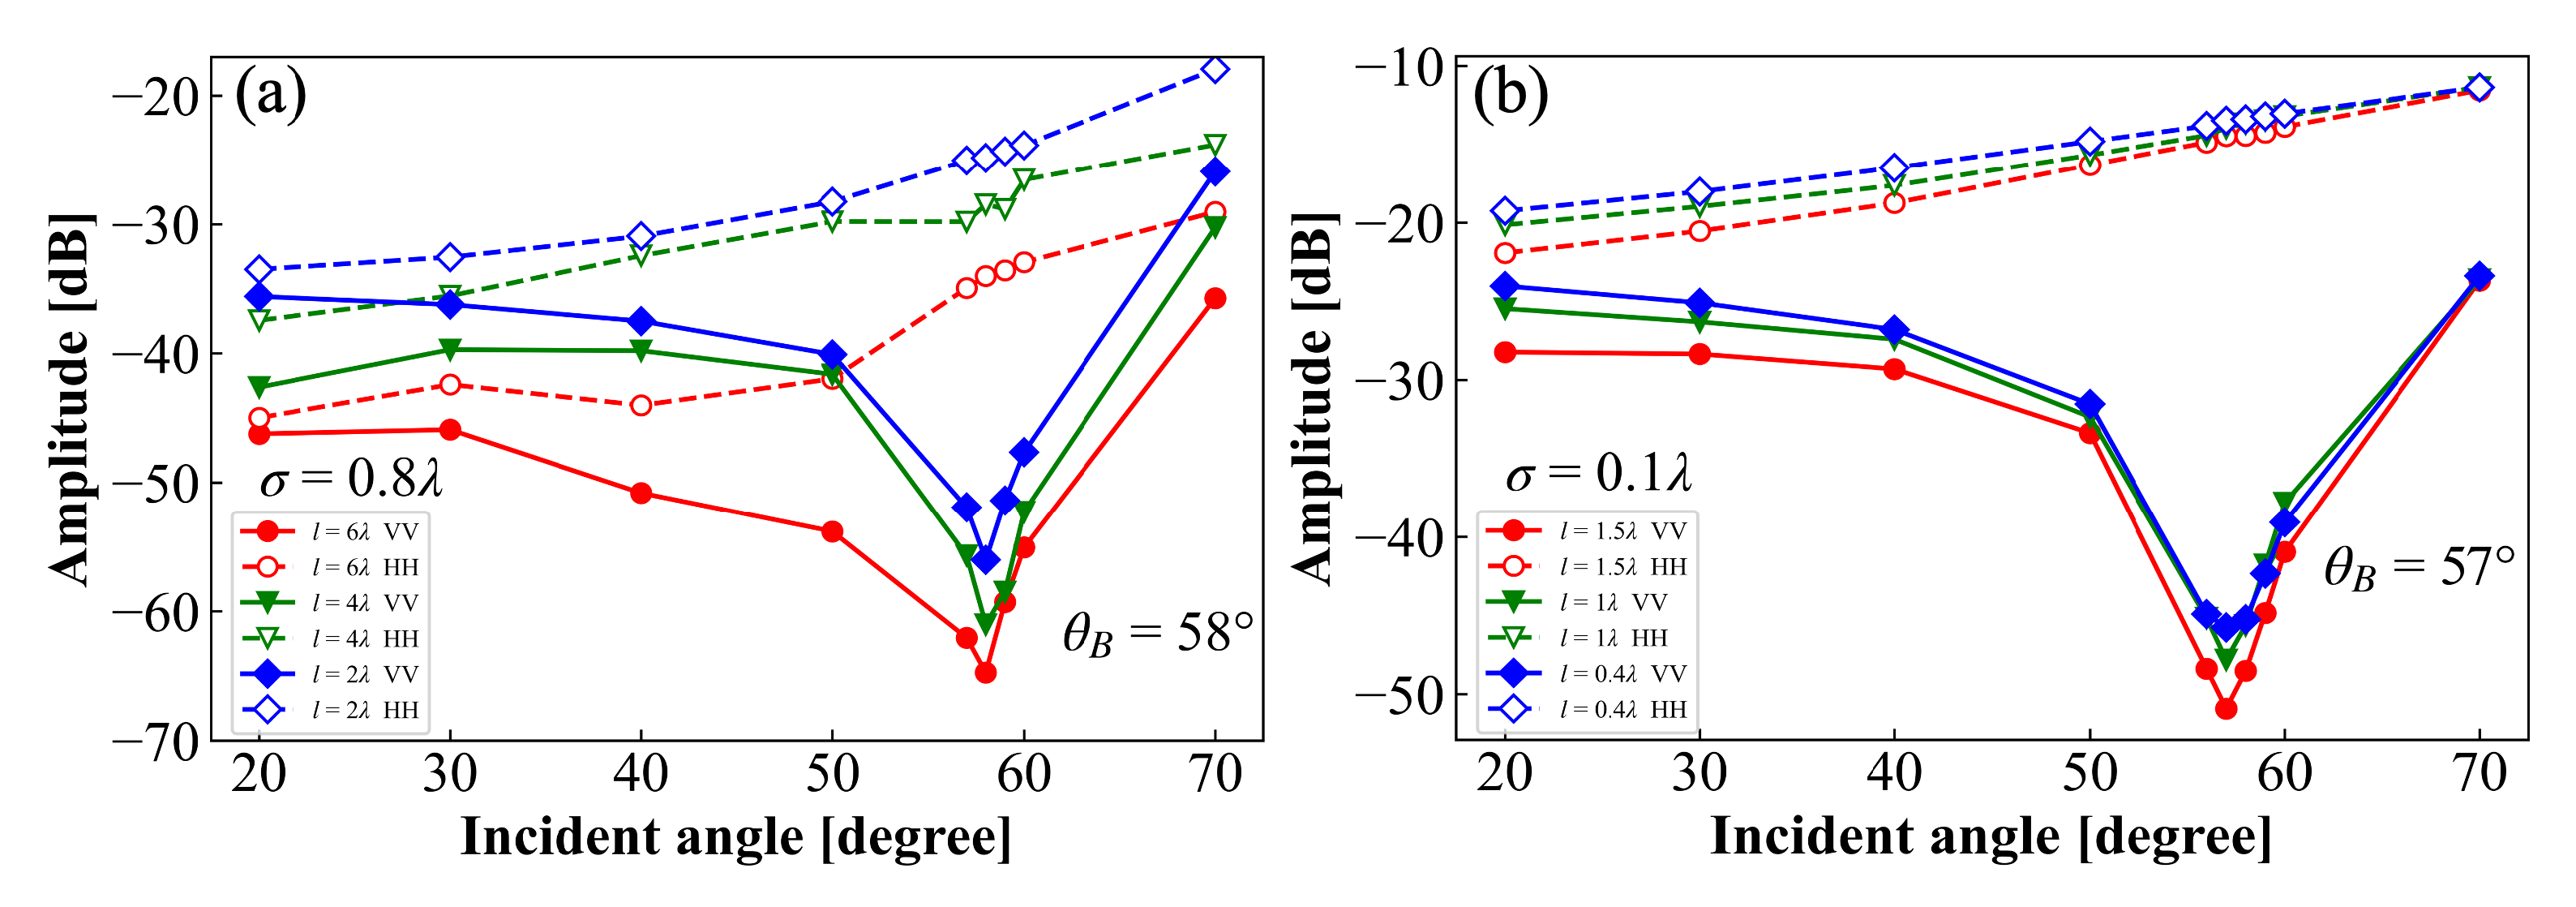
Figure 9a illustrates the effect of correlation lengths on angular scattering behavior at a frequency of 480 GHz. The RMS height is 0.8 λ , and the correlation lengths are 2 λ , 4 λ , and 6 λ . For three rough surfaces with different correlation lengths but the same RMS height, the amplitude of the HH polarization increases with the incident angle. However, as the correlation length increases, the HH polarization amplitude decreases. Furthermore, an increase in surface roughness results in a broadening of the scattering pattern. Figure 9b presents another set of rough surfaces with an RMS height of 0.1 λ  and correlation lengths of 0.4 λ , 1 λ , and 1.5 λ , respectively. Although the differences between the correlation lengths are much smaller, a similar trend can be observed for the HH polarization amplitude. The amplitude of the VV polarization shows a more complex behavior; for instance, in Figure 9a, the VV polarization dips near the Brewster angle ( θ B = 58 ), reaching about −65.6 dB for  l = 6 λ , −61.5 dB for  l = 4 λ , and around −56 dB for  l = 2 λ . In Figure 9b, with smaller RMS height, the VV polarization dip is less pronounced, with the amplitude around −51 dB for  l = 1.5 λ , −47.5 dB for  l = 1 λ , and −45 dB for  l = 0.4 λ , and the Brewster angle is approximately ( θ B = 57 ). However, the general trend regarding the effect of surface roughness on the angular scattering behavior remains consistent. Interestingly, the shift in the Brewster angle observed experimentally for rough surfaces is not as pronounced as theoretically predicted from the analysis in [37], regardless of variations in RMS height or correlation length.
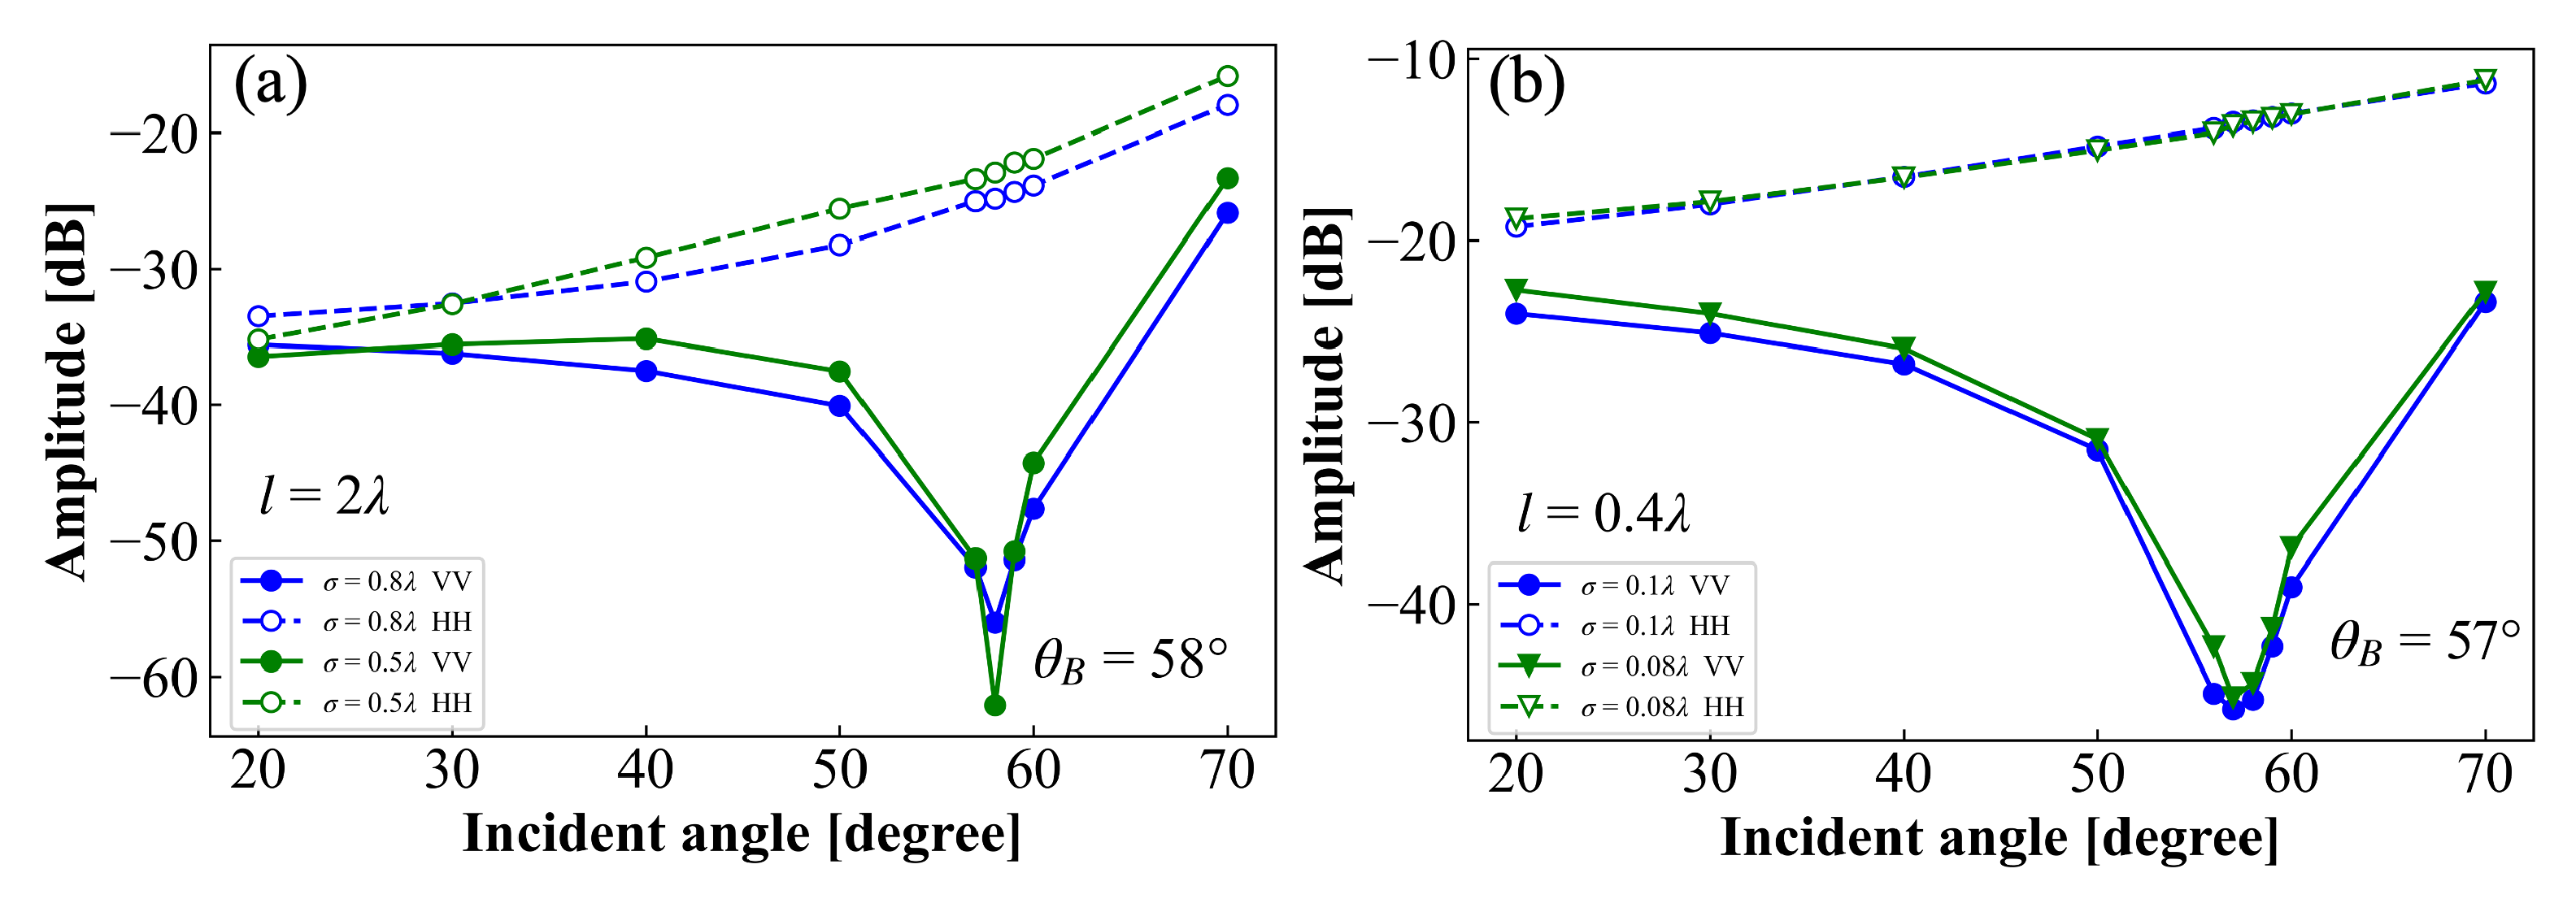
Figure 10 illustrates the effect of RMS height on THz scattering from rough surfaces, with two sets of cases: one with a correlation length of  l = 2 λ  and RMS heights of 0.5 λ  and 0.8 λ  in Figure 10a, and the other with a correlation length of  l = 0.4 λ  and RMS heights of 0.08 λ  and 0.1 λ  in Figure 10b. In Figure 10a, a significant dip in amplitude occurs around the Brewster angle ( θ B = 58 ) for the VV polarization, with the amplitude decreasing to about −56 dB for  σ = 0.8 λ  and around −62 dB for  σ = 0.5 λ . As the RMS height increases, a slight narrowing of the scattering pattern is observed in the angular domain, resulting in a sharper and more focused dip in the VV polarization near the Brewster angle. The HH polarization, on the other hand, remains relatively stable with only moderate variation across the angular range, and shows a slight increase in amplitude at larger incident angles, especially for larger RMS heights. In Figure 10b, where  l = 0.4 λ , the VV polarization shows a less pronounced dip near the Brewster angle ( θ B = 57 ), with amplitudes of about −47.5 dB for  σ = 0.1 λ  and around −47 dB for  σ = 0.08 λ . The scattering pattern here is less distinct, leading to smaller variations in amplitude across the angular range for both VV and HH polarizations. The HH polarization maintains a more stable amplitude, ranging from −20 dB to −10 dB, with minimal sensitivity to changes in RMS height. These results indicate that both RMS height and correlation length have a significant influence on the width of the scattering pattern, particularly for the VV polarization.

4.1.3. Polarization Dependence

The results presented in Figure 8, Figure 9 and Figure 10 provide a comprehensive analysis of the polarization dependence of THz scattering from rough surfaces. Figure 8 shows that both HH and VV polarization amplitudes increase with the incident angle across different frequencies for a correlation length of 2 λ  and an RMS height of 0.8 λ . Figure 9 demonstrates that increasing the correlation length from 2 λ  to 6 λ  for an RMS height of 0.8 λ  leads to a decrease in HH polarization amplitude due to enhanced diffuse scattering. A similar but less pronounced trend is observed for an RMS height of 0.1 λ . Figure 10 reveals that changes in RMS height have a less significant impact on the angular distribution of scattered waves compared to correlation length. Overall, THz scattering is more significantly influenced by correlation length than by RMS height, with both HH and VV polarizations increasing in amplitude with the incident angle across the examined parameter ranges.

4.1.4. Brewster Effect

Regarding the shift in the Brewster angle due to surface roughness, Greffet [38] proposed a model describing this shift as a function of RMS height and correlation length of the rough surface. Kawanishi [39] applied the stochastic functional method to study the Brewster angle shift and found that it depends more on the correlation length than on the RMS height. Vid’machenko and Morozhenko [40] emphasized the importance of using polarimetric measurements near the Brewster angle to estimate the real part of the refractive index in lunar surface mineralogy mapping. When observing surfaces under THz waves, accounting for surface roughness is crucial, especially when considering the differences between HH and VV polarization near the Brewster angle. This consideration is key to accurately estimating the dielectric constant of the surface. However, to our knowledge, no publication has yet documented the Brewster angle shift due to surface roughness under THz observations, either theoretically or experimentally. Therefore, in this subsection, we analyzed rough surfaces with the same dielectric constant but varying RMS heights and correlation lengths, as shown in Figure 9 and Figure 10. Our findings indicate that the correlation length significantly influences the Brewster angle and scattering response more than the RMS height does. Experiments on eight rough surfaces at 480 GHz showed the Brewster angle ranging between 57° and 59°. Using the Fresnel reflectivity model, we calculated the Brewster angle for a flat surface as  2.59 j 0.16 , which closely matched our measurements from a flat surface, as shown in Figure 7. This consistency validates the accuracy of dielectric constant measurements for the material using THz-TDS, demonstrating the importance of considering both RMS height and correlation length for precise THz observation analysis.

4.2. Bistatic Scattering

In the following section, we present experimental results of bistatic scattering from rough surfaces for HH and VV polarizations at THz frequencies, compared to those from a flat surface with the same dielectric constant.
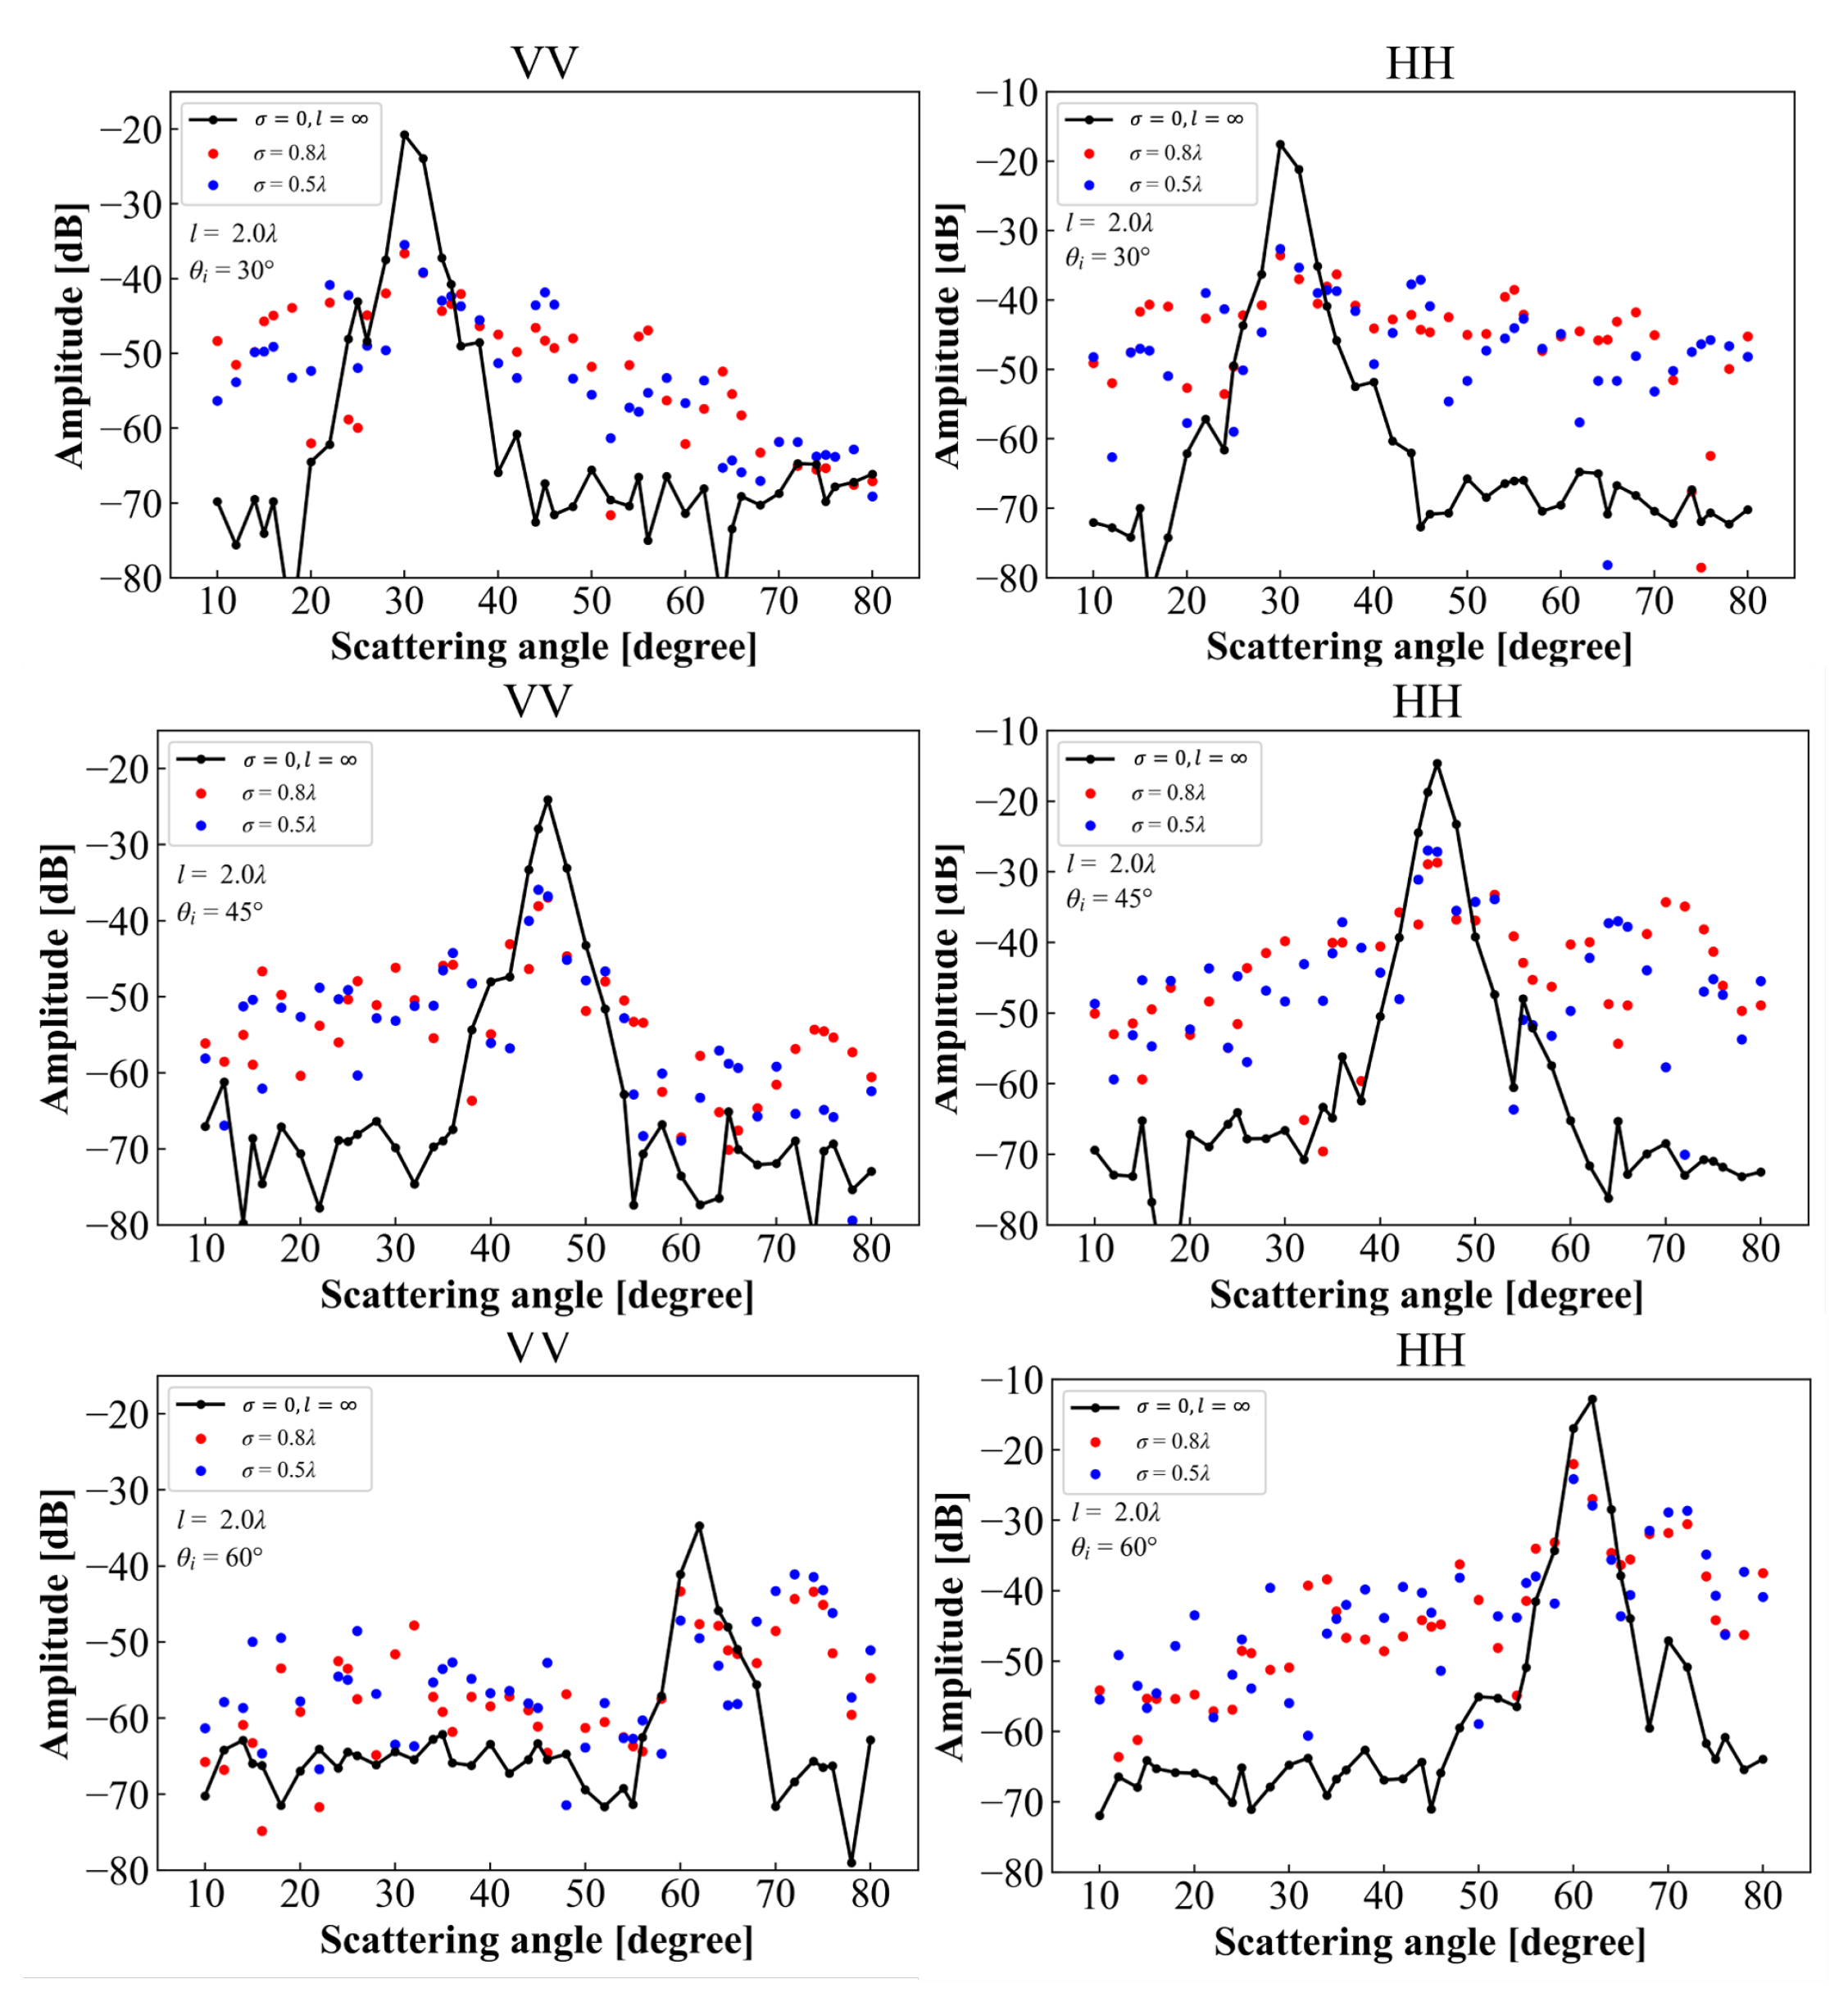
Figure 11 illustrates a comparison of bistatic scattering from both flat and rough surfaces with RMS heights of 0.5 λ  and 0.8 λ , and a fixed correlation length, across incident angles of 30°, 45°, and 60° for both HH and VV polarizations. It can be observed that the peak echoes from rough surfaces for both polarizations align with the specular direction at all three angles of incidence, albeit with amplitudes reduced by approximately 10 dB compared to the flat surface, and a broadening of the scattering pattern. At a 30° incidence angle, rough surfaces exhibit a notable increase in return for both HH and VV polarizations across both small and large scattering angle regions relative to the specular direction. This is due to diffuse scattering induced by surface roughness. Notably, in the large scattering angle domain, the diffuse scattering of HH polarization is more pronounced than that of VV polarization, with a discernible difference of around 15 dB. While the response of VV polarization declines as the scattering angle increases, HH polarization sustains a level between  50  and  40  dB, only slightly declining as the scattering angle increases. At a 45° incidence angle, this disparity becomes even more apparent, with HH response surpassing VV response by over 20 dB, This observation is significant as this angle approaches the Brewster angle, where polarization-dependent scattering behavior is prominent. Intriguingly, at a 60° incidence angle, there is a significant enhancement in VV response at larger scattering angles, approaching the specular direction. However, HH response consistently outperforms VV response across both rough surface types, further emphasizing the polarization-dependent scattering effects at higher incident angles.
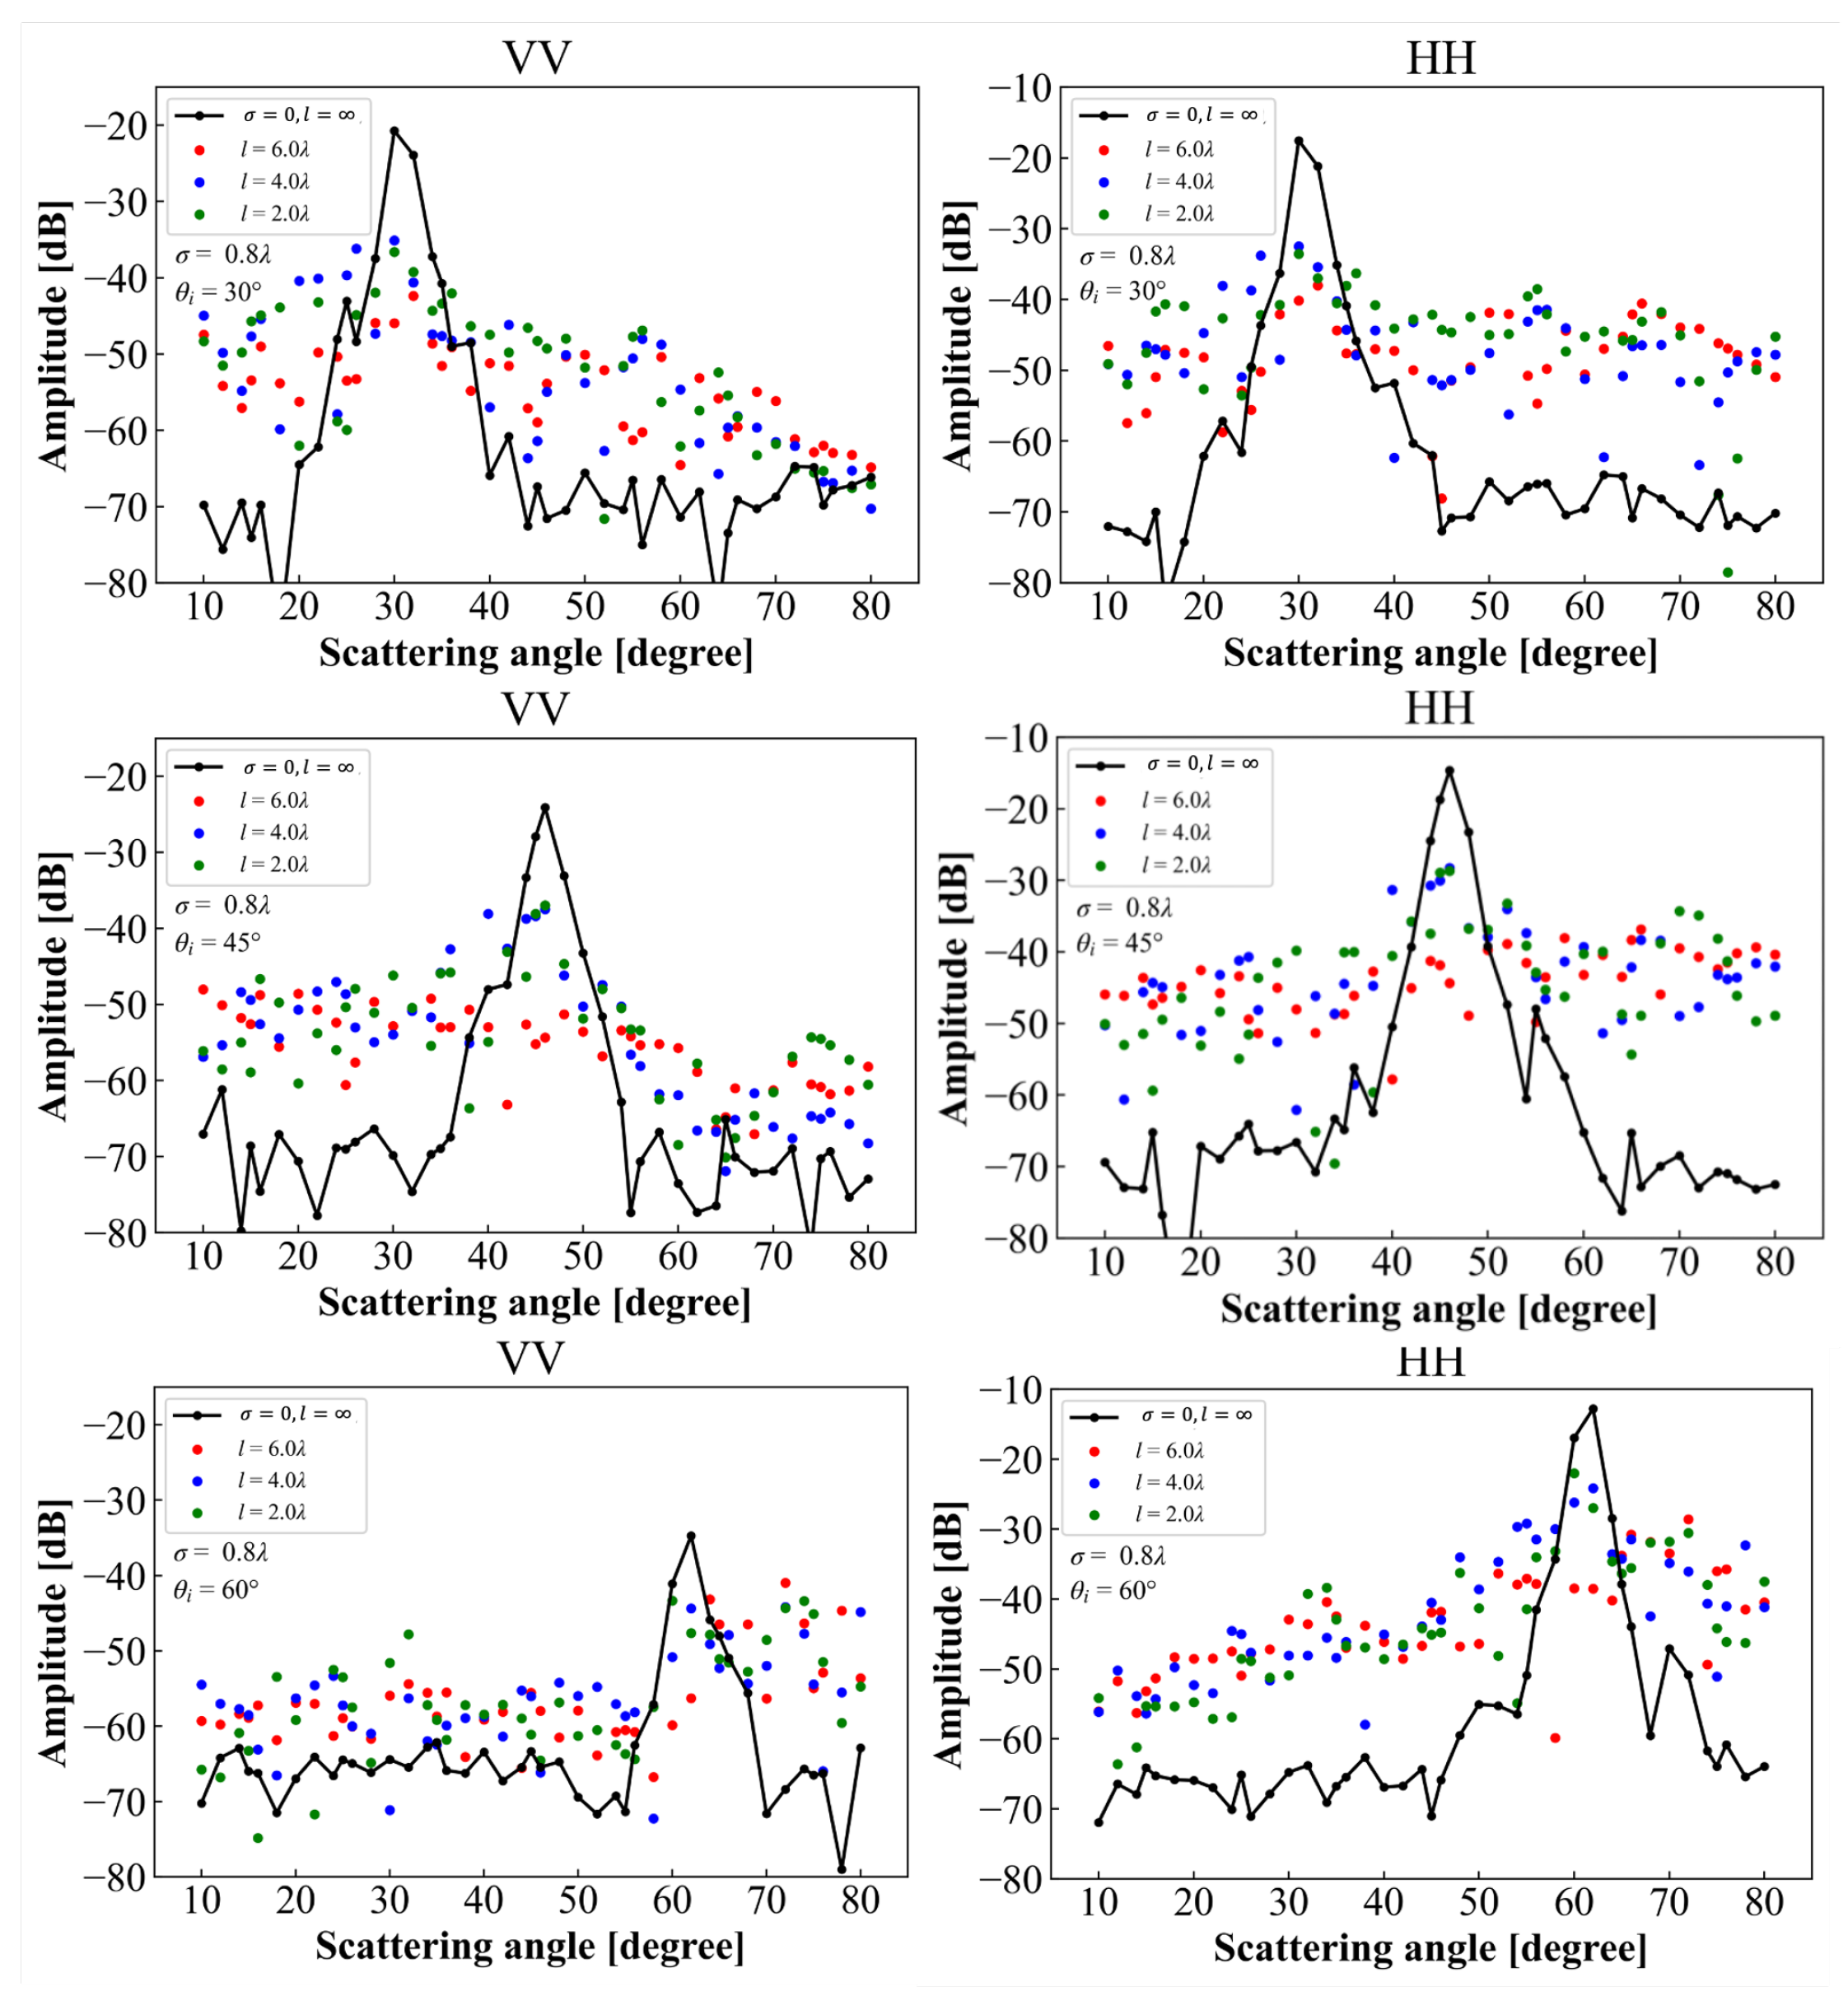
In addition, we examined another set of rough surfaces with RMS heights of 0.1 λ  and 0.08 λ , maintaining a fixed correlation length of 0.4 λ , as shown in Figure 12. At a 30° incidence angle, diffuse scattering from rough surfaces was observed at small scattering angles for both HH and VV polarizations. At larger scattering angles, the VV polarization from rough surfaces closely resembled that from the flat surface. This pattern persisted at a 45° incidence angle. At a 60° incidence angle, pronounced diffuse scattering was observed in HH polarization, whereas VV polarization showed minimal effect of the surface roughness. Following this investigation into the influence of RMS height on THz scattering from rough surfaces, we also explored the effect of correlation length. Figure 13 presents results for rough surfaces with varying correlation lengths of 2 λ , 4 λ , and 6 λ  but with a constant RMS height, across incident angles of 30°, 45°, and 60°. The trends observed in Figure 13 and Figure 14 are consistent with those noted for RMS height, as seen in Figure 11 and Figure 12, with one key difference: the impact of correlation length appears to be more pronounced than that of RMS height.
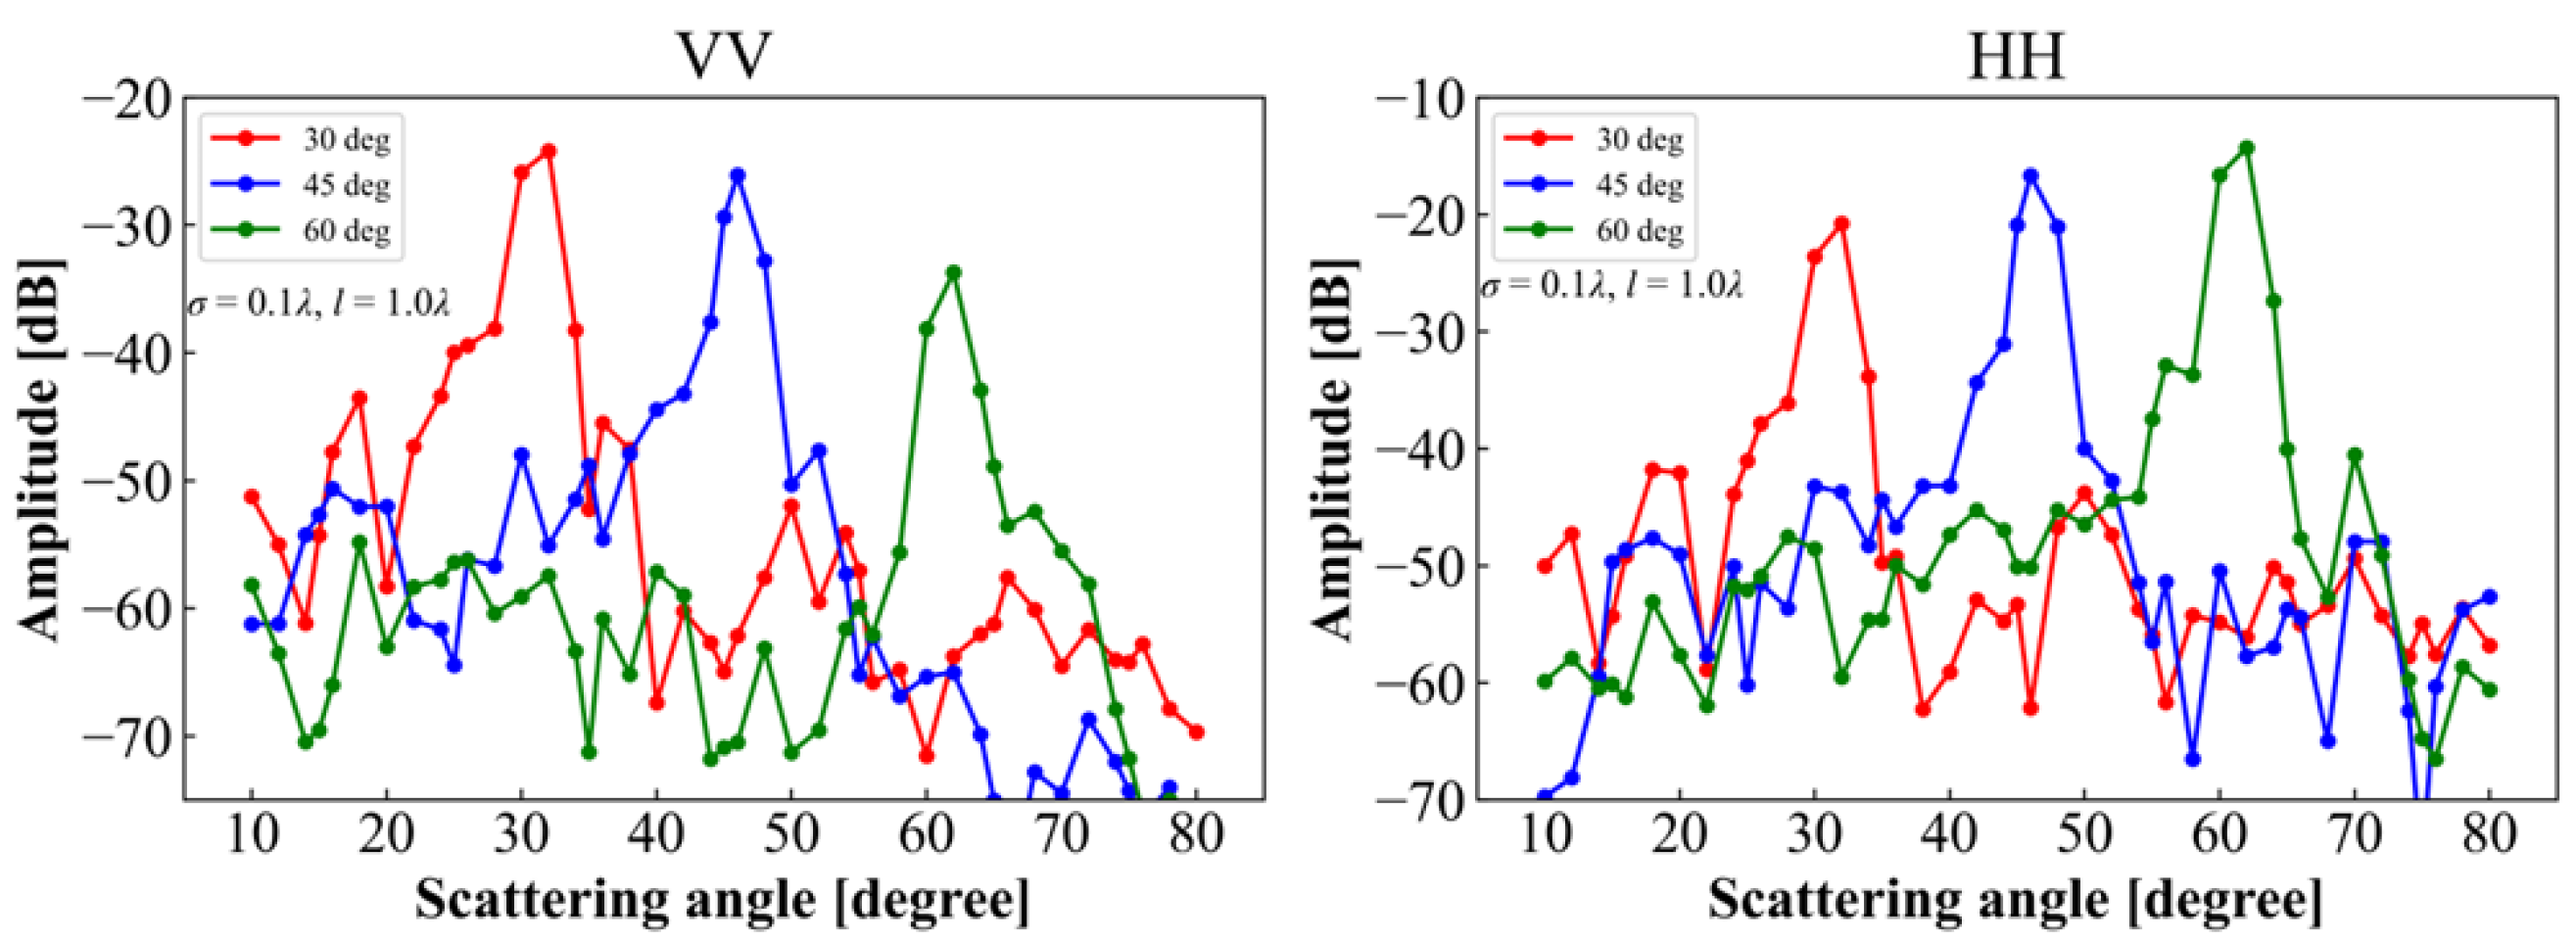
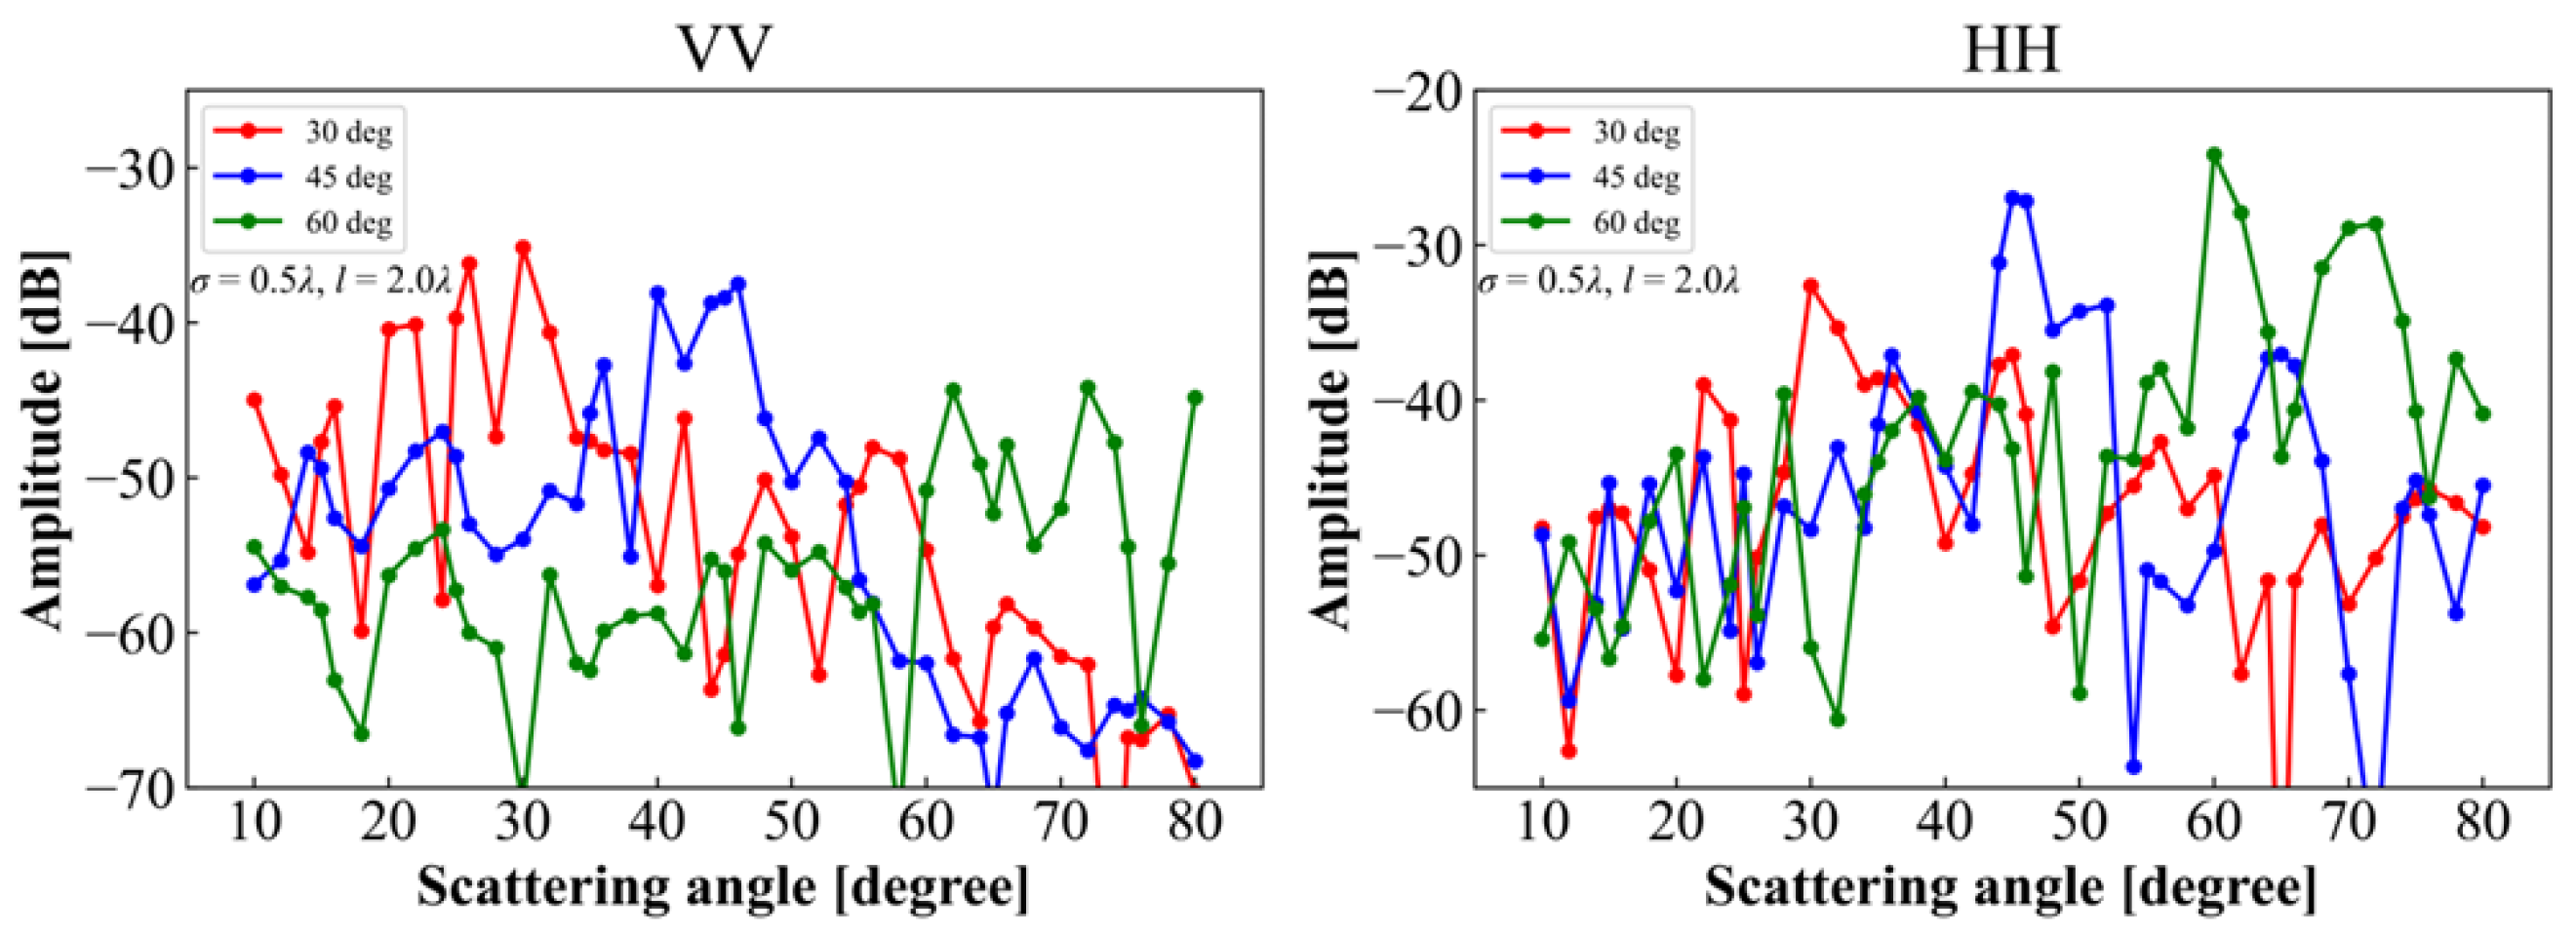
To investigate the influence of incident angle on scattering at 480 GHz, we explored various incident angles—30°, 45°, and 60°—as depicted in Figure 15 and Figure 16. Figure 15 shows the scattering behavior for a surface with an RMS height of 0.1 λ  and a correlation length of 1.0 λ  for both VV (left) and HH (right) polarizations. As the incident angle increases, the surface appears smoother to THz frequencies, resulting in distinct scattering patterns for each polarization. For comparative analysis, Figure 16 presents measured results from a rougher surface with an RMS height of 0.5 λ  and a correlation length of 2.0 λ . The scattering patterns for VV (left) and HH (right) polarizations illustrate how increased surface roughness affects the amplitude and distribution of the scattered waves. As seen, the rougher surface exhibits more pronounced diffuse scattering, particularly at larger incident angles. This comparison highlights the impact of both incident angle and surface roughness on the scattering behavior at THz frequencies.

5. Conclusions

In this article, we investigated THz scattering from the simulated lunar regolith surface through experimental measurements. We characterized the lunar surface roughness using a power law spectrum and selected materials based on the dielectric spectrum model from previous lunar missions. Gaussian-correlated surfaces with varying RMS heights and correlation lengths were fabricated using a 3D printer, closely approximating the dielectric constant of lunar regolith samples. Surface roughness was validated by comparison with theoretical values, while the dielectric constant was confirmed using THz-TDS prior to the experiments. Our study examined the roles of surface roughness, dielectric constant, frequency, polarization, and observation angle on THz scattering patterns. Key findings include that larger correlation lengths reduce HH polarization amplitude, enhancing diffuse scattering, while greater surface roughness broadens scattering patterns. Scattering was consistent across 360 GHz to 480 GHz, indicating minimal frequency dependence in this range. Observed Brewster angle shifts were smaller than predicted, with correlation length significantly affecting the Brewster feature and scattering response. Rough surfaces displayed pronounced diffuse scattering under HH polarization, with the differences between HH and VV polarizations increasing with the incident angle. Future work should explore a broader range of surface types and develop advanced theoretical models to predict scattering behaviors in THz observations.

Author Contributions

Conceptualization, S.W.; methodology, S.W. and K.H.; software, S.W. and K.H.; validation, S.W. and K.H.; formal analysis, S.W. and K.H.; investigation, S.W. and K.H.; resources, S.W.; data curation, S.W. and K.H.; writing—original draft preparation, S.W.; writing—review and editing, S.W.; visualization, K.H.; supervision, S.W.; project administration, S.W.; funding acquisition, S.W. All authors have read and agreed to the published version of the manuscript.

Funding

This work was supported by the tenure-track research startup fund at National Institute of Information and Communications Technology.

Data Availability Statement

The original contributions presented in the study are included in the article, further inquiries can be directed to the corresponding author.

Acknowledgments

We acknowledge the insightful discussions with Kun-Shan Chen from Nanjing University. We also appreciate the technical support provided by Mizuno Maya from the National Institute of Information and Communications Technology for the THz-TDS measurements, as well as the valuable discussions on system polarization with Satoshi Ochiai from the same institute.

Conflicts of Interest

The authors declare no conflicts of interest.

References

  1. Melosh, H.J. Planetary Surface Processes; Cambridge University Press: Cambridge, UK, 2011; Volume 13. [Google Scholar]
  2. Evans, J. Radar studies of planetary surfaces. Annu. Rev. Astron. Astrophys. 1969, 7, 201–248. [Google Scholar] [CrossRef]
  3. Williams, J.P.; Paige, D.; Greenhagen, B.; Sefton-Nash, E. The global surface temperatures of the Moon as measured by the Diviner Lunar Radiometer Experiment. Icarus 2017, 283, 300–325. [Google Scholar] [CrossRef]
  4. de Arruda Moreira, G.; Guerrero-Rascado, J.L.; Bravo-Aranda, J.A.; Foyo-Moreno, I.; Cazorla, A.; Alados, I.; Lyamani, H.; Landulfo, E.; Alados-Arboledas, L. Study of the planetary boundary layer height in an urban environment using a combination of microwave radiometer and ceilometer. Atmos. Res. 2020, 240, 104932. [Google Scholar] [CrossRef]
  5. Horgan, B.H.; Cloutis, E.A.; Mann, P.; Bell, J.F., III. Near-infrared spectra of ferrous mineral mixtures and methods for their identification in planetary surface spectra. Icarus 2014, 234, 132–154. [Google Scholar] [CrossRef]
  6. Goetz, A.F. Three decades of hyperspectral remote sensing of the Earth: A personal view. Remote Sens. Environ. 2009, 113, S5–S16. [Google Scholar] [CrossRef]
  7. Davidsson, B.J.; Rickman, H.; Bandfield, J.L.; Groussin, O.; Gutiérrez, P.J.; Wilska, M.; Capria, M.T.; Emery, J.P.; Helbert, J.; Jorda, L.; et al. Interpretation of thermal emission. I. The effect of roughness for spatially resolved atmosphereless bodies. Icarus 2015, 252, 1–21. [Google Scholar] [CrossRef]
  8. Näränen, J.; Kaasalainen, S.; Peltoniemi, J.; Heikkilä, S.; Granvik, M.; Saarinen, V. Laboratory photometry of planetary regolith analogs. II. Surface roughness and extremes of packing density. Astron. Astrophys. 2004, 426, 1103–1109. [Google Scholar] [CrossRef]
  9. Johnson, P.E.; Vogler, K.J.; Gardner, J.P. The effect of surface roughness on lunar thermal emission spectra. J. Geophys. Res. Planets 1993, 98, 20825–20829. [Google Scholar] [CrossRef]
  10. Honniball, C.; Lucey, P.; Li, S.; Shenoy, S.; Orlando, T.; Hibbitts, C.; Hurley, D.; Farrell, W. Molecular water detected on the sunlit Moon by SOFIA. Nat. Astron. 2021, 5, 121–127. [Google Scholar] [CrossRef]
  11. Davidsson, B.J.; Hosseini, S. Implications of surface roughness in models of water desorption on the Moon. Mon. Not. R. Astron. Soc. 2021, 506, 3421–3429. [Google Scholar] [CrossRef]
  12. Spencer, J.R. A rough-surface thermophysical model for airless planets. Icarus 1990, 83, 27–38. [Google Scholar] [CrossRef]
  13. Giese, B.; Kührt, E. Theoretical interpretation of infrared measurements at Deimos in the framework of crater radiation. Icarus 1990, 88, 372–379. [Google Scholar] [CrossRef]
  14. Emery, J.; Sprague, A.; Witteborn, F.; Colwell, J.; Kozlowski, R.; Wooden, D. Mercury: Thermal modeling and mid-infrared (5–12 μm) observations. Icarus 1998, 136, 104–123. [Google Scholar] [CrossRef]
  15. Müller, M. Surface properties of asteroids from mid-infrared observations and thermophysical modeling. arXiv 2012, arXiv:1208.3993. [Google Scholar]
  16. Hayne, P.O.; Aharonson, O.; Schörghofer, N. Micro cold traps on the Moon. Nat. Astron. 2021, 5, 169–175. [Google Scholar] [CrossRef]
  17. Bandfield, J.L.; Hayne, P.O.; Williams, J.P.; Greenhagen, B.T.; Paige, D.A. Lunar surface roughness derived from LRO Diviner Radiometer observations. Icarus 2015, 248, 357–372. [Google Scholar] [CrossRef]
  18. Fa, W.; Wieczorek, M.A. Regolith thickness over the lunar nearside: Results from Earth-based 70-cm Arecibo radar observations. Icarus 2012, 218, 771–787. [Google Scholar] [CrossRef]
  19. Liu, N.; Fa, W.; Jin, Y.Q. No water–ice invertable in PSR of Hermite-a crater based on mini-RF data and two-layers model. IEEE Geosci. Remote Sens. Lett. 2018, 15, 1485–1489. [Google Scholar] [CrossRef]
  20. Wang, S.; Yamada, T.; Kasai, Y. TSUKIMI: Forward modeling for lunar terahertz exploration. In Proceedings of the 44th COSPAR Scientific Assembly, Athens, Greece, 16–24 July 2022; Volume 44, p. 291. [Google Scholar]
  21. Siegel, P.H. Terahertz technology. IEEE Trans. Microw. Theory Tech. 2002, 50, 910–928. [Google Scholar] [CrossRef]
  22. Ulaby, F.T.; Long, D.G. Microwave Radar and Radiometric Remote Sensing; University of Michigan Press: Ann Arbor, MI, USA, 2014. [Google Scholar]
  23. Ma, J.; Shrestha, R.; Moeller, L.; Mittleman, D.M. Invited article: Channel performance for indoor and outdoor terahertz wireless links. APL Photonics 2018, 3, 051601. [Google Scholar] [CrossRef]
  24. Piesiewicz, R.; Jansen, C.; Mittleman, D.; Kleine-Ostmann, T.; Koch, M.; Kurner, T. Scattering analysis for the modeling of THz communication systems. IEEE Trans. Antennas Propag. 2007, 55, 3002–3009. [Google Scholar] [CrossRef]
  25. Fung, A.K.; Li, Z.; Chen, K.S. Backscattering from a randomly rough dielectric surface. IEEE Trans. Geosci. Remote Sens. 1992, 30, 356–369. [Google Scholar] [CrossRef]
  26. Chen, K.S. Radar Scattering and Imaging of Rough Surfaces: Modeling and Applications with MATLAB®; CRC Press: Boca Raton, FL, USA, 2020. [Google Scholar]
  27. Grossman, E.N.; Popovic, N.; Chamberlin, R.A.; Gordon, J.; Novotny, D. Submillimeter wavelength scattering from random rough surfaces. IEEE Trans. Terahertz Sci. Technol. 2017, 7, 546–562. [Google Scholar] [CrossRef]
  28. Fung, A.K.; Liu, W.; Chen, K.; Tsay, M. An improved IEM model for bistatic scattering from rough surfaces. J. Electromagn. Waves Appl. 2002, 16, 689–702. [Google Scholar] [CrossRef]
  29. Krywonos, A.; Harvey, J.E.; Choi, N. Linear systems formulation of scattering theory for rough surfaces with arbitrary incident and scattering angles. J. Opt. Soc. Am. A 2011, 28, 1121–1138. [Google Scholar] [CrossRef]
  30. Ma, J.; Shrestha, R.; Zhang, W.; Moeller, L.; Mittleman, D.M. Terahertz wireless links using diffuse scattering from rough surfaces. IEEE Trans. Terahertz Sci. Technol. 2019, 9, 463–470. [Google Scholar] [CrossRef]
  31. Amarasinghe, Y.; Zhang, W.; Zhang, R.; Mittleman, D.M.; Ma, J. Scattering of terahertz waves by snow. J. Infrared Millim. Terahertz Waves 2020, 41, 215–224. [Google Scholar] [CrossRef]
  32. Alissa, M.; Friederich, B.; Sheikh, F.; Czylwik, A.; Kaiser, T. Experimental investigation of terahertz scattering: A study of non-Gaussianity and lateral roughness influence. IEEE Access 2020, 8, 170672–170680. [Google Scholar] [CrossRef]
  33. Heiken, G.; Vaniman, D.; French, B.M. Lunar Sourcebook: A User’s Guide to the Moon; Number 1259; CUP Archive: Cambridge, UK, 1991. [Google Scholar]
  34. Li, Q.; Shi, J.; Chen, K.S. A generalized power law spectrum and its applications to the backscattering of soil surfaces based on the integral equation model. IEEE Trans. Geosci. Remote Sens. 2002, 40, 271–280. [Google Scholar]
  35. Neu, J.; Schmuttenmaer, C.A. Tutorial: An introduction to terahertz time domain spectroscopy (THz-TDS). J. Appl. Phys. 2018, 124, 231101. [Google Scholar] [CrossRef]
  36. Formlabs. Durable Resin V2 Technical Data Sheet. 2020. Available online: https://formlabs-media.formlabs.com/datasheets/Durable_Resin_Technical.pdf (accessed on 26 January 2018).
  37. Yang, Y.; Chen, K.S.; Li, Z.L. A note on brewster effect for lossy inhomogeneous rough surfaces. IEEE Trans. Geosci. Remote Sens. 2020, 58, 6722–6730. [Google Scholar] [CrossRef]
  38. Greffet, J.J. Theoretical model of the shift of the Brewster angle on a rough surface. Opt. Lett. 1992, 17, 238–240. [Google Scholar] [CrossRef] [PubMed]
  39. Kawanishi, T.; Ogura, H.; Wang, Z. Scattering of an electromagnetic wave from a slightly random dielectric surface: Yoneda peak and Brewster angle in incoherent scattering. Waves Random Media 1997, 7, 351. [Google Scholar] [CrossRef]
  40. Vid’Machenko, A.; Morozhenko, A. The application of the brewster angle data for the lunar surface mapping by the real part of the refractive index. Sol. Syst. Res. 2006, 40, 462–467. [Google Scholar] [CrossRef]
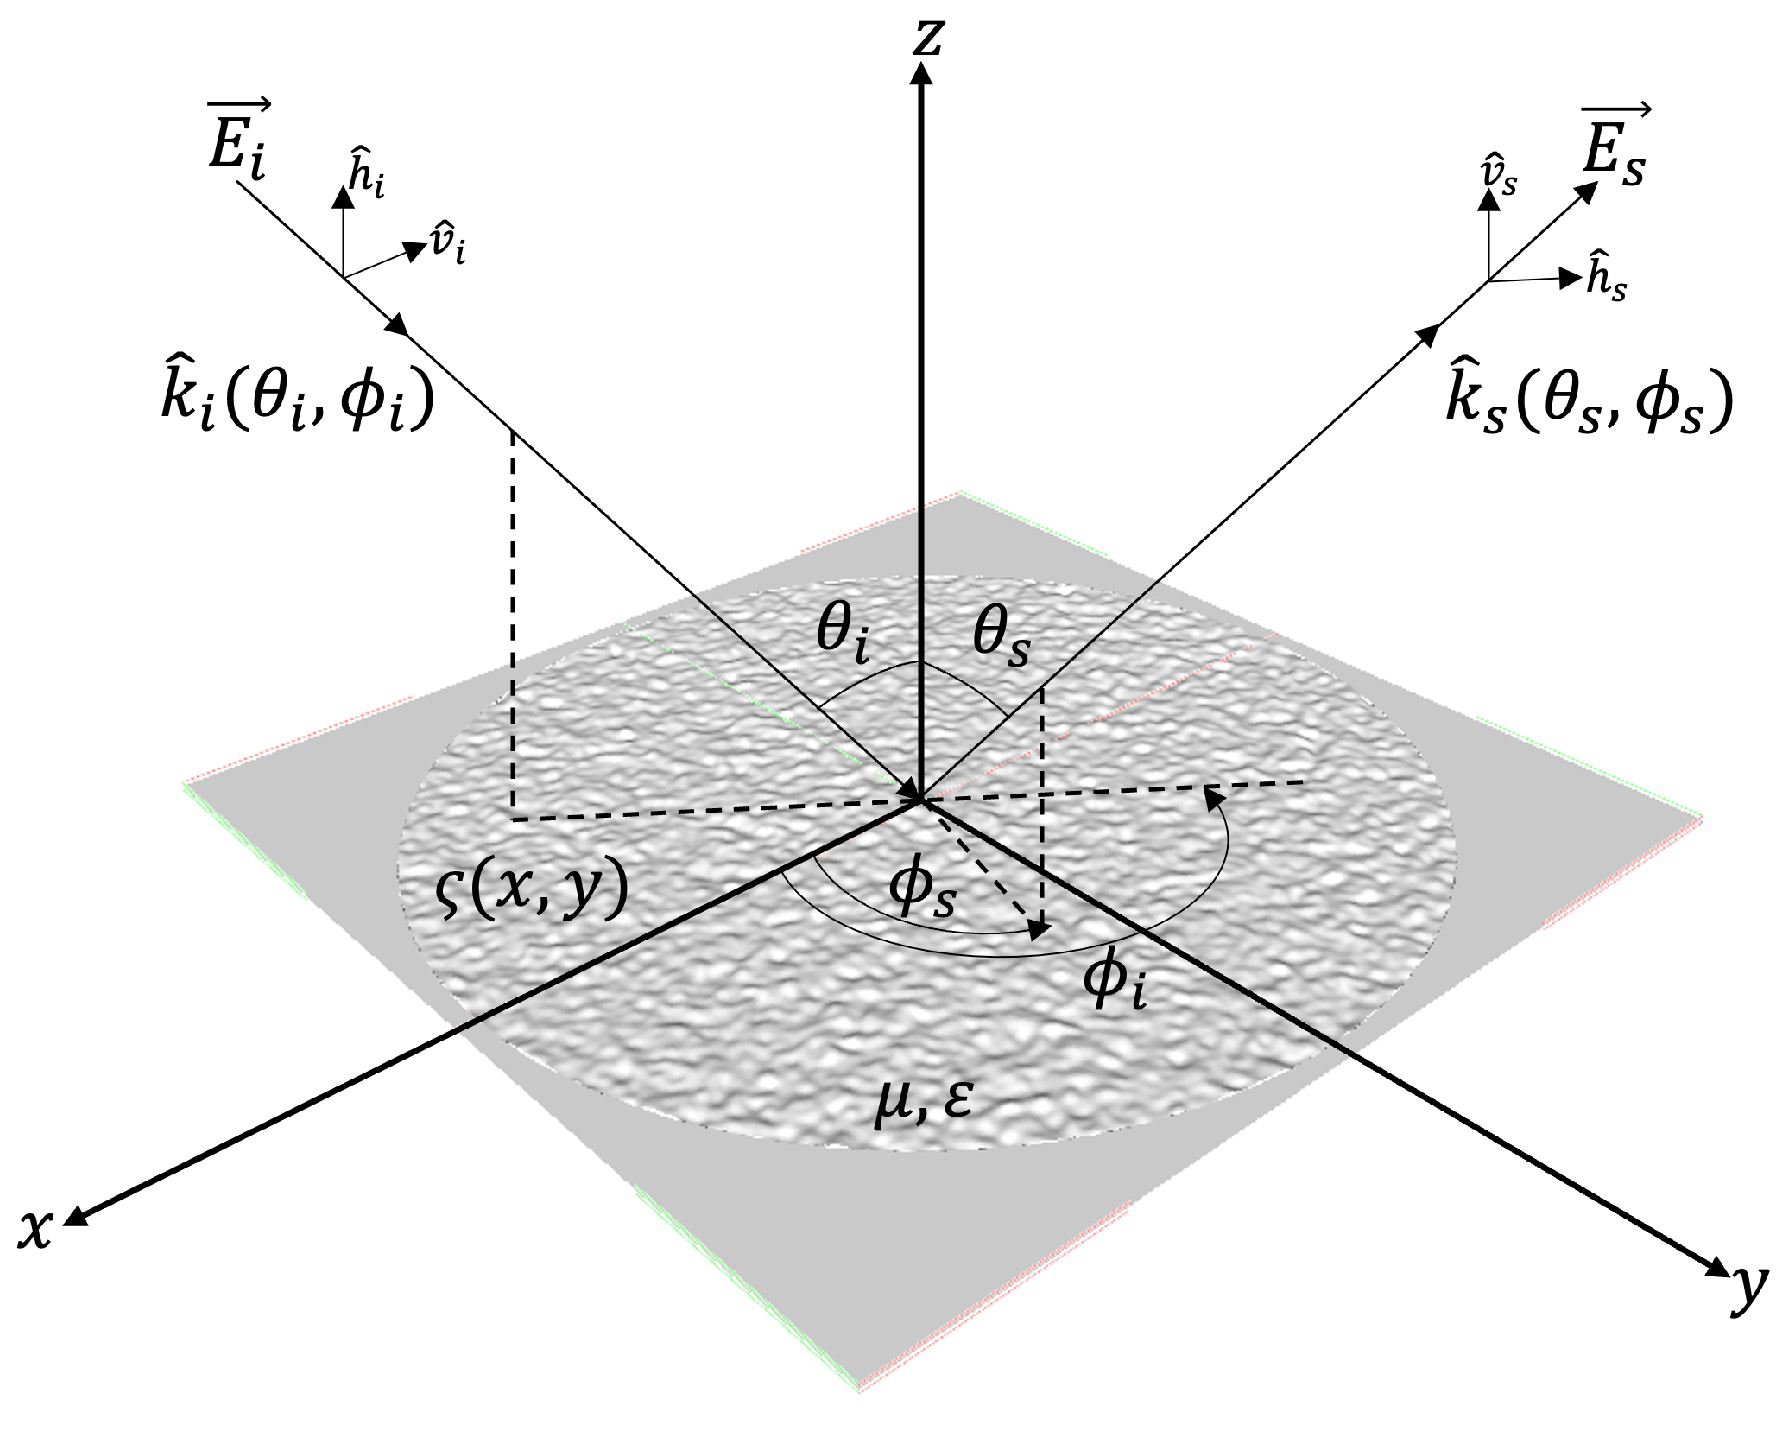
Figure 1. The geometry of wave scattering from rough surface.
Remotesensing 16 03819 g001
Figure 2. The rough surface samples are designed with specified RMS heights and correlation lengths.
Remotesensing 16 03819 g002
Figure 3. The measured dielectric constant of the material by THz-TDS.
Remotesensing 16 03819 g003
Figure 4. The roughness validation of one selected rough surface with an RMS height of 0.8 λ  and a correlation length of 2 λ .
Remotesensing 16 03819 g004
Figure 5. The experiment configuration.
Remotesensing 16 03819 g005
Figure 6. The polarizer consists of three reflectors.
Remotesensing 16 03819 g006
Figure 7. The comparison between the simulated and experimental HH and VV reflections from a flat surface with a dielectric constant of  2.597 + j 0.165 .
Remotesensing 16 03819 g007
Figure 8. The frequency effect on THz scattering from rough surface.
Remotesensing 16 03819 g008
Figure 9. The correlation length effect on THz scattering from rough surface. (a σ  = 0.8 λ  (b σ  = 0.1 λ .
Remotesensing 16 03819 g009
Figure 10. The RMS height effect on THz scattering from rough surface. (a) l = 2 λ  (b) l = 0.4 λ .
Remotesensing 16 03819 g010
Figure 11. Comparison of bistatic scattering from flat and rough surfaces with RMS heights of 0.5 λ  and 0.8 λ  and a fixed correlation length of 2 λ  at incident angles of 30°, 45°, and 60° for both HH and VV polarizations.
Remotesensing 16 03819 g011
Figure 12. Comparison of bistatic scattering from flat and rough surfaces with RMS heights of 0.1 λ  and 0.08 λ  and a fixed correlation length of 0.4 λ  at incident angles of 30°, 45°, and 60° for both HH and VV polarizations.
Remotesensing 16 03819 g012
Figure 13. Comparison of bistatic scattering from the flat surface and rough surface with different correlation lengths of 2 λ , 4 λ  and 6 λ  and a fixed RMS height of 0.8 λ  at the incident angle of 30°, 45° and 60° for HH and VV polarizations.
Remotesensing 16 03819 g013
Figure 14. Comparison of bistatic scattering from rough surfaces with correlation lengths of 1.5 λ , 1 λ , and 0.4 λ  and a fixed RMS height of 0.1 λ  at incident angles of 30°, 45°, and 60° for both HH and VV polarizations.
Remotesensing 16 03819 g014
Figure 15. Comparison of three different incident angles 30°, 45°, and 60° for HH and VV polarizations from a Gaussian correlated surface of l = 1.0  λ σ  = 0.1  λ . ((left): VV polarization, (right): HH polarization).
Remotesensing 16 03819 g015
Figure 16. Comparison of three different incident angles 30°, 45°, and 60° for HH and VV polarizations from a Gaussian correlated surface of l = 2.0  λ σ  = 0.5  λ . ((left): VV polarization, (right): HH polarization).
Remotesensing 16 03819 g016
Table 1. The experimental parameters.
ParameterSpecificationUnit
Frequency325∼500GHz
PolarizationHH/VV/HV/VH-
WaveformLinear frequency modulation-
Sampling8001Point
Average10Time
Incident angle20∼70Degree
MaterialResin V2-
Disclaimer/Publisher’s Note: The statements, opinions and data contained in all publications are solely those of the individual author(s) and contributor(s) and not of MDPI and/or the editor(s). MDPI and/or the editor(s) disclaim responsibility for any injury to people or property resulting from any ideas, methods, instructions or products referred to in the content.