Abstract
Promoting the accessibility of basic public service facilities is key to safeguarding and improving people’s lives. Effective public service provision is especially important for the sustainable development of less developed regions. Lincang in Yunnan Province is a typical underdeveloped region in China. In parallel, multisource remote sensing data with higher spatial resolution provide more precise results for small-scale regional accessibility assessment. Thus, we use an assessment method to measure and evaluate the accessibility of three types of infrastructure in Lincang based on multisource geospatial data. We further analyze the matching between public service facility accessibility and the socioeconomic attributes of inhabitant clusters and different poverty groups. The results show that the accessibility of educational facilities is currently better than that of health facilities in Lincang and that of sanitation facilities is relatively poor. Public service facility accessibility varies significantly among different types of inhabitant clusters, with better accessibility in inhabitant clusters with high levels of population density, aging, and income. Accessibility to healthcare, education, and sanitation is negatively correlated to varying degrees of poverty levels of poor groups, and the mean values of accessibility to various types of public facilities vary significantly across poor groups. Our findings can help inform policy formulation and provide theoretical support for planning and optimizing the layout of public facilities.
1. Introduction
Public service facilities include various types of facilities that provide necessary resources and services for residents’ lives [1]. The rational layout of public service facilities is related to the fair and efficient allocation of government resources, the quantity and quality of services enjoyed by the public, and the equality of access to such services [2]. Efficient public service provision is a common problem in urban governance, affecting residents’ perceptions of life and the formulation of urban development strategies. The accessibility of public facilities reflects whether the layout of public facilities is reasonable and whether public resources are equitable; assessing such accessibility can help overcome inequalities and alleviate poverty [3,4]. With rapid urbanization, there is increasing demand for culture, education, healthcare, and transportation facilities, among others. Meanwhile, the differentiated needs of different groups place increased pressure on the supply of public service facilities, thus highlighting the importance of investigating public service facility accessibility.
Accessibility research has a long history. In the late 1950s, Hansen et al. [5] used various methods and mathematical models to introduce the accessibility theory into the layout and planning of public service facilities. Wachs et al. [6] characterized accessibility as the average likelihood that people will participate in an activity, given factors such as travel time, distance, or cost. Dalvi et al. [7] suggested that accessibility is an inherent feature or advantage of a place in overcoming spatial operation friction—that is, the convenience of reaching a place from a particular spatial location using the transportation system. Accessibility is widely used to define reachability in terms of the travel time required to reach the nearest target facility and construct global spatial friction [8]. Since the development of the Geographic Information System (GIS), many studies have used it to measure transportation accessibility, incorporating land use, population, and employment characteristics into the assessment [9]. Kalogirou et al. [10] analyzed healthcare accessibility in Ireland using a GIS-based weighted accessibility model, overlaying population, hospital, and road networks. Others, meanwhile, have investigated the fairness of different groups’ access to public service facilities [11]. Taking Detroit as an example, Zenk et al. [12] used GIS and spatial regression modeling to explore neighborhoods’ accessibility to supermarket chains in terms of racial composition and income. Other studies have shown that public service facility accessibility is affected by the proportion of mobile population [13], the regional economy [14], individuals’ socioeconomic and activity characteristics [15,16], and environmental attributes [17].
Many of the UN’s Sustainable Development Goals (SDGs) mention public service accessibility. Relatedly, the EO4SDG initiative of the Group on Earth Observations proposes using remote sensing for SDG monitoring [18]. SDG 11.2 states, “By 2030, provide safe, affordable, accessible and sustainable transport systems for all and improve road safety, in particular by expanding public transport, paying special attention to the needs of people in vulnerable situations, women, children, persons with disabilities and older persons”. The proposed calculation of the “proportion of the population with easy access to public transport” as an indicator aligns with the idea of calculating accessibility and emphasizes the need to focus on different population groups. Health, education, and sanitation are in line with SDGs 3, 4, and 6, which also refer to differences in the attributes of the study population.
Hospitals are important public service facilities that affect people’s lives, and unequal access to healthcare is one of the main obstacles to achieving SDG 3—“Ensure healthy lifestyles and promote well-being for people of all ages” [19]. Measuring the accessibility of healthcare facilities can support equitable access to healthcare [20,21] and contribute to SDG achievement [22]. SDG 3.8 also notes that essential health services should be calculated as an indicator by stating, “Achieve universal health coverage, including protection from economic risks, access to quality essential healthcare services for all, and access to safe, effective, good quality and affordable essential medicines and vaccines for all”. Many studies have investigated healthcare facility accessibility. Alegana et al. [23] modeled the probability of public health facility involvement in children’s fever treatment in Namibia based on travel time, predicting the number of people who would use a public health facility. Weiss et al. [24,25] improved on Nelson’s spatial friction and mapped the travel time cost of cities and health facilities globally using the least cost distance algorithm.
Education is another important aspect of development. SDG 4 states, “Ensure inclusive and equitable quality education and lifelong learning opportunities for all”. Yet, there is still widespread inequality in terms of the accessibility and quality of schools [26]. SDG 4.5, which suggests using the Education Parity Index as a measurement indicator, states, “By 2030, eliminate gender disparities in education and ensure equal access to all levels of education and vocational training for disadvantaged groups, such as persons with disabilities, indigenous peoples and children in vulnerable situations”. Studies have found that different groups have different accessibility to schools based on income and location [27], highlighting the need to study the different attributes of inhabitants. It has been shown that accessibility and equality are significantly better in eastern and central China than in western China [28]. It is important, therefore, to study the western inland areas with poor accessibility to further promote sustainable development.
Public sanitation is a basic guarantee for hygienic cities and public health. SDG 6 proposes that “water and sanitation should be made available to all and managed sustainably”. The criteria reflecting public sanitation’s level of implementation and progress include availability, quality, physical accessibility, affordability, and acceptability [29]. Improved sanitation reduces the risk of diarrheal infections in children [30,31] and is an effective intervention for most water-related diseases [32]. Therefore, improving sanitation accessibility is essential for a healthy, sustainable future in developing countries [33] and contributes to achieving SDG 6. SDG 6.2 more specifically states that “by 2030, everyone will have access to adequate and equitable sanitation and hygiene, eliminating open defecation, with particular attention to meeting the needs of women, girls and vulnerable groups”.
Current research on public service accessibility is dominated by large-scale data, mostly corresponding to a resolution of 1 km. As a result, the data are not precise enough to guide practice. Moreover, it makes research unfavorable for further analysis combined with other factors. At the same time, the differentiated needs of different types of inhabitants and groups have been neglected, resulting in mismatches between the supply of public service facilities and residents’ needs. Therefore, evaluating accessibility using multisource data with higher accuracy can make research more scientific and can overcome the data shortfall problem of previous studies [34,35,36]. Meanwhile, studies have shown that socioeconomic and demographic factors play a key role in accessibility [37]. Thus, it is important to use more clear, scientific classification methods to study the relationship between accessibility and inhabitants’ social attributes, which can improve public service facility accessibility research and guide policy. It is also necessary, then, to study differences in inhabitant and resident attributes to allocate public service facilities in precise differentiated ways. Relatedly, remote sensing technology has been increasingly used for mapping in socioeconomic research [38,39,40]. You et al. [41], for example, used remote sensing to study the effectiveness of shelters. Wang et al. [42] measured the urban poverty space based on remote sensing, while Cui et al. [43] used it to measure the service capacity of primary schools. Thus, by using remote sensing to measure service accessibility, we can better analyze the equity and convenience of residents’ use of public service facilities based on high-precision data.
China was the first country to achieve the UN’s Millennium Development Goal of halving the number of people living in poverty [44]. By the end of 2020, China had eliminated absolute rural poverty under the current standard and entered a phase of relative poverty characterized by regional and urban–rural income disparities, unequal access to public services, and multidimensional poverty [45]. With rapid economic development, problems of social inequality have gradually emerged in China, including unequal access to public services. The government has noted such inequalities, projecting in the Fourteenth Five-Year Plan for Public Services that basic public services will be equalized by 2035.
Assessing public service facility accessibility in underdeveloped regions can help alleviate poverty, equalize public services, and promote sustainable development. This study takes Lincang, a typical underdeveloped region in Yunnan Province, as the study area and uses a method based on multisource remote sensing data to measure and assess the accessibility of three types of infrastructure: healthcare, education, and sanitation. We further explore the matching relationship between the accessibility of these three infrastructures and the social attributes of the inhabitants and different poverty groups. The findings can help guide policy and support the planning and optimization of the layout of public facilities.
This study’s marginal contributions are threefold. (1) We use remote sensing to measure the accessibility of service facilities and synthesize multisource data to construct Points-of-Interest (POI) data, which can improve measurement accuracy. (2) The 30 m accuracy of the remote sensing data used in this study is relatively high, which overcomes the problem of the low resolution of Open Street Map (OSM) road network data and compensates for the data shortcomings of previous studies. (3) We use a clear, scientific classification method to study the relationship between public service facility accessibility and inhabitants’ social attributes and different poverty groups, which has implications for both theoretical research and policy practice.
2. Materials and Methods
2.1. Study Area
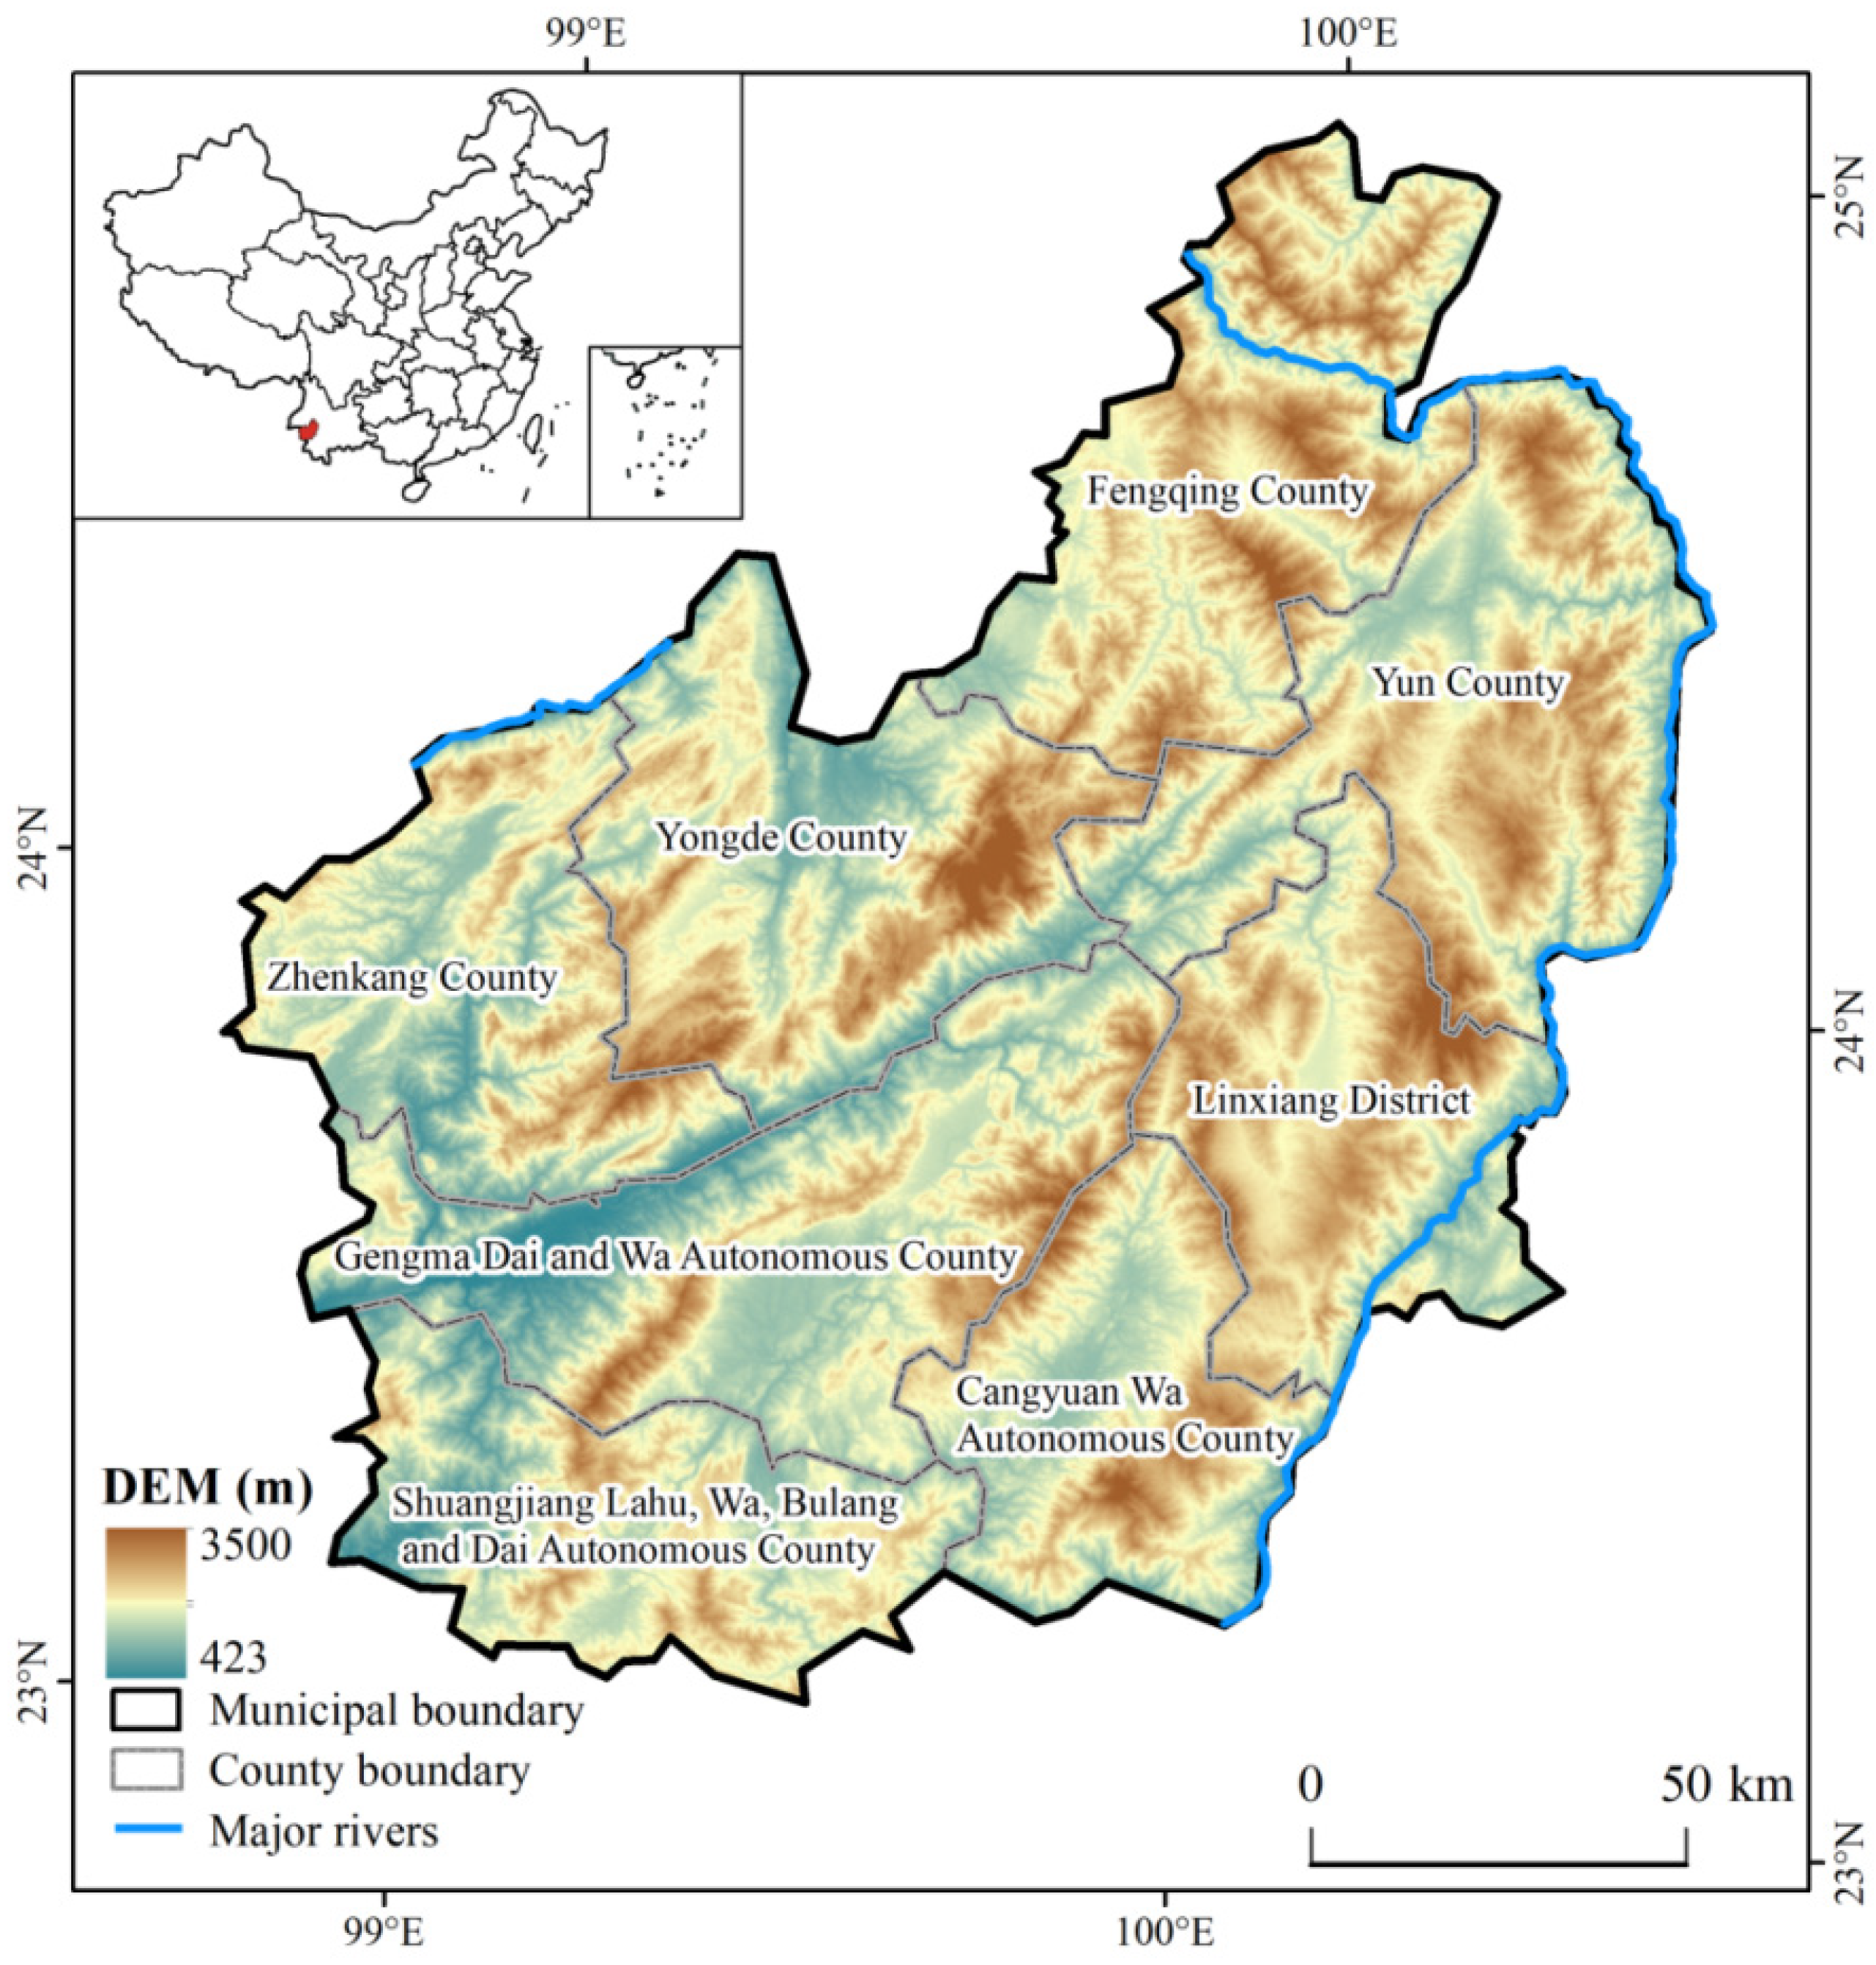
Lincang is located at the southwestern border of China’s Yunnan Province, with a longitude of 98°40′–100°32′E and a latitude of 23°05′–25°03′N. It is governed by one district, four counties, and three minority counties (Figure 1). Lincang’s land area is 24,000 km2, with 97.5% of the city belonging to mountainous and semimountainous areas and 70% covered by forest. Lincang has a population of 2.6 million, of which 38.6% are ethnic minorities. In May 2019, Lincang was approved to build a National Sustainable Development Innovation Demonstration Zone with the theme of “Innovation-Driven Development in Borderland Multiethnic Underdeveloped Areas”. It aims to explore solutions for achieving the 2030 SDGs. With its rich ethnic and cultural resources and excellent environment, Lincang has unique resource advantages for building a sustainable development demonstration zone.
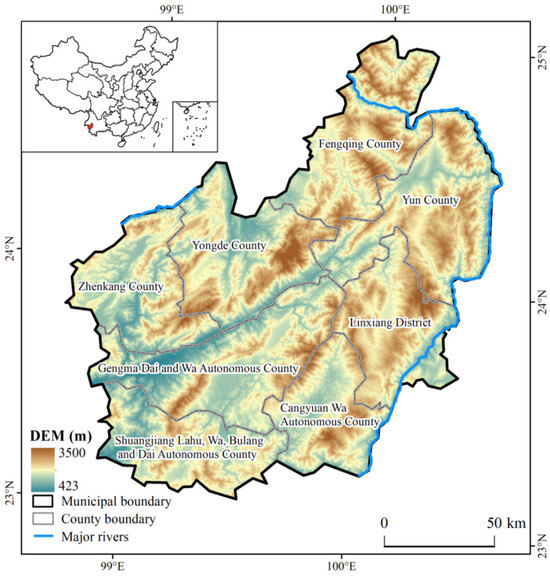
Figure 1.
Geographic location and administrative divisions of Lincang.
2.2. Data Sources
2.2.1. Landuse Data
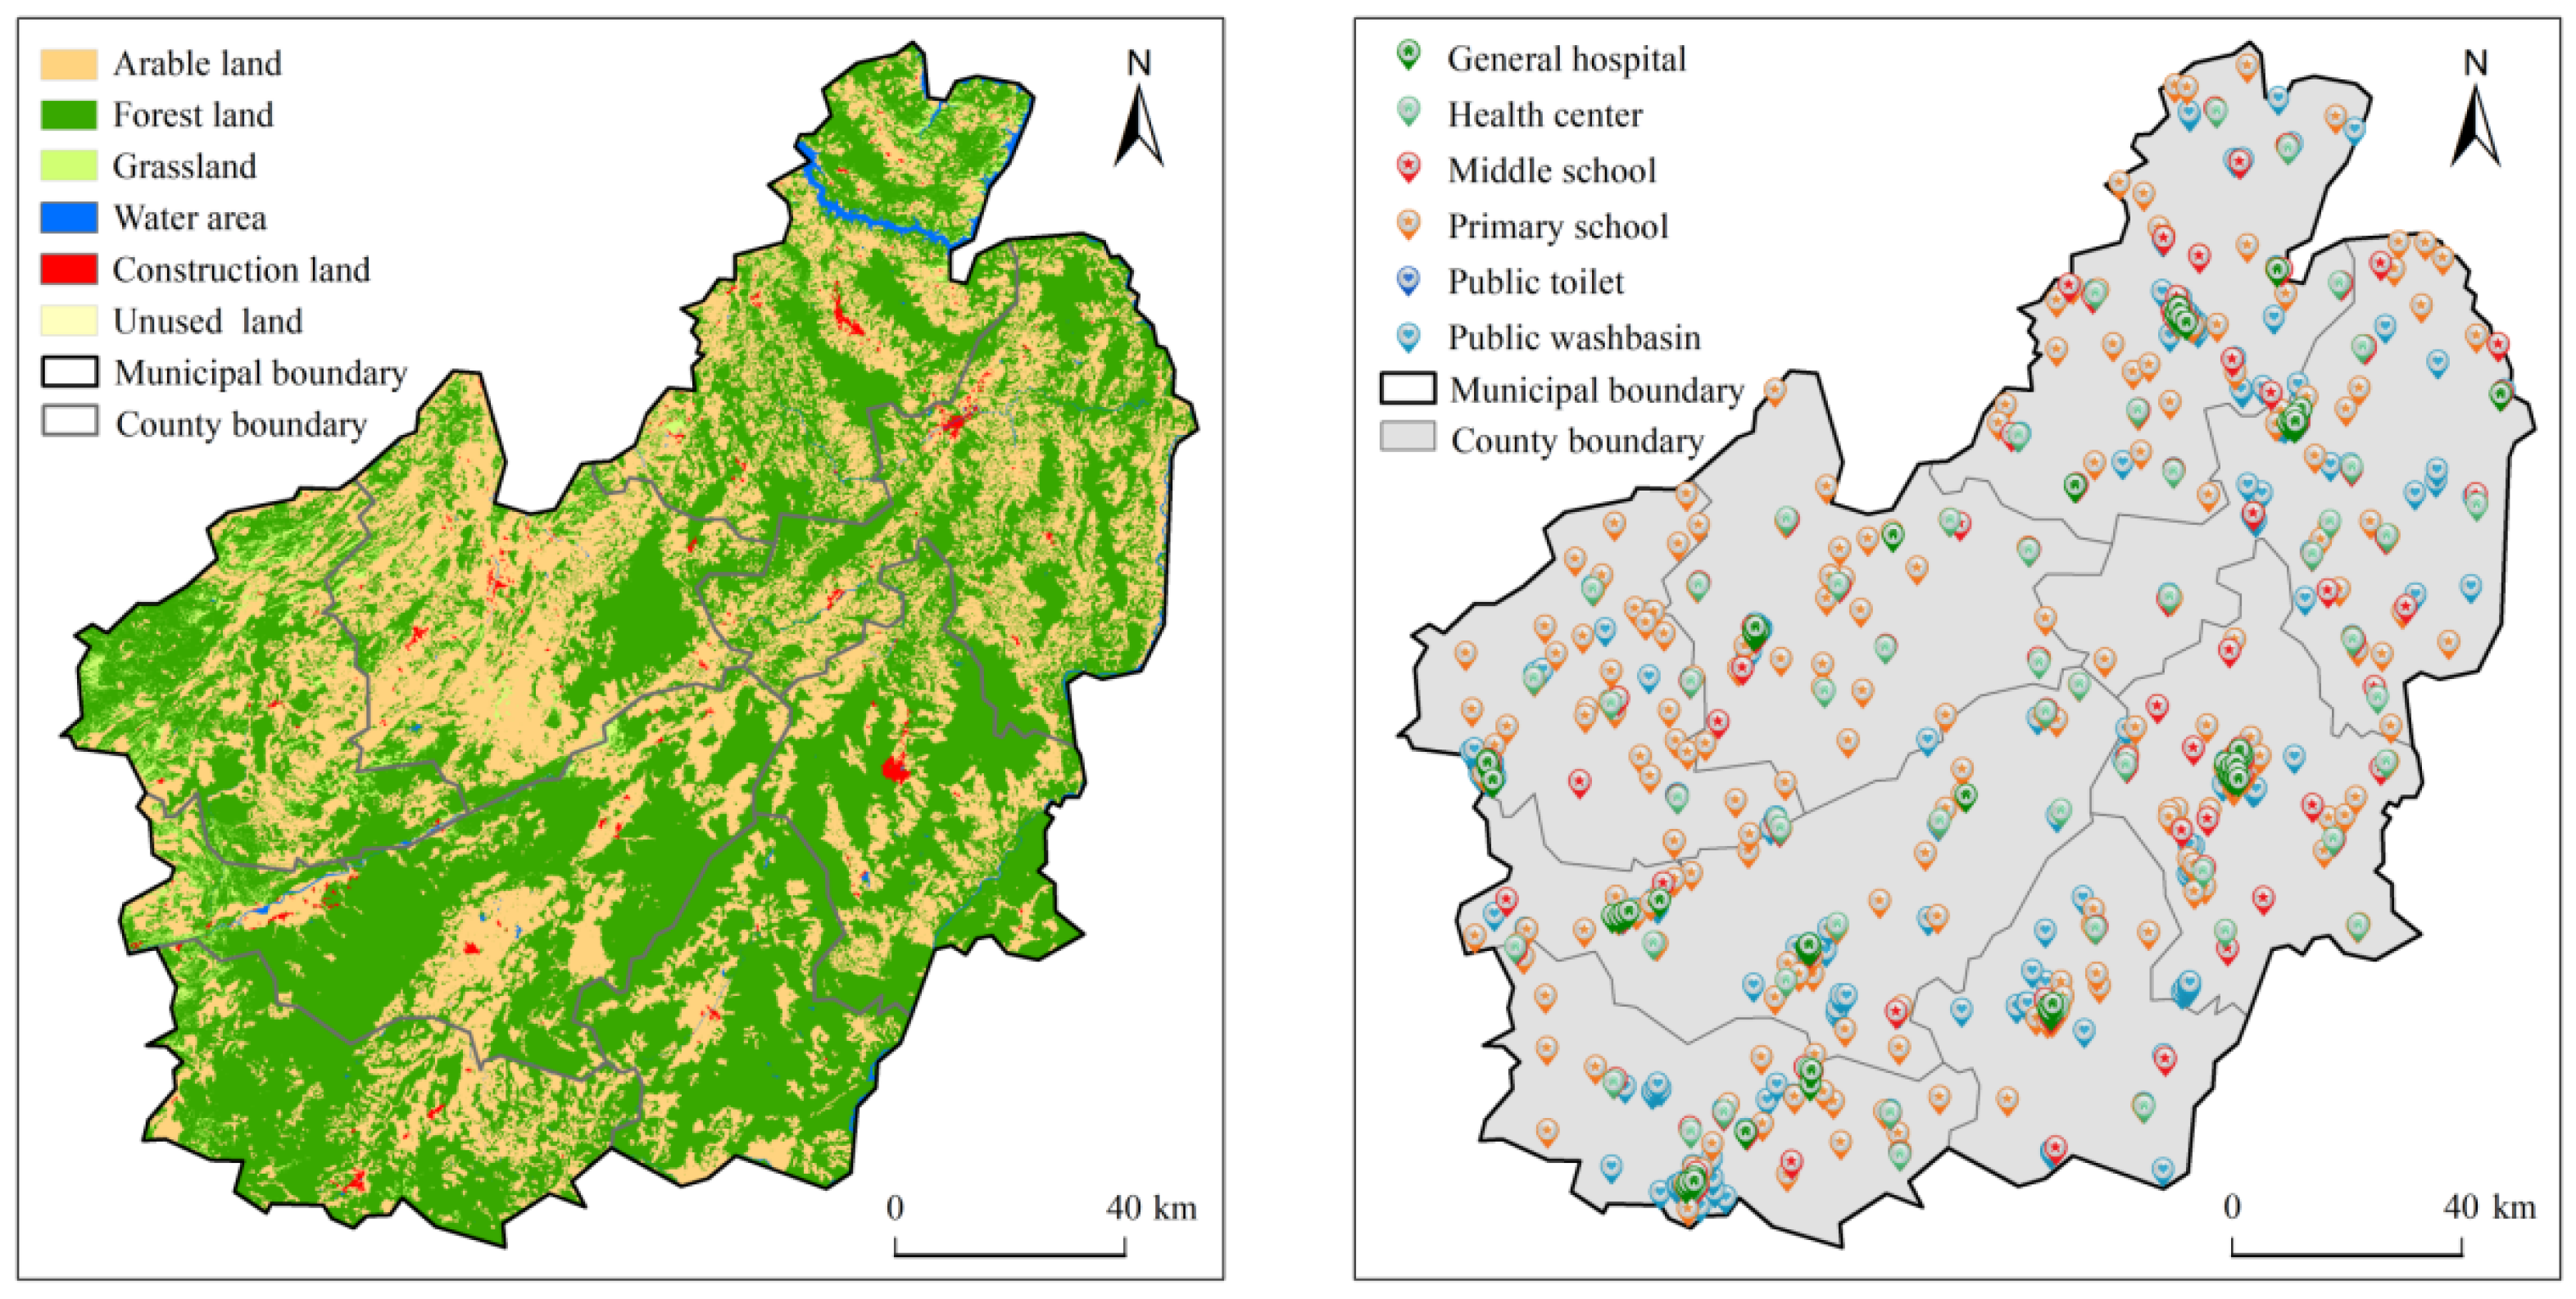
The landuse data in 2020 were derived from the landcover dataset GlobeLand30 (http://globeland30.org, accessed on 6 December 2021). This includes 30 m spatial resolution global landcover data developed by China based on Landsat TM5, ETM+, OLI multispectral imagery, HJ-1 multispectral imagery, and GF-1 multispectral imagery. In total, 11 level-1 types were included, with an overall accuracy of 85.72%; these include cropland, woodland, grassland, scrub, wetland, water, tundra, artificial ground, bare ground, glacier, and permanent snow (Figure 2).
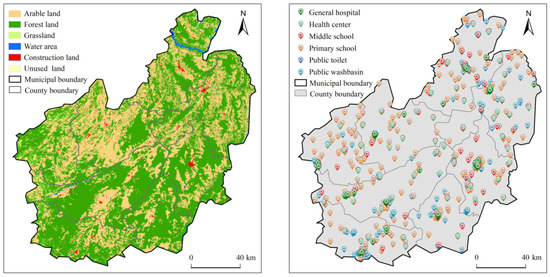
Figure 2.
Spatial distribution of land use and public facilities in Lincang.
2.2.2. Elevation Data
Elevation data were obtained from the Advanced Spaceborne Thermal Emission and Reflection Radiometer (ASTER) GDEM V3 dataset, available from NASA’s Earthdata website (https://search.earthdata.nasa.gov, accessed on 7 June 2021). With a spatial resolution of 30 m, ASTER provides the only high-resolution elevation imagery data with global land coverage. Elevation is a static variable and rarely changed. The ASTER GDEM V3 dataset used in this study was released in 2019.
2.2.3. Points of Interest (POI) Data
The POI data of public service facilities of Lincang in 2020 were obtained from the China Point of Interest (https://www.resdc.cn, accessed on 23 December 2021) at the Center for Resource Environmental Science and Data. Six types of facility data were extracted: general hospitals, health centers, secondary schools, primary schools, public toilets, and public wash basins (Figure 2).
2.2.4. Socioeconomic Statistics
Socioeconomic data in 2020 were obtained from the Lincang Statistical Yearbook, the Lincang National Economic and Social Development Statistical Bulletin, the Earth Big Data-Supported Assessment Report on the Progress of SDGs in Lincang, official statistics on poor households in Lincang, and information provided by government departments.
2.2.5. Road and River Network Data
Road network data included those on railways extracted from Open Street Map (OSM) (https://www.openstreetmap.org/, accessed on 7 December 2021) and highways at all levels provided by the Lincang Transportation Bureau. River network data were also extracted from Open Street Map (OSM) (https://www.openstreetmap.org/, accessed on 7 December 2021). They are dated in 2020.
2.3. Method
2.3.1. Public Service Facility Accessibility Assessment
We chose a minimum cumulative cost distance to calculate public facilities accessibility as it is readily interpretable and is known to be a predictive metric in research domains [8,24,25,46,47,48,49,50]. And, minimum cumulative cost distance better captures the opportunity cost of travel than Euclidean or network distance [24]. All areas in the study area are represented by pixels with a spatial resolution of 30 m. The travel time cost raster was quantified by setting the speed of people passing through each pixel in the study area and obtaining the travel time for each pixel. Then, a minimum cost path algorithm was used to calculate the shortest traveling time from each pixel to the nearest public facility by combining the public facility and the time cost raster.
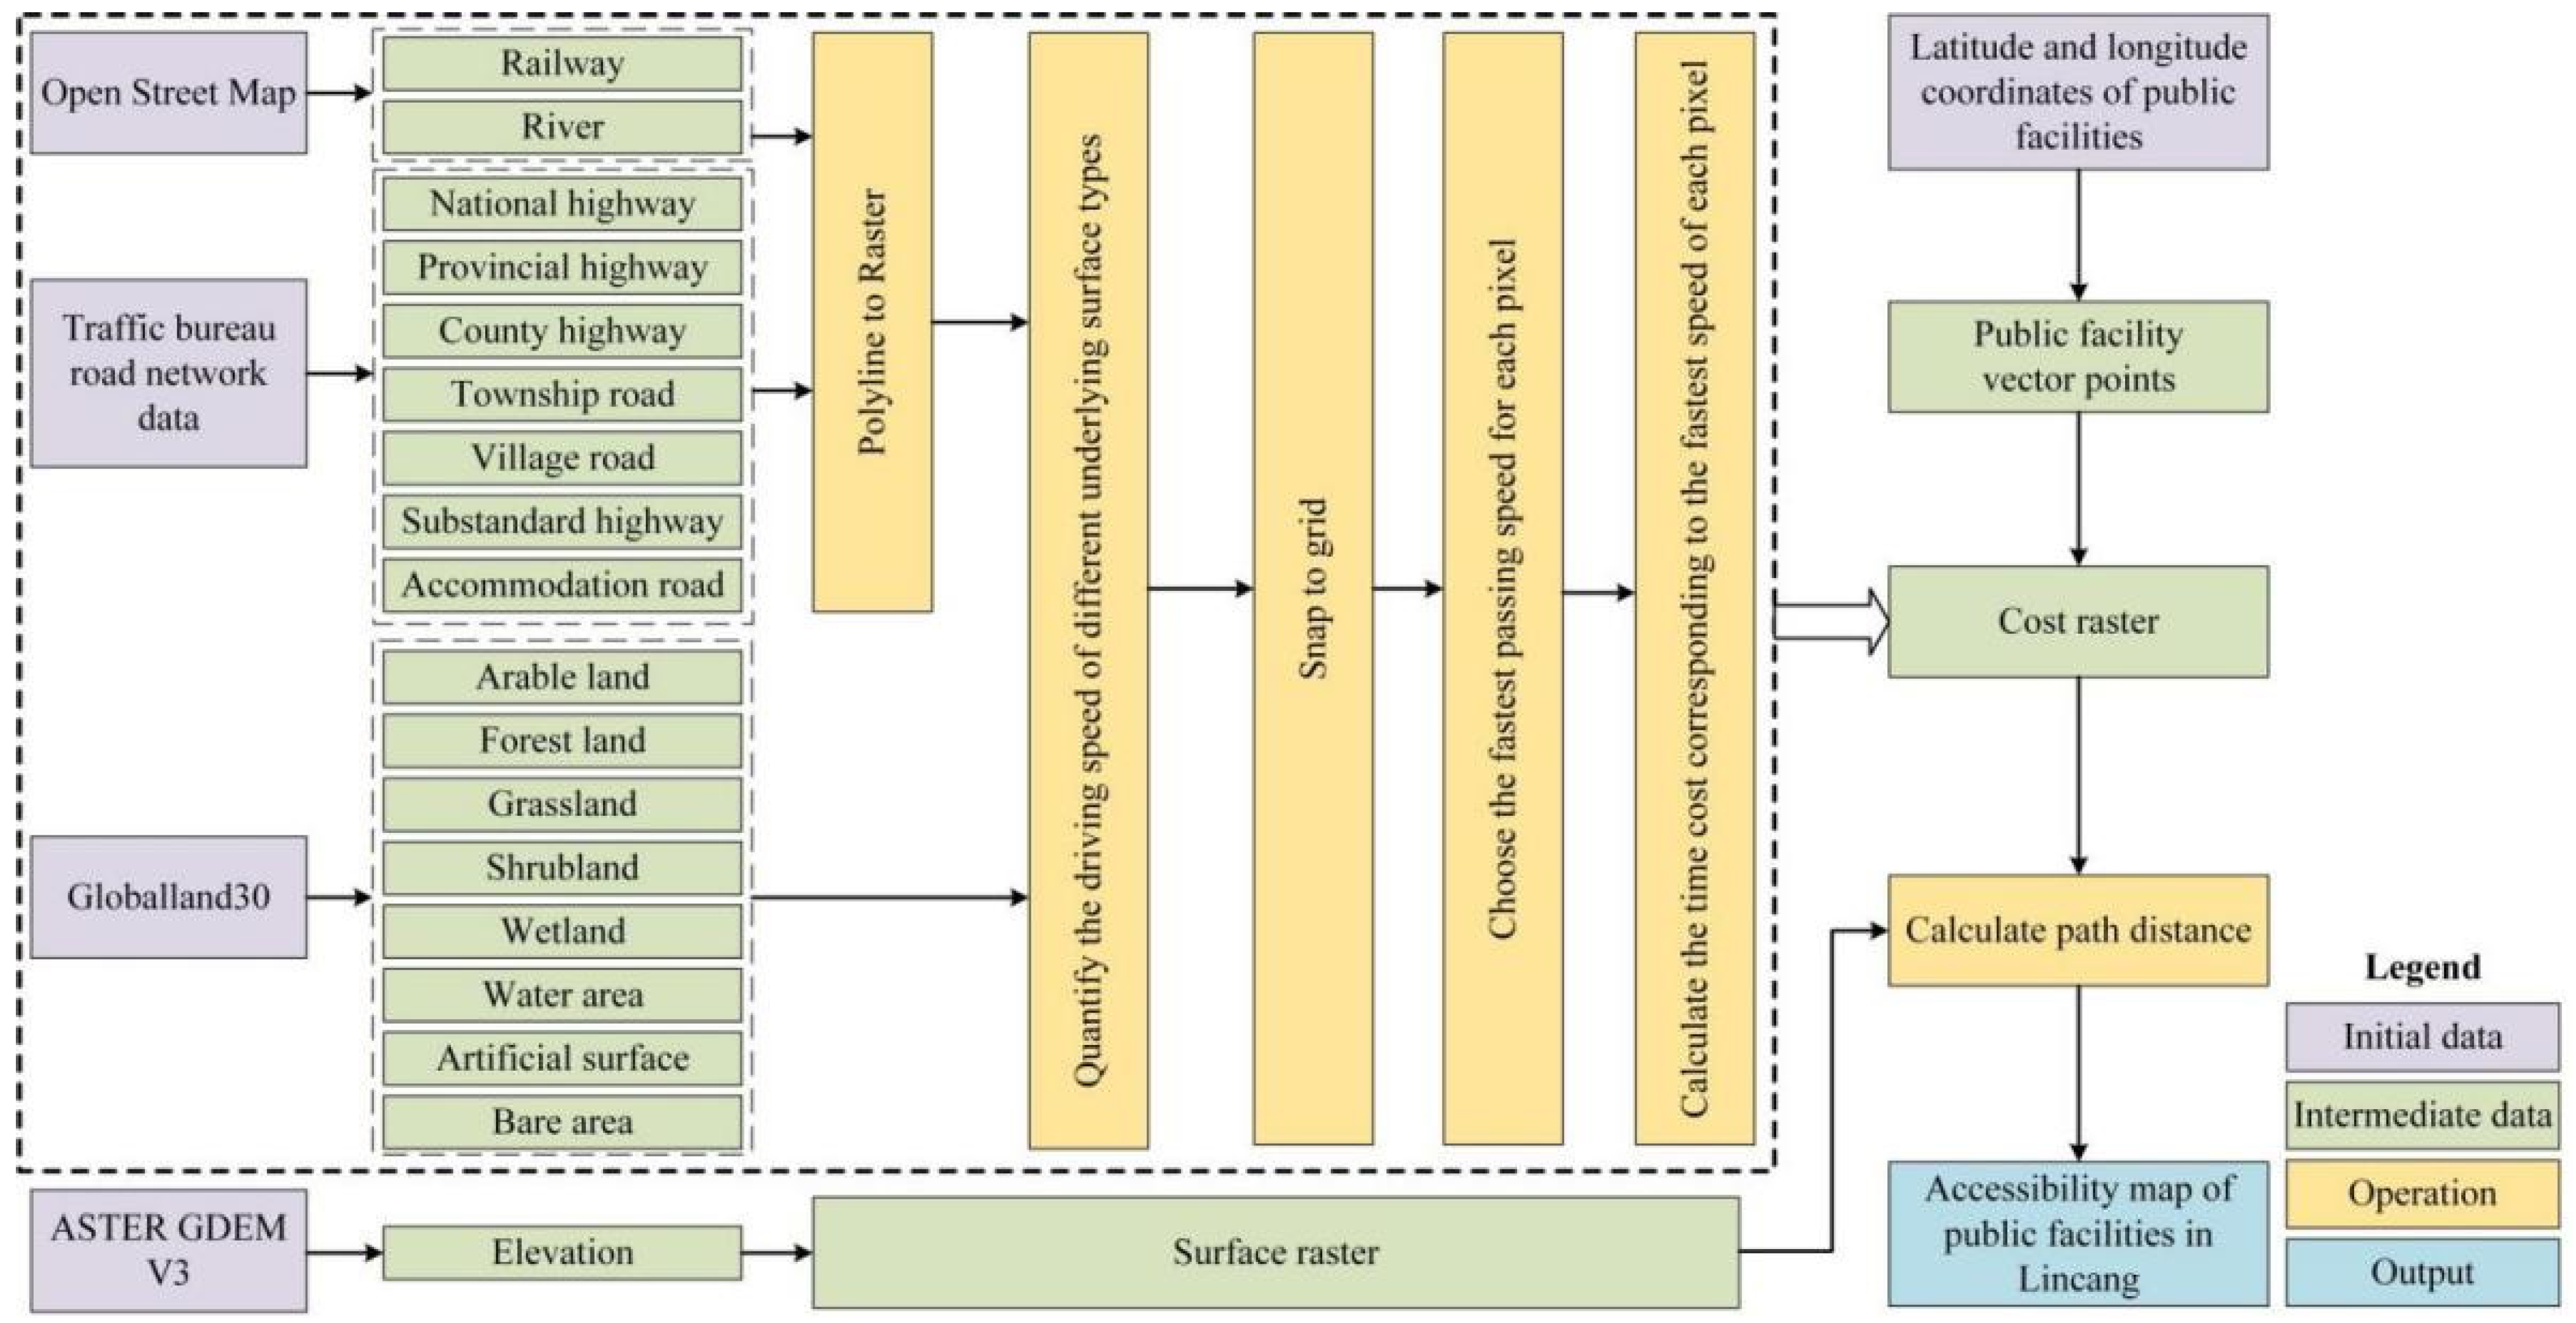
Figure 3 shows the main calculation process, which is generally divided into four steps, as follows:
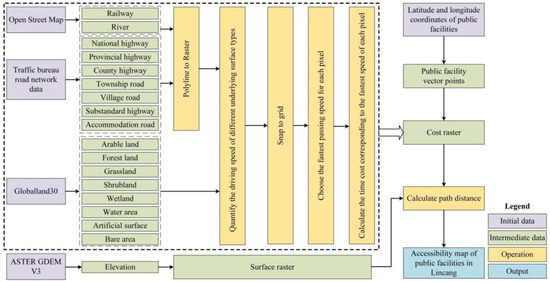
Figure 3.
Flowchart for calculating the accessibility of public facilities.
- (1)
- Generate the passing speed raster layer. Railway, river, and road data were extracted from the OSM dataset and the road network dataset provided by the Lincang Transportation Bureau. The corresponding speeds were assigned in the attribute table. Then, they were converted into a raster with a spatial resolution of 30 m. The pixel values were the corresponding traffic speeds of each type of railway, river, and road. For areas not covered by roads and rivers, we extracted land-cover and land-use type data from the Globeland30 dataset and assigned the corresponding traffic speed (walking) to the pixels of each type. Table A1 shows the specific settings of traffic speed for different types of pixels. In the case of multiple underlying surface types in a pixel, the type with the highest speed was preferentially selected to generate the final passing speed raster data.
- (2)
- Calculate the cost raster. The pixel size was divided by the highest passing speed of the 30 m spatial resolution passing speed raster data obtained above to calculate the minimum passing time of each pixel and obtain the cost raster.
- (3)
- Calculate the path distance. We used path distance analysis [51] to calculate the minimum cumulative cost distance (shortest travel time) between each pixel and its nearest public facility combined with the cost raster and elevation as the surface raster, taking into account the surface distance as well as horizontal and vertical cost factors to modify the cost.
- (4)
- Map the spatial layout of public facility accessibility. Finally, we completed the accessibility evaluation of three types of infrastructure (healthcare, education, and sanitation) and drew the accessibility map.
The detailed calculation steps for path distance are as follows:
- (1)
- Prepare the surface raster. Path distance analysis is generally used to calculate the least-cost path between a source and a destination, while accounting for the surface distance and the horizontal and vertical factors [51]. As Lincang is mostly mountainous, the effect of terrain fluctuations on traffic speed needs to be considered. Therefore, we extracted 30 m spatial resolution elevation data from the ASTER GDEM V3 dataset as the surface raster for traffic speed adjustments.
- (2)
- Generate vector point data of public facilities. Based on the latitude and longitude coordinates of public facilities provided in the POI data, vector point data were generated for Lincang General Hospital, the Health Center, primary and secondary schools, public toilets, and public washbasins.
- (3)
- Calculate the minimum cumulative cost distance. The traveling cost between two adjacent nodes depends on the spatial direction of the two nodes and the way the image elements are connected. The three cases included are the adjacent node cost, cumulative perpendicular cost, and diagonal node cost, the specific principles of which are detailed in [51].
2.3.2. Classification of the Inhabitants’ Socioeconomic Attributes
The fact that infrastructure construction satisfies the needs of various groups in society affects whether the development gap between these groups can be narrowed and whether society can develop in a harmonious and balanced manner. We selected four socioeconomic attributes directly related to inhabitants’ governance: population density, registered residence structure, age structure, and income level. Based on population density, inhabitant clusters are classified into two types: high density and average density. The registered residence structure is based on the proportion of local population to the resident population. Therefore, the inhabitants are classified into three types: local population (clusters with predominantly local household populations), mixed population, and foreign population (clusters with predominantly nonlocal household permanent residents). In terms of age structure, we used the proportion of the elderly population to the total population as an indicator to classify inhabitants into aging and nonaging clusters. Inhabitants are classified into high-income, middle-income, and low-income types based on the level of per capita annual disposable income (Table 1).

Table 1.
Classification and grading criteria for the socioeconomic attributes of the Lincang inhabitants.
To describe and analyze the accessibility of public facilities to Lincang inhabitants with different socioeconomic attributes, the inhabitant clusters are classified and named as follows. The naming rule is “population density-age structure-household structure-income level”. Each name corresponds to a specific inhabitant clusters type, resulting in a total of 36 inhabitant clusters with different socioeconomic attributes. For example, “Gd-N-Fp-L” stands for general density, nonaging, foreign population, low-income inhabitant cluster. Table 2 presents a list of the different types of inhabitant clusters.

Table 2.
Designations of inhabitant clusters with different socioeconomic attributes.
2.3.3. Cluster Identification of Poverty Groups
The impact of infrastructure accessibility on different poverty groups is a theoretical basis for providing accurate poverty alleviation policies. This study used poverty alleviation system data, combined with machine learning methods, to identify poverty groups in multiple dimensions to analyze differences among poverty groups. Using multifactor analysis to deal with continuous and categorical variables in the poverty alleviation data [52], we obtained four poverty dimensions: family background, ethnicity and self-development, geographic environment, and health and labor (Table A2). Based on the identification of poverty dimensions, we used the k-medoids clustering method for differential group identification [53]. This method is based on real sample points and is more robust to noise. The clustering results obtained by this method are more accurate; thus, it is more conducive to the accurate identification of poverty groups. The differences in each attribute among different poverty groups were analyzed by ANOVA and the Games–Howell pairwise comparison test [54]. Meanwhile, the Chi-square test was used for proportional attributes, and the Bonferroni adjusted z-test was used for post hoc comparative analyses for groups with significant differences [55]. The final groups of differentially poor people are determined as shown in Table 3.

Table 3.
Poverty group clusters.
There are significant differences between the different groups. The first poverty group is “ethnic minorities and large-scale families”. Ethnic minorities make up the largest proportion of this group at 62.37%. Households are relatively large, with an average household size of 4.25 persons. The second group of poor people is “young and geographically favored”, the majority of whom are young or middle-aged (58.50%). They live in a geographically favorable area compared with the other groups. This group is dominated by migrant and nonagricultural workers (68.62%). The third group of poor people is “older and less educated”. There are many elderly people (>60 years) in this group, with an average age of 65.42 years. The level of education is low, with an illiteracy rate of 51.28%. The fourth poverty group is “sick, disabled, and lonely”. People in this group are in poor health, have insufficient working capacity, and have few family members. Most in this group are elderly people left behind in rural areas.
3. Results
3.1. Spatial Patterns of Accessibility to Public Service Facilities
3.1.1. Accessibility to Healthcare Facilities
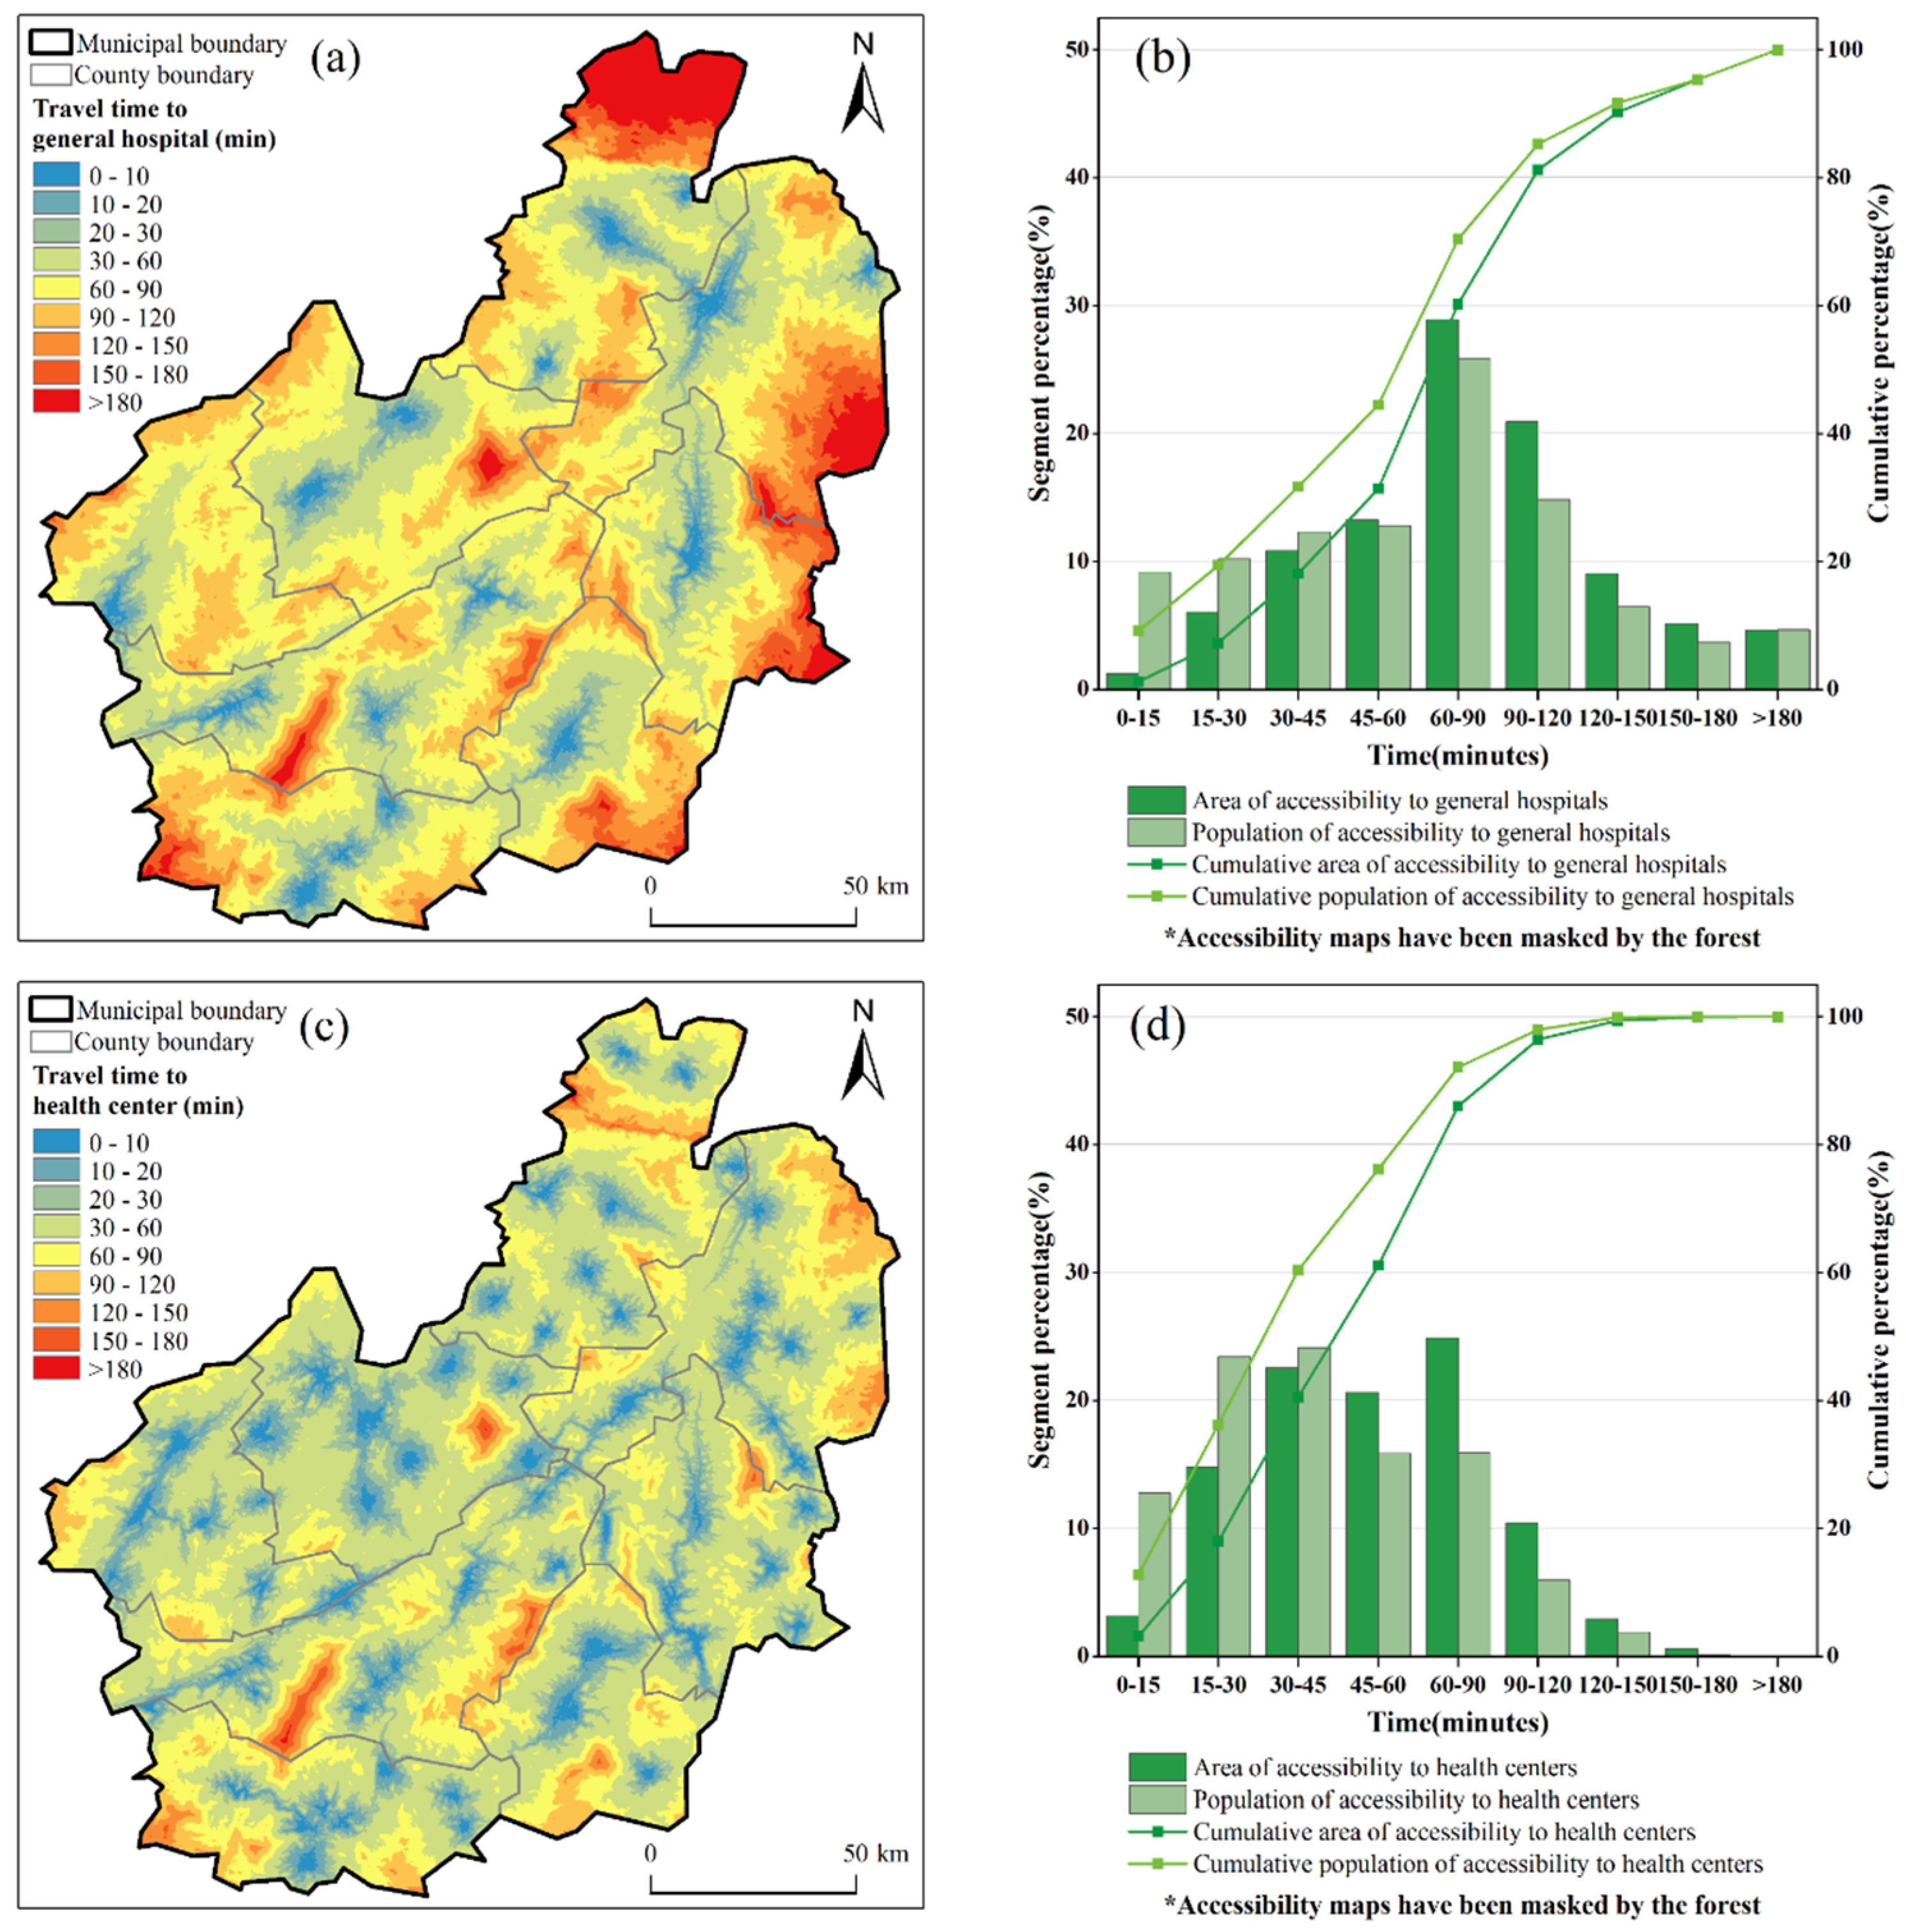
Figure 4 shows the accessibility map of medical and health centers and the proportion of cumulative population in Lincang. The map of minimum travel times to general hospitals and health centers (Figure 4a,c) shows spatial heterogeneity in the accessibility of healthcare facilities in Lincang, with a spatial resolution of 30 m. Overall, travel times to general hospitals are longer than to health centers, especially on the northern and eastern fringes of the study area. In terms of general hospital accessibility, each county has some small areas with high accessibility (blue areas in Figure 4a). We can assume that the distribution of general hospital resources in each county and district in Lincang is relatively balanced. Meanwhile, from the land use and land cover shown in Figure 2a, the areas with high accessibility to general hospitals are highly consistent with the zones of construction sites. The accessibility of health centers (Figure 4c) is much better than that of general hospitals, with significantly more and evenly distributed blue patches throughout the region. To further analyze the healthcare status of Lincang residents, we intersected the travel time maps of general hospitals and health centers with gridded demographic data and then quantified the proportion of the Lincang population that visited health facilities at each time period (Figure 4b,d). A total of 9.16% and 12.75% of the population lived within a 15 min travel time from general hospitals and health centers, respectively, and 31.68% and 60.31% lived within a 30 min travel time from general hospitals and health centers, respectively. Moreover, 44.48% and 76.17% of the total population lived within a 1 h travel time from nearby general hospitals and health centers, respectively. We found that through motorized transportation, 60.3% of the population lived within a 10 min travel time from a hospital or clinic, and 82.6% and 91.1% lived within 30 and 60 min travel time from a hospital or clinic, respectively. This shows that the accessibility of healthcare facilities in Lincang lags relatively behind.
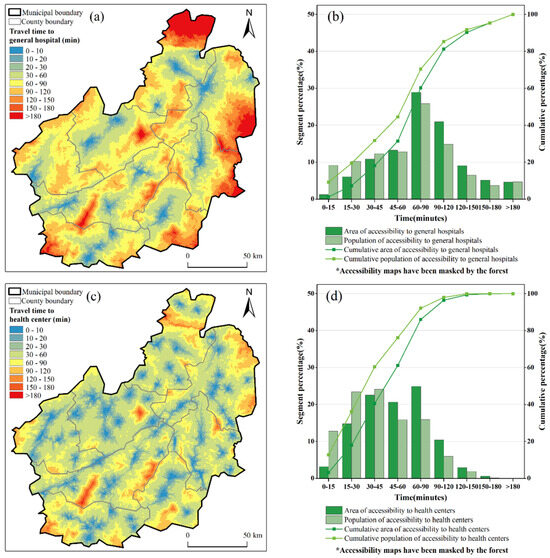
Figure 4.
Spatial patterns of medical facility accessibility and cumulative population ratio distribution in Lincang. (a) Minimum travel time to general hospitals. (b) Cumulative area and population ratio of accessibility to general hospitals at each time period. (c) Minimum travel time to health centers. (d) Cumulative area and population ratio of accessibility to health centers at each time period.
3.1.2. Accessibility to Educational Facilities
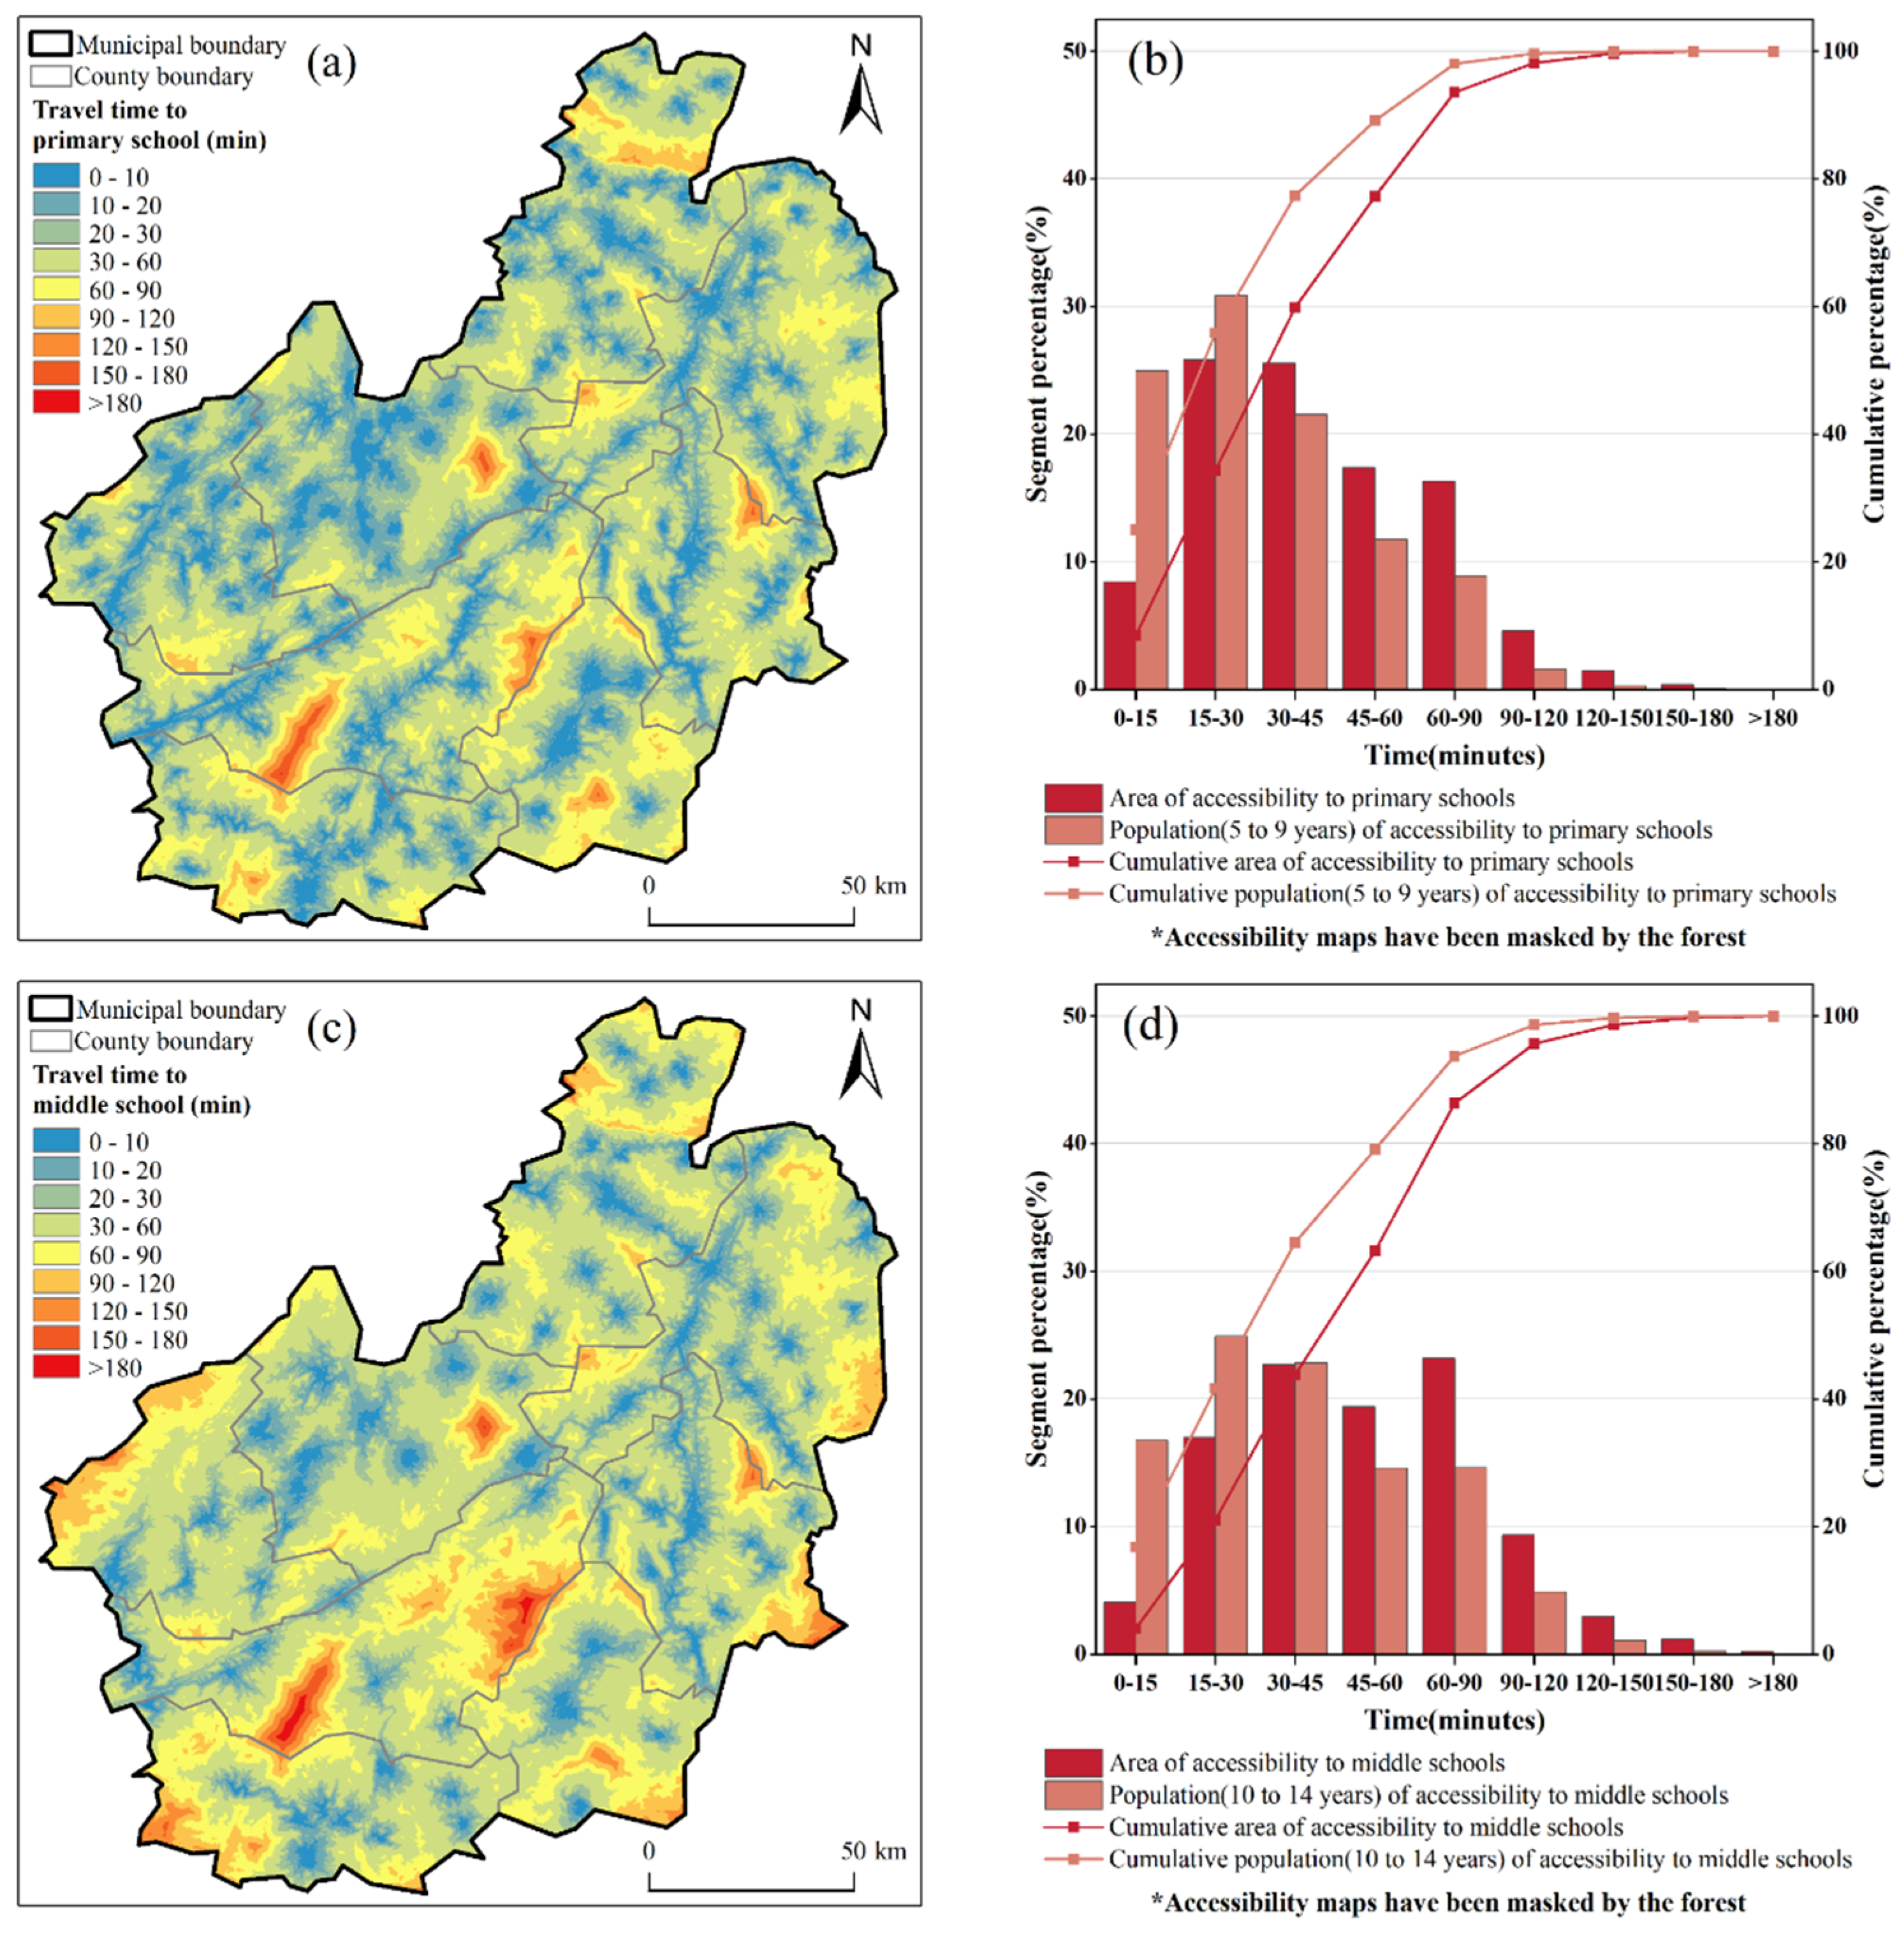
Figure 5 shows the accessibility of educational facilities and the cumulative percentage of the population in Lincang. Unlike the cumulative population distribution statistics for healthcare facilities, the population here only refers to the school-age population—that is, primary schools corresponds to the population aged 5–9 years old, and middle schools corresponds to the population aged 10–14 years old. Figure 5a,c show the spatial distribution of primary and middle schools accessibility, respectively, with a spatial resolution of 30 m. Comparing the two maps reveals that primary schools have significantly better accessibility than middle schools, and the difference in accessibility between the two is most obvious in the southwestern part of the city. To further analyze accessibility for the school-age population, we cross-tabulated the primary and middle schools travel time maps with data for the 5–9-year-old population and the 10–14-year-old population, respectively. We quantified the proportion of the population that arrived at nearby primary and middle schools at different times. Figure 5b,d show the cumulative time taken by the populations aged 5–9 years and 10–14 years to attend nearby primary and middle schools, respectively. The results show that 24.98% and 16.75% of the school-age population live within a 15 min travel time to primary and middle schools, respectively, and 55.85% and 41.68% of the school-age population live within a 30 min travel time to primary and middle schools, respectively. The proportion of the school-age population that can reach nearby primary and middle schools within 1 h is 89.15% and 79.12%, respectively. The accessibility of educational facilities in Lincang is thus noticeably better than that of medical facilities.
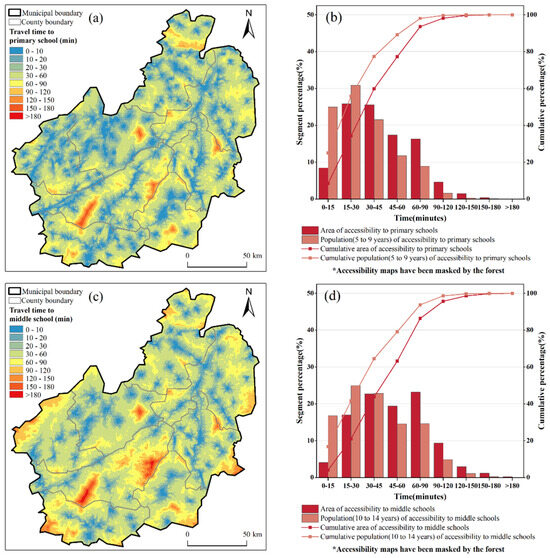
Figure 5.
Spatial patterns of educational facility accessibility and cumulative population ratio distribution in Lincang. (a) Minimum travel time to primary school. (b) Cumulative area and population ratio of accessibility to primary school at each time period. (c) Minimum travel time to middle school. (d) Cumulative area and population ratio of accessibility to middle school at each time period.
3.1.3. Accessibility to Sanitation Facilities
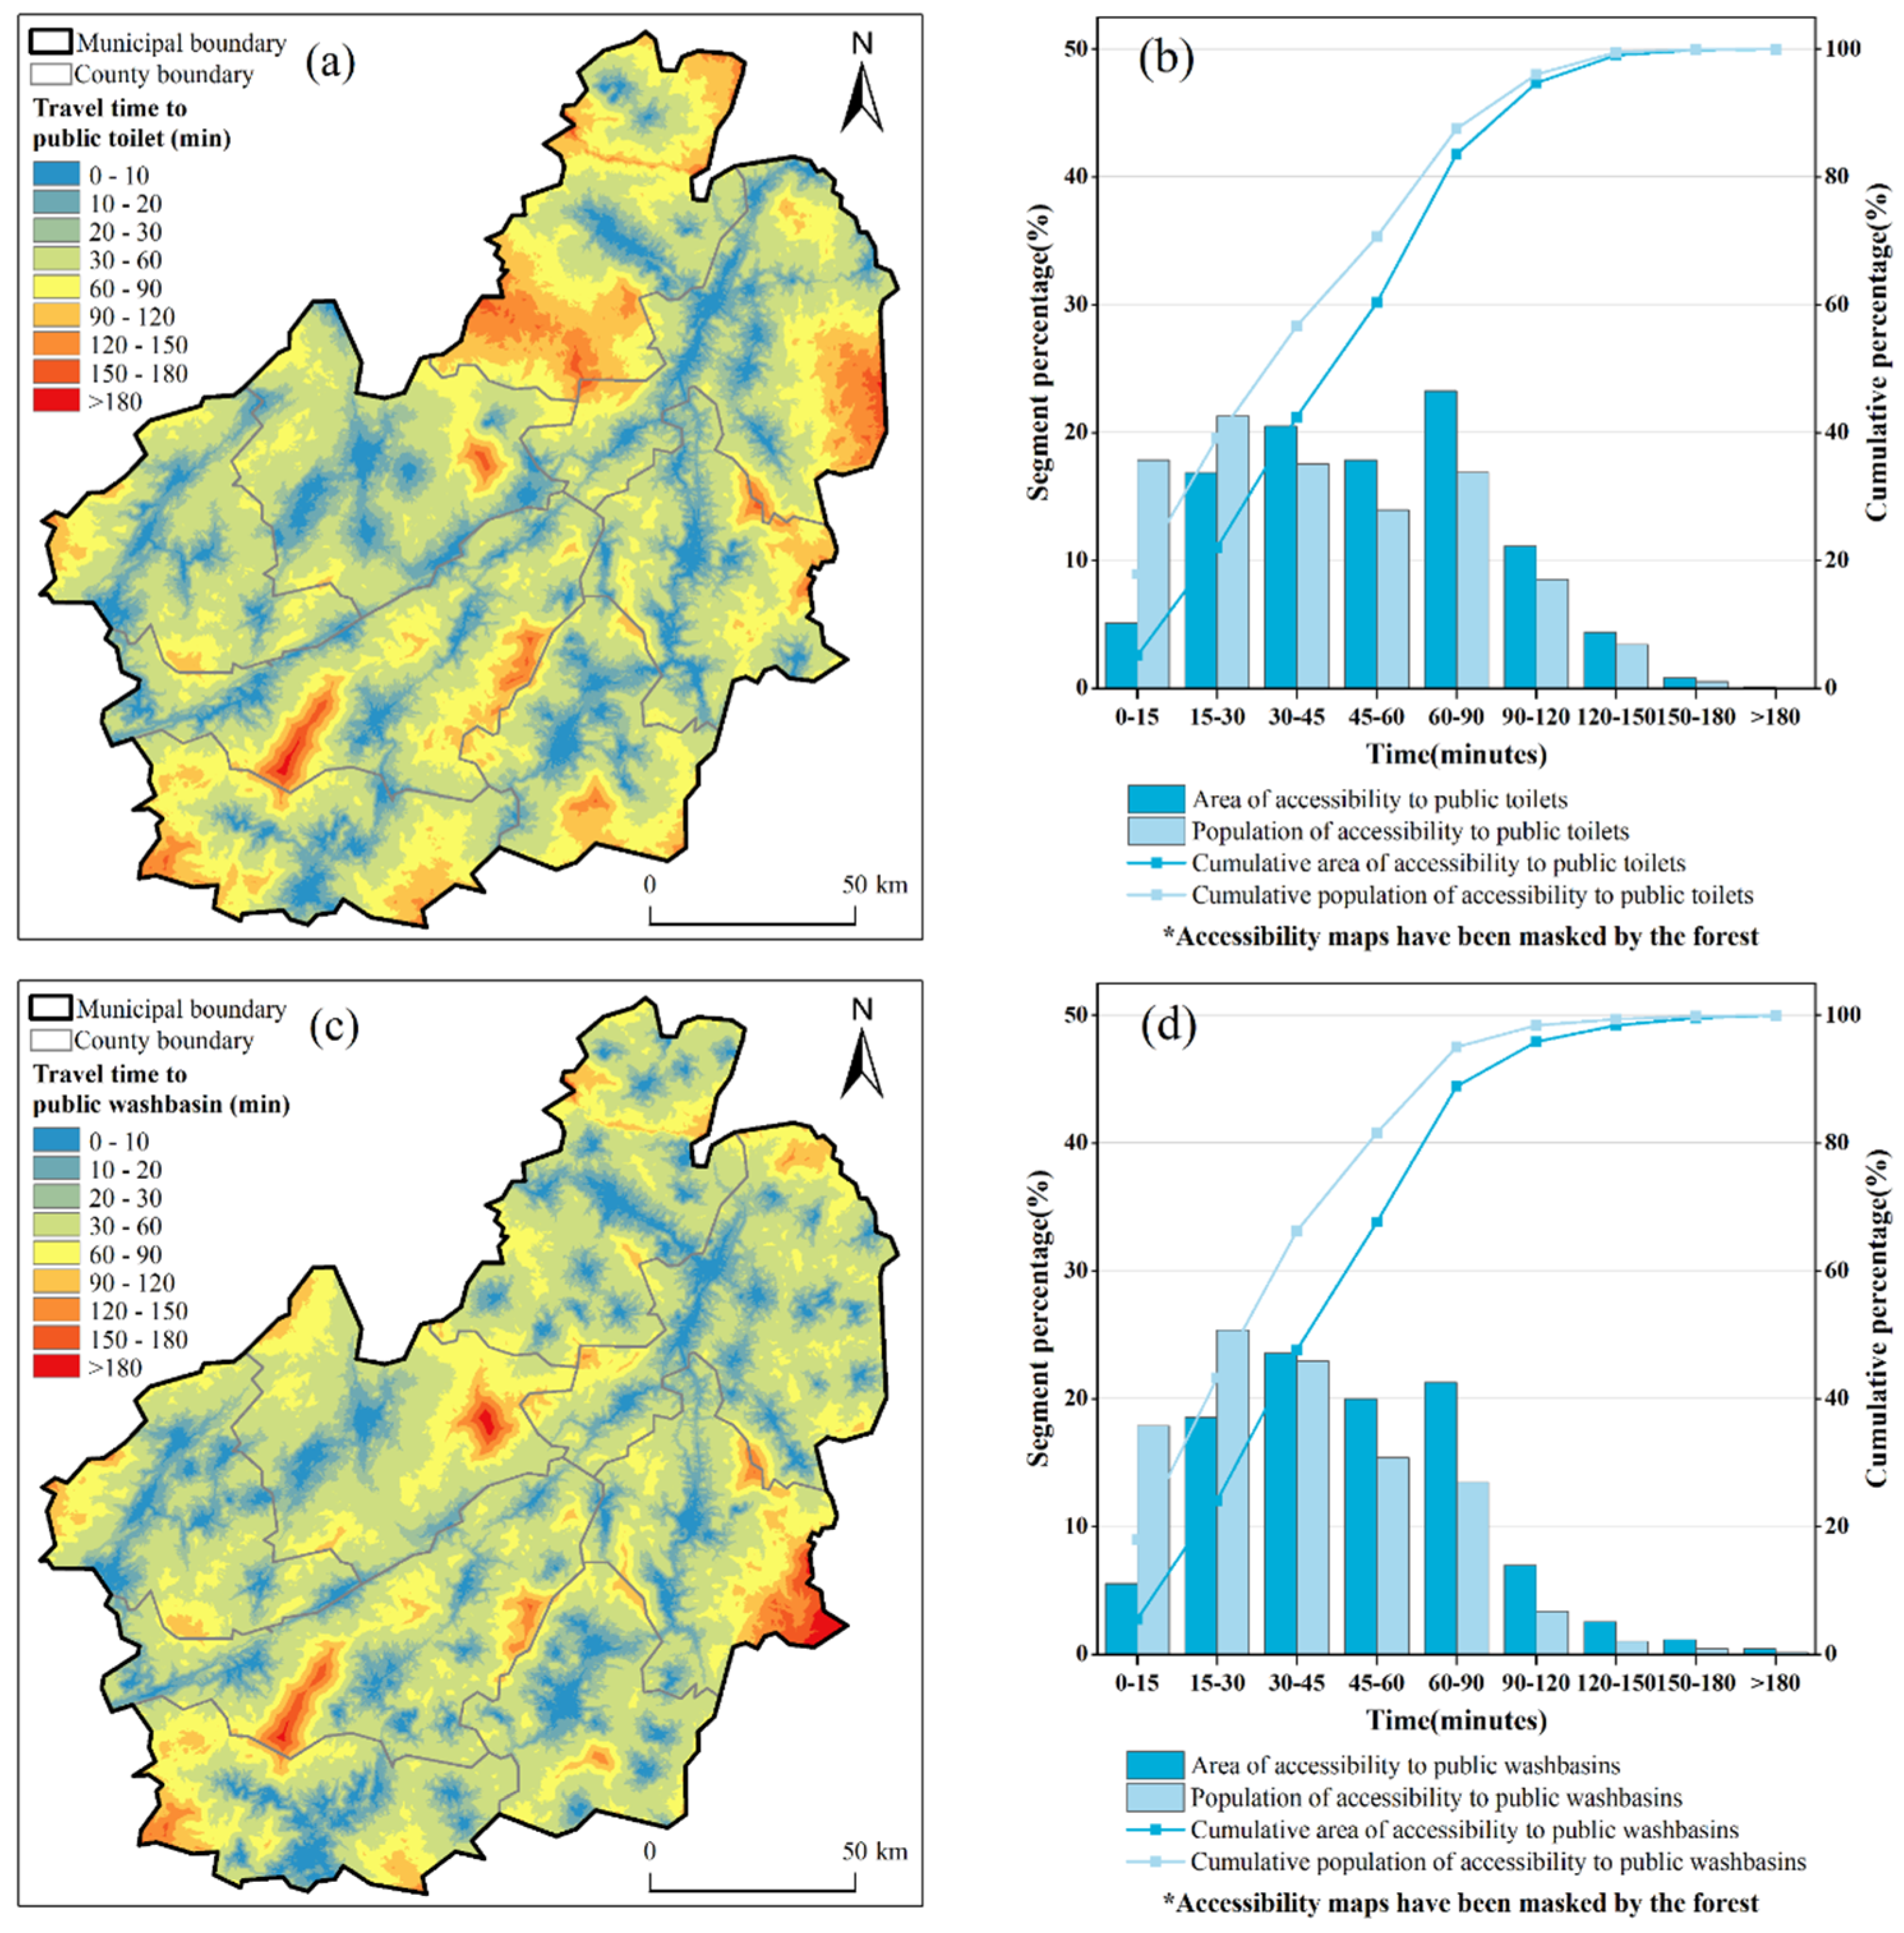
Figure 6 shows the results for sanitation accessibility and cumulative population ratio in Lincang. Considering data availability and representativeness, public toilets and public washbasins were selected to measure the accessibility of sanitation facilities. Among them, the public washbasins are a set of facilities responding to the “Patriotic Hygiene Special Action” in Yunnan Province, representing characteristic sanitation facilities in the province. Figure 6a,c show the spatial heterogeneity of the accessibility of public toilets and washbasins, respectively, with a spatial resolution of 30 m. We can see that the accessibility of public washbasins in Lincang is slightly better than that of public toilets and that the overall distribution is spread out at multiple points. The public toilets and public washbasins accessibility maps are cross-tabulated with the gridded population data of Lincang to calculate the proportion of the population that takes time to reach nearby public toilets and public washbasins (Figure 6c,d). The results show that 17.88% and 17.85% of the population live within a 15 min walk from a public washbasins and public toilets, respectively, and 43.25% and 39.15% of the population had access to nearby public toilets and public washbasins within 30 min, respectively. Moreover, 81.59% and 70.66% of the city’s population live within 1 h of a public toilets and public washbasins, respectively.
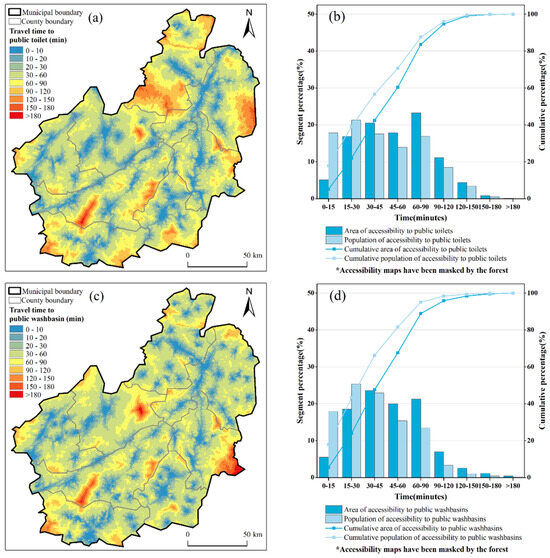
Figure 6.
Spatial patterns of sanitation facility accessibility and cumulative population ratio distribution in Lincang. (a) Minimum travel time to public toilets. (b) Cumulative area and population ratio of accessibility to public toilets at each time period. (c) Minimum travel time to public washbasins. (d) Cumulative area and population ratio of accessibility to public washbasins at each time period.
3.1.4. Comparison of Public Facility Accessibility in Lincang’s Counties and Districts
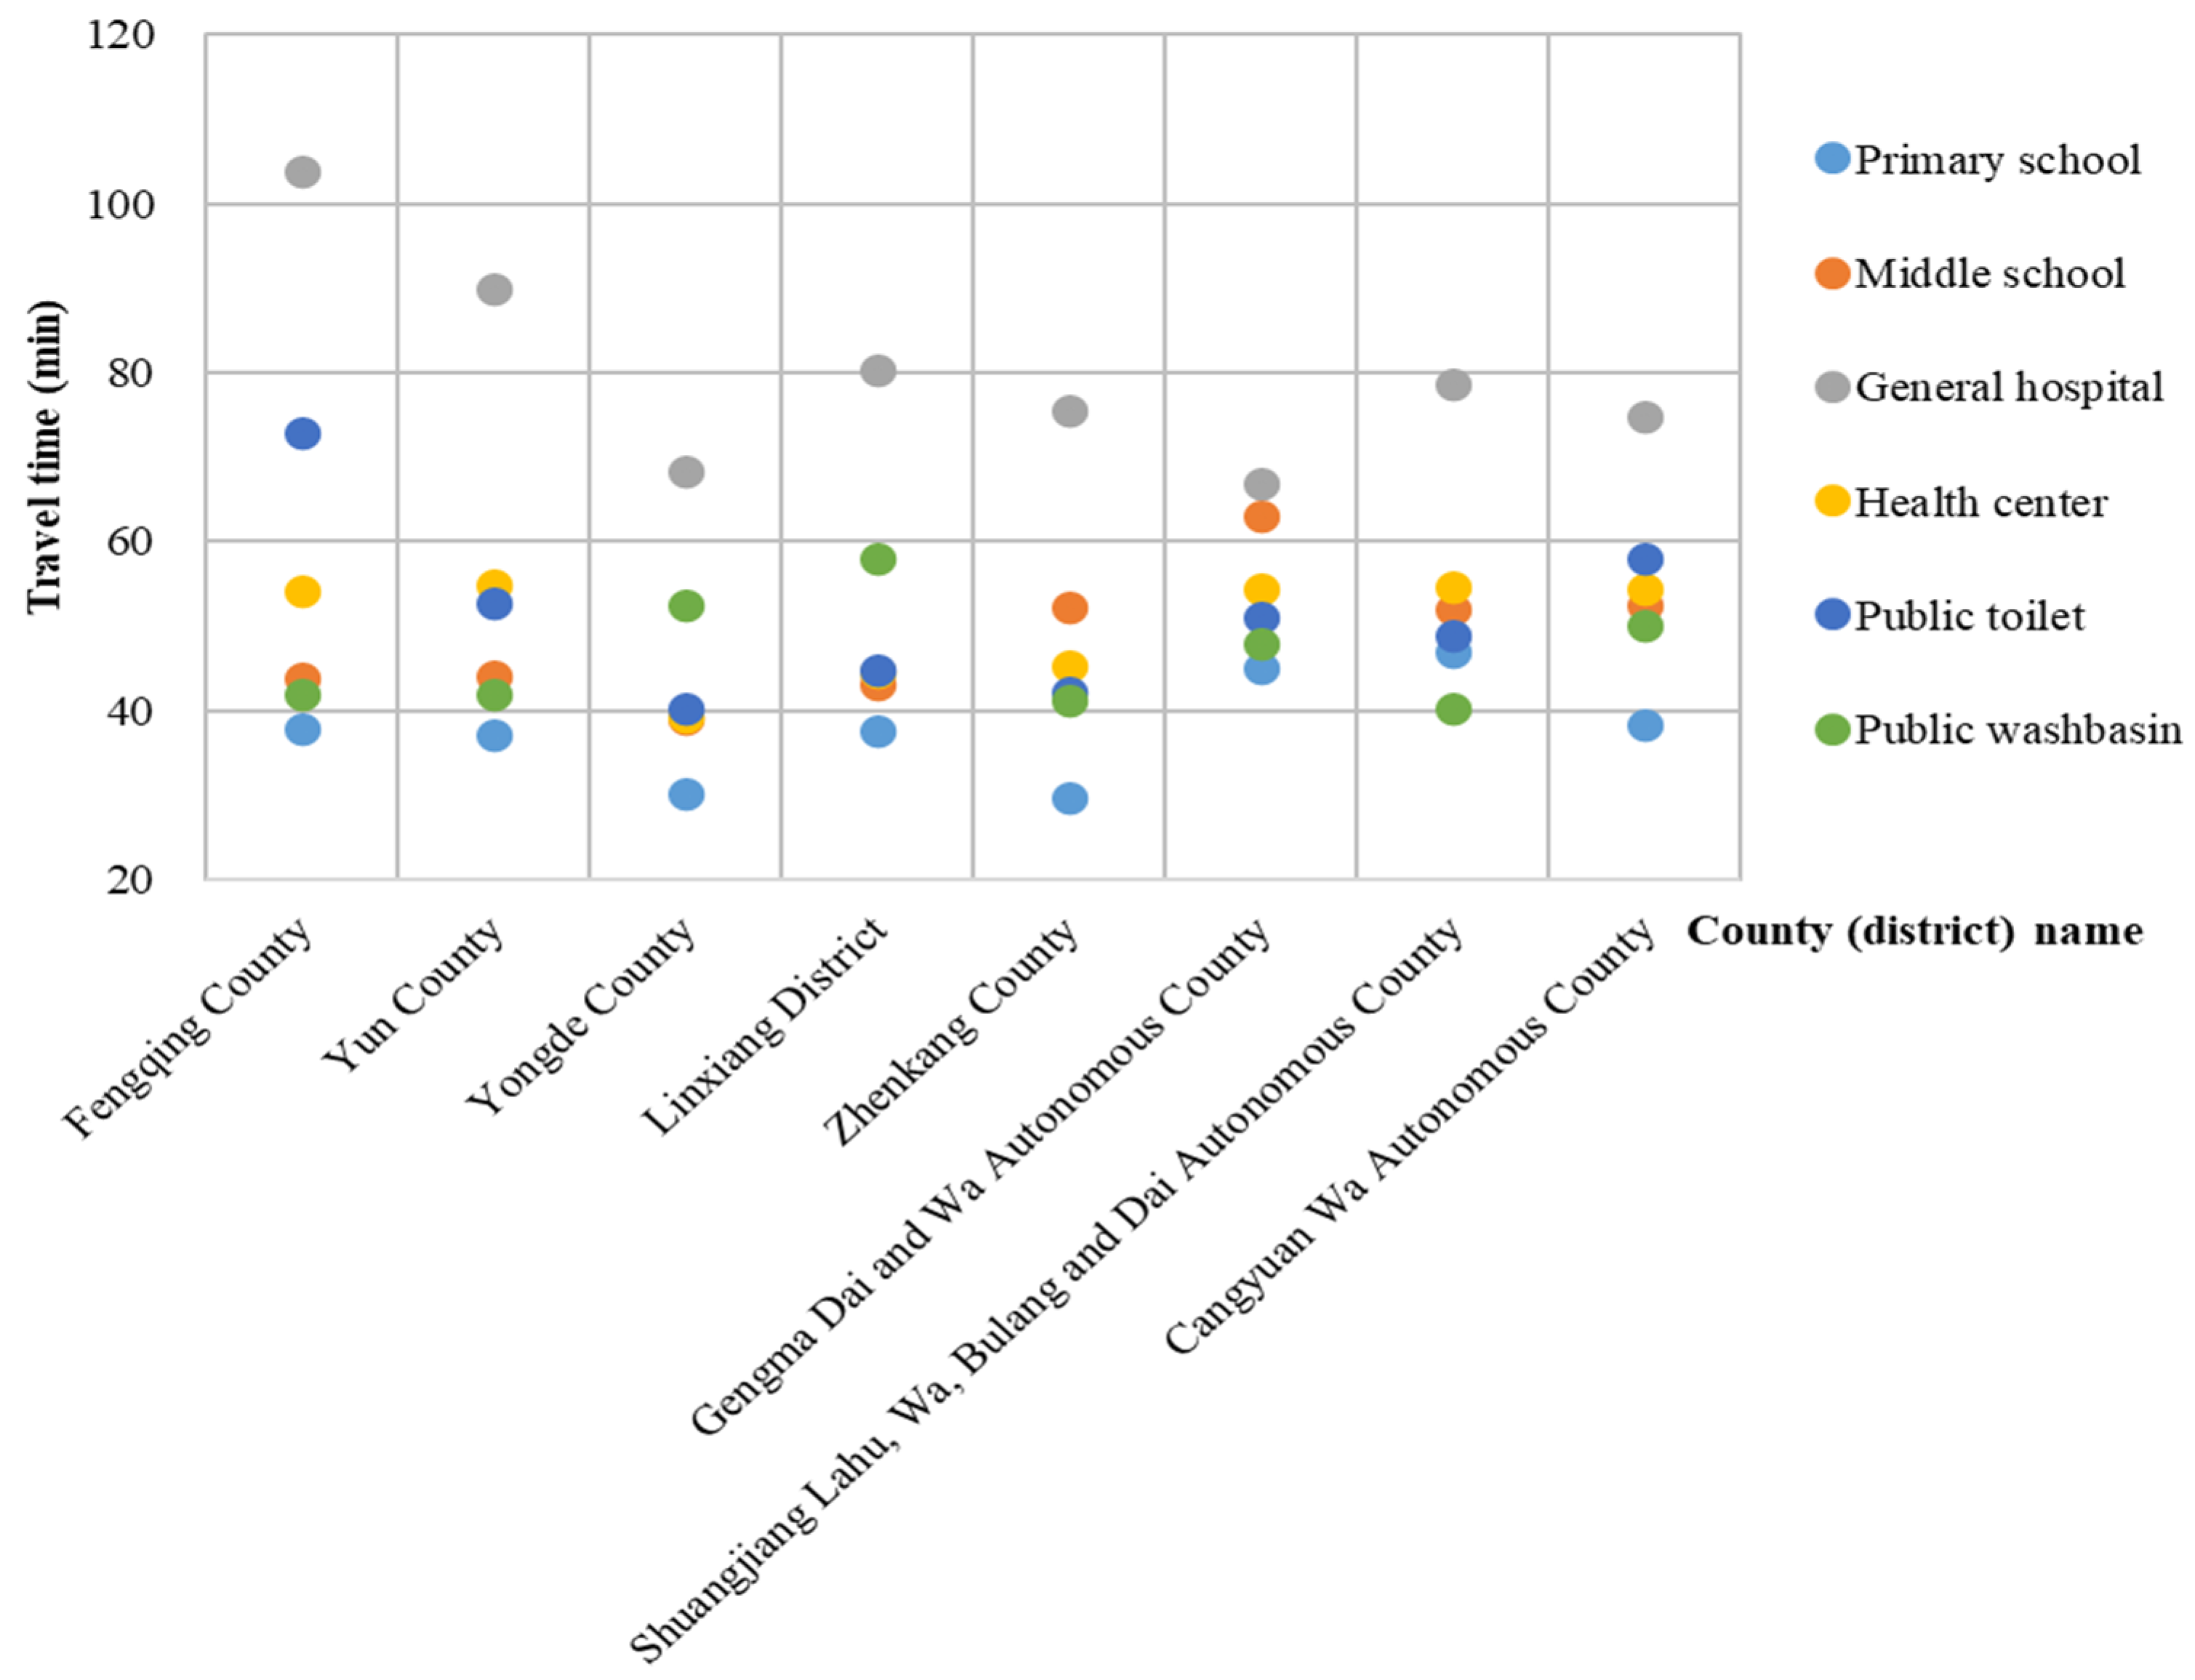
To further analyze the accessibility of public facilities in each county and district of Lincang, we counted the accessibility maps of primary schools, middle schools, general hospitals, health centers, public toilets, and public washbasins in Lincang by county and district (Figure 7). It can be seen that the accessibility of all types of public facilities in the seven counties and one district is the best in Yongde County and is the worst in Fengqing County. In terms of public facility type, the accessibility of primary schools in the study area is the best, and the accessibility of general hospitals is the worst. The accessibility of other types of public facilities varies from county to county, but most are concentrated in the travel time range of 40–60 min.
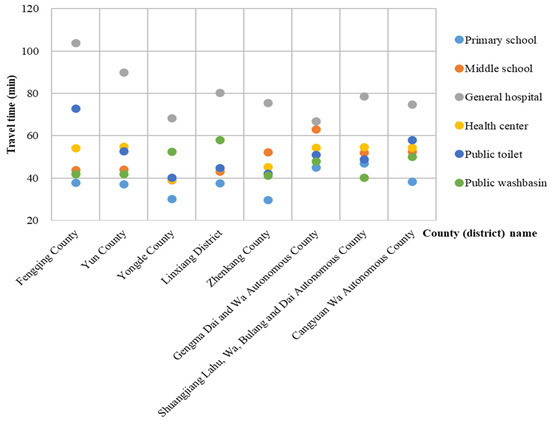
Figure 7.
Comparison of accessibility to public facilities in Lincang’s counties and districts.
3.2. Public Facility Accessibility Analysis Based on Different Inhabitant Attributes
3.2.1. Correlation Analysis of Inhabitant Attributes and Minimum Cost Distance
Studying differences in the economic and social attributes of the inhabitant clusters is conducive to providing differentiated and precise public infrastructure allocation. We used SPSS 22.0 to analyze the correlation between the minimum cost distance to medical, educational, and sanitation facilities and socioeconomic inhabitant attributes. Table 4 shows the Pearson’s correlation coefficients between the two variables. Population density is significantly and negatively correlated with the minimum cost distance to the three facilities, strongly correlated with accessibility to educational facilities (1% significance), and moderately correlated with accessibility to medical and health facilities (5% significance). This suggests that the minimum cost distance to the respective facility decreases with increasing residential population density. In other words, public facility accessibility is better in inhabitant clusters with high population densities. The level of aging is significantly and negatively correlated with the minimum cost distance to medical facilities (5% significance) and is weakly and negatively correlated with both educational facilities and health facilities (10% significance). This suggests that the minimum cost distance to the three types of public facilities decreases with aging, thus highlighting the propensity for justice between public facility accessibility and the elderly population. Income level is significantly and negatively correlated with the minimum cost distance to the three types of facilities. Overall, there is a significant negative correlation between population density, aging level, and income level and the minimum cost distance to public facilities. In addition, the local household registration rate is to some extent related to the least-cost distance to public facilities.

Table 4.
Pearson’s correlation coefficients between minimum cost distance and inhabitant attributes.
3.2.2. Average Analysis of the Accessibility to Public Facilities in Different Inhabitant Clusters
Statistically, there are 15 different types of inhabitant clusters in Lincang. Table 5 shows the minimum cost distance averages of the three types of public service facilities in different clusters. The means of the three types of public service facility accessibility differ among different inhabitant cluster types. In terms of healthcare facility accessibility, the Hd-N-Mp-H type of cluster requires the shortest average time, and the Gd-N-Lp-L type has the furthest cost distance. The comparison indicates that population density and income level have a strong influence on healthcare facility accessibility. In terms of the accessibility of educational facilities, Hd-N-Mp-H, Hd-N-Mp-M, and Hd-N-Fp-H are more accessible, with an average access time of 30 min or less. These clusters have high population densities and residents with moderate-to-high incomes. Sanitation conditions are more consistently distributed among most inhabitant clusters, but travel times are longer in the Gd-A-Lp-L and Gd-A-Mp-L clusters, which exhibit significant aging trends and low-income characteristics. In terms of the weighted-average least-cost distance, accessibility to public facilities is poorer in the Gd-A-Mp-L, Hd-A-Lp-L, Gd-N-Lp-L, and Gd-A-Lp-L neighborhoods, which mostly have lower population densities, low-income levels, and aging residents.

Table 5.
Average values for the accessibility of different types of inhabitant clusters.
3.3. Public Facility Accessibility Analysis Based on Attributes of Poor Groups
3.3.1. Correlation Analysis of Different Types of Poverty Groups and Least-Cost Distance
Studying the differences in infrastructure accessibility between different poor groups is essential for alleviating relative poverty, preventing the risk of returning to poverty, and achieving the equalization of public social services. Table 6 shows the correlations between the minimum cost distance of healthcare, educational, and sanitary facilities and the poverty level of different groups. The minimum cost distance of public infrastructure is positively correlated with the poverty level of poor groups at different significance levels. This indicates that improving infrastructure and basic public services is closely related to poverty alleviation. The mean values of accessibility to the three types of public services vary across poverty groups. Specifically, accessibility to healthcare infrastructure has a strong positive correlation with poverty levels in group 4, which is characterized by a large proportion of “sick, disabled, and lonely”. For this group, the main cause of poverty is “disease-related poverty”, and improvements in health infrastructure are likely to be more effective for alleviating their poverty. Poverty levels are positively correlated at the 1% significance level with access to educational facilities for group 3, which is characterized by an “older population with a low level of education”. The main reason for poverty in this group is “poverty due to lack of schooling”, and being far away from educational facilities is not conducive to alleviating their poverty. The poverty status of different poor groups is to some extent related to the minimum cost distance to a sanitation facility, but it does not show significant differences. In Lincang, as a multiethnic underdeveloped border region, group 1 is the main type of poor population, characterized by “ethnic minorities and large-scale families”. The accessibility of medical, educational, and sanitation infrastructure for this group is poor, and improving infrastructure thus plays an important role in alleviating their poverty.

Table 6.
Pearson’s correlation coefficients between minimum cost distance and poverty groups.
3.3.2. Analysis of Average Accessibility to Public Facilities among Different Poor Groups
We further analyze the mean least-cost distance to public service facilities among different poverty groups. As shown in Table 7, the three public service facility accessibility averages differ significantly across poverty groups. In terms of the weighted-average distance to public facilities, group 2 has the strongest accessibility, groups 1 and 3 have the second-highest accessibility, and group 4 has the worst accessibility. Group 4 is characterized by poor health, insufficient working capacity, and few family members. The majority of this group are elderly people left behind in the countryside, and infrastructure development is important for lifting them out of poverty. Most of group 2 are young and middle-aged people, and the accessibility of infrastructure and public services plays a positive role in helping them get out of poverty and achieve their own development. The poor accessibility of health and sanitation infrastructure in group 1 is attributable to the fact that this group is dominated by ethnic minorities who mostly live in remote mountainous areas. The lack of infrastructure further inhibits their survival and development. Thus, the improvement of public service infrastructure is conducive to poverty eradication in these ethnic areas.

Table 7.
Average values for the accessibility of different poverty groups.
4. Discussion
First, in terms of healthcare facility accessibility, the distribution of general hospitals in each county and district of Lincang is relatively balanced. The accessibility of health centers is much better than that of general hospitals, which confirms that the higher the level of public health infrastructure, the lower the balance of its spatial layout; meanwhile, the lower the level of health infrastructure, the more balanced the spatial layout [56]. The accessibility of educational facilities in Lincang is significantly better than that of medical facilities. Unlike previous studies that took primary or middle schools alone as the study subject, we compared the accessibility of primary and middle schools and concluded that the accessibility of primary schools is significantly better than that of middle schools in all counties and districts. This could be related to the current primary school zoning enrollment policy, wherein parents who buy housing tend to choose locations that are more accessible to their children’s primary school. Regarding sanitation facilities, the accessibility of public washbasins in Lincang’s counties and districts is slightly better than that of public toilets, and the overall distribution is characterized by multipoint diffusion. This also suggests that the “Patriotic Hygiene Special Action” to implement washbasins has helped improve accessibility.
Second, the public infrastructure accessibility to different inhabitant groups with different economic and social characteristics differ obviously. There is a significant negative correlation between population density, aging level, and income level and the least costly distance to public facilities. Transportation-based accessibility has been shown to be unevenly distributed across populations, with the most underserved group being low-wage earners, followed by seniors and less educated people [57]. Currently, there are more studies on income as a factor influencing accessibility, with many confirming that low-income households are more likely to be located in low-accessibility areas, while middle- and high-income households are more likely to be located in high-accessibility areas [58,59]. In terms of educational facility accessibility, inhabitant clusters with high population density and high income have better access. The larger population density promotes the construction of educational facilities in the region, and good educational facilities attract more people, thus forming a virtuous circle. Proximity to good schools often means higher housing prices, which means that families capitalize on excluded public goods. As a result, the spatial differentiation of socioeconomic groups further reduces educational access for low-income people, which has also been shown in previous studies [60]. The improper allocation of educational resources restricts social mobility and further exacerbates differences in urban social spaces [61], which is detrimental to overall city development. Regarding healthcare access, aging, low-income, low-population-density inhabitant clusters have less access. Studies have shown that distance from medical and health facilities has a significant effect on people’s use of medical care [62,63]. The low affordability of healthcare itself reduces low-income people’s use of medical services. Moreover, low-income people often live in places with poor accessibility, further reducing their access.
Finally, unlike studies that measure poverty only in terms of income and do not categorize poverty groups, we categorized poverty groups into different types with corresponding salient features. Infrastructure accessibility is essential for poverty alleviation and protection against the risk of returning to poverty. Our findings show that the least-cost distances to healthcare, education, and sanitation infrastructure are positively correlated with different degrees of poverty. Echoing our findings, a study in Chicago found that accessibility was lower in areas with high populations of minorities, poor people, and less educated people [57]. Moreover, a study in Perth similarly revealed poor accessibility for elderly and low-income households [64]. In terms of the weighted-average distance to public facilities, poor group 4 had the least access among the four poverty groups. Most of this group are elderly people left behind in the countryside, for whom infrastructure development is needed to lift them out of poverty. As an underdeveloped multiethnic frontier region, Lincang’s poor group 1 is the main type of poverty-stricken population. The poor accessibility to health and sanitation infrastructure for poor group 1 is attributable to the fact that this group is dominated by ethnic minorities who mostly live in remote mountainous areas, where the lack of infrastructure curtails their survival and development. When developing public facilities, consideration can be given to prioritizing allocation to disadvantaged groups. While this could lead to an unequal spatial distribution of public infrastructure, it could help equalize opportunities and outcomes. This is in line with Rawls’ view that “public facilities should be allocated in favor of the more disadvantaged” [65].
The findings of this paper are validated by the fact that less developed regions around the world are alleviating poverty by enhancing infrastructure accessibility. Akbar et al. suggested that improving female educational infrastructure in rural areas and reformulating health policies should be prioritized for poverty alleviation in Pakistan, with a special focus on middle and high-level poverty groups [66]. In their study, Fereira and Cateia showed that investment in infrastructure has a significant impact on structural transformation and poverty reduction in Guinea, while the economic and social characteristics of the different groups should be emphasized in the process of poverty reduction [67]. Xiao et al. empirically estimated the impact of infrastructure development on the income level and distribution of poor households, and showed that fine-tuned investment in infrastructure in poor rural areas is conducive to sustainable development for the poor [68]. Infrastructure accessibility is a key national development priority and an important condition for achieving sustainable development. Especially in poor and underdeveloped areas, enhancing the precise allocation of infrastructure is conducive to upgrading local economic development and people’s living standards, thus promoting local sustainable development.
5. Conclusions
Taking Lincang in Yunnan Province, a typical underdeveloped region in China, as the study area, this study used multisource remote sensing data and POI data to assess the accessibility of healthcare, education, and sanitation facilities. Moreover, we explored the relationship between public service facility accessibility and different inhabitant attributes and heterogeneous poverty groups. The results of this study reveal large disparities in the accessibility of different types of infrastructure in Lincang. We also found that public service facility accessibility varies significantly among inhabitants with different socioeconomic attributes and among different groups of poor people. Inhabitant clusters with high population density, high levels of aging, and high income have better access to public facilities. The accessibility of healthcare, education, and sanitation infrastructure is negatively correlated with the poverty level of poor groups to varying degrees.
Combined with the findings of the study, we propose the following three policy recommendations. First of all, it is necessary to provide precise differentiated configurations of public service facilities based on inhabitant characteristics to improve the service level and efficiency of public facilities. Promoting the accessibility of public facilities should be prioritized in areas with less developed economies, lower residential income levels, and serious aging. Secondly, precise development policies should be formulated for poor districts to improve the accessibility of infrastructure, such as education and health care. And upgrading the infrastructure configuration according to poverty-causing characteristics among different groups will enhance efficiency. Finally, less developed regions need to strengthen the universality and equity of public services as a means of preventing the risk of returning to poverty and promoting their sustainable development.
We explored the main infrastructure accessibility through multisource data fusion and accuracy improvement, expanding the application of remote sensing technology and better utilizing the social and economic benefits of remote sensing applications. The assessment methodology based on multisource geospatial data is equally applicable to other less developed regions for infrastructure accessibility measurement. Our findings provide a reference for the same type of underdeveloped areas, which is conducive to promoting their sustainable development through the planning and optimal layout creation of public facilities. However, this study still has some limitations. We measured infrastructure accessibility based on a spatial dimension perspective and did not account for nonspatial factors such as residents’ self-selection, economic affordability, and institutional barriers, especially regarding the inequality of such factors among disadvantaged groups. Thus, future studies can consider integrating route determination and transportation decision-making more closely to enrich the results. Similarly, infrastructure accessibility depends not only on facility allocation but also on intermodal transportation networks. Some studies have shown that transportation-related factors contribute to almost half of the spatial inequalities in healthcare accessibility [69]. Thus, more transportation factors could be incorporated into future research.
Author Contributions
Conceptualization, C.H. and Y.F.; methodology, Y.F. and X.L.; software, Y.F. and X.L.; validation, Y.W., D.S. and F.Z.; formal analysis, Y.W., D.S. and F.Z.; writing—original draft preparation, C.H., F.Z. and X.L.; writing—review and editing, C.H., Y.F., Y.W., D.S. and F.Z.; visualization, Y.F. and X.L.; supervision, C.H. and F.Z.; project administration, C.H.; funding acquisition, C.H. All authors have read and agreed to the published version of the manuscript.
Funding
This work is supported by the Open Research Program of the International Research Center of Big Data for Sustainable Development Goals (Grant No. CBAS2023ORP04) and the National Key R&D Program of China (Project No. 2022YFC3800700).
Data Availability Statement
The data that support the findings of this study are available from the corresponding author upon reasonable request.
Conflicts of Interest
The authors declare no conflicts of interest.
Appendix A
In constructing the computational cost grid, the traffic speeds of different types of pixels are set as follows: (1) Land refers to the parts of land excluding roads. Based on the data for land-use type, it is assumed that the same type is internally homogeneous. It can move in any direction, the travel mode is limited mainly by walking, and the passing speed is set for each pixel of land-use type [24]. (2) Highways include railways in the OSM dataset as well as national roads, provincial roads, county roads, township roads, village roads, foreign roads, and special roads of the Lincang Transportation Bureau. Traffic speed is determined based on the mileage and speed standards of different grades of railway in China and China’s highway engineering technical standards, combined with the specific situation of the study area. (3) Water area. Considering that the water area is stationary and navigable, but the rivers in the study area are not navigable, the transportation time cost is greater than that of the land; thus, the traffic speed is set at 1 km/h [24]. Table A1 shows the speed for each road type.

Table A1.
Passing speeds in different types of pixels.
Table A1.
Passing speeds in different types of pixels.
| Dataset | Type | Speed (km/h) |
|---|---|---|
| Open Street Map | Railway | 90 |
| River | 1 | |
| Transportation bureau road network data | National highway | 80 |
| Provincial highway | 60 | |
| County highway | 40 | |
| Township road | 30 | |
| Village road | 30 | |
| Substandard highway | 20 | |
| Accommodation road | 30 | |
| Globeland 30 | Arable land | 2.87 |
| Forest land | 3.068 | |
| Grassland | 4.86 | |
| Shrubland | 3.6 | |
| Wetland | 2 | |
| Water area | 1 | |
| Artificial surface | 5 | |
| Bare area | 3 | |
| ASTER GDEM V3 | Elevation | Surface raster |

Table A2.
Poverty dimensions and corresponding eigenvalue loads of attributes.
Table A2.
Poverty dimensions and corresponding eigenvalue loads of attributes.
| Variable | Dimension | |||
|---|---|---|---|---|
| Family Background | Ethnicity and Self-Development | Geographical Environment | Health and Labor Force | |
| Ethnicity | 0.0068 | 0.8749 | 0.0037 | 0.0016 |
| Age | 0.0206 | 0.7504 | 0.0025 | 0.0074 |
| Education level | 0.0837 | 0.4656 | 0.0214 | 0.1258 |
| Health status | 0.5007 | 0.0049 | 0.0421 | 0.8125 |
| Labor ability | 0.4892 | 0.1684 | 0.0230 | 0.7762 |
| Total family population | 0.7858 | 0.0253 | 0.0047 | 0.0051 |
| Working population in the family | 0.8236 | 0.0027 | 0.0039 | 0.7664 |
| Migrant workers in the family | 0.7859 | 0.0043 | 0.0026 | 0.6355 |
| Distance to the nearest city | 0.0037 | 0.0014 | 0.8572 | 0.0097 |
| Distance to the nearest station | 0.0098 | 0.0036 | 0.8901 | 0.0196 |
| Distance to the nearest public facility | 0.0188 | 0.0025 | 0.8012 | 0.0054 |
References
- Jin, M.; Liu, L.; Tong, D.; Gong, Y.; Liu, Y. Evaluating the Spatial Accessibility and Distribution Balance of Multi-Level Medical Service Facilities. Int. J. Environ. Res. Public Health 2019, 16, 1150. [Google Scholar] [CrossRef] [PubMed]
- Zhang, X.; Sun, L.; Shao, Z.; Zhou, X. Accessibility Evaluation of Public Service Facilities in Villages and Towns Based on POI Data: A Case Study of Suining County, Xuzhou, China. J. Urban Plan. Dev 2023, 149, 05023019. [Google Scholar] [CrossRef]
- Levine, J. A Century of Evolution of the Accessibility Concept. Transp. Res. Part D Transp. Environ. 2020, 83, 102309. [Google Scholar] [CrossRef]
- Park, J.; Goldberg, D.W. A Review of Recent Spatial Accessibility Studies That Benefitted from Advanced Geospatial Information: Multimodal Transportation and Spatiotemporal Disaggregation. ISPRS Int. J. Geo-Inf. 2021, 10, 532. [Google Scholar] [CrossRef]
- Hansen, W.G. How Accessibility Shapes Land Use. J. Am. Inst. Plan. 1959, 25, 73–76. [Google Scholar] [CrossRef]
- Wachs, M.; Kumagai, T.G. Physical Accessibility as a Social Indicator. Socio-Econ. Plan. Sci. 1973, 7, 437–456. [Google Scholar] [CrossRef]
- Dalvi, M.Q.; Martin, K.M. The Measurement of Accessibility: Some Preliminary Results. Transportation 1976, 5, 17–42. [Google Scholar] [CrossRef]
- Nelson, A. Travel Time to Major Cities: A Global Map of Accessibility; European Communities: Ispra, Italy, 2008. [Google Scholar]
- Hsiao, S.; Lu, J.; Sterling, J.; Weatherford, M. Use of Geographic Information System for Analysis of Transit Pedestrian Access. Transp. Res. Rec. 1997, 1604, 50–59. [Google Scholar] [CrossRef]
- Kalogirou, S.; Foley, R. Health, Place and Hanly: Modelling Accessibility to Hospitals in Ireland. Ir. Geogr. 2006, 39, 52–68. [Google Scholar] [CrossRef]
- Litman, T. Evaluating Transportation Equity. World Transp. Policy Pract. 2002, 8, 50–65. [Google Scholar]
- Zenk, S.N.; Schulz, A.J.; Israel, B.A.; James, S.A.; Bao, S.; Wilson, M.L. Neighborhood Racial Composition, Neighborhood Poverty, and the Spatial Accessibility of Supermarkets in Metropolitan Detroit. Am. J. Public Health 2005, 95, 660–667. [Google Scholar] [CrossRef] [PubMed]
- Zhao, M.; Liu, S.; Qi, W. Spatial Differentiation and Influencing Mechanism of Medical Care Accessibility in Beijing: A Migrant Equality Perspective. Chin. Geogr. Sci. 2018, 28, 353–362. [Google Scholar] [CrossRef]
- Guo, Y.; Chang, S.-S.; Chen, M.; Yip, P.S.F. Do Poorer Areas Have Poorer Access to Services in Hong Kong? A Small-Area Analysis Based on Multiple Spatial Accessibility Indicators. Soc. Indic. Res. 2018, 138, 1–21. [Google Scholar] [CrossRef]
- Akhavan, A.; Phillips, N.E.; Du, J.; Chen, J.; Sadeghinasr, B.; Wang, Q. Accessibility Inequality in Houston. IEEE Sens. Lett. 2019, 3, 7102104. [Google Scholar] [CrossRef]
- Chen, Y.; Bouferguene, A.; Shen, Y.; Al-Hussein, M. Assessing Accessibility-Based Service Effectiveness (ABSEV) and Social Equity for Urban Bus Transit: A Sustainability Perspective. Sustain. Cities Soc. 2019, 44, 499–510. [Google Scholar] [CrossRef]
- Wang, H.; Kwan, M.-P.; Hu, M. Social Exclusion and Accessibility among Low- and Non-Low-Income Groups: A Case Study of Nanjing, China. Cities 2020, 101, 102684. [Google Scholar] [CrossRef]
- Estoque, R.C. A Review of the Sustainability Concept and the State of SDG Monitoring Using Remote Sensing. Remote Sens. 2020, 12, 1770. [Google Scholar] [CrossRef]
- Lawal, O.; Anyiam, F.E. Modelling Geographic Accessibility to Primary Health Care Facilities: Combining Open Data and Geospatial Analysis. Geo-Spat. Inf. Sci. 2019, 22, 174–184. [Google Scholar] [CrossRef]
- Evans, D.B.; Hsu, J.; Boerma, T. Universal Health Coverage and Universal Access. Bull. World Health Organ. 2013, 91, 546A. [Google Scholar] [CrossRef]
- Ashiagbor, G.; Ofori-Asenso, R.; Forkuo, E.K.; Agyei-Frimpong, S. Measures of Geographic Accessibility to Health Care in the Ashanti Region of Ghana. Sci. Afr. 2020, 9, e00453. [Google Scholar] [CrossRef]
- Salvacion, A.R. Measuring Spatial Accessibility of Healthcare Facilities in Marinduque, Philippines. ISPRS Int. J. Geo-Inf. 2022, 11, 516. [Google Scholar] [CrossRef]
- Alegana, V.A.; Wright, J.A.; Pentrina, U.; Noor, A.M.; Snow, R.W.; Atkinson, P.M. Spatial Modelling of Healthcare Utilisation for Treatment of Fever in Namibia. Int. J. Health Geogr. 2012, 11, 6. [Google Scholar] [CrossRef]
- Weiss, D.J.; Nelson, A.; Gibson, H.S.; Temperley, W.; Peedell, S.; Lieber, A.; Hancher, M.; Poyart, E.; Belchior, S.; Fullman, N.; et al. A Global Map of Travel Time to Cities to Assess Inequalities in Accessibility in 2015. Nature 2018, 553, 333–336. [Google Scholar] [CrossRef] [PubMed]
- Weiss, D.J.; Nelson, A.; Vargas-Ruiz, C.A.; Gligorić, K.; Bavadekar, S.; Gabrilovich, E.; Bertozzi-Villa, A.; Rozier, J.; Gibson, H.S.; Shekel, T.; et al. Global Maps of Travel Time to Healthcare Facilities. Nat. Med. 2020, 26, 1835–1838. [Google Scholar] [CrossRef] [PubMed]
- Pizzol, B.; Giannotti, M.; Tomasiello, D.B. Qualifying Accessibility to Education to Investigate Spatial Equity. J. Transp. Geogr. 2021, 96, 103199. [Google Scholar] [CrossRef]
- Moreno-Monroy, A.I.; Lovelace, R.; Ramos, F.R. Public Transport and School Location Impacts on Educational Inequalities: Insights from São Paulo. J. Transp. Geogr. 2018, 67, 110–118. [Google Scholar] [CrossRef]
- Gao, Y.; He, Q.; Liu, Y.; Zhang, L.; Wang, H.; Cai, E. Imbalance in Spatial Accessibility to Primary and Secondary Schools in China: Guidance for Education Sustainability. Sustainability 2016, 8, 1236. [Google Scholar] [CrossRef]
- United Nations. Report of the Independent Expert on the Issue of Human Rights Obligations Related to Access to Safe Drinking Water and Sanitation, Catarina de Albuquerque: Addendum. 2010. Available online: https://digitallibrary.un.org/record/685823 (accessed on 16 April 2023).
- Kumar, S.; Vollmer, S. Does Access to Improved Sanitation Reduce Childhood Diarrhea in Rural India? Health Econ. 2013, 22, 410–427. [Google Scholar] [CrossRef]
- Verma, A.; Megiddo, I.; Nandi, A.; Laxminarayan, R.; Ashok, A. Reduced Burden of Childhood Diarrheal Diseases through Increased Access to Water and Sanitation in India: A Modeling Analysis. Soc. Sci. Med. 2017, 180, 181–192. [Google Scholar] [CrossRef]
- Gentry-Shields, J.; Bartram, J. Human Health and the Water Environment: Using the DPSEEA Framework to Identify the Driving Forces of Disease. Sci. Total Environ. 2014, 468–469, 306–314. [Google Scholar] [CrossRef]
- Cheng, S.; Li, Z.; Uddin, S.M.N.; Mang, H.-P.; Zhou, X.; Zhang, J.; Zheng, L.; Zhang, L. Toilet Revolution in China. J. Environ. Manag. 2018, 216, 347–356. [Google Scholar] [CrossRef]
- Korah, P.I.; Nunbogu, A.M.; Ahmed, A. Measuring Access to Health Facilities in Ghana: Implications for Implementation of Health Interventions and the Sustainable Development Goal 3. Appl. Geogr. 2023, 158, 103026. [Google Scholar] [CrossRef]
- Sahitya, K.S.; Prasad, C.S.R.K. Evaluation of Opportunity Based Urban Road Network Accessibility Using GIS. Spat. Inf. Res. 2020, 28, 487–493. [Google Scholar] [CrossRef]
- Benenson, I.; Ben-Elia, E.; Rofe, Y.; Geyzersky, D. The Benefits of a High-Resolution Analysis of Transit Accessibility. Int. J. Geogr. Inf. Sci. 2017, 31, 213–236. [Google Scholar] [CrossRef]
- Delamater, P.L.; Messina, J.P.; Shortridge, A.M.; Grady, S.C. Measuring Geographic Access to Health Care: Raster and Network-Based Methods. Int. J. Health Geogr. 2012, 11, 15. [Google Scholar] [CrossRef] [PubMed]
- Shi, Y.; Zheng, J.; Pei, X. Measurement Method and Influencing Mechanism of Urban Subdistrict Vitality in Shanghai Based on Multisource Data. Remote Sens. 2023, 15, 932. [Google Scholar] [CrossRef]
- Rogers, G.; Koper, P.; Ruktanonchai, C.; Ruktanonchai, N.; Utazi, E.; Woods, D.; Cunningham, A.; Tatem, A.J.; Steele, J.; Lai, S.; et al. Exploring the Relationship between Temporal Fluctuations in Satellite Nightlight Imagery and Human Mobility across Africa. Remote Sens. 2023, 15, 4252. [Google Scholar] [CrossRef]
- Forget, Y.; Shimoni, M.; Gilbert, M.; Linard, C. Mapping 20 Years of Urban Expansion in 45 Urban Areas of Sub-Saharan Africa. Remote Sens. 2021, 13, 525. [Google Scholar] [CrossRef]
- You, D.; Wang, S.; Wang, F.; Zhou, Y.; Wang, Z.; Wang, Y.; Wang, J.; Xiong, Y.; Ji, J. Monitoring and Analyzing the Effectiveness of the Effective Refuge Area of Emergency Shelters by Using Remote Sensing: A Case Study of Beijing’s Fifth Ring Road. Remote Sens. 2023, 15, 3646. [Google Scholar] [CrossRef]
- Wang, K.; Zhang, L.; Cai, M.; Liu, L.; Wu, H.; Peng, Z. Measuring Urban Poverty Spatial by Remote Sensing and Social Sensing Data: A Fine-Scale Empirical Study from Zhengzhou. Remote Sens. 2023, 15, 381. [Google Scholar] [CrossRef]
- Cui, H.; Wu, L.; Hu, S.; Lu, R. Measuring the Service Capacity of Public Facilities Based on a Dynamic Voronoi Diagram. Remote Sens. 2021, 13, 1027. [Google Scholar] [CrossRef]
- Guo, Y.; Zhou, Y.; Cao, Z. Comprehensive Measurement of County Poverty in China and Targeting Poverty Reduction after 2020. J. Geogr. Sci. 2018, 28, 1810–1824. [Google Scholar]
- Guo, Y.; Zhou, Y.; Liu, Y. Targeted Poverty Alleviation and Its Practices in Rural China: A Case Study of Fuping County, Hebei Province. J. Rural Stud. 2022, 93, 430–440. [Google Scholar] [CrossRef]
- Bruun, H.H.; Nelson, A.; Chomitz, K.M. Effectiveness of Strict vs. Multiple Use Protected Areas in Reducing Tropical Forest Fires: A Global Analysis Using Matching Methods. PLoS ONE 2011, 6, e22722. [Google Scholar] [CrossRef]
- Schmitz, C.; Biewald, A.; Lotze-Campen, H.; Popp, A.; Dietrich, J.P.; Bodirsky, B.; Krause, M.; Weindl, I. Trading more food: Implications for land use, greenhouse gas emissions, and the food system. Glob. Environ. Chang. 2012, 22, 189–209. [Google Scholar] [CrossRef]
- Gilbert, M.; Golding, N.; Zhou, H.; Wint, G.R.W.; Robinson, T.P.; Tatem, A.J.; Lai, S.; Zhou, S.; Jiang, H.; Guo, D.; et al. Predicting the risk of avian influenza A H7N9 infection in live-poultry markets across Asia. Nat. Commun. 2014, 5, 4116. [Google Scholar] [CrossRef]
- Bhatt, S.; Weiss, D.J.; Cameron, E.; Bisanzio, D.; Mappin, B.; Dalrymple, U.; Battle, K.E.; Moyes, C.L.; Henry, A.; Eckhoff, P.A.; et al. The effect of malaria control on Plasmodium falciparum in Africa between 2000 and 2015. Nature 2015, 526, 207–211. [Google Scholar] [CrossRef]
- Frelat, R.; Lopez-Ridaura, S.; Giller, K.E.; Herrero, M.; Douxchamps, S.; Djurfeldt, A.A.; Erenstein, O.; Henderson, B.; Kassie, M.; Paul, B.K.; et al. Drivers of household food availability in sub-Saharan Africa based on big data from small farms. Proc. Natl. Acad. Sci. USA 2015, 113, 458–463. [Google Scholar] [CrossRef]
- Esri. ArcGIS Help Document: How the Path Distance Tools Work. 2021. Available online: https://desktop.arcgis.com/en/arcmap/latest/tools/spatial-analyst-toolbox/how-the-path-distance-tools-work.htm (accessed on 10 April 2023).
- Escofier, B.; Pagès, J. Multiple Factor Analysis (AFMULT Package). Comput. Stat. Data Anal. 1994, 18, 121–140. [Google Scholar] [CrossRef]
- Park, H.-S.; Jun, C.-H. A Simple and Fast Algorithm for K-Medoids Clustering. Expert Syst. Appl. 2009, 36, 3336–3341. [Google Scholar] [CrossRef]
- Sauder, D.C.; Demars, C.E. An Updated Recommendation for Multiple Comparisons. Adv. Methods Pract. Psychol. Sci. 2019, 2, 26–44. [Google Scholar] [CrossRef]
- Perneger, T.V. What’s Wrong with Bonferroni Adjustments. BMJ 1998, 316, 1236–1238. [Google Scholar] [CrossRef] [PubMed]
- Zhang, D.; Zhang, G.; Zhou, C. Differences in Accessibility of Public Health Facilities in Hierarchical Municipalities and the Spatial Pattern Characteristics of Their Services in Doumen District, China. Land 2021, 10, 1249. [Google Scholar] [CrossRef]
- Ermagun, A.; Tilahun, N. Equity of Transit Accessibility across Chicago. Transp. Res. Part D Transp. Environ. 2020, 86, 102461. [Google Scholar] [CrossRef]
- Jang, S.; Lee, S. Study of the Regional Accessibility Calculation by Income Class Based on Utility-Based Accessibility. J. Transp. Geogr. 2020, 84, 102697. [Google Scholar] [CrossRef]
- Tao, S.; Cheng, L.; He, S.; Witlox, F. Examining the Non-Linear Effects of Transit Accessibility on Daily Trip Duration: A Focus on the Low-Income Population. J. Transp. Geogr. 2023, 109, 103600. [Google Scholar] [CrossRef]
- Marques, J.L.; Wolf, J.; Feitosa, F. Accessibility to Primary Schools in Portugal: A Case of Spatial Inequity? Reg. Sci. Policy Pract. 2021, 13, 693–707. [Google Scholar] [CrossRef]
- Xu, Y.; Song, W.; Liu, C. Social-Spatial Accessibility to Urban Educational Resources under the School District System: A Case Study of Public Primary Schools in Nanjing, China. Sustainability 2018, 10, 2305. [Google Scholar] [CrossRef]
- Dutton, D. Financial, Organizational and Professional Factors Affecting Health Care Utilization. Soc. Sci. Med. 1986, 23, 721–735. [Google Scholar] [CrossRef]
- Strauss, A.L. Medical Organization, Medical Care and Lower Income Groups. Soc. Sci. Med. 1969, 3, 143–177. [Google Scholar] [CrossRef]
- Ricciardi, A.M.; Xia, J.; Currie, G. Exploring Public Transport Equity between Separate Disadvantaged Cohorts: A Case Study in Perth, Australia. J. Transp. Geogr. 2015, 43, 111–122. [Google Scholar] [CrossRef]
- Rawl, J. A Theory of Justice. Bamforth N 1971, 14, 26–28. [Google Scholar] [CrossRef]
- Akbar, M.; Abdullah; Naveed, A.; Syed, S.H. Does an Improvement in Rural Infrastructure Contribute to Alleviate Poverty in Pakistan? A Spatial Econometric Analysis. Soc. Indic. Res. 2022, 162, 1. [Google Scholar] [CrossRef]
- Fereira, S.B.; Cateia, J.V. Trade reform, infrastructure investment, and structural transformation in Africa: Evidence from Guinea-Bissau. Emerg. Mark. Rev. 2023, 55, 101027. [Google Scholar] [CrossRef]
- Xiao, H.; Zheng, X.Y.; Xie, L.Y. Promoting pro-poor growth through infrastructure investment: Evidence from the Targeted Poverty Alleviation program in China. China Econ. Rev. 2022, 71, 101729. [Google Scholar] [CrossRef]
- Tao, Z.; Wang, Q. Facility or Transport Inequality? Decomposing Healthcare Accessibility Inequality in Shenzhen, China. Int. J. Environ. Res. Public Health 2022, 19, 6897. [Google Scholar] [CrossRef]
Disclaimer/Publisher’s Note: The statements, opinions and data contained in all publications are solely those of the individual author(s) and contributor(s) and not of MDPI and/or the editor(s). MDPI and/or the editor(s) disclaim responsibility for any injury to people or property resulting from any ideas, methods, instructions or products referred to in the content. |
© 2024 by the authors. Licensee MDPI, Basel, Switzerland. This article is an open access article distributed under the terms and conditions of the Creative Commons Attribution (CC BY) license (https://creativecommons.org/licenses/by/4.0/).

