1. Introduction
Ongoing global climate change is increasingly exposing the world’s forests to unprecedented levels of abiotic and biotic threats [
1,
2,
3]. Continual increases in global trade and international travel, together with the lack of adequate quarantine policies and biosecurity regulations in many countries, have favored the introduction (whether intentional or otherwise) of alien invasive species that may be dangerous for local environments [
4,
5]. Thus, the distributions of many non-native plants [
6,
7], forest insects [
8], and plant pathogens [
9,
10] have been artificially expanded largely beyond their natural boundaries, with, in some cases, large disturbances to the affected ecosystems and severe socio-economic impacts [
11,
12]. Among these impacts, alien plant pathogen invaders are particularly dangerous, since they can have major detrimental effects on plants, animals, and ecosystem health [
13,
14], as well as the often prohibitive costs involved in their management and the economic damage they can cause [
15,
16].
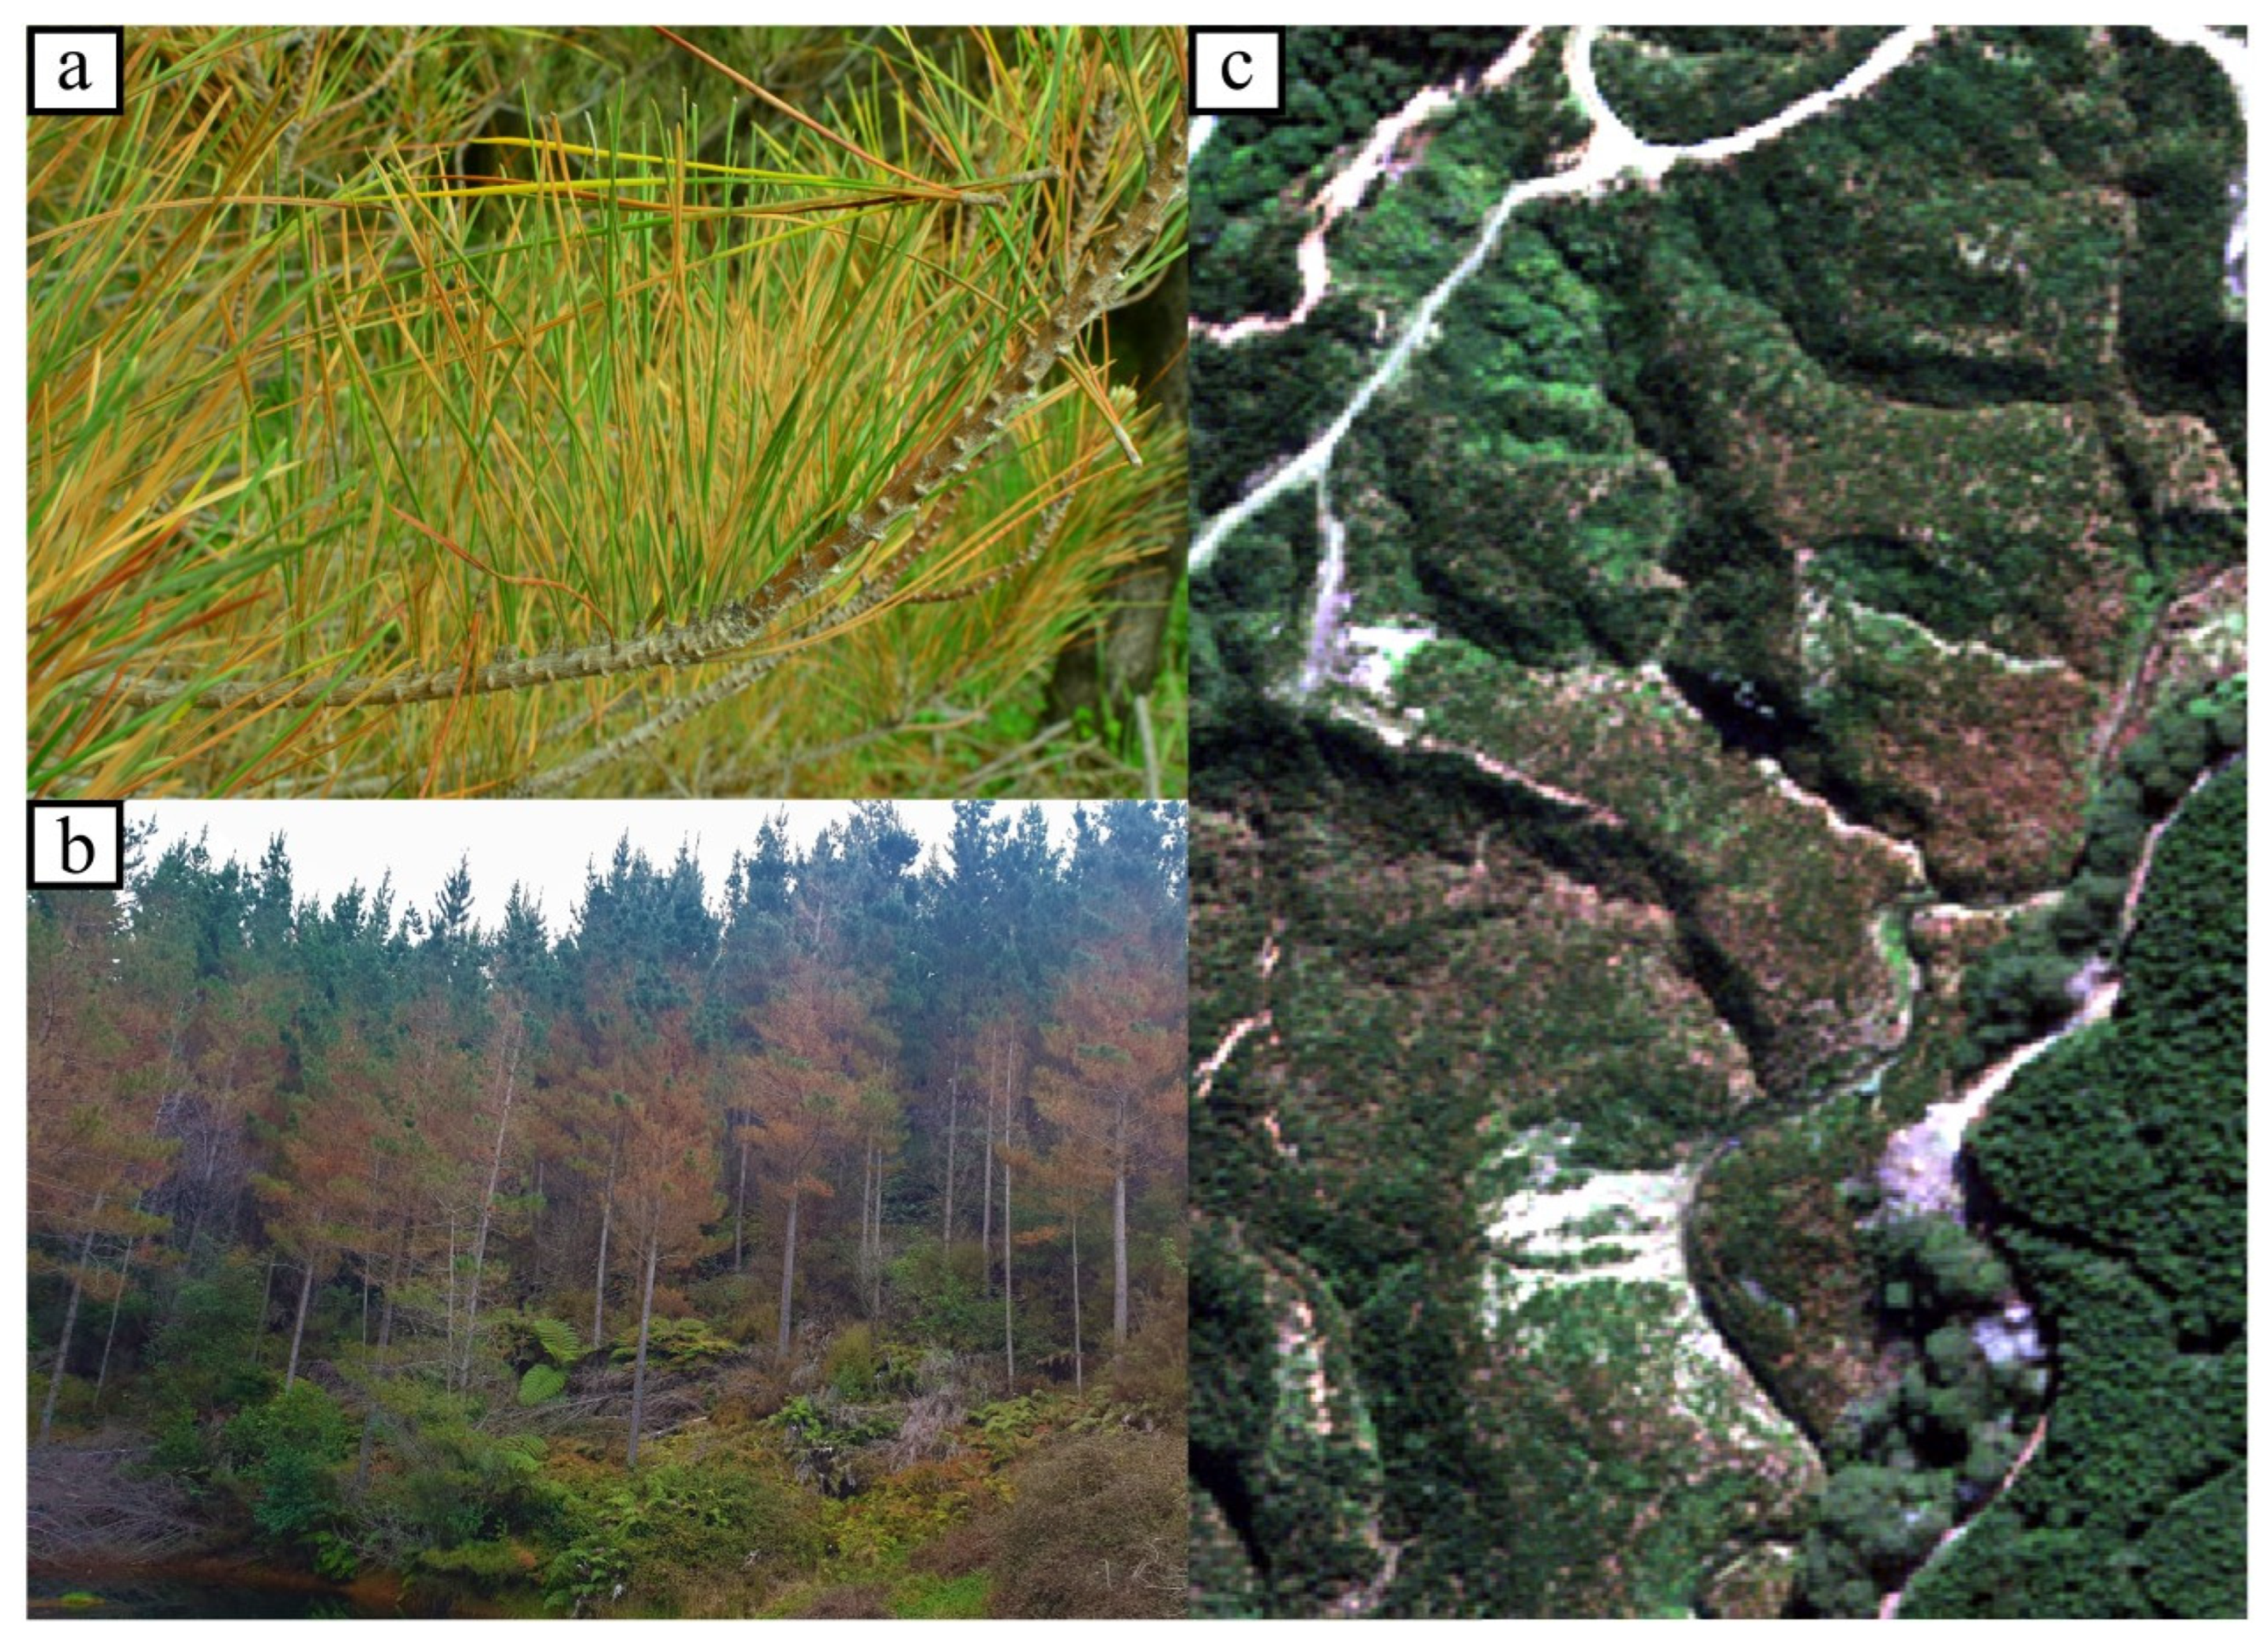
Red needle cast (RNC) is a foliar disease of radiata pine (
Pinus radiata—
Figure 1), caused by the oomycete pathogen
Phytophthora pluvialis and, occasionally, by
Phytophthora kernoviae [
17].
Phytophthora pluvialis was first recorded in New Zealand in 2008 [
17], while
P. kernoviae is known to have been present in the country since at least the 1950s [
18]. Both these pathogens impact productivity in pine plantations [
17], as they can result in a reduction of up to 38% in stem cross-sectional area increment (measured by wood cores) in the first growing season following severe disease expression (data not published). Early symptoms of the disease appear as dark green lesions on needles, sometimes containing black, resinous bands [
17,
19]. These lesions quickly change to a khaki color, and then become yellow or red, before the needles are shed [
17,
19]. Timing of symptom expression varies between sites and years, but will typically start appearing in autumn or winter on the lower branches of infected individuals. Under favorable conditions, the disease rapidly spreads upwards in affected trees, causing large-scale discoloration of the foliage before the trees cast infected needle fascicles, usually by the first half of spring [
17,
20]. Although trees that were completely green at the beginning of autumn can be almost completely defoliated by springtime, new needle growth in the following spring season is rarely affected [
17]. Therefore, RNC is currently a major health concern for the forest sector, which has deployed radiata pine across nearly 90% of New Zealand’s planted forest estate [
21].
The development of a method to accurately monitor the disease over large areas is becoming increasingly important. Such a monitoring framework would allow more rapid detection and management of the disease and allow researchers to understand the environmental drivers of disease expression and quantify impacts at scales ranging from the tree to the forest level. Currently, in New Zealand there is no systematic national survey for RNC, which limits the scale and spatially biases disease observations. This limits insights into the true spatial pattern and extent of RNC outbreaks. During severe outbreaks, visual aerial surveys are sometimes used [
22,
23], but only approximate disease mapping is obtained from these observations. A more robust approach would be to use remotely sensed satellite imagery to accurately and repeatably detect and map unhealthy pine forests.
Many studies have investigated the use of remote sensing products to map pathogen and pest outbreaks. Data from several sensors (e.g., active and passive) mounted on different platforms (i.e., airborne and spaceborne) have been used to detect disease outbreaks at different scales, in a range of host species and environments [
24,
25,
26,
27,
28,
29]. Imagery (Airborne Visible Infrared Imaging Spectrometer [AVIRIS] and Landsat-5 and -7) obtained from providers such as Google Earth and the National Agriculture Imagery Program (NAIP) has been used to model and map the spread of
Phytophthora ramorum [
25]. A combination of airborne and satellite-based (Landsat Climate Data Records—LCDR) multispectral imagery has been used to map pine and spruce beetle outbreaks in Colorado over an 18-year period [
30]. Airborne light detection and ranging (LiDAR) has been combined with imaging spectrometry to detect rapid Ohi’a death [
26] and high resolution orthoimagery to identify individual fir trees affected by
Armillaria spp. [
29].
As a sole data source, satellite imagery has been used to detect forest damage at varying scales, from single trees to whole landscapes [
22,
26,
31], and there has been a strong focus on detecting damage from insects. A large body of work in the remote sensing literature has focused on the outbreaks of a bark beetle species (
Ips typographys) [
23,
32,
33,
34,
35] that has been responsible for the destruction of more than 150 million m
3 of forest volume in Europe over a 50-year period [
32,
36]. Generally, these studies have found that the three stages of infestation can be accurately delineated [
35]. Many other studies have used fine–medium-resolution satellite imagery to characterize damage from bark beetle species within Italy [
33,
35], central Europe [
23,
37,
38], and Canada [
39]. Satellite imagery has also been successfully used to detect damage from jack pine budworm [
40], gypsy moth [
41], bronze bug [
42], and eucalypt weevil [
43].
Most of the studies described above focused on a single time stamp classification and, importantly, none of them tested the transferability of their models for multi-temporal, multi-scene disease detection and mapping. Although pathogens have a major impact on many plantation species [
44], with a few exceptions [
45], most studies using satellite imagery have focused on characterizing damage from insects. Thus, to the best of our knowledge, we are unaware of any literature that uses a transferable machine learning model for automated forest disease detection.
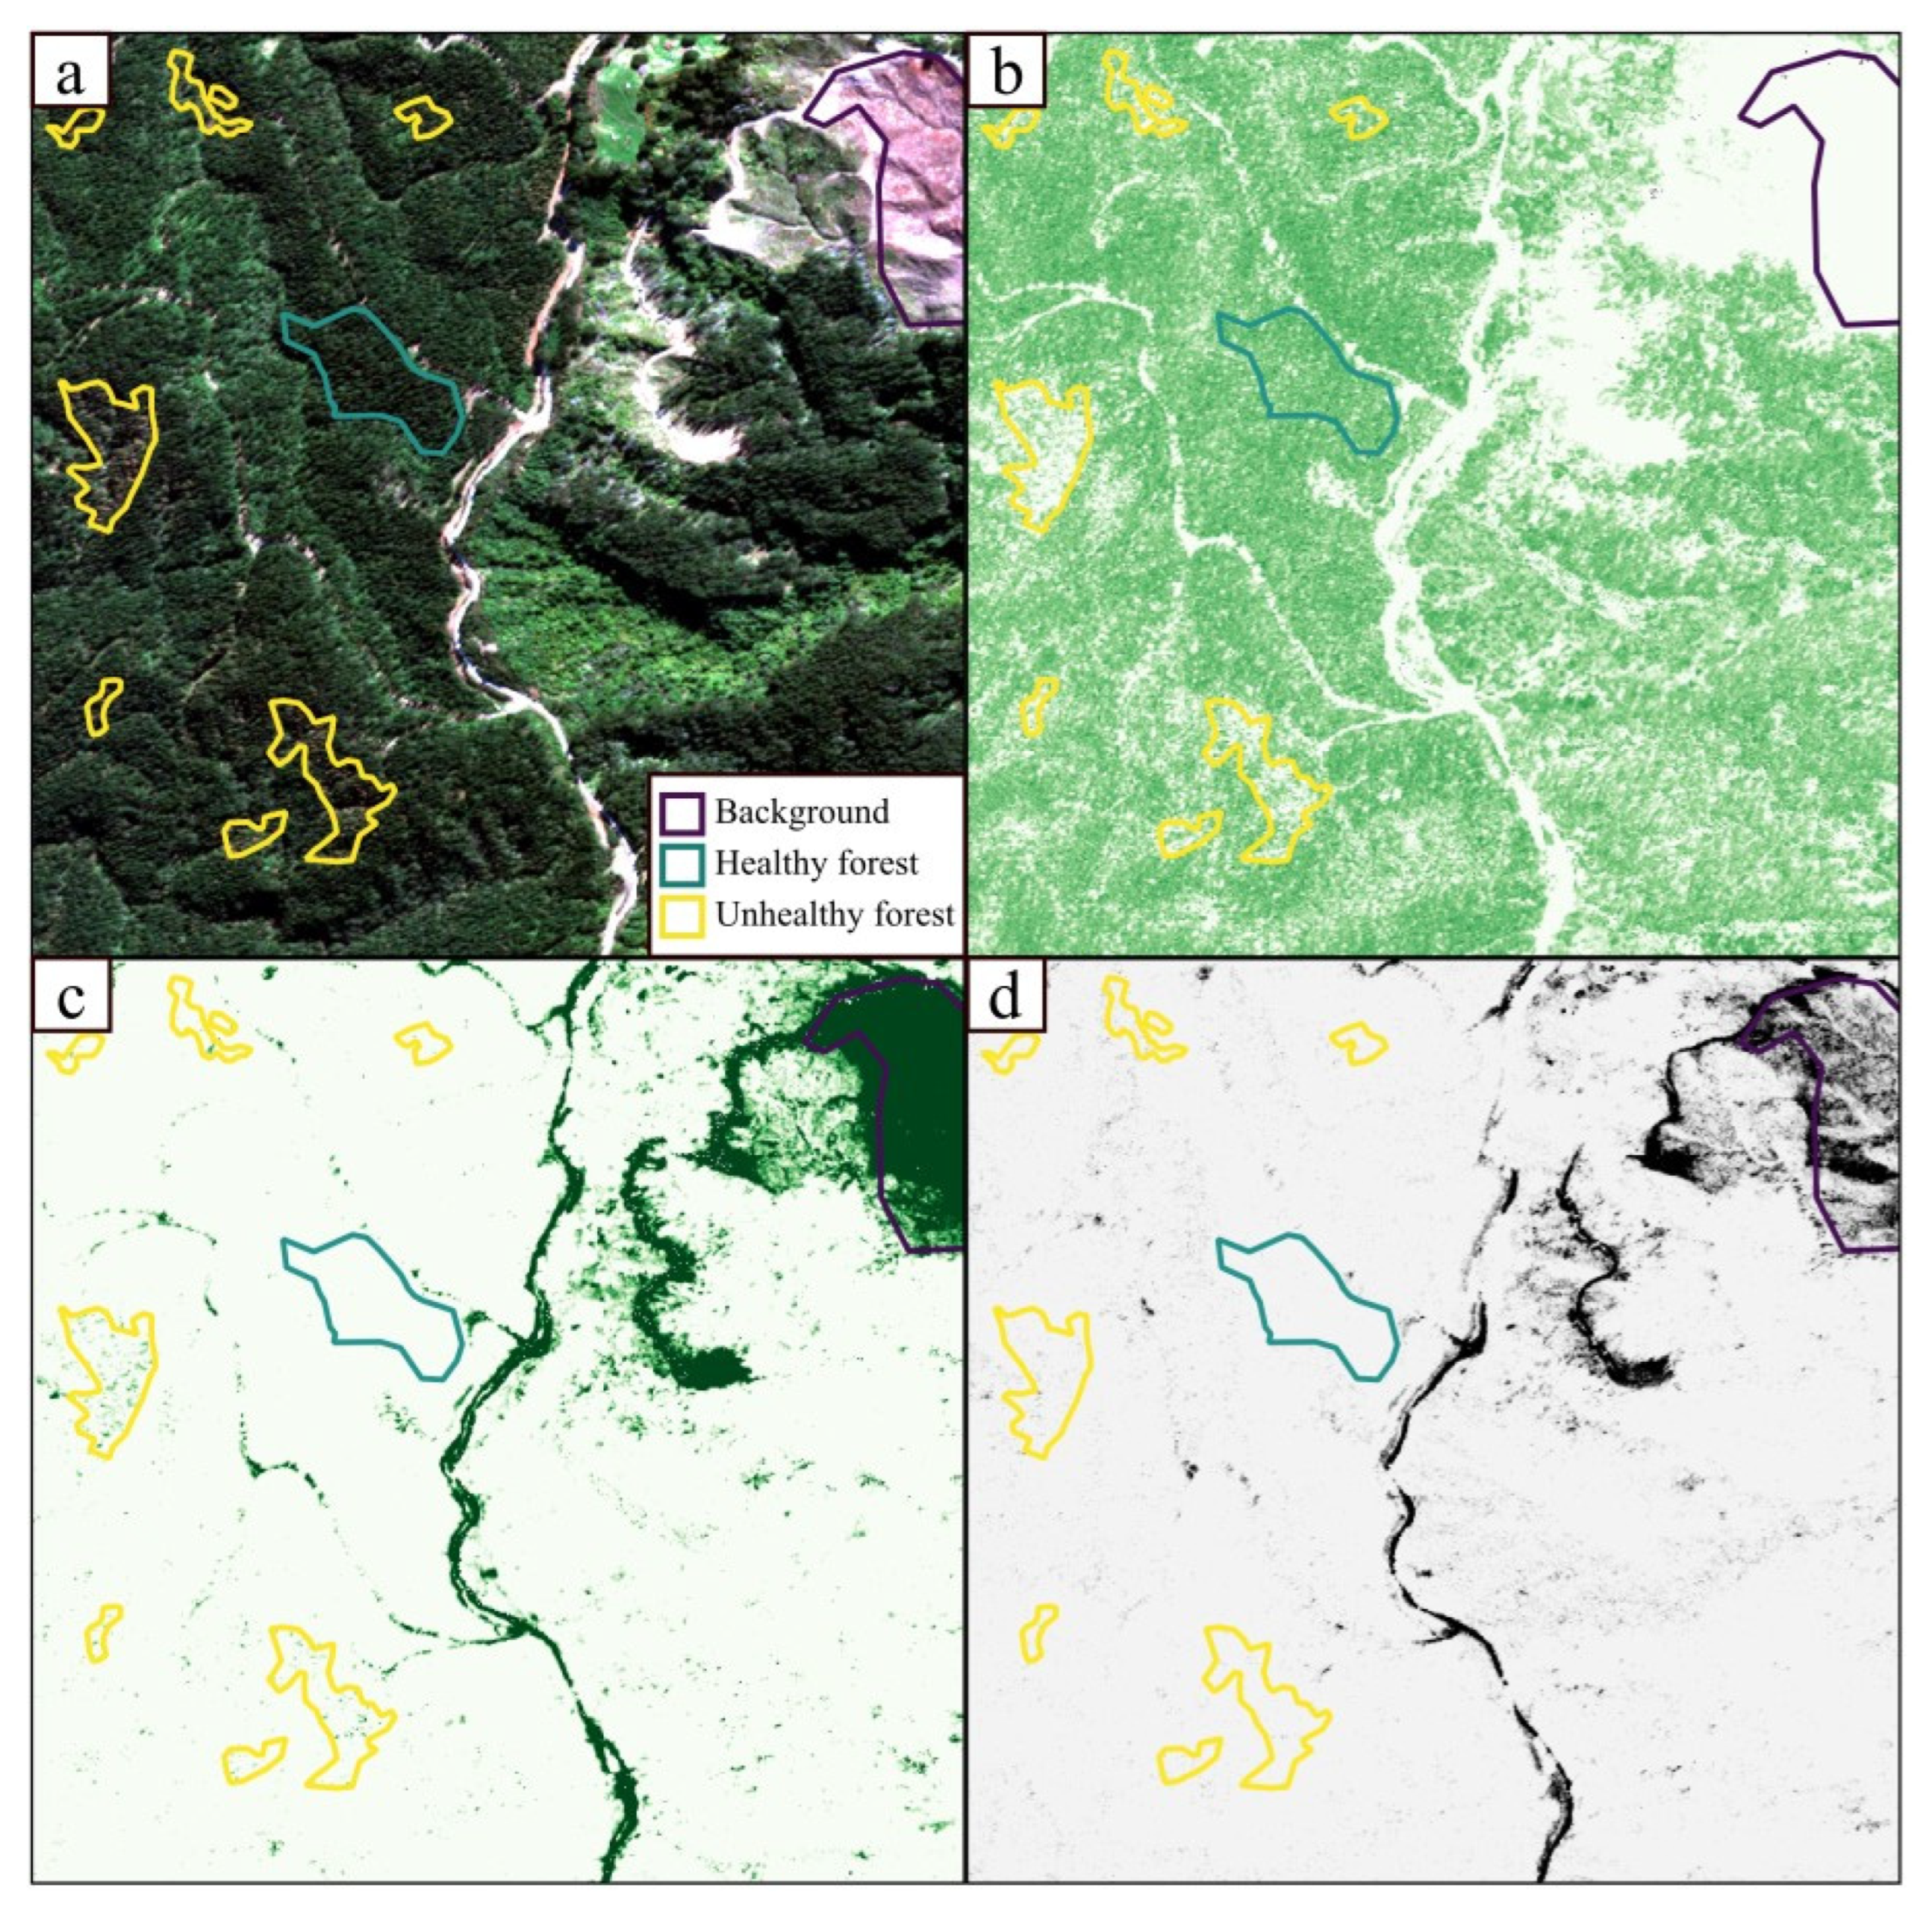
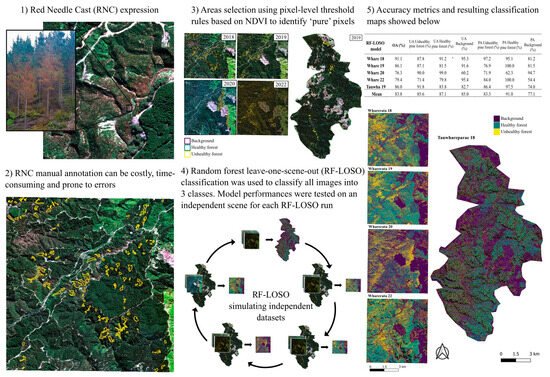
In this study, we attempt to address these limitations by developing a transferable automated approach to differentiate between healthy and unhealthy pine forest expressing symptoms of severe and widespread RNC. The overarching goal was to develop a classifier that could readily and accurately classify new imagery and reduce the need to develop per-scene classifiers. Using a combination of training data from several satellite scenes that had been extensively labeled, our objectives were to (i) develop a model to predict and map healthy/unhealthy pine forest using machine learning methods and (ii) test the model using a leave-one-scene-out approach where each model was trained on data from all scenes except one, and then the model was applied to the withheld scene. This approach allowed a completely independent evaluation of the model accuracy.
4. Discussion
The results from this study demonstrated that it was possible to train a generalizable model for classifying unhealthy pine forest with high-resolution satellite imagery. For all scenes, the RF models produced moderately to highly accurate classification maps of areas of forest affected by RNC expression in independent imagery. This approach simulates a scenario where new satellite imagery can be ingested and automatically classified to map disease expression over relatively large areas.
The accuracy values obtained from the internal validation datasets were higher than those obtained from the independent scenes, since the RF–LOSO models were trained on a data partition taken from the same pool of labeled data. Nevertheless, the RF–LOSO models performed well when using the independent data, with overall accuracies greater than 75% in all scenes, and greater than 85% for three out of five scenes (
Table 5). These analyses produced classification results comparable with those presented in other studies found in the remote sensing literature [
25,
38,
62,
63,
64]. While some studies focused on mapping bark beetle outbreaks through change detection over long time series [
25,
65], others mapped their impacts at the individual tree level using machine learning [
63]. In their study, Dalponte et al. [
63] used SVM to classify individual Sentinel-2 scenes covering the same area throughout a summer season, and then used the best-performing model from one image to classify all remaining images. By doing so, they achieved an overall bark beetle detection in individual trees of up to 79.2%. Although very promising, in New Zealand, this approach can be difficult due to long periods of persistent cloud cover interrupting the temporal sequence. In this context, the ability to perform classification using a single scene is an advantage. Recently, Chadwick et al. [
66] tested the transferability of a mask region-based convolutional neural network (Mark R-CNN) model to segment two species of regenerating conifers, achieving a mean average precision of 72% (69% and 78% for the two species). In another study, Puliti and Astrup [
67] presented a deep learning-based approach to detect and map snow breakage at tree level using UAV images acquired over a broad spectrum of light, seasonal, and atmospheric conditions. By providing enough training observations from a wide range of images, they were able to develop a model with a high degree of transferability. This is in agreement with the approach followed in this study, where manually labeled information from different study areas and years were pooled together to provide a wider range of spectral signal examples of what each class mapped looked like in as many different scenes and acquisition years as possible. Earlier research on the transferability of random forest models for coastal vegetation classification achieved similar accuracies to our study when classifying areas within the training dataset (85.8% accuracy), but performed significantly worse when applied to other sites other than those trained upon, with classification results between 54.2 and 69.0% [
68]. The authors suggested that this was due to a lack of representation of the training data in the independent data tested [
68]. Other authors tested the ability of the classification and regression tree (CART) implementation of the decision tree algorithm to classify land cover at regional scale over a highly heterogeneous area in South Africa, using Landsat-8 data [
50]. Using approximately 90,000 data points to develop a decision tree ruleset, this was then tested on two adjacent scenes, with results varying substantially between scenes (i.e., 83.7% and 64.1% accuracies) [
50].
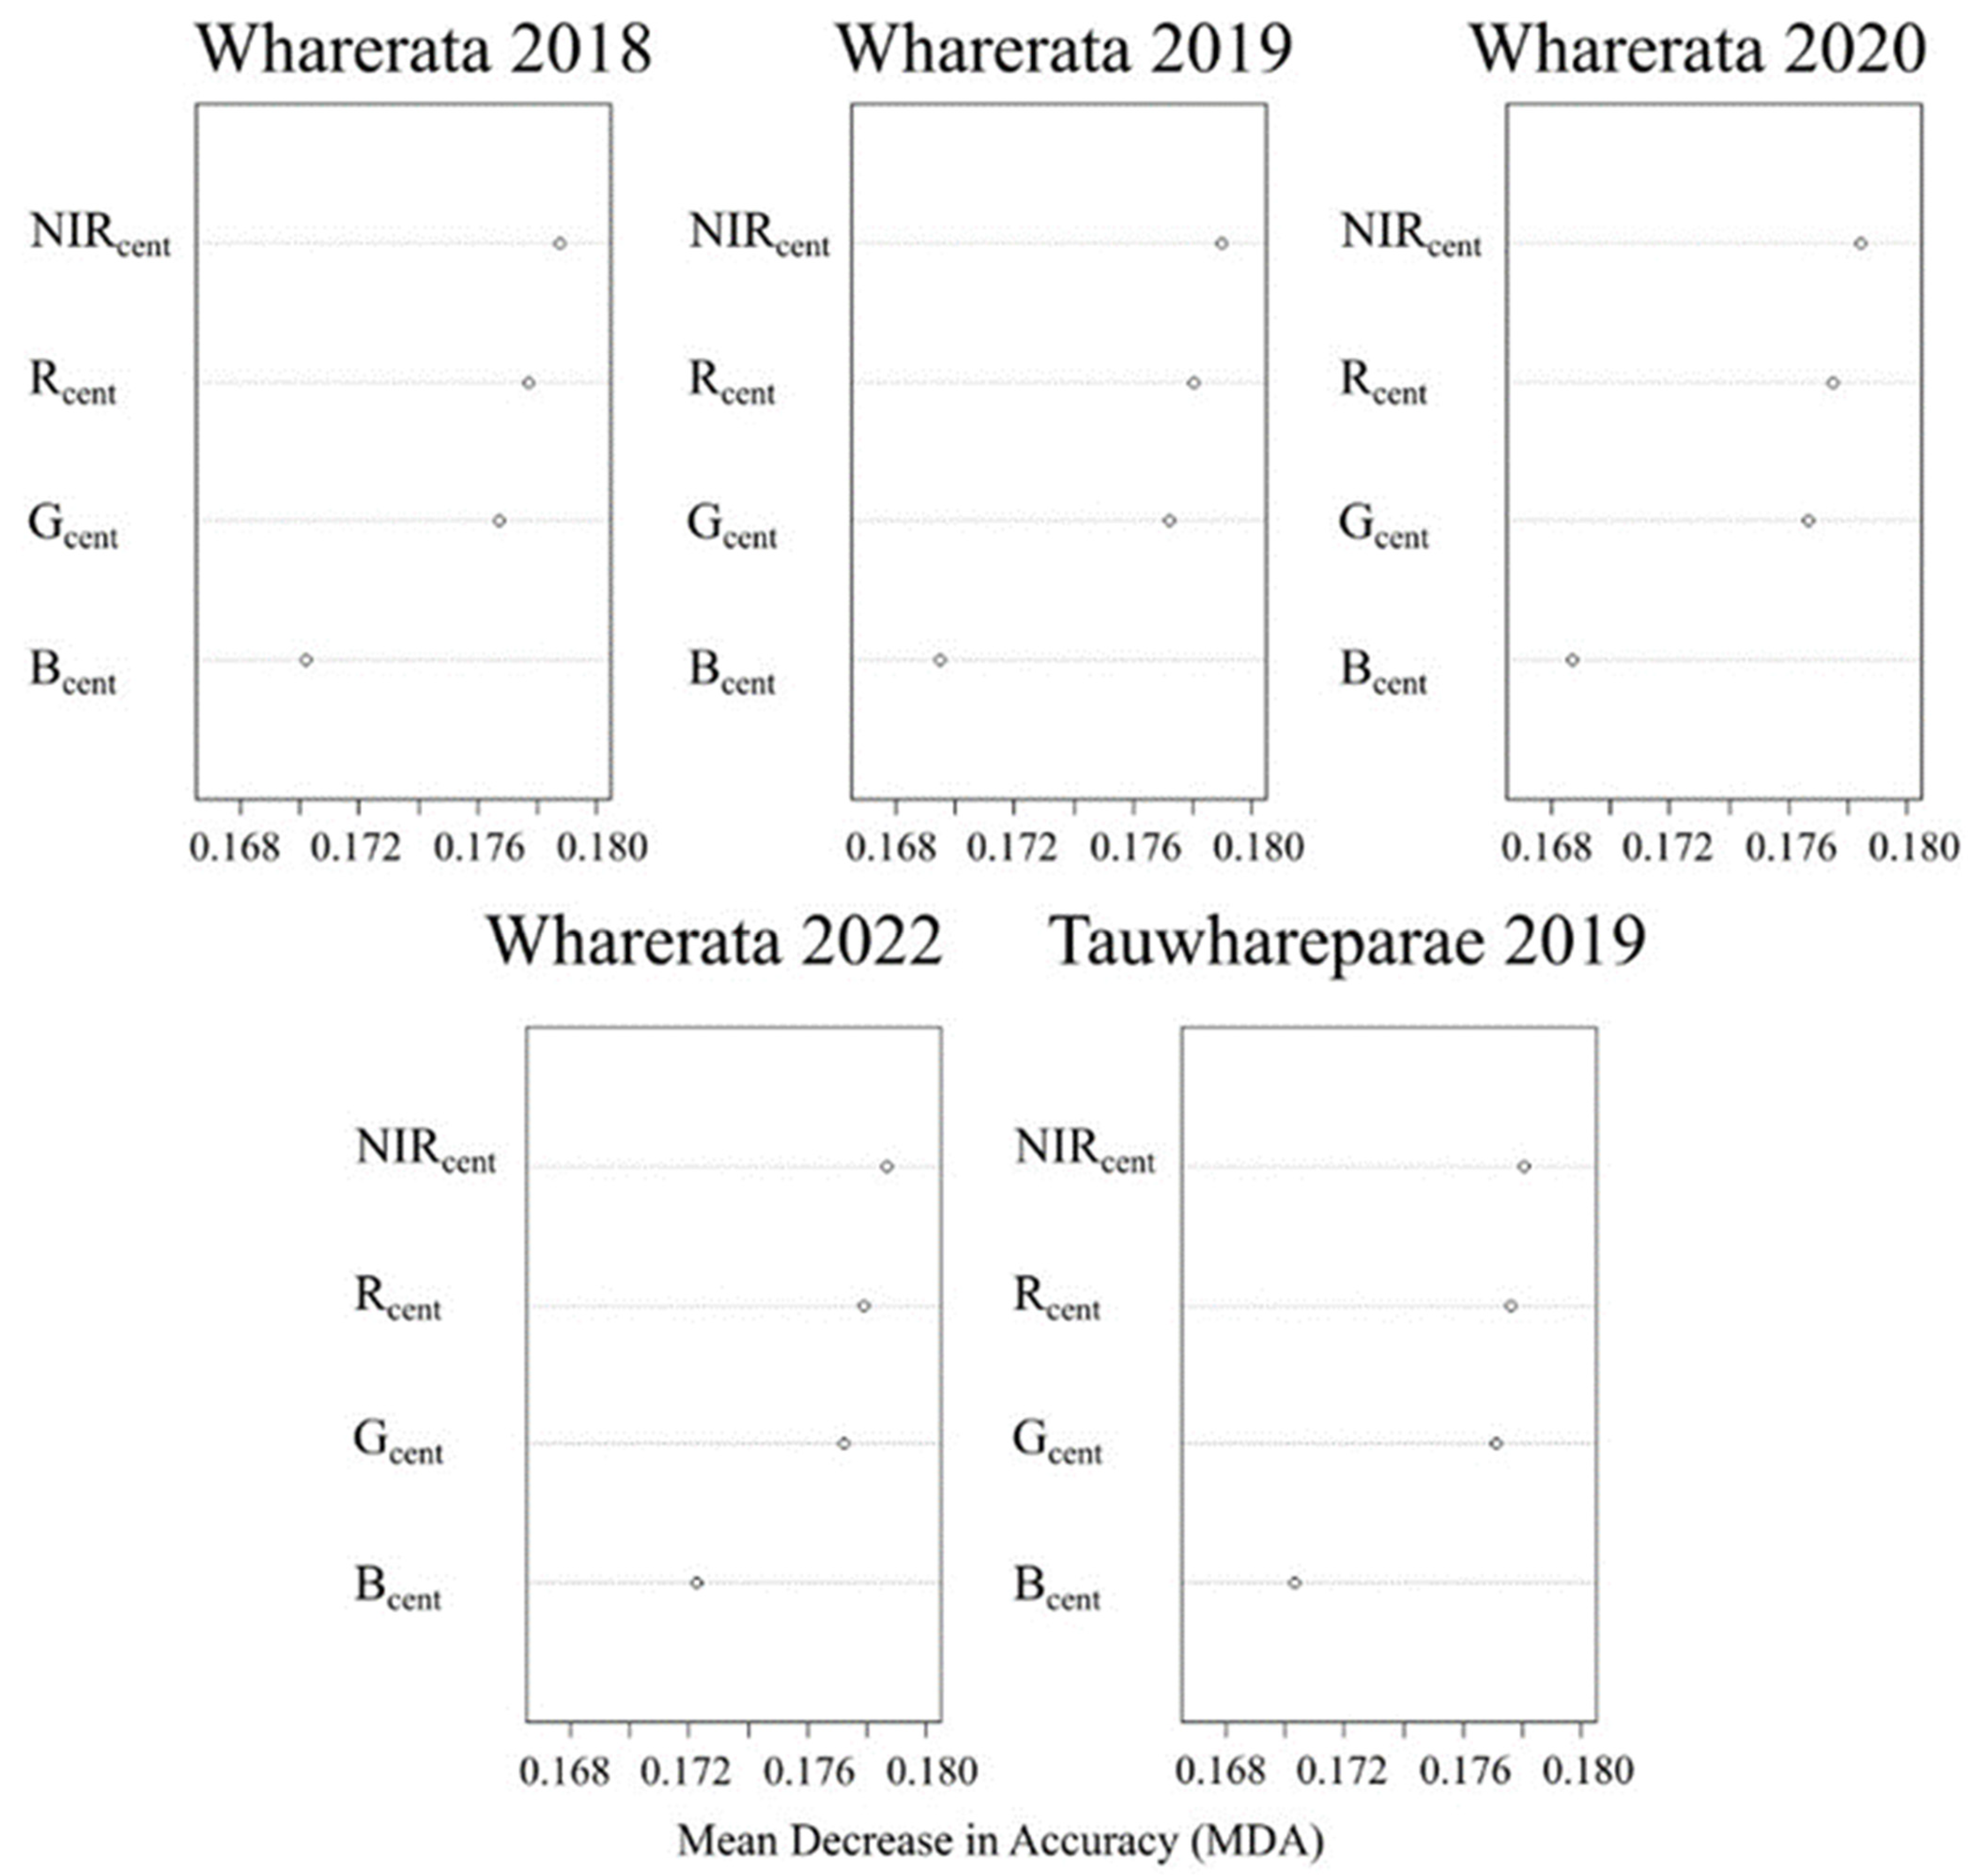
Overall, our results show that RF classification based only on the spectral properties of the unhealthy pine forest pixels was generally consistent across scenes and time steps and this consistency enabled unhealthy pine forest to be distinguished from the other two classes. The variable importance scores showed that the NIR and Red bands were especially useful for separating the classes in all models, further confirming that the different variations in the RF models performed similarly. The importance of Red and NIR bands was not surprising as the ratio of these two bands has been widely used in studies of plant health [
69] due to the strong relationship between Red/NIR ratio and the health status of vegetation [
70]. The Green band was also important, although generally to a lesser extent than the NIR and Red ones, across the RF–LOSO models. The higher importance of NIR and Red likely reflects the reddening of the foliage during outbreaks before the needles are cast. The Blue band ranked the lowest in variable importance, with notably smaller MDA values across all models, but had similar MDA values to the other bands for the unhealthy pine forest class. In combination, the four-band product appeared to offer sufficient spectral discrimination between classes to allow for accurate classification and produced useful maps of disease outbreaks.
The generally high performance of the models suggested that a relatively simple product with only four bands could still produce a transferable model for the task of detecting disease expression caused by RNC outbreaks. Very little benefit from additional spectral bands was observed in earlier testing (
Table A1). This does not fully align with the general trends seen in the literature, where it was reported that a mix of bands and/or vegetation indices was best [
37,
38,
71], although some recent studies are starting to question this assumption [
72]. In their study, Kwan et al. [
72] challenged the generally agreed upon concept of “more spectral information equals better classification outcomes”. They trained a convolutional neural network for land cover classification using only 4 bands (RGB + NIR) and 144 hyperspectral bands. The four-band dataset was augmented using extended multi-attribute profiles (EMAPs), based on morphological attribute filters, with the model using fewer bands achieving a better land cover classification performance. In the present case, a possible explanation for the better performance of fewer bands might be connected to the fact that RNC causes large patches of defoliation in an otherwise homogenous planted canopy—making symptoms easier to detect, even from the four-band imagery. This also suggests that it may be possible to incorporate data from other satellite platforms covering similar spectral ranges. One noticeable issue affecting these maps was the occurrence of misclassified pixels, such as background in forested parcels, that created a ‘salt and pepper’ effect in the final maps. This is a common problem associated with pixel-based analysis, particularly when dealing with high-resolution imagery, and is generally linked to local spatial heterogeneity between neighboring pixels [
73]. Nevertheless, this issue did not overly affect the usefulness of the maps for the identification and classification of patches of unhealthy pine forest.
Although it is unlikely that our approach can detect early pockets of RNC disease for control before spreading (as RNC does not reach the top of the trees until an advanced stage in its outbreak), predictions could be used to identify outbreaks of the disease. These delineated outbreaks will provide useful ground-truth data for models that predict disease expression from landscape features and annual variation in weather. The development of models that utilize temporal and spatial variation in key variables such as air temperature and relative humidity, accessed through platforms such as Google Earth Engine [
74], would allow areas with high disease risk to be identified each year. These predictions, in turn, provide a means of narrowing the extent of satellite imagery required for more in-depth identification of RNC using approaches such as the one described here. The implementation of this approach will allow us to routinely monitor our plantations, quantify and assess impacts of disease on growth, and potentially plan for future control operations (if prior disease contributes to future risk). One of the main limitations of estimating the impact of RNC on growth is the inability to know the disease history over a given stand [
22]. Applying the approach proposed here on satellite imagery will allow us to overcome this limitation and improve our research into growth losses. Furthermore, as additional scenes are acquired and included in the model, it is expected that classification outcomes become more refined, potentially removing some of the salt and pepper effect mentioned earlier, thus allowing for the creation of highly accurate disease expression maps.
To the best of our knowledge, none of the literature currently available addresses training a transferable machine learning model for the automated detection of forest disease. Although our classification algorithm is fully automated, it is still possible to further improve upon it through the addition of new imagery and labeled data. The only step that was required to ingest new data with the RF classifier proved to be the centering of values in the RGB + NIR bands using the z scores step (see Section 2.21 in [
48]). While an alternative approach could be that of radiometrically normalizing the scenes to each other in order to ensure that reflectances of classes are similar across scenes, that approach would require the normalization of all scenes whenever a new scene is available. On the other hand, by using the z scores, any new scene can simply be loaded into R and used for predictions via the existing RF model. This highlights the potential and repeatability of our approach to improve monitoring of forest health without the need for manual interpretation of all newly acquired high-resolution imagery. Importantly, this greatly expands the scale at which monitoring can be undertaken to further our understanding of how environment and genetics interact with disease dynamics. This will help to develop an integrated disease management strategy for RNC in New Zealand’s planted forests [
22,
75].


