Article

Identifying Seismic Anomalies via Wavelet Maxima Analysis of Satellite Microwave Brightness Temperature Observations

1
Institute of Earthquake Forecasting, China Earthquake Administration, Beijing 100036, China
2
Sichuan Earthquake Administration, Chengdu 610000, China
*
Author to whom correspondence should be addressed.
Remote Sens. 2024, 16(2), 303; https://doi.org/10.3390/rs16020303
Submission received: 19 November 2023 / Revised: 29 December 2023 / Accepted: 8 January 2024 / Published: 11 January 2024
(This article belongs to the Section Satellite Missions for Earth and Planetary Exploration)

Abstract

:
This study develops a wavelet maxima-based methodology to extract anomalous signals from microwave brightness temperature (MBT) observations for seismogenic activity. MBT, acquired via satellite microwave radiometry, enables subsurface characterization penetrating clouds. Five surface categories of the epicenter area were defined contingent on position (oceanic/terrestrial) and ambient traits (soil hydration, vegetal covering). Continuous wavelet transform was applied to preprocess annualized MBT readings preceding and succeeding prototypical events of each grouping, utilizing optimized wavelet functions and orders tailored to individualized contexts. Wavelet maxima graphs visually portraying signal intensity variations facilitated the identification of aberrant phenomena, including pre-seismic accrual, co-seismic perturbation, and postseismic remission signatures. The casework found 10 GHz horizontal-polarized MBT optimally detected signals for aquatic and predominantly humid/vegetative settings, whereas 36 GHz horizontal-polarized performed best for arid, vegetated landmasses. Quantitative machine learning methods are warranted to statistically define selection standards and augment empirical forecasting leveraging lithospheric stress state inferences from sensitive MBT parametrization.

1. Introduction

Earthquakes are a significant component of natural disasters on our planet, characterized by suddenness and unpredictability, posing immense threats to human society and natural environments. As a result, earthquake forecasting and research have been essential areas of focus in geophysics, geology, and disaster science. With the advancement of remote sensing technology, microwave brightness temperature data has increasingly been applied to earthquake forecasting and research. Microwave brightness temperature data can penetrate cloud cover and adverse weather conditions, providing valuable information about seismic activity and geological structures, making it of broad application value in earthquake prediction.
Microwave brightness temperature data is obtained through microwave radiometer equipment, which can acquire surface radiation information at different microwave bands [1]. Microwave radiometers are sensors that receive microwave energy from Earth’s surface to measure brightness temperature. This data reveals surface temperature, humidity, wind speed, precipitation, and geological structures. In earthquake prediction, it monitors seismic activity, aiding in understanding earthquake occurrence and progression. Research on earthquake anomalies using microwave brightness temperature data can be traced back to 2009. Takashi Maeda et al. discovered multi-frequency microwave radiation pulses during the compression fracture process of rocks, which led to the selection of an AMSR-E sensor operating at 18.7 GHz to capture dual-polarization data to construct a satellite monitoring algorithm for rock rupture microwave radiation signals [2]. This algorithm was applied to the study of microwave anomalies during the 2008 Wenchuan earthquake in China, revealing a significant rise in MBT along the Longmenshan fault zone the day after the quake. Chen et al. defined a radiation anomaly index and introduced 23.8 GHz microwave data to evaluate the impact of surface temperature and atmospheric water vapor, finding an MBT rise anomaly distributed along the fault zone prior to the 2010 Yushu earthquake in China [3]. Singh et al. used an SSM/I sensor operating at 19 GHz and 37 GHz to collect dual-polarization data to analyze the MBT in the epicenter area of Wenchuan earthquake, recognizing the existence of an MBT rise prior to the Wenchuan earthquake [4]. In terms of research methods on MBT data, Ma et al. proposed a two-step differential method for suppressing non-seismic influence factors such as topography, geomorphology, and meteorological conditions, and revealed a “strengthening-quietness-pre-seismic movement toward the epicenter” feature in MBT before the Wenchuan earthquake based on AMSR-E 18.7 GHz horizontally polarized data [5]. Jie and colleagues used AMSR-E 89 GHz data and visual interpretation to compare the short-term sequence MBT spatial features before and after the 2010 Baja California earthquake in the United States, noting an enhancement of MBT near the epicenter prior to the quake [6]. Zhang et al. developed a statistical pixel-by-pixel algorithm based on earthquake microwave anomaly time and location information using a quartile method in statistics. They applied this method to study the earthquake microwave anomaly phenomena in the Kamchatka region of Russia between 2003 and 2011 using AMSR-E sensor 18.7 GHz dual-polarization data and found that MBT anomalies could be detected for all EQs with magnitudes of 6 or above, mostly occurring within one month before the earthquake [7]. Jing et al. defined an MBT anomaly index that could suppress the effects of surface roughness and vegetation type while detecting significant anomaly points with large amplitude changes in passive microwave images. They conducted research on the pre-quake MBT anomalies of five strong EQs in China’s Sichuan-Tibet region, the 2015 Gorkha earthquake and aftershocks in Nepal using DMSP satellite SSM/I and SSMIS sensor multi-channel data. Significant MBT rises were found near the epicenter or fault zones in most of the cases [8,9]. Considering the similarity and heterogeneity of different influence factors of surface microwave radiation in time and space, scholars reconstruct the weight calculation method and distribution rules of historical microwave data, and put forward the spatio-temporally weighted two-step method (STW-TSM). Based on STW-TSM, the MBT anomaly before and after the 2008 Wenchuan earthquake is studied by using the multi-band dual polarization data of the AMSR-E sensor. It is found that the MBT anomaly increases gradually before the Wenchuan earthquake, reaches the peak on the day of the main shock, and migrates with the aftershocks after the EQ. Its spatial location and shape are completely consistent with the Quaternary strata on the east and west sides of Longmen Mountain. By comparing the detailed characteristics and amplitude of MBT anomalies with different frequencies and polarization, it is considered that 10.65 GHz horizontal polarization is the optimal channel for extracting seismic MBT anomalies. Current research on earthquake MBT anomalies covers various microwave frequencies, mostly observed in microwave radiation during experimental compression loading of rocks. However, the layers located between the lithosphere and atmosphere, which shield the electromagnetic signals emanating from the earth, affect the frequencies or polarizations observed by satellites, making them markedly uncertain. As outdoor environments are complex, laboratory-established stress-sensitive microwave channels may not be well-reflected in satellite observations. Compared to normal background information, MBT anomalies caused by EQs tend to be relatively weak. These weak earthquake responses might be overwhelmed by natural but non-seismic (NbNS) factors affecting land surface microwave media or physical temperatures. Therefore, determining the optimal microwave channels for revealing earthquake MBT anomalies requires further studies.
Qi et al. found that through an in-depth analysis of the natural characteristics of Qingtongxia and surrounding areas, low-frequency (e.g., 10.65 and 18.7 GHz) microwave brightness temperatures are mainly affected by natural factors such as surface temperature and dielectric properties, while high-frequency (e.g., 36.5 and 89 GHz) microwave brightness temperatures reflect more vegetation and air temperature information. It was also found that channels sensitive to factors with a significant dielectric impact are generally at low frequencies, while those sensitive to factors primarily affecting temperature or transmission paths are at high frequencies. The sensitive channels for the same land cover impact factors may vary depending on the geographical location, depending on local temperature and vegetation density [1,10,11,12,13]. Liu et al. detected reliable pre-earthquake microwave brightness temperature anomalies from AMSR-E and AMSR-2 datasets using a two-step wavelet difference method. They found that pre-earthquake MBT anomalies were generally affected by multiple factors, including topography, land cover type, seasonal variations, and meteorological conditions [14,15]. Thus, detecting earthquake MBT anomalies is a problem of identifying weak signals from strong background noise. Researchers have long combined wavelet methods and earthquake-related research. Zhang et al. found that EQ thermal infrared and longwave radiation anomalies shared the same characteristic periods, with the maximum amplitude exceeding nine times, making it easier to extract using the wavelet transform-relative power spectrum method. Earthquake thermal radiation anomaly features showed significant regional and geographical environmental differences [16]. Xiong analyzed the Wenchuan (12 May 2008) and Pu’er (3 June 2007) earthquakes in China using the wavelet Maxima method, and found that there are continuous high intensity wavelet Maxima in the wavelet time series of [17,18,19,20] in the main earthquake area of Wenchuan earthquake. The anomaly intensity of the Pu’er earthquake decreased 5 months before the earthquake and reached anomaly. The intensity suddenly increased sharply in April 2007 and reached its peak in that month, which is the result of great changes in energy during the preparation of the Pu’er earthquake. This conclusion is consistent with the research results of the Wenchuan earthquake.
Consequently, it becomes evident that the wavelet methodology exhibits remarkable efficacy in the extraction of seismic anomalies from microwave brightness temperature data. This notable efficiency primarily derives from the wavelet analysis’s capacity to meticulously examine microwave brightness temperature data across various frequency strata, thereby enabling the effective identification of subtle anomalous signals associated with seismic activity. Through the precise capture and analysis of these minute oscillations, the wavelet method can provide pivotal information, instrumental in the preemptive recognition of potential seismic phenomena.
This paper endeavors to develop an advanced methodology predicated on wavelet maxima for the extraction of anomalous wavelet information, facilitating a comprehensive analysis and investigation of seismic anomalies within microwave brightness temperature data. Firstly, this study will collect and organize microwave brightness temperature data for different surface categories of the epicenter area, including land, ocean, dry soil, wet soil, high vegetation cover areas, and low vegetation cover areas. A total of five classes of earthquake cases will be considered, including ocean, land with high soil moisture and high vegetation cover, land with high soil moisture and low vegetation cover, land with low soil moisture and high vegetation cover, and land with low soil moisture and low vegetation cover. Then, for each category of earthquake cases, the wavelet maxima method will be applied to process and analyze the microwave brightness temperature data. By selecting different frequencies and bands, the optimal microwave brightness temperature characteristics corresponding to different categories of earthquake cases can be extracted. These features can include peak frequency, extreme point location, and the number of maxima.

2. Data and Preprocessing

2.1. Data

2.1.1. Microwave Brightness Temperature (MBT) Data

Since the 1960s, many earth observation satellites have been equipped with microwave radiometers. Since then, passive microwave remote sensing has become an important method for observing terrestrial thermal radiation and energy exchange. Multiple generations of Special Sensor Microwave/Images (SSM/I) on the Defense Meteorological Satellite Program (DMSP), Advanced Microwave Scanning Radiometer-Earth Observing System (AMSR-E) on the NASA Aqua satellite, Advanced Microwave Scanning Radiometer-2 (AMSR-2) on the Global Change Observation Mission-Water (GCOM-W1), and Microwave Radiometer Imager (MWRI) on the China Meteorological Satellite (FY-3B) have been extensively used for researching seismic microwave radiation anomalies. The MBT data used in this research is selected from the AMSR-2 instrument. AMSR-2 is successor to the AMSR on Advanced Earth Observing Satellite-II (ADEOS-II) and AMSR-E on the Aqua satellite. Launched in May 2012, this instrument has successfully gathered Earth’s microwave radiation for over nine years. AMSR-2 was equipped with 12 channels, i.e., five microwave frequencies, including 10.65, 18.7, 23.8, 36.5 GHz and 89.0 GHz (A and B), and dual-polarized (vertical and horizontal). The instantaneous field of view (IFOV) ranges from 24 × 42 km to 3 × 5 km, corresponding to the above five frequencies. The AMSR-2 observation data used in this research was obtained under descending mode (local night time) to minimize disruption from human activities and strong daytime background. The MBT data time range used in this research is from January 2013 to August 2023, with a spatial resolution of 0.25°.

2.1.2. Remote Sensing Parameters Influencing MBT Data

Vegetation coverage and soil moisture are two key factors in the study of microwave data. Vegetation has a significant effect on the absorption and scattering of microwave radiation. In the areas with high vegetation coverage, the scattering effect of vegetation on microwave radiation is more obvious, which weakens the total microwave radiation from the surface. The effect of soil moisture on microwave brightness temperature is mainly reflected in the absorption, emission and scattering of microwave radiation. When the soil moisture is high, the electromagnetic properties of the soil will change, which will increase the absorption and scattering of microwave radiation and reduce the microwave brightness temperature [21,22,23].
In addition to the aforementioned data, satellite remote sensing data was also used. The study utilized satellite remote sensing data, including soil moisture and vegetation coverage, for time-series analysis to distinguish the anomalous points of the revealed MBT. This data was sourced from GES DISC, providing a temporal resolution of one day and a spatial resolution of 0.25°. The full name of the dataset is GLDAS Catchment Land Surface Model L4 daily 0.25 × 0.25 degree GRACE-DA1 V2.2. The vegetation coverage data is extracted from ERA5, with a spatial resolution of 0.25°. The full name of the dataset is ERA5 hourly data on single levels from 1940 to present. As the temporal resolution of vegetation coverage data is hours, we need to process the average of time in advance to make sure the temporal resolution of vegetation coverage data matches that of the other types of data, i.e., one day.

2.2. Data Processing

Following the standardization of the spatiotemporal resolution of the aforementioned data, we performed a temporal and spatial registration of the data and categorized the microwave brightness temperature data into five distinct types: Type 1 for microwave brightness temperatures located in oceanic regions; Type 2 for regions with a vegetation cover greater than 0.5 and soil moisture content exceeding 6; Type 3 for areas where vegetation cover is greater than 0.5, but soil moisture is less than or equal to 6; Type 4 for regions with vegetation cover less than or equal to 0.5, yet soil moisture exceeding 6; and Type 5 for areas where both vegetation cover and soil moisture are less than or equal to 0.5 [24,25,26,27,28]. Detailed information is presented in Table 1.
In addition, we also classified seismic events. Based on the temporal and spatial coordinates of earthquake occurrences, we aligned these with the aforementioned categories, thus deriving a five-fold classification for seismic activities. This study selected global seismic events exceeding a magnitude of 4.8 from 1 January 2013 to 1 August 2023 (sourced from USGS). After classifying each event, we identified the most representative seismic occurrence for each category: the 24 May 2013 magnitude 8.3 earthquake in the Sea of Okhotsk (Type 1); the 26 May 2019 magnitude 8.0 earthquake in Peru (Type 2); the 25 April 2015 magnitude 7.8 earthquake in Nepal (Type 3); the 6 February 2023 magnitude 7.8 earthquake in Turkey (Type 4); and the 13 November 2016 magnitude 7.8 earthquake in New Zealand (Type 5). Detailed information is presented in Table 2.

3. Comprehensive Methodological Approach

Through previous research, it has been found that wavelet analysis effectively separates the frequency domain and time domain information of signals, which is crucial for the analysis of microwave brightness temperature data. The separation of frequency and time domain information allows for a better understanding of microwave signal characteristics and variations.
Wavelet analysis possesses excellent noise reduction and interference suppression ability, thereby effectively eliminating noise and disruption, improving the signal-to-noise ratio of microwave brightness temperature data. As a result, it facilitates the extraction of useful signal features and discovery of potential seismic activity. Concurrently, wavelet analysis can achieve data compression, compressing a large amount of microwave brightness temperature data into a small amount of feature information, reducing storage space and calculation quantity. This is beneficial for handling large amounts of microwave brightness temperature data.
Additionally, wavelet analysis can be combined with visualization technology to implement visualization analysis of microwave brightness temperature data. Through visualization analysis, we can observe the variations and traits of the microwave signal more intuitively, enhancing our understanding of seismic activity. Based on these advantages, this paper has developed an extraction method for abnormal microwave brightness temperature data based on the maximum value method of wavelets.

3.1. Wavelet Analysis Method

The fundamental principle of wavelet analysis is signal decomposition through a series of wavelet functions that adapt to different frequency ranges and time frames. By decomposing the signal into multiple wavelet functions, useful spatial characteristics can be extracted, and non-linear and non-stationary characteristics can be accurately and efficiently drawn out. Meanwhile, wavelet analysis can also reconstruct the time-domain and frequency-domain characteristics, therefore obtaining more complex information regarding signal quality.
Specifically, wavelet analysis considers seismic signals as the overlap of a set of wavelet functions, describing local seismic signal traits at different scales. By analyzing these wavelet function coefficients, seismic signal characteristics such as amplitude, frequency and phase can be extracted, which can be used to predict the occurrence of earthquakes.

3.1.1. Continuous Wavelet Base Function

The choice of the wavelet base function determines the efficiency and effect of wavelet transformation. The wavelet base function is flexible to choose and can be constructed based on the issues faced. The following list includes a few continuous wavelet base functions employed in this paper:
(1)
Haar wavelet
ψ H ( t ) = { 1 , 0 t 1 2 1 , 1 2 t 1 0 , else
It can be said that the Haar wavelet is the simplest of all known wavelets. For the translation of t the Haar wavelet is orthogonal. For one-dimensional Haar wavelet, it can be regarded as the completion of the difference operation, that is, the difference of the part which is not equal to the average value of the observed results. Obviously, Haar wavelets are not continuous differentiable functions.
(2)
Mexico wavelet
The Mexico hat wavelet is the second derivative of the Gaussian function, that is:
ψ ( t ) = 2 3 π 1 / 4 ( 1 t 2 ) e t 2 / 2
The coefficient 2 3 π 1 / 4 is mainly to ensure the normalization of ψ(t), i.e., ψ 2 = 1 . This wavelet uses the second order derivative of the Gaussian smoothing function and is named due to the similarity of the waveform to the Mexican Hat (straw hat) parabolic contour line. It has gained more applications in visual information processing research and edge detection; hence it is also called the Marr wavelet.
A cluster of wavelets can be given by the m th order derivative of the Gaussian function:
ψ m = C m ( 1 ) m d 2 d t m ( e t 2 2 )
The constant in Equation (3) is to ensure that ψ m 2 = 1 . Although the Mexican straw hat wavelet is equivalent to the case of m = 2 in Equation (3), it is isotropic and thus cannot detect different directions of the signal.
The DOG wavelet formed with the Difference of Gaussians (DOG) function is a good approximation of the Mexico straw hat wavelet as:
ψ ( t ) = e t 2 2 1 2 e t 2 / 8
Morlet real wavelet:
ψ 0 ( t ) = π 1 / 4 cos ( 5 t ) e t 2 / 2
The Morlet wavelet is the most commonly used complex-valued wavelet, which is defined by Equation (6).
ψ 0 ( t ) = ( π f B ) 0.5 e j 2 π f c t e t 2 f B ω
The Fourier transform of Equation (6) is given by
ψ 0 ( f ) = e ( f f 0 ) 2 f B
Typically, ω 0 5 , ω 0 = 5 is the most used case. f B is the bandwidth and f C is the centre frequency.
(3)
Complex Gaussian wavelet
A complex Gaussian wavelet consists of the nth order derivative of a complex Gaussian function defined as follows:
ψ ( t ) = C n d n d x ( e j x e x 2 )
The constant C n is used to maintain the energy normalisation property of the wavelet function.
(4)
Fushanong wavelet
ψ ( t ) = f B 0.5 sin ( f B t m ) m exp ( 2 j π f c t )
where f B is the bandwidth, f C is the centre frequency and m is a positive integer.

3.1.2. Wavelet Maxima

Let W f ( s , x ) be the convolutional wavelet transform of the function f ( x ) , and the point ( s 0 , x 0 ) is said to be a local extremum point under the scale s 0 if W f ( s 0 , x ) x has a point over zero on x 0 . If ( s 0 , x 0 ) has a zero crossing point on, then it is the modulo maximal point of the wavelet and then visualized transform, and for any point x belonging to a neighborhood of x 0 , there are
| W f ( s 0 , x ) | | W f ( s 0 , x 0 ) |
Mathematically, an infinitely derivable function is said to be smooth or free of singularities, and a function is said to be singular here if it has a break somewhere or if the derivatives of a certain order are discontinuous. A mutating signal must be singular at its point of mutation.
The degree of singularity of a function (or signal) f ( x ) R at a point is often portrayed by its singularity index, Lipschitz α , abbreviated as Lip index.
Let 0 α 1 , at the point x 0 if there exists a constant K, for any point x in the neighbourhood of x 0 such that the following equation holds:
f ( x ) f ( x 0 ) K x x 0
Then f ( x ) is said to be Lip α at x 0 .
The Lip index α gives precise information about the conductivity of the signal f ( x ) at the point x 0 . If α = 1 the function f ( x ) is continuously differentiable at x 0 , the function f ( x ) is said to have no singularity; if α = 0 , the function f ( x ) is interrupted at x 0 ; if 0 < α < 1 the smoothness of the function decreases. If α is larger, then the singular function f ( x ) is closer to the rule; if α is smaller, then the singular function f ( x ) at x 0 point changes more sharply. Usually, the singularity of a signal tends to behave as a positive singularity, while noise behaves as a negative singularity.
The use of wavelet transforms to detect the singularity of the signal is mainly reflected in two aspects: one is the use of wavelet transform on the location of the singularity of the positioning and noise cancellation processing; the second is the use of wavelet transform to determine the singularity of the singularity index (i.e., the size of the singularity).
The wavelet used for singularity detection is different from the general orthogonal wavelet, which is obtained from the smooth function. Let θ ( x ) be a smooth function with low-pass property, and take its first-derivative φ ( x ) = d θ ( x ) d x as a wavelet, it is not difficult to prove the following relationship:
W f 1 ( s , x ) = f ( x ) ϕ s 1 ( x ) = s d d x [ f ( x ) θ s ( x ) ] ω
where: θ s ( x ) = 1 s θ ( x s ) . The above equation shows that the three-wavelet transform of the signal f ( x ) can be expressed as the first-order derivative of the signal after f ( x ) is smoothed by θ s ( x ) at the scale, s where the extreme point of the wavelet transform is the turning point of f ( x ) θ s ( x ) , which in the limit is the step point. The advantage of characterizing the signal in terms of the extremes of W f 1 ( s , x ) is that it is possible to distinguish between the very large and the very small. Extremes are where the signal changes dramatically and minima are where the signal changes slowly. These basic conclusions form the theoretical basis for the detection of anomalies (sudden signal change points) by the wavelet extreme value method.

3.2. Research Approach

Based on the aforementioned theoretical foundation, we have constructed a global microwave brightness temperature database from 1 January 2013 to 1 August 2023. This is achieved by combining the microwave brightness radiation data from the GCOM-W1 satellite platform and the AMSR2 sensor, using a spatial resolution of 0.25° × 0.25°. We made use of the spatial continuity in seismic geology and earthquake remote sensing data and considered specific earthquake events to identify geographically corresponding research areas. We applied the one-dimensional continuous wavelet method to test the time series of AMSR2 microwave brightness temperature data, calculated the wavelet maxima, visualized them, and explored their relationship with earthquake timings. Ultimately, we defined seismic anomalies through the intensity of wavelet maxima.
Considering the physical causes of microwave brightness temperature mentioned above, we decided to use the following continuous wavelet transformation methods after several experiments: Daubechies wavelet method (abbreviated as ‘db’), Gaussian derivative wavelet method (abbreviated as ‘gaus’), Meyer wavelet method (abbreviated as ‘meyr’), and Morlet wavelet method (abbreviated as ‘morl’). We utilized these to detect seismic anomalies in microwave brightness temperature data through wavelet maxima graphing methods.
Taking the seismic events in the Nepal region as an example, our specific research approach is outlined below; the specific flow chart is shown in Figure 1.
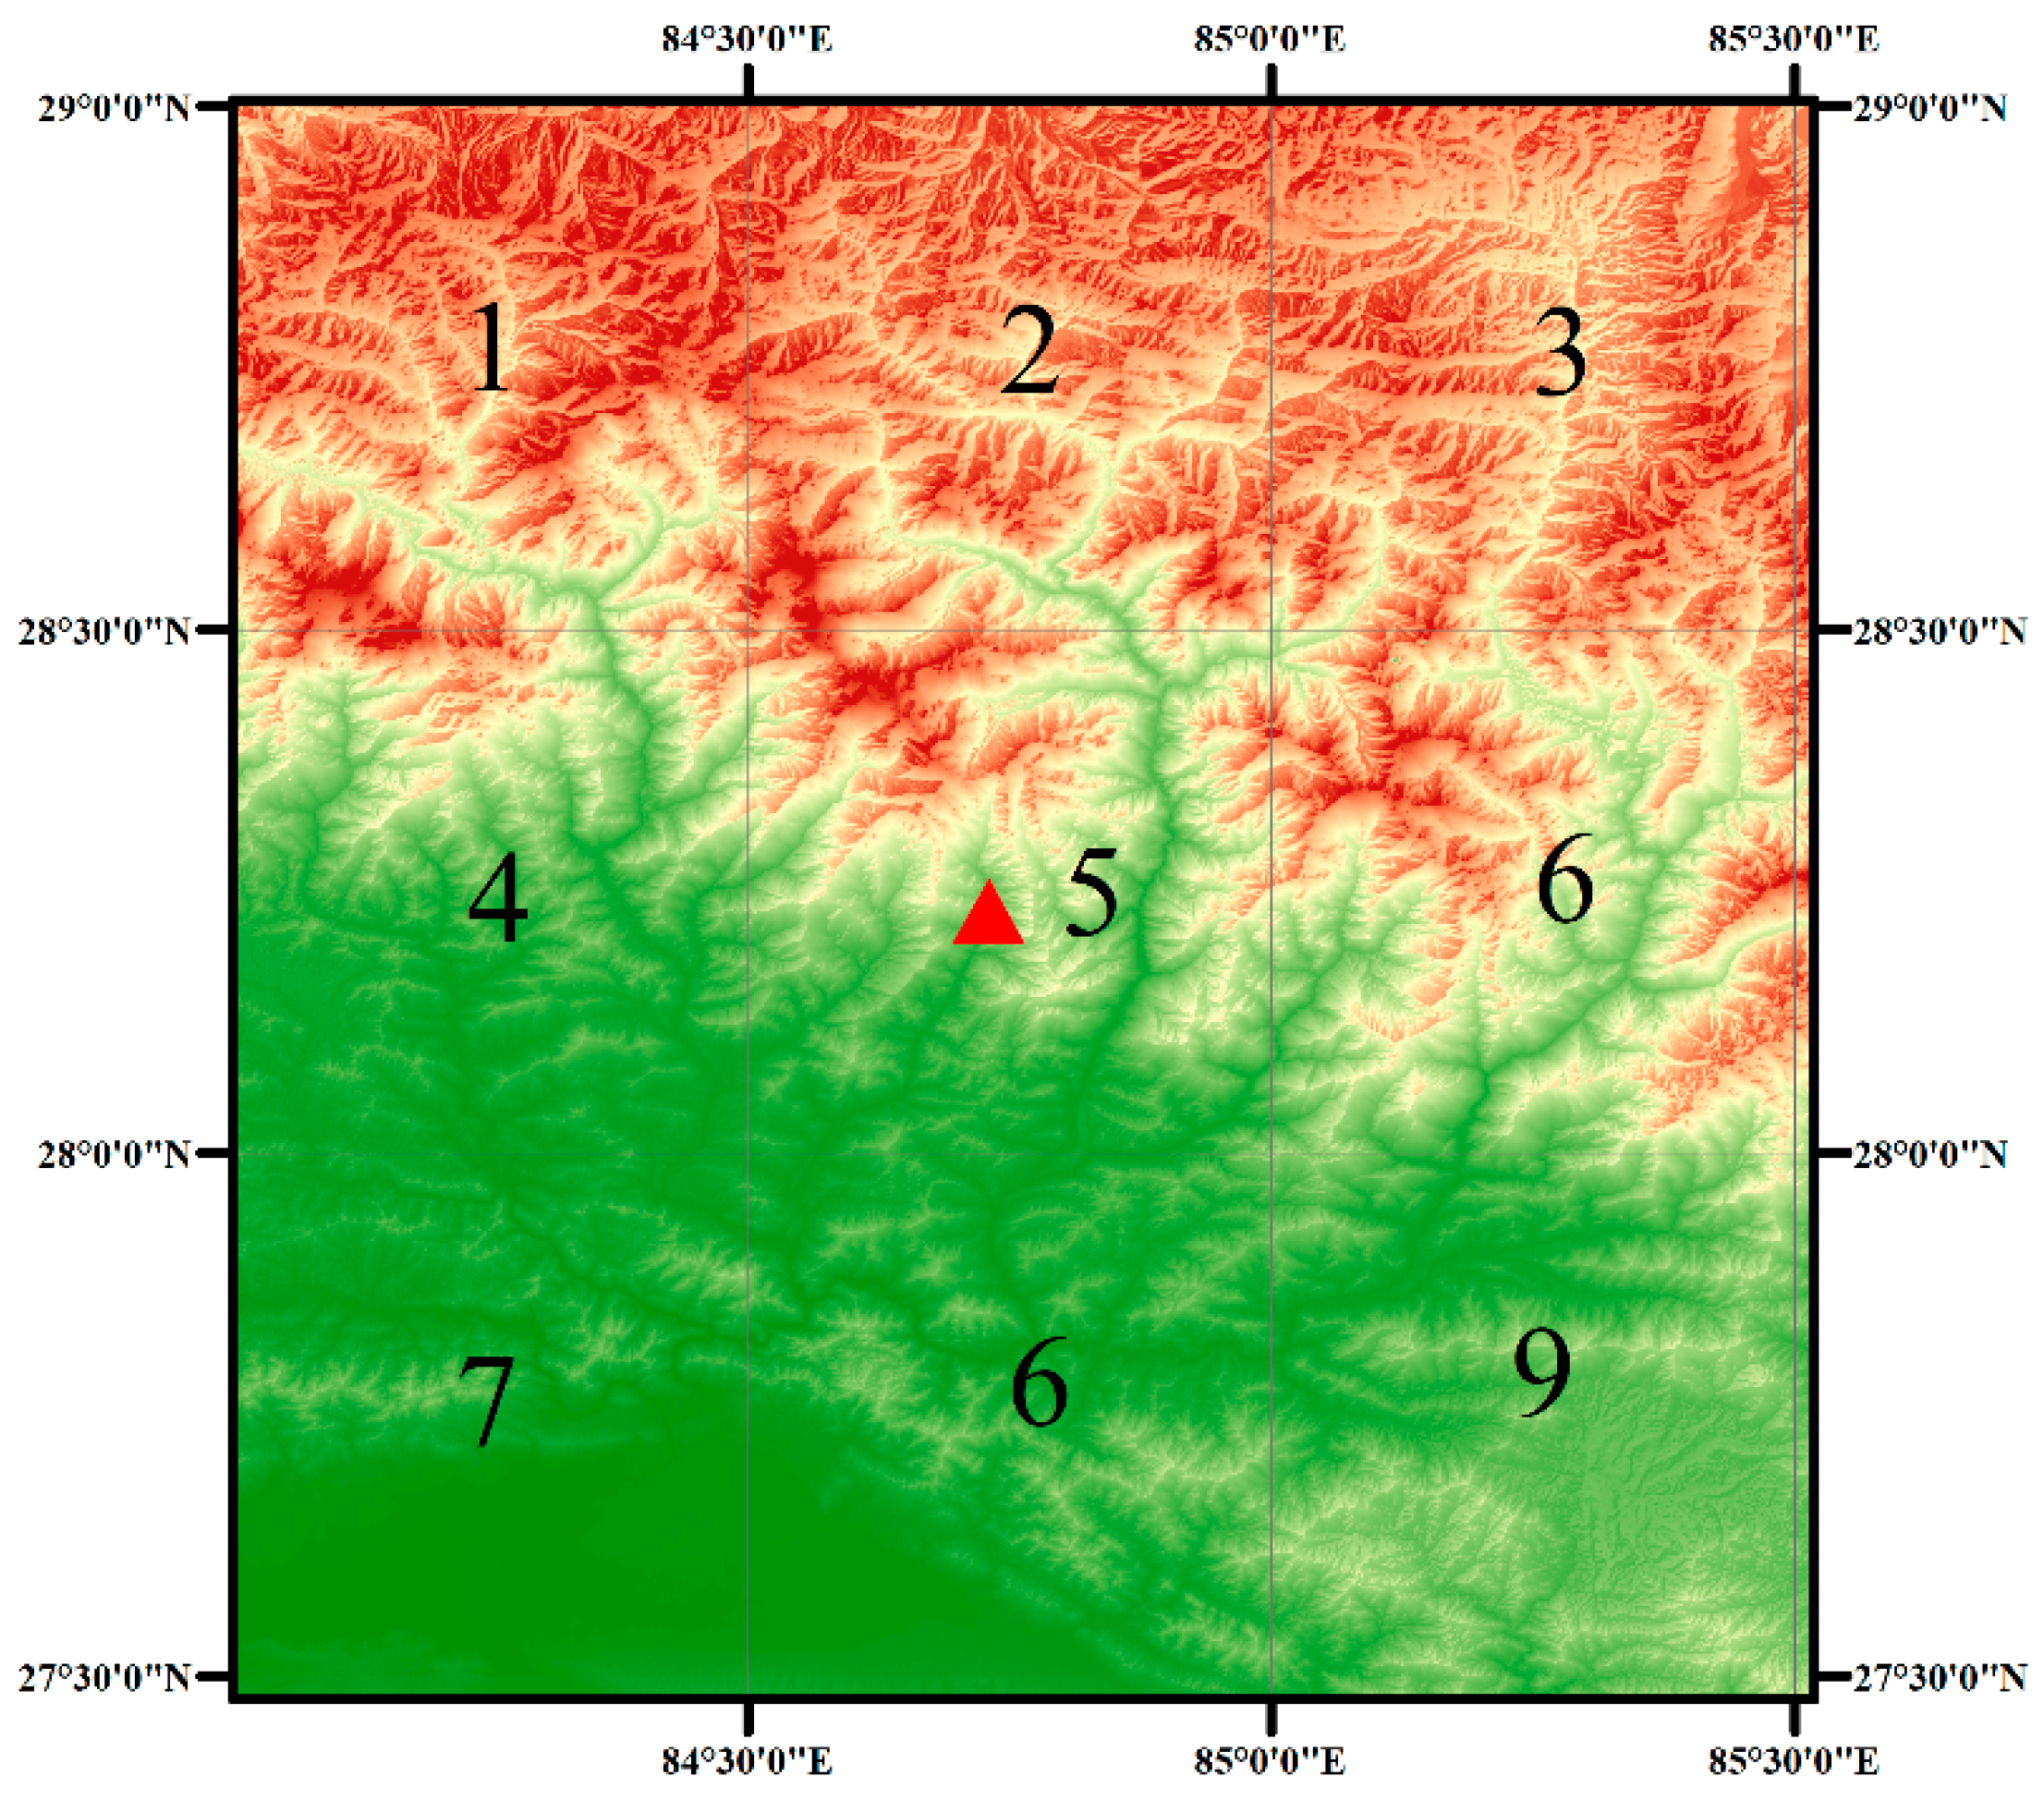
Firstly, we define the research area and divide it into grid cells (Figure 2).
Based on the seismic geological background of the research area and in order to better study the immense energy changes in earthquakes, we defined a research experimental area centered around the epicenter of the earthquake in the Nepal region, with a size of 1.5° × 1.5°. For convenience in subsequent research, considering the characteristics of the selected microwave brightness temperature data, we divided the research experimental area into nine different grid cells of 0.5° × 0.5° each. These were distinguished using Arabic numerals, with the epicenter located in grid cell 5 (Mark with red triangles).
Secondly, we calculate the wavelet maxima of microwave brightness temperature in each grid cell.
We selected approximate daily mean data of microwave brightness temperature for a year before and after the time of the earthquake in the Nepal region (29 August 2014 to 23 August 2015). After a series of data preprocessing steps such as eliminating bad points and data interpolation, we formed daily mean data files of microwave brightness temperature time series.
Regarding the testing of different wavelet function and orders, for Type 1 cases, we used the db3 wavelet function and the wavelet order was 16; for Type 2 cases, we used the meyr wavelet function, and the wavelet order was 16; for Type 3 cases, we used the morl wavelet function, and the wavelet order was 20; for Type 4 cases, we used the gaus3 wavelet function, and the wavelet order was 13; for Type 5 cases, we used the gaus5 wavelet function, and the wavelet order was 20. This process would generate wavelet coefficients corresponding to each wavelet order. Using the generated wavelet coefficients, combined with mathematical principles such as singularity detection, we can calculate the wavelet maxima. The original time series data, wavelet coefficients, and wavelet maxima are then visualized. This constitutes the basic research approach of the wavelet maxima graphing method.
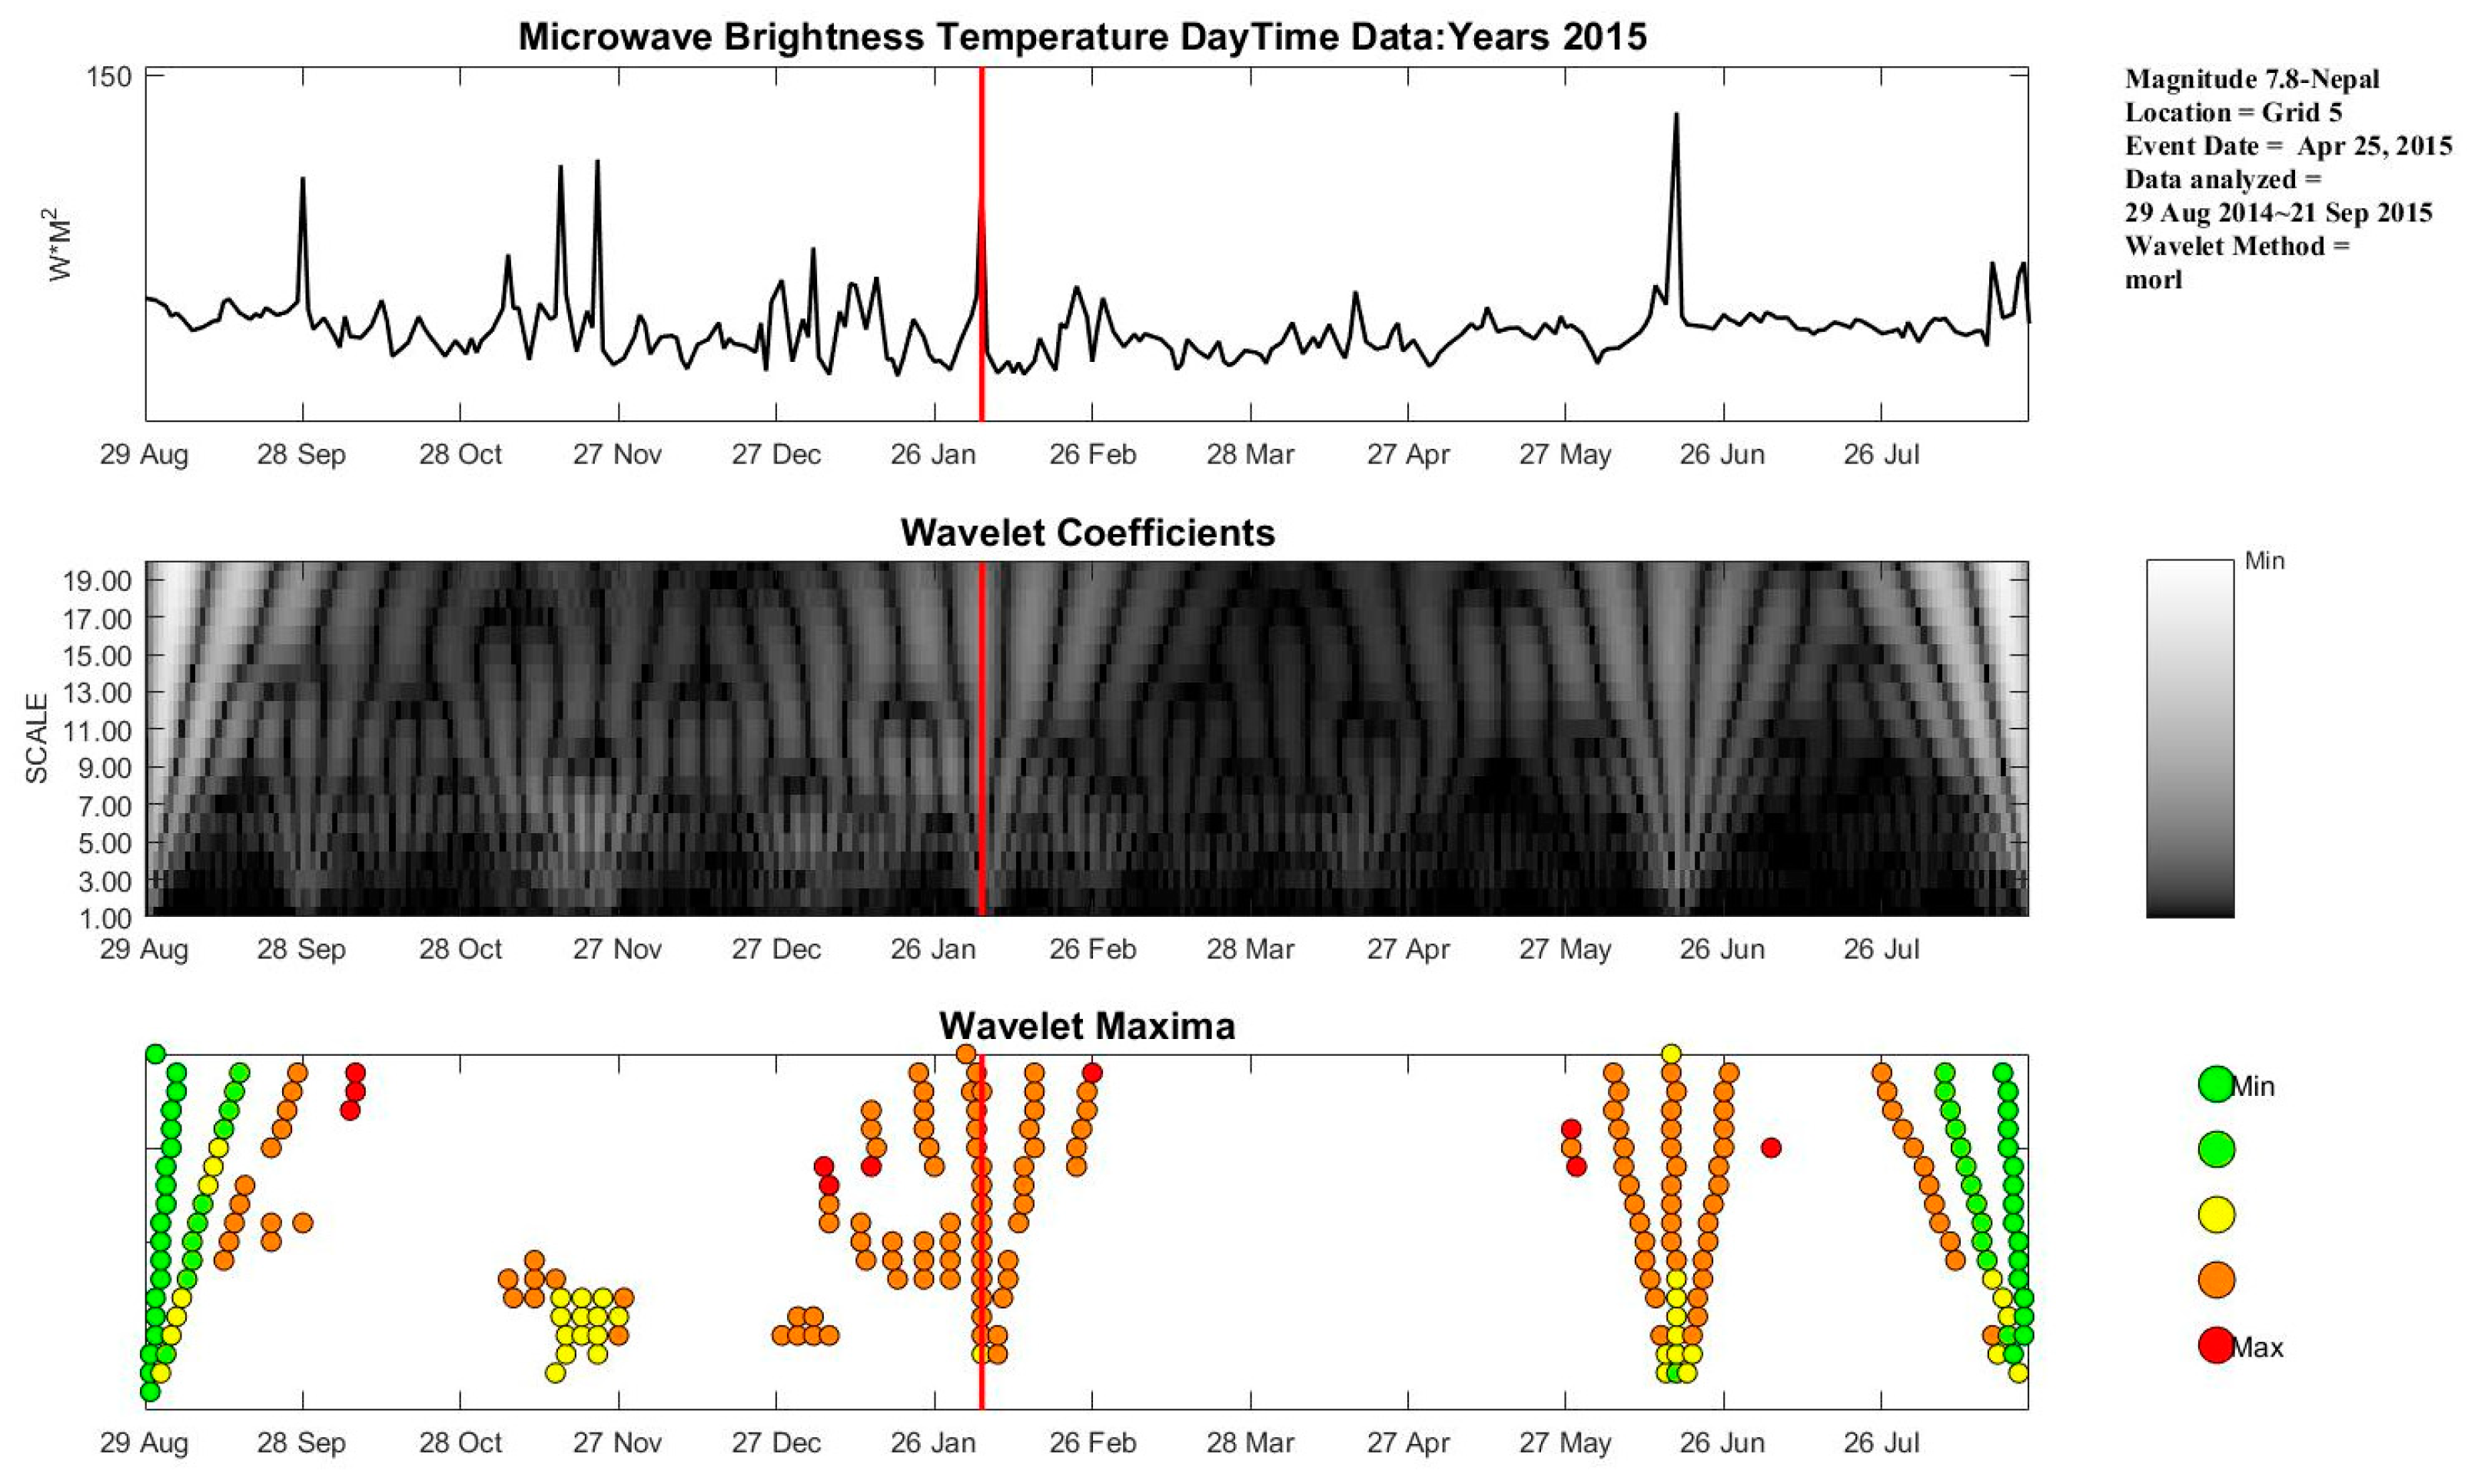
Having undergone the above processing, the time series microwave brightness temperature data in each grid cell has ultimately formed a wavelet maxima map (Figure 3), which includes three parts: (a) visualization of microwave brightness temperature data value in time series, (b) grey scale 3D plot of wavelet coefficients after wavelet transformation, and (c) wavelet maxima map after treatment.
Color is used to distinguish the intensity of the wavelet maxima—the darker the color, the greater the intensity. Black is used to represent the maximum intensity, while gray, white represents the minimum intensity.
Thirdly, we form a sequence map of wavelet maxima.
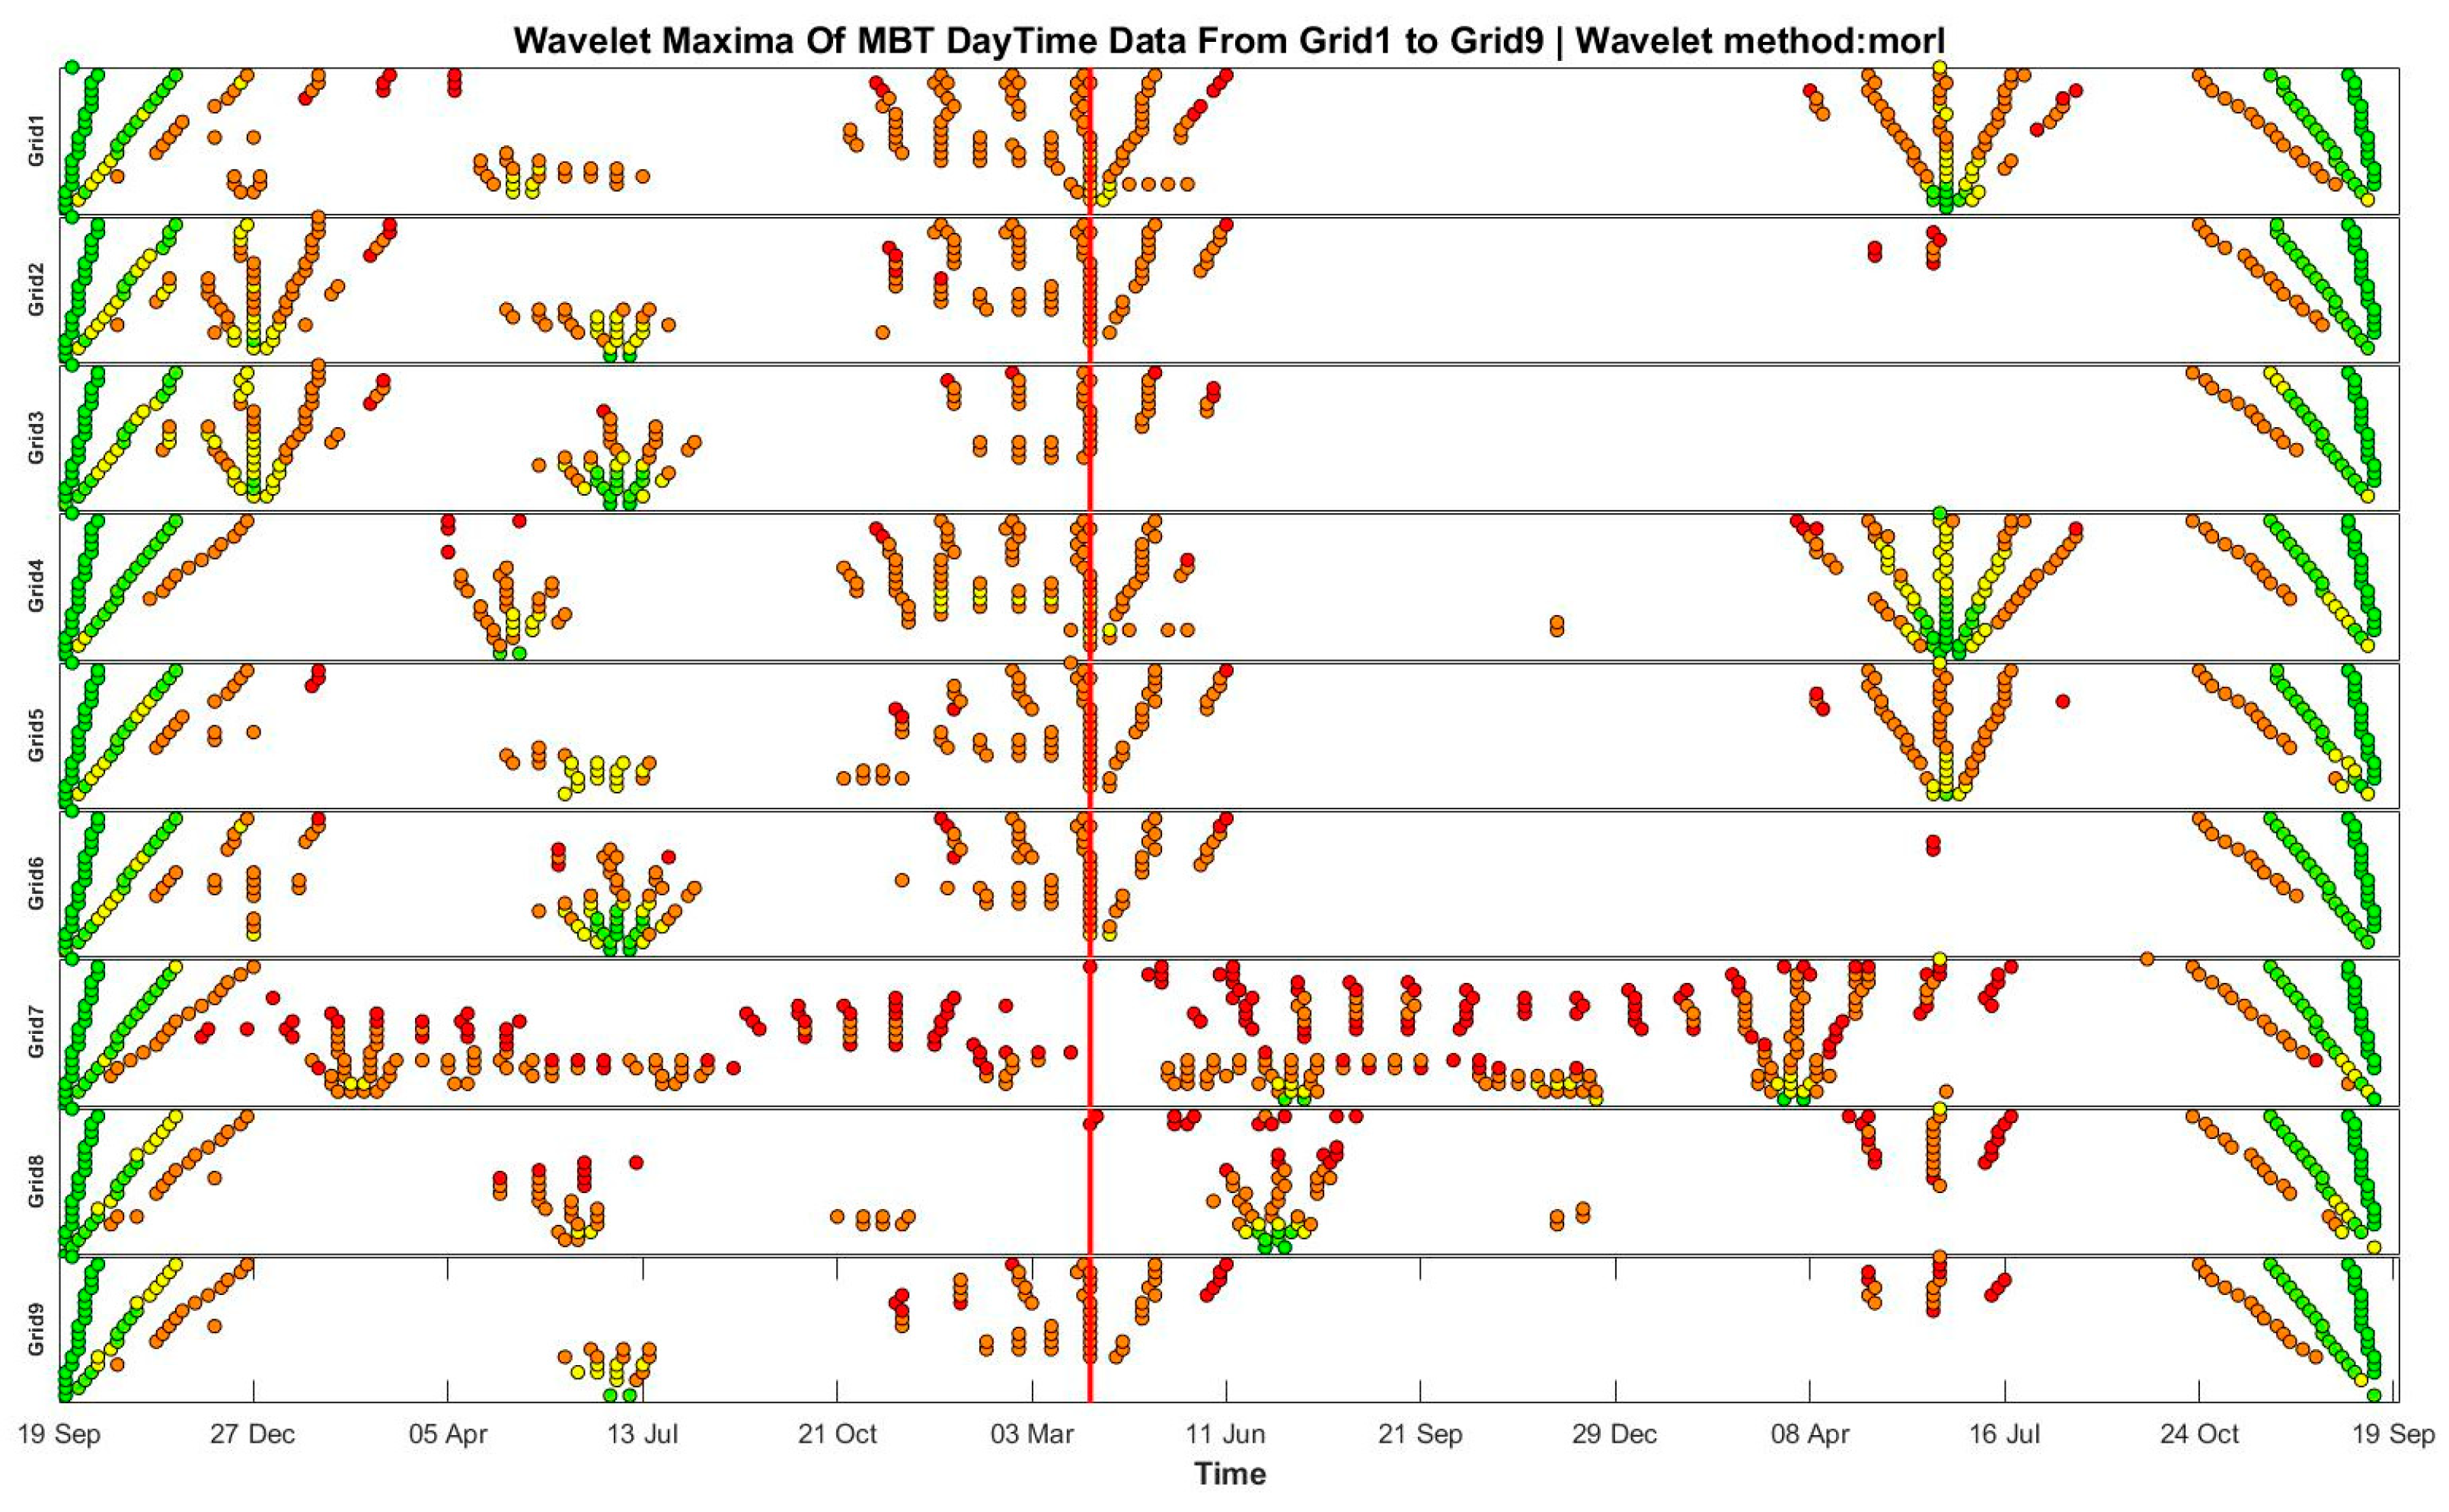
Using the wavelet maxima segments of the wavelet maxima graphics in the nine grid cells, we stack them in numerical order to form a spatially continuous sequence map of wavelet maxima (Figure 4).
In the graph, the horizontal axis represents time in days, the vertical axis represents the nine grid cells of the experimental research area arranged in spatial order, and the legend uses color to indicate the intensity of the wavelet maxima. The graph’s top section marks the earthquake and related information about the selected data along with the chosen wavelet method. The red line in the graph indicates the time of the earthquake occurrence.
Lastly, we identify abnormal information in the wavelet maxima sequence map. Based on the physical causes of the microwave brightness temperature data, non-periodic, local, and isolated changes in the microwave brightness temperature data in the sequence map of wavelet maxima are considered potentially earthquake-induced anomalies. Additionally, the extreme energy changes before and after an earthquake can also lead to an increase in longwave radiation intensity. Therefore, wavelet maxima with high intensity and continuity are also viewed as possible earthquake anomalies.
Summarizing the abnormal characteristics of the wavelet maxima sequence map and analyzing their causes, we categorize them into three types: (1) pre-shock anomaly, which could be due to the extreme energy accumulating before the earthquake; (2) co-seismic anomaly, which is caused by the immense energy changes during the earthquake itself; and (3) post-shock anomaly, perhaps due to the energy impact from the numerous aftershocks following the main earthquake.

4. Results

Based on the research process described above, we collected the seismic cases that occurred globally from January 2013 to August 2023, and according to the classification criteria mentioned earlier, we selected one earthquake from each of the five types of earthquakes (Table 2) to conduct a single case study investigation.

4.1. Ms 8.3 Earthquake in the Sea of Okhotsk

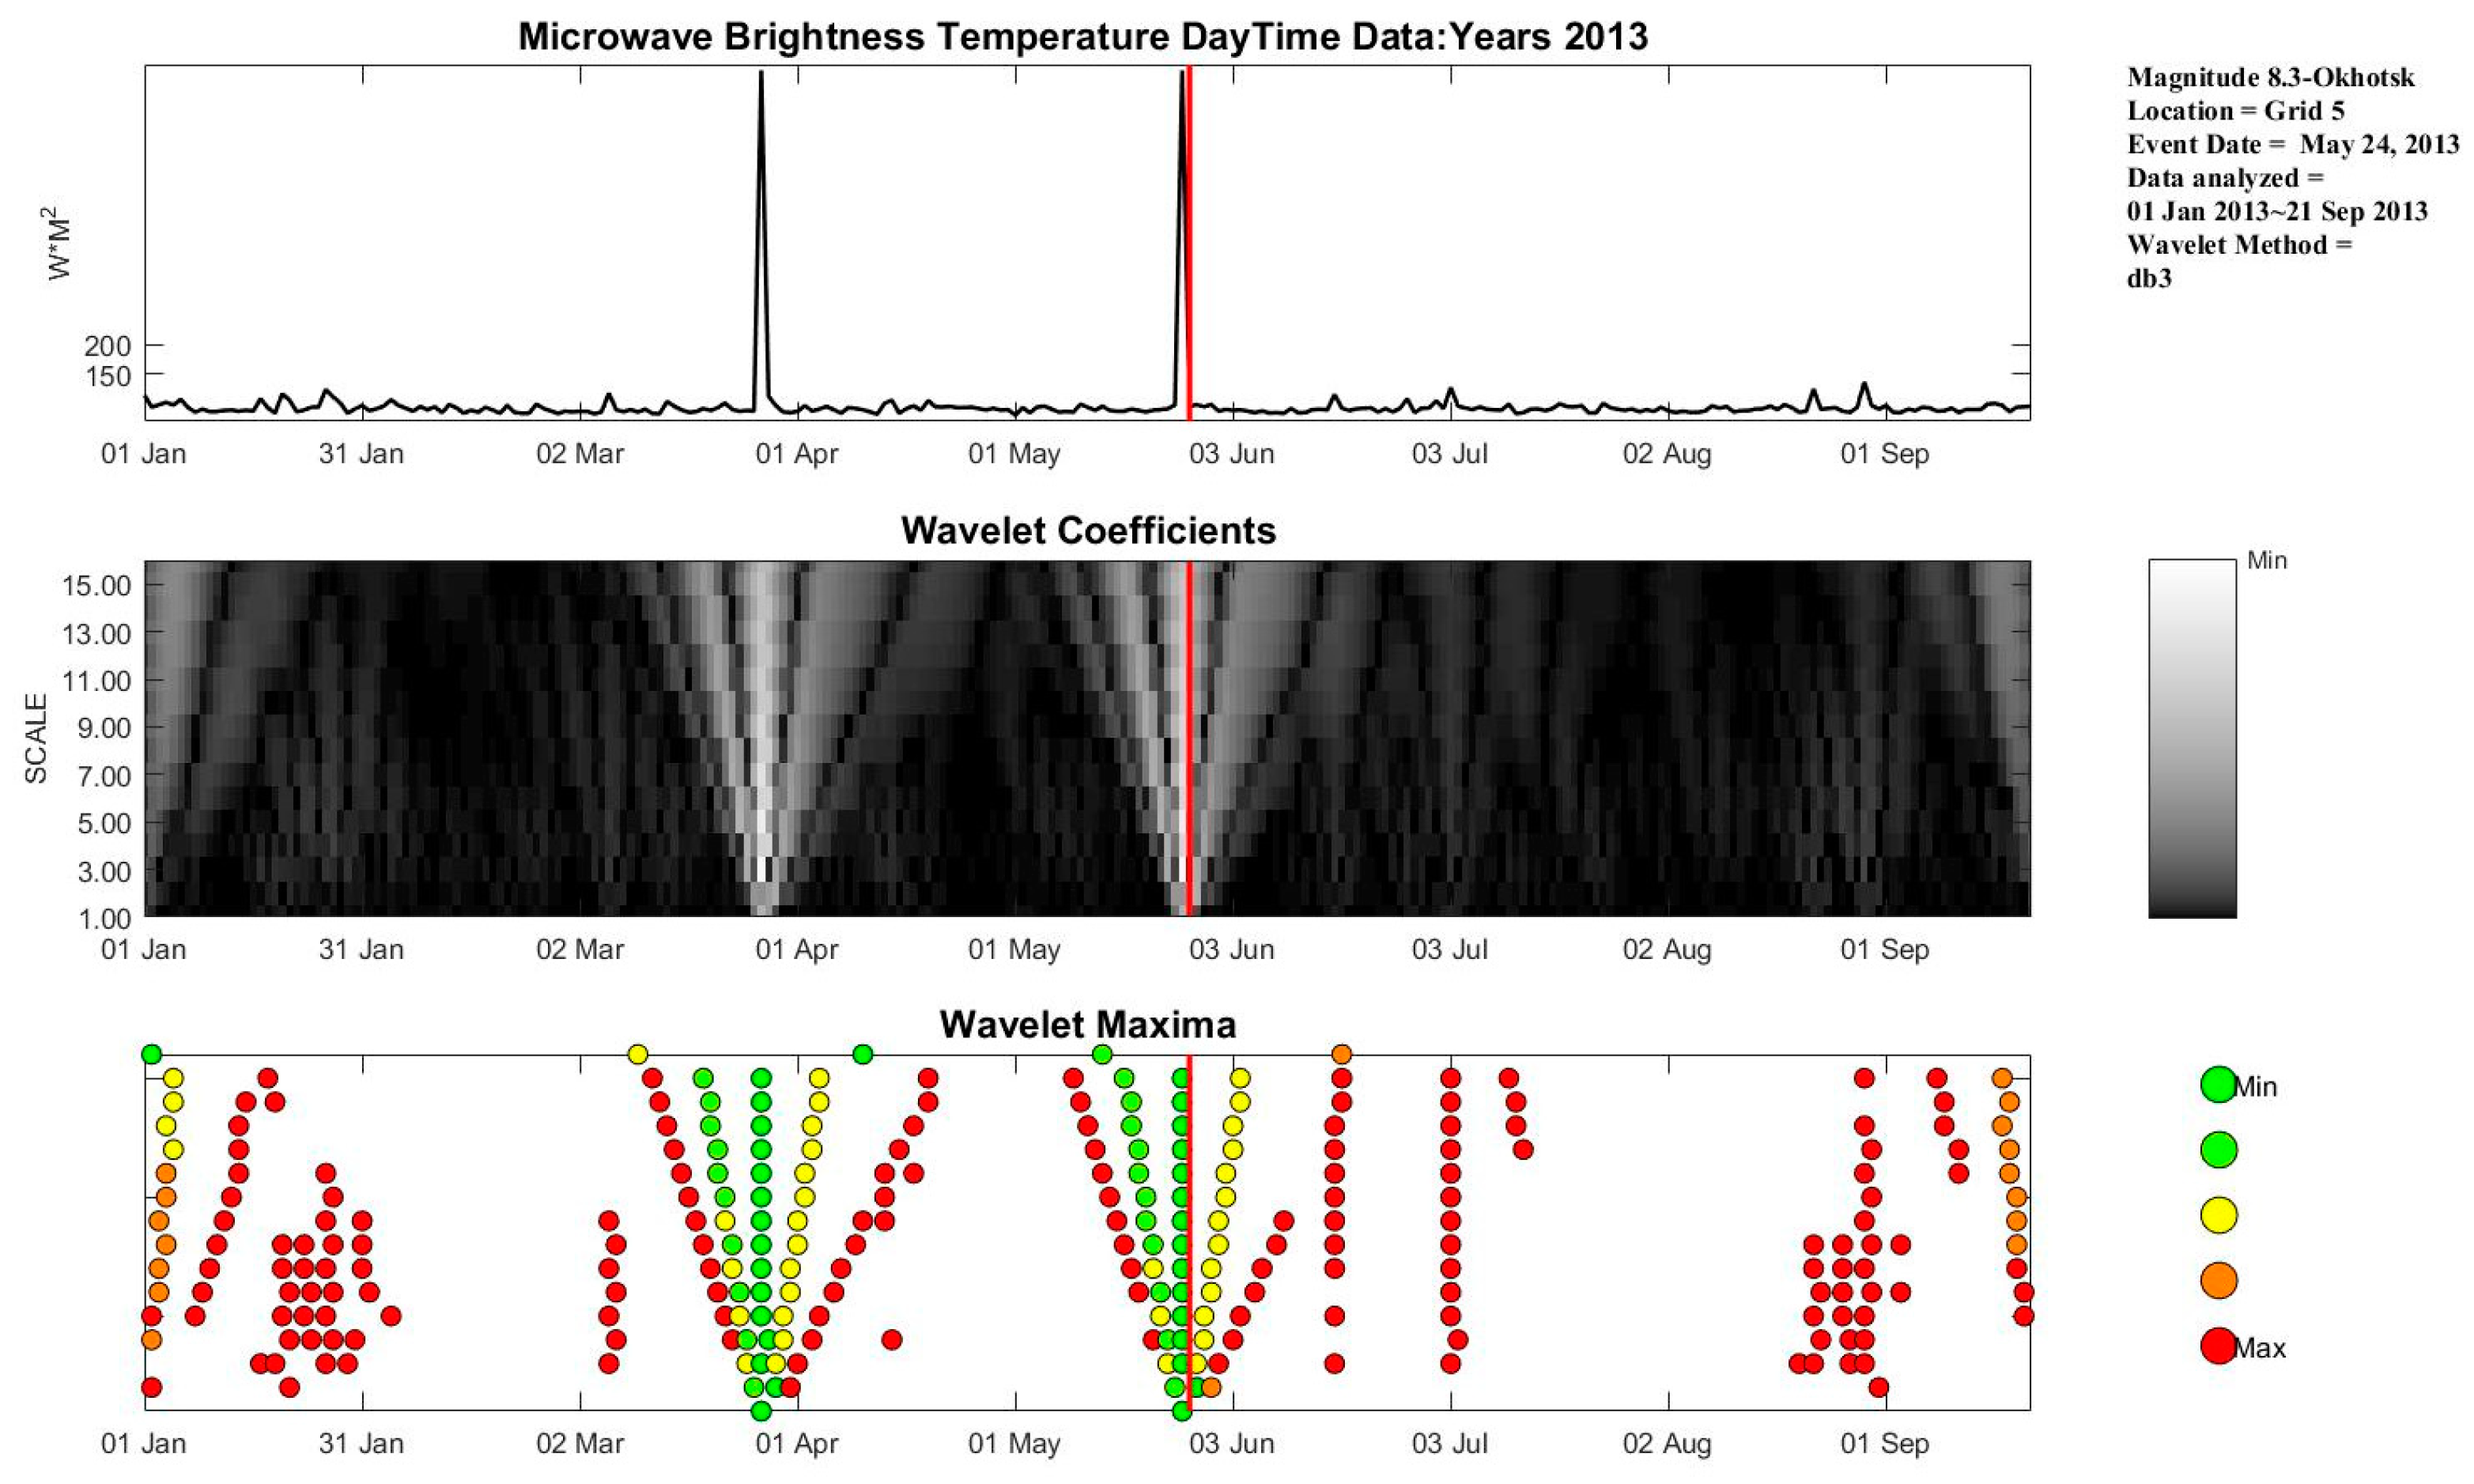
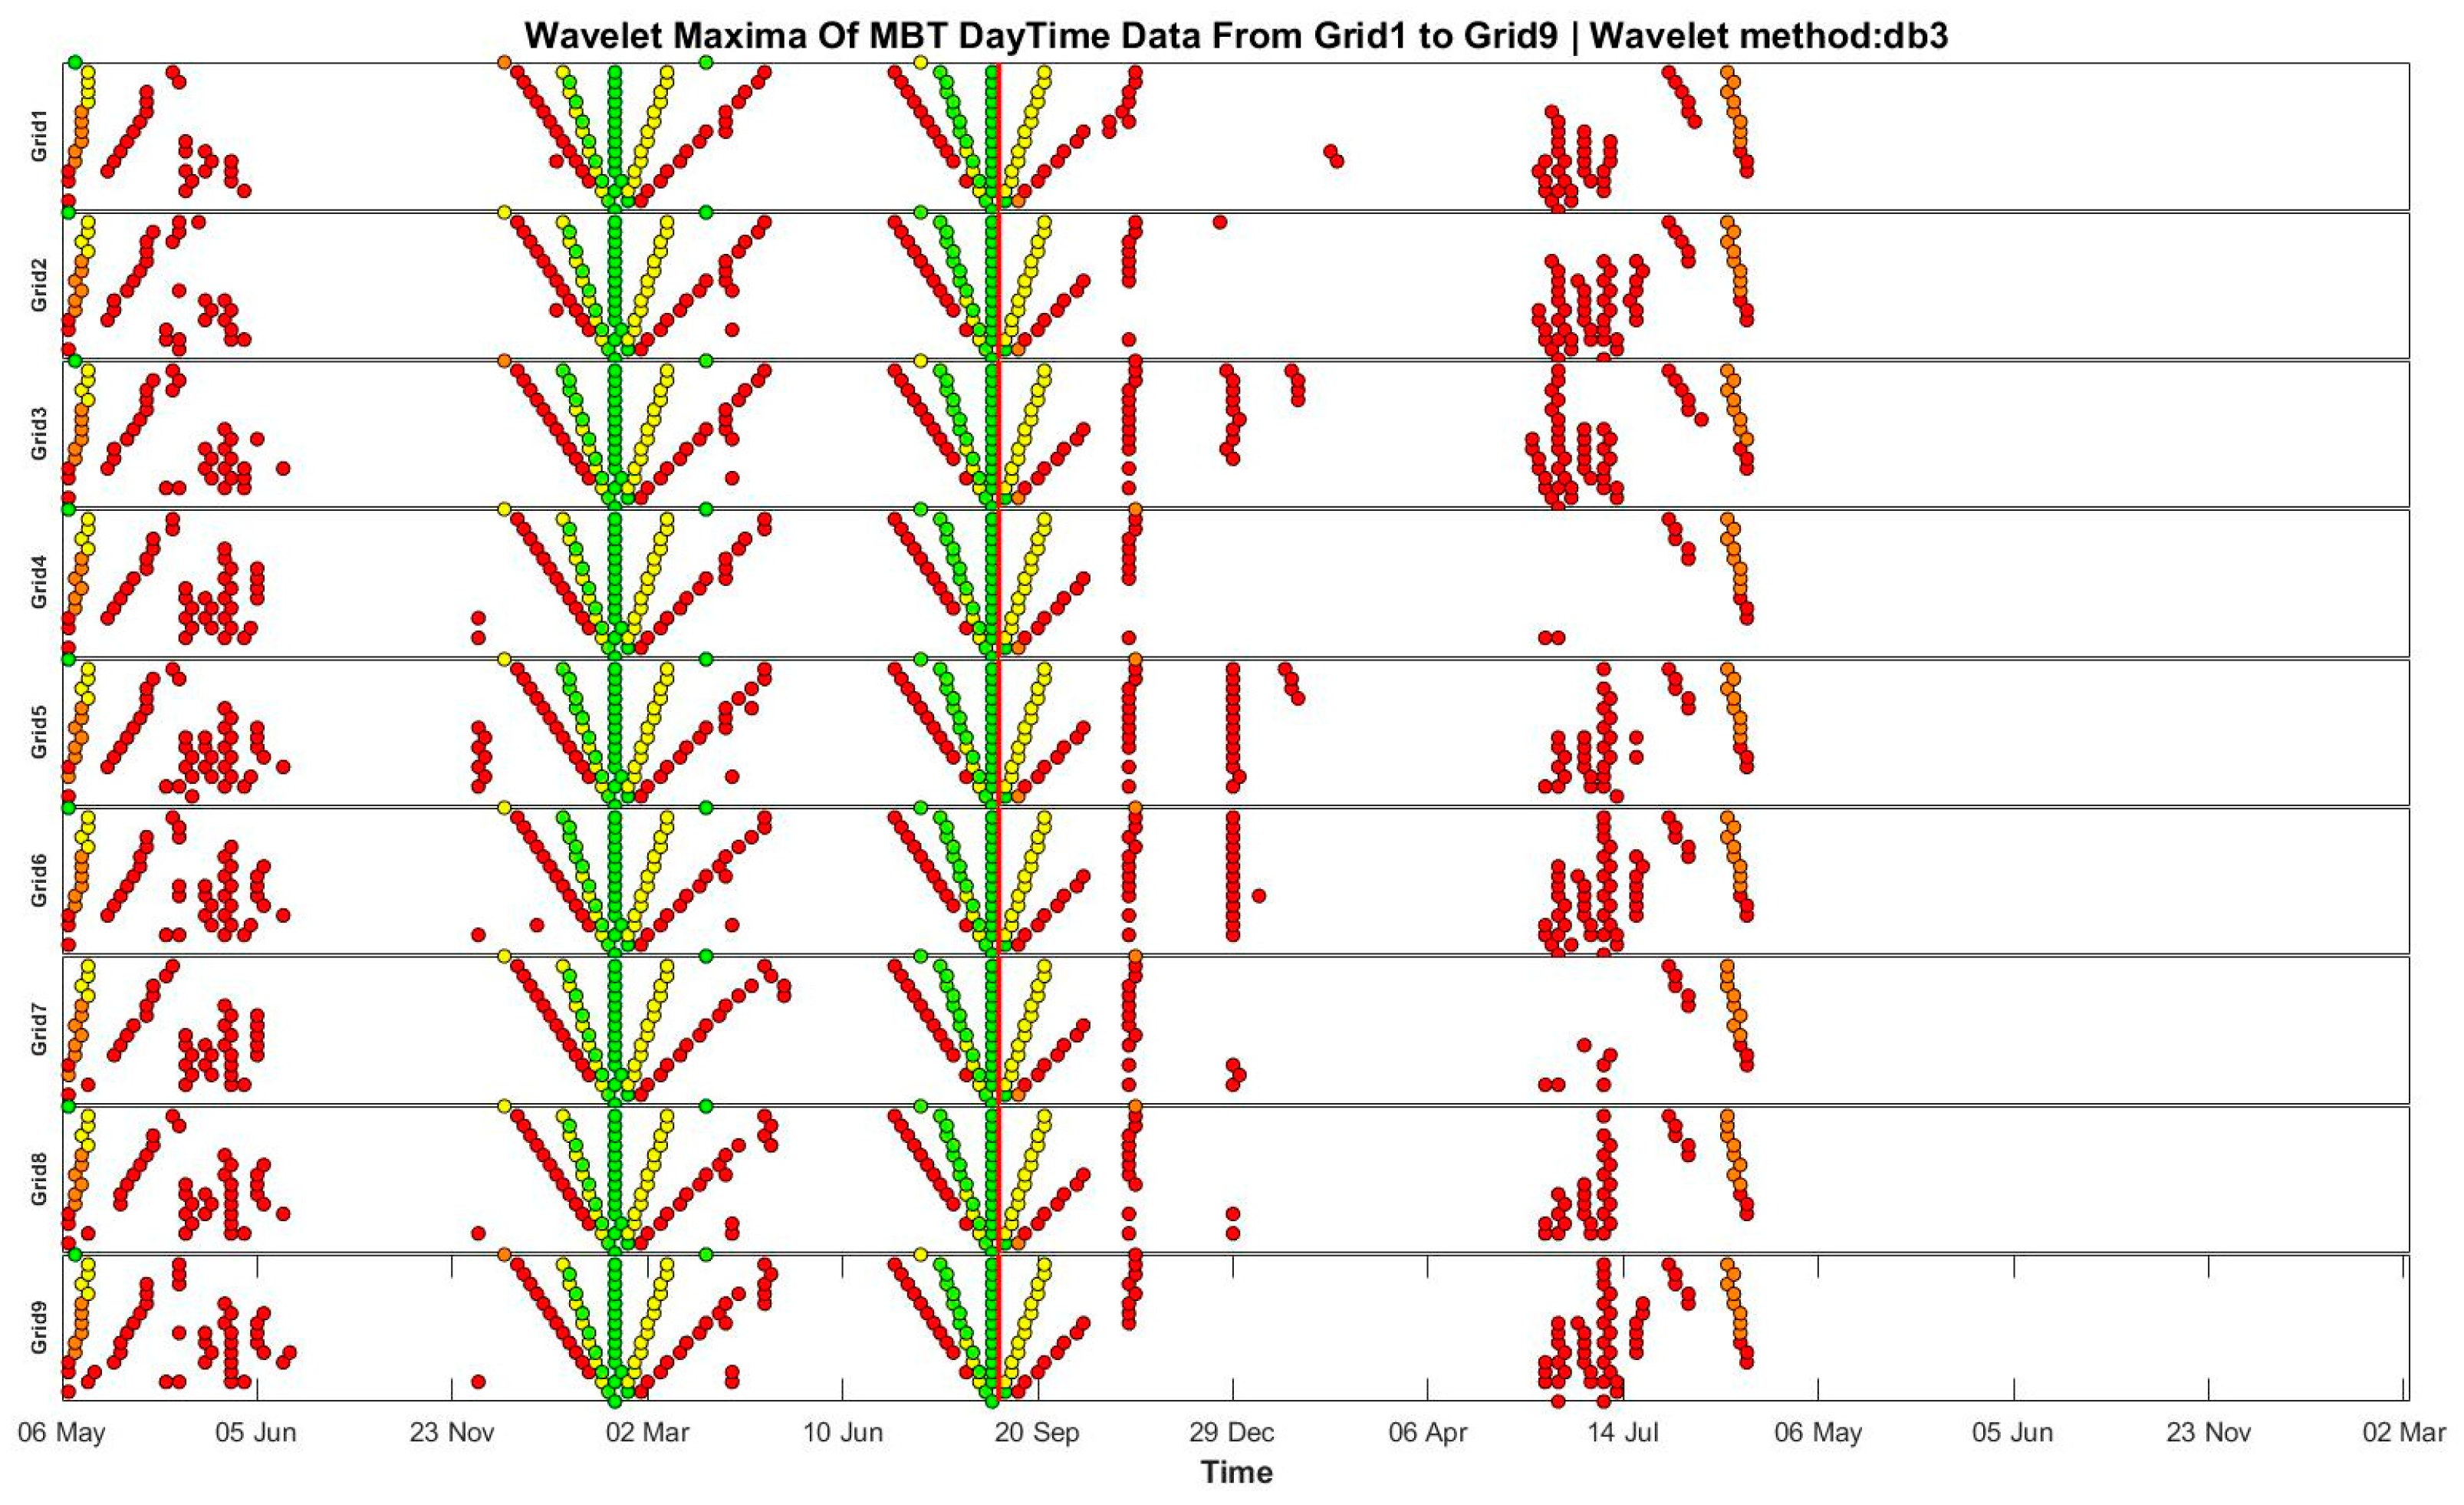
The Sea of Okhotsk earthquake on 24 May 2013 was analyzed using data from 1 January 2013 to 30 December 2013. Employing the db3 wavelet method, the data frequency band was set at 10 GHz with horizontal polarization. The timing of this earthquake is marked by a red line in Figure 5 and Figure 6.
In the wavelet sequence graph of the Sea of Okhotsk earthquake, there are many occurrences of wavelet maxima with large amplitudes. As shown in Figure 6, the continuous, regular, and intense wavelet maxima that appeared at the end of March were likely due to a relatively large earthquake that also occurred near the Sea of Okhotsk. Two irregular and intense anomalies in the figure occurred in January because the Siberian cold air blew towards the sea, causing a sudden drop in sea water temperature and freezing, which led to a change in the surface dielectric constant of the sea, causing abnormal MBT. Another irregular and intense anomaly was attributed to the end of August, when rising temperatures and local monsoons warmed the sea waters, causing glaciers to melt and altering the sea surface dielectric constant, thereby inducing anomalies in MBT. Concurrently, given the Sea of Okhotsk is a relatively deep marine area, scattered anomalies might result from the seafloor topography and ocean currents affecting the distribution and dynamics of marine ecosystems, thereby influencing MBT. For instance, unique seafloor formations like mountain ranges and trenches could impact oceanic circulation and seawater temperatures, subsequently affecting the distribution and abundance of plankton and other marine species. Changes in these ecosystems might impact the microwave brightness temperature data, leading to anomalies.

4.2. Ms 8.0 Peru Earthquake

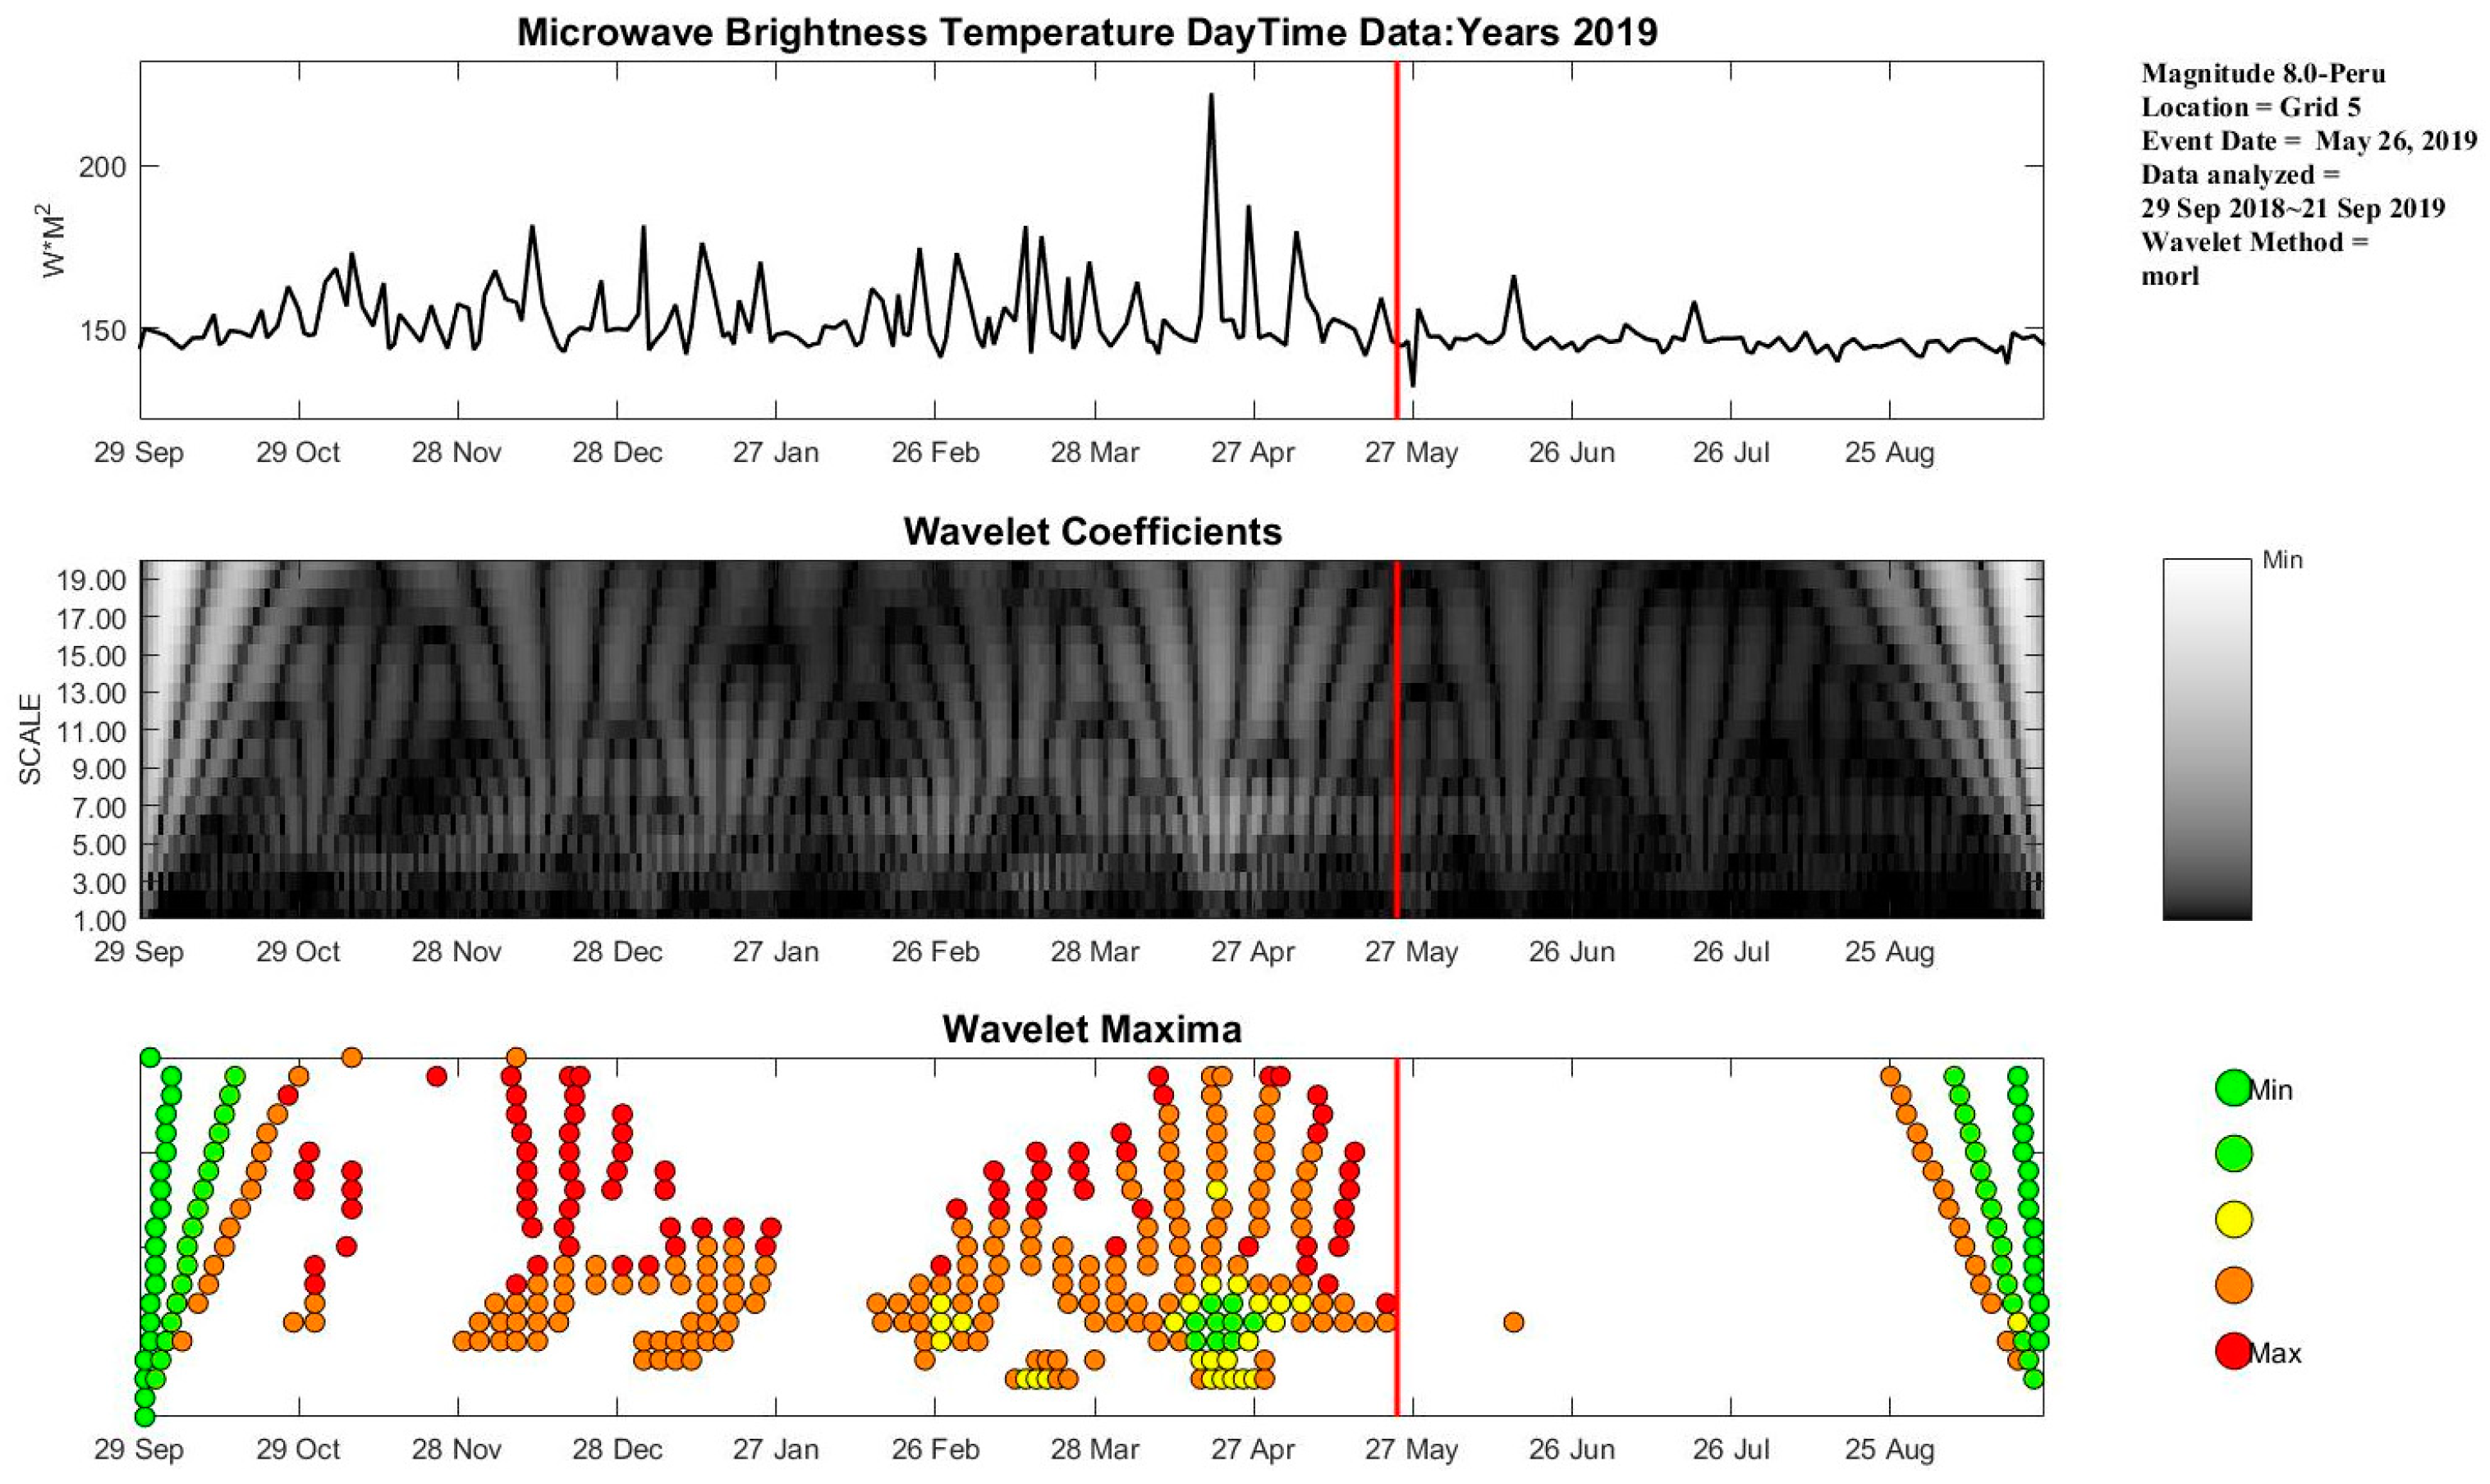
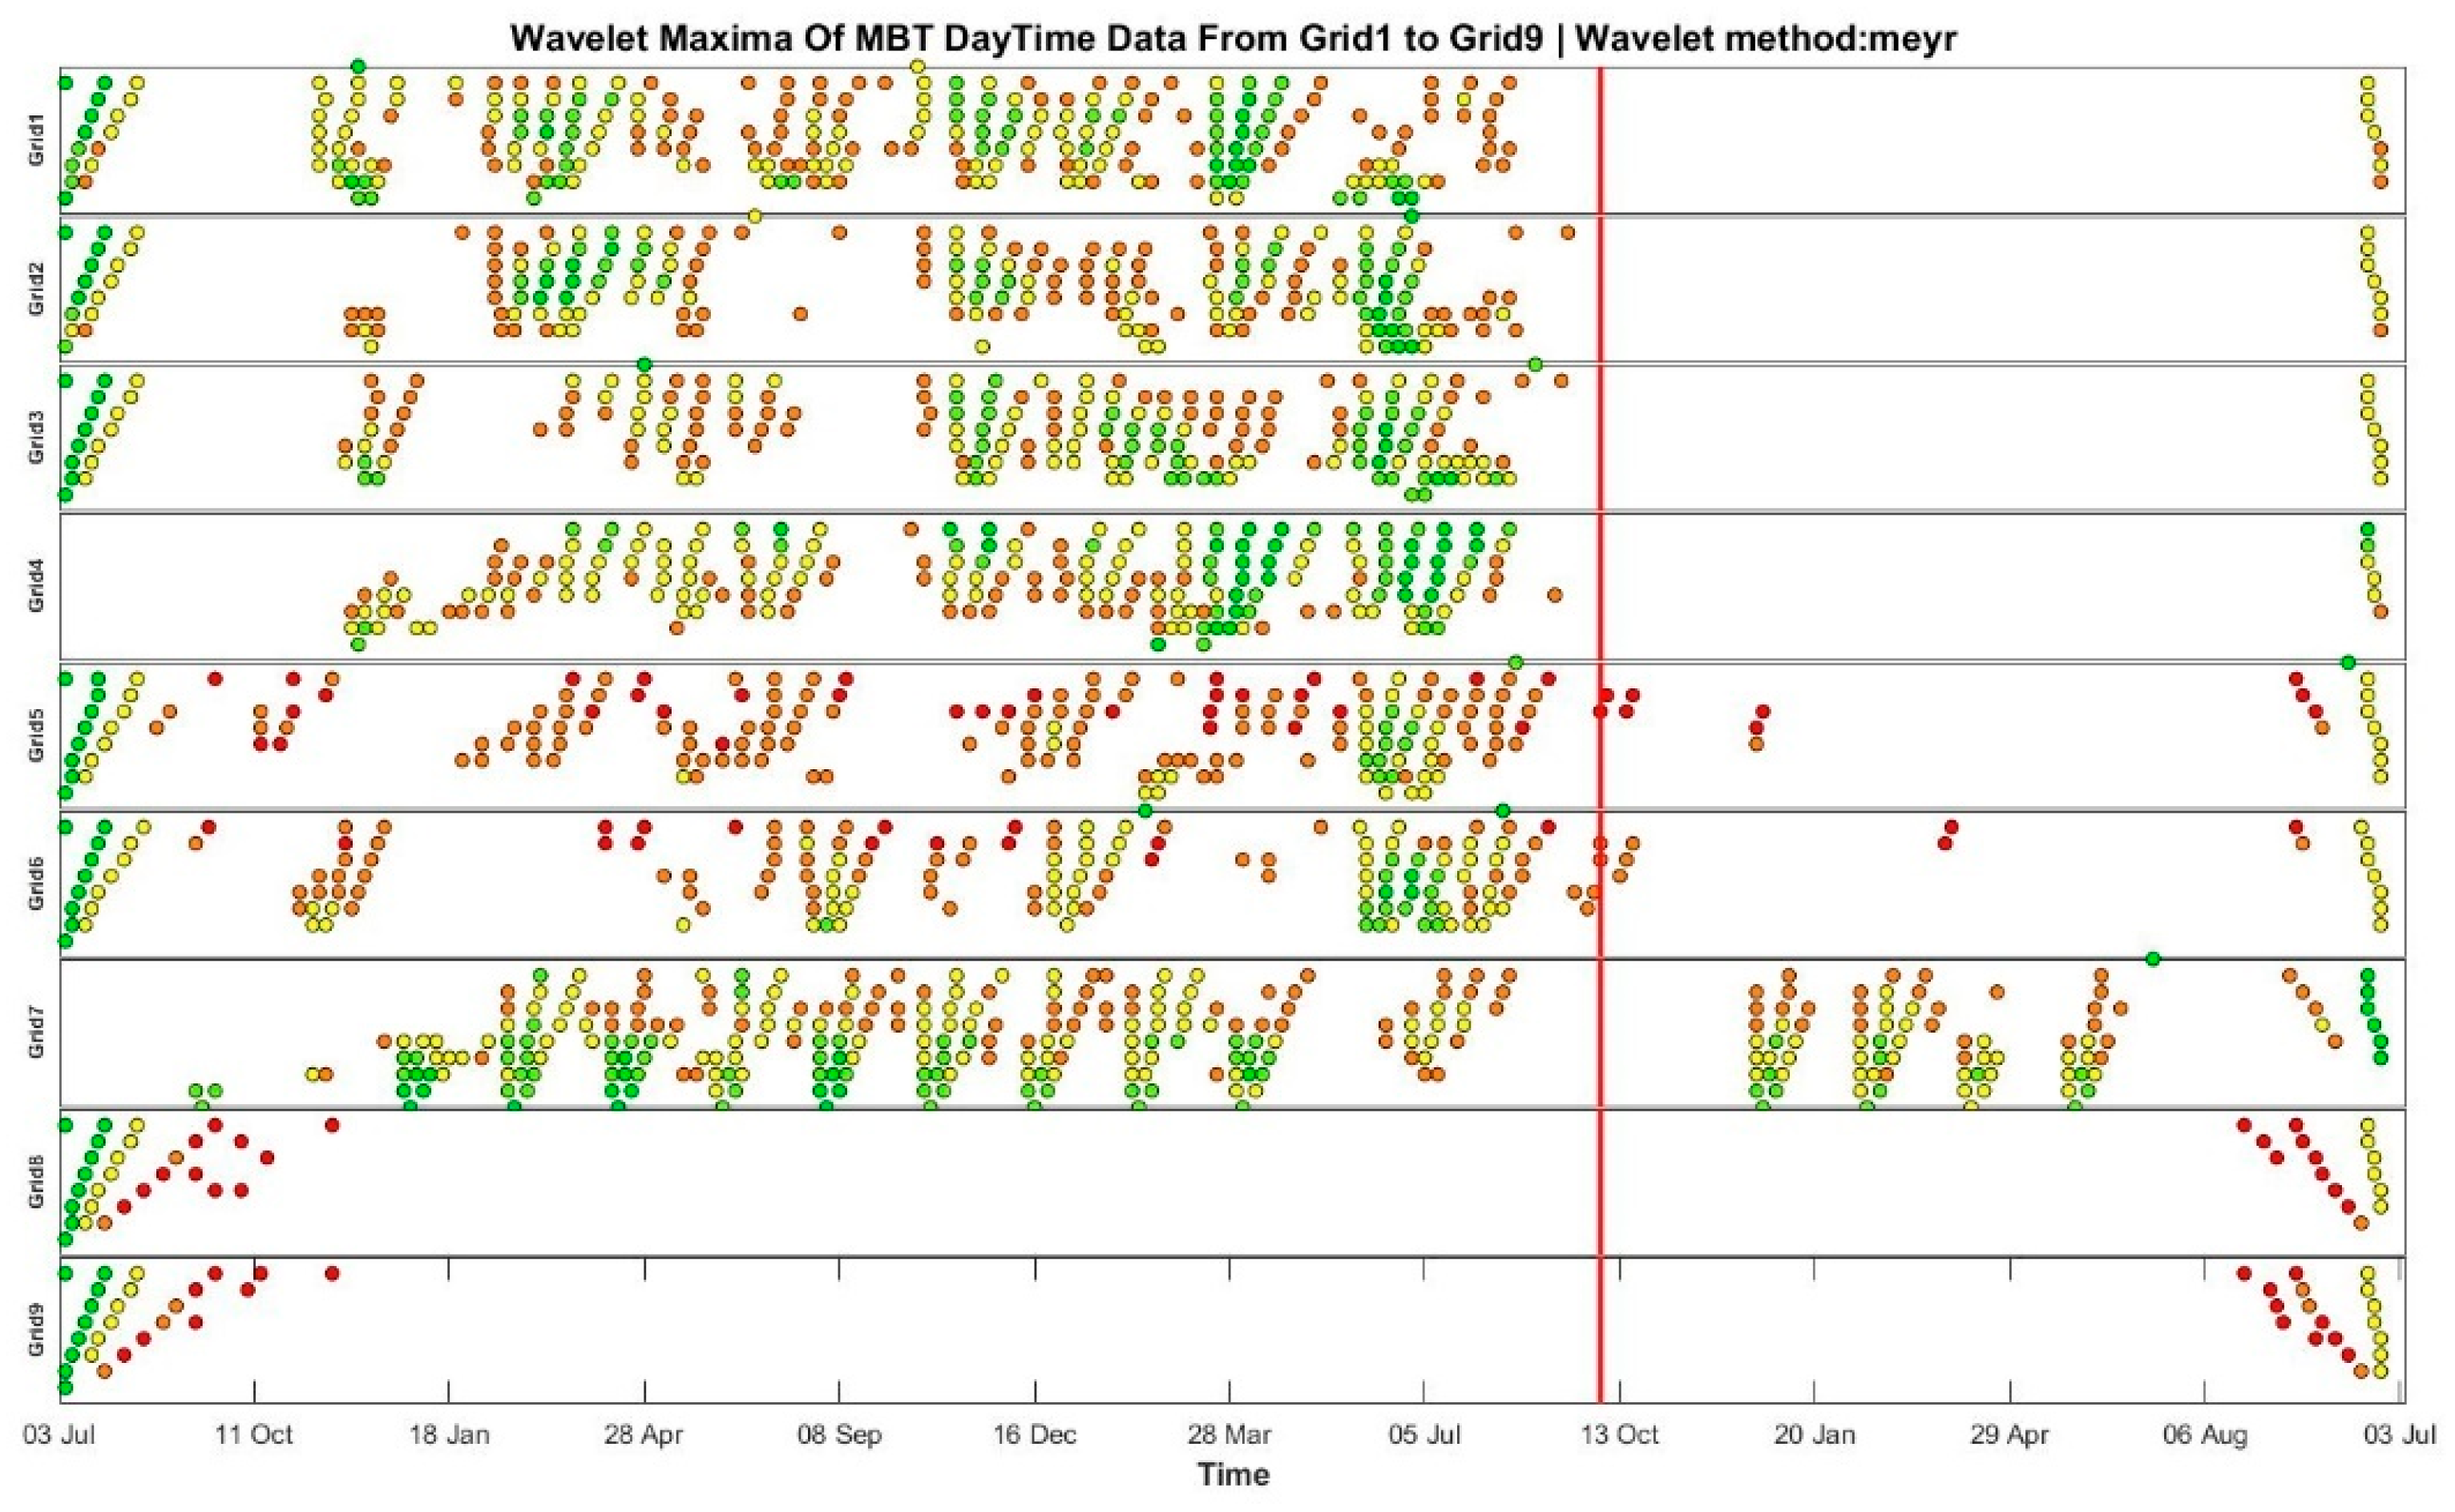
The Peru earthquake on 24 May 2013 was analyzed using data from 1 January 2013 to 30 December 2013. Employing the db3 wavelet method, the data frequency band was set at 10 GHz with horizontal polarization. The timing of this earthquake is marked by a red line in Figure 7 and Figure 8.
The earthquake is situated within the Machu Picchu National Forest Park in northern Peru, precisely located at 5.812° south latitude and 75.269° west longitude. This region is characterized by a high degree of vegetation coverage, predominantly consisting of dense forests and luxuriant shrubberies. Due to its position in the Southern Hemisphere and the influence of the Southern Hemisphere monsoons, the area experiences a gradual increase in temperature from November 2019 to early April of the following year. Vegetation coverage and soil moisture significantly impact microwave brightness temperature data. Elevated vegetation coverage intensifies the microwave radiative properties of the surface, resulting in higher anomalies in microwave brightness temperature data. Furthermore, excessive soil moisture also leads to abnormal increases in microwave brightness temperature readings. This occurs because, in moist soil, plants absorb more water, enhancing their microwave emissivity, thereby affecting the microwave brightness temperature data. The Southern Hemisphere monsoon plays a pivotal role in local temperature variations. The monsoon brings copious amounts of warm air and water vapor, altering local atmospheric circulation and consequently affecting temperature changes. Additionally, due to its proximity to the Equator, the climate is characterized as quasi-tropical, with high temperatures and heavy rainfall throughout the year, thus consistently influencing the MBT to skew anomalously high. Specifically, the data absence in Grids 8 and 9 is primarily attributed to malfunctions in data collection apparatus or interruptions in data transmission.

4.3. Ms 7.8 Nepal Earthquake

The Nepal earthquake, occurring on 25 April 2015, involved data from 29 August 2014 to 23 August 2015. The study applied the morl wavelet method with the same frequency band and polarization, and the event is highlighted in Figure 3 and Figure 4.
Analyzing the wavelet maxima map of the earthquake reveals that regular anomalies in the MBT occurred in different grids prior to the quake. These anomalies suggested the accumulation of substantial energy, culminating in pronounced MBT anomalies at the time of the earthquake. Post-seismic, sporadic MBT anomalies are observed, likely due to the influence of aftershocks. Particularly for Grid 7, situated on the sun-facing slope of the Himalayan range, the interplay of mountain altitude and topography engenders distinct heating effects when sunlight strikes the slope. The sun-facing side, receiving more solar irradiation, tends to be relatively warmer, while the shaded side remains cooler. This temperature differential may induce a state of atmospheric instability above the slope, consequently impacting microwave transmission and resulting in anomalous microwave brightness temperature phenomena.

4.4. Ms 7.8 Turkey Earthquake

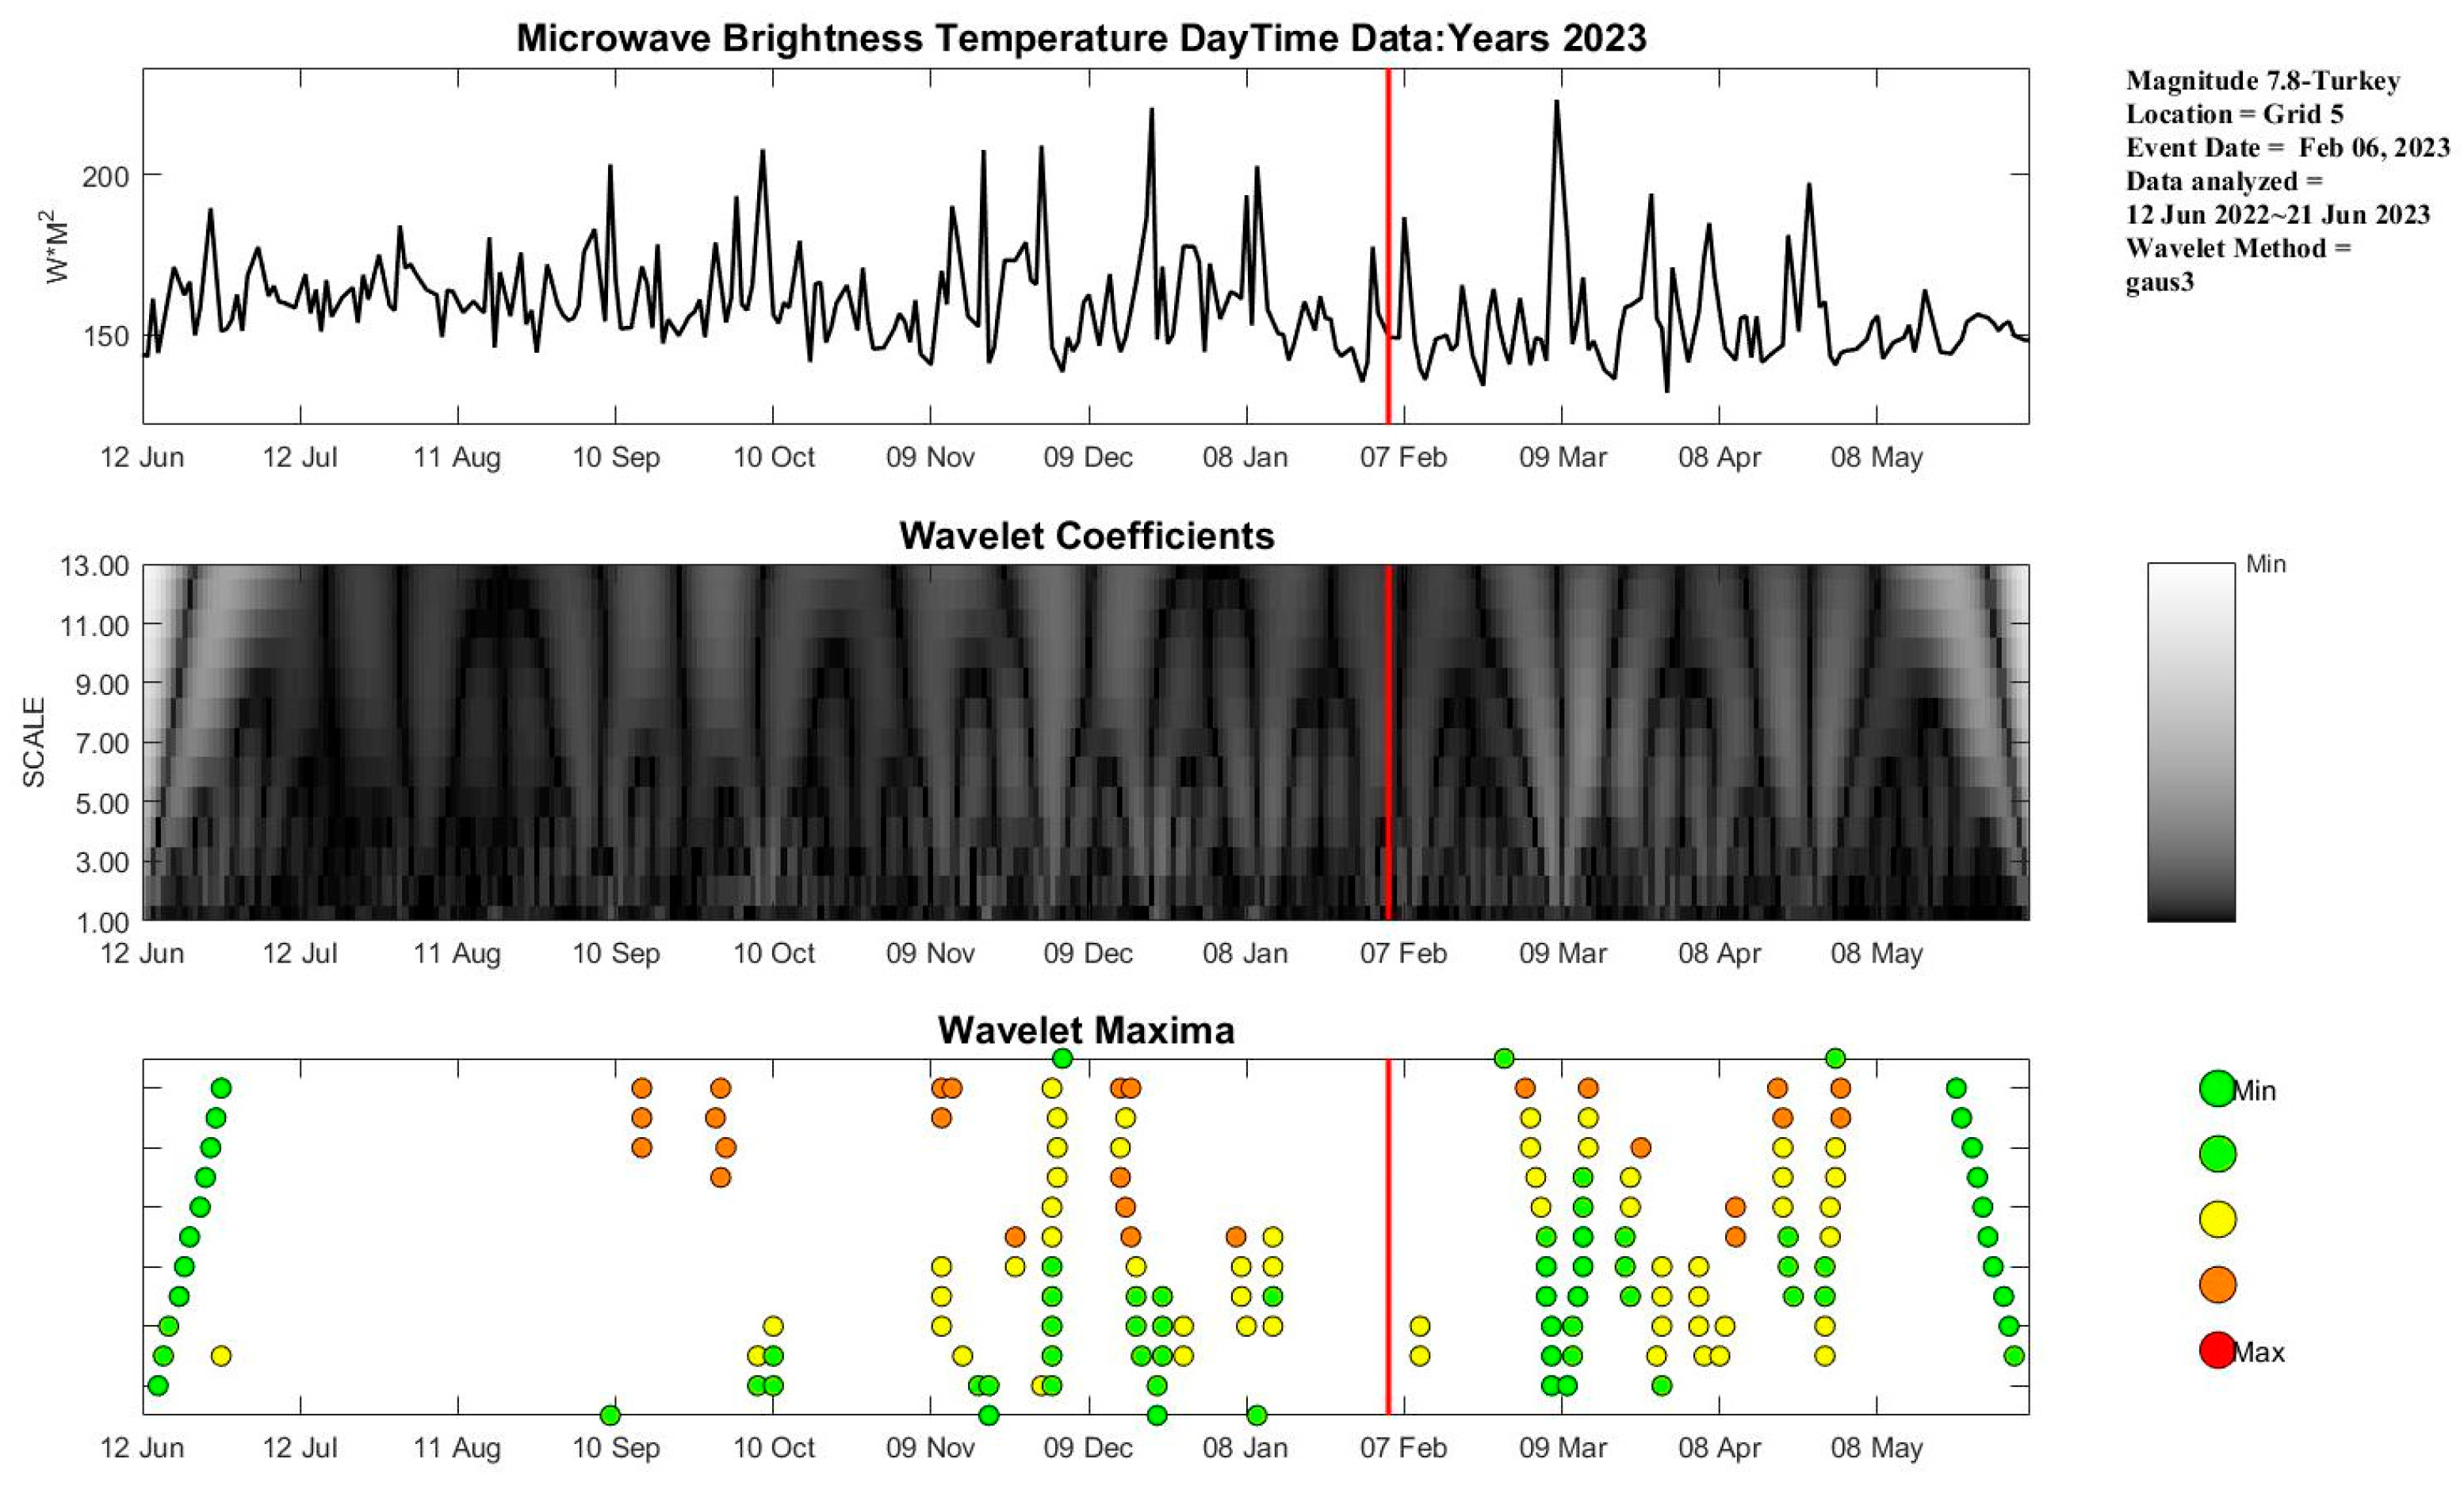
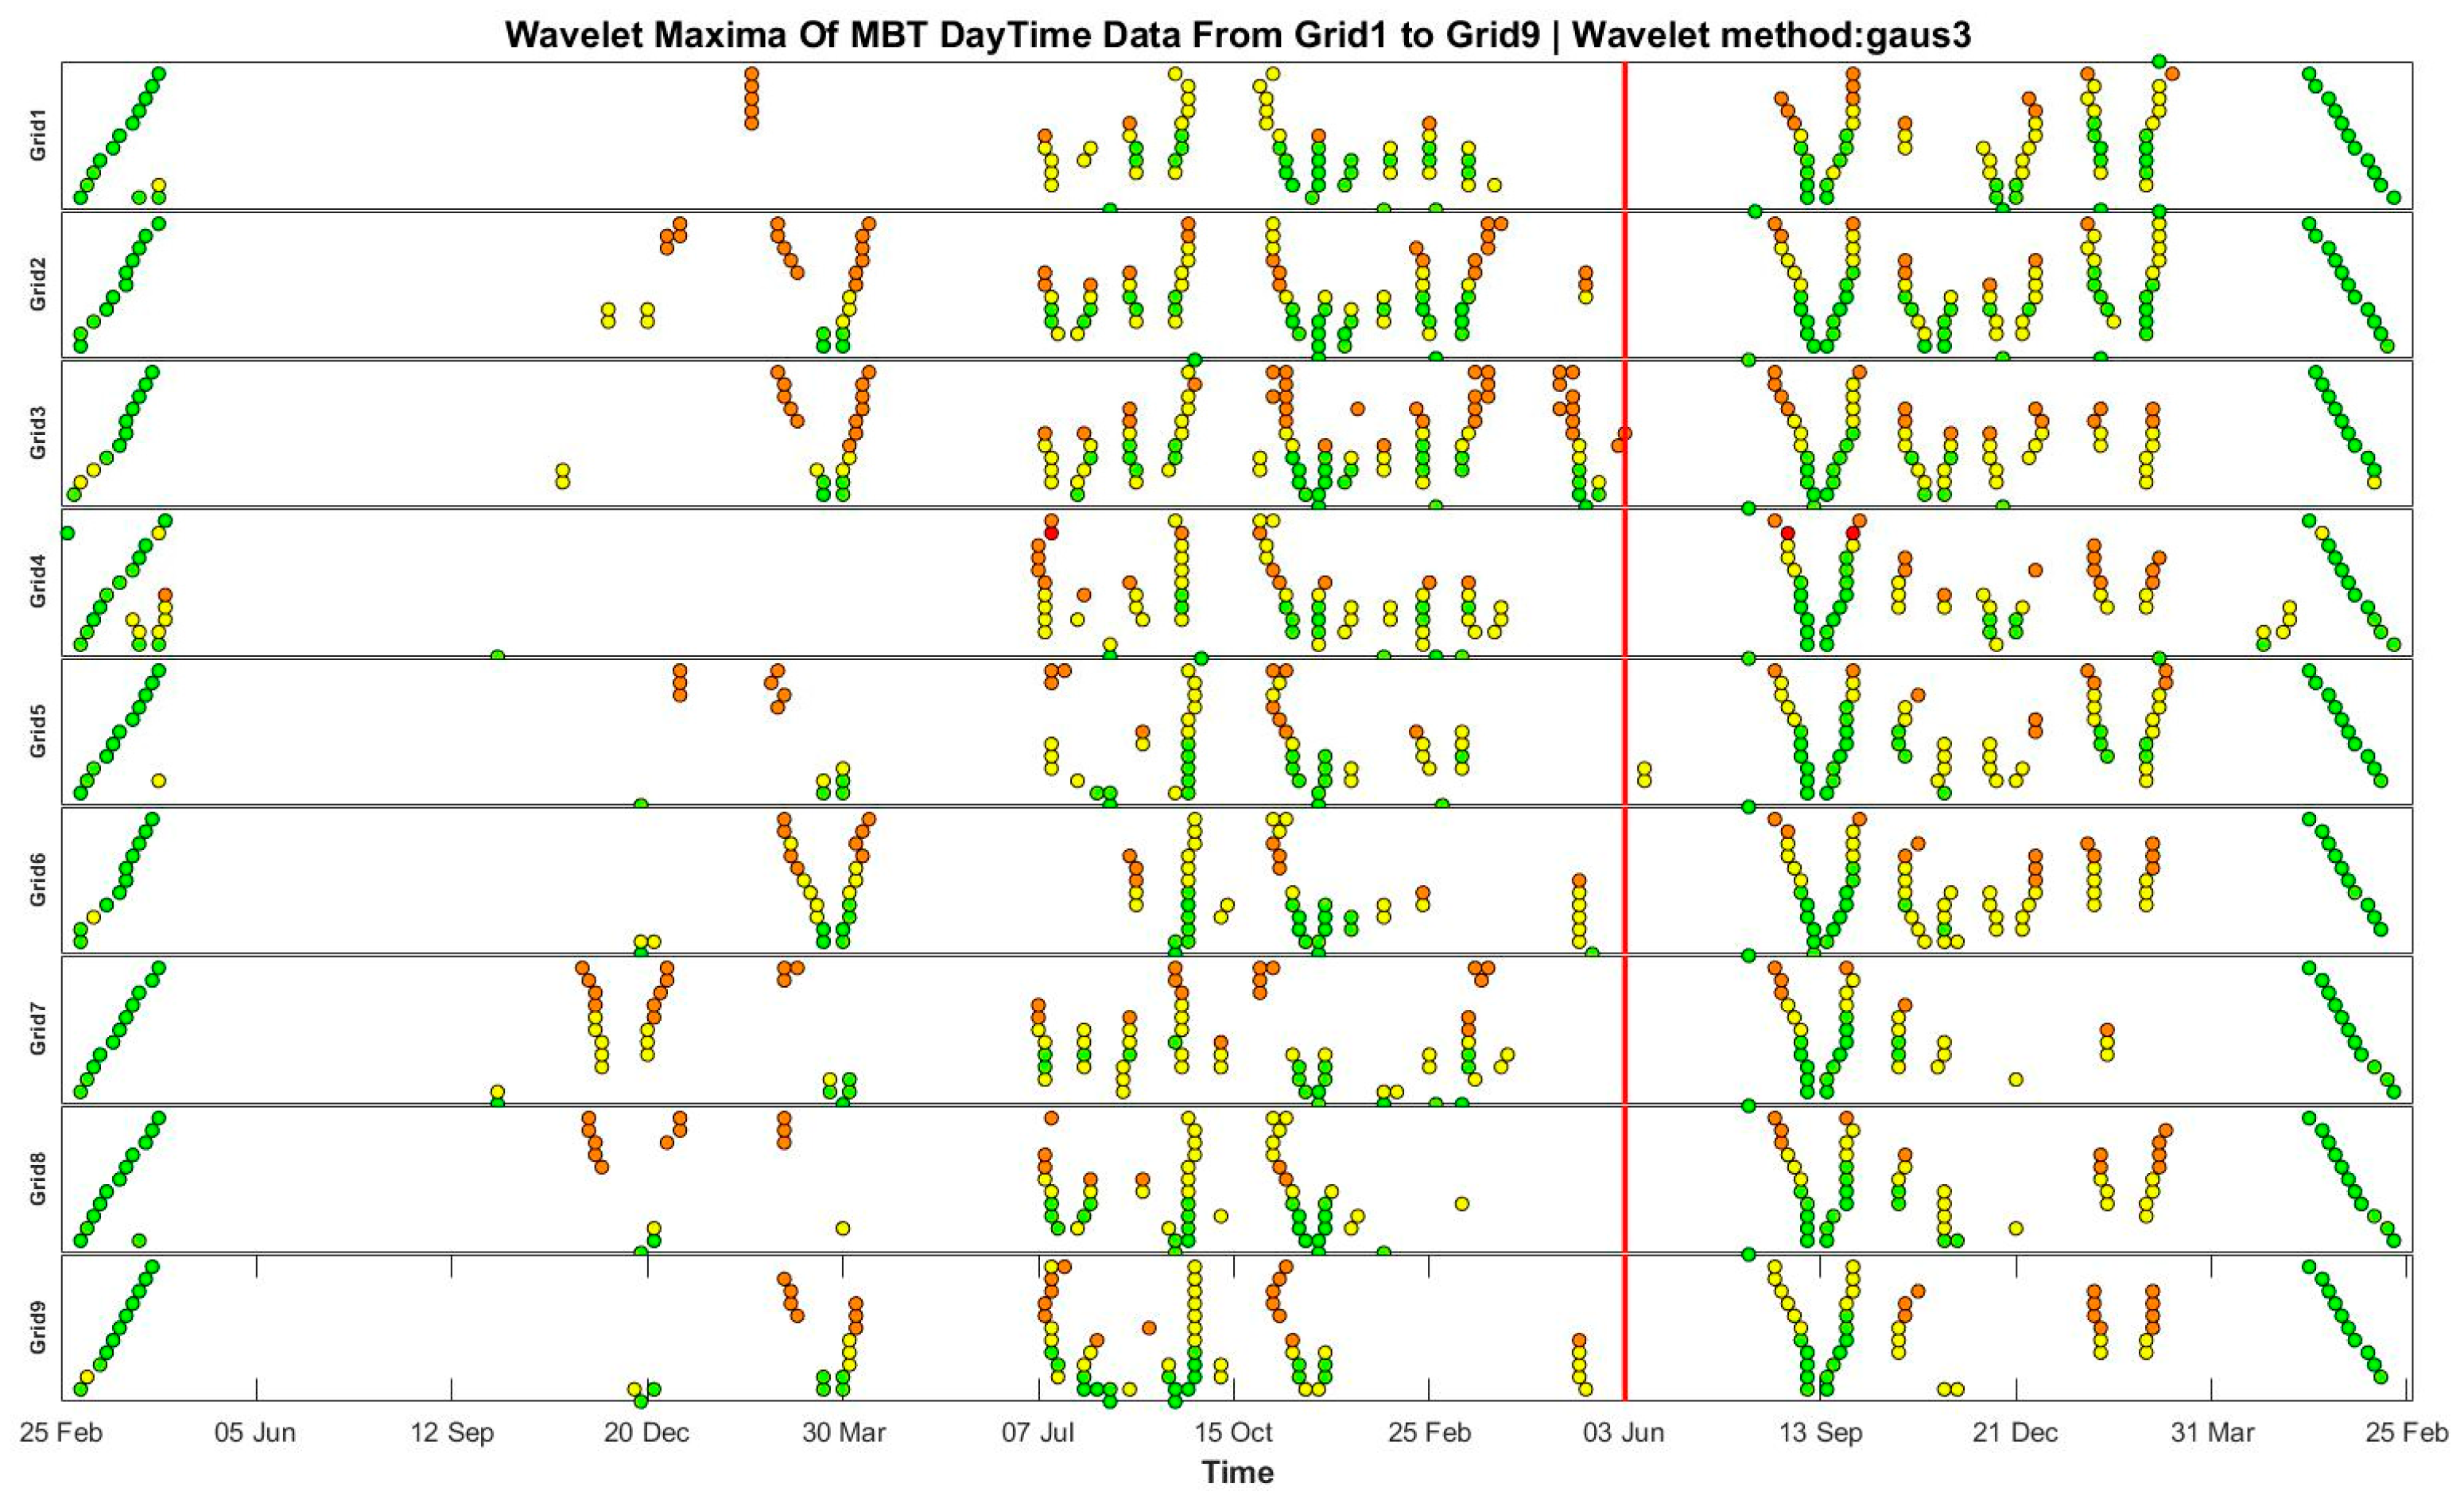
Analysis of the Turkey earthquake on 6 February 2023, included data from 12 June 2022 to 23 June 2023. This research utilized the gaus3 wavelet method, uniquely using a 36 GHz frequency band. The earthquake timing is shown in Figure 9 and Figure 10.
The seismic zone is located in Turkey, at the juncture of the Eurasian, Anatolian and Arabian plates. Turkey’s Mediterranean climate is characterized by hot, dry summers and mild, rainy winters. This climatic pattern arises from the interplay between monsoons and topography. During the summer, continental air masses dominate, bringing hot weather. In winter, maritime air masses prevail, delivering moderate rainfall to Turkey. In spring (March, April, and May), temperatures in Turkey gradually rise, leading to warmer weather. Such climatic changes may lead to anomalies in microwave brightness temperature, typically caused by alterations in the microwave radiative properties of the earth’s surface. As temperatures rise in spring, the microwave radiative properties of the surface (such as vegetation and soil) also change. These variations can affect the microwave radiative properties of the atmosphere, further impacting microwave brightness temperature data.
In winter (November and December), Turkey is influenced by the convergence of cold air from Asia and warm air from Europe. At the same time, before the Turkish earthquake, the Mediterranean was affected by strong storms, leading to widespread snowfall. This meteorological condition complicates Turkey’s weather systems, affecting microwave transmission, potentially leading to microwave brightness temperature anomalies. During winter, Turkey’s plateaus and mountains may form temperature inversions, impacting the stability of the atmosphere and microwave transmission. These inversions can hinder microwave signal transmission, causing anomalies in microwave brightness temperature data.
The plateaus and mountains within Turkey also impact microwave brightness temperature data. These topographical features can alter the turbulence and microwave scattering properties within the atmosphere, thus affecting microwave transmission and data. For instance, in winter, plateaus and mountains may form temperature inversions, altering the atmospheric temperature distribution and airflows, thereby influencing the transmission and scattering of microwave signals.

4.5. Ms 7.8 New Zealand Earthquake

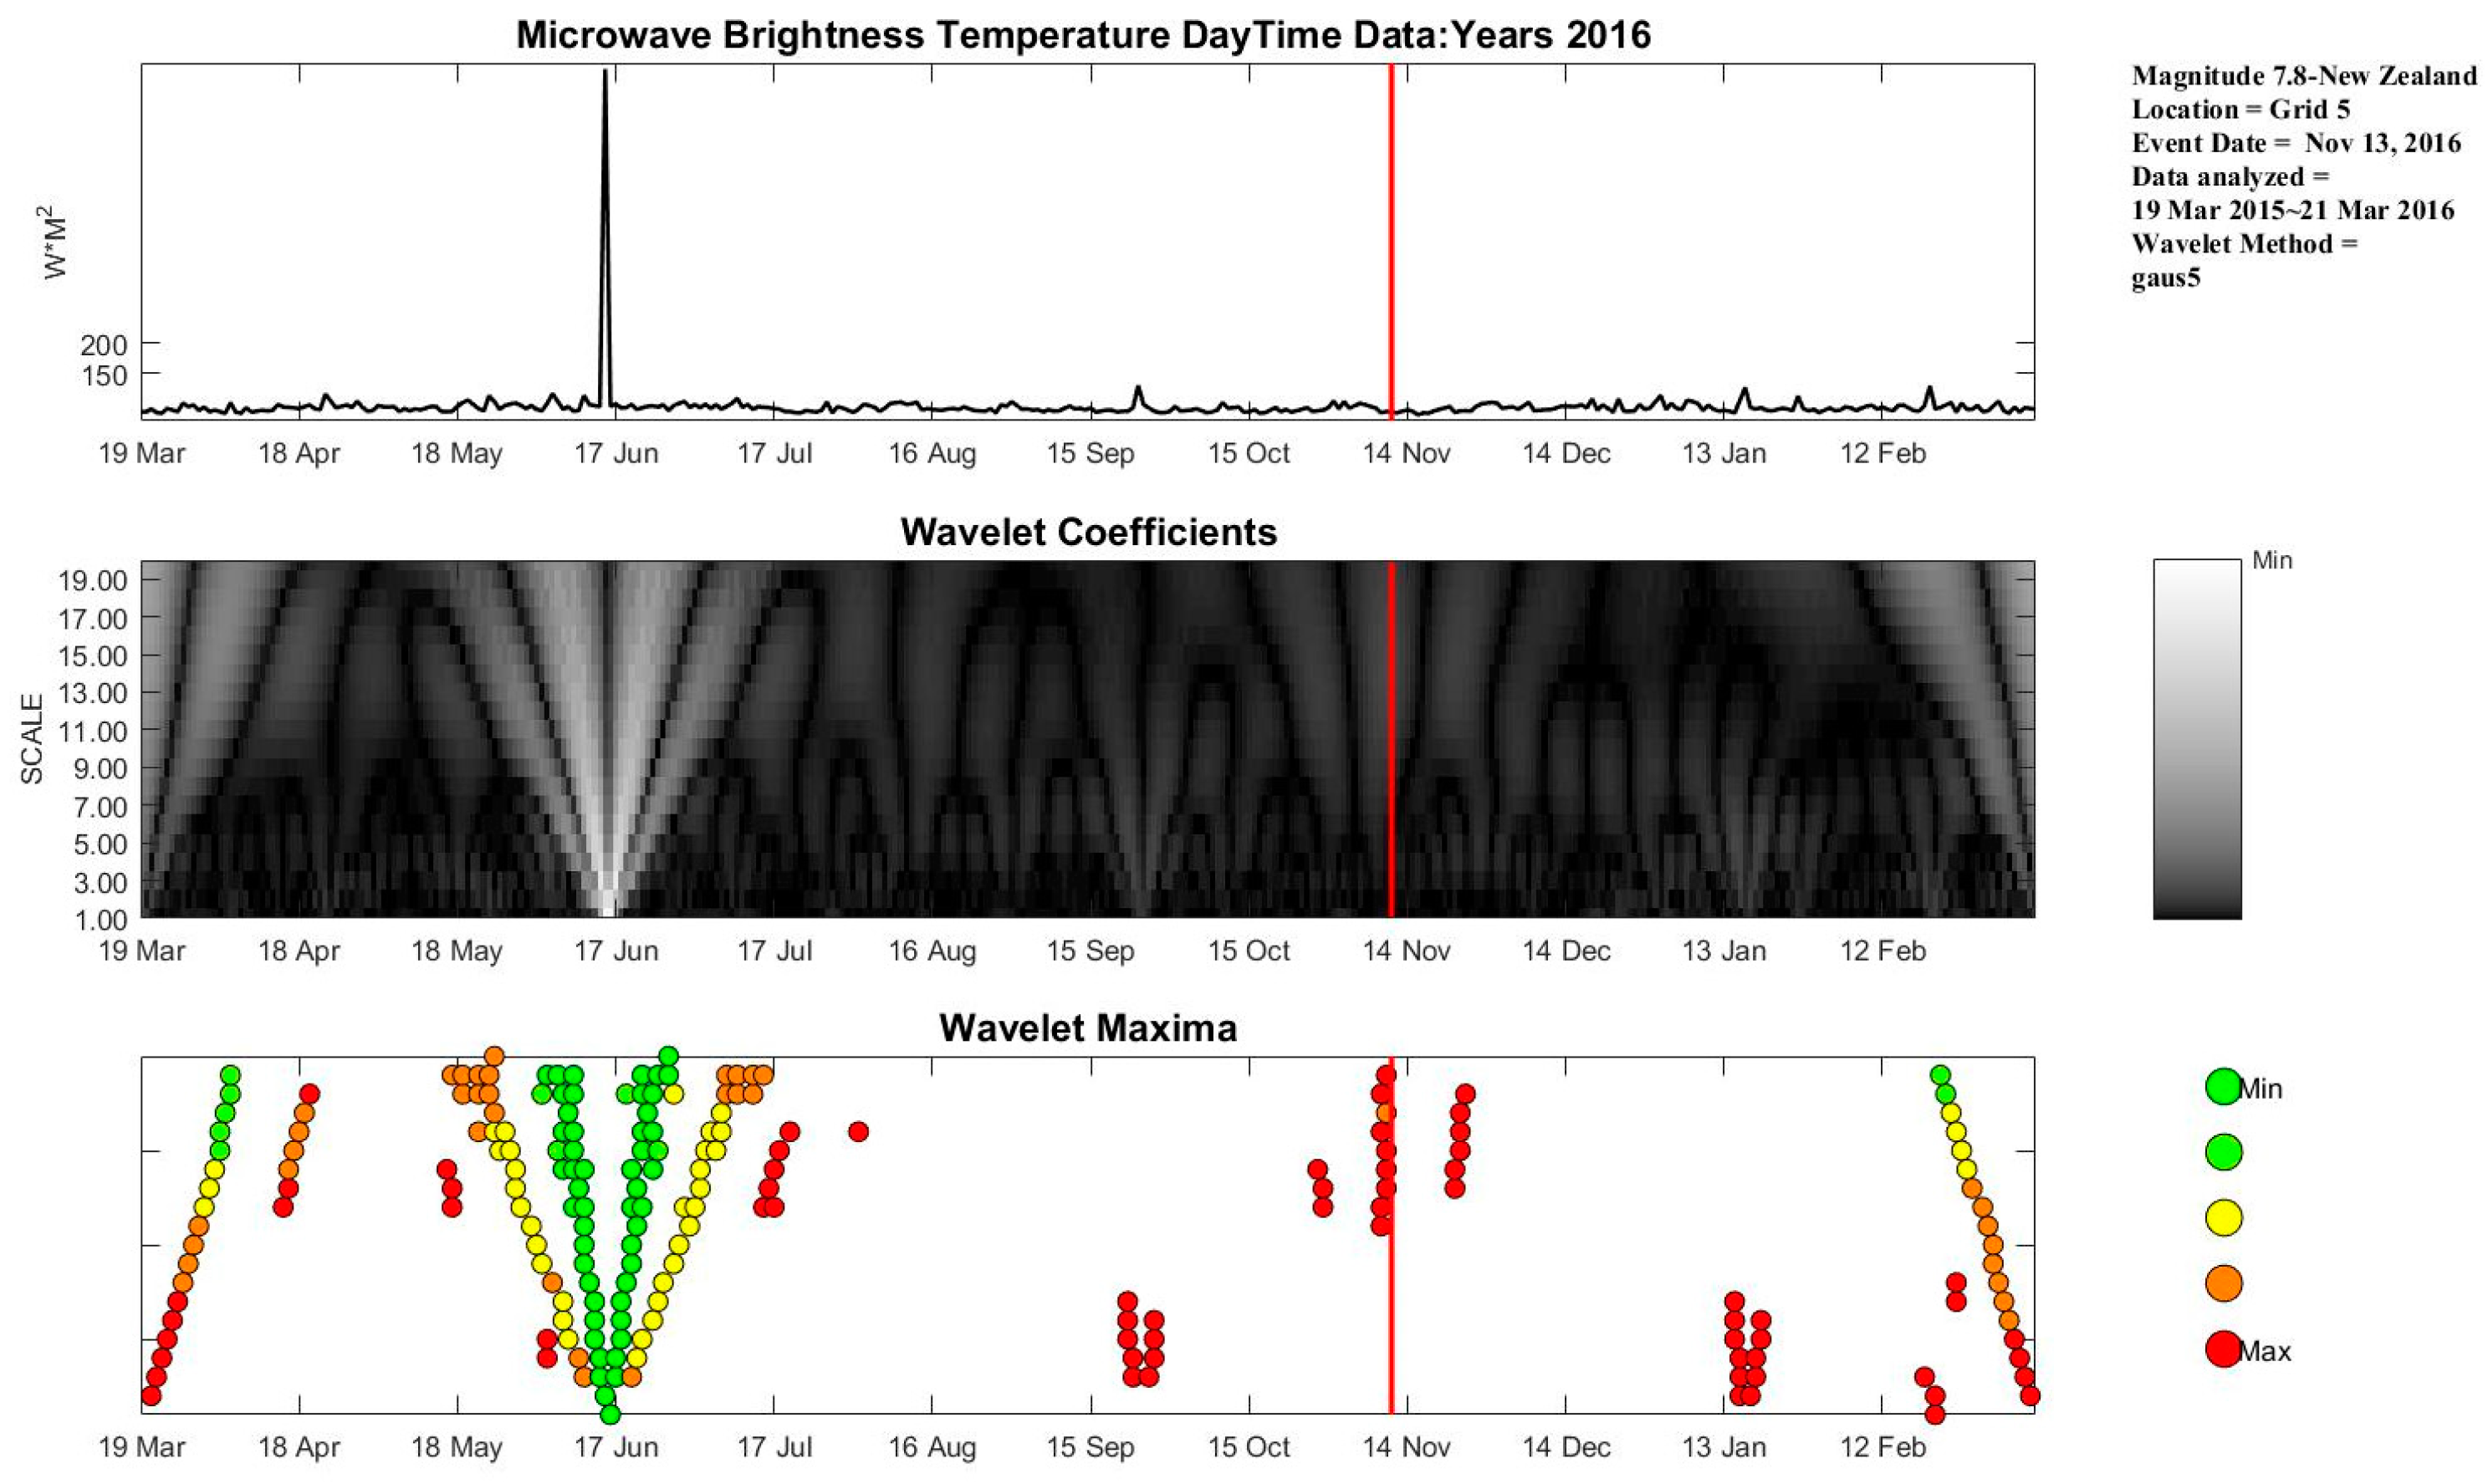
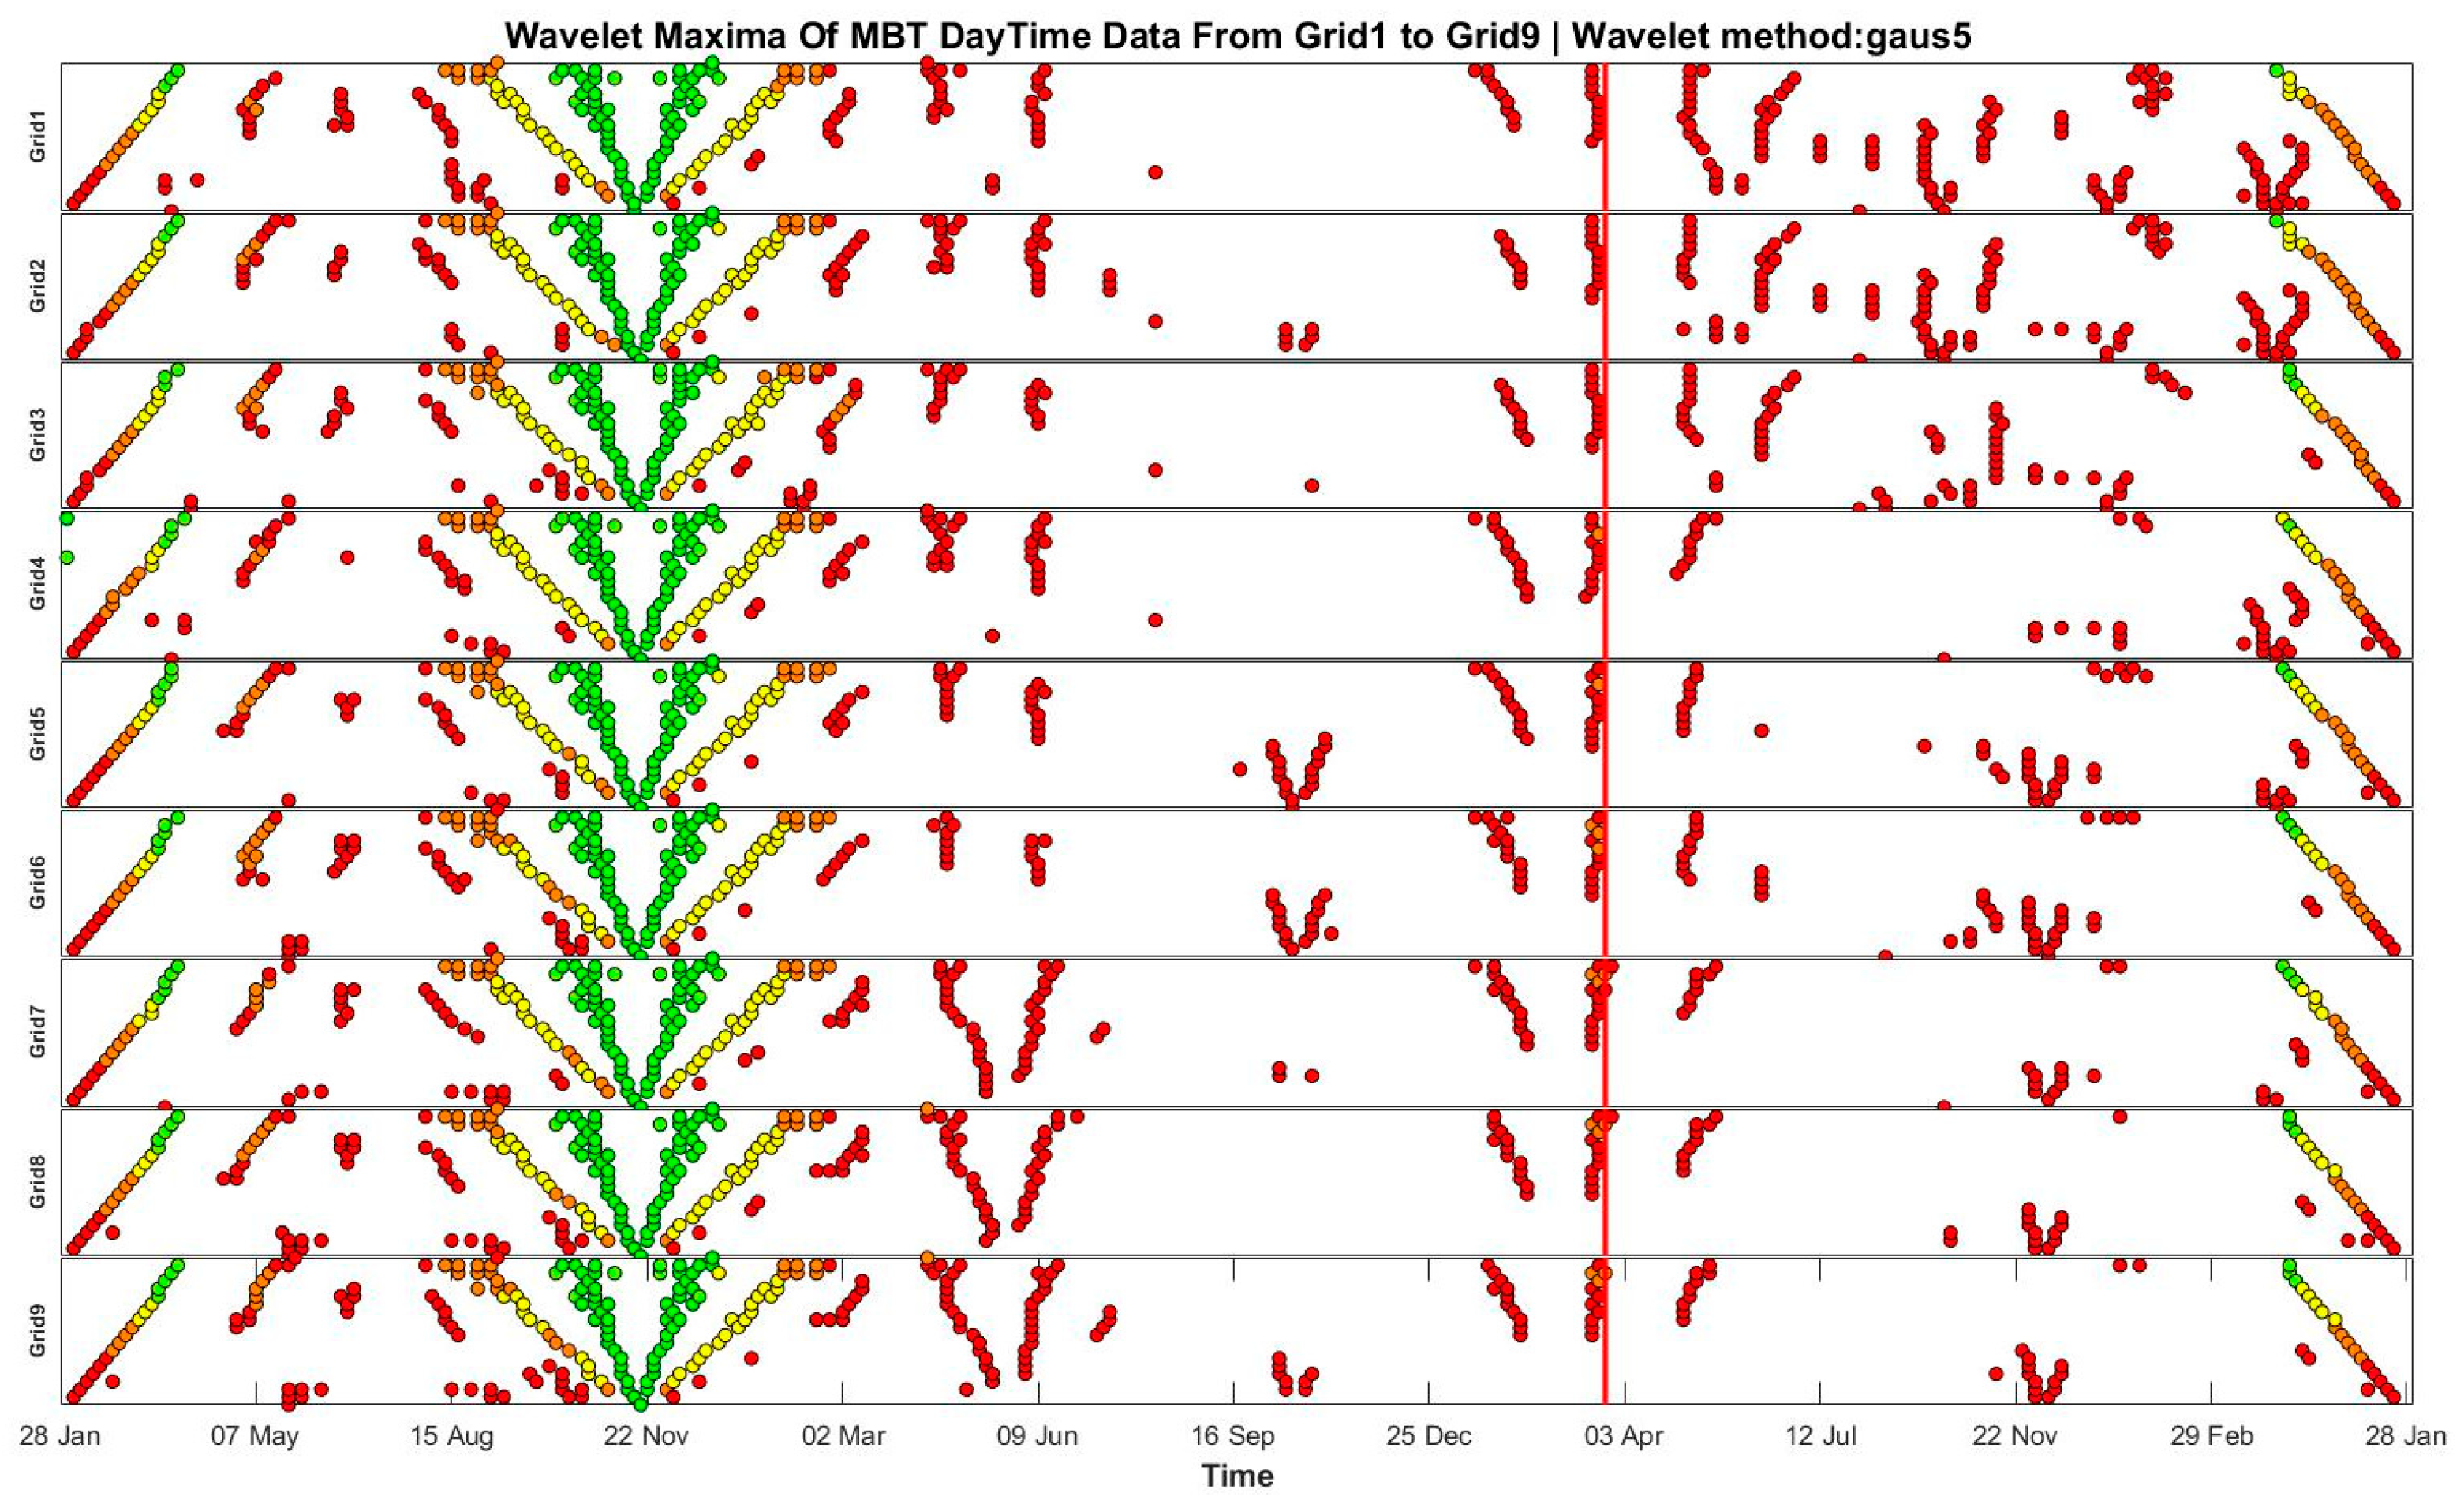
The New Zealand earthquake on 13 November 2016 was studied with data from 19 March 2016 to 23 March 2017. The experiment used the gaus5 wavelet method, set at a 10 GHz frequency band with horizontal polarization, and the earthquake’s occurrence is marked in Figure 11 and Figure 12.
Apart from the anomalies observed before, during, and after the earthquake, the occurrence of irregularities between May and July could be attributed to multiple earthquakes in the New Zealand region during this period, coupled with the impact of natural disasters such as hailstorms. In the following January, a sharp increase in temperature led to anomalies in the local microwave brightness temperature. The seismic activity in New Zealand, known for its high rate of seismicity, could have contributed to disturbances in the earth’s surface properties, which in turn affect microwave brightness temperature readings. Additionally, the hailstorms, typically characterized by intense and rapid alterations in atmospheric conditions, could have temporarily modified the microwave radiative properties of the atmosphere and the earth’s surface.
The abrupt temperature rise in January may have significantly altered the thermal properties of the surface and the atmosphere. Such a rapid change can affect the microwave emissivity of various surface elements, including soil and vegetation. These combined factors can lead to notable deviations in the microwave brightness temperature data, reflecting the dynamic interplay between climatic conditions, seismic activities, and atmospheric phenomena.

5. Discussion

In this study, we explore the optimal frequency band and polarization mode of microwave brightness temperature data for different seismic cases under global different land cover types, based on the microwave brightness temperature data, soil moisture data, and vegetation coverage data of AMSR-2 microwave scanning radiometer, using wavelet functions and the wavelet maxima method. The specific choices are presented in Table 3.
From the above table, it can be seen that 10 GHz is the majority in the frequency band selection, such as earthquakes of category 1, 2, 3 and 5. The specific reasons are: (1) penetration capability: the lower the frequency, the stronger the penetration of the microwave. In seismic studies, it is often necessary to penetrate the surface and internal media to reach the seismic source area. Low-frequency microwaves can easily penetrate the surface and different media, providing more comprehensive underground information. (2) Sensitivity: microwave brightness temperature data are highly sensitive to temperature changes. Low-frequency microwaves dissipated less in media and can better sense and transfer information from seismic areas. This helps accurately determine the location and depth of the earthquake source. (3) Stability: the transmission characteristics of low-frequency microwaves are relatively stable and less affected by weather and environmental factors, contributing to the reliability and accuracy of earthquake monitoring. (4) Geophysical characteristics: seismic sources usually have geological correlations. Low-frequency microwaves in propagation can sense these changes in geological properties better, providing more useful information for seismic studies.
As for the choice of polarization mode, all chose horizontal polarization. The specific reasons are: (1) surface reflection: microwaves with horizontal polarizations are easier to be reflected by the surface, covering the ground area better. This is important for seismic studies as seismic sources are usually below the surface. (2) Medium characteristics: microwaves with horizontal polarization are easier to interact with the crust’s composition in propagation. Since earthquake sources correlate with changes in geological properties, horizontal polarization microwave data can provide more information about the seismic source. (3) Signal attenuation: seismic studies require accurate determination of the source’s location and depth. Horizontal polarization data can reduce the impact of signal attenuation on earthquake monitoring. (4) Stability: microwaves with horizontal polarization usually have more stable transmission characteristics and are less affected by weather and environmental factors, which helps improve the reliability and accuracy of earthquake monitoring.
The physical origin of the microwave brightness temperature mainly relates to the thermal radiation and non-thermal radiation inside the object. At microwave frequencies, the molecules and atoms inside the object will vibrate, inducing the emission and absorption of electromagnetic waves [29,30].
Firstly, let us consider thermal radiation. When the temperature inside the object increases, the molecules and atoms will vibrate at a higher frequency, creating higher frequency electromagnetic waves. These electromagnetic waves will be reflected, absorbed, and transmitted by the object’s surface in the process of external propagation. Secondly, we need to look at non-thermal radiation. In addition to thermal radiation, objects also generate non-thermal radiation. This kind of radiation mainly relates to factors such as the microscopic structure and chemical composition of the object surface. Non-thermal radiation’s electromagnetic waves also undergo reflection, absorption, and transmission in propagation, forming a specific electromagnetic field distribution. Based on the physical origin of the microwave brightness temperature, we reasonably use this data to infer seismic events.
For the different categories of seismic cases proposed in this text, Type 1 occurs in the ocean area. According to water pressure theory, we believe that the rocks in the crust will deform under the action of water pressure. The water pressure and its variation may help to increase the load on the seismogenic fault. When the water pressure in the crust accumulates to a certain extent, the rock will rupture, releasing a large amount of energy to form an earthquake. This fracture causes the crust to move up and down along the fracture surface, forming seismic waves. For other types of seismic cases, we believe that the rock in the crust is a viscoelastic material. They will deform under the action of stress. As the stress increases, the deformation of the rock also gradually increases. When the stress accumulates to a certain extent, the rock will rupture suddenly, causing an earthquake. This rupture causes the crust to move up and down along the fracture surface, forming seismic waves.

6. Conclusions

In this study, based on the microwave brightness temperature data, soil moisture data, and vegetation coverage data of AMSR-2, we explored the study of different land cover types, the best microwave brightness temperature data frequency band and polarization mode corresponding to different seismic cases.
Through the wavelet analysis method, a technique for extracting MBT anomalies based on the wavelet maxima graph method was proposed. For different types of seismic cases, we separately used multiple wavelet functions and orders for analysis. The results show that for earthquakes with sources in the ocean area, the use of 10 GHz horizontal polarization data is the best. For seismic sources located in areas with high soil moisture and high vegetation coverage, using 10 GHz horizontal polarization data is the most effective. For seismic sources located in areas of high soil moisture and low vegetation coverage, using 10 GHz horizontal polarization data is the most effective. For seismic sources located in areas of low soil moisture and high vegetation coverage, using 36 GHz horizontal polarization data is the most effective. For seismic sources located in areas of low soil moisture and low vegetation coverage, using 10 GHz horizontal polarization data is the most effective.
Going forward, our methods and procedures are all based on qualitative research, and the current classification of seismic case information is relatively macro, which may cause errors in the selection of the best frequency band and polarization mode of microwave brightness temperature data for regions with boundary values. Therefore, in follow-up research, we will continue to use Artificial Intelligence (AI) and big data technology for quantitative research to obtain more complete and accurate selection standards of microwave brightness temperature data for different seismic cases.

Author Contributions

Conceptualization, H.W.; methodology, H.W.; software, H.W.; validation, J.C.; formal analysis, X.Z.; investigation, X.Y.; resources, X.Y.; data curation, X.Y.; writing—original draft preparation, J.C.; writing—review and editing, X.Z.; visualization, J.C.; supervision, P.X. All authors have read and agreed to the published version of the manuscript.

Funding

This work was supported in part by the Natural Science Foundation of China (NSFC), grant number 42274108, and the Central Public-interest Scientific Institution Basal Research Fund (No. CEAIEF20230506).

Data Availability Statement

The MBT data of AMSR-2 can be accessed from G-Portal System (https://gportal.jaxa.jp/gpr/ (access on 20 September 2023)), The CVH data can be accessed from ERA5 hourly data on single levels from 1940 to present (https://cds.climate.copernicus.eu (access on 20 September 2023)), The SM can be accessed from GES DISC (https://disc.gsfc.nasa.gov/ (access on 20 September 2023)), The earthquake examples can be accessed from USGS (https://earthquake.usgs.gov/earthquakes/search/ (access on 20 September 2023)).

Conflicts of Interest

The authors declare no conflict of interest.

References

  1. Qi, Y.; Wu, L.; Mao, W.; Ding, Y.; Liu, Y.; Wang, X. Characteristic background of microwave brightness temperature (MBT) and optimal microwave channels for searching seismic MBT anomaly in and around the Qinghai-Tibet Plateau. IEEE Trans. Geosci. Remote Sens. 2023, 61, 4504918. [Google Scholar] [CrossRef]
  2. Maeda, T.; Takano, T. Detection of microwave signals associated with rock failures in an earthquake from satellite-borne microwave radiometer data. In Proceedings of the 2009 IEEE International Geoscience and Remote Sensing Symposium, Cape Town, South Africa, 12–17 July 2009. [Google Scholar]
  3. Hao, C.; Yaqiu, J. Preliminary Detection of Rock Fracture Radiation Anomalies in the Yushu Earthquake by Spaceborne Microwave Radiometer. Remote Sens. Technol. Appl. 2020, 29, 29–35. [Google Scholar] [CrossRef]
  4. Singh, R.P.; Mehdi, W.; Gautam, R.; Senthil Kumar, J.; Zlotnicki, J.; Kafatos, M. Precursory signals using satellite and ground data associated with the Wenchuan Earthquake of 12 May 2008. Int. J. Remote Sens. 2010, 31, 3341–3354. [Google Scholar] [CrossRef]
  5. Ma, Y.; Liu, S.; Wu, L.; Xu, Z. Two-step method to extract seismic microwave radiation anomaly: Case study of MS8.0 Wenchuan earthquake. Earthq. Sci. 2011, 24, 577–582. [Google Scholar] [CrossRef]
  6. Jie, Y.; Guangmeng, G. Preliminary analysis of thermal anomalies before the 2010 Baja California M7.2 earthquake. Atmósfera 2013, 26, 473–477. [Google Scholar] [CrossRef]
  7. Zhang, B.; Qin, K.; Wu, T.; Shi, T.; Fan, W. Statistical Analysis of Microwave Radiation Anomaly Before Earthquake: A Case Study of Kamchatka Peninsula. Acta Seismol. Sin. 2018, 40, 98–107. [Google Scholar] [CrossRef]
  8. Jing, F.; Singh, R.P.; Cui, Y.; Sun, K. Microwave Brightness Temperature Characteristics of Three Strong Earthquakes in Sichuan Province, China. IEEE J-Stars 2020, 13, 513–522. [Google Scholar] [CrossRef]
  9. Jing, F.; Singh, R.P.; Shen, X. Land—Atmosphere—Meteorological coupling associated with the 2015 Gorkha (M 7.8) and Dolakha (M 7.3) Nepal earthquakes. Geomat. Nat. Hazards Risk 2019, 10, 1267–1284. [Google Scholar] [CrossRef]
  10. Qi, Y.; Wu, L.; Ding, Y.; Mao, W. Microwave Brightness Temperature Anomalies Associated With the 2015 Mw 7.8 Gorkha and Mw 7.3 Dolakha Earthquakes in Nepal. IEEE Trans. Geosci. Remote Sens. 2022, 60, 1–11. [Google Scholar] [CrossRef]
  11. Qi, Y.; Wu, L.; Mao, W.; Ding, Y.; He, M. Discriminating Possible Causes of Microwave Brightness Temperature Positive Anomalies Related With May 2008 Wenchuan Earthquake Sequence. IEEE Trans. Geosci. Remote Sens. 2021, 59, 1903–1916. [Google Scholar] [CrossRef]
  12. Qi, Y.; Wu, L.; Ding, Y.; Liu, Y.; Chen, S.; Wang, X.; Mao, W. Extraction and Discrimination of MBT Anomalies Possibly Associated with the Mw 7.3 Maduo (Qinghai, China) Earthquake on 21 May 2021. Remote Sens. 2021, 13, 4726. [Google Scholar] [CrossRef]
  13. Qi, Y.; Wu, L.; He, M.; Mao, W. Spatio-Temporally Weighted Two-Step Method for Retrieving Seismic MBT Anomaly: May 2008 Wenchuan Earthquake Sequence Being a Case. IEEE J. Sel. Top. Appl. Earth Obs. Remote Sens. 2020, 13, 382–391. [Google Scholar] [CrossRef]
  14. Liu, S.J.; Ji, M.Y.; Song, L.M.; Wei, L.H. Microwave Anomaly of Maduo MS7.4 Earthquake Derived by Improved Two-Step Difference Method. Acta Seismol. Sin. 2023, 45, 328–340. [Google Scholar] [CrossRef]
  15. Liu, S.; Cui, Y.; Wei, L.; Liu, W.; Ji, M. Pre-earthquake MBT anomalies in the Central and Eastern Qinghai-Tibet Plateau and their association to earthquakes. Remote Sens. Environ. 2023, 298, 113815. [Google Scholar] [CrossRef]
  16. Zhang, Y.-S.; Guo, X.; Wei, C.-X.; Shen, W.-R.; Hui, S.-X. The Characteristics of Seismic Thermal Radiation of Japan Ms9.0 and Myanmar Ms7.2 Earthquake. Chin. J. Geophys. Chin. 2011, 54, 2575–2580. [Google Scholar] [CrossRef]
  17. Xiong, P.; Shen, X.H.; Bi, Y.X.; Kang, C.L.; Chen, L.Z.; Jing, F.; Chen, Y. Study of outgoing longwave radiation anomalies associated with Haiti earthquake. Nat. Hazards Earth Syst. Sci. 2010, 10, 2169–2178. [Google Scholar] [CrossRef]
  18. Xiong, P.; Bi, Y.; Shen, X. Study of outgoing longwave radiation anomalies associated with two earthquakes in China using wavelet maxima. In Proceedings of the Hybrid Artificial Intelligence Systems: 4th International Conference, HAIS 2009, Proceedings 4, Salamanca, Spain, 10–12 June 2009; pp. 77–87. [Google Scholar]
  19. Xiong, P.; Bi, Y.; Shen, X. A wavelet-based method for detecting seismic anomalies in remote sensing satellite Data. In Proceedings of the Machine Learning and Data Mining in Pattern Recognition: 6th International Conference, MLDM 2009, Proceedings 6, Leipzig, Germany, 23–25 July 2009; pp. 569–581. [Google Scholar]
  20. Xiong, P.; Gu, X.; Shen, X.; Zhang, X.; Kang, C.; Bi, Y. Wavelet-based method for detecting seismic anomalies in DEMETER satellite data. In Proceedings of the Knowledge Science, Engineering and Management: 5th International Conference, KSEM 2011, Proceedings 5, Irvine, CA, USA, 12–14 December 2011; pp. 1–11. [Google Scholar]
  21. Kim, S.-B.; Huang, H.; Liao, T.-H.; Colliander, A. Estimating Vegetation Water Content and Soil Surface Roughness Using Physical Models of L-Band Radar Scattering for Soil Moisture Retrieval. Remote Sens. 2018, 10, 556. [Google Scholar] [CrossRef]
  22. Liang, M.; Pause, M.; Prechtel, N.; Schramm, M. Regionalization of Coarse Scale Soil Moisture Products Using Fine-Scale Vegetation Indices—Prospects and Case Study. Remote Sens. 2020, 12, 551. [Google Scholar] [CrossRef]
  23. Zhu, H.; Zhang, Z.; Lv, A. Evaluation of Satellite-Derived Soil Moisture in Qinghai Province Based on Triple Collocation. Water 2020, 12, 1292. [Google Scholar] [CrossRef]
  24. Mladenova, I.; Jackson, T.; Njoku, E.; Bindlish, R.; Chan, S.; Cosh, M.; Holmes, T.; De Jeu, R.; Jones, L.; Kimball, J.; et al. Remote monitoring of soil moisture using passive microwave-based techniques—Theoretical basis and overview of selected algorithms for AMSR-E. Remote Sens. Environ. 2014, 144, 197–213. [Google Scholar] [CrossRef]
  25. Qiao, P.; Zhang, J.; Wang, C. Soil moisture retrieving by AMSR-E microwave remote sensing data. J. China Univ. Min. Technol. Chin. Ed. 2007, 36, 262. [Google Scholar]
  26. Njoku, E.G.; Jackson, T.J.; Lakshmi, V.; Chan, T.K.; Nghiem, S.V. Soil moisture retrieval from AMSR-E. IEEE Trans. Geosci. Remote Sens. 2003, 41, 215–229. [Google Scholar] [CrossRef]
  27. Jin, Y. Data analysis of the spaceborne SSM/I over crop areas of the Northern China. J. Remote Sens. 1998, 2, 18–25. [Google Scholar]
  28. Wang, J.R.; Schmugge, T.J. An empirical model for the complex dielectric permittivity of soils as a function of water content. IEEE Trans. Geosci. Remote Sens. 1980, 4, 288–295. [Google Scholar] [CrossRef]
  29. Mao, W.F.; Wu, L.X.; Liu, S.J.; Xu, Z.Y. Experiment Comparison on Microwave Radiation from Stressed Rock Covered by Materials: Dry or Humid Sands. J. Northeast. Univ. Nat. Sci. 2018, 39, 710. [Google Scholar]
  30. Liu, S.; Xu, Z.; Wei, J.; Huang, J.; Wu, L. Experimental study on microwave radiation from deforming and fracturing rock under loading outdoor. IEEE Trans. Geosci. Remote Sens. 2016, 54, 5578–5587. [Google Scholar] [CrossRef]
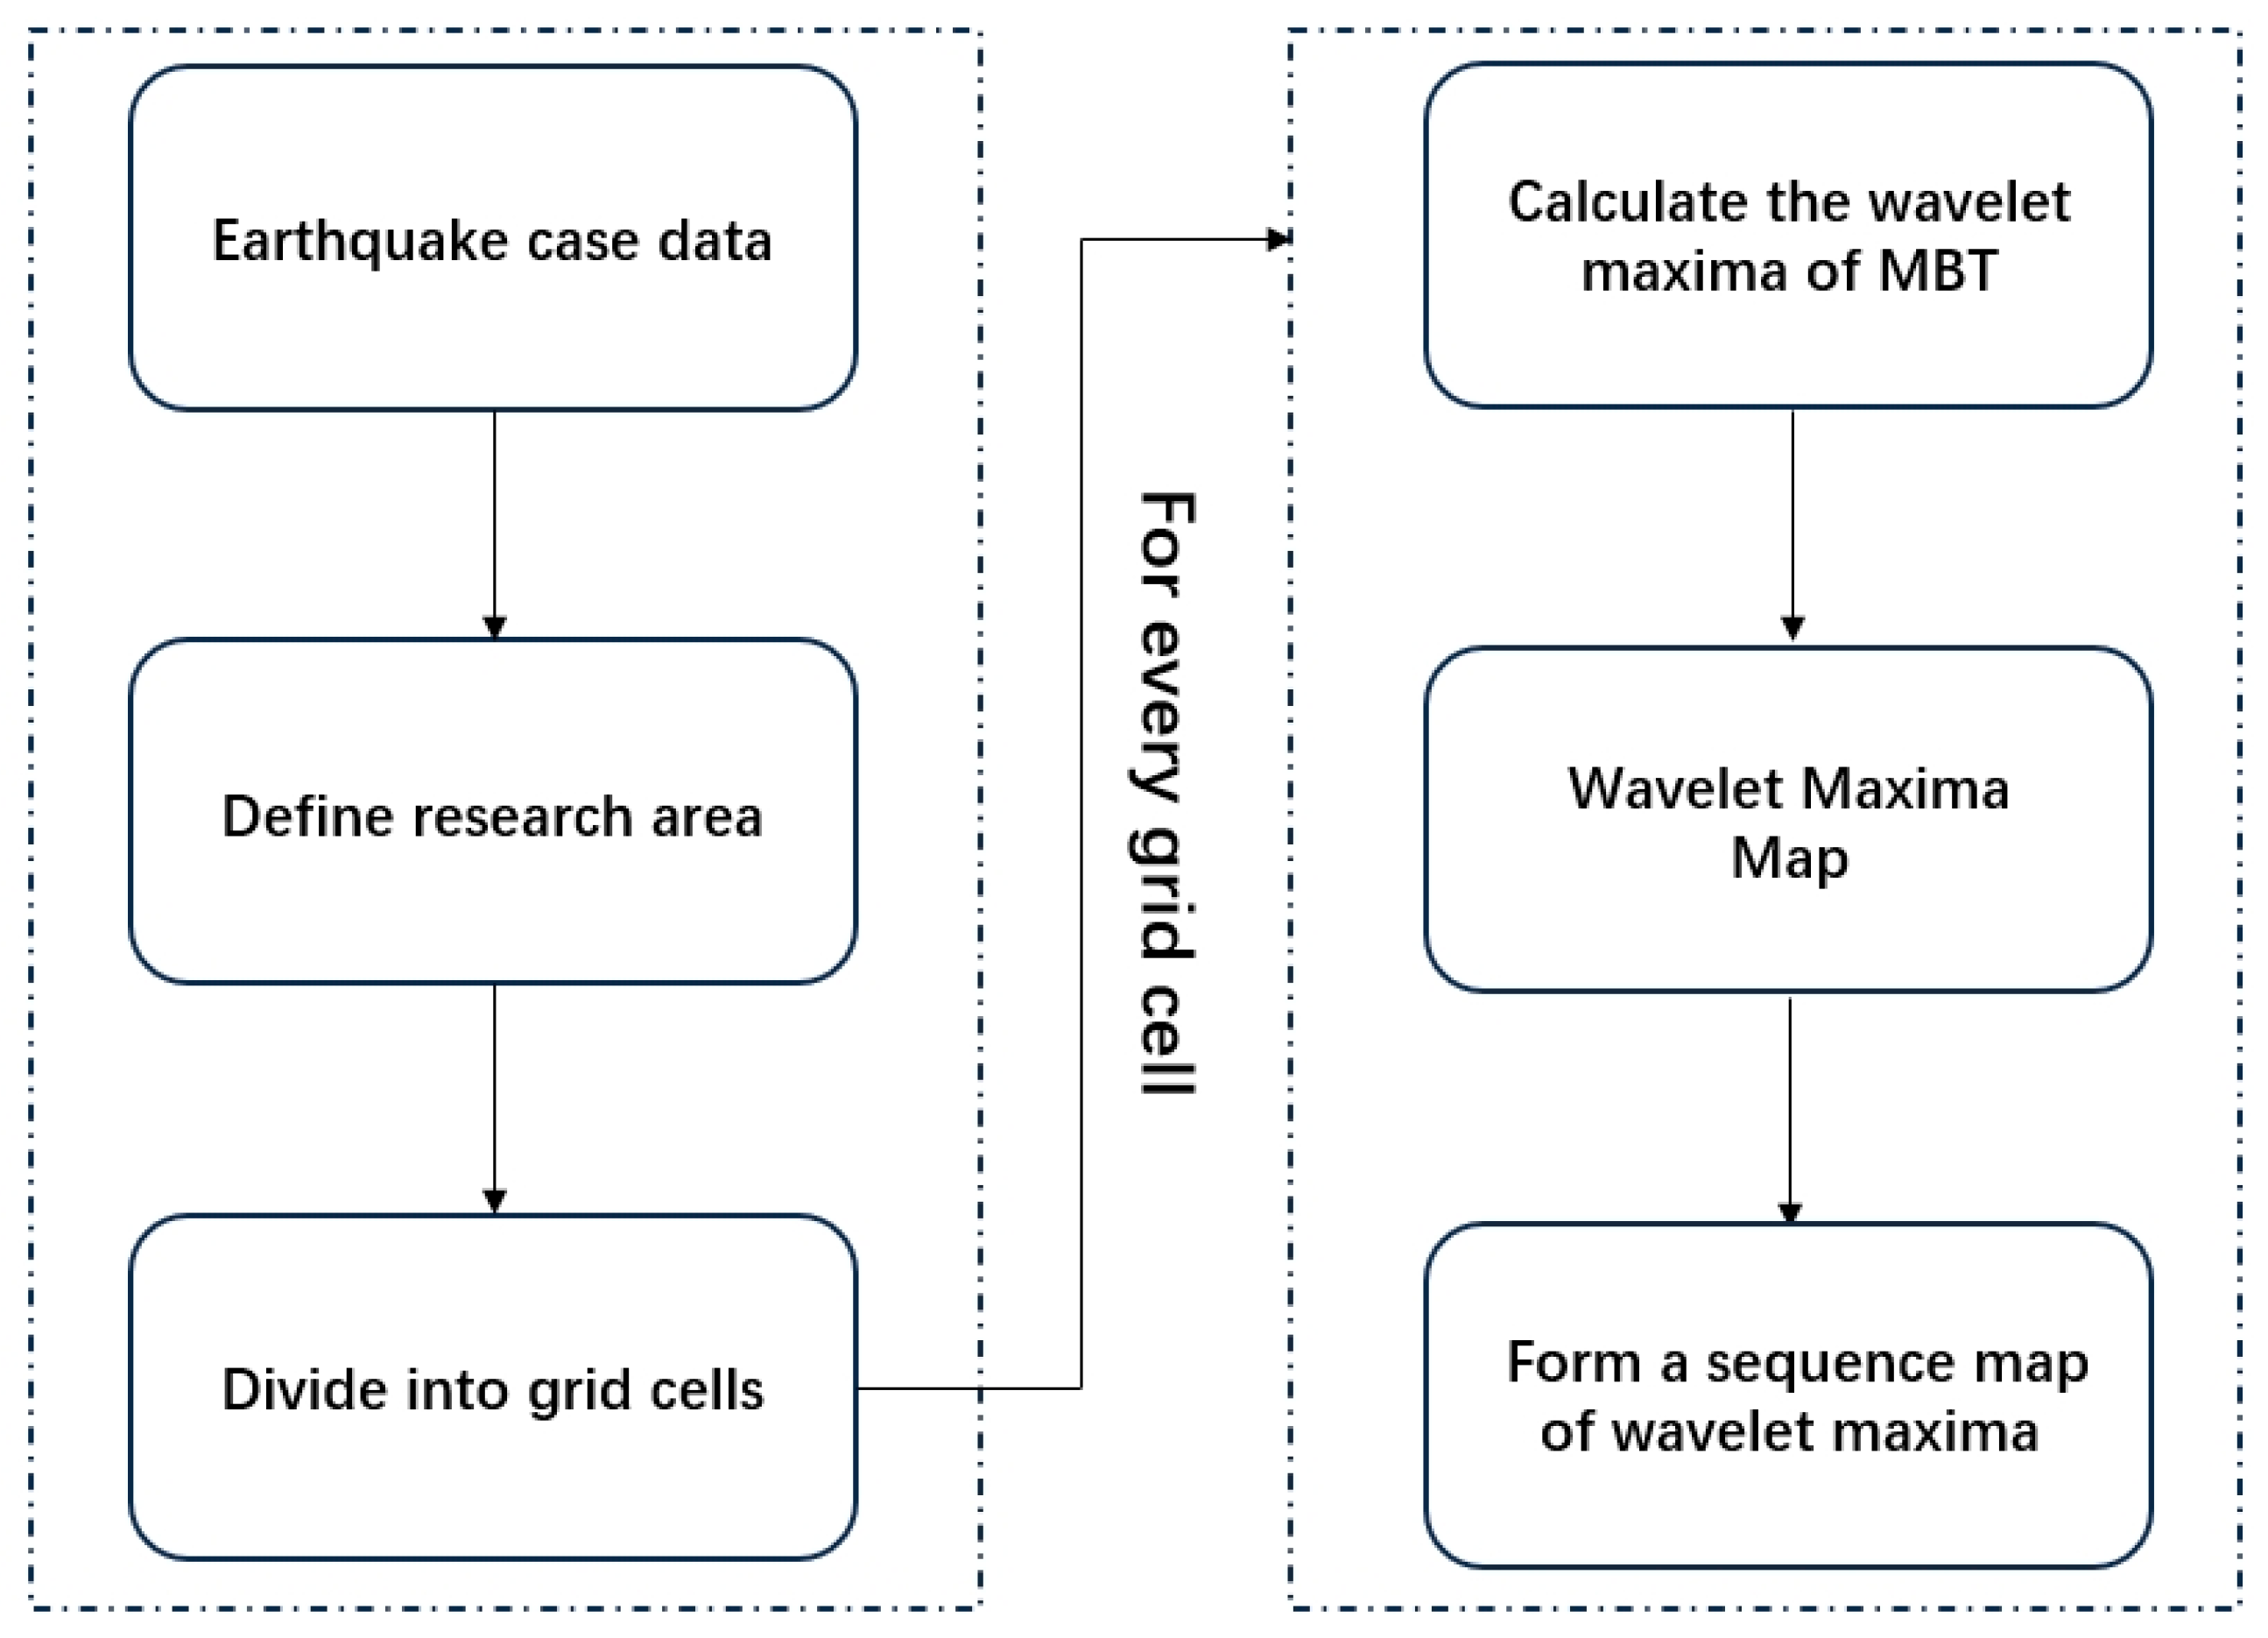
Figure 1. Flow chart of wavelet analysis method.
Remotesensing 16 00303 g001
Figure 2. Stratification of the study area into grid cells of the Nepal earthquake (April 2015).
Remotesensing 16 00303 g002
Figure 3. Illustrative depiction of the wavelet maxima.
Remotesensing 16 00303 g003
Figure 4. Wavelet maxima sequence diagram.
Remotesensing 16 00303 g004
Figure 5. Wavelet maxima from MBT data near the epicenter of the Sea of Okhotsk earthquake (24 May 2013).
Remotesensing 16 00303 g005
Figure 6. Seismic wavelet maxima sequence in the Ms 8.3 earthquake in the Sea of Okhotsk.
Remotesensing 16 00303 g006
Figure 7. Wavelet maxima from MBT data near the epicenter of the Peru earthquake (26 May 2019).
Remotesensing 16 00303 g007
Figure 8. Seismic wavelet maxima sequence in the Peru earthquake.
Remotesensing 16 00303 g008
Figure 9. Wavelet maxima from MBT data near the epicenter of the Turkey earthquake (6 February 2023).
Remotesensing 16 00303 g009
Figure 10. Seismic wavelet maxima sequence in the Turkey earthquake.
Remotesensing 16 00303 g010
Figure 11. Wavelet maxima from MBT data near the epicenter of the New Zealand earthquake (13 November 2016).
Remotesensing 16 00303 g011
Figure 12. Seismic wavelet maxima sequence in the New Zealand earthquake.
Remotesensing 16 00303 g012
Table 1. Information on the classification standards.
TypeDescriptionVegetation CoverSoil Moisture
1Ocean--
2Land>0.5>6
3Land>0.5≤6
4Land≤0.5>6
5Land≤0.5≤6
Table 2. Information on earthquake cases.
TypeLatitudeLongitudeDepthMagCVHSM
154.892153.221598.108.30−1
2−5.812−75.269122.578.018.27
328.23184.7318.227.80.6564.505
437.22637.01410.007.80.4797.435
5−42.737173.05415.117.80.0144.849
In the above table, latitude less than 0 indicates south latitude, longitude less than 0 indicates west longitude; SM value of −1 indicates that there is no soil moisture, that is, ocean. CVH represents vegetation coverage, and SM represents soil moisture.
Table 3. Optimal frequency band and polarization mode of microwave brightness temperature data for different seismic cases.
TypeFrequency (GHz)PolarizationWavelet FunctionWavelet Order
110HDb316
210HMeyr10
310HMorl20
436HGaus313
510HGaus520
Disclaimer/Publisher’s Note: The statements, opinions and data contained in all publications are solely those of the individual author(s) and contributor(s) and not of MDPI and/or the editor(s). MDPI and/or the editor(s) disclaim responsibility for any injury to people or property resulting from any ideas, methods, instructions or products referred to in the content.