Article

Cross-Calibration of HY-1D/COCTS Thermal Emissive Bands in the South China Sea

1
Key Laboratory of Ocean Observation and Information of Hainan Province, Sanya Oceanographic Institution, Ocean University of China, Sanya 572024, China
2
College of Marine Technology, Faculty of Information Science and Engineering, Ocean University of China, Qingdao 266100, China
3
Laboratory for Regional Oceanography and Numerical Modeling, Qingdao National Laboratory for Marine Science and Technology, Qingdao 266237, China
*
Author to whom correspondence should be addressed.
Remote Sens. 2024, 16(2), 292; https://doi.org/10.3390/rs16020292
Submission received: 5 December 2023 / Revised: 7 January 2024 / Accepted: 8 January 2024 / Published: 11 January 2024
(This article belongs to the Section Ocean Remote Sensing)

Abstract

:
Haiyang-1D (HY-1D) is the second operational satellite in China’s Haiyang-1 series of satellites, carrying the Chinese Ocean Color and Temperature Scanner (COCTS) to provide ocean color and temperature observations. The radiometric calibration is a prerequisite to guarantee the quality of the satellite observations and the derived products, and the radiometric calibration of the thermal emissive bands of HY-1D/COCTS can effectively improve the accuracy of sea surface temperature (SST) derived from the thermal infrared data. In this paper, a study on the regional cross-calibration of the COCTS thermal emissive bands is conducted for high-accuracy SST observations in the South China Sea. The Visible Infrared Imaging Radiometer Suite (VIIRS) on board the NOAA-20 satellite launched by the National Oceanic and Atmospheric Administration (NOAA) is selected as the calibration reference sensor, and a double-difference cross-calibration method is used for HY-1D/COCTS thermal infrared brightness temperature (BT) evaluation. The results show that the bias of the 11 µm and 12 µm thermal emissive bands of COCTS and VIIRS in the South China Sea are 0.101 K and 0.892 K, respectively, and the differences in BTs between the two sensors show temperature dependence. The cross-calibration coefficients are obtained and used to correct the BT of the COCTS thermal emissive bands. The bias of the BT of the 11 µm and 12 µm bands of COCTS are about 0.01 K after cross-calibration. To further validate the results, COCTS post-calibration data were examined using the NOAA-20 Cross-track Infrared Sounder (CrIS) data as a third-party source. The BT is calculated with the spectral response functions of the COCTS thermal emissive bands using the convolution calculation of the CrIS hyperspectral region observations. The comparison shows a small bias between the post-calibration COCTS thermal emissive band observations and CrIS, which is consistent with the comparison between VIIRS and CrIS. The accuracy of the post-calibration COCTS thermal emissive band BT data in the South China Sea has been significantly improved.

1. Introduction

The second operational satellite in the Haiyang-1 series, Haiyang-1D (HY-1D), was launched on 11 June 2020. The satellite is positioned at a nominal orbital altitude of 782 km [1] and one of the payloads is the Chinese Ocean Color and Temperature Scanner (COCTS), which detects ocean color and sea surface temperature (SST). It has a swath width of 3000 km and the ability to achieve global data coverage in a single day. HY-1D/COCTS forms a network with the same series of satellites, Haiyang-1C (HY-1C), for both morning and afternoon transit observations [2].
The South China Sea, with its unique geographical location, is rich in marine thermodynamic processes, and its thermal conditions and changes are very complex, with the strongest convection, high water vapor content, and extremely strong sea–air interactions. The South China Sea is also an important region where the East Asian monsoon system interconnects and interacts with the South Asian monsoon and the Asian–Australian monsoon systems, and as a conduit for water vapor transport from various air streams to the Chinese mainland in summer, the thermal effect of the South China Sea and the related processes of sea–air interactions have an important impact on the weather and climate of the Chinese mainland [3]. Therefore, understanding the spatial and temporal distribution of the SST field and its long-term trend in the South China Sea is of great significance to marine scientific research and meteorological and weather prediction, and the relevant research and predictions need to be supported by high-quality satellite SST data. To enable the HY-1D/COCTS thermal emissive bands to accurately observe the ocean thermal conditions in the South China Sea region, this paper takes the South China Sea as a calibration scene and carries out a calibration study on the thermal emissive band observations of HY-1D/COCTS.
Radiometric calibration is a prerequisite for ensuring the quality of satellite observation and the derived products. Radiometric calibration of the thermal emissive bands of HY-1D/COCTS will effectively improve the accuracy of COCTS in thermal emissive bands, thus ensuring that the remote sensing data can accurately reflect the real field. Cross-calibration is an efficient radiometric calibration method for calibration by establishing the corresponding observation conversion relationship between the sensors to be calibrated and the reference sensors with good calibration accuracy [4,5]. Compared to other calibration methods, cross-calibration is more adaptable to calibration scenarios, requires fewer resources, and can provide a large number of simultaneous observations to support the calibration process and to observe and verify calibration results [6]. Mittaz et al. conducted a cross-calibration study of the thermal emissive bands of the Advanced Very-High-Resolution Radiometer (AVHRR), based on the Infrared Atmospheric Sounding Interferometer (IASI) data [7], which reduces the bias of the AVHRR observations. Efremova et al. compared and analyzed the observed differences in the thermal emissive bands of the Visible Infrared Imaging Radiometer Suite (VIIRS) on board the S-NPP satellite and the Moderate Resolution Imaging Spectroradiometer (MODIS) on board the Aqua satellite using the cross-calibration method [8]; the results show that there is a small negative bias in the VIIRS sensor observations relative to MODIS. Ye et al. calibrated the thermal emissive bands of the visible and infrared multispectral sensor (VIMS) on board the Gaofen-5 satellite with Aqua/MODIS as the reference sensor [9]. Rong et al. carried out simultaneous measurements and calibrations of Fengyun-2B and Fengyun-2C satellite infrared bands in the South China Sea, respectively, and the two experiments obtained good results [10], which also provided a scientific basis for the study of calibration in the South China Sea.
In this paper, we focus on the evaluation and cross-calibration of regional HY-1D/COCTS thermal infrared observations in the South China Sea. Cross-calibration of the HY-1D/COCTS thermal emissive bands requires the selection of a sensor with both similar characteristics and reliable observation accuracy as a reference. Launched in November 2017, the NOAA-20 satellite operates in a polar sun-synchronous orbit at a nominal altitude of 824 km, with a swath width of 3060 km, and has a similar afternoon equator crossing time to HY-1D [11]. The central wavelengths of the thermal emissive bands of the VIIRS on board NOAA-20 are 10.7 μm and 12.0 μm, respectively. The daily bias of the observed BTs of the thermal emissive bands of NOAA-20/VIIRS at the nadir, as well as the observed BTs of the Cross-track Infrared Sounder (CrIS) on board the NOAA-20, is within 0.1 K [12], and the two thermal infrared bands of the VIIRS offer high accuracy and reliable stability [13]. Compared with the S-NPP/VIIRS, the thermal emissive bands of NOAA-20/VIIRS have a lower noise equivalent temperature, and their accuracy does not vary with seasons, which provides better stability, and thus NOAA-20/VIIRS is selected as the calibration reference sensor for the HY-1D/COCTS thermal emissive bands.
After cross-calibration of the HY-1D/COCTS thermal emissive bands, a reliable third-party data source is required to validate the COCTS calibration results in order to verify the accuracy of the calibration conclusions. CrIS is a hyperspectral sensor and a payload on the NOAA-20 satellite along with VIIRS. CrIS has a nadir resolution of 14 km and a swath width of 2200 km, with 717 observation channels in the hyperspectral band and good continuity between channels. CrIS acquires two internal calibration target pixels (hot calibration points) and two deep-sky pixels (cold calibration points) for performing blackbody and deep-sky radiometric calibrations for each round of scanning, and spectral corrections are completed by laser wavelength corrections and neon spectral corrections. CrIS has a reliable calibration accuracy and has been used many times to cross-calibrate other sensors. For example, Iturbide-Sanchez et al. evaluated the performance of the NOAA-20/CrIS sensor data product in 2019, and the results showed that the NOAA-20/CrIS SDR product meets the JPSS requirements, has long-term stability, and that it is highly consistent with the observations from the S-NPP/CrIS, demonstrating the high quality and stability of the CrIS observations [14]. In 2021, Tremblay et al. used the same series of on board instrument S-NPP/CrIS, which has been in smooth operation for a long time, as a reference to validate the accuracy of NOAA-20/CrIS in the high, medium, and low spectral bands, and the results of the experiment showed that there was good agreement between the two instruments [15]. In this paper, CrIS data are used to validate the calibration results of COCTS thermal emissive bands.
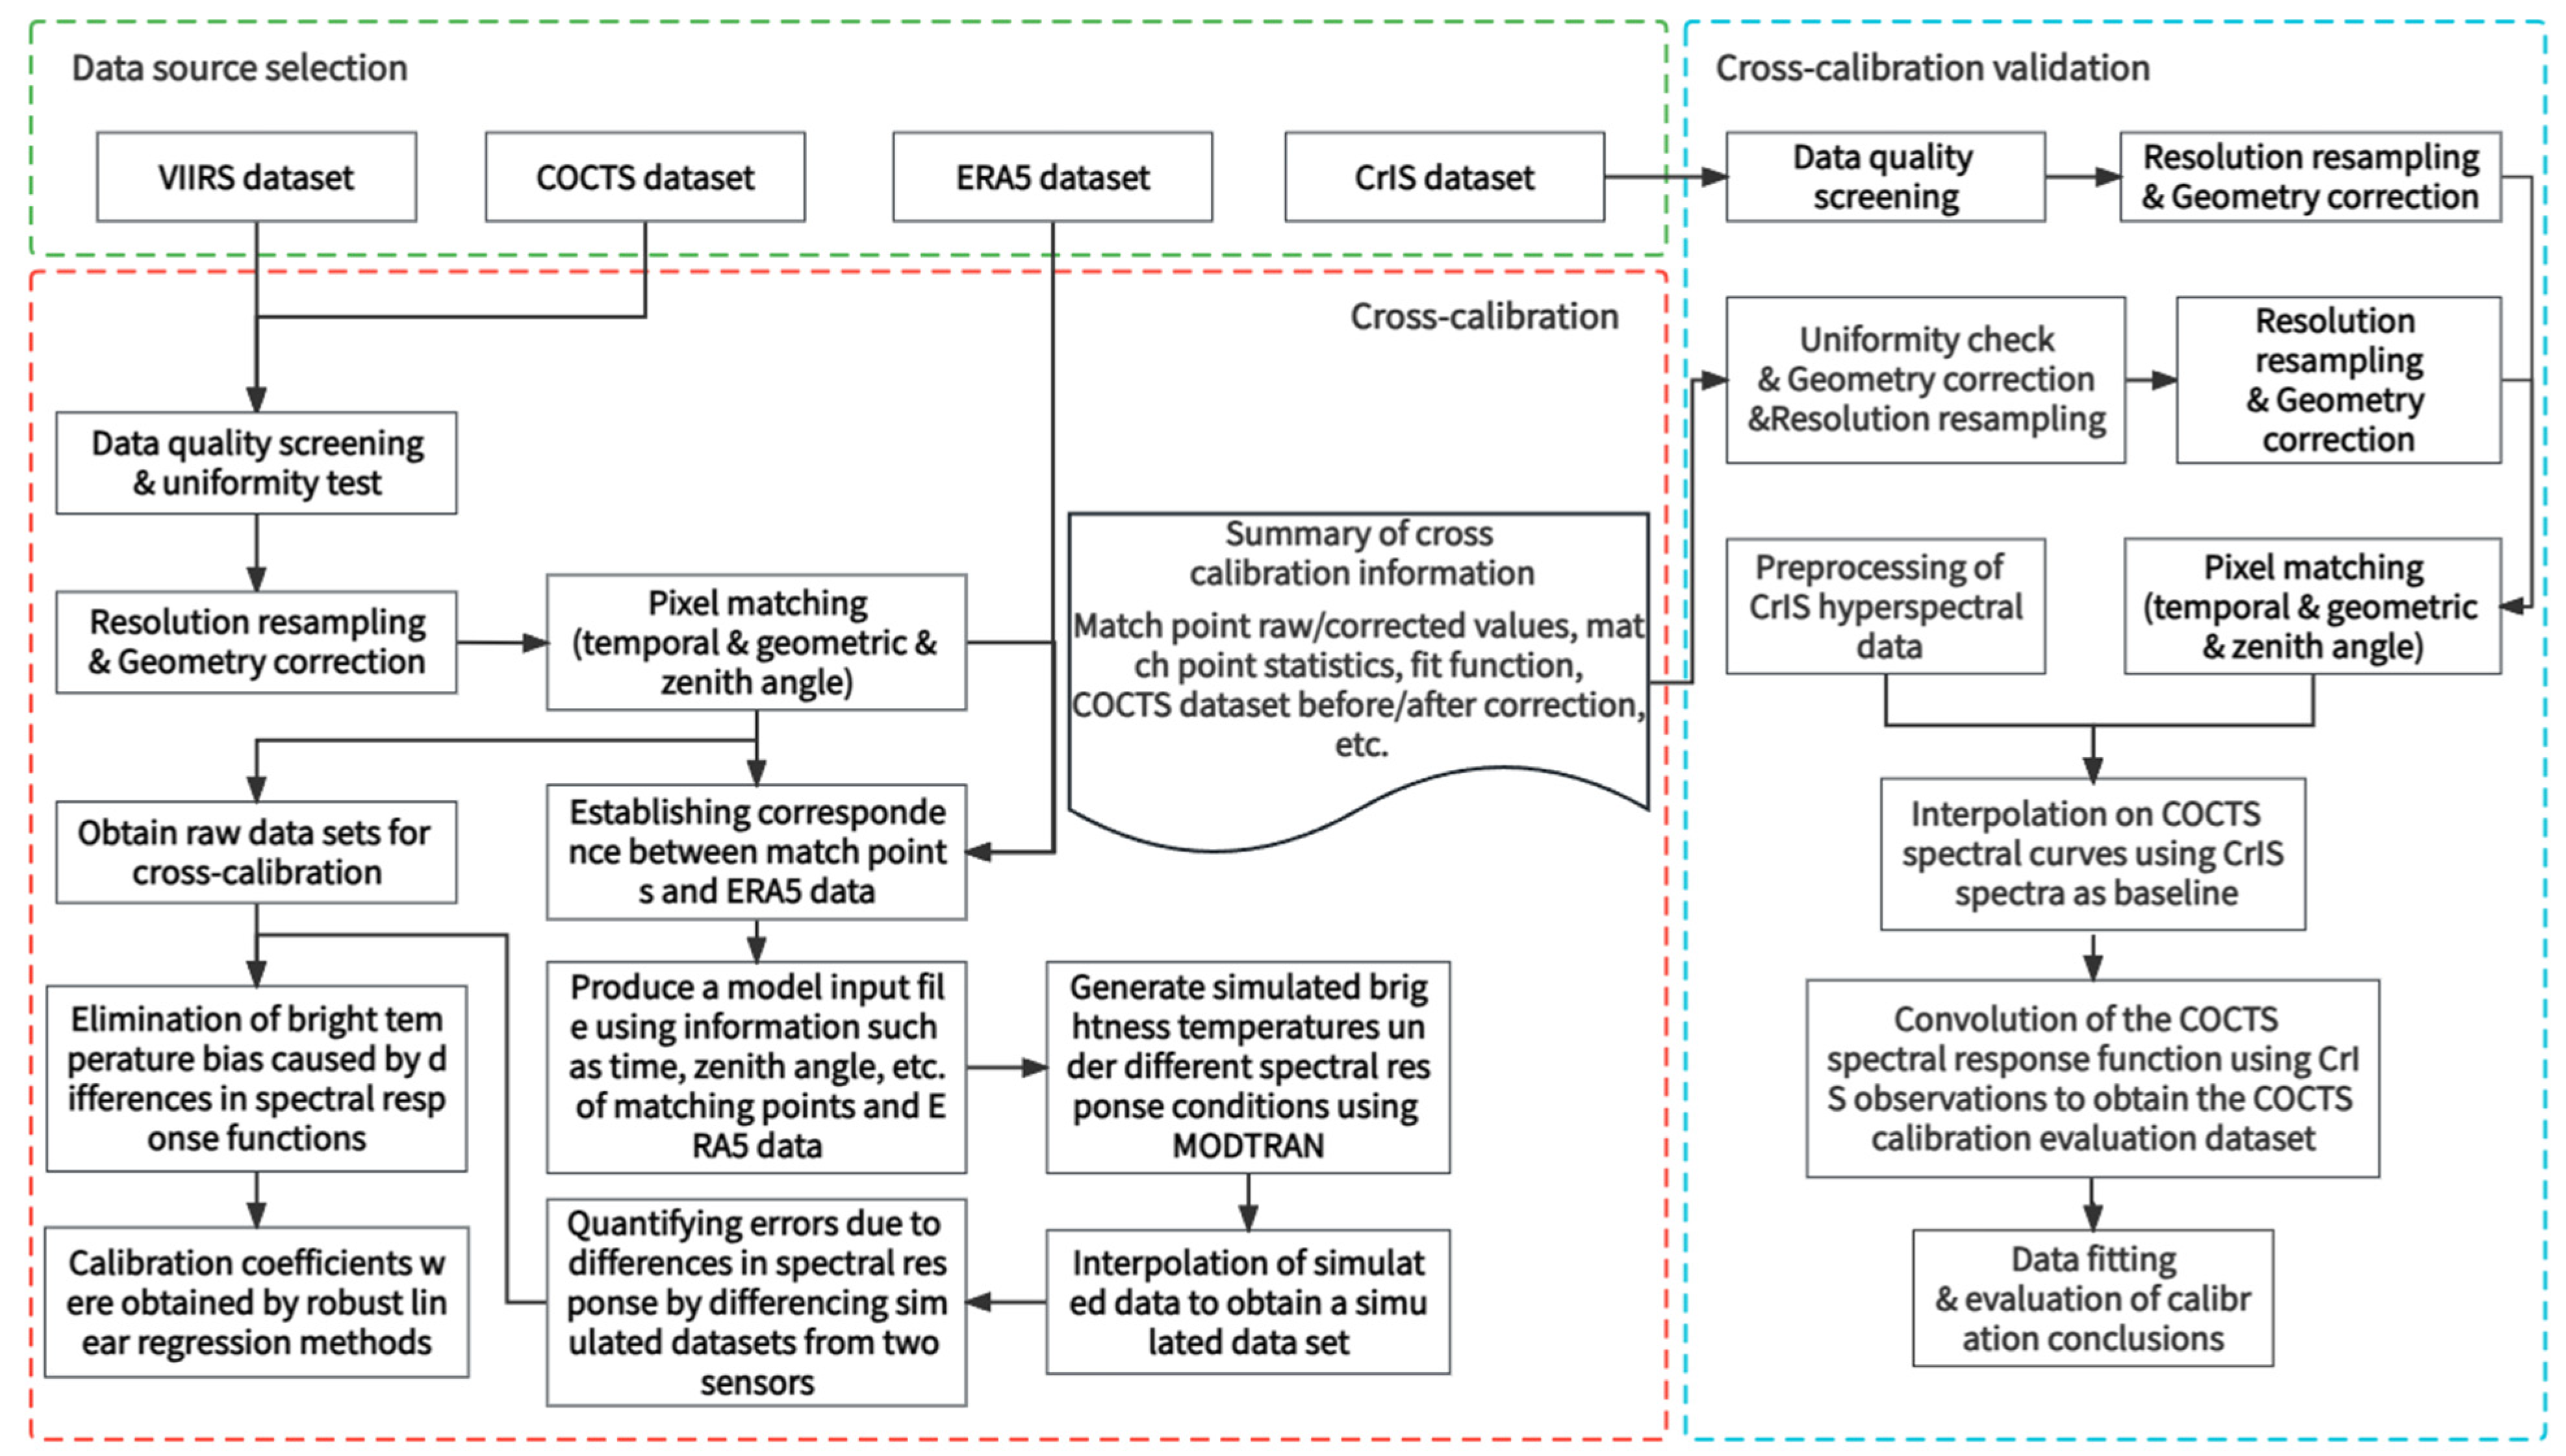
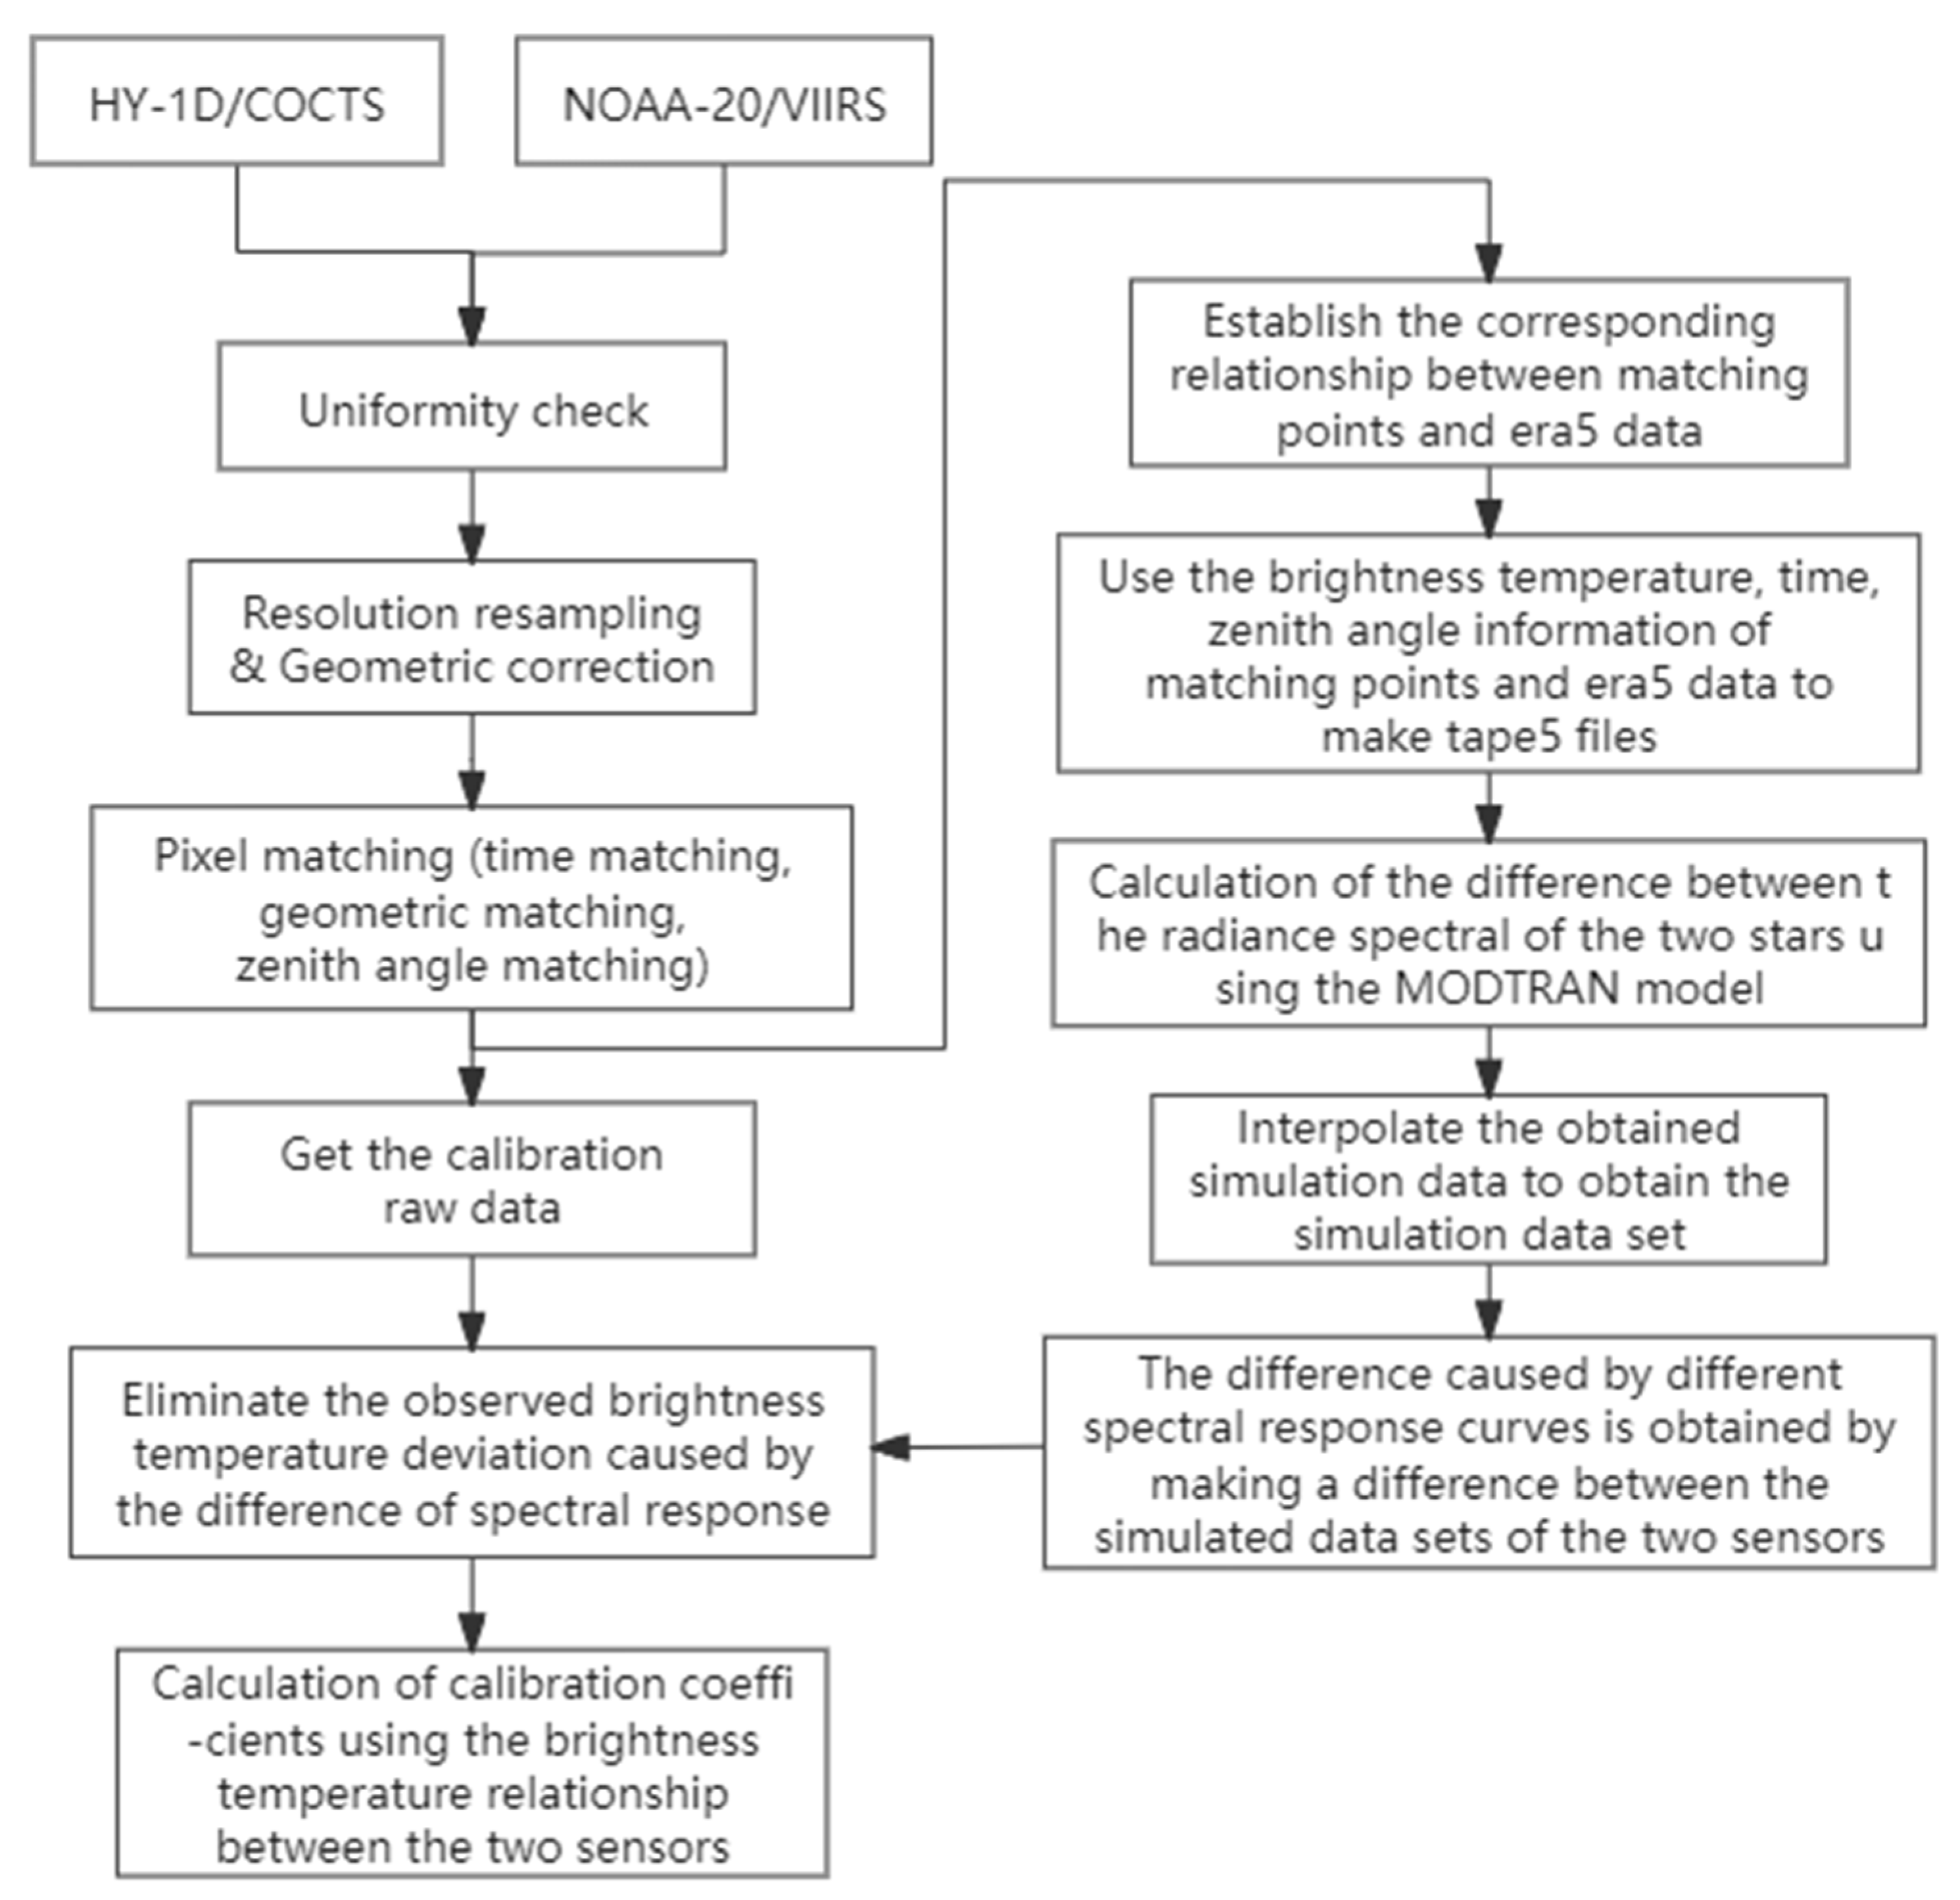
This paper is divided into five sections to present and discuss the calibration of HY-1D/COCTS thermal emissive bands in the South China Sea. The second section introduces the various data sources used in this paper, and gives the method of the double-difference cross-calibration to calibrate the HY-1D/COCTS thermal emissive band observations with NOAA-20/VIIRS as the reference sensors. The calibration coefficient results for the two thermal emissive bands of COCTS in the South China Sea are given in Section 3, along with the analysis of the calibration results. In Section 4, discussions are given using the hyperspectral instrument CrIS to assess the accuracy of calibrated COCTS thermal infrared data. A conclusion of this paper is presented in Section 5.

2. Materials and Methods

The datasets used in this paper include the thermal infrared dataset of HY-1D/COCTS and the thermal infrared dataset of NOAA-20/VIIRS as the reference, both of which selected L1 data for cross-calibration. In addition, due to using the double-difference method for cross-calibration, the Moderate Resolution Atmospheric Transmission (MODTRAN) model was chosen to correct spectral differences of the thermal emissive bands between COCTS and VIIRS. The fifth generation European Centre for Medium-Range Weather Forecasts (ECMWF) reanalysis (ERA5) is used to provide relevant parameters for the radiative transfer simulation process of MODTRAN. Upon completion of the calibration, the NOAA-20/CrIS sensor data record (SDR) will be used as a third-party data source to validate the accuracy of the calibration conclusions. The overall technical route of this paper is shown in Figure 1.

2.1. Data Set

2.1.1. HY-1D/COCTS Data

HY-1D/COCTS is a medium-resolution scanner with a resolution of 1.1 km at nadir, and is mainly applied to detect ocean color elements and SST fields. HY-1D/COCTS comprises 10 bands, where bands 1 to 8 are designated for visible and near-infrared observations and bands 9 and 10 are designated for thermal infrared observations. The two thermal emissive bands have central wavelengths of 10.8 μm and 12.0 μm, respectively. Both bands are designed to have a noise-equivalent temperature difference of 0.2 K under the measurement condition of 300 K. The L1A data used in this study during the period of April 2021 to March 2023 are provided by the National Satellite Ocean Application Service (NSOAS) Centre of the Ministry of Natural Resources of China.

2.1.2. NOAA-20/VIIRS Data

The NOAA-20/VIIRS scanning radiometer has a field of view of 112.56° in the vertical direction of the orbit and a swath width of 3060 km, which enables daily global coverage of observational data. The VIIRS provides 22 spectral bands, including 16 medium-resolution bands (M-bands), with a nadir spatial resolution of 750 m. M15 and M16 of the NOAA-20/VIIRS are medium-resolution thermal emissive bands. The spectral ranges of M15 and M16 are from 10.263 μm to 11.263 μm (with a central wavelength of 10.8 μm) and 11.538 μm to 12.488 μm (with a central wavelength of 12.0 μm), respectively. The M15 and M16 bands of NOAA-20/VIIRS are used as references. The NOAA-20/VIIRS L1B data are obtained from NASA’s Class L1 Atmospheric Products Archive and Distribution Centre.

2.1.3. NOAA-20/CrIS Data

The NOAA-20/CrIS hyperspectral sensor has a swath width of up to 2200 km (+/−50°). During each CrIS scan, performed at an 8 s repetition interval, 30 Earth scene pixels can be acquired along with pixels from internal correction targets (hot correction points) and deep-space pixels (cold correction points) used for black-body and deep-space radiometric calibrations. CrIS can simultaneously measure infrared radiation in the high, middle, and low wavelength bands, and is capable of obtaining 8.7 million spectra per day, covering more than 95% of the Earth’s surface, of which the hyperspectral wavelength band has 717 observation channels, with a good inter-channel continuity, with one channel for every 0.625 cm−1 in the wavenumbers from 648.75 cm−1 to 1096.25 cm−1. The SDR dataset has been processed by the ground station, and can be downloaded from NOAA’s Comprehensive Large Array-data Stewardship System.

2.1.4. ERA5 Data

ERA5 is the ECMWF reanalysis for the global climate and weather, which combines model data with observations from around the world into a globally complete and consistent dataset, where previous forecasts are optimally combined with new available observations at hourly intervals to produce new best estimates of the state of the atmosphere reflection. ERA5 provides hourly estimates for a large number of atmospheric, oceanic, and land surface data, and in this paper, the ERA5 data will be used as an input to the MODTRAN, with the model simulated values used to remove the spectral differences between the HY-1D/COCTS and NOAA-20/VIIRS thermal emissive bands in the double-difference method of cross-calibration. ERA5 data are obtained from the Copernicus Climate Data Centre.

2.2. Cross-Calibration Method

The double-difference method of cross-calibration is used to evaluate and correct the BT of the HY-1D/COCTS thermal emissive bands. Observational simulation of the same radiation under different spectral response conditions by the MODTRAN quantifies the observational difference caused by the differences in spectral response function and eliminates them using the double-difference calibration method [16]. In order to cross-calibrate the HY-1D/COCTS thermal emissive bands with the NOAA-20/VIIRS as a reference, it is necessary to establish, as far as possible, the comparison of the data between the corresponding bands of the two sensors under the same observing conditions. The factors affecting the accuracy of the cross-calibration come mainly from two aspects: the matching and screening of the calibration pixels between the two satellite sensors, and the different methods of the cross-calibration and their elimination of the differences in spectral response between the corresponding bands of the two sensors. The treatment of the two aforementioned factors affecting calibration accuracy in this study will be presented separately next.

2.2.1. Data Screening and Matching

The purpose of data screening is to select a batch of data from the original dataset for the calibration process, and the screening of the calibration dataset not only ensures the quality of the data, but also needs to take into account the spatial and temporal differences between the observations of the two sensors.
Although both NOAA-20 and HY-1D satellites have a similar afternoon equator crossing time, because the orbits of the two satellites are not exactly same, there are differences in the time of observation and field of view. As a factor to be considered in cross-calibration, the temporal and spatial window between the observations of the two sensors should be limited. This paper has a set temporal window of 30 min and has investigated the BT in a spatial window of 0.01°. The calibration dataset only consists of data from the region with a uniform temperature.
Moreover, the homogenous test within the spatial window should be performed to minimize the difference caused by the temporal and spatial discrepancy. The purpose of the uniformity test is to look for uniformly observed areas where temperature changes are not significant over a half-hour time span. Such observations can be employed as pixels for cross-calibration [17]. In order to find a spatial window that is sufficient to ensure the data quality, the partially overlapped orbits of the two sensors in the South China Sea between April and September 2021 are used, and the matchups with the homogenous test windows of 0.03° and 0.05° are analyzed, respectively. It is found that as the scale of the spatial window is increased, the bias of the observations between the two sensors remains essentially unchanged, and the effect of increasing the scale of the spatial window for the homogenous test results in a reduction in the number of the matchups due to screening and a small range of fluctuation in the standard deviation of the matched data. Figure 2a shows the time series of observation deviation when the spatial window is set to 0.03°, and Figure 2b shows the time series of observation deviation when the spatial window is set to 0.05°. The blue and red lines in the plots represent the daily mean observation differences between VIIRS and COCTS in the 11 μm and 12 μm bands, respectively, while the black error bars are the standard deviation of the observation differences for the day, and the black dashed lines represent the corresponding number of matchups that passed through the homogeneity filter in the date. Considering that widening the spatial window would not have a beneficial effect on statistics, but rather reduce the amount of calibration data, we calculate the robust standard deviation of the observed BTs of the VIIRS and COCTS thermal emissive bands in the range of 0.03° around the target pixel for the homogenous test. Only uniform scene-matching samples where the uniformity detection values of the corresponding channels of both remote sensors are simultaneously less than 0.1 K are retained.
Concerning the earth observation of HY-1D/COCTS and NOAA-20/VIIRS, as the scanning angle increases, the pixel arrangement acquired by the instrument scanning is gradually distorted, which is further exacerbated when the observation data are averaged into a series of consecutive pixels within a very short period of time. Since the satellite dataset used in this paper has not been corrected for geographic information, geometric correction of the data using the equal angle projection method is required to correct distortions in the acquisition process. Considering the differences in the spatial resolution of the two sensors, the spatial resampling of the thermal infrared data from the two sensors is also required during the equal angle projection [18]. BT data from HY-1D/COCTS and NOAA-20/VIIRS in the study area were projected onto equal angle maps, with map grid size of 0.01°, to enable spatial matching of observations in subsequent operations.
After completing the outlier rejection and homogeneity test, and completing the geometric correction to remove spatial aberrations, the BT dataset for the two sensors on a 0.01° spatial grid was obtained. To achieve the accurate calibration of the target sensors, it is also necessary to consider the similarity of observation conditions between the corresponding observation pixels of the two sensors, and set up a reasonable observation window to select the matchups to meet the spatial and temporal consistency [19,20]. Since geometric matching of the pixels has already been carried out in the spatial resampling process, the focus here is on satellite zenith angle matching and temporal matching in the pixel matching process.
The purpose of satellite zenith angle matching is to control the difference in radiative attenuation caused by the different atmospheric path during the radiometric measurement of the sensor. In order to determine a reasonable range for the satellite zenith angle window during the matching process, MODTRAN was used to simulate the thermal radiation changes in the BT of the sensors with the change in the satellite zenith angle under an observation condition of 300 K of the SST, and the result is shown in Figure 3. In the figure, the observed zenith angle varies from 0° to 75° in 5° steps. It can be seen that as the observed zenith angle increases, the observed BT decreases gradually, and the rate of change in the observed BT also increases. When the observed zenith angle is less than 10°, the attenuation of the BT from the thermal emissive bands of both sensors is lower than 0.05%, so the screening condition of the matched image pixel is controlled within 10° of the satellite zenith angle to avoid the observation distortion caused by the excessively long atmospheric path. At the same time, to ensure the similarity of the radiation attenuation caused by the different atmospheric path lengths and the consistency of the ground incidence angle when the two sensors observe the same matchups, only those pixels are considered where the difference in the observed zenith angle between the reference and target sensors is less than 5°.
Concerning the temporal matching window for the sensors, since the original dataset was tested for homogeneity during the screening process and the data retained were homogeneous scenes, a larger time window can be appropriately selected to obtain more matching data for calibration. Referring to the setting of the time window in the relevant literature [21], the difference in the observation time of two sensors is set to be less than 30 min to ensure that the water surface temperature and atmospheric conditions of the observed image from the two sensors have not changed significantly within this time window.
The variance in COCTS minus VIIRS radiance difference on the temporal window and satellite zenith angle window is examined. No obvious increasing trend was observed, which indicates that the matching window threshold set in this paper is suitable. With the above conditions as the matching windows, the matched data that meet the window conditions are used as the calibration dataset for HY-1D/COCTS.

2.2.2. Spectral Correction

The difference between the spectral response functions of HY-1D/COCTS and NOAA-20/VIIRS thermal emissive bands is shown in Figure 4, where the orange and blue lines represent the spectral response functions of VIIRS and COCTS, respectively, corresponding to 11 µm and 12 µm bands. The double-difference cross-calibration method quantifies the observation differences due to different spectral responses by selecting a third-party data source with reliable accuracy and calculating the observation differences of the third-party data source under the spectral response conditions of the corresponding bands of the reference and to-be-calibrated sensors when the three data sources measure the same target.
In this calibration study of the COCTS thermal emissive bands, MODTRAN is selected to correct the spectral differences between COCTS and VIIRS, which is particularly suitable to be used in double-difference cross-calibration because it can simulate the observed BTs of the target region under the conditions of the spectral response functions of VIIRS and COCTS, respectively. The ERA5 atmospheric data are used as input of MODTRAN to provide the surface parameters and atmospheric profiles for the simulation. The difference between the simulated BT with different spectral response functions is used to correct the spectral difference in the observations of the two sensors. The matchups of BT, which has been processed through the above steps, will undergo fitting and calculation to derive the calibration coefficients. These coefficients will then be used to calibrate the remaining matchups. Subsequently, the outcomes will be analyzed and discussed. Figure 5 illustrates the calibration process.

3. Calibration Results and Discussion

Considering HY-1D COCTS data were improved during the on-orbit testing activity before April 2021 with the improvement of the thermal channels’ striping removal [
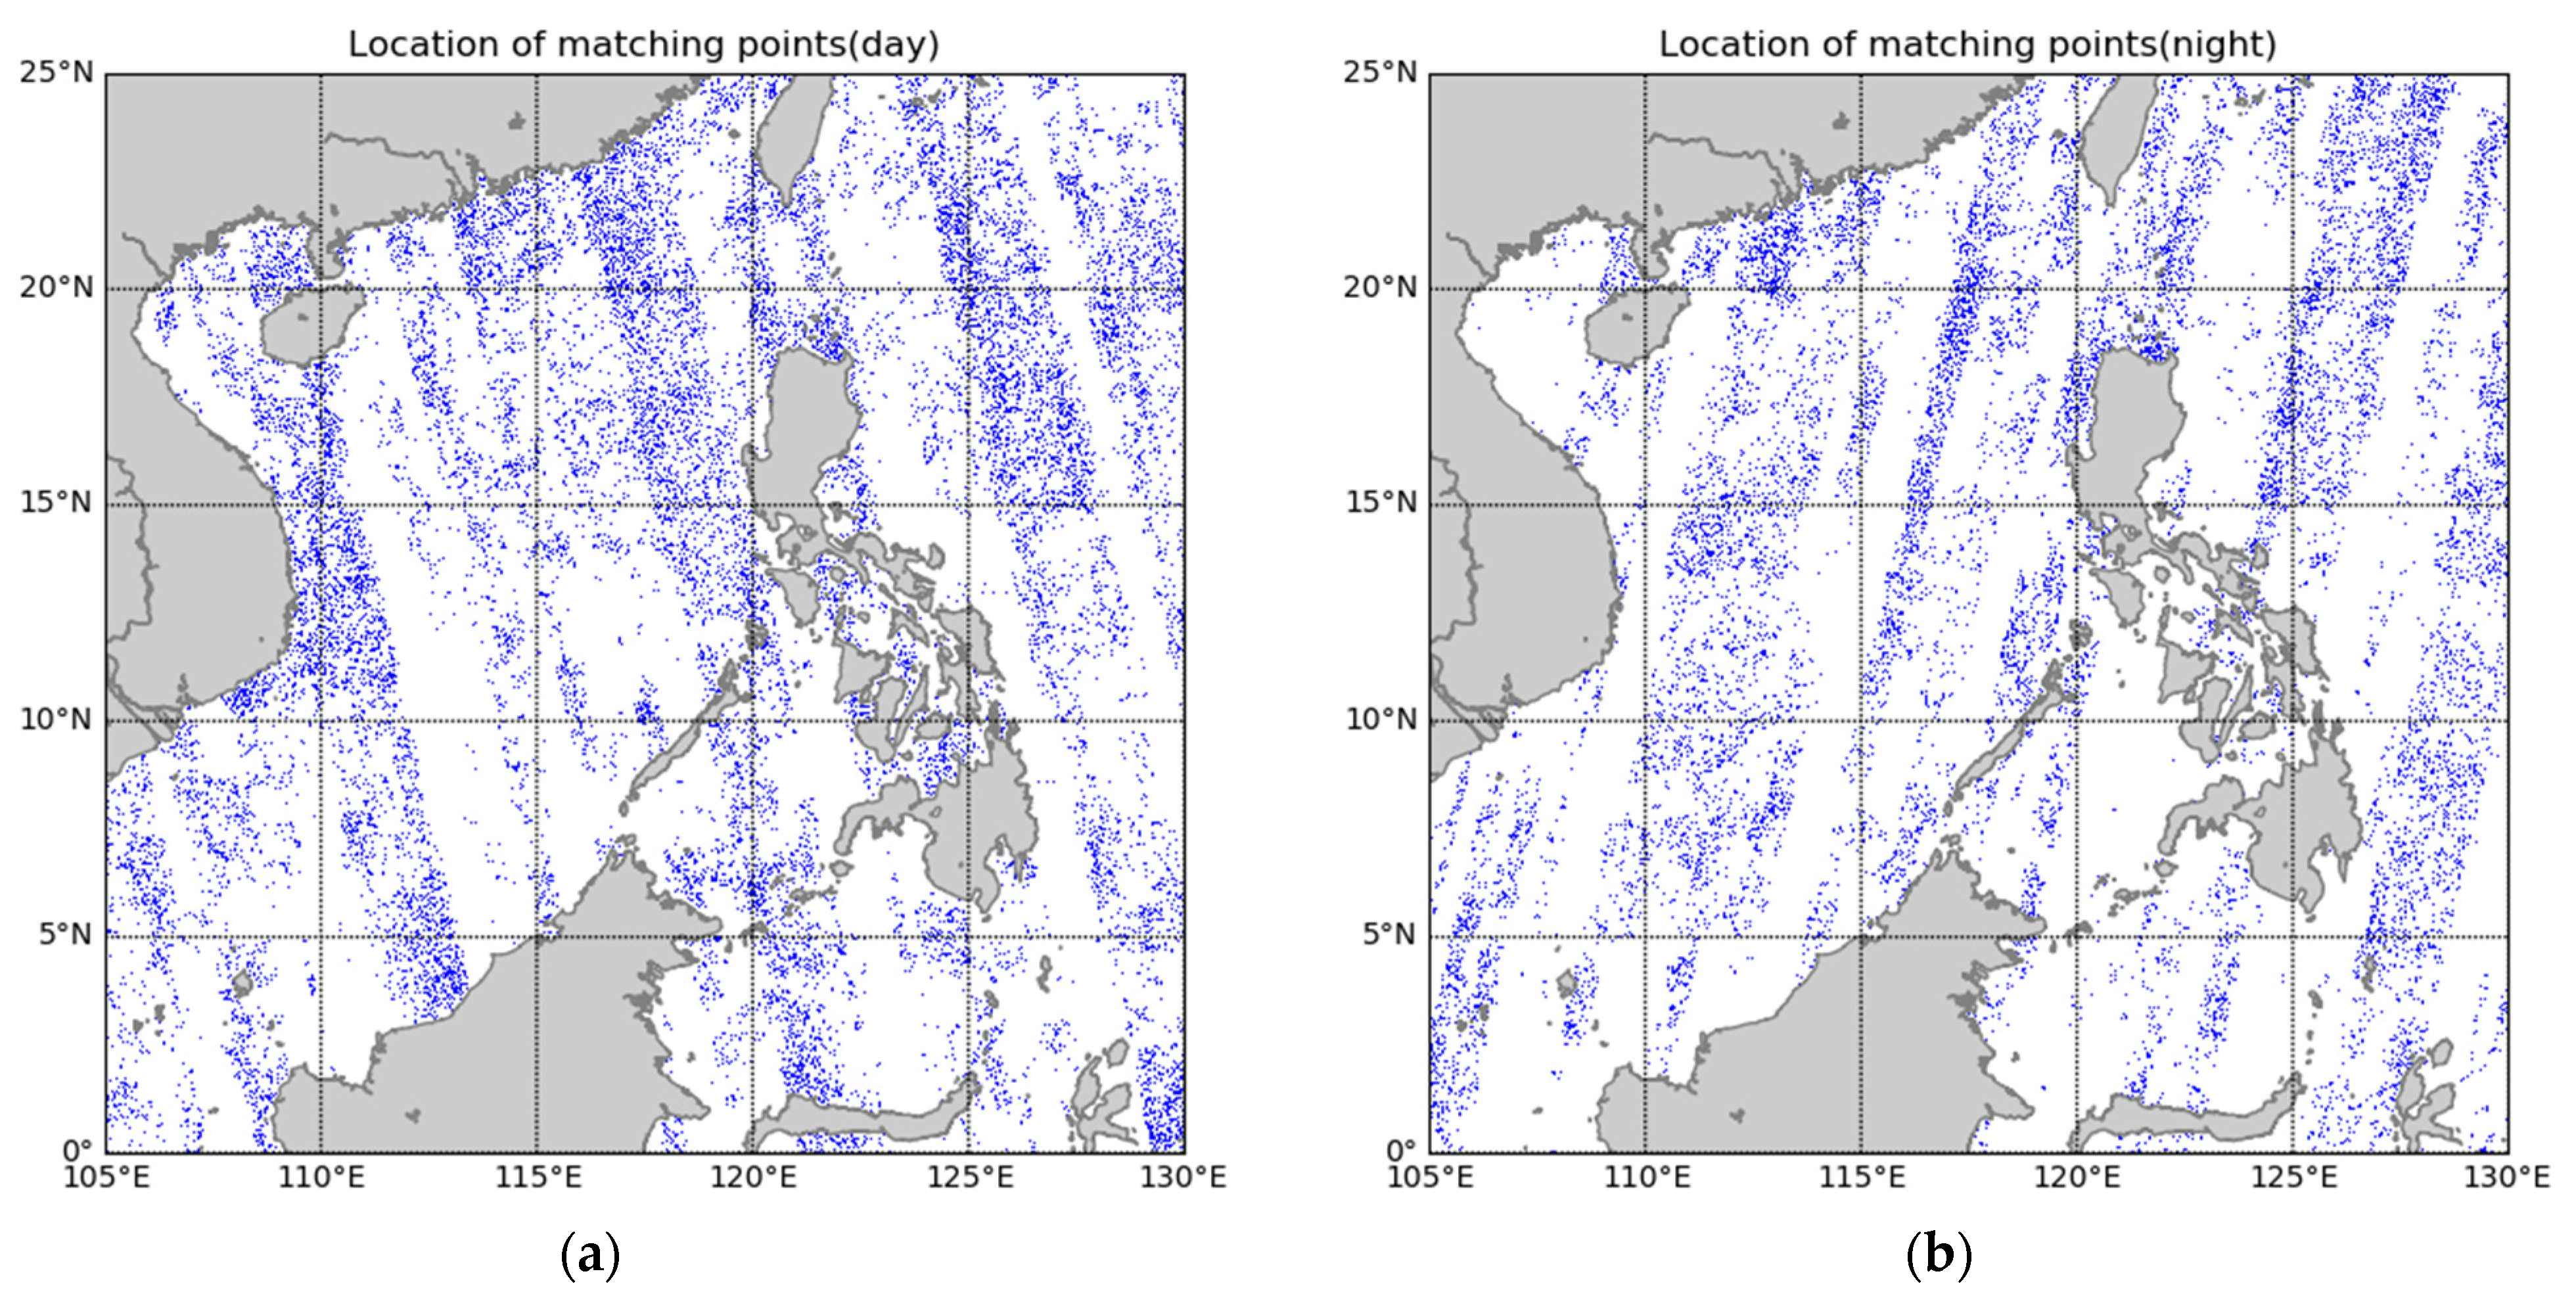
2], a two year period from April 2021 to March 2023 was selected for the cross-calibration study. After selecting the matchups of the thermal infrared data from HY-1D/COCTS and NOAA-20/VIIRS in the South China Sea region for the period April 2021 to March 2023 using the data screening and matching methods described in Section 2.2, a total of 699,479 matchups were obtained. The distribution of matchups is shown in Figure 6, in which the blue points represent the spatial locations of matched pixels. The spatial distribution of matchups has good homogeneity and representativeness.
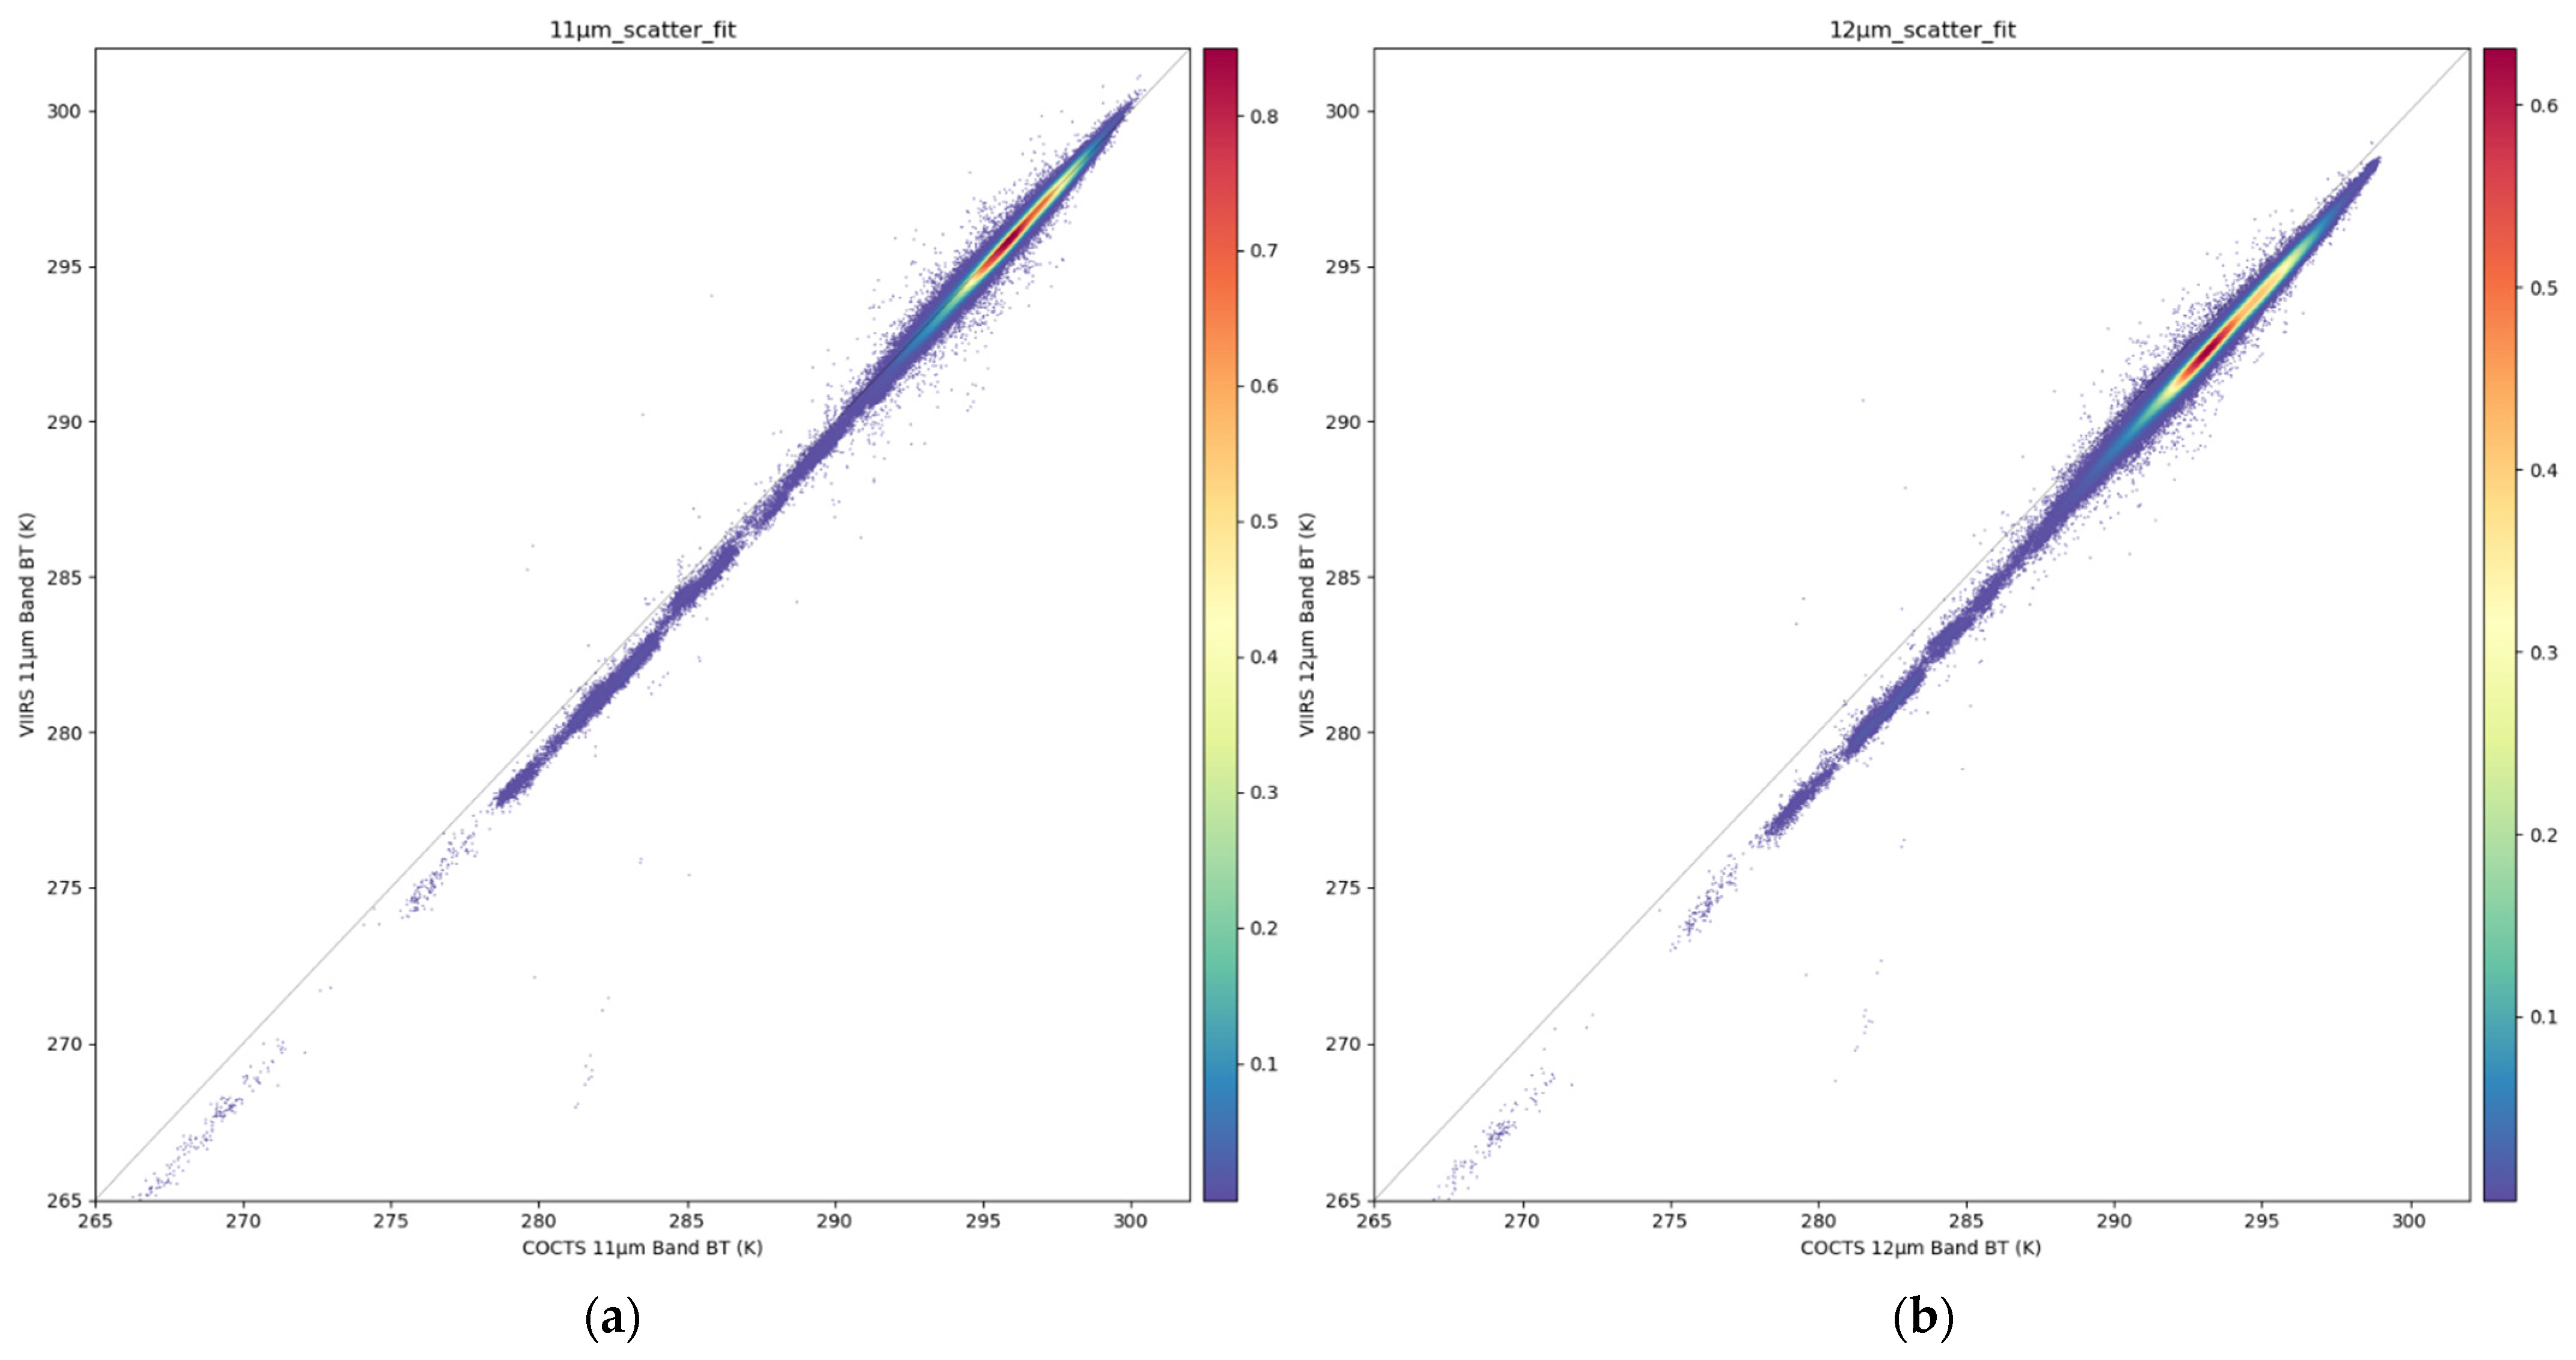
Figure 7 shows the comparison between the BT of the matchups from the two thermal emissive bands of HY-1D/COCTS and NOAA-20/VIIRS. Figure 7 indicates that the BT of the two thermal emissive bands of HY-1D/COCTS are higher compared to NOAA-20/VIIRS, and this difference is more obvious in the 12 μm band. Table 1 shows the comparative statistics. The bias between HY-1D/COCTS and NOAA-20/VIIRS in the 11 μm band is about 0.101 K, which is a good performance of accuracy, and the difference in the 12 μm band is larger, up to 0.892 K.
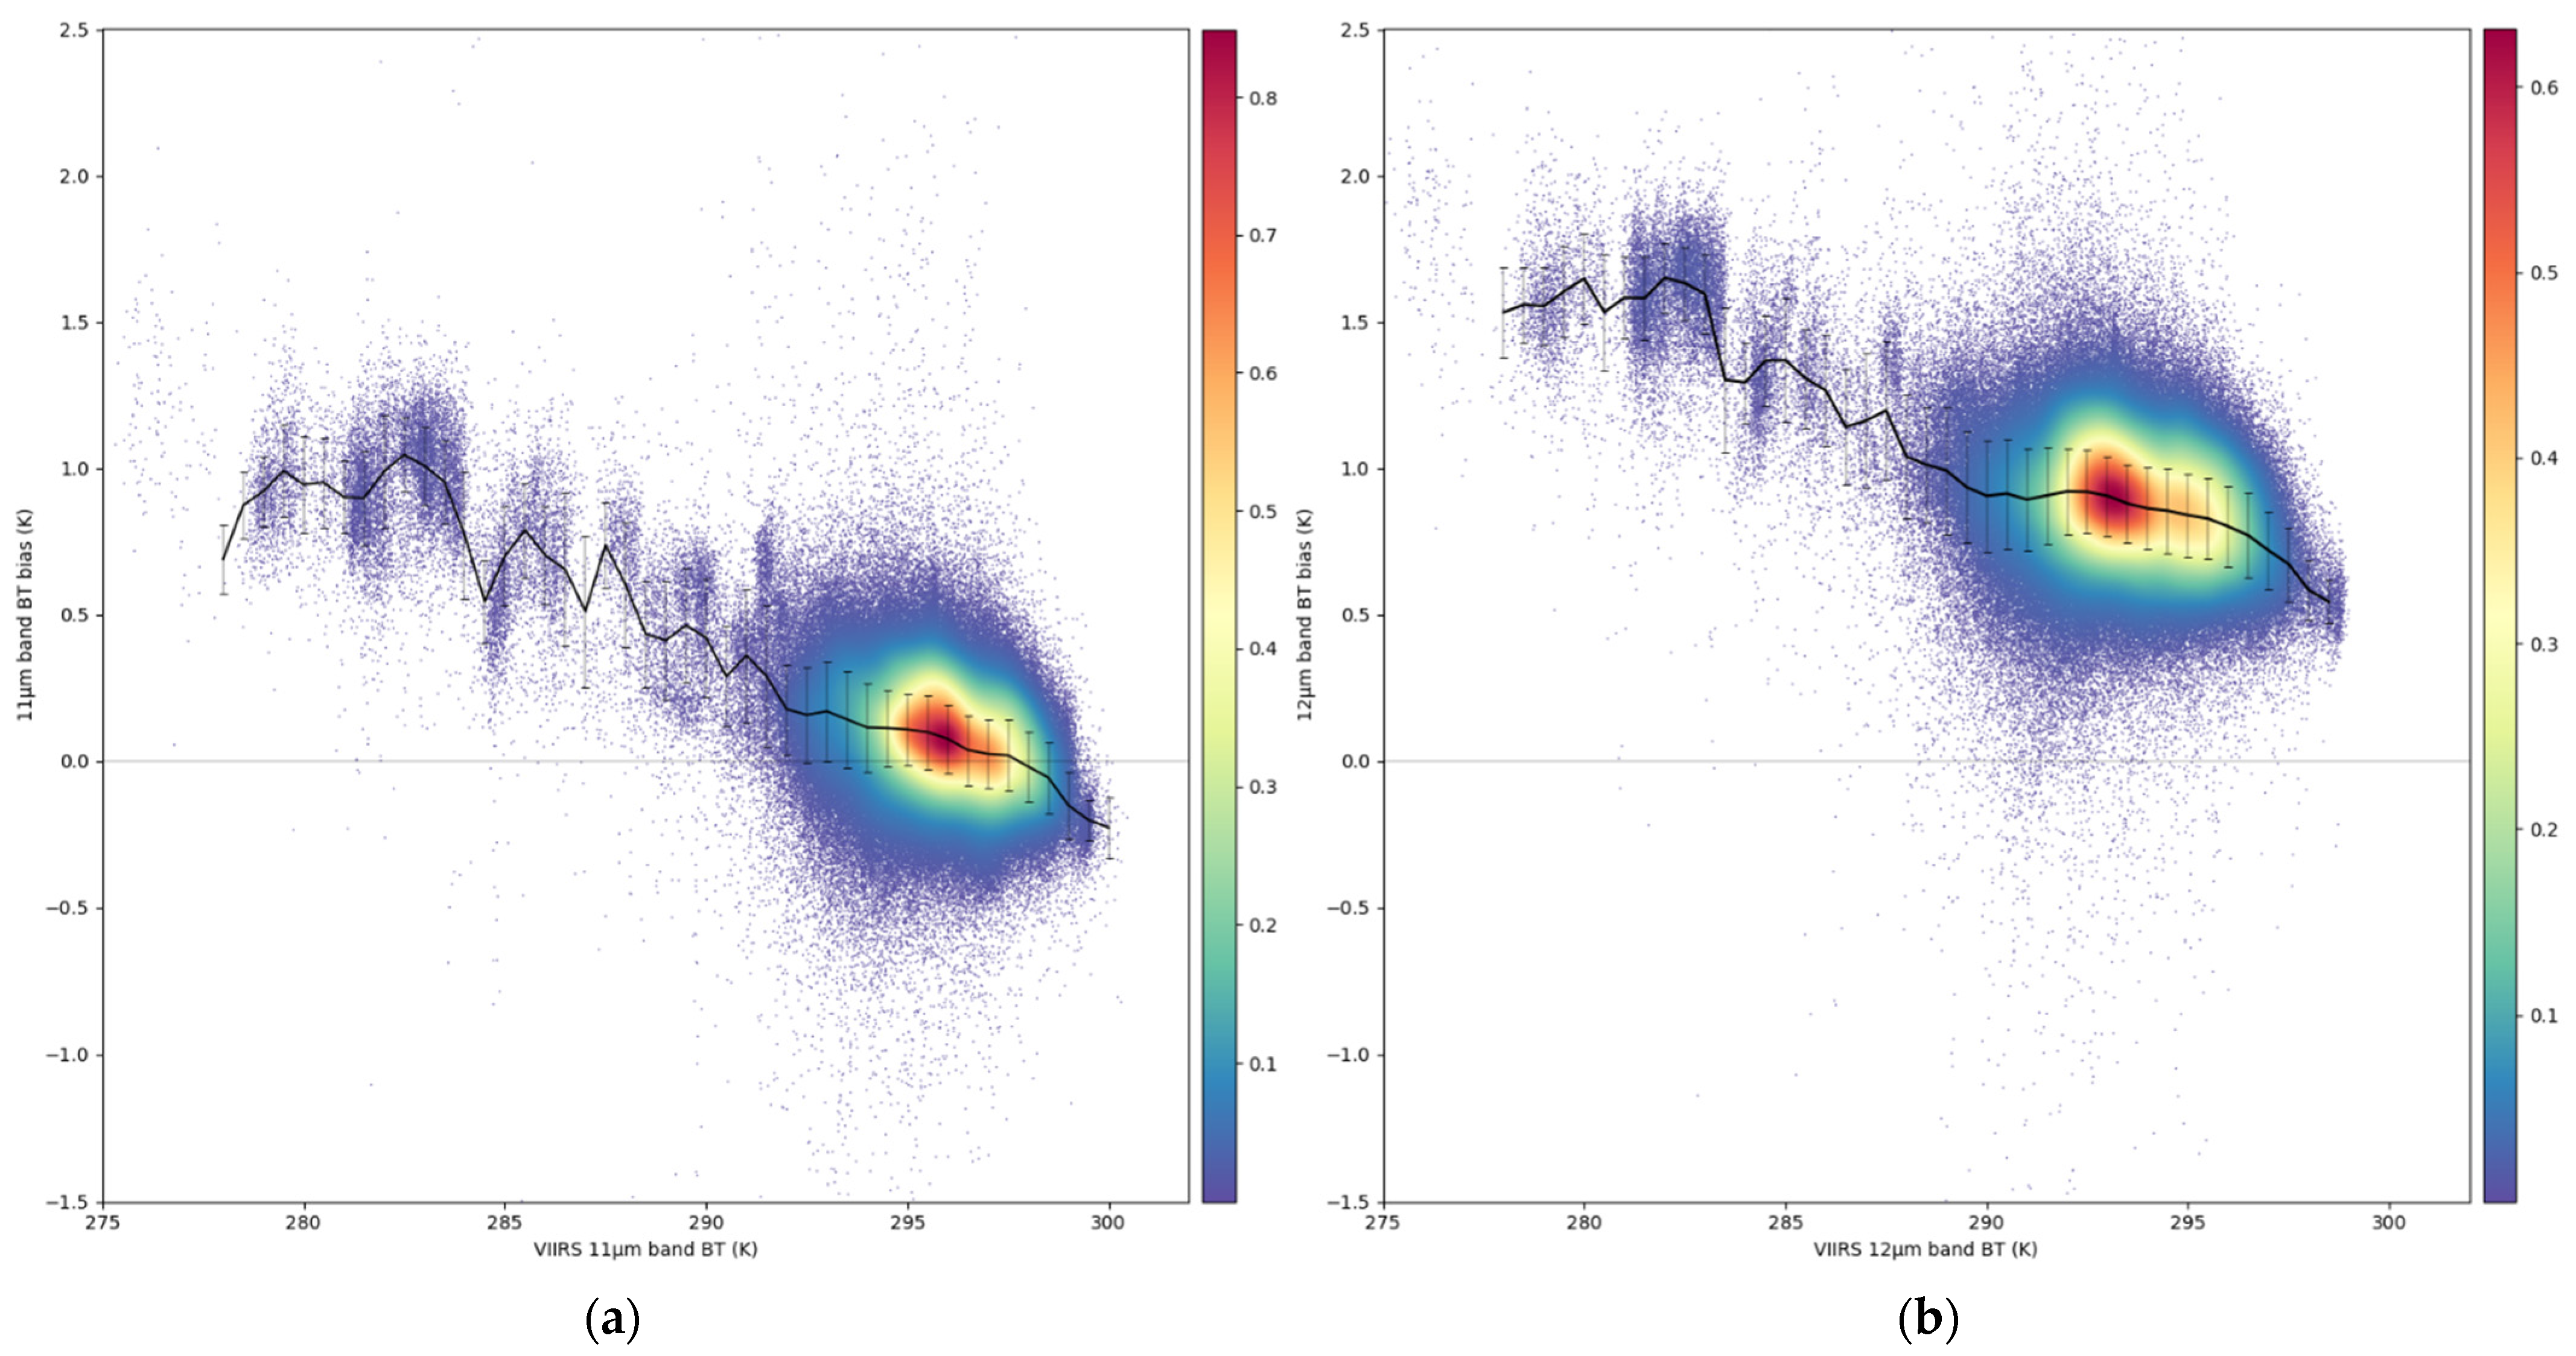
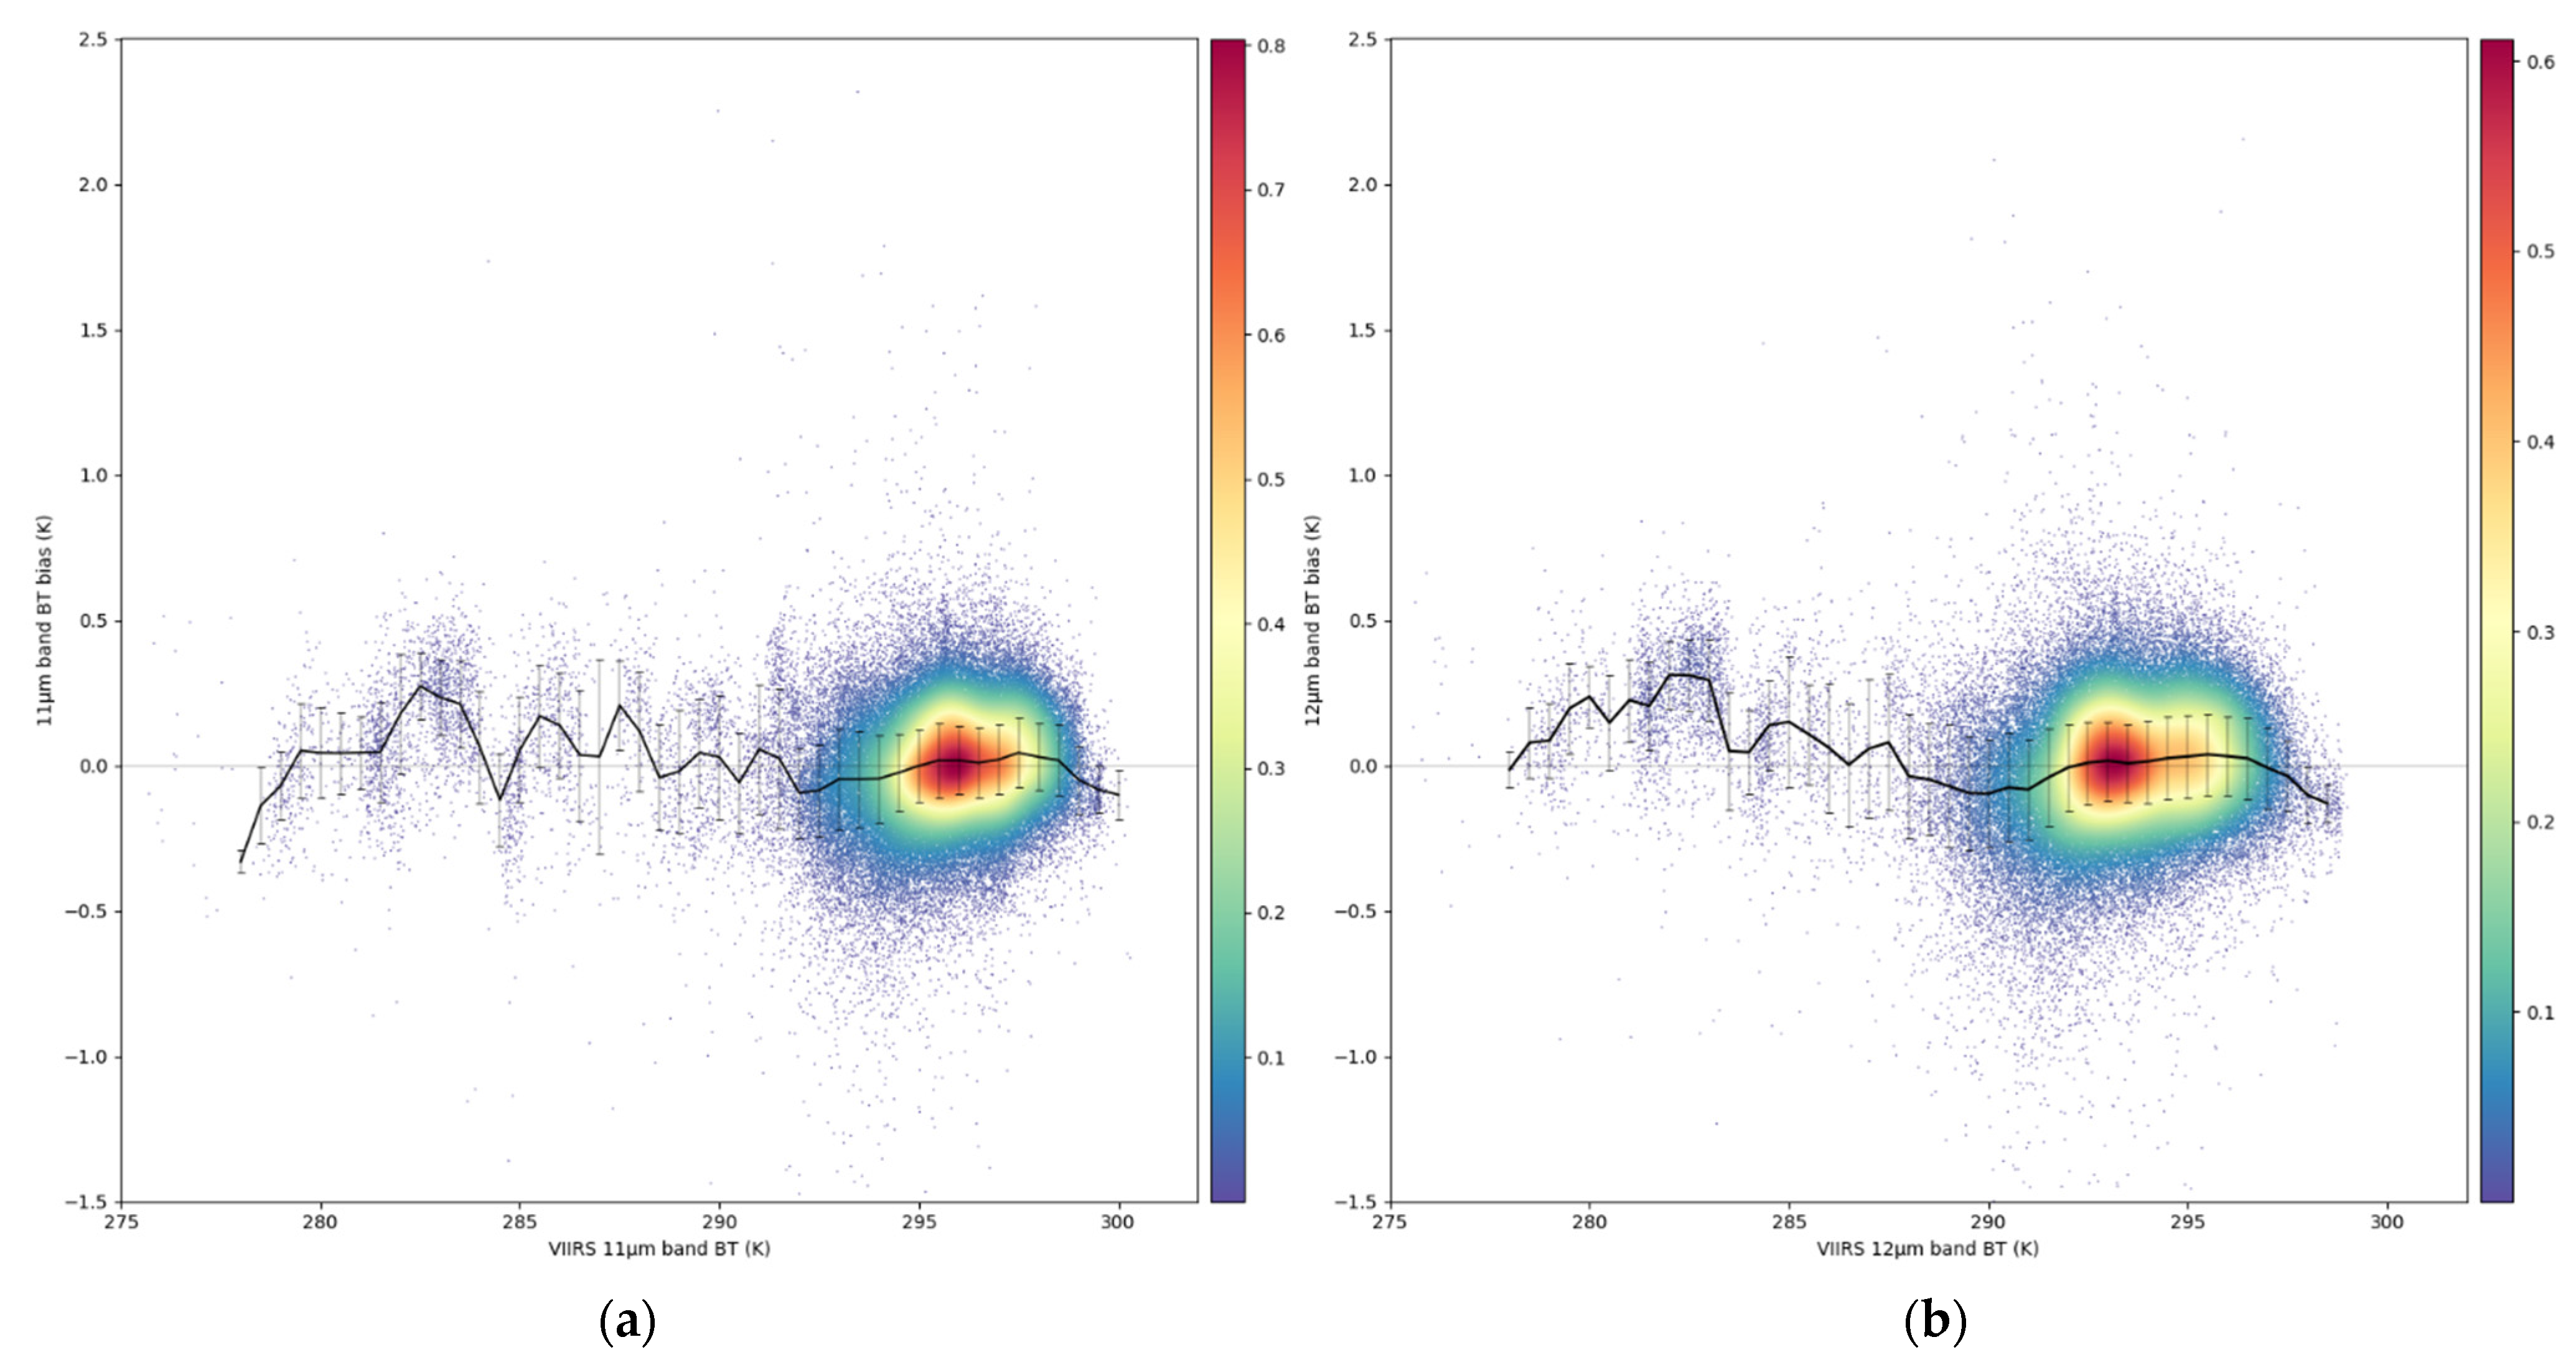
The thermal infrared observations from the two sensors are more consistent in the high temperature range than in the low temperature range, which is further demonstrated in Figure 8. To prevent the effect of individual extremes on the entire dataset, we only consider bins which contain a sizeable amount of data, that is, with more than 50 points in a single interval. Moreover, we exclude bins that have values greater than the sum of the upper quartile and 1.5 times the interquartile range, or less than the lower quartile and 1.5 times the interquartile range from the calculation. The observed difference between the two sensors appears to decrease gradually with increasing temperature. The BT difference in the 11 μm band appears to be more dependent on the scene temperature. When the background temperature varies from 280 K to 300 K, the difference observed in the 12 μm band decreases by approximately 1 K, whereas the difference observed in the 11 μm band decreases by approximately 1.5 K. Furthermore, for background temperatures above 297.3 K, the BT observed by the VIIRS in the 11 μm band exceeds that of the COCTS. This demonstrates the clear temperature dependence of the observation accuracy of the COCTS, which is particularly evident in the 11 μm band.
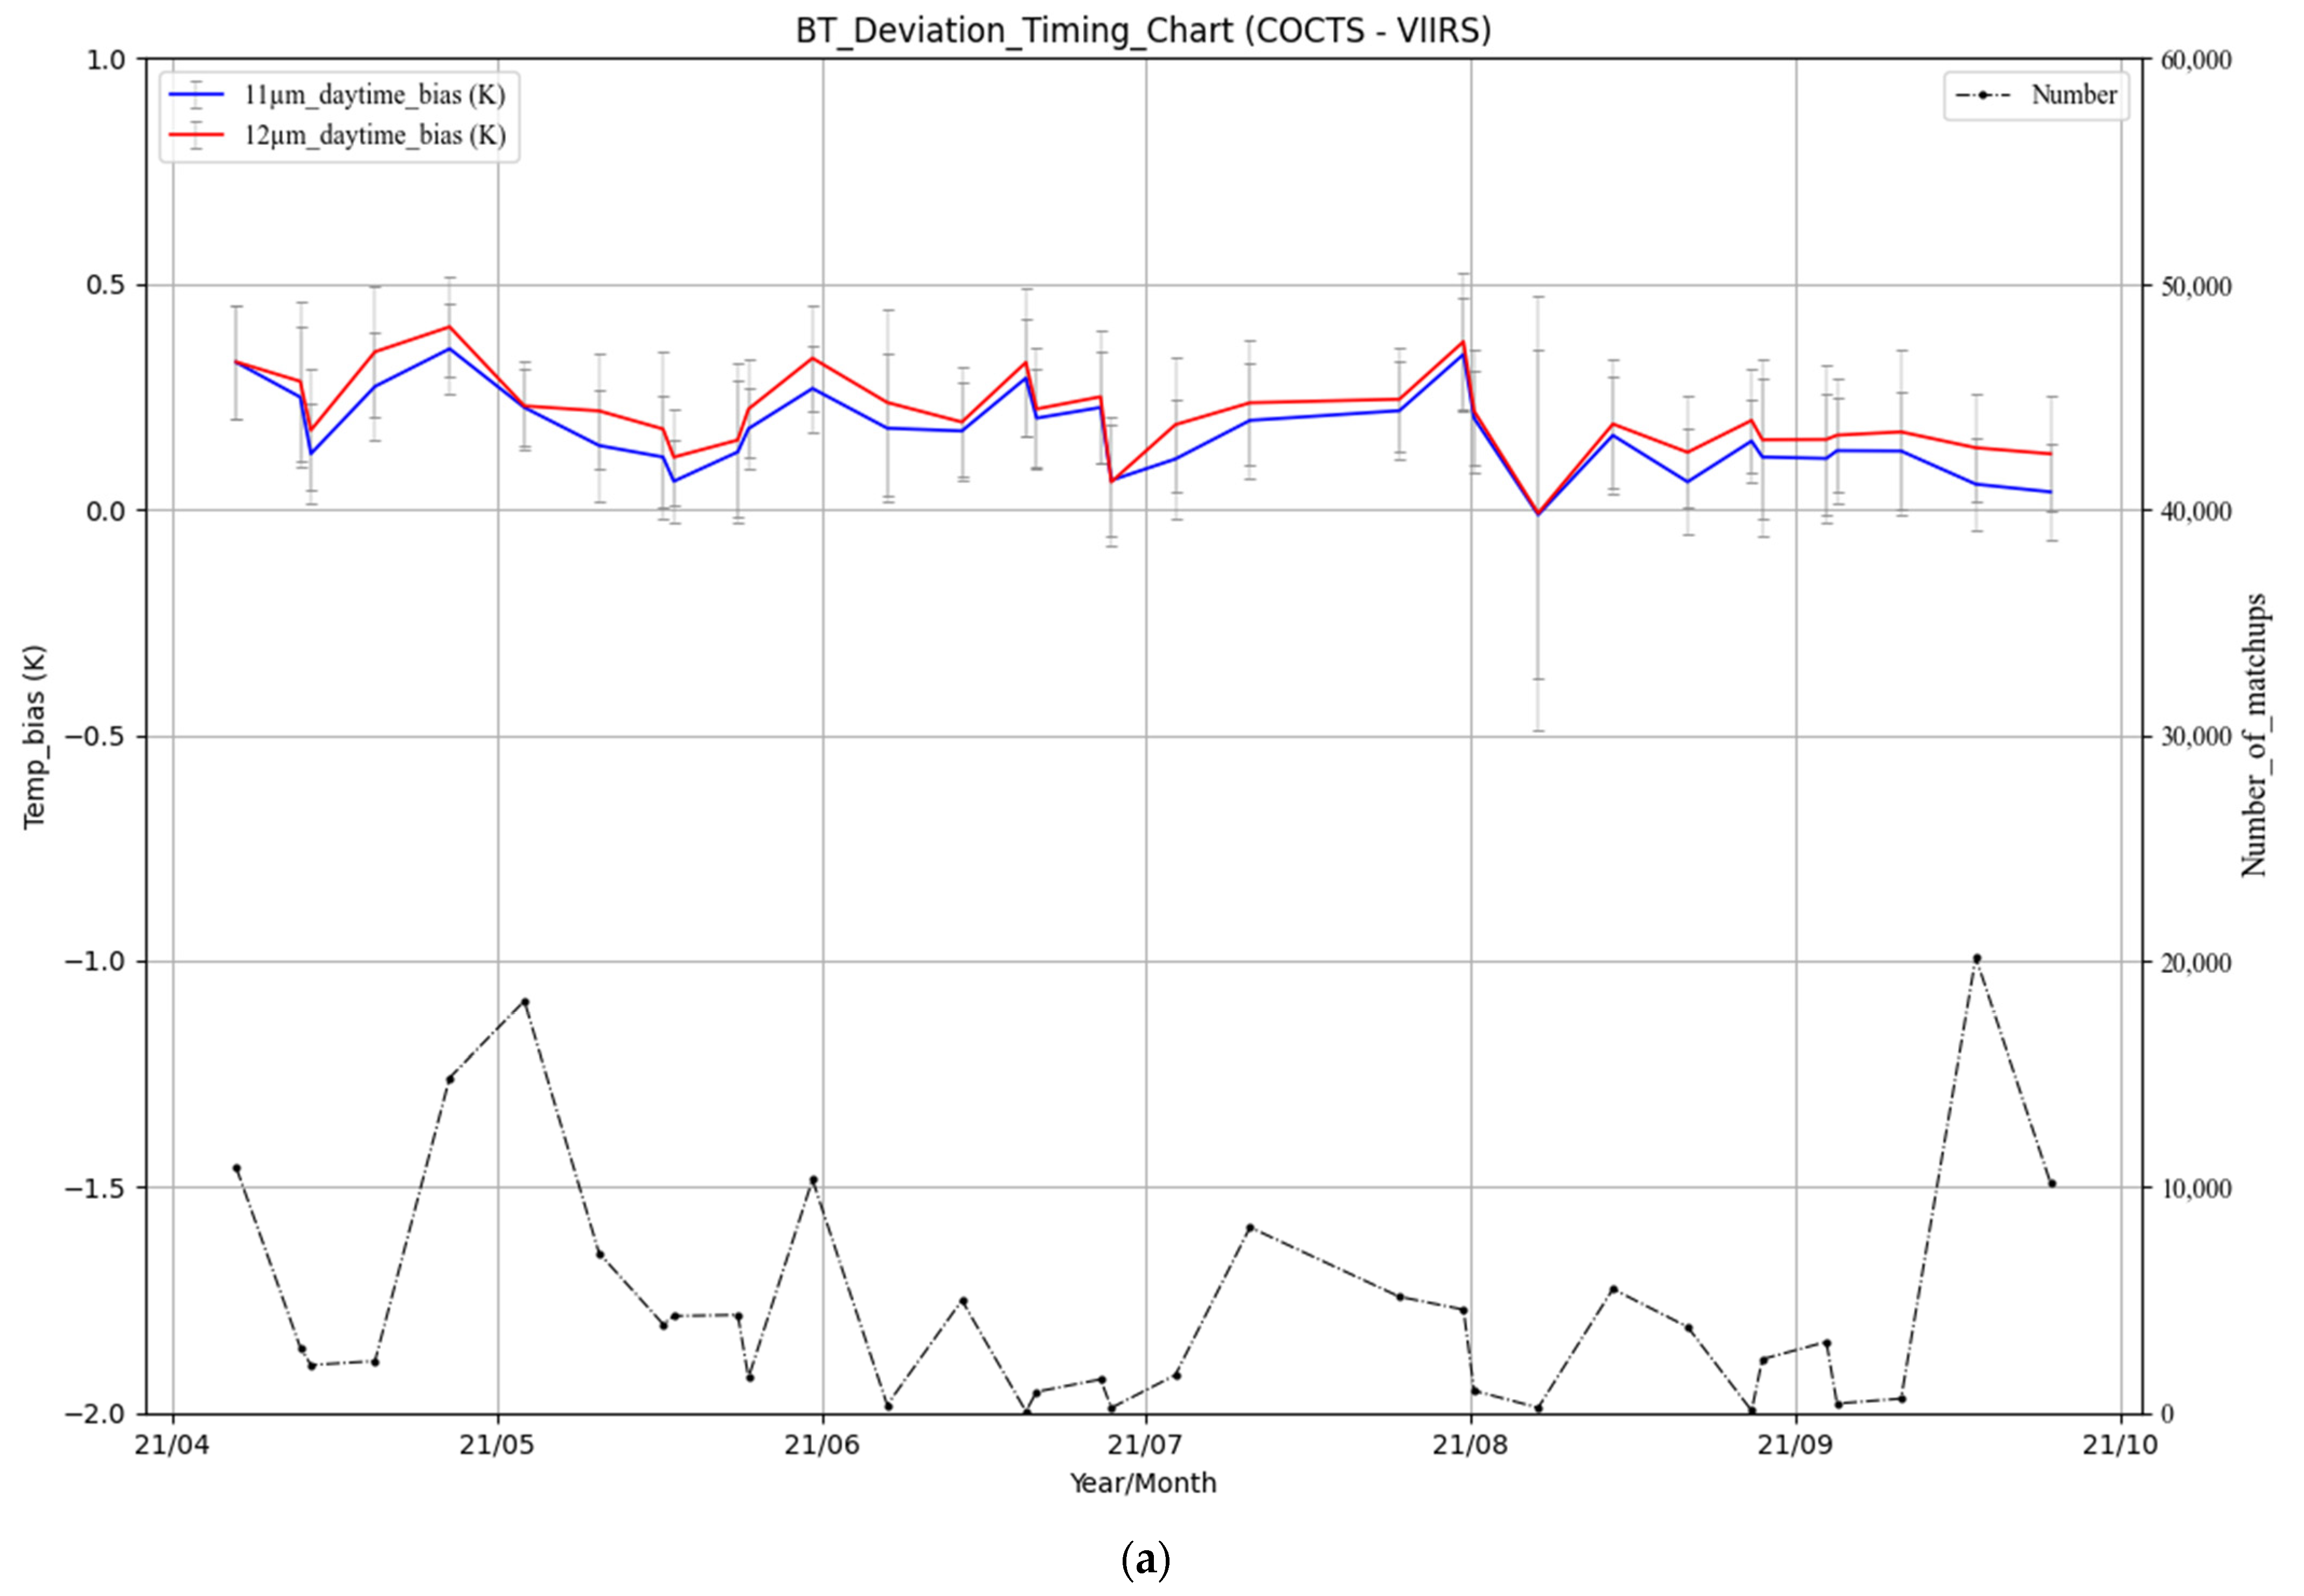
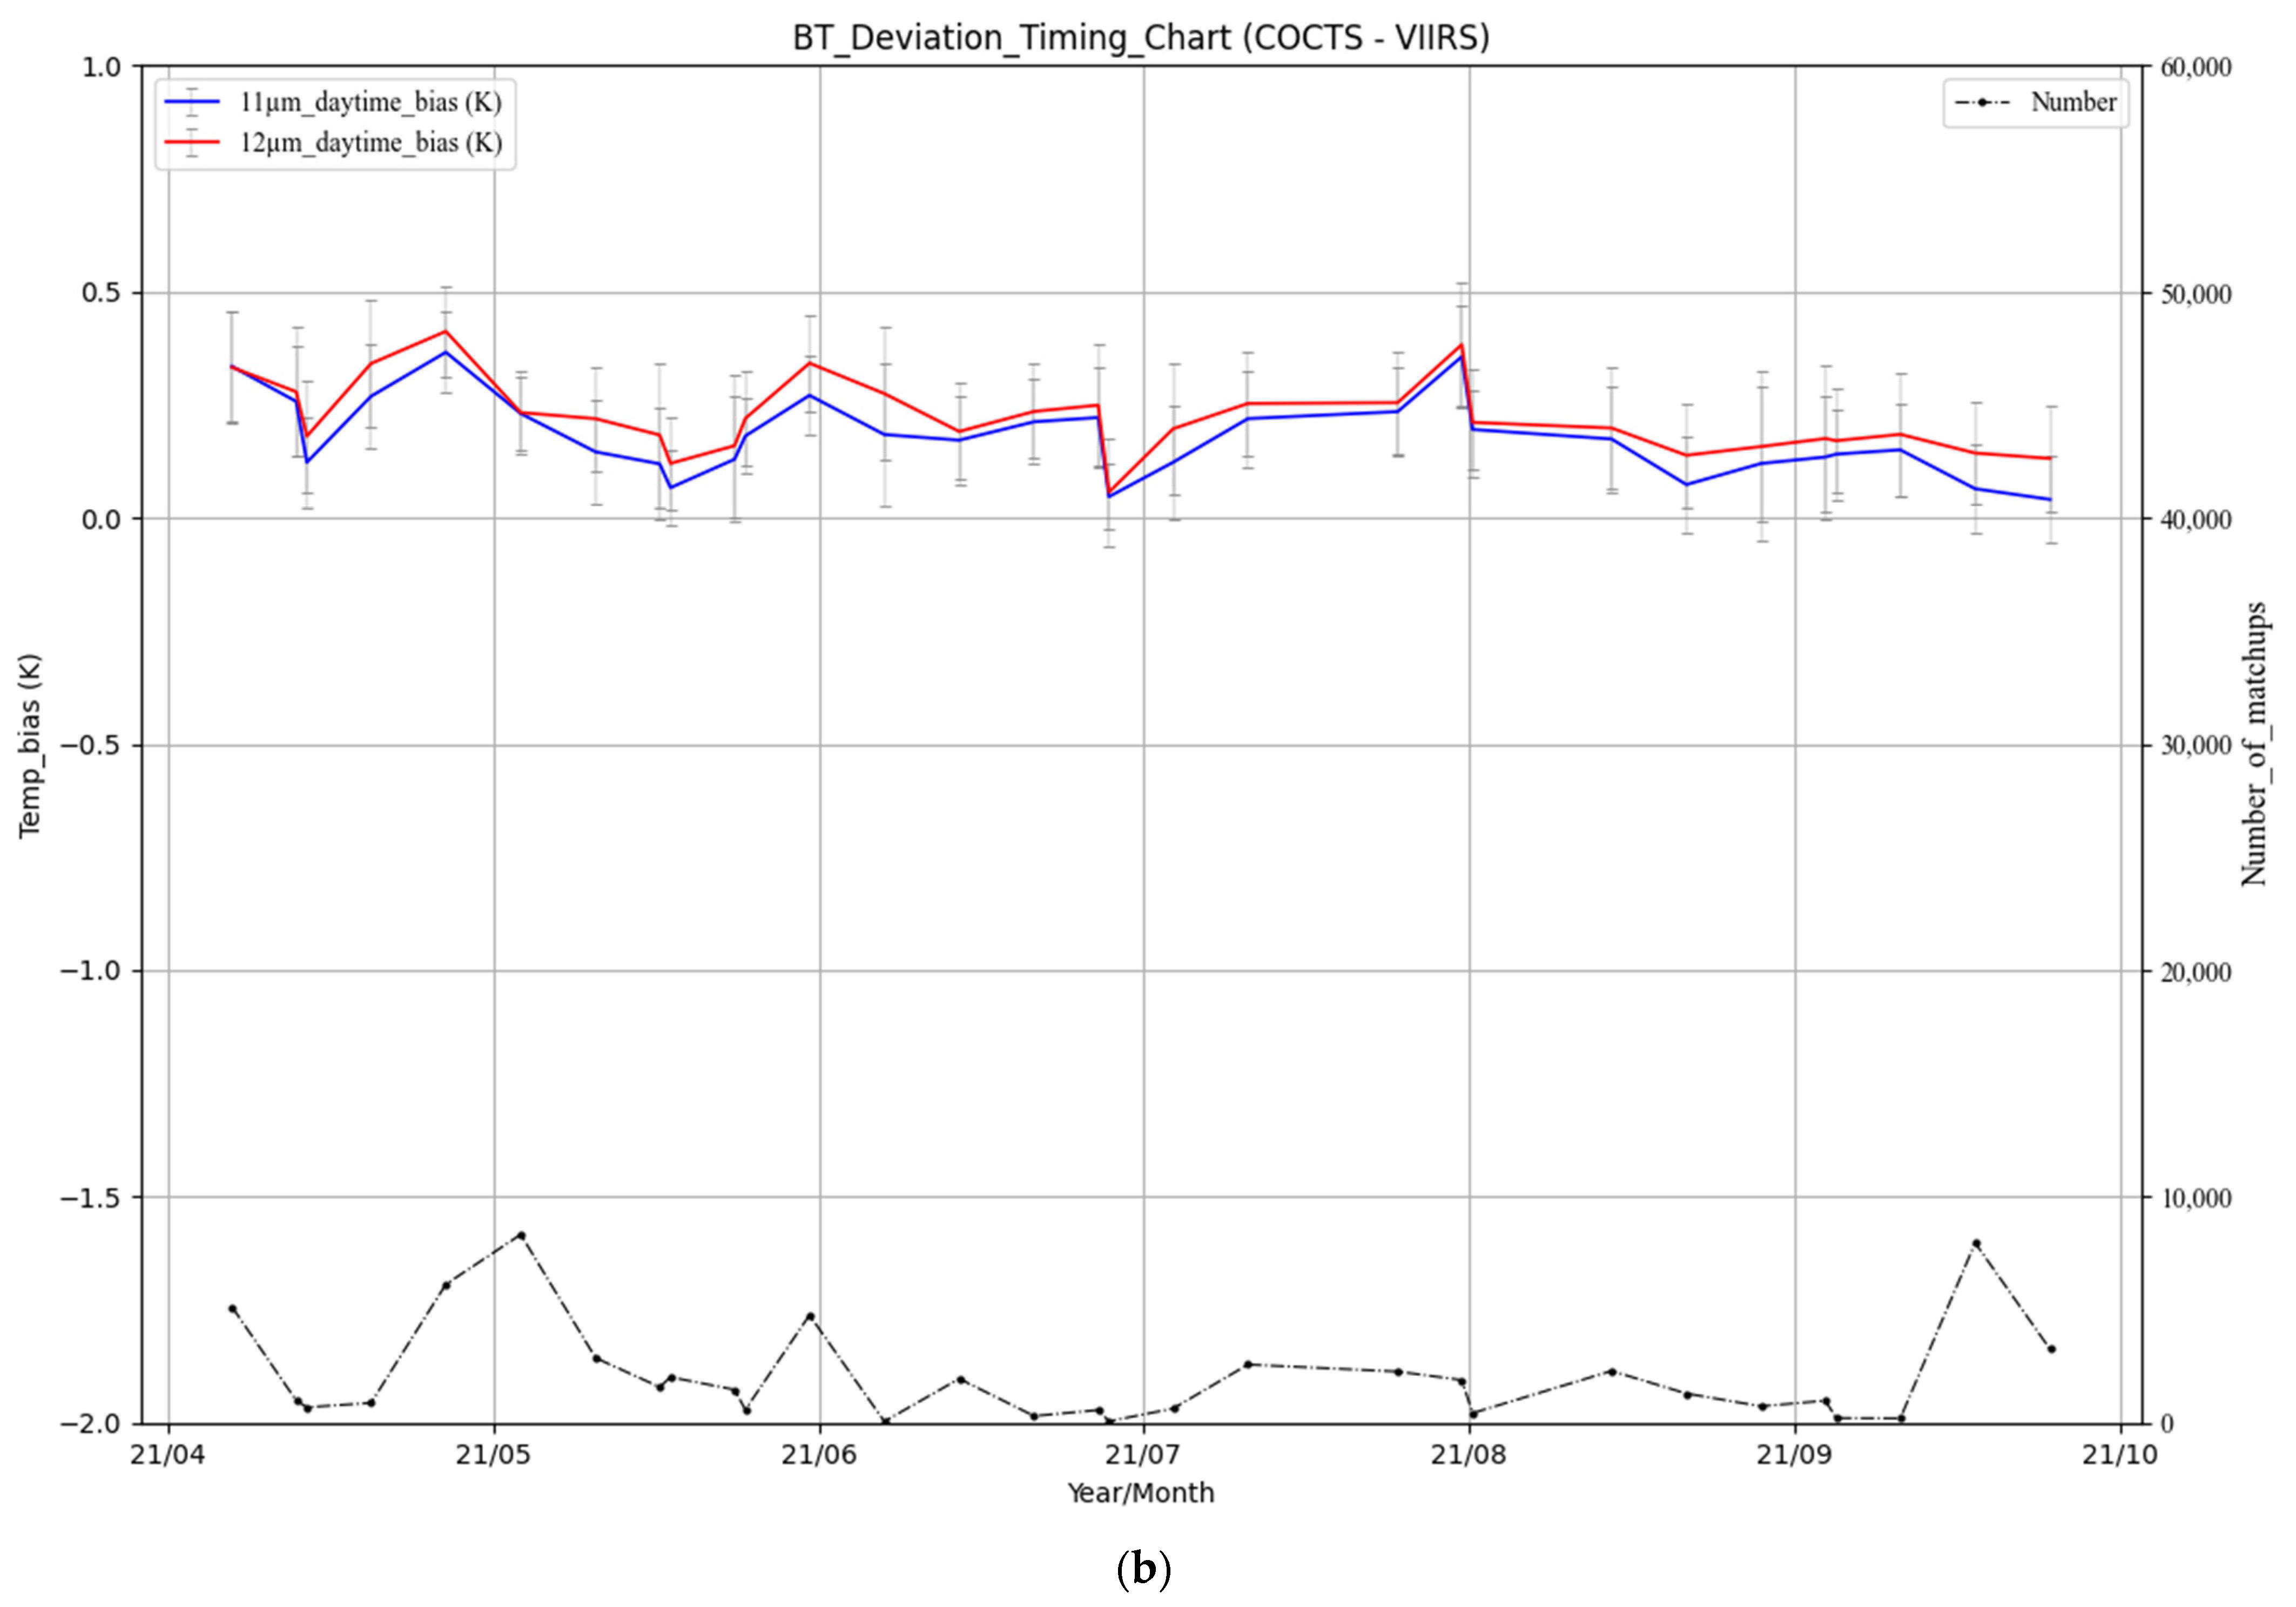
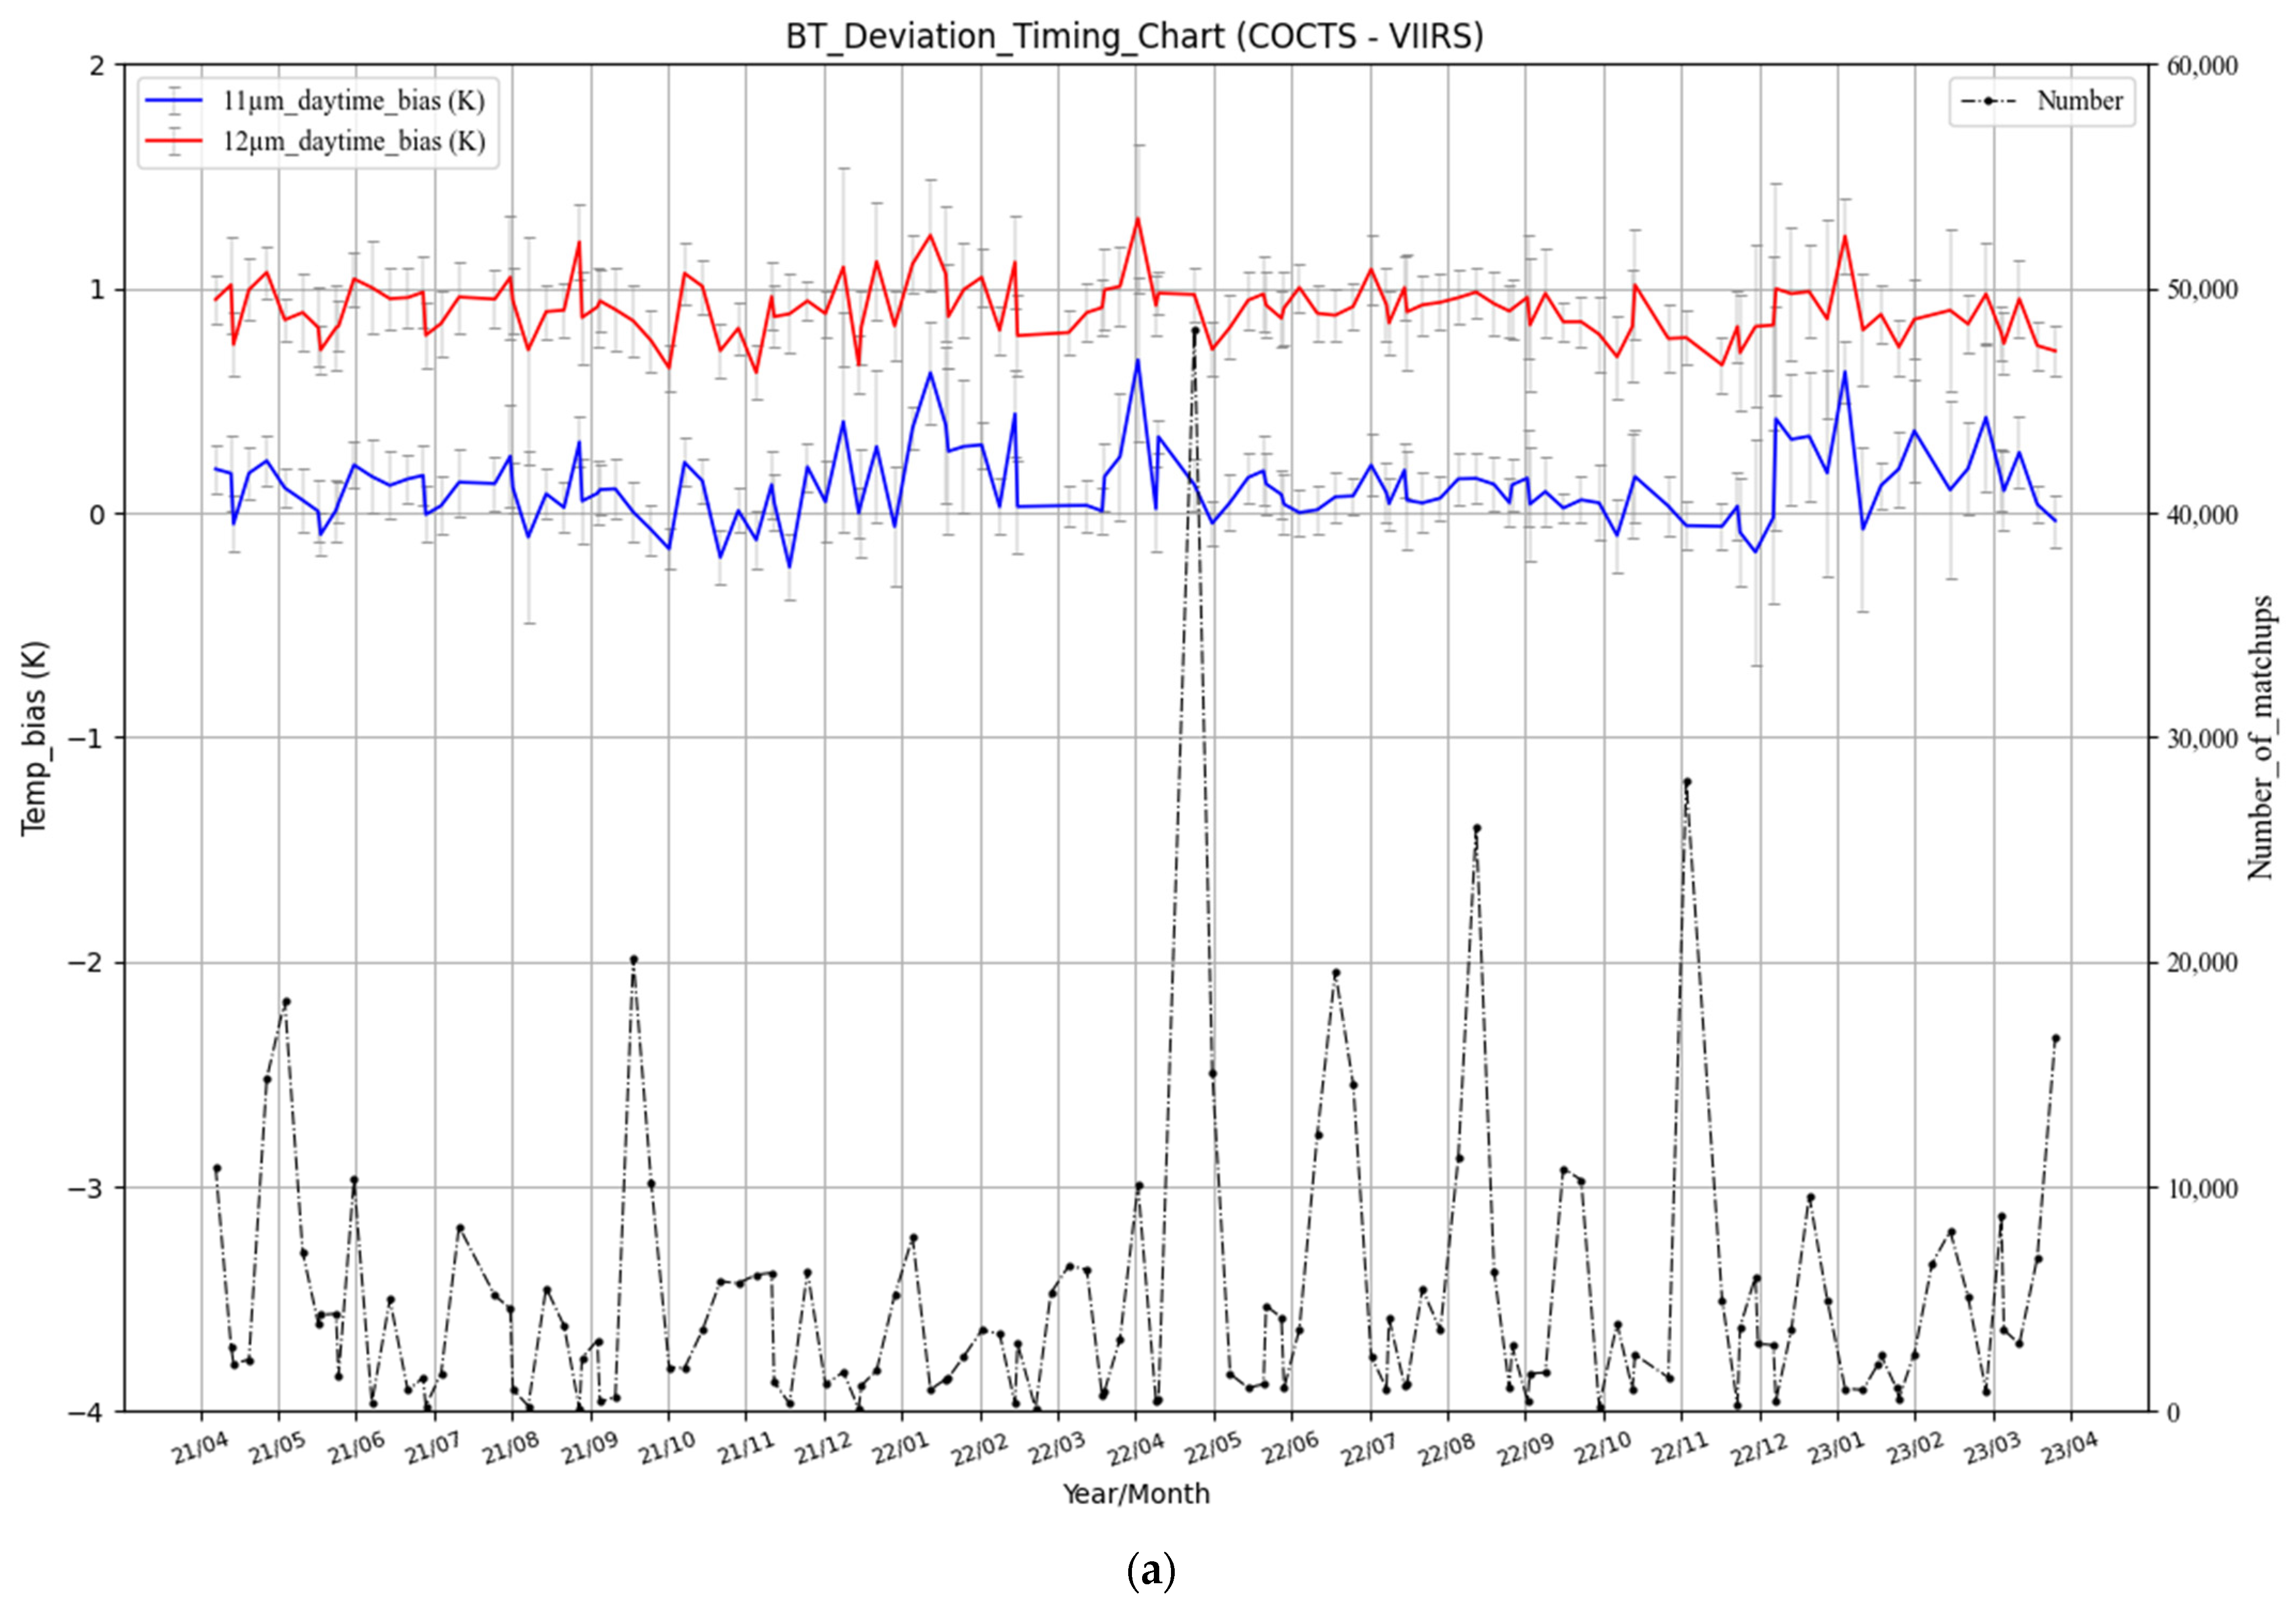
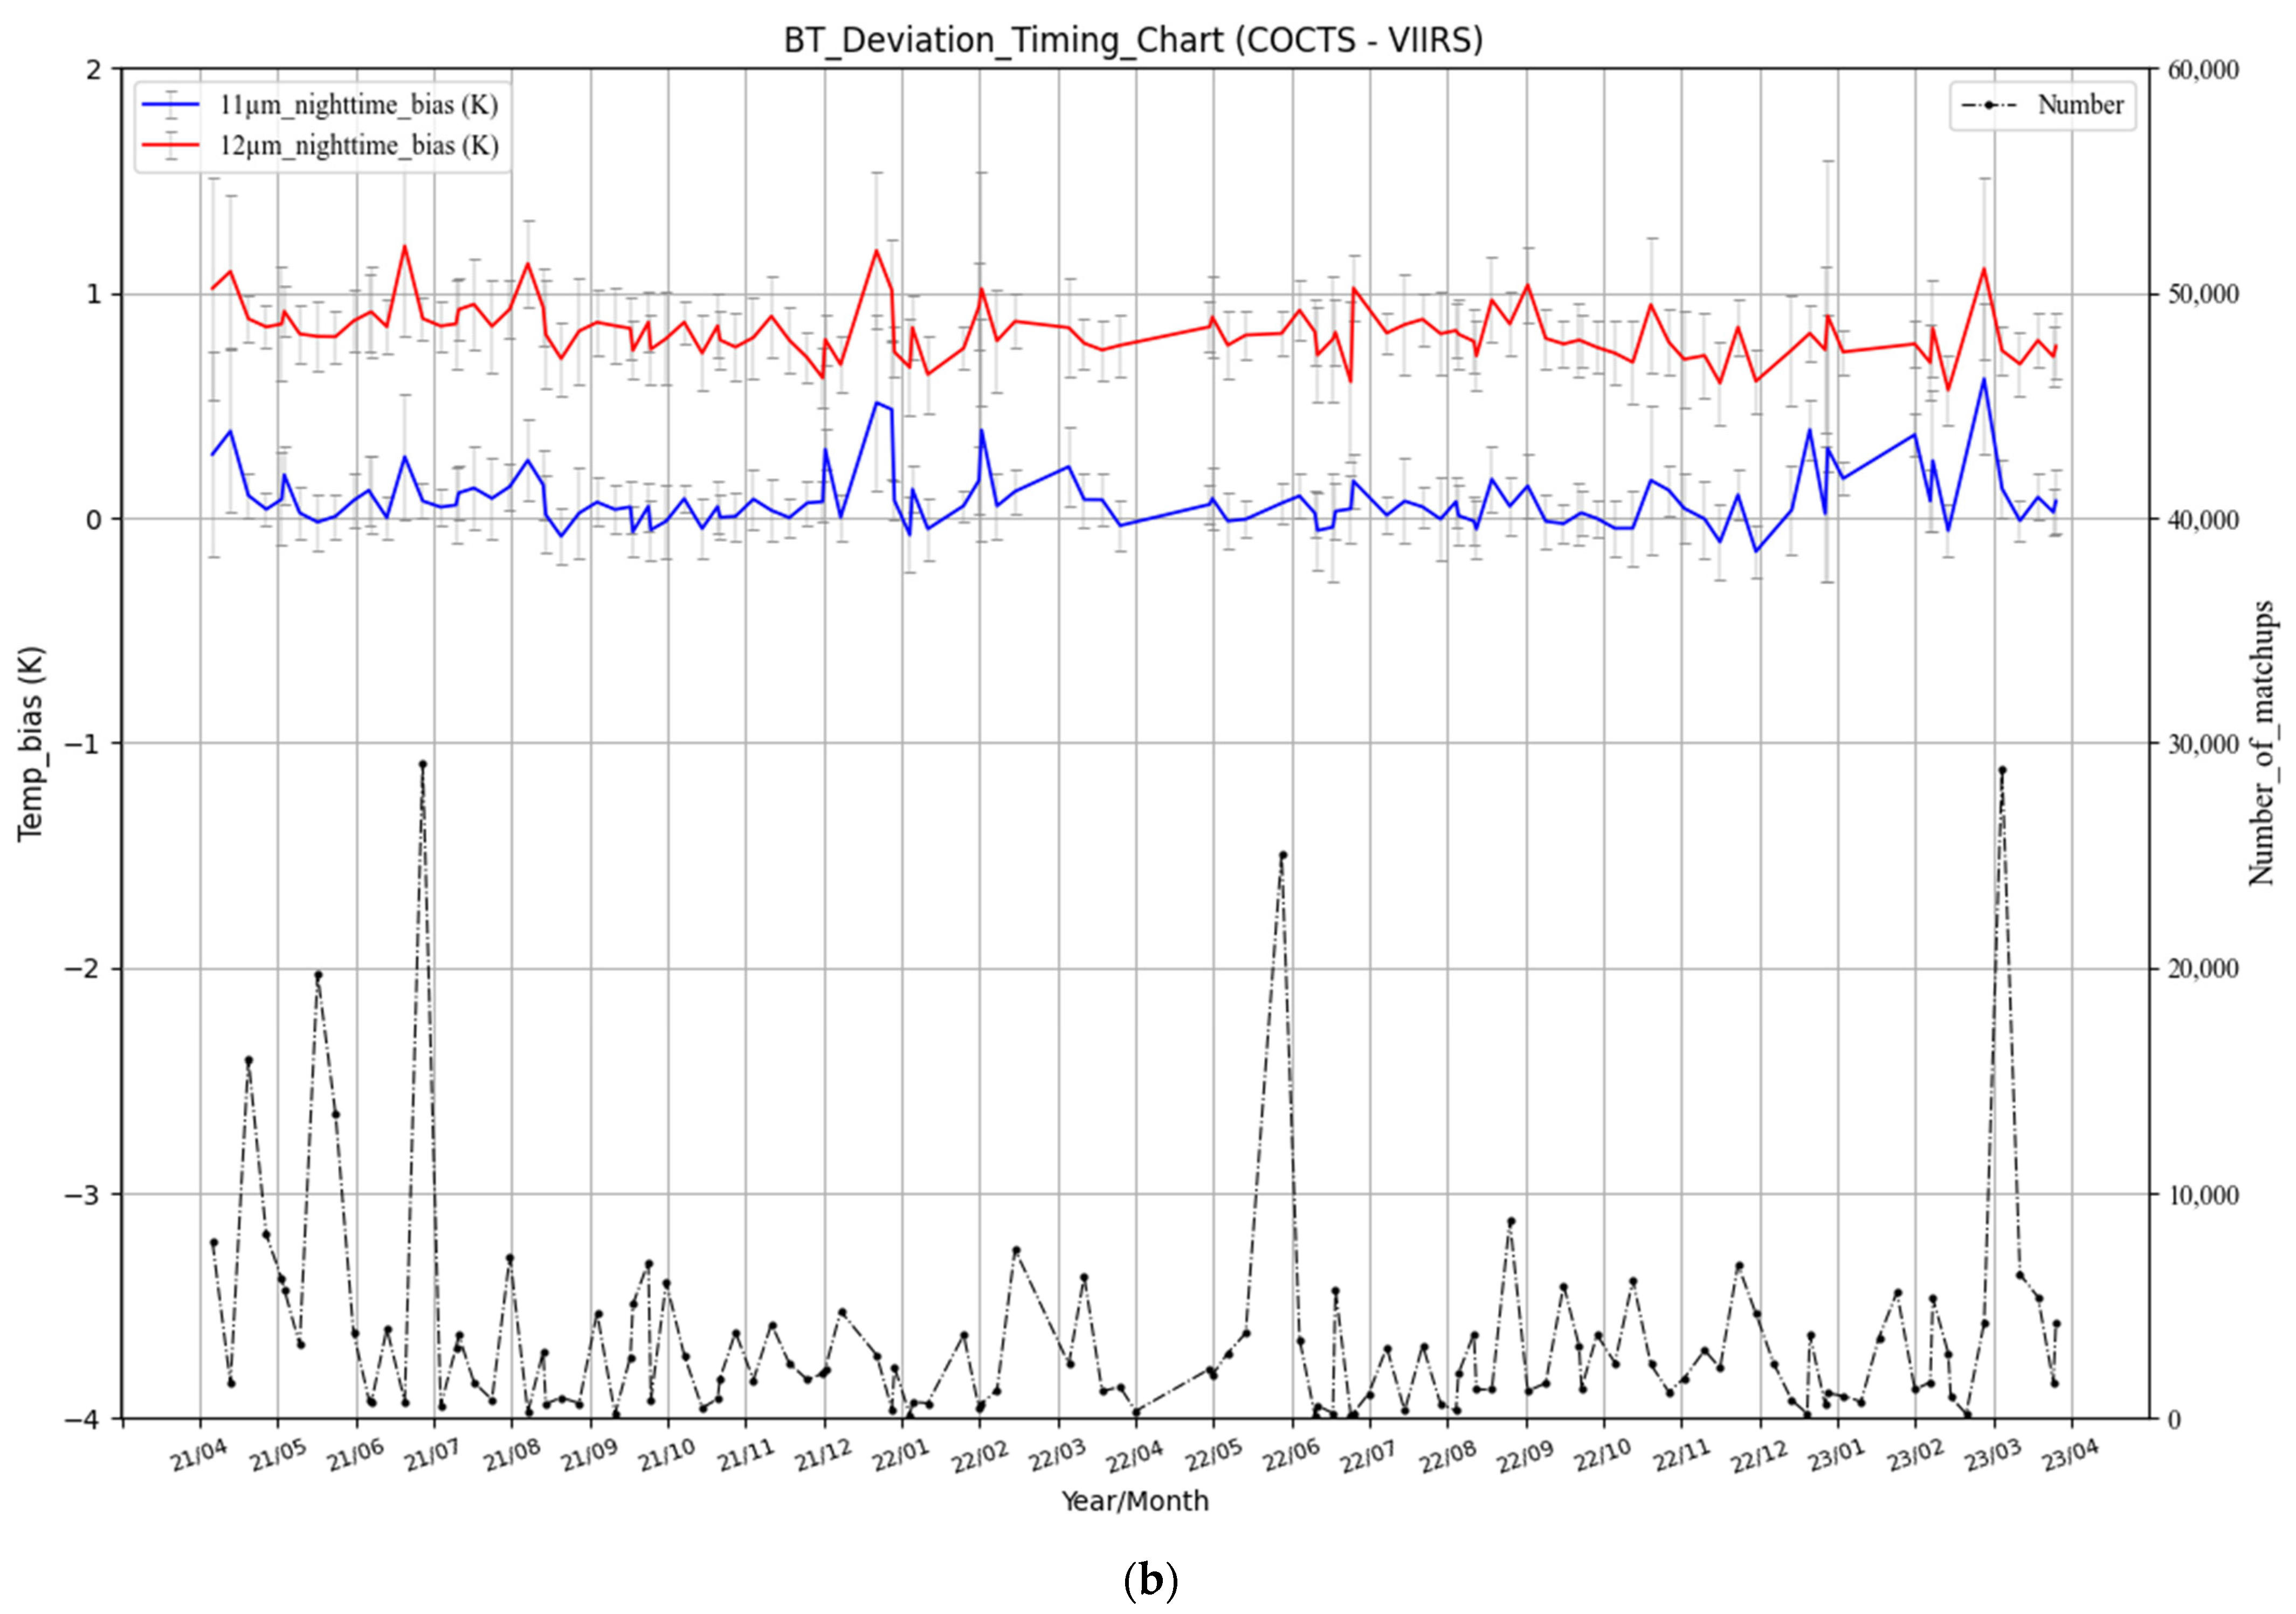
Figure 9 shows a time series variation of the differences between the thermal infrared for NOAA-20/VIIRS and HY-1D/COCTS from April 2021 to March 2023. Figure 9 illustrates the fluctuation range of the observation difference between the two sensors is small and generally stable, with the bias of the 11 μm band around 0.1 K, while that of the 12 μm band is around 0.9 K. The standard deviations of the differences of the two bands both fluctuate above and below 0.2 K.
The data from December to February fluctuate more frequently and more widely than the data from other months, as evidenced by an increase in the observed BT difference between the COCTS and the corresponding thermal emissive bands of the VIIRS on some dates.
Considering the temperature dependence of the observational accuracy of the COCTS thermal emissive bands, which has been found in Figure 7 and Figure 8, it is conjectured that the increase in the frequency and range of fluctuations may be caused by the phenomenon of cold bias, and the average BTs for the date of occurrence of the peak of the discrepancy in the calibration dataset are compared with the average of the observed BTs for the other dates in the same month. For example, the peak of the difference occurred in the daytime of 12 January 2022 and the night of 22 December 2021. The average BT of the matchups during the daytime of the whole month of January was 291.93 K, while on 12 January, the average temperature of the daytime pixels was only 283.86 K, which was significantly lower than the monthly average; the same phenomenon also occurred on the night of 22 December 2021, whose average BT of the pixels was 287.57 K, while the average BT for the December night was 293.11 K. Compared with other data in the same month, the BTs on the dates of the peaks in the differences are the lowest values, and thus the increased bias of the observations between December and February is mainly attributed to the temperature dependence of the observed BTs of the COCTS thermal emissive bands in Figure 8, i.e., when the temperature is lowered, the observed values of the HY-1D/COCTS thermal emissive bands will be more biased from the NOAA-20/VIIRS, and the low-temperature data result in increased observational variability due to significantly more cold regions in the matched data for December, January, and February compared to March to November.
In general, except for a small fluctuation caused by the cold bias of the sensors, the bias of the observed values of HY-1D/COCTS and NOAA-20/VIIRS has remained in a relatively stable state during the study period.
The matched data from HY-1D/COCTS and NOAA-20/VIIRS are fitted using robust linear regression to obtain the radiometric correction factors for HY-1D/COCTS in the thermal emissive bands. The fitting function is shown in Equation (1):
B T V I I R S B T V I I R S B T C O C T S = c o e f × B T C O C T S + o f f s e t
where B T V I I R S and B T C O C T S are the original observed BTs corresponding to the calibration points of VIIRS and COCTS, respectively. B T V I I R S and B T C O C T S represent the BTs of VIIRS and COCTS simulated by the MODTRAN using the ERA5 data as the input source, respectively, and their difference and the original observed value of VIIRS are made to eliminate the spectral response differences between sensors. We used 80% of the calibration dataset for coefficient fitting, with the remaining 20% serving as the evaluation dataset to independently validate the calibration results. Table 2 displays the fitting results of the calibration dataset.
Applying the calibration coefficients to the evaluation dataset, the result is demonstrated in Figure 10, from which it can be seen that the scattered data are centered on the diagonal line rather than below the diagonal line as previously. Since the 11 μm band of the two sensors are well matched by themselves, the improvement of the BT after calibration of the 11 μm band is relatively small. However, the bias of the BT is significantly diminished after calibrating the 12 μm band. The standard deviations of the 11 μm and 12 μm bands after calibration are also reduced. Figure 11 shows that the temperature dependence of the thermal emissive bands of COCTS is also eliminated after calibration. The statistics after calibration are shown in Table 3. It can be seen that after calibration, the bias of BT of COCTS and VIIRS in both the 11 μm and 12μm bands drops to about 0 K, and the standard deviation of the difference in both bands is about 0.2 K.

4. Evaluation of Cross-Calibration Results

We validate the double-difference method cross-calibration results using an evaluation dataset independent of the coefficient fitting data. The validation results demonstrate that the calibration coefficients obtained can effectively correct the BT of the HY-1D/COCTS thermal emissive bands, this affirms the accuracy of the calibration process and the representativeness of the calibration conclusions. To improve the reliability of the calibration conclusions and to avoid the influence of the intrinsic errors of the VIIRS data on the calibration coefficients, it is necessary to introduce a reliable third data source to assess the accuracy of the COCTS thermal infrared data corrected by the calibration coefficients. Based on the considerations of the reliable calibration accuracy of CrIS and the fact that it is on the same satellite platform as VIIRS, the hyperspectral data of NOAA-20/CrIS are selected as the third-party reference data to further assess the cross-calibration of the thermal emissive bands of HY-1D/COCTS.

4.1. Evaluation Method

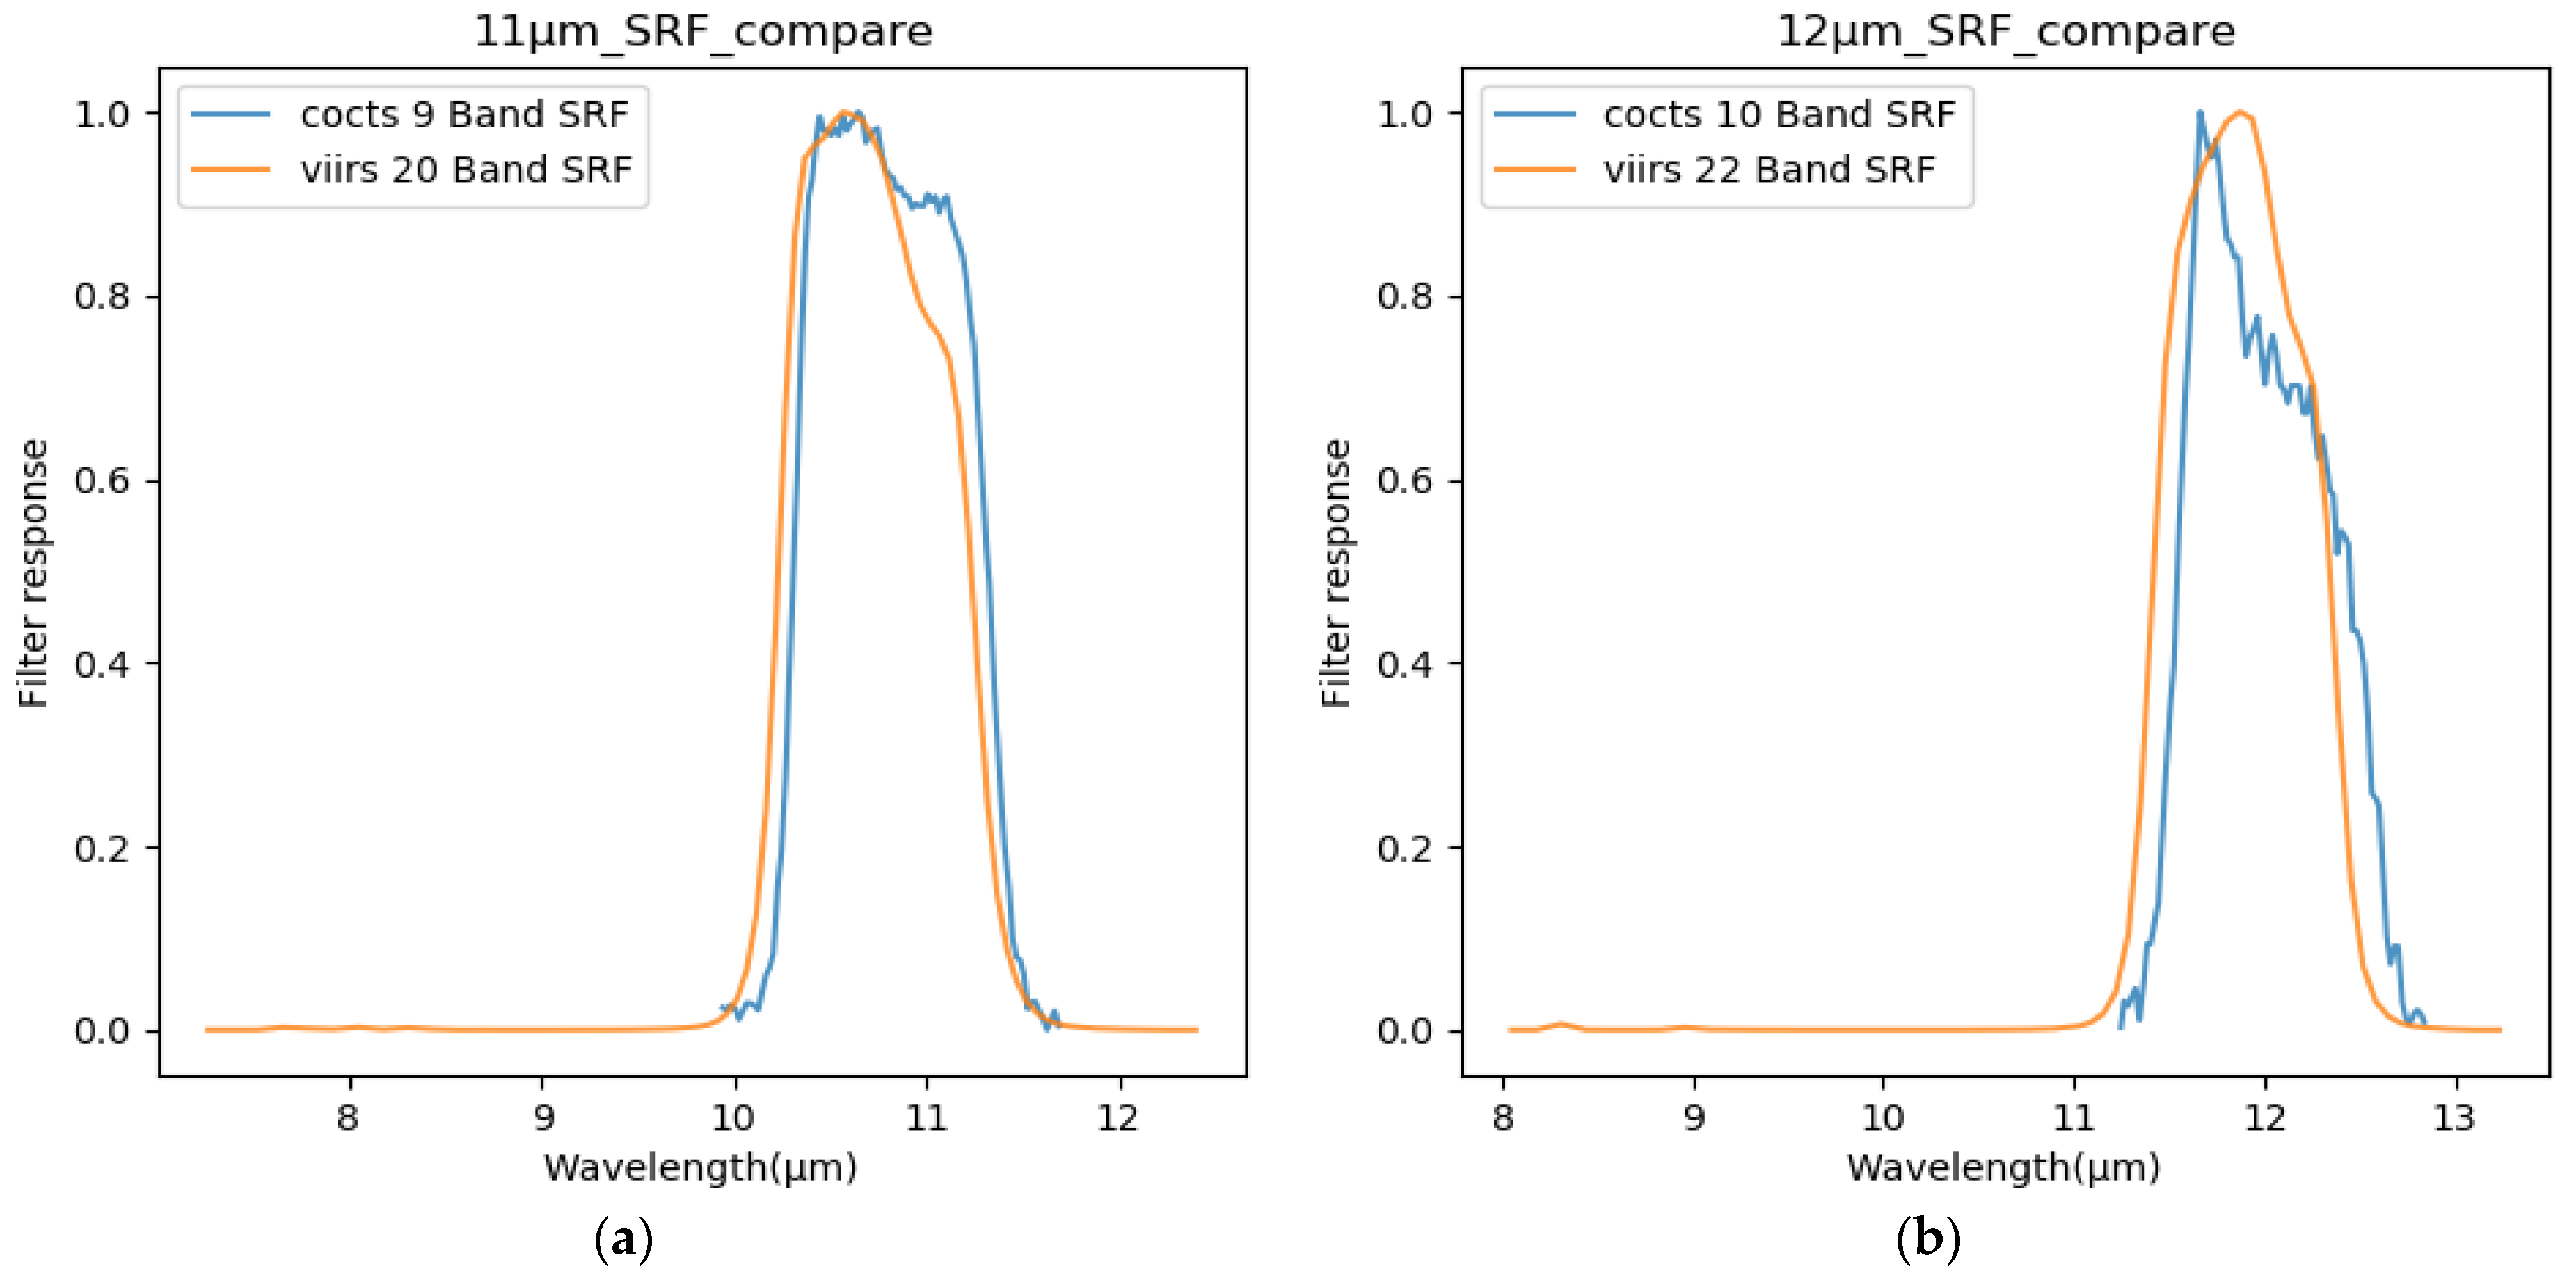
The hyperspectral convolution of the CrIS data with COCTS thermal infrared spectral response function are used to evaluate the calibrated COCTS thermal emissive band data. The complete coverage of the hyperspectral band range of the bands to be calibrated is a prerequisite for the use of the hyperspectral convolution method, the 11 μm and 12 μm band spectral response functions of COCTS were plotted against the common spectra of CrIS in the hyperspectral region as shown in Figure 12. The blue and orange lines represent the spectral response functions of COCTS in bands 9 and 10, respectively, and the black lines represent the observed radiance of CrIS in the hyperspectral region. It can be seen that the hyperspectral range of CrIS covers the two thermal emissive bands of COCTS, which allows for the use of the hyperspectral method to evaluate the COCTS double-difference calibration.
Similar to the previous double-difference cross-calibration, the hyperspectral method also requires geometric corrections, low-quality data rejection, and reasonable windows for filtering and matching the calibration datasets. The process of geometric correction and the elimination of low-quality data in the above operations is basically the same as that of the double-difference method cross-calibration in Section 3; therefore, the screening and matching process of the CrIS and COCTS calibration datasets is mainly described.
Since the spatial resolution of CrIS pixels is 14 km and the spatial resolution of COCTS is approximately 1 km, the spatial window is set to 0.14°. The higher spatial resolutions of COCTS thermal infrared data are averaged in each CrIS grid. It is also essential to perform a spatial homogeneity test before initiating the data matching process between CrIS and COCTS. When calibrating the thermal infrared data from COCTS with VIIRS, the homogeneity test’s spatial window is set to 0.03°. The observed area of a single CrIS field of view is much larger than this spatial window, and the pixels are already homogenized. Therefore, no homogeneity screening is conducted on the CrIS data. It is noteworthy that although the homogeneity test carried out on COCTS data can screen out significant homogeneous characteristics, applying the regional COCTS mean radiance for comparison with CrIS might produce an unrepresentative mean radiance for a grid point if the smaller-sized COCTS data that passed the homogeneity test within a single CrIS field of view are not sufficient to achieve a representative average after averaging. After thorough consideration, the threshold for rsd uniformity for COCTS data within a spatial grid point of 0.14° has been set at 0.1 K. To ensure that the screened points are representative of the spatial grid point, a grid point is only taken as a calibration object if the number of COCTS data points within the spatial grid point is higher than 50 percent.
The observed values for each channel of CrIS were subsequently convolved using the spectral response function of the COCTS thermal emissive band according to the following equation to derive the convolved radiance of CrIS in the corresponding spectral band of COCTS.
L = v 1 v 2 R ( v ) S ( v ) d v v 1 v 2 S ( v ) d v
where ν 1 and ν 2 are the lower and upper limits of the channel wave number, R ( v ) is the CrIS hyperspectral observations, and S ( v ) is the spectral response function of the COCTS band to be validated. Since the hyperspectral observations of CrIS need to be multiplied by the spectral response function of COCTS, an interpolation operation of the two spectra is required to ensure that the transverse axes of them are equal in length. In this paper, the number of channels of CrIS hyperspectral data is used as a standard, and the spectral response function of the COCTS bands to be validated is used for interpolation operation, which finally yields two groups of 717 data points each. These data points are then substituted into Equation (2) for the convolution calculation.

4.2. Evaluation Results and Discussion

Considering that the datasets used for the cross-calibration of the HY-1D/COCTS thermal emissive bands cover a long period of time, and that COCTS and VIIRS data are used for the calibration for the period April 2021 to March 2023, covering different seasonal conditions, the CrIS data from October 2021 and January, April, and July 2022 are selected at equal intervals to assess and corroborate the accuracy of the calibrated COCTS thermal infrared data to ensure that the assessment samples are sufficiently representative in time.
The bias between the BTs of CrIS and the uncalibrated COCTS thermal emissive bands is derived to be about 0.217 K in the 11 μm band, and 0.915 K in the 12 μm band, and the standard deviation and robust standard deviation of the evaluated dataset are kept at a low levels, which indicate that the differences between COCTS and CrIS in the dataset are more consistent. COCTS observations are higher than CrIS, and the difference in observations between the two satellite sensors is greater in the 12 μm band, which is consistent with the difference between VIIRS and COCTS. Using the calibration coefficients derived from the double-difference cross-calibration in Section 3 to calibrate the COCTS thermal emissive bands and comparing them with the CrIS hyperspectral data, the difference between the corrected COCTS data and CrIS is significantly reduced, with a bias of about 0.138 K in the 11 μm band and 0.037 K in the 12 μm band, with the specific parameters shown in Table 4. The corrected COCTS accuracy using the calibration coefficients are both improved, with the improvement being particularly obvious in the 12 μm band. The calibrated COCTS data comparison with CrIS is consistent with the VIIRS and COCTS differences recorded in the relevant literature. An assessment of the comparison with CrIS concludes that using VIIRS as a reference sensor to cross-calibrate the thermal emissive bands of COCTS through the double-difference method is effective.

5. Conclusions

The double-difference method is applied to cross-calibrate the HY-1D/COCTS thermal emissive bands in the South China Sea. By comparing the observed BTs of HY-1D/COCTS and the corresponding thermal emissive bands of NOAA-20/VIIRS after the correction of the spectral difference, it is found that the observed BTs of the two instruments in the 11 μm band are close to each other, with a bias of about 0.101 K, and in the 12 μm band, the mean observation difference between the two sensors is large, reaching 0.892 K, with standard deviations of the two bands of 0.197 K and 0.234 K, respectively. The observed BTs of both thermal emissive bands of COCTS showed a clear temperature dependence, with the 11 μm band dependence being stronger. The calibration coefficients of the COCTS thermal emissive bands in the South China Sea are obtained by robust linear fitting, and after the calibration coefficients derived from the cross-calibration are used for correction, the observed bias of the two thermal emissive bands of COCTS from the VIIRS is reduced to about 0.01 K. The temperature dependence exhibited between the thermal emissive bands of the two sensors was eliminated after calibration.
The NOAA-20/CrIS hyperspectral data are used to further evaluate the cross-calibration results of the COCTS thermal emissive bands. The results show that the calibrated COCTS thermal infrared data are in good agreement with CrIS, and the bias between the observed BTs of the two sensors in the 11 μm and 12 μm bands is around 0.1 K, which is in agreement with the observed deviation of VIIRS and CrIS recorded in previous publications. This assessment indicates that the HY-1D/COCTS thermal emissive bands after cross-calibration have good accuracy in the South China Sea.

Author Contributions

Conceptualization, R.C., L.G. and L.Q.; methodology R.C., L.G., M.L. and L.Q.; software, R.C. and M.L.; validation, R.C., L.G. and M.L.; formal analysis, R.C.; resources, L.G.; data curation, R.C. and L.G.; writing—original draft preparation, R.C.; writing—review and editing, L.G. and L.Q.; funding acquisition, L.G. All authors have read and agreed to the published version of the manuscript.

Funding

This work was supported by the National Key R&D Program of China (2022YFC3104900/2022YFC3104905), and Hainan Provincial Natural Science Foundation of China (122CXTD519).

Data Availability Statement

HY-1D/COCTS data were obtained at https://osdds.nsoas.org.cn/ (accessed on 22 November 2023). NOAA-20/VIIRS data were downloaded at https://urs.earthdata.nasa.gov/ (accessed on 22 November 2023). The NOAA-20/CrIS data were downloaded at https://www.avl.class.noaa.gov/ (accessed on 22 November 2023). The ERA-5 data were downloaded at https://cds.climate.copernicus.eu/ (accessed on 22 November 2023).

Acknowledgments

HY-1D/COCTS data were provided by NSOAS. NOAA-20/VIIRS and NOAA-20/CrIS data were provided by NASA. ERA5 data were provided by ECMWF.

Conflicts of Interest

The authors declare no conflicts of interest. The funders had no role in the study’s design; in the collection, analyses, or interpretation of data; in the writing of the manuscript or in the decision to publish the results.

References

  1. Wang, H.; Lin, M.; Ma, C.; Liu, J.; Guan, L. Validation of Sea Surface Temperature from HY-1D Data. In Proceedings of the 2021 Photonics & Electromagnetics Research Symposium (PIERS), Hangzhou, China, 21–25 November 2021; pp. 2119–2123. [Google Scholar]
  2. Ye, X.; Liu, J.; Lin, M.; Ding, J.; Zou, B.; Song, Q.; Teng, Y. Evaluation of Sea Surface Temperatures Derived From the HY-1D Satellite. IEEE J. Sel. Top. Appl. Earth Obs. Remote Sens. 2022, 15, 654–665. [Google Scholar] [CrossRef]
  3. Qi, Q.; Cai, R. The relation between the spatial-temporal evolution of SST in the South China Sea and the earlier or later onset of the South China Sea summer monsoon. Acta Oceanol. Sin. 2014, 36, 94–103. [Google Scholar] [CrossRef]
  4. Teillet, P.M.; Barker, J.L.; Markham, B.L.; Irish, R.R.; Fedosejevs, G.; Storey, J.C. Radiometric cross-calibration of the Landsat-7 ETM+ and Landsat-5 TM sensors based on tandem data sets. Remote Sens. Environ. 2001, 78, 39–54. [Google Scholar] [CrossRef]
  5. Jiang, G.; Li, Z. Cross-calibration of MSG1-SEVIRI infrared channels with Terra-MODIS channels. Int. J. Remote Sens. 2009, 30, 753–769. [Google Scholar] [CrossRef]
  6. Jiang, X.W.; Niu, S.L.; Tang, J.; Shao, Y. The System Cross-Calibration between SeaWiFS and HY-1/COCTS. J. Remote Sens. 2005, 6, 680–687. [Google Scholar]
  7. Mittaz, J.; Harris, A. A Physical Method for the Calibration of the AVHRR/3 Thermal IR Channels. Part II: An In-Orbit Comparison of the AVHRR Longwave Thermal IR Channels on board MetOp-A with IASI. J. Atmos. Ocean. Technol. 2010, 28, 1072–1087. [Google Scholar] [CrossRef]
  8. Efremova, B.; Wu, A.; Xiong, X. Relative spectral response corrected calibration inter-comparison of S-NPP VIIRS and Aqua MODIS thermal emissive bands. In Earth Observing Systems XIX; SPIE: Bellingham, WA, USA, 2014. [Google Scholar]
  9. Ye, X.; Ren, H.; Liang, Y.; Zhu, J.; Guo, J.; Nie, J.; Zeng, H.; Zhao, Y.; Qian, Y. Cross-calibration of Chinese Gaofen-5 thermal infrared images and its improvement on land surface temperature retrieval. Int. J. Appl. Earth Obs. Geoinf. 2021, 101, 102357. [Google Scholar] [CrossRef]
  10. Rong, Z.-G.; Zhang, Y.-X.; Jia, F.-M.; Tan, S.-X.; Liu, J.-J.; Zhang, Y.; Liu, C.; Zhang, P. On-orbit radiometric calibration of Fengyun geostationary meteorological satellite’s infrared channels based on sea-surface measurements in the South China Sea. J. Infrared Millim. Waves 2007, 2, 97–101. [Google Scholar] [CrossRef]
  11. Cao, C.; Blonski, S.; Wang, W.; Uprety, S.; Shao, X.; Choi, J.; Lynch, E.; Kalluri, S. NOAA-20 VIIRS on-orbit performance, data quality, and operational Cal/Val support. In Earth Observing Missions and Sensors: Development Implementation and Characterization V; SPIE: Bellingham, WA, USA, 2018; Volume 10781, pp. 63–71. [Google Scholar]
  12. Wang, W.; Cao, C. NOAA-20 and S-NPP VIIRS Thermal Emissive Bands On-Orbit Calibration Algorithm Update and Long-Term Performance Inter-Comparison. Remote Sens. 2021, 13, 448. [Google Scholar] [CrossRef]
  13. Wang, W.; Cao, C. NOAA-20 VIIRS Sensor Data Records Geometric and Radiometric Calibration Performance One Year in-Orbit. In Proceedings of the IGARSS 2019—IEEE International Geoscience and Remote Sensing Symposium, Yokohama, Japan, 28 July–2 August 2019; IEEE: New York, NY, USA, 2019; pp. 8485–8488. [Google Scholar] [CrossRef]
  14. Iturbide-Sanchez, F.; Taylor, J.; Esplin, M.; Yan, B.; Cao, C.; Kalluri, S.; Chen, Y.; Tremblay, D.; Jin, X.; Tobin, D.; et al. Performance of the SNPP and NOAA-20 CrIS Sensor Data Record Products. In Proceedings of the IGARSS 2019—IEEE International Geoscience and Remote Sensing Symposium, Yokohama, Japan, 28 July–2 August 2019; IEEE: New York, NY, USA, 2019; pp. 8815–8818. [Google Scholar] [CrossRef]
  15. Tremblay, D.A.; Iturbide-Sanchez, F.; Chen, Y.; Borg, L.; Predina, J.; Jin, X.; Tobin, D.C.; Strow, L.; Mooney, D.L.; Johnson, D.; et al. Radiometric noise assessment of the Cross-track Infrared Sounder on the NOAA-20 satellite. IEEE Trans. Geosci. Remote Sens. 2021, 60, 5506615. [Google Scholar] [CrossRef]
  16. Liang, X.; Ignatov, A.; Kramar, M.; Yu, F. Preliminary inter-comparison between AHI, VIIRS and MODIS clear-sky ocean radiances for accurate SST retrievals. Remote Sens. 2016, 8, 203. [Google Scholar] [CrossRef]
  17. Rong, Z.; Zhang, Y.; Lu, F.; Xu, J.; Qui, K. Inter calibration of FY-2B IR channel with NOAA satellites. Acta Meteorol. Sin. 2005, 63, 485–492. [Google Scholar] [CrossRef]
  18. Feng, C.; Shoujing, Y.; Li, Z.; Kai, Y.; Baoyin, H.; Song, Y. Radiometric calibration of the HJ-1B thermal channel and its effects on land surface temperature retrieval. J. Remote Sens. 2016, 20, 601–609. [Google Scholar] [CrossRef]
  19. Thome, K.J.; Biggar, S.F.; Wisniewski, W. Cross comparison of EO-1 sensors and other Earth resources sensors to Landsat-7 ETM+ using Railroad Valley Playa. IEEE Trans. Geosci. Remote Sens. 2015, 41, 1180–1188. [Google Scholar] [CrossRef]
  20. Chander, G.; Haque, M.; Micijevic, E.; Barsi, J.A. A procedure for radiometric recalibration of Landsat 5 TM reflective-band data. IEEE Trans. Geosci. Remote Sens. 2009, 48, 556–574. [Google Scholar] [CrossRef]
  21. Li, Y.; Wu, J.; Fang, Y. Cross-Calibration of FY-3A/VIRR Thermal Infrared Channel with TERRA/MODIS. J. Atmos. Environ. Opt. 2016, 3, 7. [Google Scholar]
Figure 1. HY-1D/COCTS cross-calibration framework.
Remotesensing 16 00292 g001
Figure 2. The differences between NOAA-20/VIIRS and HY-1D/COCTS thermal emissive band observations with homogeneity test windows: (a) 0.03°; (b) 0.05°.
Remotesensing 16 00292 g002aRemotesensing 16 00292 g002b
Figure 3. MODTRAN simulated BTs with variation in the satellite zenith angle.
Remotesensing 16 00292 g003
Figure 4. Comparison of spectral response functions of corresponding bands between NOAA-20/VIIRS and HY-1D/COCTS: (a) 11 µm band; and (b) 12 µm band.
Remotesensing 16 00292 g004
Figure 5. Flow chart of HY-1D/COCTS cross-calibration procedure.
Remotesensing 16 00292 g005
Figure 6. Spatial distribution of matched pixels of HY-1D/COCTS and NOAA-20/VIIRS: (a) daytime matched pixel distribution; (b) nighttime matched pixel distribution.
Remotesensing 16 00292 g006
Figure 7. Brightness temperature correlation point density plots for matched datasets: (a) 11 μm band; (b) 12 μm band.
Remotesensing 16 00292 g007
Figure 8. Temperature bias (COCTS−VIIRS) between HY-1D/COCTS and NOAA-20/VIIRS for different temperature intervals: (a) 11 μm band; (b) 12 μm band.
Remotesensing 16 00292 g008
Figure 9. Difference in observations between NOAA-20/VIIRS and HY-1D/COCTS thermal emissive bands in the South China Sea between April 2021 and March 2023: (a) daytime; (b) nighttime.
Remotesensing 16 00292 g009aRemotesensing 16 00292 g009b
Figure 10. Evaluation dataset calibration results: (a) 11 μm band; (b) 12 μm band.
Remotesensing 16 00292 g010
Figure 11. Difference distribution of HY-1D/COCTS thermal emissive band data after bracketing: (a) 11 μm band; (b) 12 μm band.
Remotesensing 16 00292 g011
Figure 12. Schematic of the spectral response function of the COCTS thermal emissive bands and the CrIS hyperspectral band.
Remotesensing 16 00292 g012
Table 1. The statistics of the difference from April 2021 to March 2023 (COCTS−VIIRS).
Data TypeBiasDifference Standard DeviationMedian
Difference
Robust Standard DeviationCorrelation
11 μmRadiance
(W/m2-sr-um)
0.0140.0310.0120.0230.997
BT
(K)
0.1010.2330.0810.1630.997
12 μmRadiance
(W/m2-sr-um)
0.0970.0240.0970.0200.997
BT
(K)
0.8920.2310.8820.1810.997
Table 2. Statistics on information in the calibration dataset and calibration coefficients obtained using the calibration dataset (COCTS−VIIRS).
Data TypeBias
(K)
Difference Standard Deviation
(K)
Median
Difference
(K)
Robust Standard Deviation
(K)
Radiometric
Correction Factors
(Coef/Offset)
11 μm 0.1010.2330.0810.1631.0539/−16.0248
12 μm 0.8920.2320.8820.1811.0404/−12.5571
Table 3. Difference statistics between COCTS and VIIRS after testing the evaluation dataset using the obtained calibration coefficients (COCTS−VIIRS).
Data TypeBiasDifference Standard DeviationMedian
Difference
Robust Standard
Deviation
11 μmRadiance
(W/m2-sr-um)
0.0000.0270.0000.022
BT
(K)
0.0020.1970.0000.152
12 μm Radiance
(W/m2-sr-um)
0.0010.0250.0000.019
BT
(K)
0.0080.234−0.0020.175
Table 4. Difference in CrIS data before and after COCTS calibration (COCTS−CrIS).
Difference before CalibrationDifference after Calibration
Data TypeBiasStandard
Deviation
Median
Difference
Robust Standard DeviationBiasStandard
Deviation
Median
Difference
Robust Standard Deviation
11 μm Radiance
(W/m2-sr-um)
0.0330.0320.0270.0190.0210.0260.0170.015
BT
(K)
0.2170.1840.1850.1330.1380.1390.1230.106
12 μm Radiance
(W/m2-sr-um)
0.1000.0220.0980.0170.0040.0200.0020.014
BT
(K)
0.9150.2110.8850.1650.0370.1880.0160.128
Disclaimer/Publisher’s Note: The statements, opinions and data contained in all publications are solely those of the individual author(s) and contributor(s) and not of MDPI and/or the editor(s). MDPI and/or the editor(s) disclaim responsibility for any injury to people or property resulting from any ideas, methods, instructions or products referred to in the content.

