Abstract
A passive microwave instrument will be carried by China’s geostationary microwave satellite. A microwave hyper-spectral band included by the instrument ranges from 52.6 to 57.3 GHz, and totally has 89 channels in this spectral domain. The design of the hyper-spectral band is described from the aspects of scientific objectives and specifications. The weighting functions for each channel are calculated utilizing radiative transfer simulations under clear sky conditions. Then, the information content as well as the degree of freedom for signal are computed and analyzed to characterize this hyper-spectral sounding for atmospheric temperature profiling. Both the vertical distribution of the weighting functions and the width of retrieval averaging kernels indicate that the hyper-spectral band can provide more denser sampling for atmospheric temperature. The information content for the hyper-spectral band is approximately 46% higher than that of the ATMS-type channel 3 to 15, indicating that hyper-spectral measurement can improve the accuracy of retrieval. The most informative channels mainly locate near 57 GHz, having good consistency with the existing channels. The height range where the retrieval using the hyper-spectral observations is sensitive to the true profile, begins from about 800 to 1 hPa. Some channels can be considered as alternatives to each other since they have very similar information content and weighting functions. These results are expected to provide a valuable reference for future applications of the microwave hyper-spectral measurements.
1. Introduction
Remote sensing using passive microwave sensors, such as the Microwave Sounding Unit (MSU), the Advance Microwave Sounding Unit (AMSU) and the Advanced Technology Microwave Sounder (ATMS), has been developed for more than four decades since the world’s first operational microwave temperature sounder [1,2]. Microwave has the benefits of detecting within and penetrating cloud or precipitation. Therefore, the sensors can provide a wealth of information about the surface, the atmosphere and cloud or precipitation depending on the sensors’ frequencies and the geophysical states. Consequently, these information from passive microwave technology can be used to retrieve a large number of parameters, for instance, temperature profiles, humidity profiles, total precipitable water vapor, surface temperature, snow water equivalent, etc. In addition, brightness temperatures provided by these instruments can be assimilated into modern numerical weather prediction (NWP) systems and are very important for the improvement in forecasting accuracy.
In China, space-based remote sounding using passive microwave sensors for meteorology starts from FengYun-3 (FY-3) meteorological satellite, which is operated in polar orbit [3]. Among the sensors are the MicroWave Temperature Sounder (MWTS) and the MicroWave Humidity Sounder (MWHS). Their channels are similar to those of ATMS. However, the number of channels for these space-borne microwave sensors is quite limited, less than 20 channels for MWTS onboard FY-3E satellite. As mentioned by previous studies [4], the limited number of channels is insufficient to detect the Earth’s atmosphere, especially the height of the tropopause. It is especially true for cases in which cloud or other hydrometeor is present in the atmosphere. In contrast, remote sensing using near-infrared or infrared band currently contains several thousand channels such as the Infrared Atmospheric Sounding Interferometer (IASI) on the meteorological operational satellite program (MetOp), the Cross-track Infrared Sounder (CrIS) on the Suomi National Polar-Orbiting Partership (SNPP) satellite or the Hyper-spectral Infrared Atmospheric Sounder (HIRAS) on FY-3. Although not all of the hyper-spectral infrared channels are used, they significantly improve the retrieval accuracy. Generally, a satellite sensor with high spectral resolution has the capabilities of carrying enough information content to allow the full characterization of the parameters being retrieved. This is suitable not only for the infrared sensor, but also for the microwave sensor.
Several studies have already demonstrated that retrievals of temperature and moisture profiles can be significantly improved when microwave hyper-spectral channels are employed. Lipton (2003) [5] investigated the creating of a set of optimal channels for microwave sounding, as well as the combination of center frequency and bandwidth that provides optimal skills for the retrieval of atmospheric parameters. Boukabara et al. (2011) [4] highlighted the eight benefits of a microwave hyper-spectral sensor and presented the scientific results that supported the development of the hyper-spectral sensor. Blackwell et al. (2011) [6] introduced a microwave hyper-spectral remote sensing modality for atmospheric sounding and demonstrated that hyper-spectral sensor substantially improves temperature and moisture profiling accuracy. Aires et al. (2015) [7] investigated the benefits of a satellite microwave hyper-spectral sensor for the retrieval of atmospheric temperature and humidity profiles and confirmed the positive impact of microwave hyper-spectral sensor on the retrieval. In particular, the temperature retrieval uncertainty is reduced by 2 to 10%. For humidity sounding, the improvement can reach 30% with satisfying a priori information. After that study, they considered the more complex cloudy/precipitating scene [8]. Kummerow et al. (2022) [9] demonstrated that retrieval of temperature and moisture sounding could be improved by as much as 50% when 60–80 pseudo-channels were employed.
For technological challenge in the design and manufacture, the development of hyper-spectral microwave is far behind that of the infrared. However, recent advances in microwave technology allow microwave hyper-spectral sounder to have a few hundred channels in a certain spectra with reliable measurement accuracy. A dedicated millimeter and sub-millimeter sounder onboard geostationary FengYun-4 (FY-4) satellite, has been developed. This sounder includes a hyper-spectral band near 55 GHz. Our purpose is to study the characteristics of this hyper-spectral band to understand how the hyper-spectral channels sound the atmosphere along the vertical, and to understand how the hyper-spectral channels offer informative measurements for product retrieval or NWP system. For this purpose, the weighting functions, the retrieval averaging kernel, the information content and the degree of freedom for signal (DFS) have been investigated.
This article firstly introduces the design of the microwave hyper-spectral band from the aspects of scientific objective, specifications and signal processing flow in Section 2. Then, the method and model used to derive the weighting function and information content is briefly introduced in Section 3. In Section 4, these above physical quantities and their associated quantities on atmospheric temperature are calculated, analyzed and compared. Special efforts are made to study the vertical distribution of the weighting function and their width variation. The analysis of information content and DFS have been conducted in detail not only for the whole hyper-spectral band, but also for each channel. The relationship between the sorted high information content and the vertical arrangement of weighting function is examined. The discussion are presented in Section 5. Finally, the main conclusions from this stud are summarized in Section 6.
2. The Design of Hyper-Spectral Band
2.1. Scientific Objective
The microwave capability of penetrating cloud cover can supplement the lack of optical sensors whose observations are limited by cloud and rain. Thus, all-weather temperature and humidity soundings can be achieved by the observations from both optical and microwave sensors at the same time. The microwave satellite carrying a millimeter and sub-millimeter wave atmospheric sounder is scheduled to be launched into geostationary orbit in the year 2025. Besides the conventional microwave band used in the low orbit, the hyper-spectral band around 55 GHz has been added to the microwave sounder onboard the microwave satellite. As an experiment technology, the scientific objective of this hyper-spectral band is to enhance the vertical sampling, the temporal resolution as well as the retrieval accuracy of atmospheric temperature profile in all weather conditions. These new hyper-spectral sounding data are expected to support the development of microwave hyper-spectral data assimilation systems and NWP models so as to improve short- to medium-range weather forecasts.
The Specifications of Hyper-Spectral Band
It is much more difficult to realize microwave observation in geostationary orbit than that in polar orbit. The currently developed microwave instrument is based on a 5-m filled-aperture antenna to achieve an initial spatial resolution of 17 km to 60 km at the bands of millimeter wave and submillimeter wave ranging from 50 GHz to 425 GHz. Besides the existing channels near 55 GHz used on previous sensors such as AMSU-A or ATMS, FY-4 microwave satellite implements the hyper-spectral technique over the frequency range from 52.6 GHz to 57.3 GHz. The range is very similar to that in [7,8], but the spectral resolution is different. Here, the microwave hyper-spectral band is divided into two sub-bands with the boundary at 55 GHz. In the first sub-band, the channels are separated by spectral resolution of 200 MHz from 52.6 GHz to 55 GHz. In the second sub-band, they are separated by 30 MHz from 55 GHz to 57.3 GHz. The noise of these hyper-spectral channels is expected to be 1 K, and the dynamic ranges are 3–340 K. Table 1 summaries the key specifications of the hyper-spectral band.

Table 1.
The specifications of the microwave hyper-spectral band.
FY-4 microwave satellite platform and microwave payload are manufactured by Shanghai Institute of Satellite Engineering and Shanghai Spaceflight Institute of TT&C and Telecommunication, respectively. FY-4 microwave hyper-spectral band is achieved through intermediate frequency sampling and digital detector integration techniques. The microwave radiation emitted by the earth-atmosphere system is received by the 5-m antenna and horn feed, and then is mixed with local oscillator to the range of 1.7 GHz to 6.3 GHz. After power division, secondary mixing and filtering, the intermediate frequency signal with a bandwidth of 1.2 GHz is outputed. It is then sampled by the high-speed Anolog to Digital. Digital detection and accumulation are completed by the Field Programmable Gate Array (FPGA) after sampling. Finally, a total number of 89 channels are outputed at the vertical polarization via FPGA processing. Channels 1–12 cover 52.6 GHz to 55 GHz band with the resolution of 200 MHz, and channels 13–89 cover 55 GHz to 57.3 GHz band with the resolution 30 MHz, respectively. In order to better satisfy the requirement of the spectrum sampling, the channels are designed to have the capability of adjusting their widths to some extent on orbit under the condition that the total band range is unchanged. The entire signal processing flow is described in Figure 1.
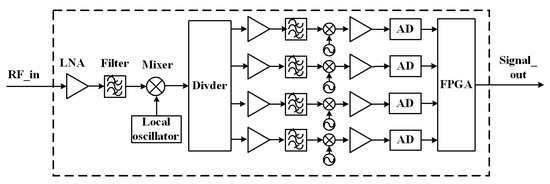
Figure 1.
The signal processing flow implemented by the microwave hyper-spectral band.
It is well known that the frequency ranging from 52 GHz to 67 GHz are dominated by oxygen lines. Figure 2 displays the microwave hyper-spectral region in terms of the atmospheric optical depth as a function of frequency. It can be seen that the optical depth tends to increase with the increamental frequency. Nine fine, isolated absorption lines exist in this band. There are more complex and noticeable absorption lines in the second sub-band, in which the channel resolution needs to be higher so as to obtain high quality spectrum samples. In fact, the microwave spectra are much more simpler than the infrared spectra. Consequently, the number of useful hyper-spectral channels in the microwave is much less than that in the infrared. Usually, the number is a few hundred channels depending on the channel resolution and the spectral range. For the case of microwave hyper-spectral band on board the FY-4 geostationary satellite, there are 89 channels in the microwave spectra shown in Table 1.
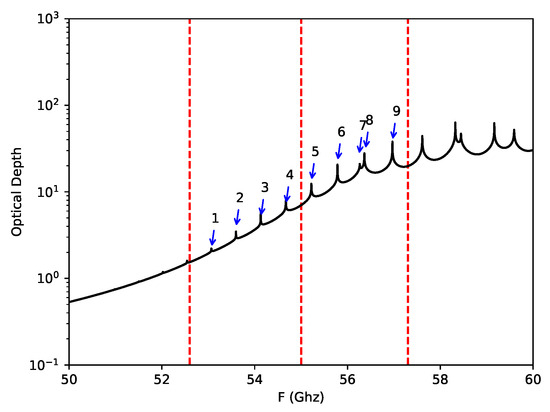
Figure 2.
The microwave hyper-spectral range and the optical depth as a function of frequency near 55 GHz. The left and the right dashed lines show the band boundaries. The middle dashed line shows the boundary between the two sub-bands. Nine fine oxygen absorption lines are indicated by the numbers.
3. Method and Model
3.1. Weighting Function
Rodgers [10] describes the concepts of retrieval theory including weighting function, information content and DFS. Here, we briefly review these concepts and method. Let x and y be the atmospheric state variables and multiple-channel observations from a satellite-based microwave radiometer, respectively. The physical relationship between the two vectors can be described by the forward model, which usually is nonlinear.
where is the measurement noise, and is the forward model that describes the physics process of the measurement.
Considering the issue of optimal retrieval, it is widely accepted that a linearization of a forward model about a reference state is adequate for the purpose of assessing the information content of a measurement. For remote sounding of atmospheric temperature using microwave band, the linearization is valid and feasible. Therefore, the relationship between measurement vector y and state vector x can be written as:
where and define an arbitrary linearization point, and K is the weighting function matrix or jacobian matrix. In the field of microwave temperature sounding, the weighting function means that the forward model takes the form of a weighted average of the vertical profile of the atmospheric temperature. These weighting functions have to be fully understood because they play a critical role in the interpretation of satellite measurements in terms of a vertical profile.
Weighting function is a peaked curve with certain width. The peak and width are determined by the frequency and pass-band. Hence, these microwave hyper-spectral channels have weighting functions peaking at different altitudes. More essentially, the peak altitude of the weighting function depends on the absorption cross section or absorption coefficient. From an application perspective, the weighting function is expected to be as narrow as an impulse response () function to represent the best vertical resolution. However, the actual width is much wider than that of the function. In this study, we use the Full Width of the Half Maximum (FWHM) to quantitatively descriptive the weighting function width.
3.2. Information Content and DFS
Information content originates from information theory developed in the 1940’s. It is defined with respect to the a priori probability distribution and the distribution of the estimation x after the measurement:
It provides a quantitative way to describe the performance of a satellite-based remote sensing system. If is the error covariance matrix of a priori atmospheric state, i.e., temperature profile in the datasets, and is the inverse covariance matrix. Let be the covariance matrix of the measurement noise. The retrieval covariance matrix can be written as [11]
Equation (4) is also known as information matrix in the Gaussian linear case. For a multivariate Gaussian distribution, the information content becomes, using Equation (4) [10],
here is the determinant of and I is the unit matrix. The information content evaluated using Equation (5) is in the state vector space. It can also be calculated in the measurement vector space. Both of the two cases are equivalent for a given observation.
The information content is suitable for assessing the measurement. But it can not tell us how many independent components of the state vector are effectively measured to meet the accuracy requirement. Degree of freedom for signal (DFS) can avoid this small problem. DFS is introduced to provide a quantitative assessment of the performance of a remote sounding system. It can be expressed by an expectation value of the normalized difference between inverted state x and a priori state :
where is the expected value operator. DFS describes the number of useful independent quantities contained in measurements. Therefore, The largest number of DFS does not exceed the number of elements in the state vector. Usually the rank of the weighting function matrix K is the required DFS. If people want to know the components of the total DFS or information content, they should calculate the eigenvalues of the product of the contribution function matrix G and the weighting function K. G is given by [10]
With this approach, we are able to know the contribution of each eigenvector to the DFS or information content. It should be noted that DFS is not necessarily an integer due to the presence of noise and the correlation of the observation of each channel.
3.3. Radiative Transfer Simulation Model
The simulations of brightness temperature at the microwave hyper-spectral band is performed using the Atmospheric Radiative Transfer Simulator (ARTS) that is designed to model atmospheric radiative transfer in the range of passive millimeter and sub-millimeter measurements. It is a relatively general and flexible model [12,13]. The polarization of state vectors can be fully described with ARTS. A comprehensive and efficient treatment of sensor characteristics is supported. Jacobians can be analytically calculated for the most important atmospheric variables in non-scattering conditions. The absorption calculations can be computed by either the line-by-line method or the available continuum method.
Two atmospheric profile datasets has been used in the simulation. The first data set is a climate data set and has 42 profiles. Each profile is divided into 43 levels (L43) with the top at about 0.1 hPa. As a supplement, another data set generated at the European Center for Medium-Range Weather Forecasts (ECMWF) [14], containing 83 profiles and 101 levels (L101) with the top at about 0.005 hPa, was also adopted. For the first data set, Figure 3 shows the distribution of the means and the standard deviations of the temperature profiles. The maximum change in temperature occurs at the bottom where the mean temperature is near 280 K with the standard deviation of 20 K. The temperature profiles in the second dataset have similar statistical characteristics with the mean of 274 K and the standard deviation of 24 K at the bottom. The two datasets contain concentrations of gases including ozone, water vapor, carbon dioxide, etc. The concentrations of oxygen and nitrogen dioxide are set to be constants in the simulations. The viewing angle is set to zenith and the surface emissivity is assumed to a constant value of 0.6.
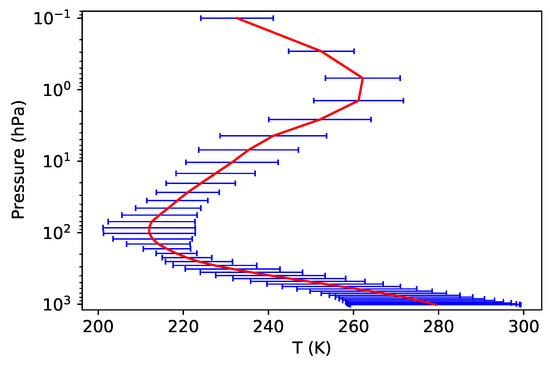
Figure 3.
The means (red line) and the standard deviations (blue line) of the temperature profiles in the first data set.
4. Results
4.1. Characteristics of the Weighting Functions
The weighting functions on atmospheric temperature for each microwave hyper-spectral channel are calculated in the context of cloud-free atmosphere taken from the two datasets. Figure 4 shows them calculated using an individual atmospheric profile in the two data sets. These weighting functions obtained are very similar for the two datasets, except that those obtained from the second data set are more smoother at the upper stratosphere due to more atmospheric levels in this area. They can be used to explain which layer of the atmosphere the satellite-observed signals mainly come from. Hence, the dense vertical sampling of the atmosphere illustrates the potential capability of providing more higher vertical resolution for temperature sounding.
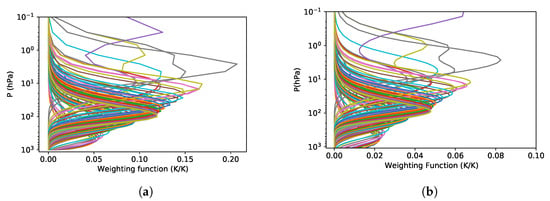
Figure 4.
The temperature weighting functions calculated using an individual profile for the microwave hyper-spectral band. Each curve corresponds to a channel. (a) the first L43 data set. (b) the second L101 data set.
This hyper-spectral band is significantly sensitive to temperature and less sensitive to water vapor [7]. In order to find the impact of different atmospheric situations on weighting functions, we examine the variation of some representative weighting functions, peaking at the low, middle and upper atmosphere respectively, for the coldest and the hottest profiles. Figure 5 shows these weighting functions derived from the coldest and the hottest atmospheric profiles in the first data set. Note that their shapes keep very stable between the two extreme atmospheric states. But the values of the peaks at the middle atmosphere have little difference. The weighting functions at this hyper-spectral band do not have significant changes, indicating that they are not significantly affected by the atmospheric conditions.
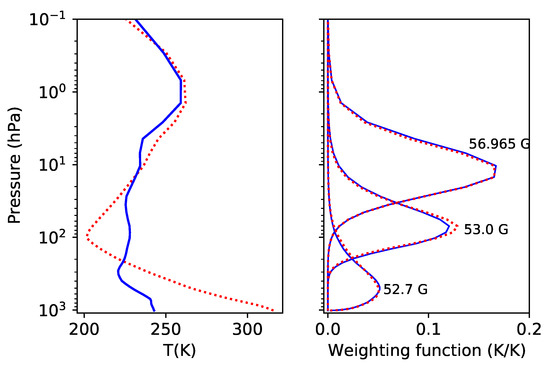
Figure 5.
(Left): the coldest (solid) and the hottest (dashed) profile in the first data set. (Right): the representative temperature weighting function peaking at the low, middle and upper atmosphere, corresponding to the coldest and the hottest profile in the left panel.
In fact, the weighting functions are dominated by the frequency and the passband of each channels. The higher frequencies are usually accompanied with higher peak altitudes. Almost invariable, constant weighting function brings great convenience to the temperature sounding. As a consequence, a single weighting function on temperature calculated from an individual profile can be used to represent a wide range of atmospheric temperature states.
The channel will sense the higher atmosphere if the frequency is higher. Furthermore, the channels around the absorption lines can sense the higher atmosphere in the vertical with higher vertical resolution. However, a few weighting functions near absorption lines show the unexpected behavior and have complex structures. It is found that the weighting functions of three channels at 55.795 GHz, 56.275 GHz and 56.365 GHz have irregular shapes. For example, there are two obvious peaks or one very flat peak. Because the very fine absorption lines exhibit great impact on hyper-sepctral measurement, we have examined the sampling of the absorption lines by the hyper-spectral channels. It is found that this irregular weighting function is probably caused by the sampling of the fine oxygen absorption line, whose peak is just very asymmetrically located in these channels. For instance, the absorption line 6 at 55.7838 GHz shown in Figure 2 is just located in the channel which ranges from 55.78 GHz to 55.81 GHz, with the center frequency at 55.795 GHz. Therefore, the influence of the small absorption lines on weighting functions can not be avoided thoroughly because that hyper-spectral channels are achieved by continuously sampling the spectra.
The ideal weighting function should be like a very thin impulse response function. However, the actual weighting function has certain width. Although the weighting functions of microwave are much broader than those of infrared sounders, the ability of sounding in all weather conditions makes them one of the most useful measurements for NWP models [15]. Generally, for a channel detecting a certain level of atmosphere, especially in the middle and upper atmosphere, the higher the spectral resolution is, the narrower the weight function is, thus resulting in better vertical resolution. In order to quantify this relationship, as mentioned in Section 3, we use the FWHM to assess the sampling vertical range of the atmosphere. To illustrate this, Figure 6 shows a typical weighting function as a function of pressure. The peak of this weighting function locates at about 85 hPa, and its FWHM is about 98 hPa. FWHM can also be used to measure two adjacent weighting functions. If the distance of the two peaks is greater than one FWHM, it can be said that the two weighting functions are well distinguished.
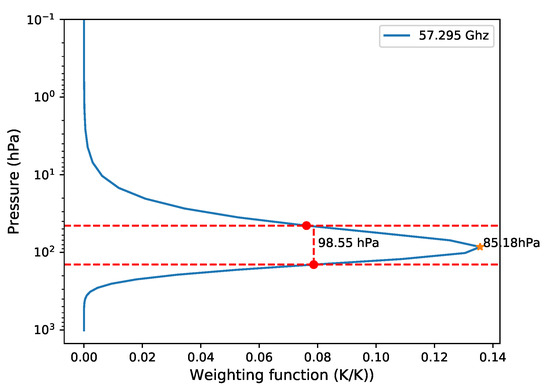
Figure 6.
The FWHM of a typical weighting function. The pentagram shows the peak position. The red lines show the range of the FWHM.
In addition, the FWHM varies with the channel frequency (see Figure 7). The FWHM is more broader under lower frequency than under higher frequency. There is also a good correspondence between the four FWHM peaks and the four absorption line 6–9 shown in Figure 2, meaning that the higher vertical resolution should be obtained by sampling the thinner absorption lines with even higher spectral resolution. We have also analyzed the variation of the peak altitudes with channels. Their pattern is very similar to Figure 7.
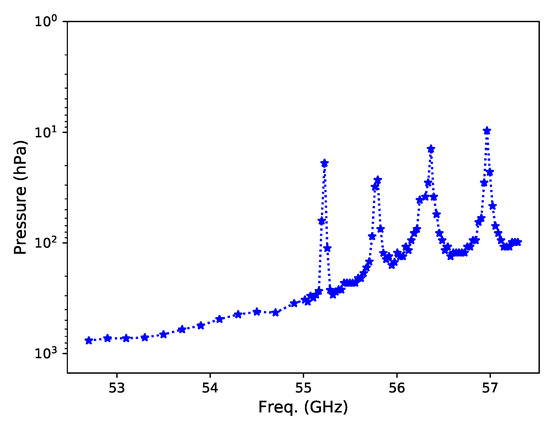
Figure 7.
The FWHM variations as a function of frequency.
The averaging kernel takes into account the impacts of the instrument observation noise and weighting function. They are more useful in practical inversion. Here, we use the measurement noise listed in Table 1 to calculated the averaging kernel matrix and its area. Figure 8 shows the averaging kernels for a subset of levels in the first data set. When the state vector represents a temperate profile in the retrieval, the kernel matrix can be regarded as smoothing functions. Due to the influence of noise, the kernels have negative values and become peaked functions with a certain width which is a measure of the spatial resolution of the instrument, providing the relationship between the retrieval and the true statement. Compared with Figure 4, it can be seen that the width of the averaging kernels are narrower than those of the original weighting functions. Therefore, these channels have better resolution ability for the actual vertical profile of the atmosphere. Also shown as the dashed line is the area region of the averaging kernels, scaled by a factor of 0.4. Except for the top and bottom regions, the area value is close to 1 from 800 hPa to 0.3 hPa, indicating that the inversion is very sensitive to the true atmospheric profile in these height regions. Thus, the channel noise of 1 K is acceptable not only in actual inversion for the data user but also in instrument manufacturing for the industry sector.
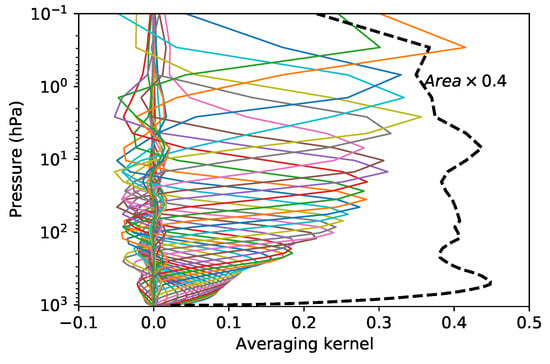
Figure 8.
Averaging kernels for the temperature sounding using microwave hyper-spectral channels (solid), and their area (dashed).
4.2. Characteristics of the Information Content and DFS
The total information content and DFS for the 89 channels in the hyper-spectral band have been calculated based on the two atmospheric data sets. The same prior error of 10 K is used in order to perform comparison between the two data sets. Figure 9 shows them for each atmospheric profile in the first data set. They have similar variation in the second data set. Their variation with the profiles is small, indicating that the information content and DFS are suitable as a quantitative method to assess new instrument performance.
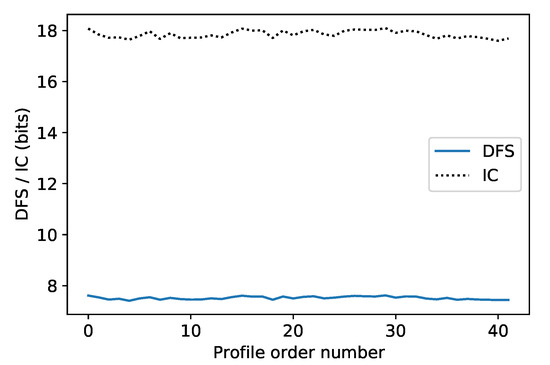
Figure 9.
The total information content and DFS for each atmospheric profile in the first data set. The unit of information content is bits and DFS is unitless.
The mean information content and DFS over all the profiles are needed in order to remove their variation. Table 2 shows the statistical results. For the first data set, the mean information content and DFS are 17.85 bits and 7.52, respectively, meaning that about different atmospheric scenes can be distinguished and more than seven quantities are independently measured if the whole hyper-spectral band is applied in retrieval. The mean values of the second data set are lower than those of the first data set. The increase in the number of atmospheric levels alone from 43 to 101 will not result in an increase in the information content and DFS.

Table 2.
The information content and DFS based on the two atmospheric data sets.
As mentioned in Section 3, the eigenvalues of the product of averaging kernel matrix and weighting function are calculated in order to analyze the composition of the information content and DFS in the whole hyper-spectral band. Figure 10 shows the first 30 components for an individual profile in the first data set after they are sorted from large to small value. It can be seen that the components of DFS are almost unchanged at the beginning, while those of the information content decreased rapidly. The most informative channels have the DFS that are near one. The components after 10th are very small.
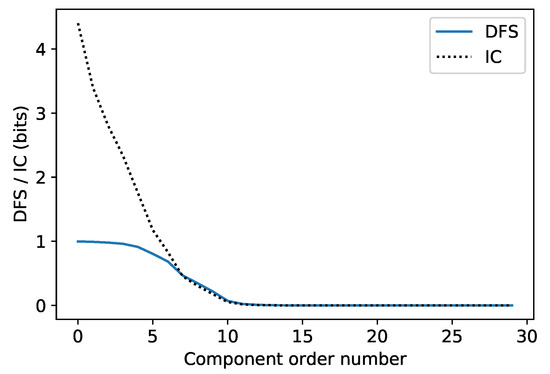
Figure 10.
The first 30 components of the information content and DFS for an individual profile in the first data set.
The retrieval of temperature profile will reduce sensitivity to background information if the information content of measurements is increased. Figure 9 illustrates the total information content contained by the whole hyper-spectral measurement. In fact, they are provided by a set of continuous channels. Thus, information content for each channel, or information spectrum, should be examined if one wants to know the information content distribution to perform channel selection. Their comparisons of information content for each channel are even more important under the same background field. The iterative procedure chosen by many previous researchers ([11,16,17]) is utilized for each atmospheric profile and for each channel. Then, the average information content of each channel is calculated over all the profiles to establish the reliable information spectrum.
The average information content for each channel over all the profiles in the first data set are shown in Figure 11. The informative channel regions of the microwave hyper-spectral band have good consistency with other existing sensors’ channels. It can be seen that there is a high information enrichment region near 57 Ghz where the largest amount of information content is also located. As is well known, ATMS and AMSU-A have many channels around 57 GHz. Their observations have already been used in the numerical weather prediction (NWP) model. There also is a high informative channel locating at 53.9 GHz, which is very close to ATMS channel 6. The mean of DFS for each channel over all the profiles shows similar result, too. It is expected that the spectrum of information content can provide some reference for the use of microwave hyper-spectral measurement in the NWP model.
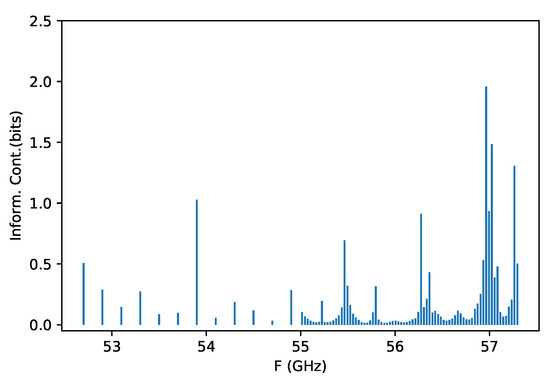
Figure 11.
The mean information content for each channel over all the profiles in the first data set.
The evaluation of hypers-pectral information content has many benefits in the use of observational data. Too much data can be provided by the hyper-spectral sensor. If the data transmission rate from satellite is limited, it is practicable to only select high information channels for transmission. In addition, When assimilating these hyper-spectral data in numerical weather forecasting, in order to improve timeliness, it is also practicable to only select some high information channels for assimilation.
Channel selection can be performed by comparing information content among different channels [5,18,19]. Table 3 shows the top 10 channels with the high information content. There is a good correspondence between the information content and DFS for each channel. Figure 12 shows the cumulative information content and DFS against the number of channels counted. Both of them show the similar variation trend with the number of channels, i.e., increase rapidly at the beginning, and slowly later. The sum of information content and DFS for the top 10 channels is about 55% and 71% of the total information for the 89 channels, respectively. When the top 20 channels are counted, the percentages further increase to 74% and 88%, respectively. It indicates that the total information content of the microwave hyper-spectral band is greatly increased, compared with several channels employed by existing sensor in the same band range.

Table 3.
The top 10 channels according to their information content.
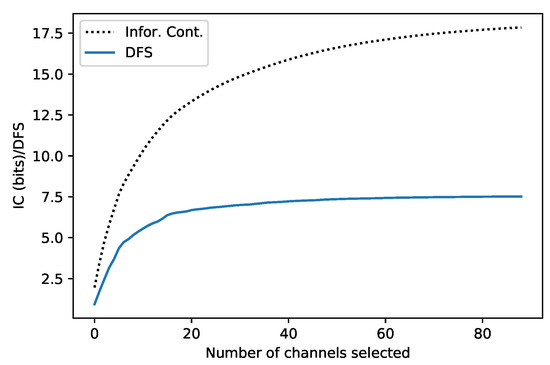
Figure 12.
The cumulative information content and DFS against the number of channels selected.
In order to illustrate the increase, we directly compared their information content between the microwave hyper-spectra and the available ATMS-type channels based on the first data set. The ATMS-type channels range from 50.3 GHz to 57.29 GHz, corresponding to ATMS channels 3 to 15. Table 4 presents the comparison results of information content and DFS. The information content of hyper-spectral channels is about 46% higher than that of ATMS type, and DFS is approximately 20% higher.

Table 4.
The comparison of information content and DFS between the ATMS-type channels and the hyper-spectral channels.
At present, there are multiple quantities to describe the microwave hyper-spectral detection capability, such as a set of weight functions, corresponding information content and DFS. From Figure 3, it can be found that, for many channels, the shapes and peak altitudes of the weighting functions are so close that they can not be clearly distinguished. For these hyper-spectral channels, one may want to know the relationship between the information content and the vertical distribution of the weighting function. If the weighting functions of each channel are plotted according to the sorted information content, we can find that the arrangement of the peak altitudes of the weighting functions almost automatically displays a certain layered structure. Figure 13 shows the weighting functions corresponding to the top 10 channels shown in Table 3. Nearly for the first 50 channels, this relationship can be clearly seen. But for the remaining channels, the layered structure is not so clear. For the channels with very close information content and weighting function such as the No. 2 and No. 9 channels in Figure 13, they can be regarded as replacements of each other in their applications. These results are expected to provide references for channel selection in future data application.
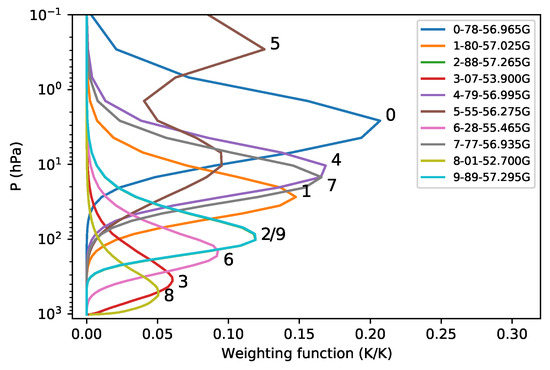
Figure 13.
The weighting functions of the top 10 channels shown in Table 3. The weighting functions are labeled by their sorted number according to the amount of information content. The legend is shown by the format of [sorted number-channel number-frequency].
5. Discussion
So far, observations from existing microwave sensors have played a key role in NWP field. One may think that the current microwave channels are sufficient for geostationary microwave satellite. Hyper-spectral, or finer spectral resolution, is not necessary for microwave sounding. Actually, the volume of observation data generated by the hyper-spectral band is much higher than that by existing channels, resulting in the slower computation speed for retrieval or assimilation. However, there are many potential advantages for the microwave satellite to use hyper-spectral technique. Besides the above mentioned benefits such as higher information content and more dense sampling of atmosphere along the vertical direction, hyper-spectral band has other potential as illustrated by other studies. First, it could be used to mitigate the radio frequency interference (RFI) problems, especially when RFI arises as continuous narrow bandwidth [7]. Second, it could serve as an intercalibration reference due to its high spectral resolution [9,20]. Finally, the uncertainties in the spectroscopy of oxygen absorption lines and the inference of line strengths and widths for a narrow channel will be decreased, compared to those for a wide channel [4], meaning that better microwave radiation modeling and retrieval can be obtained. hyper-spectral sensors are therefore considered as the replacements to the current operational microwave sounding sensors.
Weighting function is a very important parameter for analyzing the performance of hyper-spectral band because it can specify which part of the atmosphere the radiation comes from. It can be characterized by its peak altitude and FWHM, which can be used to measure whether two adjacent functions can be clearly distinguished. Most of the weighting functions have smooth shape from the bottom to the upper atmosphere, looking like a spectral response function. Only a few channels have irregular shape mainly because the continuous sampling of the spectrum can not exclude the center of the fine absorption line. These channels are not suggested to be used in the retrieval of atmospheric temperature. But they can be used in the NWP model where the retrieval of temperature is not needed. Furthermore, the distribution of the absorption coefficients is the main physical basis for analyzing the characteristics of the weighting functions. Figure 14 shows the layered oxygen absorption coefficients near 55 GHz. At the bottom atmosphere, the absorption is nearly continuous. But at the upper atmosphere, it is isolated and exhibits great gradient around each line. As mentioned above, if the peak of the small oxygen absorption is located asymmetrically in a channel’s pass band, the weighting function will appear irregular.
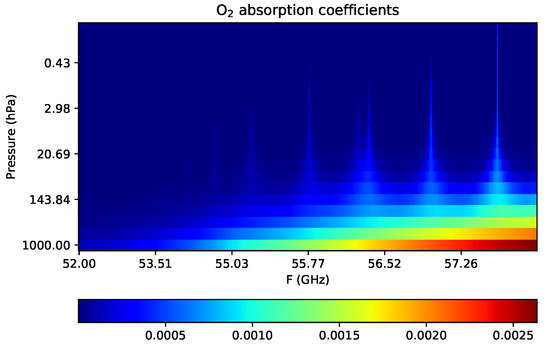
Figure 14.
The distribution of the oxygen absorption coefficients. The unit is km.
The scalar parameter information content allow us to assess the performance of microwave hyper-spectral band to some extent without the need to perform real retrievals or assimilation. In order to make the results representative and understand the impact of atmospheric background fields on information content or DFS, two data sets are used to analyze the results. The specific values of information contents and DFS are different for the two data sets. But they show very similar spectra of information content for each channel. These above analysis is conducted using an error of 10 K in the prior temperature profiles. If the error is increased, for example, to the standard deviation of temperature variation as large as 20 K in the first data set shown in Figure 3, the specific value of the information content and DFS are increased, too. But the top channel sequence and relative distribution of the information content in the hyper-spectral band, do not change.
6. Conclusions
This paper has analyzed the characteristics of geostationary orbit microwave hyper-spectral channels from the aspects including specifications, weighting functions and information content. The vertical distribution of the weighting functions and the average kernel indicate that hyper-spectral channels have the ability to densely sample atmospheric profiles. Thus, they have the potential to improve the vertical resolution of atmospheric temperature profile retrieval. Compared with the existing wide channels used for temperature detection, the total information content has increased by about 46%, indicating that hyper-spectral observation can further improve inversion accuracy, particularly in regions where the area of average kernel is close to 1. The information content of each channel has been calculated and the information spectrum has also been analyzed. High information content channels and enriched areas are selected. The informative spectral region have good consistency with the existing channels, particularly near 57 GHz. The information content further combined with the distribution of the weight function, valuable references could be provided for the selection of observation data.
The simulation and performance analysis of microwave hyperspectrum in this paper are limited to clear skies, without considering the effects of clouds and observation angles. In addition, only the typical emissivity of the ocean surface is considered, without considering the influence of more complex surface types. In order to better understand and apply the actual observation data of microwave hypersepctra in orbit, these impacts need to be simulated and analyzed by retrieval experiment in our future research.
Author Contributions
Conceptualization, software and writing original draft, Y.B.; Supervision, J.Y. and C.W.; Analysis and investigation, F.D., W.X. and D.A.; Methodology and visualization, Y.L., J.F. and L.Z. All authors have read and agreed to the published version of the manuscript.
Funding
This study was funded by National Key Research and Development Program of China (2022YFF0801302).
Data Availability Statement
The data that support the findings of this study are available from the author, Yanmeng Bi, upon request.
Conflicts of Interest
The authors declare no conflict of interest.
References
- Aumann, H.; Chahine, M.; Gautier, C.; Goldberg, M.; Kalnay, E.; McMillin, L.; Revercomb, H.; Rosenkranz, P.; Smith Sr, W.; Staelin, D.; et al. AIRS/AMSU/HSB on the Aqua mission: Design, science objective, data products, and processing systems. IEEE Trans. Geosci. Remote Sens. 2003, 41, 253–264. [Google Scholar] [CrossRef]
- Kim, E.; Lyu, C.H.J.; Anderson, K.; Vincent Leslie, R.; Blackwell, W.J. S-NPP ATMS instrument prelaunch and on-orbit performance evaluation. J. Geophys. Res. Atmos. 2014, 119, 5653–5670. [Google Scholar] [CrossRef]
- Yang, Z.; Lu, N.; Shi, J.; Zhang, P.; Dong, C.; Yang, J. Overview of FY-3 Payload and Ground Application System. IEEE Trans. Geosci. Remote Sens. 2012, 50, 4846–4853. [Google Scholar] [CrossRef]
- Boukabara, S.A.; Garrett, K. Benefits of a hyperspectral microwave sensor. In Proceedings of the 2011 IEEE Sensors Proceedings, Limerick, Ireland, 28–31 October 2011; pp. 1881–1884. [Google Scholar]
- Lipton, A. Satellite sounding channel optimization in the microwave spectrum. IEEE Trans. Geosci. Remote Sens. 2003, 41, 761–781. [Google Scholar] [CrossRef]
- Blackwell, W.J.; Bickmeier, L.J.; Leslie, R.V.; Pieper, M.L.; Samra, J.E.; Surussavadee, C.; Upham, C.A. Hyperspectral Microwave Atmospheric Sounding. IEEE Trans. Geosci. Remote Sens. 2011, 49, 128–142. [Google Scholar] [CrossRef]
- Aires, F.; Prigent, C.; Orlandi, E.; Milz, M.; Eriksson, P.; Crewell, S.; Lin, C.C.; Kangas, V. Microwave hyperspectral measurements for temperature and humidity atmospheric profiling from satellite: The clear-sky case. J. Geophys. Res. Atmos. 2015, 120, 11334–11351. [Google Scholar] [CrossRef]
- Aires, F.; Prigent, C.; Buehler, S.A.; Eriksson, P.; Milz, M.; Crewell, S. Towards more realistic hypotheses for the information content analysis of cloudy/precipitating situations – Application to a hyperspectral instrument in the microwave. Q. J. R. Meteorl. Soc. 2019, 145, 1–14. [Google Scholar] [CrossRef]
- Kummerow, C.D.; Poczatek, J.C.; Almond, S.; Berg, W.; Jarrett, O.; Jones, A.; Kantner, M.; Kuo, C.P. Hyperspectral Microwave Sensors—Advantages and Limitations. IEEE J. Sel. Top. Appl. Earth Obs. Remote Sens. 2022, 15, 764–775. [Google Scholar] [CrossRef]
- Rodgers, C.D. Inverse Methods for Atmospheric Sounding; World Scientific: Singapore, 2000. [Google Scholar]
- Rodgers, C.D. Information content and optimisation of high spectral resolution remote measurements. Adv. Space Res. 1998, 21, 361–367. [Google Scholar] [CrossRef]
- Buehler, S.; Eriksson, P.; Kuhn, T.; von Engeln, A.; Verdes, C. ARTS, the atmospheric radiative transfer simulator. J. Quant. Spectrosc. Radiat. Transf. 2005, 91, 65–93. [Google Scholar] [CrossRef]
- Eriksson, P.; Buehler, S.; Davis, C.; Emde, C.; Lemke, O. ARTS, the atmospheric radiative transfer simulator, version 2. J. Quant. Spectrosc. Radiat. Transf. 2011, 112, 1551–1558. [Google Scholar] [CrossRef]
- Matricardi, M. The Generation of RTTOV Regression Coefficients for IASI and AIRS Using a New Profile Training Set and a New Line-by-Line Database; ECMWF: Reading, UK, 2008. [Google Scholar] [CrossRef]
- Lupu, C. Data Assimilation Diagnostics: Assessing the Observations Impact in the Forecast; ECMWF Data Assimilation Training Course; ECMWF: Reading, UK, 2019. [Google Scholar]
- Collard, A. Selection of IASI channels for use in Numerical Weather Prediction. Q. J. R. Meteorl. Soc. 2007, 133, 1977–1991. [Google Scholar] [CrossRef]
- Martinet, P.; Lavanant, L.; Fourrié, N.; Rabier, F.; Gambacorta, A. Evaluation of a revised IASI channel selection for cloudy retrievals with a focus on the Mediterranean basin. Q. J. R. Meteorl. Soc. 2014, 140, 1563–1577. [Google Scholar] [CrossRef]
- Michele, S.D.; Bauer, P. Passive microwave radiometer channel selection basedoncloudandprecipitation information content. Q. J. R. Meteorol. Soc. 2006, 132, 1299–1323. [Google Scholar] [CrossRef]
- Mahfouf, J.F.; Birman, C.; Aires, F.; Prigent, C.; Orlandi, E.; Milz, M. Information content on temperature and water vapour from a hyper-spectral microwave sensor. Q. J. R. Meteorol. Soc. 2015, 141, 3268–3284. [Google Scholar] [CrossRef]
- Misra, S.; Mohammed, P.N.; Guner, B.; Ruf, C.S.; Piepmeier, J.R.; Johnson, J.T. Microwave Radiometer Radio-Frequency Interference Detection Algorithms: A Comparative Study. IEEE Trans. Geosci. Remote Sens. 2009, 47, 3742–3754. [Google Scholar] [CrossRef]
Disclaimer/Publisher’s Note: The statements, opinions and data contained in all publications are solely those of the individual author(s) and contributor(s) and not of MDPI and/or the editor(s). MDPI and/or the editor(s) disclaim responsibility for any injury to people or property resulting from any ideas, methods, instructions or products referred to in the content. |
© 2024 by the authors. Licensee MDPI, Basel, Switzerland. This article is an open access article distributed under the terms and conditions of the Creative Commons Attribution (CC BY) license (https://creativecommons.org/licenses/by/4.0/).