Abstract
At present, there is still some uncertainty in the evaluation of the performance of the Fengyun 4A Lightning Mapping Imager (LMI), which is mainly limited by the detection performance of the reference detection system and the suitability of the evaluation method. In this paper, a one-to-one performance evaluation of the LMI was performed based on total lightning flash data from the lightning Low-Frequency Electric field Detection Array (LFEDA). It was found that there were significant systematic biases in the discharge results detected via LMI, with a median of −0.946 s, −0.0817°, and −0.0245° in time bias, longitude bias, and latitude bias, respectively. The evaluation results after removing the systematic biases indicated that the relative detection efficiency for flashes of LMI was 17.6%, the mean and median time errors were both 0.647 s, and the mean and median distance errors were 6.09 km and 5.02 km, respectively. The relative detection efficiency for groups of LMI was 9.8%, the mean and median time errors were 0.674 s and 0.660 s, and the mean and median distance errors were 7.19 km and 6.54 km, respectively. The detection efficiency of LMI for both flashes and groups at nighttime was significantly higher than its detection efficiency during the daytime. The relative detection efficiency for flashes of LMI at nighttime was 26.5%, while during the daytime it was 14.4%. The relative detection efficiency for groups of LMI at nighttime was 16.2%, while during the daytime it was only 7.4%. The spatial accuracy for both flashes and groups was always better during the daytime than at nighttime.
1. Introduction
The techniques for lightning detection mainly include space-based and ground-based methods. At present, ground-based lightning detection mainly achieves wide-area positioning with high detection accuracy via multiple sub-station networks [1,2,3,4,5]. Space-based lightning detection is capable of achieving macroscale detection over global areas with a single detector. With the development of technology, the method of space-based lightning observation has evolved from the low-orbit satellite onboard to the geostationary orbit satellite onboard which is capable of realizing all-weather, uninterrupted detection for total lightning flashes [6,7,8].
Typical satellite-based lightning observation systems include the Geostationary Lightning Mapper (GLM) on the R-series of the United States Geostationary Operational Environmental Satellite (GOES) [8], the Lightning Mapping Imager (LMI) on the Chinese new-generation geostationary satellite FY-4A [9] and the Lightning Imager (LI) on the Meteosat Third Generation Imager-1 (MTG-I1) [10,11]. LMI is the first lightning imager onboard a satellite independently developed by China, which is capable of continuously detecting lightning activities in areas neighboring China and nearby seas [12,13,14]. The performance evaluation of LMI has become important to research in the stage of promoting the application of its data.
There are existing performance evaluations of LMI that show that the observation results of LMI are in agreement with the reference system and that LMI can capture location information of lightning to some extent. These assessments are mainly based on the information of ground-based positioning networks (WWLLN or ADTD) [12,14], but these ground-based positioning systems mainly detect strong lightning or cloud-to-ground flashes (CG) and have a lower detection capability of intracloud flashes (IC), so the assessment results can hardly reflect the true detection capability of LMI in total lightning flashes. Moreover, in the process of the assessments, many studies mainly focused on the comparison of detection results at large temporal and spatial scales and did not realize one-to-one comparisons at the level of discharge events [12,14,15,16,17], so there is uncertainty in the results of these assessments.
Based on the reliable and efficient detection data of total lightning flashes detected via the Low-Frequency Electrical field Detection Array (LFEDA) [18], this paper obtained the systematic deviation of LMI through overall comparison and evaluated the detection capability of LMI in terms of groups and flashes through one-to-one comparison. This paper presents more realistic performance indexes for the detection capability of LMI, aiming to provide objective standards for the application of its data.
2. Data Sources
In order to obtain the relative detection capability of LMI in this paper, the data of total lightning flashes detected via LMI was compared with that detected via the LFEDA.
2.1. FY-4A Lightning Mapping Imager
The Lightning Mapping Imager onboard the Fengyun-4A geostationary meteorological satellite is the first independently developed and operated lightning imager onboard a satellite in China. LMI takes advantage of the charge-coupled device (CCD) imaging techniques to track lightning optical signals based on the optical transient characteristic of lightning. The CCD array contains 400 × 600 tiny pixels, with a detection center wavelength of 777.4 nm and a bandwidth of 1 nm. The CCD array detects 500 frames per second, and the integration time for a single-frame image is 2 ms. The LMI on the Fengyun-4A geostationary meteorological satellite is tilted to the north to ensure the observation of lightning activities within the regional scope of China. When the satellite is positioned at 105°E, the detection range of LMI can cover the land area of China as well as the adjacent oceans, realizing the monitoring of lightning activities in the region of China [13,14,15]. In the region studied in this paper, the resolution of LMI was about 9 km [17]. The data products provided by LMI included both ‘events’ and ‘groups,’ which provided information on time, geographic location, optical radiant energy, and coverage of the detected lightning. Events corresponded to the pixel units on the CCD that were illuminated by lightning. When the strength of the optical signal was greater than the set threshold of the event, a lightning ‘event’ was judged to have been detected and then outputted. The time resolution of each event was 2 ms. A lightning optical pulse illuminated multiple pixel units, and these simultaneously illuminated events that have shared boundaries or angular adjacencies were given their weighted center-of-mass positions based on the intensity of their radiated energy as the position of ‘group.’ The ‘group’ represents the illuminated region of a lightning discharge event, also with a temporal resolution of 2 ms [6,19].
2.2. Low-Frequency Electrical Detection Array
LFEDA has been under construction since 2014, with seven substations in Conghua and the surrounding areas of Guangdong province. Three substations were added from 2015 to 2016. The location of one substation was adjusted in 2017. Finally, a stable 10-substation detection network was formed and is currently in operation [18,20]. The baseline range of the substations is 6–60 km. With at least five stations detecting signals synchronously, high-precision 3D positioning of total lightning flashes can be achieved within 100 km × 100 km based on the time-of-arrival method. Additionally, a certain level of channel positioning capability is available. Each substation of LFEDA mainly consists of a high-sensitivity fast antenna, a signal collector, and a high-precision GPS clock source. The sensitivity of the fast antenna is less than 1 V/m. After the antenna receives the spatial signals, it outputs the signals in the frequency band of 160 Hz~600 kHz at the collector after being low-pass filtered by an integrating circuit with a time constant of 1 ms. The sampling rate is 10 MS/s. The accuracy of the GPS time is better than 30 ns, and the accuracy of the final waveform data is about 100 ns. Each substation captures the no-dead-time signal of the discharge and the high-precision timestamp tagging, enabling it to be used for omission-free detection and high-precision three-dimensional positioning of thunderstorm electrical activity [1,18].
As a reference object for LMI performance evaluation, the results detected via LFEDA were the location of each lightning discharge pulse. The pulses represented individual lightning discharge events and had a time resolution of 10 μs. LFEDA has a high positioning accuracy and detection efficiency. Comparison with the Lightning Location System of the Guangdong power grid (GDLLS) [21,22] showed that the match between LFEDA and GDLLS in positioning results is up to 95% and the results of the two systems had good spatial and temporal consistency [20]. The calibration results based on artificially triggered lightning experiments show that LFEDA achieved 100% and 95% detection efficiency of flashes and return strokes [20]. The positioning error of return strokes in the plane was 102 m [18].
3. Assessment Methodology
3.1. Methods for the Flash and Group Clustering
To perform a one-to-one comparison between the data of LMI and LFEDA at the ‘flash’ and ‘group’ levels, the data detected via LMI and LFEDA needed to be processed to ensure that it corresponded to consistent physical processes. We introduced the methods at two levels.
At the flash level, it is necessary to cluster the groups of LMI (LMI_Gs) into flashes (LMI_Fs) and cluster the discharge events of LFEDA into LFEDA flashes (LFEDA_Fs). The time of LMI_F is specified as the average time of all LMI_Gs in the LMI_F, and the position of LMI_F is the center of mass position of all LMI_Gs in the LMI_F. The time of the LFEDA_F is calculated as the average time of all discharge events in the LFEDA_F, and the position of LFEDA_F is determined as the center of mass of the convex hull of all discharge events in the LFEDA_F. Considering that the resolution of LMI in the Guangdong region is around 9 km, a spatial threshold of 16.5 km was applied for LMI_G clustering to LMI_F, along with a time threshold of 330 ms [15,16,23].
The discharge events of LFEDA cluster into flashes. Considering that the LFEDA has high positioning efficiency and relatively accurate positioning accuracy after continuous upgrading, the algorithm for flash clustering refers to the flash clustering method proposed by MacGorman et al. [24] when processing the data of LMA (Lightning Mapping Array, an efficient VHF lightning detection system). Not only does the temporal and spatial relationship between the current pulse event and the previous pulse event need to be considered, but also the temporal and spatial relationship between the pulse event and the entire segment of judged lightning events, as well as the total length of the discharge time of a single flash. The specific parameter scheme is as follows. The current discharge event is categorized into the temporary flash if the following conditions are also met: 1. The time difference between the current discharge event and the last discharge event in the temporary flash is less than T1. 2. There is a discharge event in the temporary flash that meets both the time difference and the spatial distance criteria. The time difference between the current discharge event and the discharge event in the temporary flash is less than T2, and the spatial distance is less than D2. If there is any discharge event between two or more temporary flashes with a time difference and spatial distance of less than T2 and D2, then these temporary flashes will merge as long as the duration of the flashes does not exceed 3 s. The values of T1, T2, and D2 were 0.4 s, 0.6 s, and 4 km, respectively. The flash recognition of LFEDA, using the flash clustering algorithm, can reach 93% under these values [20].
At the group level, the information of the group (LMI_G) representing a luminous segment of the lightning discharges within a 2 ms timeframe is already available in the product data of LMI. On the other hand, the data of LFEDA represents a single lightning discharge event of maximum intensity within an interval of 10 us. For the two systems to be matched, the discharge events of LFEDA needed to be first clustered into segments similar to the groups of LMI, which we referred to as LFEDA_G. The specific method was as follows: first, all discharge events of LFEDA in the study area were clustered into LFEDA_Fs and then, temporal clustering was performed in each LFEDA_F to divide it into one or more LFEDA_Gs. As shown in Figure 1, the LFEDA_Gs of one LFEDA_F are demonstrated. The discharge events labeled with the same color belong to one LFEDA_G. The time of the LFEDA_G was the average time of all the discharge events in the LFEDA_G, and the position of the LFEDA_G was the center of mass of the convex hull of all the discharge events in the LFEDA_G.
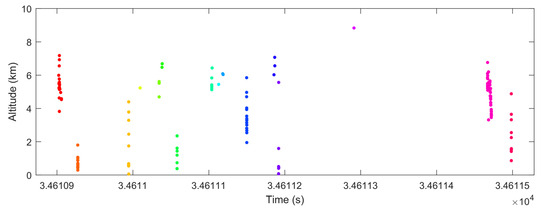
Figure 1.
The LFEDA_Gs in one LFEDA_F, the dots labeled with the same color belong to the same LFEDA_G.
3.2. Time-Space Matching Criteria
The results observed via satellite and ground-based instruments were different due to the differences in detection techniques. It was necessary to apply a spatiotemporal threshold to impose specific constraints on the detection results to identify the corresponding events detected by the two systems. In other words, if the lightning events detected by the two systems fell within a certain spatiotemporal threshold, they were considered to be the same event [25,26,27].
To determine the value of the spatiotemporal threshold, we defined the coincident rate (CR) as a metric for the matching of LFEDA_Gs and LMI_Gs. The CR can be calculated via the following Equation (1):
where is the number of LMI_Gs that can match up with LFEDA_Gs within a certain spatiotemporal threshold, is the number of LMI_Gs in the area studied. The spatiotemporal threshold for the final match was determined by observing the curve of change in the CR over the spatiotemporal threshold.
Note that the main purpose of matching through spatiotemporal thresholds was to correct the systematic biases of the LMI and establish an initial correspondence between the product data of LMI and the discharge events of LFEDA. It did not realize the one-to-one correspondence between LMI_Gs and LFEDA_Gs. The details of the one-to-one matching methodology are outlined in Section 3.4.
3.3. Matching Method between LMI_F and LFEDA_F
Using the time-space matching criteria method described in Section 3.2, we obtained the initial matching results between LMI_Gs and LFEDA_Gs. The LMI_Fs and LFEDA_Fs were obtained through flash clustering. Based on these results, we established a one-to-one correspondence at the flash level using the index method referring to Zhang et al. [23,25]. In other words, one LMI_F corresponded to one LFEDA_F. The specific method is as follows:
If LMI_G and LFEDA_G have been matched, they are then indexed to their respective corresponding LMI_F and LFEDA_F. At this point, the LMI_F matched the LFEDA_F. In addition, only one match was allowed in the flash matching. This meant that an LMI_F can only correspond to one LFEDA_F. If there was more than one correspondence, the one with the smallest time difference was matched. Furthermore, we removed the matched LMI_Gs contained in the LMI_Fs that were not matched from the dataset of LMI_Gs that had been matched.
3.4. Matching Method between LMI_G and LFEDA_G
We performed the matching using the method proposed in Section 3.3, where an LMI_F will only correspond to one LFEDA_F. However, it was not clear exactly which LMI_G of the LMI_F corresponded to which LFEDA_G of the LFEDA_F. For the subsequent discussion on the detection efficiency as well as detection accuracy of LMI, it was necessary to establish a one-to-one correspondence between LMI_G and LFEDA_G. Based on the one-to-one matching results of the flashes, we sliced the matched LFEDA_F to obtain the LFEDA_Gs in each matched LFEDA_F. Then, we utilized the time-series information of LFEDA_Gs to compare it with that of LMI_Gs in order to establish a one-to-one correspondence between LMI_Gs and LFEDA_Gs. The specific method is as follows:
Between each pair of LMI_F and LFEDA_F that have been matched, if the time difference between any pair of LFEDA_Gs was closest to the time difference between any pair of LMI_Gs, then we calculated the time difference between the first LFEDA_G and LMI_G of the two pairs of groups. This time difference was considered as the time difference between the LFEDA_F and LMI_F, adding it to each LMI_G in this LMI_F. Each subsequent LMI_G corresponded to its nearest LFEDA_G within 100 ms (roughly the time it takes for light to reach the geostationary orbit from the cloud tops), which achieved a one-to-one correspondence between LMI_G and LFEDA_G. After checking, the one-to-one results between LMI_G and LFEDA_G corresponded well. Figure 2 shows a one-to-one relationship between LMI and LFEDA at the ‘group’ level.
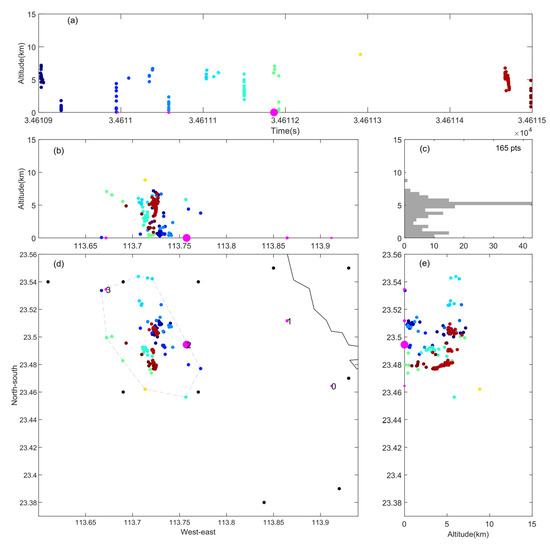
Figure 2.
One-to-one correspondence results of the same flash process of LMI and LFEDA at the group level are shown, the colored dots are the discharge events detected via LFEDA, the color represents the time of the discharge events, the blue dashed line is the convex hull that contains all the discharge events of LFEDA, the pink dots are the LMI_G, the size of the pink dots represents the energy density of LMI_G, the serial number represents the order in the occurrence of LMI_G, and the black dots are ‘events’ detected via LMI. (a) The height of discharges over time, (b) the distribution in the east-west of the height of discharges, (c) the distribution in the number of discharges from the radiation source over height, (d) the planar distribution of the discharges in the east-west-north-south, and (e) the distribution in the north-south of the height of discharges.
3.5. Detection Efficiency
The detection efficiency of a lightning detection system is defined as the ratio between the number of detected lightning events and the total number of lightning events. This section provides the calculation of the detection efficiency utilized in this study.
As shown in Figure 3, assume that S represents the set of all lightning discharges that occurred in the study area at a specific time. A denotes the set of discharges monitored by the LMI, while B represents the set of discharges detected via the LFEDA. U is the concatenation of A and B, and I is the intersection of A and B (the one-to-one matching results between the LMI and LFEDA). Ideally, the combination of the LMI and LFEDA would be able to monitor all lightning discharges. However, in practice, neither system can capture all lightning discharges, resulting in a certain number of false alarms. The magnitude of S is unknown, and U ≤ S.
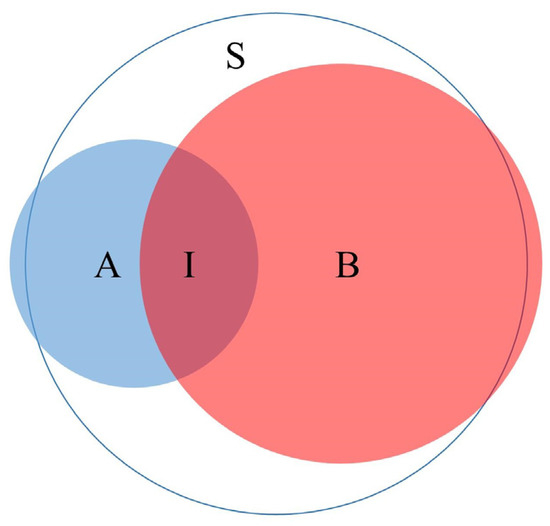
Figure 3.
Schematic of the relationship between sets S (total lightning discharges), A (lightning discharges monitored via LMI), and B (lightning discharges monitored via LFEDA).
In this paper, three types of detection efficiencies of lightning detection systems are defined: true detection efficiency, relative detection efficiency, and estimated detection efficiency [23,26,28]. The true detection efficiency of the system can be expressed as follows:
where represents the true detection efficiency of the system, and represent the number of lightning discharges that set A and set B contain, respectively, and represents the number of lightning discharges in set S. However, S is unknown, which makes it difficult to give the true detection efficiency of the system.
In general, when comparing the detection efficiency of two systems, one system is typically used as a reference. The detection efficiency of the other system is then measured relative to the reference system. The relative detection efficiency of a system can be expressed as follows:
where is the relative detection efficiency of A for B, is the relative detection efficiency of B for A, and is the number of lightning discharges in set I. Moreover,, according to Bayesian theory, the relative detection efficiency of the system can be expressed as [29,30]:
where and represent the detection efficiency of A for B and the detection efficiency of B for A, i.e., and , respectively. and denote the true detection efficiency of A and B, respectively.
The set U is usually larger than a single set A or B and closer to the set S. The estimated detection efficiency based on the set U is close to the upper limit of the true detection efficiency of the system and is relatively more accurate. The estimated detection efficiency of the system can be expressed as follows:
where and are the estimated detection efficiencies for A and B, respectively. is the number of lightning discharges in the set U. Since the true detection efficiency is difficult to give, only the relative detection efficiency as well as the estimated detection efficiency are given in this paper.
4. Assessment Results
4.1. The Systematic Bias of LMI
Figure 4 shows the distribution of the LMI_Gs and the discharge events of LFEDA on 7 August 2019, within a 150 km radius from the center of the LFEDA network. We can see that although the results detected via the two systems were consistent to some extent in space, they do not completely overlap and have systematic biases.
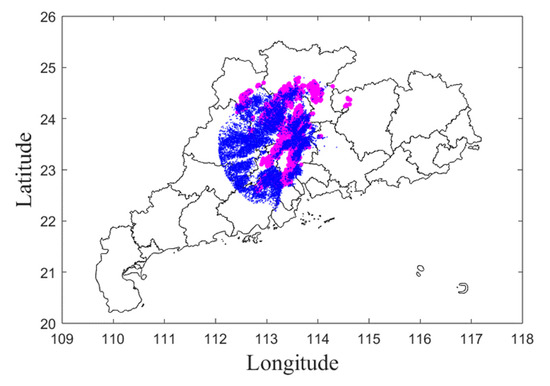
Figure 4.
Display of LMI_Gs and the discharge events of LFEDA within a 150 km radius from the center of the LFEDA network in the Guangdong region on 7 August 2019 (blue dots represent the discharge events of LFEDA, pink dots represent LMI_Gs).
We use the data detected via LFEDA as a baseline to investigate the systematic bias that exists in the LMI. The selected area was within a 50 km radius from the center of the LFEDA network to ensure higher quality in the positioning results of LFEDA. The variation of the CR with different spatiotemporal thresholds was determined using the spatiotemporal matching criterion method proposed in Section 3.1. Figure 5 shows the variation in the CR of LMI under different spatial and temporal thresholds. It was found that in the case of a fixed spatial threshold, the CR increased with the increase in the temporal threshold, but the increasing trend was getting smaller and smaller and it tended to be stabilized after 2.1 s. Similarly, the CR increased with the increase in the spatial threshold when the temporal threshold was fixed. The magnitude of the increase became smaller and smaller and stabilized after 25 km. Finally, the time and spatial thresholds of 2.1 s and 25 km were used to match LMI_Gs and LFEDA_Gs.
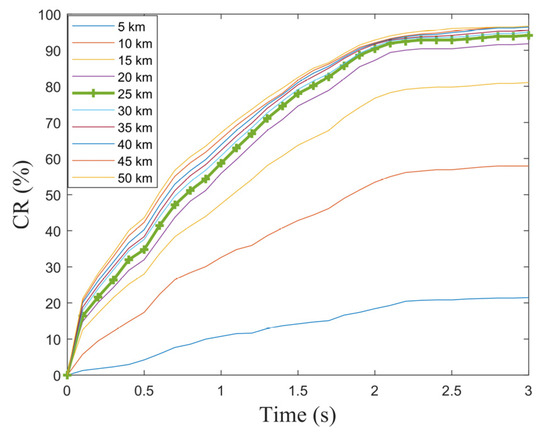
Figure 5.
Variation of the CR with different spatiotemporal thresholds.
Using the above spatiotemporal threshold for matching, the probability distributions on the spatiotemporal errors of LMI_Gs and LFEDA_Gs was obtained, as shown in Figure 6. Ideally, the probability distribution on spatiotemporal errors should be the normal distribution with a maximum value near 0. However, this was not the case, and the maximum of the probability distributions on spatiotemporal errors were all shifted (blue lines in Figure 6). The mean (median) offset of time errors was −0.896 s (−0.946 s). The mean (median) offset of longitude errors was −0.732° (−0.0817°). The mean (median) offset of latitude errors was −0.0231° (−0.0245°). This suggests that there was a high probability of spatiotemporal systematic biases in the data detected via LMI. We corrected these biases using a simple and effective method that added 0.946 s, 0.0817°, and 0.0245° (given according to their respective medians) to the raw data in time, longitude, and latitude, respectively. Figure 7 shows the comparison between LMI_Gs and the discharge events detected via LFEDA before and after calibration. The consistency of the spatial distribution of the data detected via LMI and LFEDA was greatly improved after a simple calibration. After calibration, the temporal errors of LMI_G and LFEDA_G were calculated again, and the probability distribution of the temporal errors obeyed a normal distribution with the maximum value near 0 (red lines in Figure 6). The mean (median) offset of the time errors was −0.166 s (−0.149 s), the mean (median) offset of the longitude errors was 0.0028° (−0.0025°), and the mean (median) offset of the latitude errors was −0.0043° (−0.0019°).
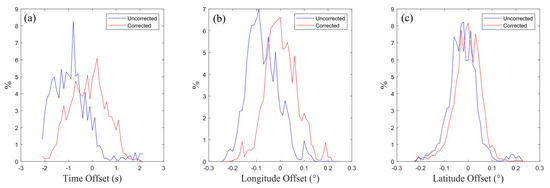
Figure 6.
Plot of probability distribution of spatiotemporal errors. (a) Probability distribution of time errors, (b) probability distribution of longitude errors, and (c) probability distribution of latitude errors.

Figure 7.
Same as Figure 4, but for the range within 50 km from the center of the LFEDA network (blue dots represent the discharge events of LFEDA, pink dots represent LMI_Gs). (a) The raw data and (b) the calibrated data of LMI_Gs.
Figure 8 illustrates the probability distribution of the time and distance difference after correcting for the spatiotemporal biases. It was found that the majority of the data was concentrated within ±1.4 s and 16 km. To minimize the influence of the discrete data on the effect of assessment and to improve the accuracy of the performance assessment of the LMI, the spatiotemporal thresholds of 1.4 s and 16 km were used for matching in Section 4.2. This systematic bias may be related to the height of the cloud tops of thunderstorm clouds. The LMI captures the optical signals of lightning that penetrate the cloud tops through the CCD arrays and calculates the location of the lightning based on the projection relationship [31]. However, this coordinate was the point where the Earth’s surface intersects with the extension line connecting the detection unit on the CCD array and the top of the thunderstorm cloud. It was not the real position where the lightning occurred, thus the position detected via the LMI had a systematic deviation from the real position.
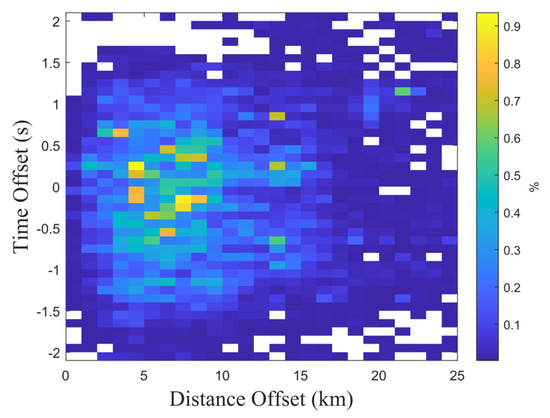
Figure 8.
Probability distribution of time and distance differences after correcting the spatiotemporal biases.
4.2. Performance Evaluation of LMI
Based on the results of correcting the systematic biases in Section 4.1, this paper evaluated the detection efficiency and the accuracy of LMI at the ‘group’ and ‘flash’ levels.
4.2.1. Evaluation of Detection Efficiency in ‘Flash’ and ‘Group’
As shown in Table 1, on 7 August 2019, within 50 km of the center of the LFEDA network, LMI detected a total of 217 LMI_Fs and 782 LMI_Gs, and LFEDA detected a total of 1234 LFEDA_Fs (those having a minimum number of 10 LFEDA sources) and 7916 LFEDA_Gs. In total, 133 flashes and 368 groups were able to be matched one-to-one. Referring to the calculation method of detection efficiency in Section 3, the relative detection efficiency of LMI at the flash level was 17.6% (10.8%/61.3%). The estimated detection efficiency was 16.5% (217/1318) for LMI and 93.6% (1234/1318) for LFEDA. At the group level, the relative detection efficiency of LMI was 9.8% (4.6%/47.1%). The estimated detection efficiency for LMI was 9.4% (782/8330), and the estimated detection efficiency for LFEDA was 95.0% (7916/8330).

Table 1.
Statistics of the results in the study area detected via two systems on 7 August 2019.
In order to study the detection efficiency of LMI in different periods, this paper counted the data detected via LMI during the daytime (6:00–19:00) and the nighttime (19:00–6:00) (Table 2). During the daytime, LMI monitored 131 LMI_Fs and 428 LMI_Gs, and LFEDA detected 911 LFEDA_Fs and 5741 LFEDA_Gs. There were 83 flashes and 219 groups were matched, respectively. The relative detection efficiency of LMI at the flash level was 14.4% (9.1%/63.4%). The estimated detection efficiency was 13.7% (131/959) for LMI and 95.0% (911/959) for LFEDA. The relative detection efficiency of LMI at the group level was 7.4% (3.8%/51.2%). The estimated detection efficiency was 7.2% (428/5950) for LMI and 96.5% (5741/5950) for LFEDA.

Table 2.
Statistics of the data detected via two systems in the study area during the daytime and nighttime on 7 August 2019.
During the nighttime, LMI monitored 86 LMI_Fs and 354 LMI_Gs, and LFEDA detected 323 LFEDA_Fs and 2175 LFEDA_Gs. There were 50 flashes and 149 groups were matched one-to-one, respectively. The relative detection efficiency of LMI at the flash level was 26.5% (15.4%/58.1%). The estimated detection efficiency of LMI was 24.0% (86/359), while the detection efficiency of LFEDA was 90.0% (323/359). The relative detection efficiency of LMI at the group level was 16.2% (6.8%/42.1%). The estimated detection efficiency of LMI and LFEDA at the group level was 14.9% (354/2380) and 91.4% (2175/2380), respectively.
It can be found that regardless of flashes or groups, the detection efficiency of LMI at nighttime was significantly better than that during the daytime. This is because LMI is an optical detector that detects optical signals emitted by lightning. The strong background sunlight during the daytime has an impact on the background light filtering algorithm of LMI [16,32].
4.2.2. Assessment of Detection Accuracy
Based on the systematic biases derived in Section 4.1, this study calculated the detection accuracy of LMI relative to LFEDA at the flash and group levels. As shown in Figure 9, the mean (median) errors in the time and distance of the flashes detected via LMI were 0.647 s (0.647 s) and 6.09 km (5.02 km). The detection accuracy during the daytime was slightly higher than at nighttime. The mean (median) error in the time was 0.599 s (0.577 s) and the mean (median) error in the distance was 5.54 km (4.60 km) during the daytime. On the other hand, the mean (median) error in the time was 0.710 s (0.727 s) and the mean (median) error in the distance was 7.17 km (6.20 km) at nighttime.
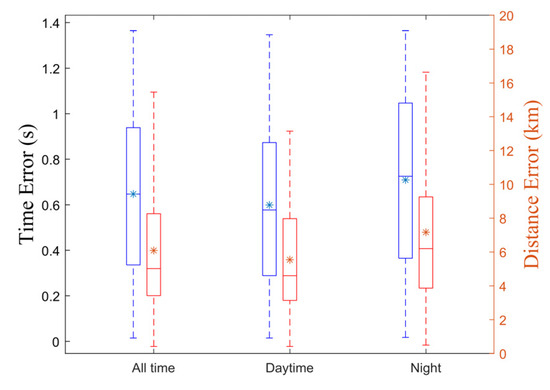
Figure 9.
The detection accuracy of LMI at flash level (blue box plots represent time errors, blue starred marks denote the mean errors in the time, red box plots represent distance errors, red starred marks represent the mean errors in the distance).
Figure 10 illustrates the detection accuracy of the LMI at the group level. The mean (median) errors in the time and distance of the groups detected via the LMI were 0.674 s (0.660 s) and 7.19 km (6.54 km), respectively. Similarly, the detection accuracy during daytime was also better than that at nighttime. The mean (median) errors in the time and distance were 0.609 s (0.558 s) and 6.53 km (5.68 km) during daytime, respectively. The values at nighttime were 0.760 s (0.865 s) and 8.10 km (7.23 km).
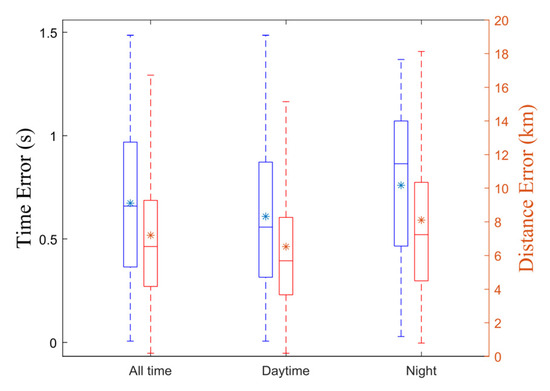
Figure 10.
Same as Figure 9, but for the group level (blue box plots represent time errors, blue starred marks denote the mean errors in the time, red box plots represent distance errors, red starred marks represent the mean errors in the distance).
In addition, this study also presents the detection accuracy of flashes and groups provided via LMI before eliminating the systematic biases, as shown in Figure 11 and Figure 12. The mean (median) error in the time and the distance of flashes detected via LMI was 1.065 s (0.994 s) and 10.98 km (11.11 km). The mean (median) errors in the time and distance were 1.181 s (1.263 s) and 8.71 km (8.55 km) during the daytime, respectively. The values were 0.912 s (0.684 s) and 14.56 km (13.76 km) at nighttime.
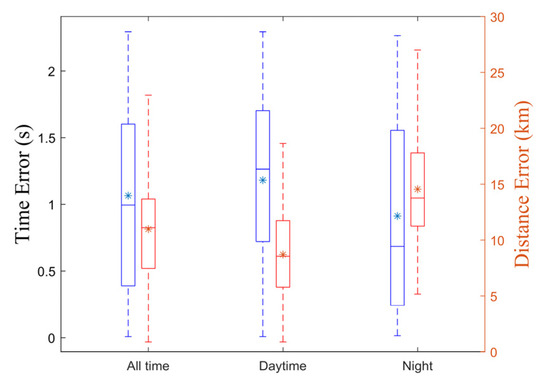
Figure 11.
Same as Figure 9, but for the flash level before revision (blue box plots represent time errors, blue starred marks denote the mean errors in the time, red box plots represent distance errors, red starred marks represent the mean errors in the distance).
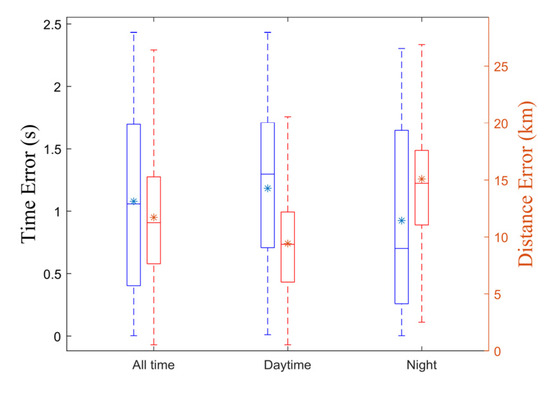
Figure 12.
Same as Figure 9, but for the group level before revision (blue box plots represent time errors, blue starred marks denote the mean errors in the time, red box plots represent distance errors, red starred marks represent the mean errors in the distance).
The mean (median) errors in the time and distance of the groups were 1.079 s (1.059 s) and 11.72 km (11.25 km). The mean (median) error in the time was 1.183 s (1.297 s) and that in the distance was 9.42 km (9.35 km) during the daytime. The mean (median) errors in the time and distance at nighttime were 0.925 s (0.702 s) and 15.09 km (14.71 km), respectively.
By comparing the detection accuracies during the daytime and nighttime before and after correcting the systematic biases, it was observed that the temporal accuracy during the daytime was better than at nighttime before correcting the biases, regardless of flashes or groups. However, the opposite was true after the biases were corrected. The spatial accuracy was always better during the daytime than at nighttime, regardless of whether the systematic biases were removed or not. This may be due to potential variations in the spatiotemporal systematic offset of LMI between daytime and nighttime, which requires further investigation through in-depth studies.
5. Conclusions and Discussion
In this paper, we assessed the detection ability of the LMI onboard the FY-4A satellite by one-to-one matching it with the 3D total lightning flash data detected via the ground-based network (LFEDA). The main conclusions are as follows:
- There was a systematic bias in the data detected via LMI. The time bias was around −0.946 s, the longitude bias was about −0.0817° and the latitude bias was about −0.0245°.
- The relative detection efficiency of LMI at the flash level was 17.6%, while the estimated detection efficiency was 16.5%. The relative detection efficiency of LMI at the group level was 9.8% and the estimated detection efficiency was 9.4%. The detection efficiency of LMI for both flash and group at nighttime was significantly better than its detection efficiency during the daytime. The relative detection efficiency and the estimated detection efficiency for flash achieved 26.5% and 24.0% at nighttime, whereas it was 14.4% and 13.7% during the daytime. The relative detection efficiency of LMI at the group level was 16.2% and the estimated detection efficiency was 14.9% at nighttime, while they were only 7.4% and 7.2% during the daytime, respectively.
- After removing the systematic biases, the mean (median) errors in the time and distance at the flash level were 0.647 s (0.647 s) and 6.09 km (5.02 km), respectively. The mean (median) detection errors of time and distance at the group level were 0.674 s (0.660 s) and 7.19 km (6.54 km), respectively. Before the systematic biases adjustment, the mean (median) time error of LMI_Fs was 1.065 s (0.994 s), and the distance error was 10.98 km (11.11 km). The mean (median) time and distance errors of LMI_Gs were 1.079 s (1.059 s) and 11.72 km (11.25 km), respectively.
- There was a significant difference in the detection accuracy of LMI during the daytime and at nighttime. When the systematic biases were removed, the mean (median) time and distance errors of LMI_Fs were 0.599 s (0.577 s) and 5.54 km (4.60 km), respectively. The corresponding values were 0.710 s (0.727 s) and 7.17 km (6.20 km) at nighttime. The values of LMI_Gs were 0.609 s (0.558 s) and 6.53 km (5.68 km) during the daytime, while the values were 0.760 s (0.865 s) and 8.10 km (7.23 km) at nighttime. Before correcting the systematic biases, the mean (median) time and distance errors of the LMI_Fs were 1.181 s (1.263 s) and 8.71 km (8.55 km) during the daytime, while the LMI_Gs were 1.183 s (1.297 s) and 9.42 km (9.35 km). During the nighttime, the mean (median) time and distance errors of the LMI_Fs were 0.912 s (0.684 s) and 14.56 km (13.76 km), while for the LMI_Gs, they were 0.925 s (0.702 s) and 15.09 km (14.71 km). The spatial accuracy was always better during the daytime than at nighttime, regardless of whether the systematic biases were removed or not.
The evaluation results of this paper correspond to the performance of LMI within a 50 km radius of the center of the LFEDA network in Guangdong. LMI has a wide detection range and its performance varies in different regions. Therefore, further research is needed to explore the impact at different positions. In future work, we will compare and analyze the detection performance of LMI in regions with different latitudes and longitudes.
Author Contributions
Conceptualization, Y.Z.; methodology, Y.Z. and M.Z.; software, M.Z.; validation, Y.Z. and Y.F.; formal analysis, M.Z. and Y.Z.; investigation, M.Z., Y.Z., Y.F., J.W. and H.Z.; resources, Y.Z.; data curation, Y.Z.; writing—original draft preparation, M.Z. and Y.Z.; writing—review and editing, Y.Z.; visualization, M.Z.; supervision, Y.Z.; project administration, Y.Z.; funding acquisition, Y.Z. All authors have read and agreed to the published version of the manuscript.
Funding
This research was funded by the S&T Development Fund of CAMS (2023KJ050), and the Basic Research Fund of Chinese Academy of Meteorological Sciences (Grant 2021Z011, 2023Z008).
Data Availability Statement
The data used in this paper can be obtained from Zenodo at https://zenodo.org/records/10003259 or the corresponding author (zhangyang@cma.gov.cn).
Conflicts of Interest
The authors declare no conflict of interest.
References
- Zhang, Y.; Wang, J.; Zheng, D.; Lyu, W.; Zhang, Y.; Fan, Y.; Fan, X.; Yao, W. Progress of Observation and Study on CMA_FEBLS Low Frequency Three-Dimensional Total Lightning Flash Detection Technology in the Last Decade. J. Trop. Meteorol. 2021, 37, 298–308. [Google Scholar] [CrossRef]
- Wacker, R.S.; Orville, R.E. Changes in Measured Lightning Flash Count and Return Stroke Peak Current after the 1994 U.S. National Lightning Detection Network Upgrade: 1. Observations. J. Geophys. Res. 1999, 104, 2151–2157. [Google Scholar] [CrossRef]
- Cummins, K.L.; Murphy, M.J. An Overview of Lightning Locating Systems: History, Techniques, and Data Uses, with an In-Depth Look at the U.S. NLDN. IEEE Trans. Electromagn. Compat. 2009, 51, 499–518. [Google Scholar] [CrossRef]
- Rison, W.; Thomas, R.J.; Krehbiel, P.R.; Hamlin, T.; Harlin, J. A GPS-Based Three-Dimensional Lightning Mapping System: Initial Observations in Central New Mexico. Geophys. Res. Lett. 1999, 26, 3573–3576. [Google Scholar] [CrossRef]
- Stock, M.G.; Akita, M.; Krehbiel, P.R.; Rison, W.; Edens, H.E.; Kawasaki, Z.; Stanley, M.A. Continuous Broadband Digital Interferometry of Lightning Using a Generalized Cross-Correlation Algorithm. J. Geophys. Res. Atmos. 2014, 119, 3134–3165. [Google Scholar] [CrossRef]
- Mach, D.M.; Christian, H.J.; Blakeslee, R.J.; Boccippio, D.J.; Goodman, S.J.; Boeck, W.L. Performance Assessment of the Optical Transient Detector and Lightning Imaging Sensor. J. Geophys. Res. 2007, 112, 2006JD007787. [Google Scholar] [CrossRef]
- Boccippio, D.J.; Koshak, W.; Blakeslee, R.; Driscoll, K.; Mach, D.; Buechler, D.; Boeck, W.; Christian, H.J.; Goodman, S.J. The Optical Transient Detector (OTD): Instrument Characteristics and Cross-Sensor Validation. J. Atmos. Oceanic Technol. 2000, 17, 441–458. [Google Scholar] [CrossRef]
- Goodman, S.J.; Blakeslee, R.J.; Koshak, W.J.; Mach, D.; Bailey, J.; Buechler, D.; Carey, L.; Schultz, C.; Bateman, M.; McCaul, E.; et al. The GOES-R Geostationary Lightning Mapper (GLM). Atmos. Res. 2013, 125–126, 34–49. [Google Scholar] [CrossRef]
- Yang, J.; Zhang, Z.; Wei, C.; Lu, F.; Guo, Q. Introducing the New Generation of Chinese Geostationary Weather Satellites, Fengyun-4. Bull. Am. Meteorol. Soc. 2017, 98, 1637–1658. [Google Scholar] [CrossRef]
- For the First Time over Europe and Africa, the Lightning Imager (LI) Provides Real-Time Data on the Location and Intensity of Lightning Flashes. Available online: https://www.eumetsat.int/mtg-lightning-imager (accessed on 22 November 2023).
- Holmlund, K.; Grandell, J.; Schmetz, J.; Stuhlmann, R.; Bojkov, B.; Munro, R.; Lekouara, M.; Coppens, D.; Viticchie, B.; August, T.; et al. Meteosat Third Generation (MTG): Continuation and Innovation of Observations from Geostationary Orbit. Bull. Am. Meteorol. Soc. 2021, 102, E990–E1015. [Google Scholar] [CrossRef]
- Hui, W.; Zhang, W.; Lyu, W.; Li, P. Preliminary Observations from the China Fengyun-4A Lightning Mapping Imager and Its Optical Radiation Characteristics. Remote Sens. 2020, 12, 2622. [Google Scholar] [CrossRef]
- Zhang, W.; Hui, W.; Lyu, W.; Cao, D.; Li, P.; Zheng, D.; Fang, X.; Zhang, Y. FY-4A LMI Observed Lightning Activity in Super Typhoon Mangkhut (2018) in Comparison with WWLLN Data. J. Meteorol. Res. 2020, 34, 336–352. [Google Scholar] [CrossRef]
- Liu, Y.; Wang, H.; Li, Z.; Wang, Z. A Verification of the Lightning Detection Data from FY-4A LMI as Compared with ADTD-2. Atmos. Res. 2021, 248, 105163. [Google Scholar] [CrossRef]
- Chen, Z.; Qie, X.; Sun, J.; Xiao, X.; Zhang, Y.; Cao, D.; Yang, J. Evaluation of Fengyun-4A Lightning Mapping Imager (LMI) Performance during Multiple Convective Episodes over Beijing. Remote Sens. 2021, 13, 1746. [Google Scholar] [CrossRef]
- Li, P.; Zhai, G.; Pang, W.; Hui, W.; Zhang, W.; Chen, J.; Zhang, L. Preliminary Research on a Comparison and Evaluation of FY-4A LMI and ADTD Data through a Moving Amplification Matching Algorithm. Remote Sens. 2020, 13, 11. [Google Scholar] [CrossRef]
- Chen, Y. Research and Application of Clustering Algorithm for FY-4A Lightning Mapping Imager. Master’s Thesis, Nanjing University of Information Science and Technology, Nanjing, China, 2019. [Google Scholar]
- Shi, D.; Zheng, D.; Zhang, Y.; Zhang, Y.; Huang, Z.; Lu, W.; Chen, S.; Yan, X. Low-Frequency E-Field Detection Array (LFEDA)—Construction and Preliminary Results. Sci. China Earth Sci. 2017, 60, 1896–1908. [Google Scholar] [CrossRef]
- Mach, D.M. Geostationary Lightning Mapper Clustering Algorithm Stability. JGR Atmos. 2020, 125, e2019JD031900. [Google Scholar] [CrossRef]
- Shi, D. Lightning Location Based on Low-Frequency Electric Fieldpulse and Relationship between Lightning Initiation Andthunderstorm Structure. Master’s Thesis, Nanjing University of Information Science and Technology, Nanjing, China, 2017. [Google Scholar]
- Chen, S.M.; Fan, L.M.; He, H.M.; Zhong, D.Z. Evaluation of the Guang Dong Lightning Location System with Transmission Line Fault Data. IEE Proc. Sci. Meas. Technol. 2002, 149, 9–16. [Google Scholar] [CrossRef]
- Chen, L.; Zhang, Y.; Lu, W.; Zheng, D.; Zhang, Y.; Chen, S.; Huang, Z. Performance Evaluation for a Lightning Location System Based on Observations of Artificially Triggered Lightning and Natural Lightning Flashes. J. Atmos. Ocean. Technol. 2012, 29, 1835–1844. [Google Scholar] [CrossRef]
- Zhang, D. Inter-Comparison of Space- and Groud-Dased Observation of Lightning. Ph.D. Thesis, The University of Arizona, Tucson, AZ, USA, 2019. [Google Scholar]
- MacGorman, D.R.; Rust, W.D.; Schuur, T.J.; Biggerstaff, M.I.; Straka, J.M.; Ziegler, C.L.; Mansell, E.R.; Bruning, E.C.; Kuhlman, K.M.; Lund, N.R.; et al. TELEX The Thunderstorm Electrification and Lightning Experiment. Bull. Amer. Meteor. Soc. 2008, 89, 997–1014. [Google Scholar] [CrossRef]
- Zhang, D.; Cummins, K.L.; Bitzer, P.; Koshak, W.J. Evaluation of the Performance Characteristics of the Lightning Imaging Sensor. J. Atmos. Ocean. Technol. 2019, 36, 1015–1031. [Google Scholar] [CrossRef]
- Zhang, D.; Cummins, K.L.; Nag, A.; Murphy, M.; Bitzer, P. Evaluation of the National Lightning Detection Network Upgrade Using the Lightning Imaging Sensor. In Proceedings of the 24th International Lighting Detection Conference & 6th International Lighting Meteorology Conference, San Diego, CA, USA, 18–21 April 2016. [Google Scholar]
- Zhang, D.; Cummins, K.L. Time Evolution of Satellite-Based Optical Properties in Lightning Flashes, and Its Impact on GLM Flash Detection. J. Geophys. Res. Atmos. 2020, 125, e2019JD032024. [Google Scholar] [CrossRef]
- Rubinstein, M. On the Estimation of the Stroke Detection Efficiency by Comparison of Adjacent Lightning Location Systems. In Proceedings of the 22nd International Conference on Lightning Protection (ICLP), Budapest, Hungary, 19–23 September 1994. [Google Scholar]
- Bitzer, P.M.; Burchfield, J.C.; Christian, H.J. A Bayesian Approach to Assess the Performance of Lightning Detection Systems. J. Atmos. Ocean. Technol. 2016, 33, 563–578. [Google Scholar] [CrossRef]
- Bitzer, P.M.; Burchfield, J.C. Bayesian Techniques to Analyze and Merge Lightning Locating System Data. Geophys. Res. Lett. 2016, 43, 12–605. [Google Scholar] [CrossRef]
- Virts, K.S.; Koshak, W.J. Mitigation of Geostationary Lightning Mapper Geolocation Errors. J. Atmos. Ocean. Technol. 2020, 37, 1725–1736. [Google Scholar] [CrossRef]
- Cao, D.; Lu, F.; Zhang, X.; Yang, J. Lightning Activity Observed by the FengYun-4A Lightning Mapping Imager. Remote Sens. 2021, 13, 3013. [Google Scholar] [CrossRef]
Disclaimer/Publisher’s Note: The statements, opinions and data contained in all publications are solely those of the individual author(s) and contributor(s) and not of MDPI and/or the editor(s). MDPI and/or the editor(s) disclaim responsibility for any injury to people or property resulting from any ideas, methods, instructions or products referred to in the content. |
© 2024 by the authors. Licensee MDPI, Basel, Switzerland. This article is an open access article distributed under the terms and conditions of the Creative Commons Attribution (CC BY) license (https://creativecommons.org/licenses/by/4.0/).