Article

SAR-to-Optical Image Translation via an Interpretable Network

1
State Key Laboratory of Integrated Services Networks, Xidian University, Xi’an 710071, China
2
Beijing Institute of Control Engineering, Beijing 100190, China
*
Author to whom correspondence should be addressed.
Remote Sens. 2024, 16(2), 242; https://doi.org/10.3390/rs16020242
Submission received: 11 November 2023 / Revised: 31 December 2023 / Accepted: 3 January 2024 / Published: 8 January 2024

Abstract

:
Synthetic aperture radar (SAR) is prevalent in the remote sensing field but is difficult to interpret by human visual perception. Recently, SAR-to-optical (S2O) image conversion methods have provided a prospective solution. However, since there is a substantial domain difference between optical and SAR images, they suffer from low image quality and geometric distortion in the produced optical images. Motivated by the analogy between pixels during the S2O image translation and molecules in a heat field, a thermodynamics-inspired network for SAR-to-optical image translation (S2O-TDN) is proposed in this paper. Specifically, we design a third-order finite difference (TFD) residual structure in light of the TFD equation of thermodynamics, which allows us to efficiently extract inter-domain invariant features and facilitate the learning of nonlinear translation mapping. In addition, we exploit the first law of thermodynamics (FLT) to devise an FLT-guided branch that promotes the state transition of the feature values from an unstable diffusion state to a stable one, aiming to regularize the feature diffusion and preserve image structures during S2O image translation. S2O-TDN follows an explicit design principle derived from thermodynamic theory and enjoys the advantage of explainability. Experiments on the public SEN1-2 dataset show the advantages of the proposed S2O-TDN over the current methods with more delicate textures and higher quantitative results.

1. Introduction

Synthetic aperture radar (SAR) achieves high-resolution microwave imaging by recording the amount of energy reflected from the sensor’s emitted energy [1,2,3,4,5] as it interacts with the Earth. Since the wavelength range of the electromagnetic signals used by SAR is centimeter to meter, SAR can effectively penetrate concealed objects and clouds [6,7,8,9,10]. In addition, SAR is not affected by illumination conditions and can operate under all-weather, all-day conditions, which is currently an important means of remote sensing observation in many applications [11,12,13,14,15]. Nevertheless, they are more difficult to interpret by human vision than optical images. Therefore, many works have been proposed to achieve SAR-to-optical (S2O) image translation [16,17,18,19,20,21,22,23] and to improve the readability of SAR images. However, geometric distortions in SAR images [24,25] are unavoidable, resulting from the special imaging mechanism of SAR images. In addition, the consistent interference of object scattering on radar echoes makes certain pixel diffusion problems inevitable during imaging. Considering the large difference in content between SAR and optical images, learning the desired nonlinear mapping of SAR images to optical images during S2O image translation remains a challenge.
Particles in the closed thermal field described in thermodynamics are in frequent collision and motion under the constraint of temperature difference [26,27]. The heat is simultaneously absorbed or released as it moves from the unstable high-temperature state to the more stable low-temperature state. On the other hand, during the S2O image conversion, pixels with different values of a SAR image are shifted and diffused within the objective function constraint, whose values can be varied based on the optical image for reconstruction [28,29,30,31,32]. Analogously, the above two processes share some similarities in the behavior of individual particle (pixel) movement, suggesting that some of the theories of thermodynamics can be adapted to the S2O image translation process. For example, due to the difficulty of obtaining exact numerical solutions for continuous variables, the first-order difference equations of thermodynamics are utilized to achieve numerical solutions for particles at discrete time points. This can be adopted in the same way as the expression for the residual network. Given that higher-order residual networks have a greater learning capability, we can use the third-order equation instead of the first-order finite difference equation to guide the construction of the residual structure to obtain a more efficient function. In addition, in the S2O image translation process, when extracting SAR image features as time changes, the network is in an unstable state due to the uncertainty of pixel motion, resulting in the pixels undergoing diffusion. In light of the first law of thermodynamics [33,34], the thermal field tends to move from an unstable higher temperature state to a more stable lower temperature state. Therefore, we considered following the first law of thermodynamics and designing a guided branch to regularize the feature diffusion.
Based on the above motivation, we went a step further toward solving the S2O problem from the perspective of the evolution of SAR images and made the first attempt to apply the thermodynamic theory to the S2O model design. Specifically, we propose a thermodynamics-inspired network (S2O-TDN) for S2O image translation in this paper. We constructed a basic third-order finite difference (TFD) residual block inspired by the TFD equation of thermodynamics, which was utilized to construct our backbone network. The helpful information was extracted from the SAR images by accumulating and strengthening features at different layers. Meanwhile, to address the pixel diffusion problem in the S2O image translation process, an FLT-guided branch was designed explicitly based on the first law of thermodynamics (FLT). It facilitates the transition of feature values from the unstable diffusion state to the stable state and is designed to regularize the feature diffusion and maintain the image structures in the S2O image translation process. Putting them together in the GAN framework, we obtained our S2O-TDN as shown in Figure 1. Experiments on the public SEN1-2 benchmark [35] illustrate the advantages of the proposed S2O-TDN over the most advanced methods in terms of objective indications and visual quality.
The key contributions of this paper are summarized in three areas.
  • A thermodynamic perspective is taken on the S2O image translation task, and accordingly, we propose a novel S2O-TDN that follows a clear and interpretable design principle. This is the first time that thermodynamic theories are brought into S2O image translation networks.
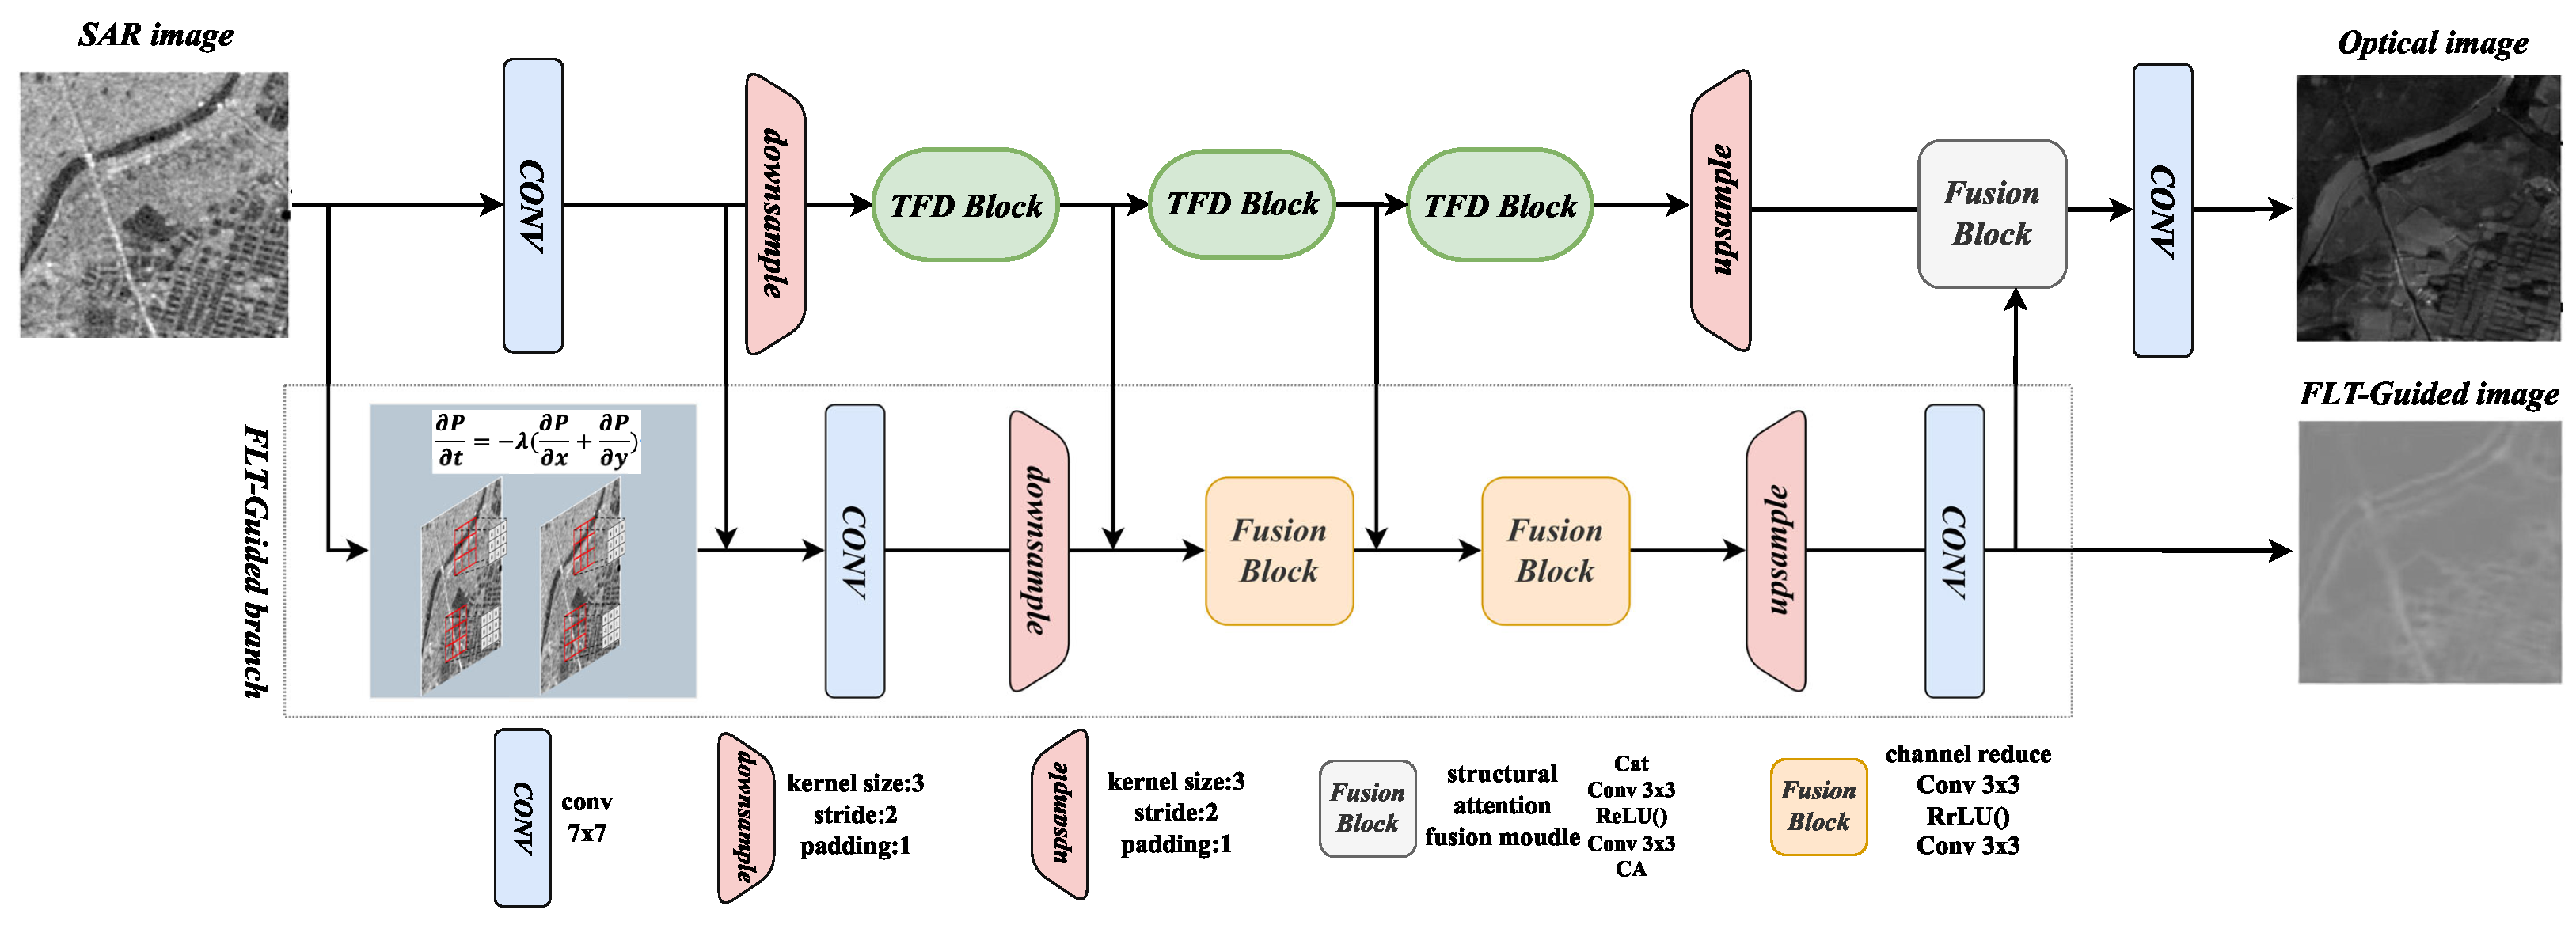
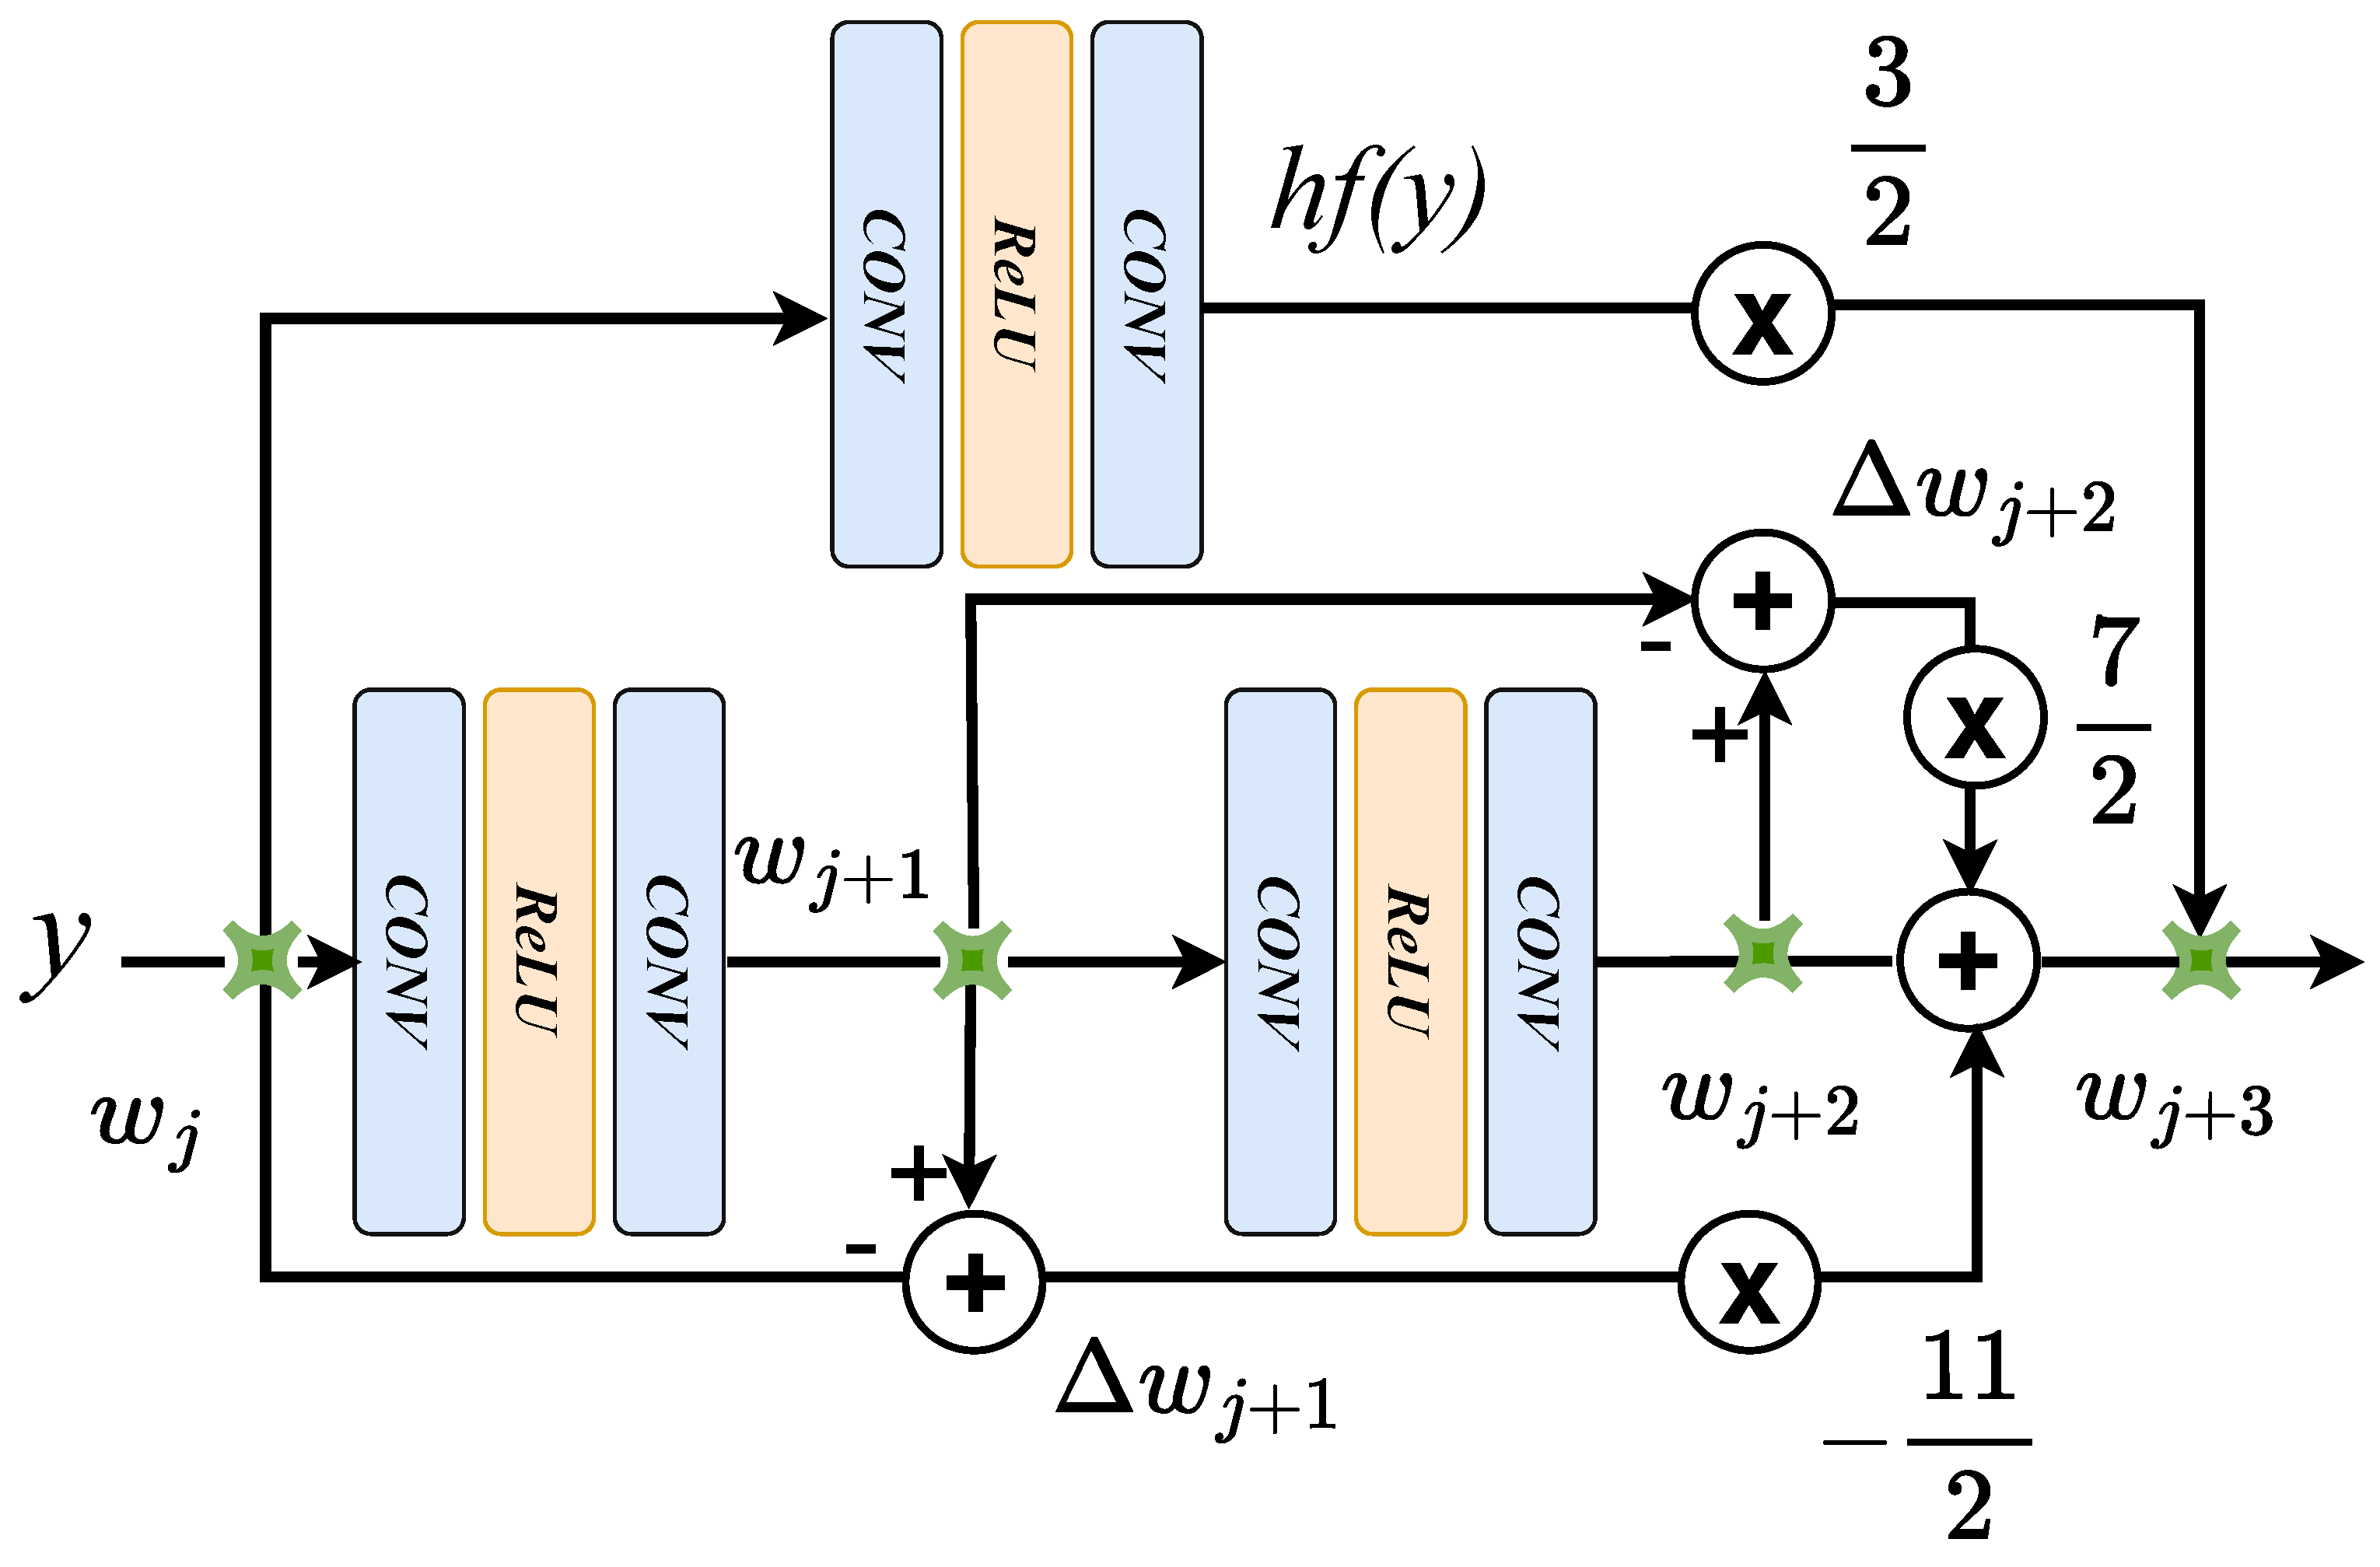
  • Inspired by the third order finite difference equation (TFD), i.e., the TFD residual block was used to build the backbone network. Motivated by the first law of thermodynamics (FLT), i.e., the FLT-guided branch was developed. They help the proposed S2O-TDN to learn a better nonlinear mapping between inter-domain features for S2O image translation while preserving the geometric structures by mitigating the pixel diffusion problem.
  • The proposed S2O-TDN model was experimentally tested on the currently popular SEN1-2 dataset with improved objective metrics and visual image quality. Optical images were generated with a finer structure and improved geometry.

2. Related Work

2.1. SAR-to-Optical Image Translation

Image-to-image translation has evolved as one of the most important research subjects in deep learning [36,37,38,39,40,41]. Initially, only content loss functions were leveraged to calculate the loss, such as L1-normal loss or L2-normal loss, which resulted in poor image quality. Since GANs can generate images with good visual properties, many scholars have made extensive attempts to apply generative adversarial networks to inter-image translation tasks [42,43]. Among the S2O image translation methods based on deep learning, the GAN-based approach shows promising performance because its generators can produce delicate visual images [44,45,46]. A series of methods such as Feature-Guiding Generative Adversarial Networks (FGGANs) [47], Edge-Preserving Convolutional Generative Adversarial Networks (EPCGANs) [35], and Supervised Cycle-consistent Generative Adversarial Networks (S-CycleGANs) [48] have been proposed. By leveraging the provided information such as class labels in the generator of the original GAN, Conditional Generative Adversarial Networks (cGANs) [1] can learn an adaptive sample generation process for different classes during training, thus enabling the model to generate more realistic images belonging to a given class. However, for the S2O image conversion task, the generated optical images usually do not have the desired fine structure since there is a substantial inter-domain gap existing between the SAR image and the optical image [49,50,51,52]. Isola et al. presented a pix2pix [53] model based on a cGAN and utilized the input image as a condition for image translation. The model learns the relationship of mapping between the input and output images for generating a specific output image. However, it requires known image pairs, which are often difficult to obtain in the real world. Zhu et al. presented Cycle-Consistent Adversarial Networks (CycleGANs) [54], which utilized two mirror-symmetric GANs under the cyclic consistency loss to form a ring network, i.e., a structure that does not require an input pair of images. However, the generated images by the above GAN-based methods do not perform well on the S2O image translation task by suffering from geometric distortion, since there is a large domain gap between the SAR and optical images, and there are no explicit constraints on the evolution of pixels from SAR images to optical images, making them difficult to learn an effective mapping function between the inter-domain features.
In contrast to the above approach, we build our S2O image translation model by taking the explicit design guideline of thermodynamic theory. Specifically, from the microscopic perspective, the evolution of pixels during the S2O image translation process can be analogized to the particles of thermodynamics. Accordingly, we devise a basic TFD residual block and an FLT-guided branch based on the third-order finite difference equation and the first law of thermodynamics. They constrain the movement of the pixels and mitigate the challenges in the S2O image translation task such as pixel diffusion, delivering improved results.

2.2. Neural Partial Differential Equations

Deep learning has reshaped many research fields in computer vision and made significant progress in recent years [55,56,57,58,59,60]. To mitigate the degeneration problem of the representation ability of deep neural networks built by stacking many plain convolutional layers, He et al. [61] presented a new residual network structure (ResNet) to replace a single plain convolution layer, which can be easily scaled up to more than 1000 layers and enhance the network capacity drastically. The deep residual learning idea has been used in many vision tasks [62,63], especially in low-level image processing tasks. For instance, Zhang et al. proposed the DnCNNs for image super-resolution by introducing the residual learning idea into the feed-forward convolutional neural networks, where a residual map between the input image and ground truth target is learned. Zhang et al. developed a lightweight fully point-wise dehazing network with residual connections to learn multi-scale haze-relevant features in an end-to-end way, delivering good dehazing results in a fast inference speed [64]. Weinan [65] explored the potential possibility that ordinary differential equations (ODEs) can be used in the design of neural networks and interpreted the residual network as a discrete dynamical system. Recently, many ODE-inspired networks have been proposed [66,67,68,69,70]. For example, He et al. [70] investigated the forward Euler method of dynamical systems with the similarity of residual structures and proposed a novel network inspired by ODE for image super-resolution.
We also devised our S2O image translation model based on neural ODEs but interpret the S2O image translation process as a specific dynamical system, i.e., thermodynamics. From the macro perspective, we can regard the layers of neural networks in the S2O image translation process as the status forward units of time in a thermodynamic system. Since, according to the first law of thermodynamics, the thermal field tends to transfer from an unstable high-temperature state to a more stable low-temperature state [33], we considered following the first law of thermodynamics and designing a guided branch to regularize the feature diffusion. In addition, we also leveraged the third-order finite difference equation of thermodynamics to replace the first-order equation of the existing dynamical system for designing a TFD residual structure.

3. Method

3.1. Third-Order Finite Difference Residual Structure

Since there is a large domain gap between SAR and optical images, it is difficult to achieve good nonlinear mapping in the S2O image translation process. Accordingly, we put forward a residual-specific block to achieve better mapping of features, so that various features in the SAR image domain can be encoded to map to the optical image domain and generate superior-quality optical images. Thus, we applied the idea of third-order finite difference equations in thermodynamics to construct the third-order finite difference (TFD) residual block.
Specifically, we used the finite difference method to discretize the ODE and build a novel SR residual network, a TFD block. Since the third-order derivatives in the finite difference equation can extract multidimensional information during the interaction, we utilized the third-order finite difference to devise a residual network structure. The third-order finite difference is defined as
w y j = 11 w j + 18 w j + 1 9 w j + 2 + 2 w j + 3 3 Δ y ,
where w represents an objective that is dependent on the input y. Δ y refers to the difference between the input and output of the TFD residual block. The above equation can be reformulated as follows:
w y j Δ y = 11 3 w j + 6 w j + 1 3 w j + 2 + 2 3 w j + 3 .
A change in the target w from layer j to layer j + 3 is exhibited on the left side of Equation (2) and is approximated in the neural network by a neural module approved as h f y . The above equation can be further derived as
h f ( y ) = 11 3 w j + 1 w j 7 3 w j + 2 w j + 1 2 3 w j + 2 + 2 3 w j + 3 .
To simplify the above equation, we use Δ w j + 2 and Δ w j + 1 to represent the residuals over w j + 2 and w j + 1 and the residuals over w j + 1 and w j , respectively. We can then obtain the final mathematical form of the TFD residual block.
w j + 3 = w j + 2 + 7 2 Δ w j + 2 11 2 Δ w j + 1 + 3 2 h f ( y ) .
In this paper, a TFD residual block is designed to implement Equation (4). Specifically, we leverage a sequence of convolutional layers with a ReLU layer for designing h f ( y ) . Figure 2 depicts the detailed structure of the TFD residual block.

3.2. The First Law of the Thermodynamics Guided Branch

The uncertainty of pixel motion during S2O leads to irregular particle forward motion, and this forward motion needs to be constrained to suppress the possibility of pixels being dispersed to some extent. To solve this problem, we designed the FLT bootstrap branch to obtain discrete-time particle values by approximating the continuous deviation using a thermodynamic TFD. The irregular particles move forward after being constrained by the TFD residual block and the FLT-guided branch, respectively.
The First Law of Thermodynamics: In the thermodynamic field, the energy of a system is conserved, which is known as the FLT. This indicates that all matter in nature has energy, which can be neither created nor destroyed. However, the energy can be transferred from one entity to another, and the total amount of energy remains the same. In other words, after the thermodynamic system reaches the final state from the initial state through any process, the increment of internal energy should be equal to the difference between the heat transferred to the system by the outside world and the energy work produced by the system on the outside, which can be quantified by the following mathematical formula:
Q = U + A ,
where Q is the heat gained by the system per unit of time. U represents the energy added to the system per unit of time. A represents the power done by the system to the outside. The physical meaning of this formula is that the change in total energy in a system is equal to the energy difference between the outlet and the entrance plus the change in energy within the system.
Similarly, treating the S2O image translation network as a dynamic system, the difference between input and output pixels P f plus the change in pixel values in the training image itself P v equals the overall variation of pixel values throughout the network P , which can be described as
P = P f + P v .
The variance of the input and output pixel values P f : During the S2O image translation, we assume that an image can be arbitrarily divided into several small regions, each of which we label as Ω . Ω is small enough. Each Ω pixel per unit time is P, and its pixel-value density with partial differentiation in the x-axis and y-axis directions are p x and p y , respectively. We can then derive the relationship between the pixel value and pixel value density of the image in each Ω region in one unit of time as follows:
d P x = p x d y d t ,
d P y = p y d x d t ,
where P x and P y denote the pixel values of x-axis and y-axis directions per unit time at the small region of the input image Ω i n , respectively. p x and p y are the pixel density values of the x-axis and y-axis directions per unit time at the small region of the input image Ω i n , respectively. Given the same reasoning process in the two directions, x-axis and y-axis, we only elaborate on the x-axis-related process, and the y-axis is the same. We assume that P x + d x and p x + d x represent the pixel values and the pixel density values of the x-axis direction per unit time at the small region of the output image Ω o u t . In the same way as Equation (7), we can obtain the relation of the output P x + d x and p x + d x as
d P x + d x = p x + d x d y d t .
According to the relationship between difference and derivative, Equations (7) and (9) can be further obtained as follows:
p x p x + d x = p x x d x .
The difference between the Ω i n and Ω o u t pixel value on the x-axis is then
d P x d P x + d x = p x x d x d y d t .
After adding the pixel differences of the x-axis and y-axis directions, we obtain the pixel differences of each Ω i n and Ω o u t in unit time:
d P x d P x + d x + d P y d P y + d y = p x x + p y y d x d y d t .
Finally, we add up the difference between the pixel values of Ω i n and Ω o u t for all small regions of Ω . In this way, we can obtain the difference P f between the input and output pixels of the whole image during the S2O image translation process, which is caused by pixel diffusion. When the number of Ω regions divided tends to be infinite, the above summation process can be approximated as the integration of a two-dimensional image:
P f = ( d P x d P x + d x + d P y d P y + d y ) d x d y = [ p x x + p y y d x d y d t ] d x d y = p x x + p y y d t .
The change in the image’s pixel value P v : Besides the variations due to the pixel inflow and outflow, the decrease and increase of the pixel values of the training image itself will also impact the global values. The pixel value will change over time for every point in the microcluster.
d P v = p v d x d y d t ,
where p v represents the pixel value per unit area of the image per unit of time, which is the so-called pixel density. P v is the increment of pixel values inside the image.
The overall changes P : Combining Equations (6), (13) and (14), P can be obtained.
P = p x x + p y y d t + p v d x d y d t .
In this paper, considering that the pixel value of each point in the trained image is fixed, the value of the pixel itself does not change, i.e., p v = 0 . Therefore, we only focus on the incremental pixel values of the image input and output. When the number of Ω regions divided tends to be infinite, the pixel density p x , p y within each Ω can be approximated as the pixel value P in that region, Therefore, Equation (15) can be rewritten:
P t = P x + P y .
That is, in the time domain, the change rate of pixel difference P t and the partial derivative of a pixel in the x and y axes P x and P y can be obtained during the S2O image translation process. Therefore, based on the similarity between the laws of motion of particles in thermodynamics and the pixel flow motion during S2O image translation, we can devise our FLT-guided branch accordingly.
In the numerical computation, the partial derivatives P x and P y of a pixel P(the position of pixel P in the image is denoted as ( i , j ) ) can be computed from:
P t = P x + P y = P ( i + 1 , j ) P ( i 1 , j ) 2 + P ( i , j + 1 ) P ( i , j 1 ) 2
This can correspond to a convolutional computation realized by the operators [ 1 , 0 , 1 ] T , [ 1 , 0 , 1 ] and a parameter. As shown in Equation (17), we used some convolution layers with fixed kernels and a learnable parameter λ to realize the function on the right side of the equation. Specifically, using convolution kernels such as W x = [ 0 , 1 , 0 ; 0 ; 0 , 1 , 0 ] and W y = [ 0 ; 1 , 0 , 1 ; 0 ] , we can obtain the derivative of the image along the x and y axes. The convolution layers have constant kernels, which we name the FLT-guided heads. In addition to utilizing fixation convolution kernel learning. Several fusion blocks were also designed to facilitate functional interaction between the spine and the FLT-guided head and to further enhance the detailed features. The FLT-guided head structure information is available in Figure 1. The output feature maps of the FLT-guided head are processed by a simple convolution and downsampling process, and the outputs of their TFD residual blocks are then fused using two consecutive fusion modules. Each fusion module is composed of three convolutions. Finally, a side scan, i.e., the FLT-guided image, is obtained following an upsampling layer and a prediction layer. The high-dimensional tensor information output from the FLT-guided branches is output as a one-channel two-dimensional tensor by the convolution layer for intuitive visual understanding.

3.3. The Overall Structure of S2O-TDN

We designed the S2O-TDN model built on the CycleGAN architecture. The backbone network of the generator is composed of three TFD residual blocks (Section 3.1) and a parallel FLT-guided branch (Section 3.2), the exact structure of which is illustrated in Figure 1. In the backbone, SAR images are first fed into convolutional and downsampling layers and then go through three TFD residual blocks for feature aggregation and inter-domain feature transformation. The parallel FLT-guided branch aims to constrain pixel diffusion in the S2O image translation process. To be specific, we first feed SAR images to the head of the FLT-guided branch to normalize feature spread and maintain image structure during S2O image conversion. In the fusion block, we fuse the output feature with the feature of the remaining TFD blocks. After simply going through the upsampling and convolution layers, we then obtain a secondary output: an FLT-guided image. Finally, we feed the FLT-guided image into the backbone fusion block of facilitate feature interactions and drive the generator to produce the final fine-grained optical image. A specific loss (Section 3.4) is utilized to optimize the proposed S2O-TDN.

3.4. Loss Function

In the proposed SO-TDN, we designed a TD loss L T D to highlight the high frequency of details. L T D can be defined as
L T D = L T F D + L F L T g u i d e d = E S , O p S , O ϕ O ϕ G T F D S + + E S , O p S , O ϕ O G F L T g u i d e d S ,
where L F L T g u i d e d and L T F D are the lateral output of the neural module used to supervise the FLT-guided and the loss of the final forecast of the backbone network, separately. ϕ · denotes the FLT-guided head function, as discussed in (Section 3.1). In the above equation, S is used to represent the real SAR image. The optical image is represented using O. In the limit of the loss function, higher frequency features ϕ O obtained in the true optical map are compatible with the higher frequency features ϕ G T F D S of the output optical images, and the FLT-guided images generated by the FLT-guided neural module G F L T g u i d e d S are compatible. The L F L T g u i d e d then becomes part of the FLT-guided neural module.
We then combined the proposed thermodynamics (TD) loss L T D with several loss functions including the adversarial loss L G A N , cycle consistency loss L c y c , pixel loss L p i x , and perceptual loss L p e r . These losses have been commonly used in previous works [1,53,54] and show their effectiveness in supervising the training of S2O image translation networks. This leads to the definition of the overall loss function, as follows:
L = L G A N + λ p i x L p i x + λ p e r L p e r + λ c y c L c y c + + λ T D L T D ,
where λ p i x , λ p e r , λ c y c , and λ T D are the coefficients of the loss functions: L G A N , L c y c , L p i x , and L p e r , respectively. We empirically set the above hyper-parameters to 10 in our experiments.

4. Experimental Results and Analysis

4.1. Datasets

The SEN1-2 dataset contains 282,384 pairs of image blocks within a series of paired SAR images and optical images. We cropped the average distance of all images involved in the training to 256 × 256 [35]. A popular approach to choosing a dataset is to extract certain image batches from the images and use them as the training set and the remaining as the test dataset while assuming that no pixel overlaps between every two images. This approach makes sense when pairwise data sources for a particular problem are difficult to access. Nevertheless, there is a great similarity between small image blocks cropped on the same large image. By training the network on the same image blocks that the test set has, the performance of the model on the test set will be better than it should be, and the models’ robustness cannot be reflected in the results of such experiments.
We obtained 1600 pairs of high-resolution SAR and optical images from the SEN1-2 database for the training dataset and 300 pairs for the test dataset (denoted by Test 1) with the size of 256 × 256 [35]. These images were clipped from the initial 258 pairs of high-resolution optical-SAR images. The test and the train datasets cover various topographic classes, such as forests, lakes, mountains, rivers, buildings, farmlands, and roads. In addition, 52 pairs of complex mountain scenes and 68 pairs of complex suburban scenes were selected as two other test sets, named Test 2 and Test 3. The scenes in Test 2 and Test 3 do not appear in the learning process and are used as unseen data to effectively evaluate the robustness of the proposed S2O-TDN.

4.2. Implementation Details

We employed the ADAM optimizer, where β 1 = 0.5 , β 2 = 0.999 . The S2O-TDN was trained for 200 epochs at a batch size of 1 in the experiments.The learning rate is equal to 2 × 10 4 and decreases linearly from the 100th epoch until it reaches 0. We selected Pix2pix [53], the CycleGAN [48], the DCLGAN [71] S-CycleGAN [54], the FGGAN [47], the EPCGAN [35], and the AttentionGAN [72] as representative S2O image translation methods for comparison. CycleGAN and DCLGAN are unsupervised methods, and the others are supervised. Pix2pix, CycleGAN, and DCLGAN are architectures for generic images, and the others are designed specifically for the S2O image translation process. We trained the model using Pytorch on an NVIDIA GTX 2080Ti GPU.

4.3. Quantitative Results
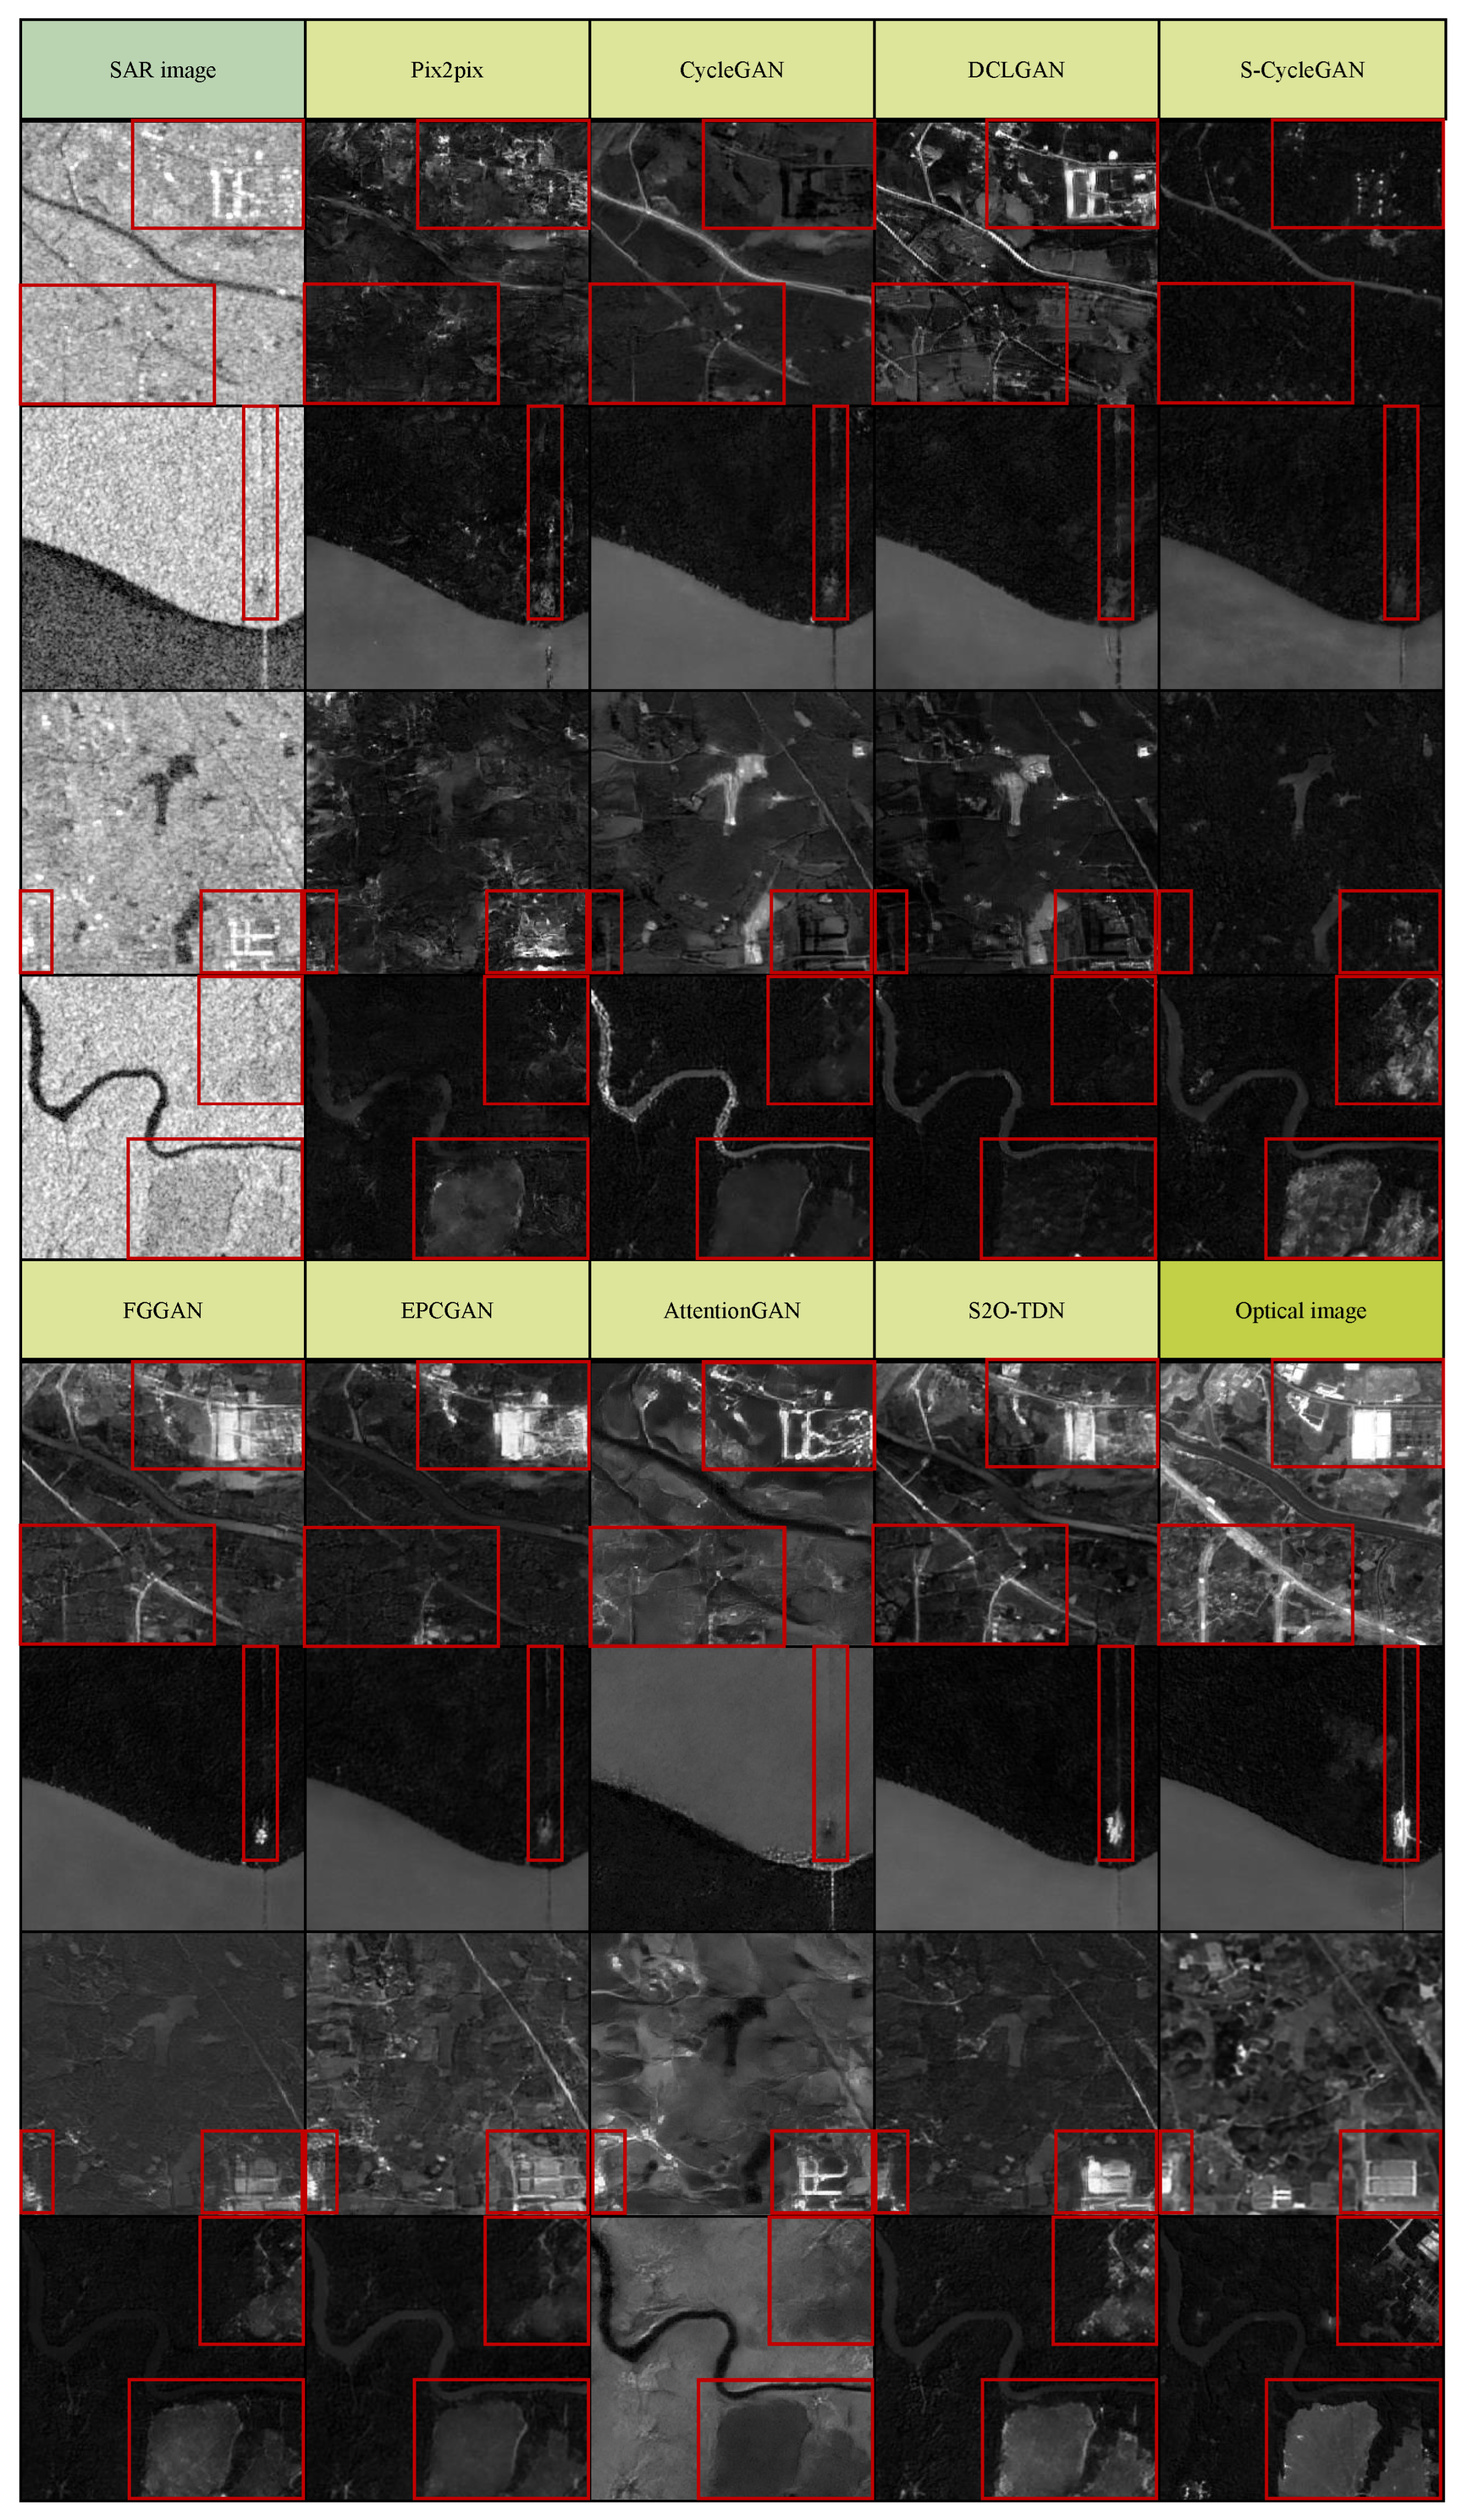
We utilized the signal-to-noise ratio (PSNR), mean square error (MSE), and structural similarity (SSIM) [73] as benchmarks to objectively quantify the proposed S2O-TDN and the existing translation approaches. The MSE indicates the mean difference between the corresponding pixels. The pixel values of the image were normalized from the range of 0–255. Its MSE index was then calculated, indicating that the smaller the MSE, the lower the level of distortion the image has. The MSE of the average difference between the optical image produced by the S2O translation network and the real optical image is called the PSNR. The PSNR index is inversely correlated with image distortion. Although the PSNR metric is accurate enough from an objective point of view, the visual presentation does not show the same results. Therefore, SSIM was used to evaluate the similarity of luminance, contrast, and texture. The PSNR metric is inversely correlated with image distortion.
We present the PSNR and SSIM [73] results of the different methods on the three test datasets. The results of the different methods on the three test sets are listed in Table 1. It is evident that the proposed S2O-TDN obtains the best performance. For example, in Test 1, the EPCGAN is 0.2 dB, and the SSIM is 0.0245 higher than the second-best EPCGAN. It is worth noting that our method has a significant performance advantage on Test 2 and Test 3, which demonstrates the excellent robustness of our method. The proposed S2O-TDN effectively extracts multi-level features through residual learning in TFD residual blocks, and uses FLT-guided neural modules to extract and reconstruct structural information to further assist image transformation. The FLT-guided branch has well-defined designs based on FLT functions that facilitate the generation of target optical images. However, the image translation networks, such as the CycleGAN and Pix2pix, do not explicitly model the structure and fail to constrain the reconstruction process of pixels, so their effectiveness is limited. Furthermore, the existing CNN-based S2O translation methods pay less attention to structure guidance and feature extraction for S2O translation through the design of the network structure, resulting in poor performance.

4.4. Visual Results

4.4.1. Comparison of Optical Images

The visual results of the various methods are shown in Figure 3. The visual results of Pix2pix are blurred, resulting from the lack of an explicit use of structure and the lack of constraints on the reconstruction of pixels. The CycleGAN can fully inherit the structural information in SAR images to generate images with clear structures, but these structures easily inherit the geometric deformation in SAR images, as indicated by the red boxes. At the same time, translation errors easily occur in the generated image, such as the building is restored to the texture of the ground in the first image, and the river is restored to the texture of the building in the last image. Although the S-CycleGAN can mitigate translation errors to some extent, it has similar phenomena in geometric deformation. It can be seen in Figure 3 that the structural information of the FGGAN and EPCGAN, compared with the S-CycleGAN and CycleGAN, is enhanced. However, the details of the image are still not well recovered. In the results of the FGGAN and EPCGAN in the first row, part of the road is lost. For SAR images with speckle noise, compared with other methods, the proposed S2O-TDN can produce optical images with a more detailed structure accuracy and an improved visual quality.

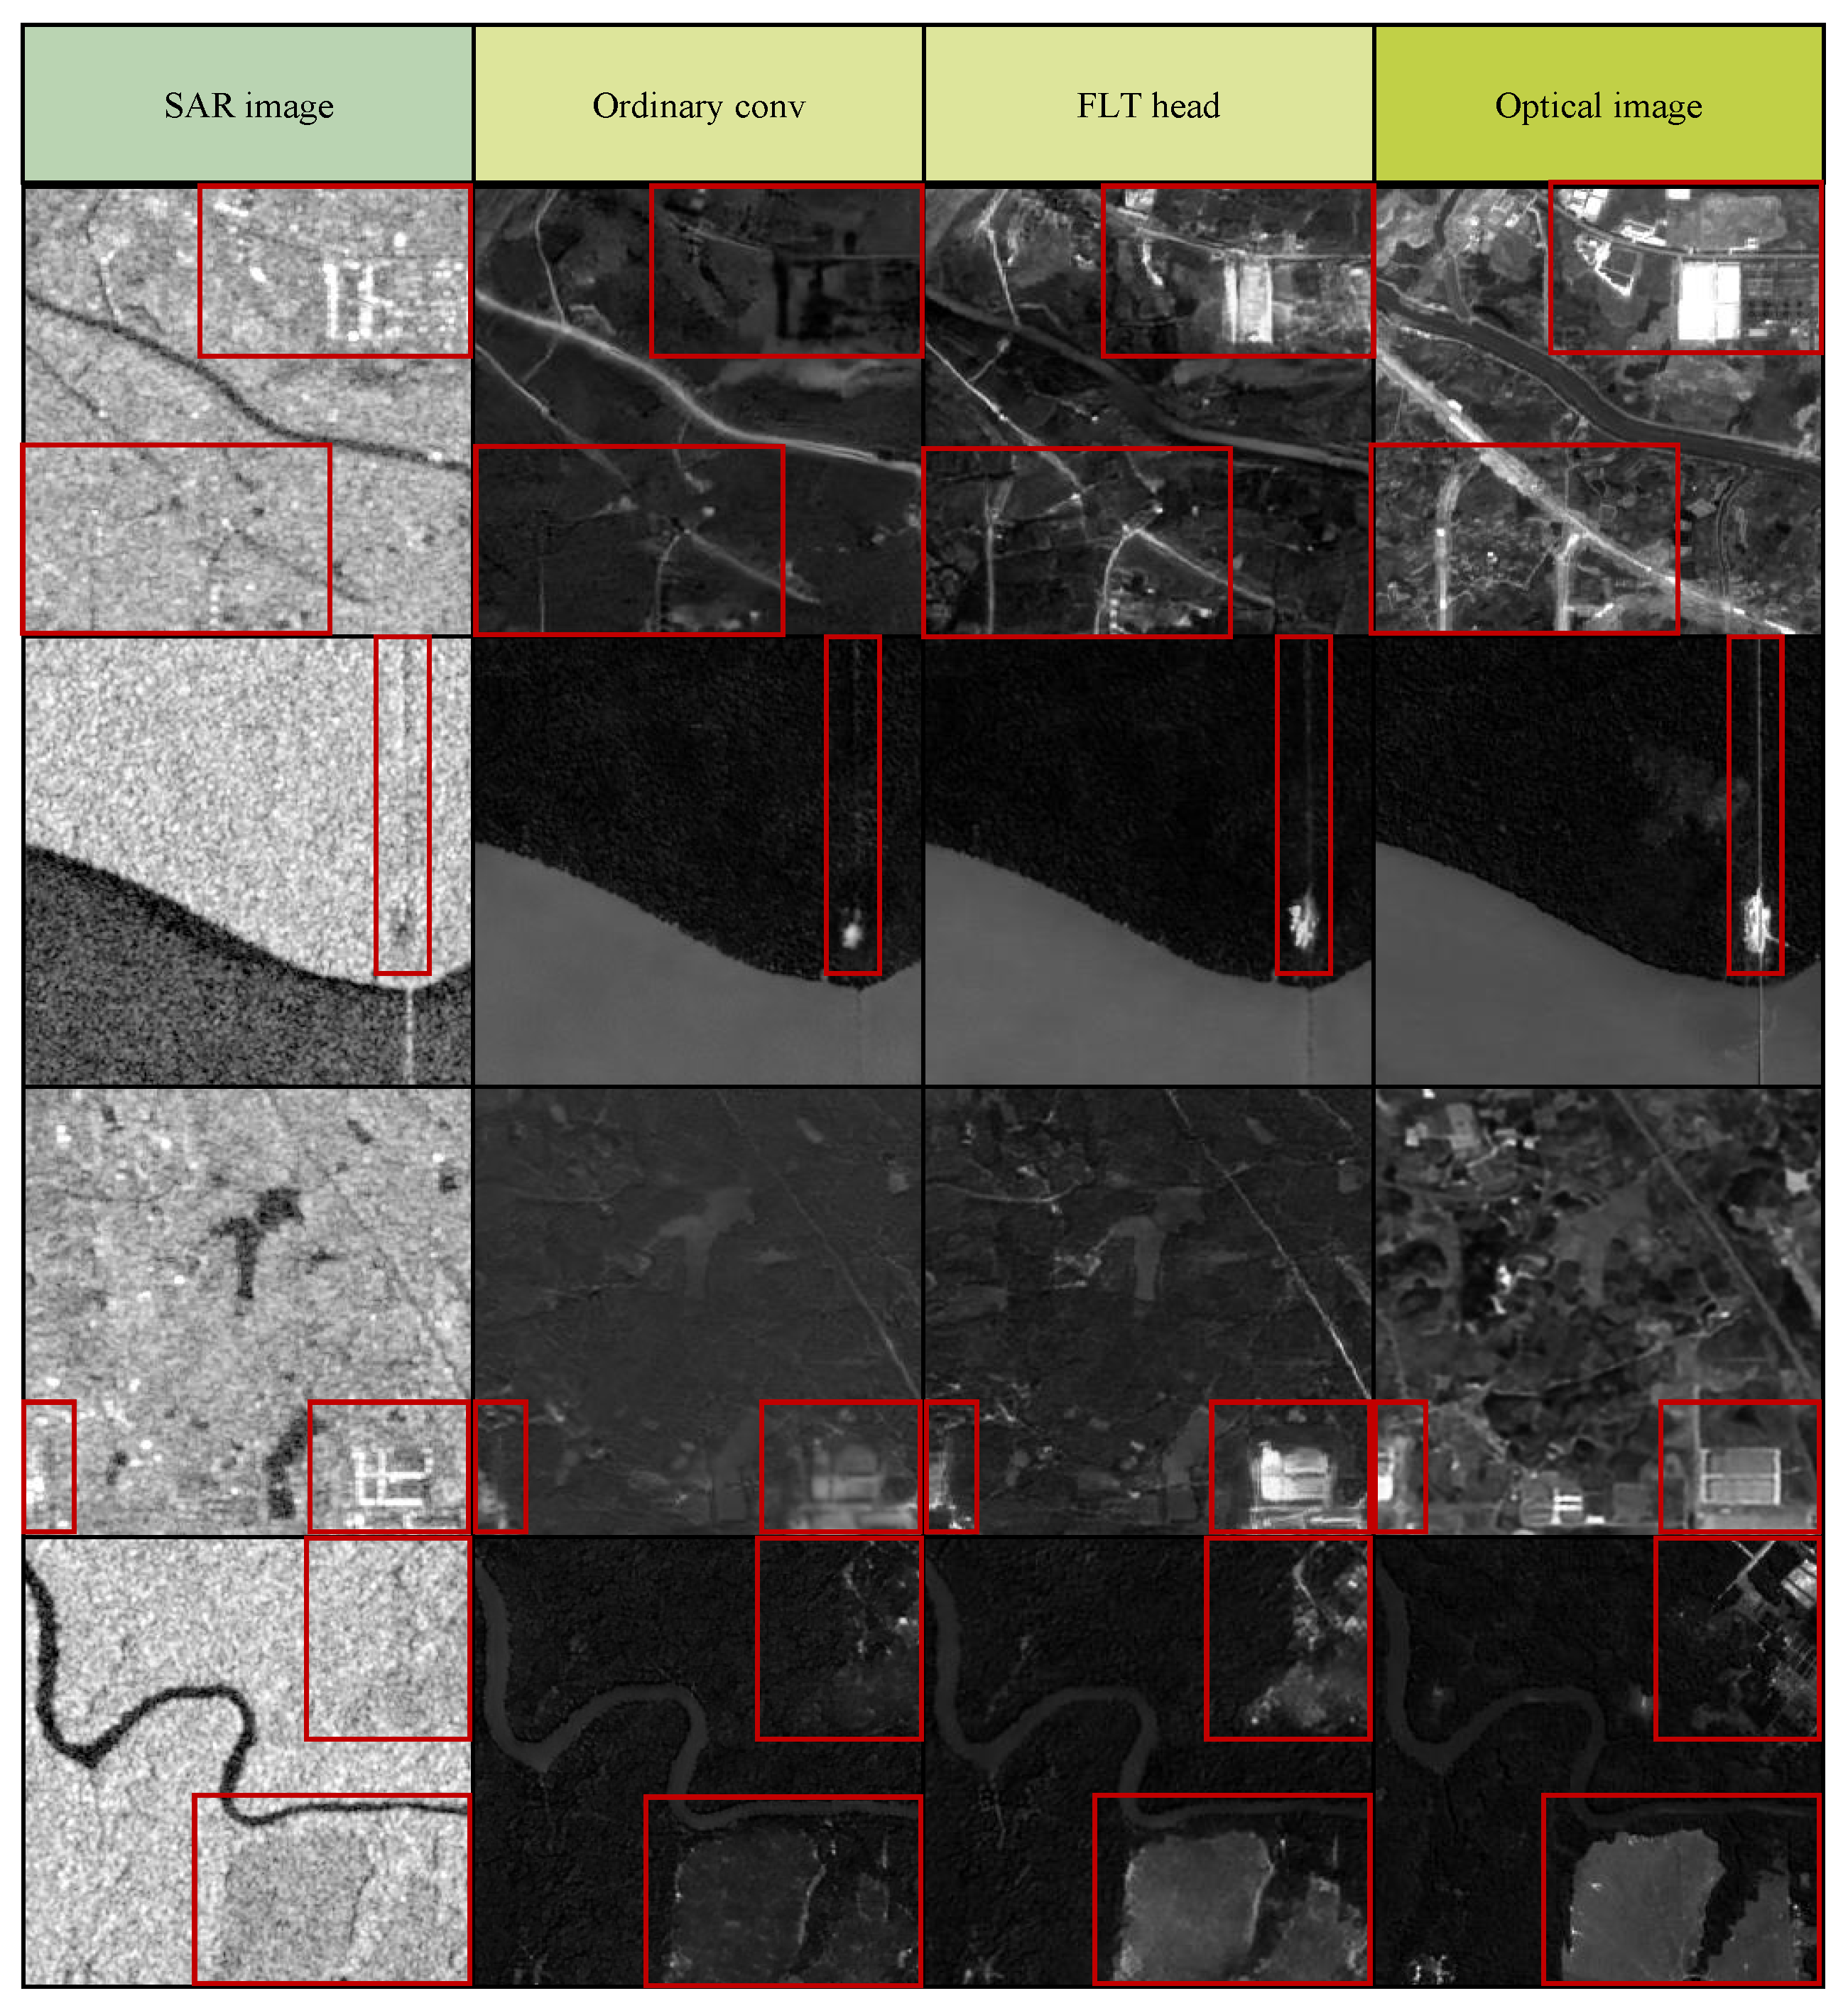
4.4.2. Comparison of Structural Information

The gradient of the image refers to the rate of change in image gray values, which can effectively reflect the texture and structure of an image. We separately select the gradient information of optical images generated from different methods for comparison and seek to demonstrate that texture information and structure information can be retained more effectively in our method. In Figure 4, we can find that the texture information is clearly contaminated by the speckle noises in the SAR images, which makes it difficult for the network to extract features to reconstruct the optical images. As a result, the optical images produced by the currently proposed methods often have problems with geometric distortions and missing textures. Different from them, the proposed S2O-TDN, benefiting from the proposed TFD residual blocks and FLT-guided branch, produces improved quality results and is closer to ground truth.

5. Discussion

5.1. Impact of the Key Components of S2O-TDN

To investigate the validity of each component in the proposed S2O-TDN, we conducted ablation experiments corresponding to each of its components, as shown in Table 2. It is worth stating that the base model does not use the TFD residual block, but rather, a standard residual structure and parallel FLT-guided branches, which do not have any feature interference or auxiliary TD losses. We tried different permutations by adding the proposed components on the base model separately. It can be seen that both blocks are useful and contribute to improved model behavior.
Moreover, they are complementary to each other and are used together to produce the best results in the proposed S2O-TDN. In addition, we tried different improved residual blocks to demonstrate the superiority of the TFD residual structure. We tried alternative designs of TFD residual blocks by using Runge–Kutta2 (RK2) [70] and PolyInception2 (poly2) [74], and their performance was inferior to our designs on the S2O image translation task. We argue that poly2 is the multiplexing and range expansion of the residual block, which faces difficulties in effectively extracting information disturbed by the noise without the specific reorganization of features. In addition, the RK2 block was designed according to the Runge–Kutta solver of the ODE, but it has limited representation capability because it extracts features only from adjacent layers, unlike the TFD block we designed, which can extract features from multiple layers.
According to Equation (16), we designed the FLT-guided head to fit the change rate of pixel difference P t during the S2O image translation process. To investigate the validity of the FLT-guided head in the FLT-guided branch, we conducted ablation experiments on the FLT guide head, as shown in Table 3 and Figure 5. It is worth stating that we only replaced the fixed convolutional layer in the FLT-guided head with an ordinary convolution. The remaining structure of the FLT-guided branch remains unchanged.
In addition, we conducted a comparison experiment using Roberts filters, Prewitt filters, and Sobel filters with the FLT-guide head to investigate the effect of different filters on bootstrap branching, as shown in Table 4. Experiments show that the ± 45 directional derivative provided by the Roberts operator is not appropriate for the selection of features by the bootstrap network. Compared to the single directional partial derivatives provided by the FLT-guided head, the mixed weighted partial derivatives of the SAR images extracted by Prewitt filters and Sobel filters, on the contrary, lead to a degradation in the performance of the S02 image conversion.

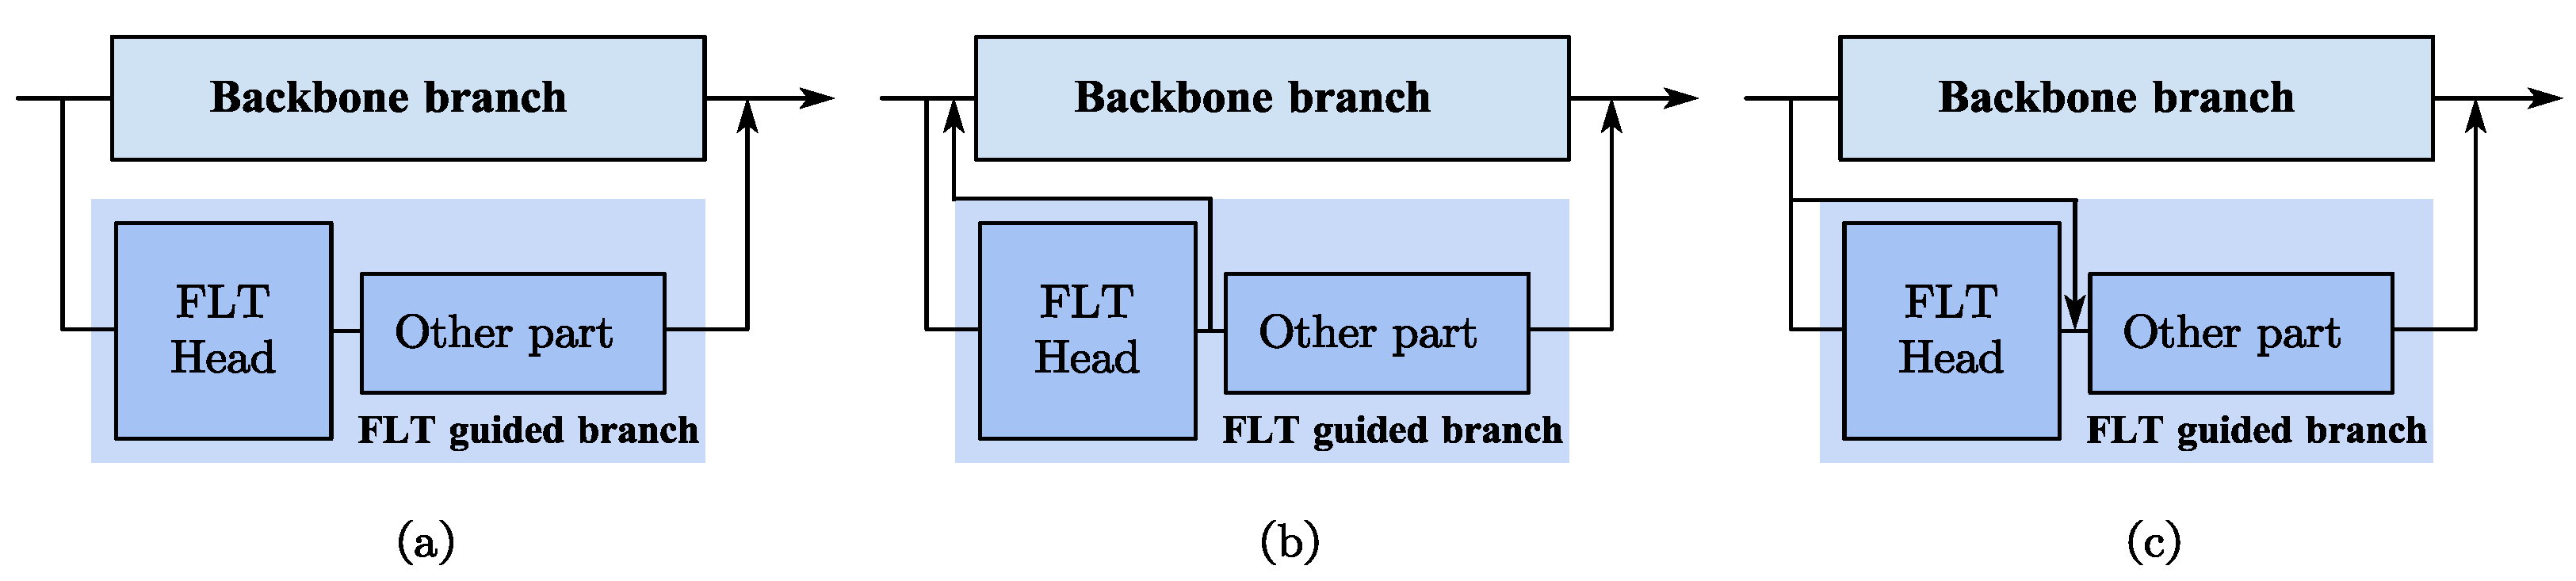
5.2. Variant Designs of the FLT-Guided Branch

According to Equation (16), we offer three variants of the FLT-guided branch by using different connections after the FLT head. Figure 6 shows three different designs. Specifically, Figure 6a is the default design we propose in this paper. In the design of Figure 6b, we added the residual generated by the FLT head back to the input image of the backbone network; i.e., we implemented the formula derived from FLT at the beginning of the backbone network and kept the role of the FLT-guided branch to implement the FLT for the whole network. In Figure 6c, we added the residual generated by the FLT head back to the input image before it is fed into the fusion blocks in the FLT-guided branch; i.e., we implemented the FLT at the beginning of the FLT-guided branch, and the reconstructed information is integrated with the features from the TFD residual blocks.
The results of the proposed S2O-TDN with the above three designs are summarized in Table 5. As can be seen, the default design and design (b) are comparable. We hypothesize that the similar performance is because the FLT is implemented for the whole network in both the default design and design (b), i.e., achieving the constraint of feature diffusion and structure preservation for the whole network by the FLT-guided branch. Additionally, implementing the FLT at the beginning of the FLT-guided branch will affect the role of the FLT-guided branch, resulting in performance degradation. The experiments imply that leveraging FLT to constrain the entire network rather than individual feature maps by the FLT-guided branch is a better choice.

5.3. Model Complexity Analysis

In addition, we analyzed the model complexity, including the model size, i.e., the number of parameters, the computation cost, i.e., the floating-point operations (FLOPs), and the execution time(s). The model complexity analysis of the proposed S2O-TDN and some representative S2O methods are summarized in Table 6. It should be noted that we counted the FLOPS of individual generators. The smaller model size and superior performance of the proposed S2O-TDN compared with other methods indicate that our model has a more effective fitting capability. While obtaining the best performance with respect to high-target indicators as well as superior visual quality, the FLOPs of the proposed S2O-TDN are close to those of most existing methods. The reason behind this is that the FLT-guided branch of the proposed S2O-TDN inevitably introduces additional computation costs.

6. Conclusions

In this paper, to perform the challenging task of SAR-to-optical image translation, we introduce the thermodynamic theory to the design of networks. The proposed S2O-TDN model contains an FLT-guided branch inspired by the first law of thermodynamics and several TFD residual blocks inspired by the third-order finite difference equation, which is used to regularize the feature diffusion and preserve image structures during S2O image translation, as well as multi-stage feature aggregation processing in the translation module. The proposed S2O-TDN can effectively extract the features of SAR images and generate optical images with a clearer and finer structure. Our experiments on the widely used sen1-2 dataset demonstrate that the proposed S2O-TDN has an advantage over most advanced methods in regard to objective indications and visual quality.

Author Contributions

Conceptualization, M.Z.; Methodology, P.Z.; Software, Y.Z.; Validation, M.Y.; Resources, X.L.; Writing—original draft, X.D.; Writing—review & editing, L.Y. All authors have read and agreed to the published version of the manuscript.

Funding

This work is supported in part by the National Natural Science Foundation of China under Grants 62272363, 62036007, and 62061047; in part by the Young Elite Scientists Sponsorship Program by CAST under Grant 2021QNRC001; in part by the Joint Laboratory for Innovation in Satellite-Borne Computers and Electronics Technology Open Fund 2023 under Grant 2024KFKT001-1.

Data Availability Statement

The SEN1-2 dataset is downloaded free of charge from the library of the Technical University of Munich according to the link in [35].

Conflicts of Interest

The authors declare no conflict of interest.

References

  1. Yang, X.; Zhao, J.; Wei, Z.; Wang, N.; Gao, X. SAR-to-optical image translation based on improved CGAN. Pattern Recognit. 2022, 121, 108208. [Google Scholar] [CrossRef]
  2. Auer, S.; Hinz, S.; Bamler, R. Ray-tracing simulation techniques for understanding high-resolution SAR images. IEEE Trans. Geosci. Remote Sens. 2009, 48, 1445–1456. [Google Scholar] [CrossRef]
  3. Pu, W. Deep SAR Imaging and Motion Compensation. IEEE Trans. Image Process. 2021, 30, 2232–2247. [Google Scholar] [CrossRef]
  4. Simard, M.; Degrandi, G. Analysis of speckle noise contribution on wavelet decomposition of SAR images. IEEE Trans. Geosci. Remote Sens. 1998, 36, 1953–1962. [Google Scholar] [CrossRef]
  5. Guo, Z.; Guo, H.; Liu, X.; Zhou, W.; Wang, Y.; Fan, Y. Sar2color: Learning Imaging Characteristics of SAR Images for SAR-to-Optical Transformation. Remote Sens. 2022, 14, 3740. [Google Scholar] [CrossRef]
  6. Jordan, R.; Huneycutt, B.; Werner, M. The SIR-C/X-SAR Synthetic Aperture Radar system. IEEE Trans. Geosci. Remote Sens. 1995, 33, 829–839. [Google Scholar] [CrossRef]
  7. Gray, A.; Vachon, P.; Livingstone, C.; Lukowski, T. Synthetic aperture radar calibration using reference reflectors. IEEE Trans. Geosci. Remote Sens. 1990, 28, 374–383. [Google Scholar] [CrossRef]
  8. Villano, M.; Krieger, G.; Papathanassiou, K.P.; Moreira, A. Monitoring dynamic processes on the earth’s surface using synthetic aperture radar. In Proceedings of the 2018 IEEE International Conference on Environmental Engineering (EE), Milan, Italy, 12–14 March 2018; pp. 1–5. [Google Scholar] [CrossRef]
  9. Fu, S.; Xu, F.; Jin, Y.Q. Reciprocal translation between SAR and optical remote sensing images with cascaded-residual adversarial networks. Sci. China Inf. Sci. 2021, 64, 1–15. [Google Scholar] [CrossRef]
  10. Grohnfeldt, C.; Schmitt, M.; Zhu, X. A conditional generative adversarial network to fuse sar and multispectral optical data for cloud removal from sentinel-2 images. In Proceedings of the IEEE International Geoscience and Remote Sensing Symposium, Valencia, Spain, 22–27 July 2018; pp. 1726–1729. [Google Scholar]
  11. Tomiyasu, K. Tutorial review of synthetic-aperture radar (SAR) with applications to imaging of the ocean surface. Proc. IEEE 1978, 66, 563–583. [Google Scholar] [CrossRef]
  12. Paolo, F.; Lin, T.t.T.; Gupta, R.; Goodman, B.; Patel, N.; Kuster, D.; Kroodsma, D.; Dunnmon, J. xView3-SAR: Detecting Dark Fishing Activity Using Synthetic Aperture Radar Imagery. In Proceedings of the Advances in Neural Information Processing Systems 35, NeurIPS 2022, New Orleans, LA, USA, 28 November 2022; Koyejo, S., Mohamed, S., Agarwal, A., Belgrave, D., Cho, K., Oh, A., Eds.; Curran Associates, Inc.: Nice, France, 2022; Volume 35, pp. 37604–37616. [Google Scholar]
  13. Huang, L.; Yang, J.; Meng, J.; Zhang, J. Underwater Topography Detection and Analysis of the Qilianyu Islands in the South China Sea Based on GF-3 SAR Images. Remote Sens. 2020, 13, 76. [Google Scholar] [CrossRef]
  14. Argenti, F.; Bianchi, T.; Lapini, A.; Alparone, L. Simplified MAP despeckling based on Laplacian-Gaussian modeling of undecimated wavelet coefficients. In Proceedings of the 19th IEEE European Signal Processing Conference, Barcelona, Spain, 29 August–2 September 2011; pp. 1140–1144. [Google Scholar]
  15. Bayramov, E.; Buchroithner, M.; Kada, M.; Zhuniskenov, Y. Quantitative Assessment of Vertical and Horizontal Deformations Derived by 3D and 2D Decompositions of InSAR Line-of-Sight Measurements to Supplement Industry Surveillance Programs in the Tengiz Oilfield (Kazakhstan). Remote Sens. 2021, 13, 2579. [Google Scholar] [CrossRef]
  16. Merkle, N.; Auer, S.; Müller, R.; Reinartz, P. Exploring the potential of conditional adversarial networks for optical and SAR image matching. IEEE J. Sel. Top. Appl. Earth Obs. Remote Sens. 2018, 11, 1811–1820. [Google Scholar] [CrossRef]
  17. Wang, P.; Patel, V.M. Generating high quality visible images from SAR images using CNNs. In Proceedings of the 2018 IEEE Radar Conference, Oklahoma City, OK, USA, 23–27 April 2018; pp. 570–575. [Google Scholar]
  18. Wang, H.; Zhang, Z.; Hu, Z.; Dong, Q. SAR-to-Optical Image Translation with Hierarchical Latent Features. IEEE Trans. Geosci. Remote Sens. 2022, 60, 5233812. [Google Scholar] [CrossRef]
  19. Wei, J.; Zou, H.; Sun, L.; Cao, X.; Li, M.; He, S.; Liu, S. Generative Adversarial Network for SAR-to-Optical Image Translation with Feature Cross-Fusion Inference. In Proceedings of the IGARSS 2022—2022 IEEE International Geoscience and Remote Sensing Symposium, Kuala Lumpur, Malaysia, 17–22 July 2022; pp. 6025–6028. [Google Scholar] [CrossRef]
  20. Quan, D.; Wei, H.; Wang, S.; Lei, R.; Duan, B.; Li, Y.; Hou, B.; Jiao, L. Self-Distillation Feature Learning Network for Optical and SAR Image Registration. IEEE Trans. Geosci. Remote Sens. 2022, 60, 4706718. [Google Scholar] [CrossRef]
  21. Zhao, Y.; Celik, T.; Liu, N.; Li, H.C. A Comparative Analysis of GAN-Based Methods for SAR-to-Optical Image Translation. IEEE Geosci. Remote Sens. Lett. 2022, 19, 3512605. [Google Scholar] [CrossRef]
  22. Zhang, M.; He, C.; Zhang, J.; Yang, Y.; Peng, X.; Guo, J. SAR-to-Optical Image Translation via Neural Partial Differential Equations. In Proceedings of the Thirty-First International Joint Conference on Artificial Intelligence, IJCAI-22, Messe Wien, Vienna, Austria, 23–29 July 2022; Raedt, L.D., Ed.; International Joint Conferences on Artificial Intelligence Organization: Eindhoven, The Netherlands, 2022; Volume 7, pp. 1644–1650. [Google Scholar] [CrossRef]
  23. Fuentes Reyes, M.; Auer, S.; Merkle, N.; Henry, C.; Schmitt, M. SAR-to-Optical Image Translation Based on Conditional Generative Adversarial Networks—Optimization, Opportunities and Limits. Remote Sens. 2019, 11, 2067. [Google Scholar] [CrossRef]
  24. Ebel, P.; Schmitt, M.; Zhu, X.X. Cloud Removal in Unpaired Sentinel-2 Imagery Using Cycle-Consistent GAN and SAR-Optical Data Fusion. In Proceedings of the IGARSS 2020-2020 IEEE International Geoscience and Remote Sensing Symposium, Waikoloa, HI, USA, 26 September–2 October 2020; pp. 2065–2068. [Google Scholar] [CrossRef]
  25. Fornaro, G.; Reale, D.; Serafino, F. Four-Dimensional SAR Imaging for Height Estimation and Monitoring of Single and Double Scatterers. IEEE Trans. Geosci. Remote Sens. 2009, 47, 224–237. [Google Scholar] [CrossRef]
  26. Laine, M.; Vuorinen, A. Basics of thermal field theory. Lect. Notes Phys. 2016, 925, 1701-01554. [Google Scholar]
  27. Zhang, M.; Wu, Q.; Guo, J.; Li, Y.; Gao, X. Heat Transfer-Inspired Network for Image Super-Resolution Reconstruction. IEEE Trans. Neural Netw. Learn. Syst. 2022, 1–11. [Google Scholar] [CrossRef]
  28. Fu, S.; Xu, F. Differentiable SAR Renderer and Image-Based Target Reconstruction. IEEE Trans. Image Process. 2022, 31, 6679–6693. [Google Scholar] [CrossRef]
  29. Chen, S.W.; Cui, X.C.; Wang, X.S.; Xiao, S.P. Speckle-Free SAR Image Ship Detection. IEEE Trans. Image Process. 2021, 30, 5969–5983. [Google Scholar] [CrossRef]
  30. Shi, H.; Zhang, B.; Wang, Y.; Cui, Z.; Chen, L. SAR-to-Optical Image Translating Through Generate-Validate Adversarial Networks. IEEE Geosci. Remote Sens. Lett. 2022, 19, 4506905. [Google Scholar] [CrossRef]
  31. Hwang, J.; Shin, Y. SAR-to-Optical Image Translation Using SSIM Loss Based Unpaired GAN. In Proceedings of the 2022 13th International Conference on Information and Communication Technology Convergence (ICTC), Jeju Island, Republic of Korea, 19–21 October 2022; pp. 917–920. [Google Scholar] [CrossRef]
  32. Pan, Y.; Khan, I.A.; Meng, H. SAR-to-optical image translation using multi-stream deep ResCNN of information reconstruction. Expert Syst. Appl. 2023, 224, 120040. [Google Scholar] [CrossRef]
  33. Romano, G.; Diaco, M.; Barretta, R. Variational formulation of the first principle of continuum thermodynamics. Contin. Mech. Thermodyn. 2010, 22, 177–187. [Google Scholar] [CrossRef]
  34. Cai, R.G.; Kim, S.P. First law of thermodynamics and Friedmann equations of Friedmann-Robertson-Walker universe. J. High Energy Phys. 2005, 2005, 050. [Google Scholar] [CrossRef]
  35. Guo, J.; He, C.; Zhang, M.; Li, Y.; Gao, X.; Song, B. Edge-Preserving Convolutional Generative Adversarial Networks for SAR-to-Optical Image Translation. Remote Sens. 2021, 13, 3575. [Google Scholar] [CrossRef]
  36. Tang, H.; Xu, D.; Yan, Y.; Corso, J.J.; Torr, P.; Sebe, N. Multi-Channel Attention Selection GANs for Guided Image-to-Image Translation. In Proceedings of the 28th ACM International Conference on Multimedia, Seattle, WA, USA, 12–16 October 2020. [Google Scholar]
  37. Dong, G.; Liu, H. Global Receptive-Based Neural Network for Target Recognition in SAR Images. IEEE Trans. Cybern. 2021, 51, 1954–1967. [Google Scholar] [CrossRef]
  38. Zuo, Z.; Li, Y. A SAR-to-Optical Image Translation Method Based on PIX2PIX. In Proceedings of the 2021 IEEE International Geoscience and Remote Sensing Symposium IGARSS, Brussels, Belgium, 11–16 July 2021; pp. 3026–3029. [Google Scholar] [CrossRef]
  39. Zhang, M.; Wang, N.; Li, Y.; Gao, X. Deep latent low-rank representation for face sketch synthesis. IEEE Trans. Neural Netw. Learn. Syst. 2019, 30, 3109–3123. [Google Scholar] [CrossRef]
  40. Zhang, M.; Wang, N.; Li, Y.; Gao, X. Neural probabilistic graphical model for face sketch synthesis. IEEE Trans. Neural Netw. Learn. Syst. 2019, 31, 2623–2637. [Google Scholar] [CrossRef]
  41. Gomez, R.; Liu, Y.; De Nadai, M.; Karatzas, D.; Lepri, B.; Sebe, N. Retrieval guided unsupervised multi-domain image to image translation. In Proceedings of the 28th ACM International Conference on Multimedia, Seattle, WA, USA, 12–16 October 2020; pp. 3164–3172. [Google Scholar]
  42. Li, S.; Günel, S.; Ostrek, M.; Ramdya, P.; Fua, P.; Rhodin, H. Deformation-Aware Unpaired Image Translation for Pose Estimation on Laboratory Animals. In Proceedings of the 2020 IEEE Conference on Computer Vision and Pattern Recognition (CVPR), Seattle, WA, USA, 16–18 June 2020; pp. 13155–13165. [Google Scholar] [CrossRef]
  43. Doi, K.; Sakurada, K.; Onishi, M.; Iwasaki, A. GAN-Based SAR-to-Optical Image Translation with Region Information. In Proceedings of the IGARSS 2020—2020 IEEE International Geoscience and Remote Sensing Symposium, Waikoloa, HI, USA, 17 February 2020; pp. 2069–2072. [Google Scholar] [CrossRef]
  44. Xiong, Q.; Li, G.; Yao, X.; Zhang, X. SAR-to-Optical Image Translation and Cloud Removal Based on Conditional Generative Adversarial Networks: Literature Survey, Taxonomy, Evaluation Indicators, Limits and Future Directions. Remote Sens. 2023, 15, 1137. [Google Scholar] [CrossRef]
  45. Zhang, Q.; Liu, X.; Liu, M.; Zou, X.; Zhu, L.; Ruan, X. Comparative analysis of edge information and polarization on sar-to-optical translation based on conditional generative adversarial networks. Remote Sens. 2021, 13, 128. [Google Scholar] [CrossRef]
  46. Li, H.; Gu, C.; Wu, D.; Cheng, G.; Guo, L.; Liu, H. Multiscale Generative Adversarial Network Based on Wavelet Feature Learning for SAR-to-Optical Image Translation. IEEE Trans. Geosci. Remote Sens. 2022, 60, 1–15. [Google Scholar] [CrossRef]
  47. Zhang, J.; Zhou, J.; Lu, X. Feature-guided SAR-to-optical image translation. IEEE Access 2020, 8, 70925–70937. [Google Scholar] [CrossRef]
  48. Wang, L.; Xu, X.; Yu, Y.; Yang, R.; Gui, R.; Xu, Z.; Pu, F. SAR-to-optical image translation using supervised cycle-consistent adversarial networks. IEEE Access 2019, 7, 129136–129149. [Google Scholar] [CrossRef]
  49. Zhang, J.; Zhou, J.; Li, M.; Zhou, H.; Yu, T. Quality Assessment of SAR-to-Optical Image Translation. Remote Sens. 2020, 12, 3472. [Google Scholar] [CrossRef]
  50. Sun, Y.; Jiang, W.; Yang, J.; Li, W. SAR Target Recognition Using cGAN-Based SAR-to-Optical Image Translation. Remote Sens. 2022, 14, 1793. [Google Scholar] [CrossRef]
  51. Wei, J.; Zou, H.; Sun, L.; Cao, X.; He, S.; Liu, S.; Zhang, Y. CFRWD-GAN for SAR-to-Optical Image Translation. Remote Sens. 2023, 15, 2547. [Google Scholar] [CrossRef]
  52. Du, W.L.; Zhou, Y.; Zhu, H.; Zhao, J.; Shao, Z.; Tian, X. A Semi-Supervised Image-to-Image Translation Framework for SAR–Optical Image Matching. IEEE Geosci. Remote Sens. Lett. 2022, 19, 1–5. [Google Scholar] [CrossRef]
  53. Isola, P.; Zhu, J.Y.; Zhou, T.; Efros, A.A. Image-to-image translation with conditional adversarial networks. In Proceedings of the IEEE Conference on Computer Vision and Pattern Recognition, Honolulu, HI, USA, 21–26 July 2017; pp. 1125–1134. [Google Scholar]
  54. Zhu, J.Y.; Park, T.; Isola, P.; Efros, A.A. Unpaired image-to-image translation using cycle-consistent adversarial networks. In Proceedings of the IEEE International Conference on Computer Vision, Venice, Italy, 22–29 October 2017; pp. 2223–2232. [Google Scholar]
  55. Zhang, M.; Zhang, R.; Zhang, J.; Guo, J.; Li, Y.; Gao, X. Dim2Clear Network for Infrared Small Target Detection. IEEE Trans. Geosci. Remote Sens. 2023, 61, 1–14. [Google Scholar] [CrossRef]
  56. Zhang, M.; Zhang, R.; Yang, Y.; Bai, H.; Zhang, J.; Guo, J. ISNet: Shape Matters for Infrared Small Target Detection. In Proceedings of the IEEE/CVF Conference on Computer Vision and Pattern Recognition (CVPR), New Orleans, LA, USA, 18–24 June 2022; pp. 877–886. [Google Scholar]
  57. Zhang, M.; Yue, K.; Zhang, J.; Li, Y.; Gao, X. Exploring Feature Compensation and Cross-Level Correlation for Infrared Small Target Detection. In Proceedings of the 30th ACM International Conference on Multimedia, New York, NY, USA, 10–14 October 2022; MM ‘22. pp. 1857–1865. [Google Scholar] [CrossRef]
  58. Zhang, M.; Bai, H.; Zhang, J.; Zhang, R.; Wang, C.; Guo, J.; Gao, X. RKformer: Runge-Kutta Transformer with Random-Connection Attention for Infrared Small Target Detection. In Proceedings of the 30th ACM International Conference on Multimedia, New York, NY, USA, 10–14 October 2022; MM ‘22. pp. 1730–1738. [Google Scholar] [CrossRef]
  59. Ghiasi, A.; Kazemi, H.; Borgnia, E.; Reich, S.; Shu, M.; Goldblum, M.; Wilson, A.G.; Goldstein, T. What do Vision Transformers Learn? A Visual Exploration. arXiv 2022, arXiv:2212.06727. [Google Scholar]
  60. Hu, Y.; Yang, J.; Chen, L.; Li, K.; Sima, C.; Zhu, X.; Chai, S.; Du, S.; Lin, T.; Wang, W.; et al. Planning-Oriented Autonomous Driving. In Proceedings of the IEEE/CVF Conference on Computer Vision and Pattern Recognition (CVPR), Vancouver, BC, Canada, 17–24 June 2023; pp. 17853–17862. [Google Scholar]
  61. He, K.; Zhang, X.; Ren, S.; Sun, J. Deep residual learning for image recognition. In Proceedings of the IEEE Conference on Computer Vision and Pattern Recognition, Las Vegas, NV, USA, 26 June–1 July 2016; pp. 770–778. [Google Scholar]
  62. Zhang, M.; Xin, J.; Zhang, J.; Tao, D.; Gao, X. Curvature Consistent Network for Microscope Chip Image Super-Resolution. IEEE Trans. Neural Netw. Learn. Syst. 2023, 34, 10538–10551. [Google Scholar] [CrossRef] [PubMed]
  63. Zhang, M.; Wu, Q.; Zhang, J.; Gao, X.; Guo, J.; Tao, D. Fluid Micelle Network for Image Super-Resolution Reconstruction. IEEE Trans. Cybern. 2022, 53, 578–591. [Google Scholar] [CrossRef] [PubMed]
  64. Zhang, J.; Tao, D. FAMED-Net: A fast and accurate multi-scale end-to-end dehazing network. IEEE Trans. Image Process. 2019, 29, 72–84. [Google Scholar] [CrossRef] [PubMed]
  65. Weinan, E. A proposal on machine learning via dynamical systems. Commun. Math. Stat. 2017, 1, 1–11. [Google Scholar]
  66. Lu, Y.; Zhong, A.; Li, Q.; Dong, B. Beyond finite layer neural networks: Bridging deep architectures and numerical differential equations. In Proceedings of the International Conference on Machine Learning, Stockholm, Sweden, 10–15 July 2018; Volume 80, pp. 3276–3285. [Google Scholar]
  67. Yin, S.; Yang, X.; Lu, R.; Deng, Z.; Yang, Y.H. Visual Attention and ODE-inspired Fusion Network for image dehazing. Eng. Appl. Artif. Intell. 2024, 130, 107692. [Google Scholar] [CrossRef]
  68. Yin, S.; Hu, S.; Wang, Y.; Wang, W.; Yang, Y.H. Adams-based hierarchical features fusion network for image dehazing. Neural Netw. 2023, 163, 379–394. [Google Scholar] [CrossRef]
  69. Chen, R.T.Q.; Rubanova, Y.; Bettencourt, J.; Duvenaud, D. Neural Ordinary Differential Equations. In Proceedings of the 32nd International Conference on Neural Information Processing Systems, NIPS 2018, Red Hook, NY, USA, 3–8 December 2018; pp. 6572–6583. [Google Scholar]
  70. He, X.; Mo, Z.; Wang, P.; Liu, Y.; Yang, M.; Cheng, J. Ode-inspired network design for single image super-resolution. In Proceedings of the IEEE Conference on Computer Vision and Pattern Recognition, Long Beach, CA, USA, 15–20 June 2019; pp. 1732–1741. [Google Scholar]
  71. Han, J.; Shoeiby, M.; Petersson, L.; Armin, M.A. Dual Contrastive Learning for Unsupervised Image-to-Image Translation. In Proceedings of the IEEE/CVF Conference on Computer Vision and Pattern Recognition, Nashville, TN, USA, 19–25 June 2021. [Google Scholar]
  72. Tang, H.; Liu, H.; Xu, D.; Torr, P.H.S.; Sebe, N. AttentionGAN: Unpaired Image-to-Image Translation using Attention-Guided Generative Adversarial Networks. IEEE Trans. Neural Netw. Learn. Syst. 2023, 34, 1972–1987. [Google Scholar] [CrossRef]
  73. Wang, Z.; Bovik, A.C.; Sheikh, H.R.; Simoncelli, E.P. Image quality assessment: From error visibility to structural similarity. IEEE Trans. Image Process. 2004, 13, 600–612. [Google Scholar] [CrossRef]
  74. Zhang, X.; Li, Z.; Change Loy, C.; Lin, D. Polynet: A pursuit of structural diversity in very deep networks. In Proceedings of the IEEE Conference on Computer Vision and Pattern Recognition(cvpr), Honolulu, HI, USA, 21–26 July 2017; pp. 718–726. [Google Scholar]
Figure 1. The generator structure of the proposed S2O-TDN, which is in line with a CycleGAN. The generator consists of a backbone with three TFD residual blocks (Section 3.1) inserted and a parallel FLT-guided branch (Section 3.2) for further feature interactions. The high-dimensional tensor information output from the FLT-guided branches is output as a one-channel two-dimensional tensor by the convolution layer for intuitive visual understanding.
Remotesensing 16 00242 g001
Figure 2. Structure of the TFD residual block.
Remotesensing 16 00242 g002
Figure 3. The visual results of the proposed S2O-TDN with the other S2O image translation methods including Pix2pix [53], the CycleGAN [48], the DCLGAN [71], the S-CycleGAN [54], the FGGAN [47], the EPCGAN [35], and the AttentionGAN [72].
Remotesensing 16 00242 g003
Figure 4. Structure information comparison of the proposed S2O-TDN and the other S2O image translation methods including Pix2pix [53], the CycleGAN [48], the DCLGAN [71], the S-CycleGAN [54], the FGGAN [47], the EPCGAN [35], and the AttentionGAN [72].
Remotesensing 16 00242 g004
Figure 5. The visual results of the ablation study of the FLT head.
Remotesensing 16 00242 g005
Figure 6. Variant designs of the FLT-guided branch by using different connections after the FLT head.
Remotesensing 16 00242 g006
Table 1. Quantitative results of different methods. The best values for each quality index are shown in bold.
Method PSNRSSIM
Pix2pixTest 117.180.3452
Test 215.930.2664
Test 316.460.2715
CycleGANTest 116.510.3422
Test 215.130.2956
Test 315.910.2896
S-CycleGANTest 118.050.4082
Test 215.670.2899
Test 316.530.2841
FGGANTest 118.560.4438
Test 215.670.3625
Test 316.530.3302
EPCGANTest 118.890.4491
Test 216.540.3615
Test 317.460.3454
AttentionGANTest 112.500.3239
Test 214.700.1914
Test 315.180.2374
S2O-TDNTest 119.160.4736
Test 217.930.4053
Test 318.260.3705
Table 2. Results of the ablation study of key components.
Method PSNRSSIM
BaseTest 118.190.4351
Test 216.990.3696
Test 316.960.3329
+FLT-guidedTest 116.610.4529
Test 217.290.3702
Test 317.530.3480
+TFDTest 118.590.4441
Test 217.600.3825
Test 317.960.3596
+Poly2 +FLT-guidedTest 118.780.4644
Test 217.870.3986
Test 317.330.3541
+RK2 +FLT-guidedTest 118.540.4408
Test 217.120.3814
Test 316.690.3329
+TFD +FLT-guidedTest 119.160.4736
Test 217.940.4053
Test 318.260.3705
Table 3. Results of the ablation study of the FLT head. The best values for each quality index are shown in bold.
Method PSNRSSIM
Ordinary convTest 118.230.4370
Test 217.340.3872
Test 317.690.3585
FLT HeadTest 119.160.4736
Test 217.940.4053
Test 318.260.3705
Table 4. Results of the comparative study of different filters. The best values for each quality index are shown in bold.
Method PSNRSSIM
FLT HeadTest 119.160.4736
Test 217.940.4053
Test 318.260.3705
Roberts filtersTest 116.350.3578
Test 216.280.3144
Test 315.840.2917
Prewitt filtersTest 118.370.4527
Test 217.110.3918
Test 317.840.3429
Sobel filtersTest 117.980.4219
Test 217.350.4011
Test 317.780.3315
Table 5. Results of S2O-TDN with different designs of the FLT-guided branch. The best values for each quality index are shown in bold.
Method PSNRSSIM
S2O-TDNTest 119.160.4736
Test 217.940.4053
Test 318.260.3705
S2O-TDN(b)Test 119.210.4827
Test 217.740.3969
Test 318.180.3659
S2O-TDN(c)Test 118.960.4505
Test 217.800.3944
Test 317.880.3613
Table 6. Model complexity analysis of some representative S2O methods and the proposed S2O-TDN.
MethodParamrers (M)FLOPs (G)Execution Time (s)
Pix2pix54.4017.842.263
CycleGAN11.3756.010.805
FG-GAN45.5862.043.572
EPCGAN2.51564.530.859
S2O-TDN2.06362.120.783
Disclaimer/Publisher’s Note: The statements, opinions and data contained in all publications are solely those of the individual author(s) and contributor(s) and not of MDPI and/or the editor(s). MDPI and/or the editor(s) disclaim responsibility for any injury to people or property resulting from any ideas, methods, instructions or products referred to in the content.

