1. Introduction
The remote sensing techniques are advanced methods that could be utilized in many branches of environmental engineering [
1]. Water quality is one of the important aspects in environmental monitoring and assessment that might need field measurement. Continuous sampling of water quality is traditionally a solution for measuring the concentration of the constituents in inland water bodies such as rivers and lakes. However, using conventional assessment methods might be expensive and arduous. Hence, remote sensing-based assessment of water quality through spectral images has been recommended in the literature [
2]. These methods can reduce the costs of water quality assessment as well as the required time for completing the projects [
3]. Details of the potential application of remote sensing analysis in the water quality assessment of water bodies, especially lakes and coastal regions, have been highlighted previously [
4,
5]. A distinctive spectral signature makes the water quality parameters detectable because an optically active component (OAC) alters the spectral behaviour of the water, which means it can be a reliable method for water quality assessment [
6]. Water quality parameters such as metal ions, total suspended solids, total dissolved solids and turbidity can be analysed through different satellite images [
7,
8,
9].
Landsat 8 was launched eight years ago from Vandenberg Air Force Base, California, in which the Operational Land Imager (OLI) and the Thermal Infrared Sensor (TIRS) have been installed to capture the spectral images with a spatial resolution of 30 m. The OLI produces images each 16 days that means images of the study area might be available for 16 day intervals. Some previous studies have highlighted the robustness of OLI images in water quality assessment [
10]. More details on Landsat 8 and OLI have been addressed in the literature [
11,
12]. Dissolved oxygen, conductivity, alkalinity, hardness, total dissolved solid, chloride, phosphate, pH are major parameters assessed through these spectral images [
13].
One of the technical issues for applying satellite images to water quality assessment is to consider an appropriate model in the remote sensing data processing. Generally, some bands might be applied to develop a proper model in this regard. For example, conventional regression models, such as linear regression, are the simplest models to analyse spectral images [
4]. However, they might not be robust enough in all cases. Machine learning models have been applied in the remote sensing analysis to enhance the accuracy of monitoring [
14]. Artificial neural networks (ANNs) are one of the popular machine learning models in which three layers, including inputs, outputs and hidden layers, will be used to generate a computational map [
15]. However, due to some inherent drawbacks of feed forward neural networks, such as acting like a black box, motivated scholars to improve them [
16]. For example, ANNs perform like a black box, that means interpretability of the outputs might not be adequate. Hence, neuro fuzzy inference systems (NFSs) were developed to improve the conventional ANNs. The adaptive neuro fuzzy inference system (ANFIS) is one of the most used data driven models in which a fuzzy inference system is applied to the structure of the neural network [
17]. The training process is the main step to developing a robust data driven model, such as an ANFIS-based model [
18]. Different methods could be applied to train the data driven models. Two known training methods, including the back propagation method and hybrid method, have been addressed in the literature [
19]. However, improved training methods might be necessary. Because it might be significantly effective on the reliability and efficiency of the data driven model. Utilizing evolutionary algorithms for training of a data driven model is one of the recent advances in AI methods [
20]. These algorithms have originally been developed for the optimization process. It should be noted that the training process of the data driven models is a type of optimization problem in which coefficients and constants of the network should be optimized based on the observed data. Generally, the evolutionary algorithms might be classified as the classic and new generation algorithms [
21]. Classic algorithms, such as genetic algorithms and particle swarm optimization, have broadly been addressed in the literature for solving the optimization problems. However, the previous studies indicated that classic algorithms might not be efficient for all problems. Hence, many new generation algorithms have been benchmarked that might be better solutions for some problems. In another classification, evolutionary algorithms might be categorized as animal and non-animal inspired algorithms [
22]. Animal inspired algorithms are more popular than non-animal inspired algorithms, in which social behaviours of the animal might be imitated to find the best solution. The particle swarm optimization (PSO) is a known animal inspired algorithm in which the movement of the organisms in a bird flock or fish school is imitated. Conversely, the non-animal inspired algorithms have been developed based on the natural law. For example, the gravity search algorithm is one of the widely used non-animal inspired algorithms in which a gravity law would be simulated to find the best solution [
23]. The previous studies corroborate the high efficiency of the evolutionary algorithms for training neural networks [
24].
The cage fish farming is one of the popular methods in aquaculture in which the fish are kept in cages, that means entire communities can share a body of water [
25]. This method might have some advantages compared with conventional fish farming, in which each farm needs an aquacultural pool and other requirements. Using reservoirs for the cage fish farming is prevalent in many regions of the world [
26]. However, water quality suitability is one of the critical technical issues for a successful cage fish farming. Hence, monitoring and assessment of water quality in the reservoirs might be very important in this regard. Using traditional methods for continuous sampling is expensive. Hence, it is useful to apply cheaper methods in this regard. The present study highlights the application and efficiency of three types of AI methods associated with remote sensing data processing for monitoring and assessment of water quality in reservoirs that are utilizable for successful cage fish farming. The main novelty aspect of the present study is to measure the robustness of different AI methods to use in the data processing of remote sensing for water quality purposes with a focus on reservoir assessment for fish cage farming. The present study might open new windows for applying improved AI methods associated with the remote sensing data processing in lakes and reservoirs.
2. Application and Methodology
2.1. AI Methods
Three methods were applied in the present study, a conventional ANFIS-based method, a PSO-ANFIS method and an optimized artificial neural network (ONN), to process remote sensing data. More details regarding each method are presented as follows.
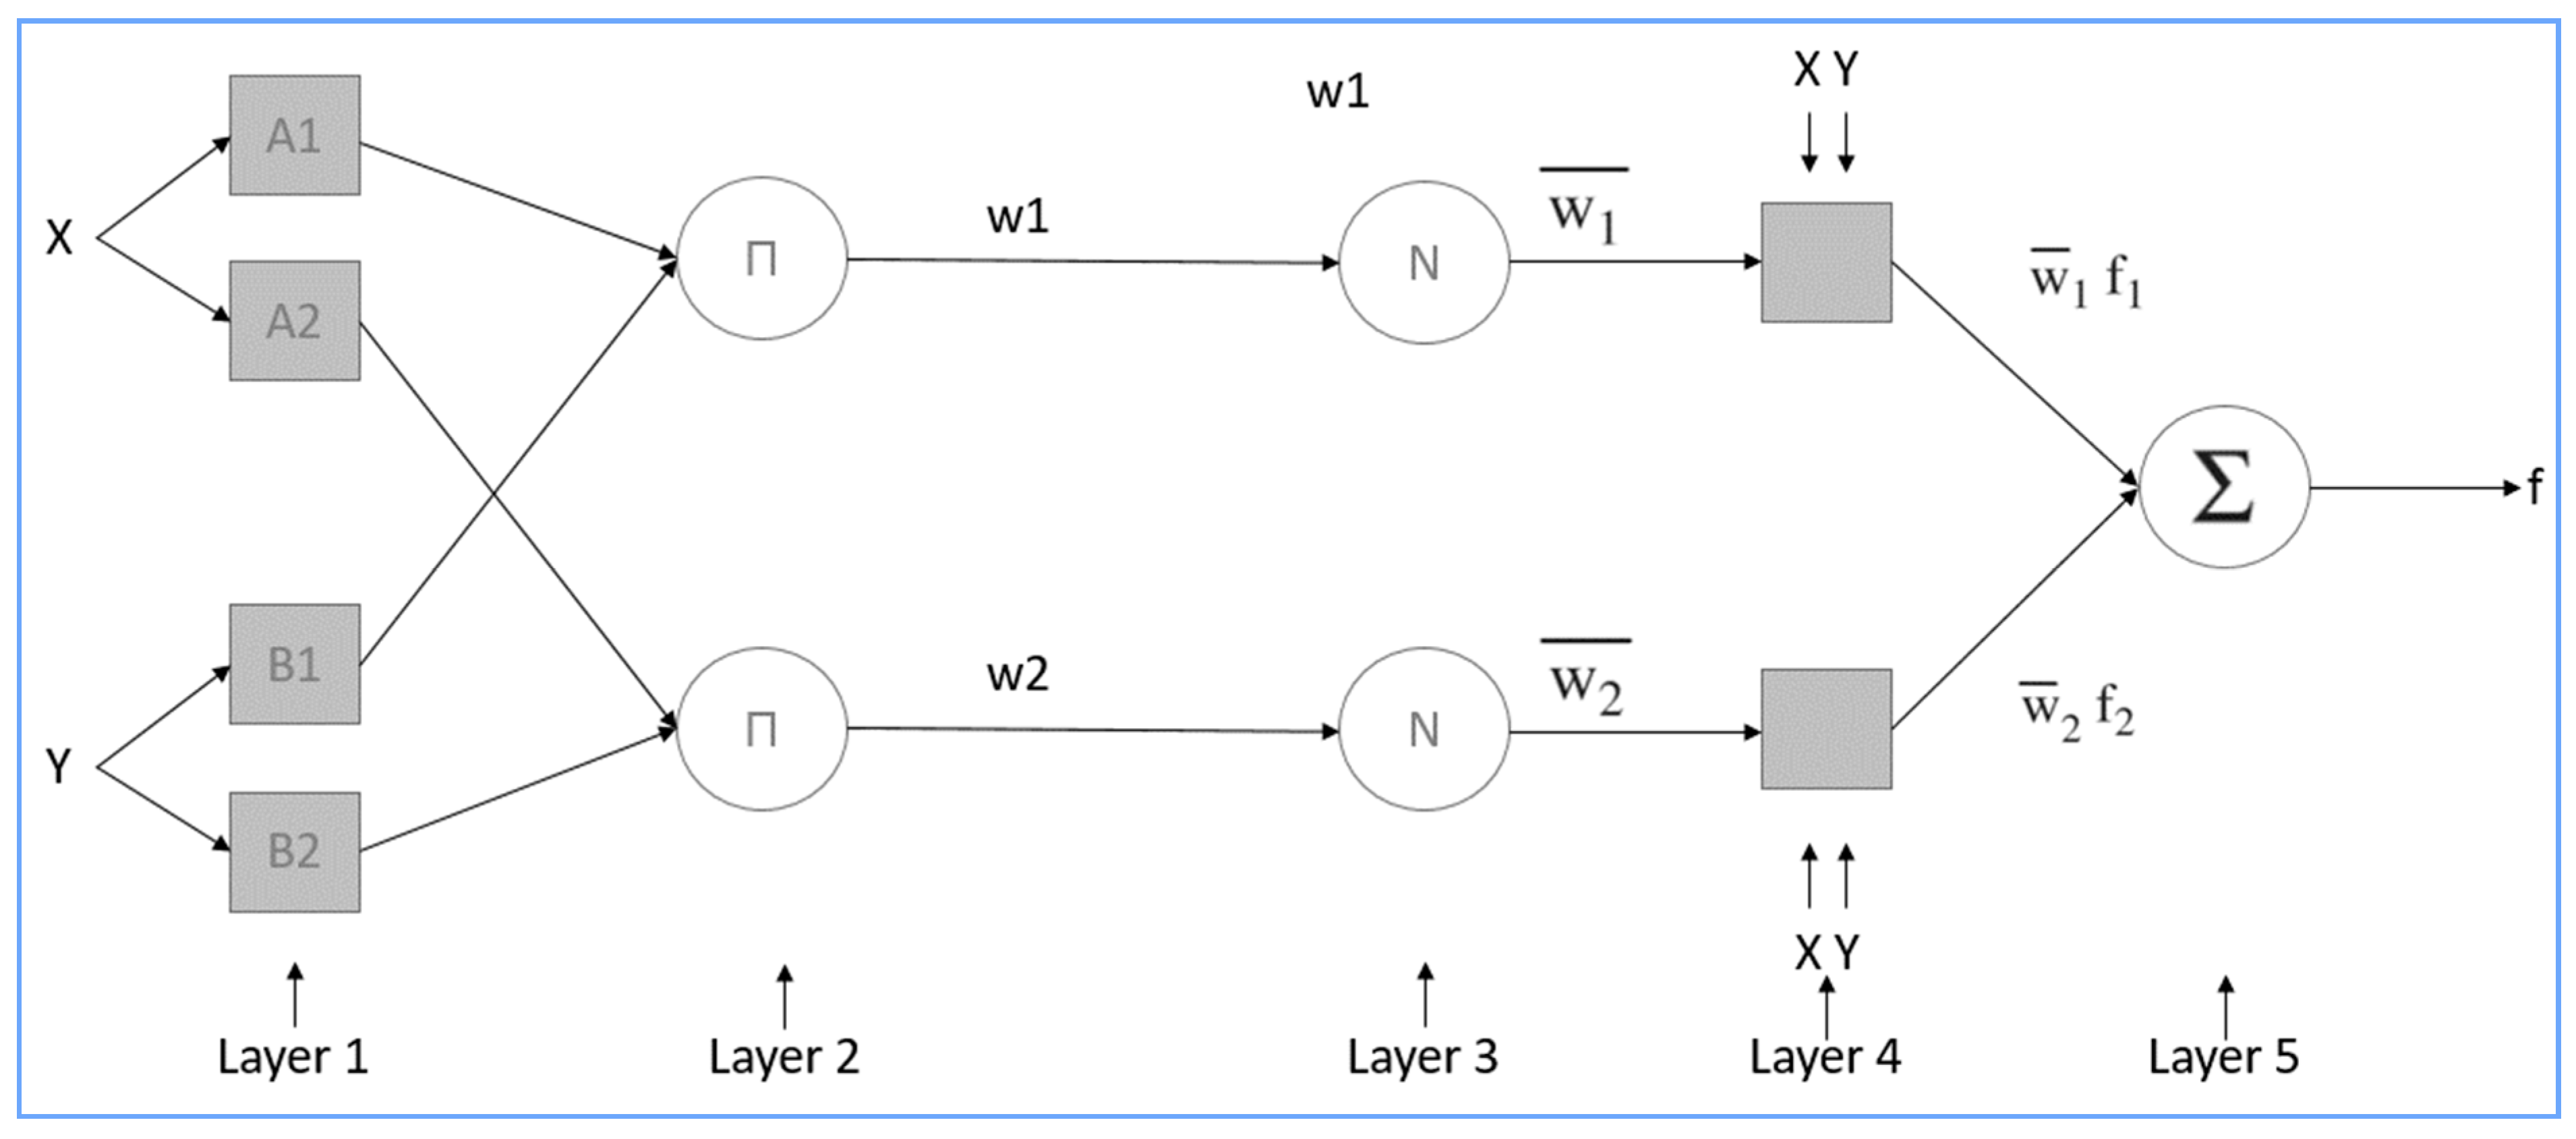
Figure 1 displays a simple structure of the ANFIS model in which two inputs are considered. The membership function could be calculated for the input of x by Equation (1).
where
a1,
N1 and
c1 are changeable premise parameters. Similarly, the membership function for the input of Y could be computed (i.e.,
. In the next step, membership functions should be multiplied as displayed in Equation (2).
In the next step, such products or firing strengths are then averaged. Nodes of the fourth layer use the average as the weighting factor. Fuzzy if–then rules can be defined as:
where A and B are linguistic labels of associated membership functions, and the terms p, q and r are changeable consequent parameters. Conventionally, two algorithms, the back propagation and hybrid algorithms, could be utilized to train the ANFIS-based data driven model. The hybrid algorithm is a combined method in which the back propagation is used for the parameters of the input membership function. Moreover, the least square estimation of the output membership functions is applied as the additional step to enhance the robustness of the back propagation method. As a brief description of the back propagation method, inputs and output are defined based on the observations. Then, feed forward of network calculates the simulated output. Finally, the error between the simulated data and observed data will be minimized based on adjusting the weights at each iteration by computing the slope of the surface.
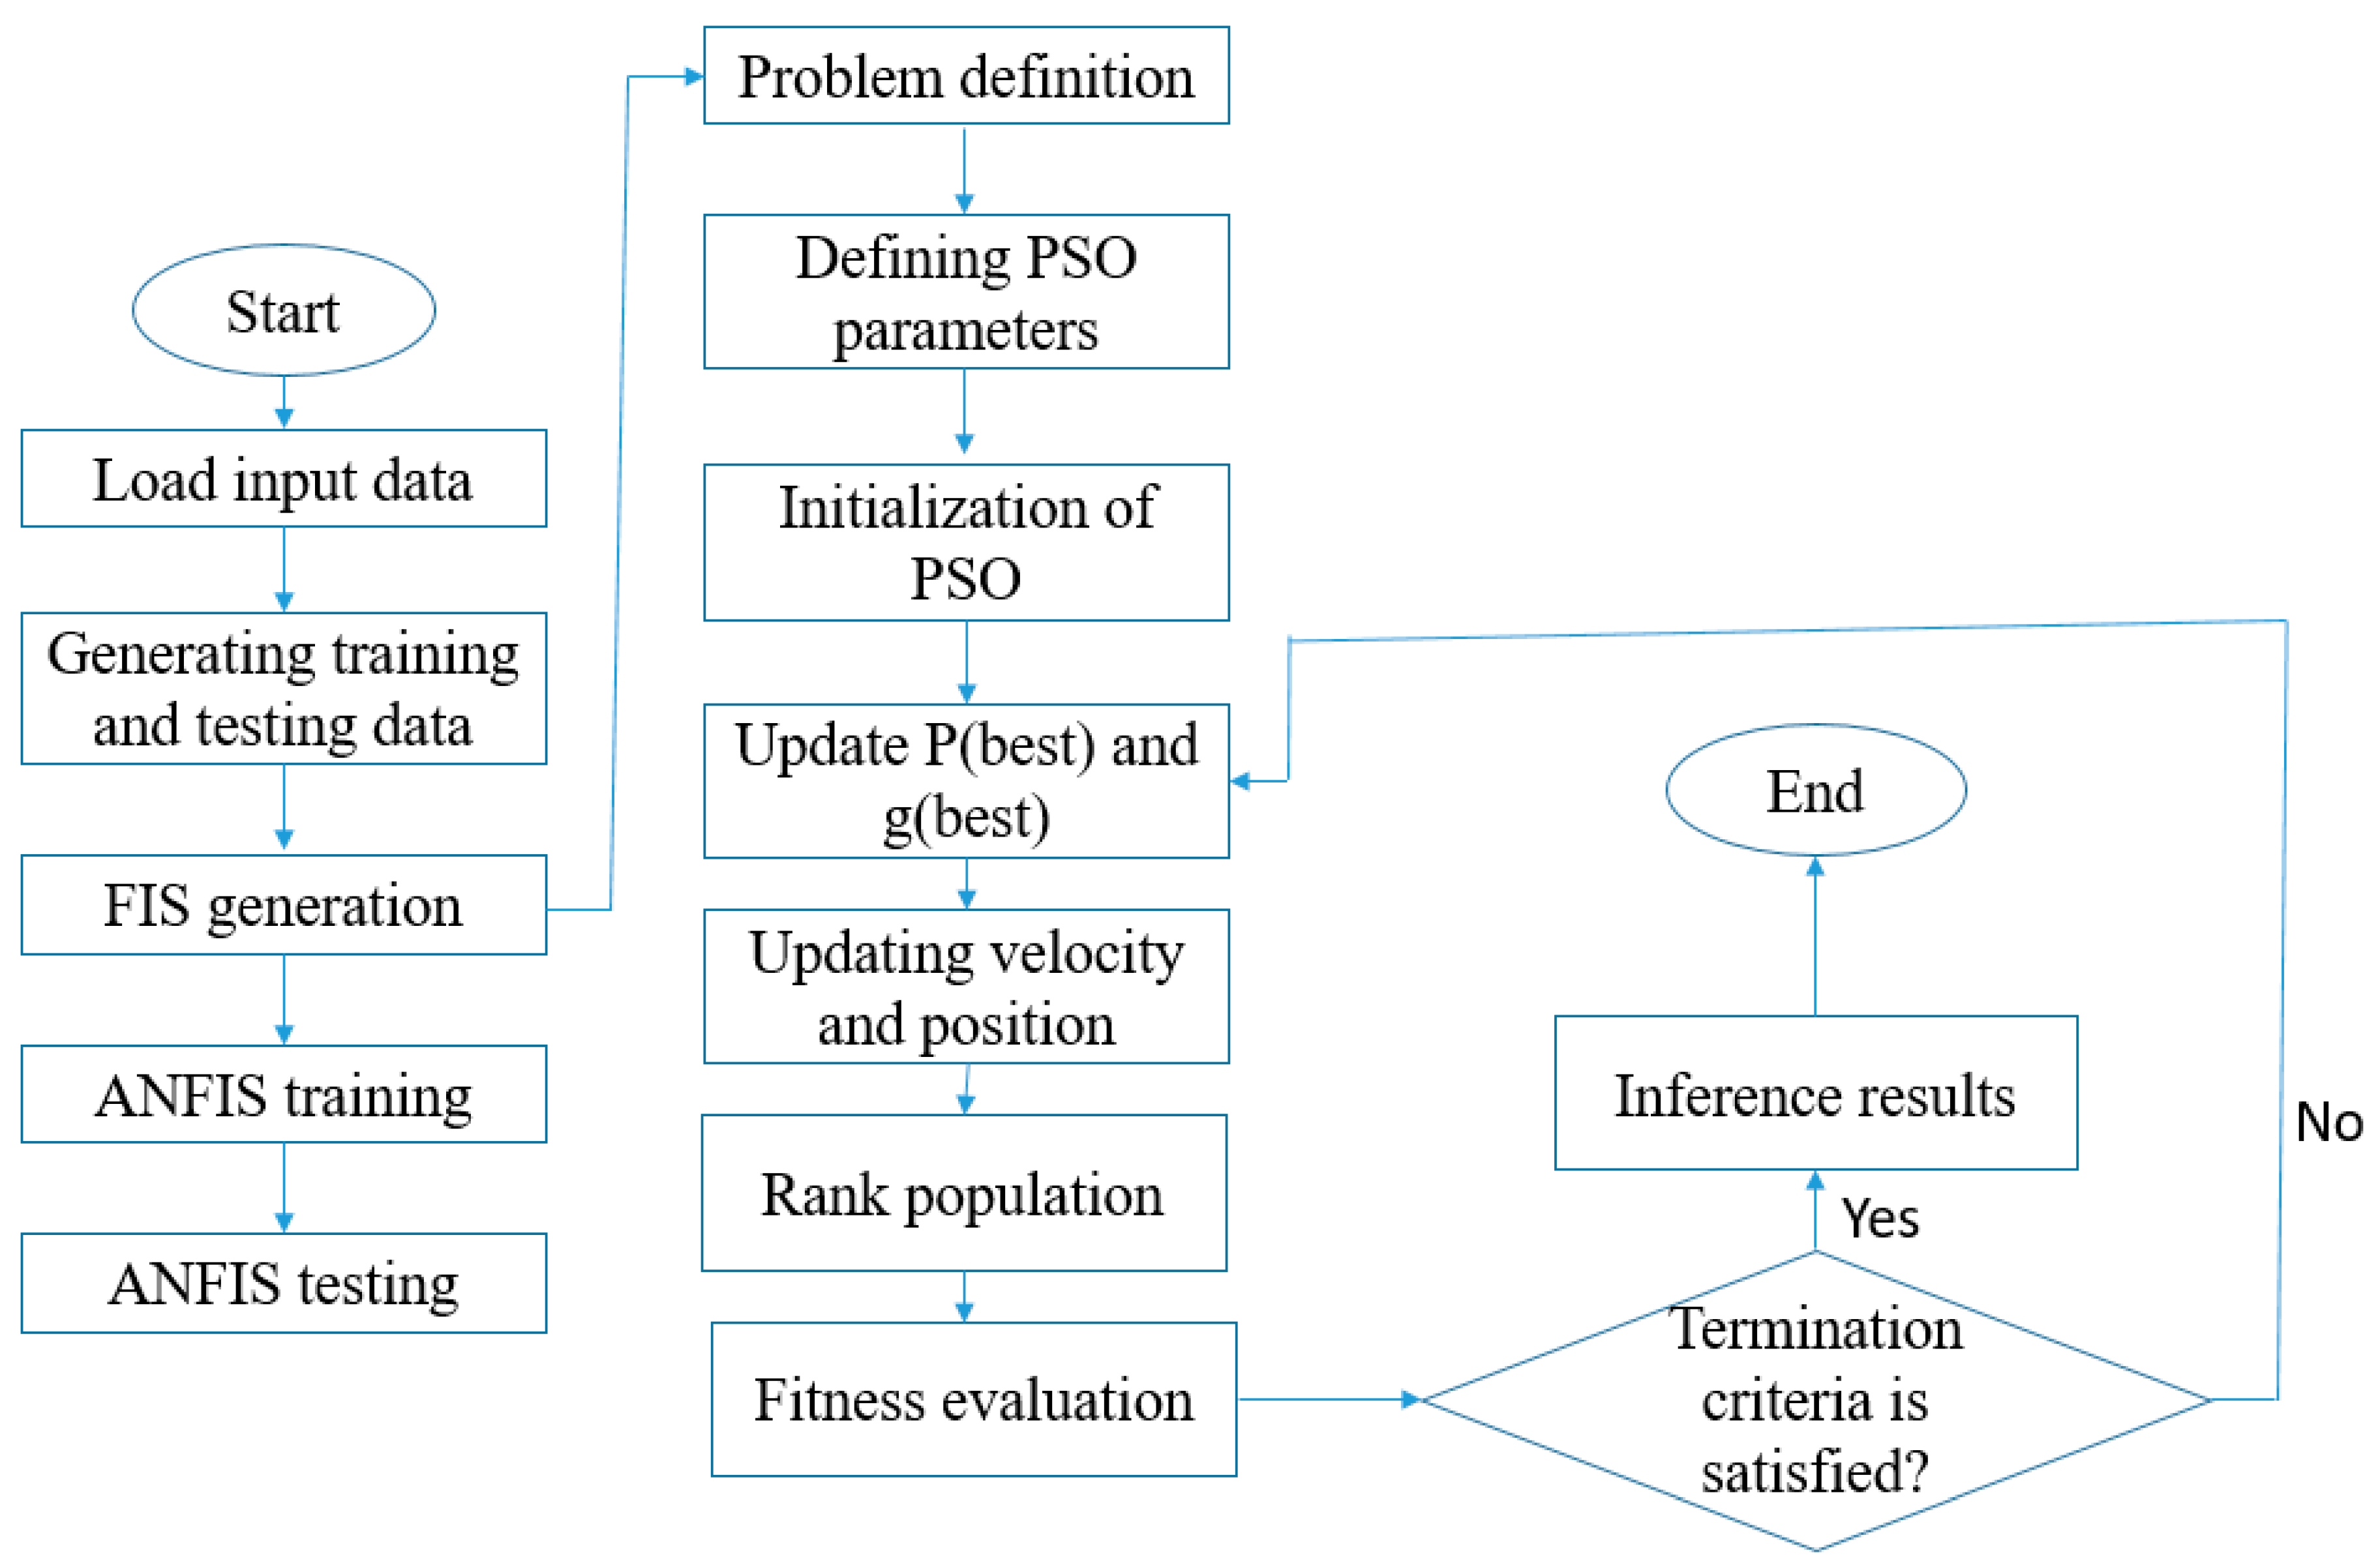
Another model applied in the present study is the PSO-ANFIS model. In fact, we utilized the PSO for training the ANFIS-based model. PSO is an evolutionary algorithm (EA) that tries to improve the optimal solution. In fact, this algorithm considers some particles as the candidates for the optimization problem. Then, these particles move around the search space according to a simple mathematical formula over the position and velocity of the candidates. PSO is the animal inspired algorithm that imitates the movement of a bird flock or fish school. More details regarding this algorithm have been addressed in the literature [
27].
Figure 2 displays the flowchart of the PSO-ANFIS method for developing a data driven model.
Table 1 shows the main characteristics of the developed ANFIS-based models in the present study.
Furthermore, an optimized artificial neural network (ONN) was applied to develop a data driven model for processing remote sensing data in the case study. It should be noted that ANNs contain three main layers, the inputs, hidden layers and output. It seems that the number of hidden layers is has a considerable impact on the outputs of the ANNs. Generally, one or two layers might be considered in the development of this type of neural network. However, no evidence is available in the literature regarding how many hidden layers might generate the best results. In fact, the required number of hidden layers might be different case by case. It appears that the optimized number of hidden layers, that is one of the requirements for applying ANNs in the machine learning method, has not been determined for the processing of remote sensing data according to the literature in the previous studies. In the present study, an optimal artificial neural network (ONN) is developed to process remote sensing data in which the number of hidden layers is optimized.
Figure 3 displays the general structure of the ANN in which inputs, hidden layers and the output layer are the main layers. It should be noted that a different number of hidden layers (0 to 100 layers) were considered in the development of the model. Then, the optimal number of hidden layers was utilized for the training process of the remote sensing analysis.
2.2. Case Study and Data Analysis
The proposed framework was implemented in the Latian dam, Iran. This dam is one of the main reservoirs for supplying water demand in the Tehran province that has been constructed on the Jajrood River. This dam provides a great lake which could be applied for cage fish farming. However, there are serious concerns regarding water quality suitability in the reservoir. In fact, point and non-point sources of pollutants are recognizable upstream of the dam that might confine the possibility of cage fish farming. It should be noted that fish species for the cages are mainly cold-water fish such as rainbow trout that need highly suitable water quality parameters for living. Hence, monitoring and assessment of the main water quality parameters are very critical for the managers and stakeholders. Three main water quality parameters, the water temperature, dissolved oxygen and total dissolved solids, are mainly problematic for the aquatics in the case study. Thus, we focused on these three parameters in the present study. Details of data acquisition and evaluating performance of the models are presented in
Table 2.
Table 2.
More details on data acquisition and evaluation of the model’s performance.
Table 2.
More details on data acquisition and evaluation of the model’s performance.
| Title | Description |
|---|
| Satellite and instrument | Landsat 8, operational land imager |
| Availability of spectral images | from 2013 to 2023, 16 days intervals |
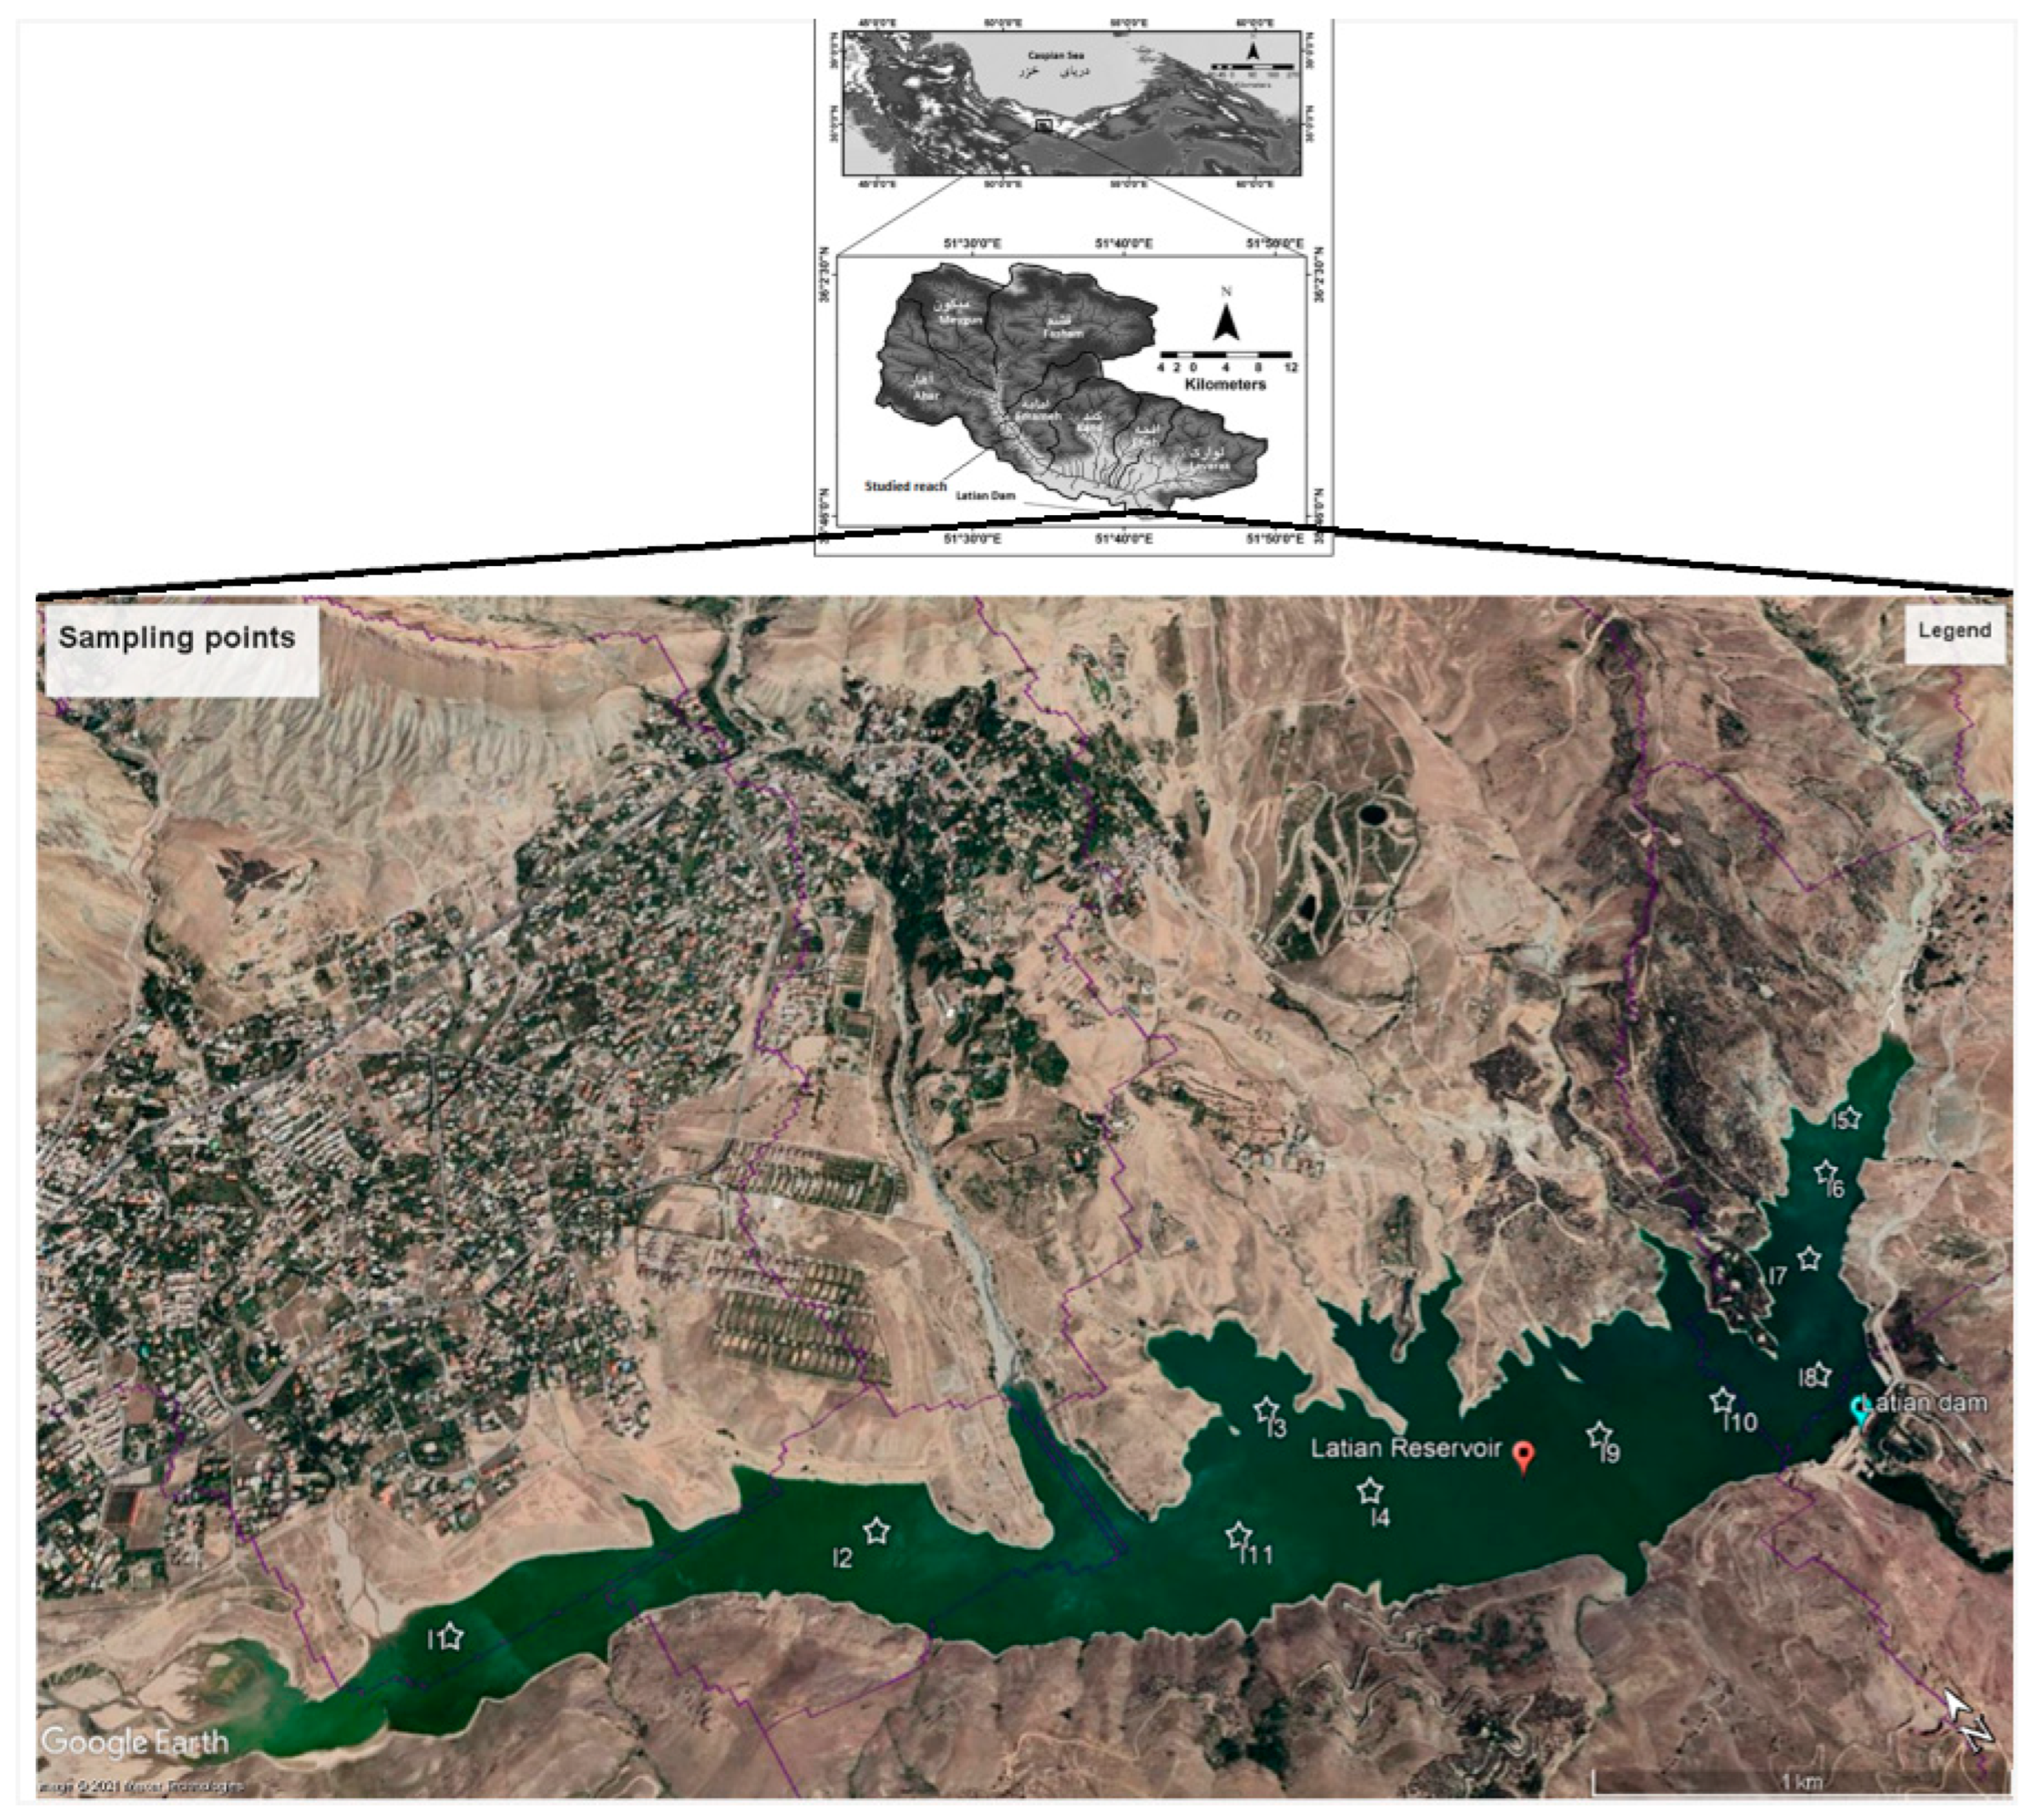
| Number of sampling points in Latian reservoir | 11 points shown in Figure 4 |
| Number of spectral images for training and testing the model | 21 |
| Total number of samples in training and testing the model | 231 |
| Platforms for data analysis | ArcGIS software v. 10.7 and MATLAB 2019a |
| First evaluation index of assessing performance of model | The Nash–Sutcliffe model efficiency coefficient (NSE). NSE more than 0.5 indicates the model is reliable |
| Mathematical definition of first evaluation index | |
| Second evaluation index of assessing performance of model | root means square error (RMSE) as a general index of evaluating statistical models |
| Mathematical definition of second evaluation index | |
Figure 4.
The location of the Latian dam and sampling points.
Figure 4.
The location of the Latian dam and sampling points.
In the above equations,
Mt are the modelled data in the sample t,
Ot are the observed data in the sample t,
Om are the mean observed data and T is the total number of samples.
RMSE was applied for evaluating the optimal number of hidden layers as well. The purpose of the present study is to apply the results of the remote sensing data processing to the water quality assessment of the reservoir for fish cage farming. Thus, post-processing is required as well. According to the expert opinion by an experienced ecologist, two classes were defined for each water quality parameter, the suitable class and unsuitable class.
Table 3 displays the defined classes for the case study. It should be noted that final outputs of the data processing were combined with the defined criteria as the post-processing of the developed framework.
3. Results
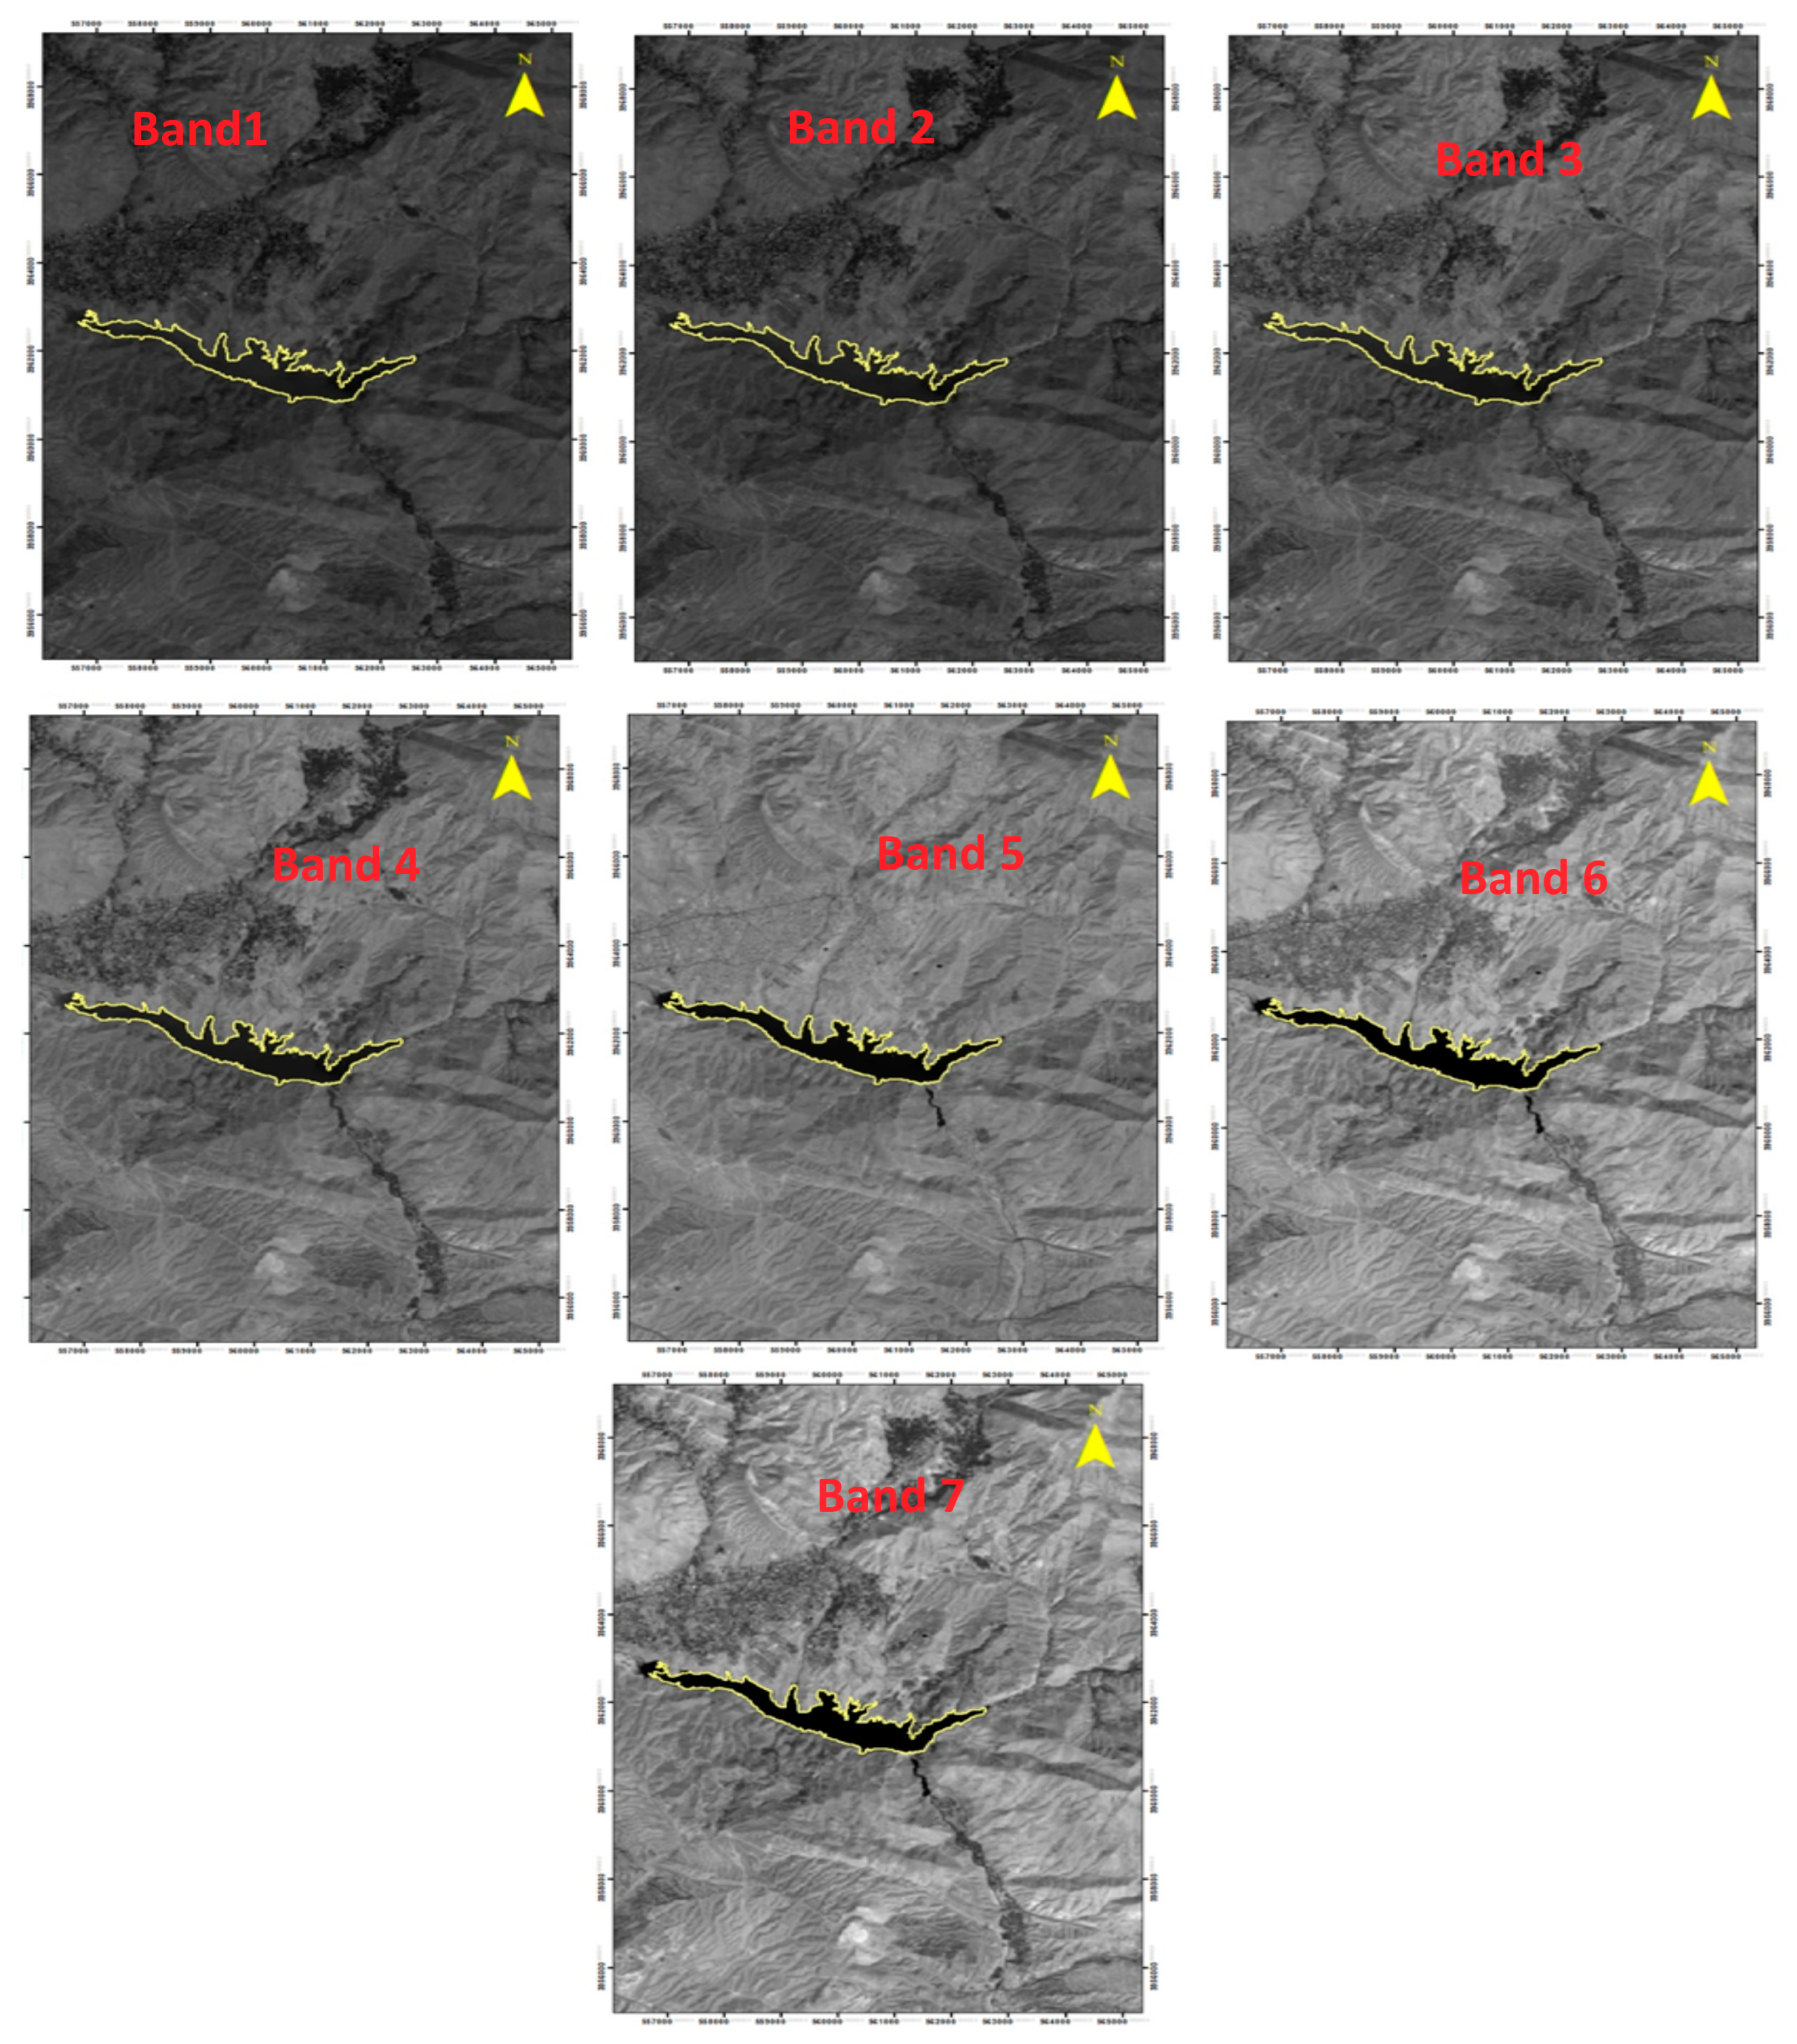
Figure 5 displays a sample of the images in the case study in which different used bands are shown. The yellow line displays the border of the reservoir. In the first step, it is required to present and discuss the optimization of the hidden layers for the ANN. The present study developed an applicable type of data driven model for simulation by the ANN in which the number of hidden layers is optimized. In fact, the optimization process of the hidden layers might increase the applicability and efficiency of the model. Eighty per cent of the available data were used to develop data driven models and 20% of data were applied in the validation process. However, 15% of the training data in the optimal neural network (ONN) were used to measure the performance of the optimization of the hidden layers, that means the optimal number of hidden layers was selected based on the RMSE of 15% the training data.
Figure 6 displays the RMSE for different numbers of hidden layers for three water quality parameters. It seems that the number of hidden layers has a considerable impact on the output of the model. In fact, one of the significant drawbacks of the previous studies by ANNs is lack of the optimization process for the number of hidden layers that might reduce the applicability and accuracy of the model. In other words, most of the previous studies applied one or two hidden layers in the structure of the data driven model that might not produce reliable results. According to the results in the case study, each water quality parameter would need a standalone optimization process. In other words, the optimal number of hidden layers for the water temperature is not applicable for either DO or TDS. Moreover, it seems that using one or two hidden layers might not generate appropriate results in the case study. However, a considerable increase in the number of hidden layers might weaken the robustness of the model as well. Hence, obtaining the optimal number of hidden layers is critical in practice. Based on the results, the optimal numbers of hidden layers for the water temperature, DO and TDS are 15, 54 and 41, respectively. It is recommendable to use the optimization process of the number of hidden layers for the future applications of the ANNs in the remote sensing data processing. The optimal number of hidden layers was applied in the next step to investigate the robustness of the different AI methods used in the present study.
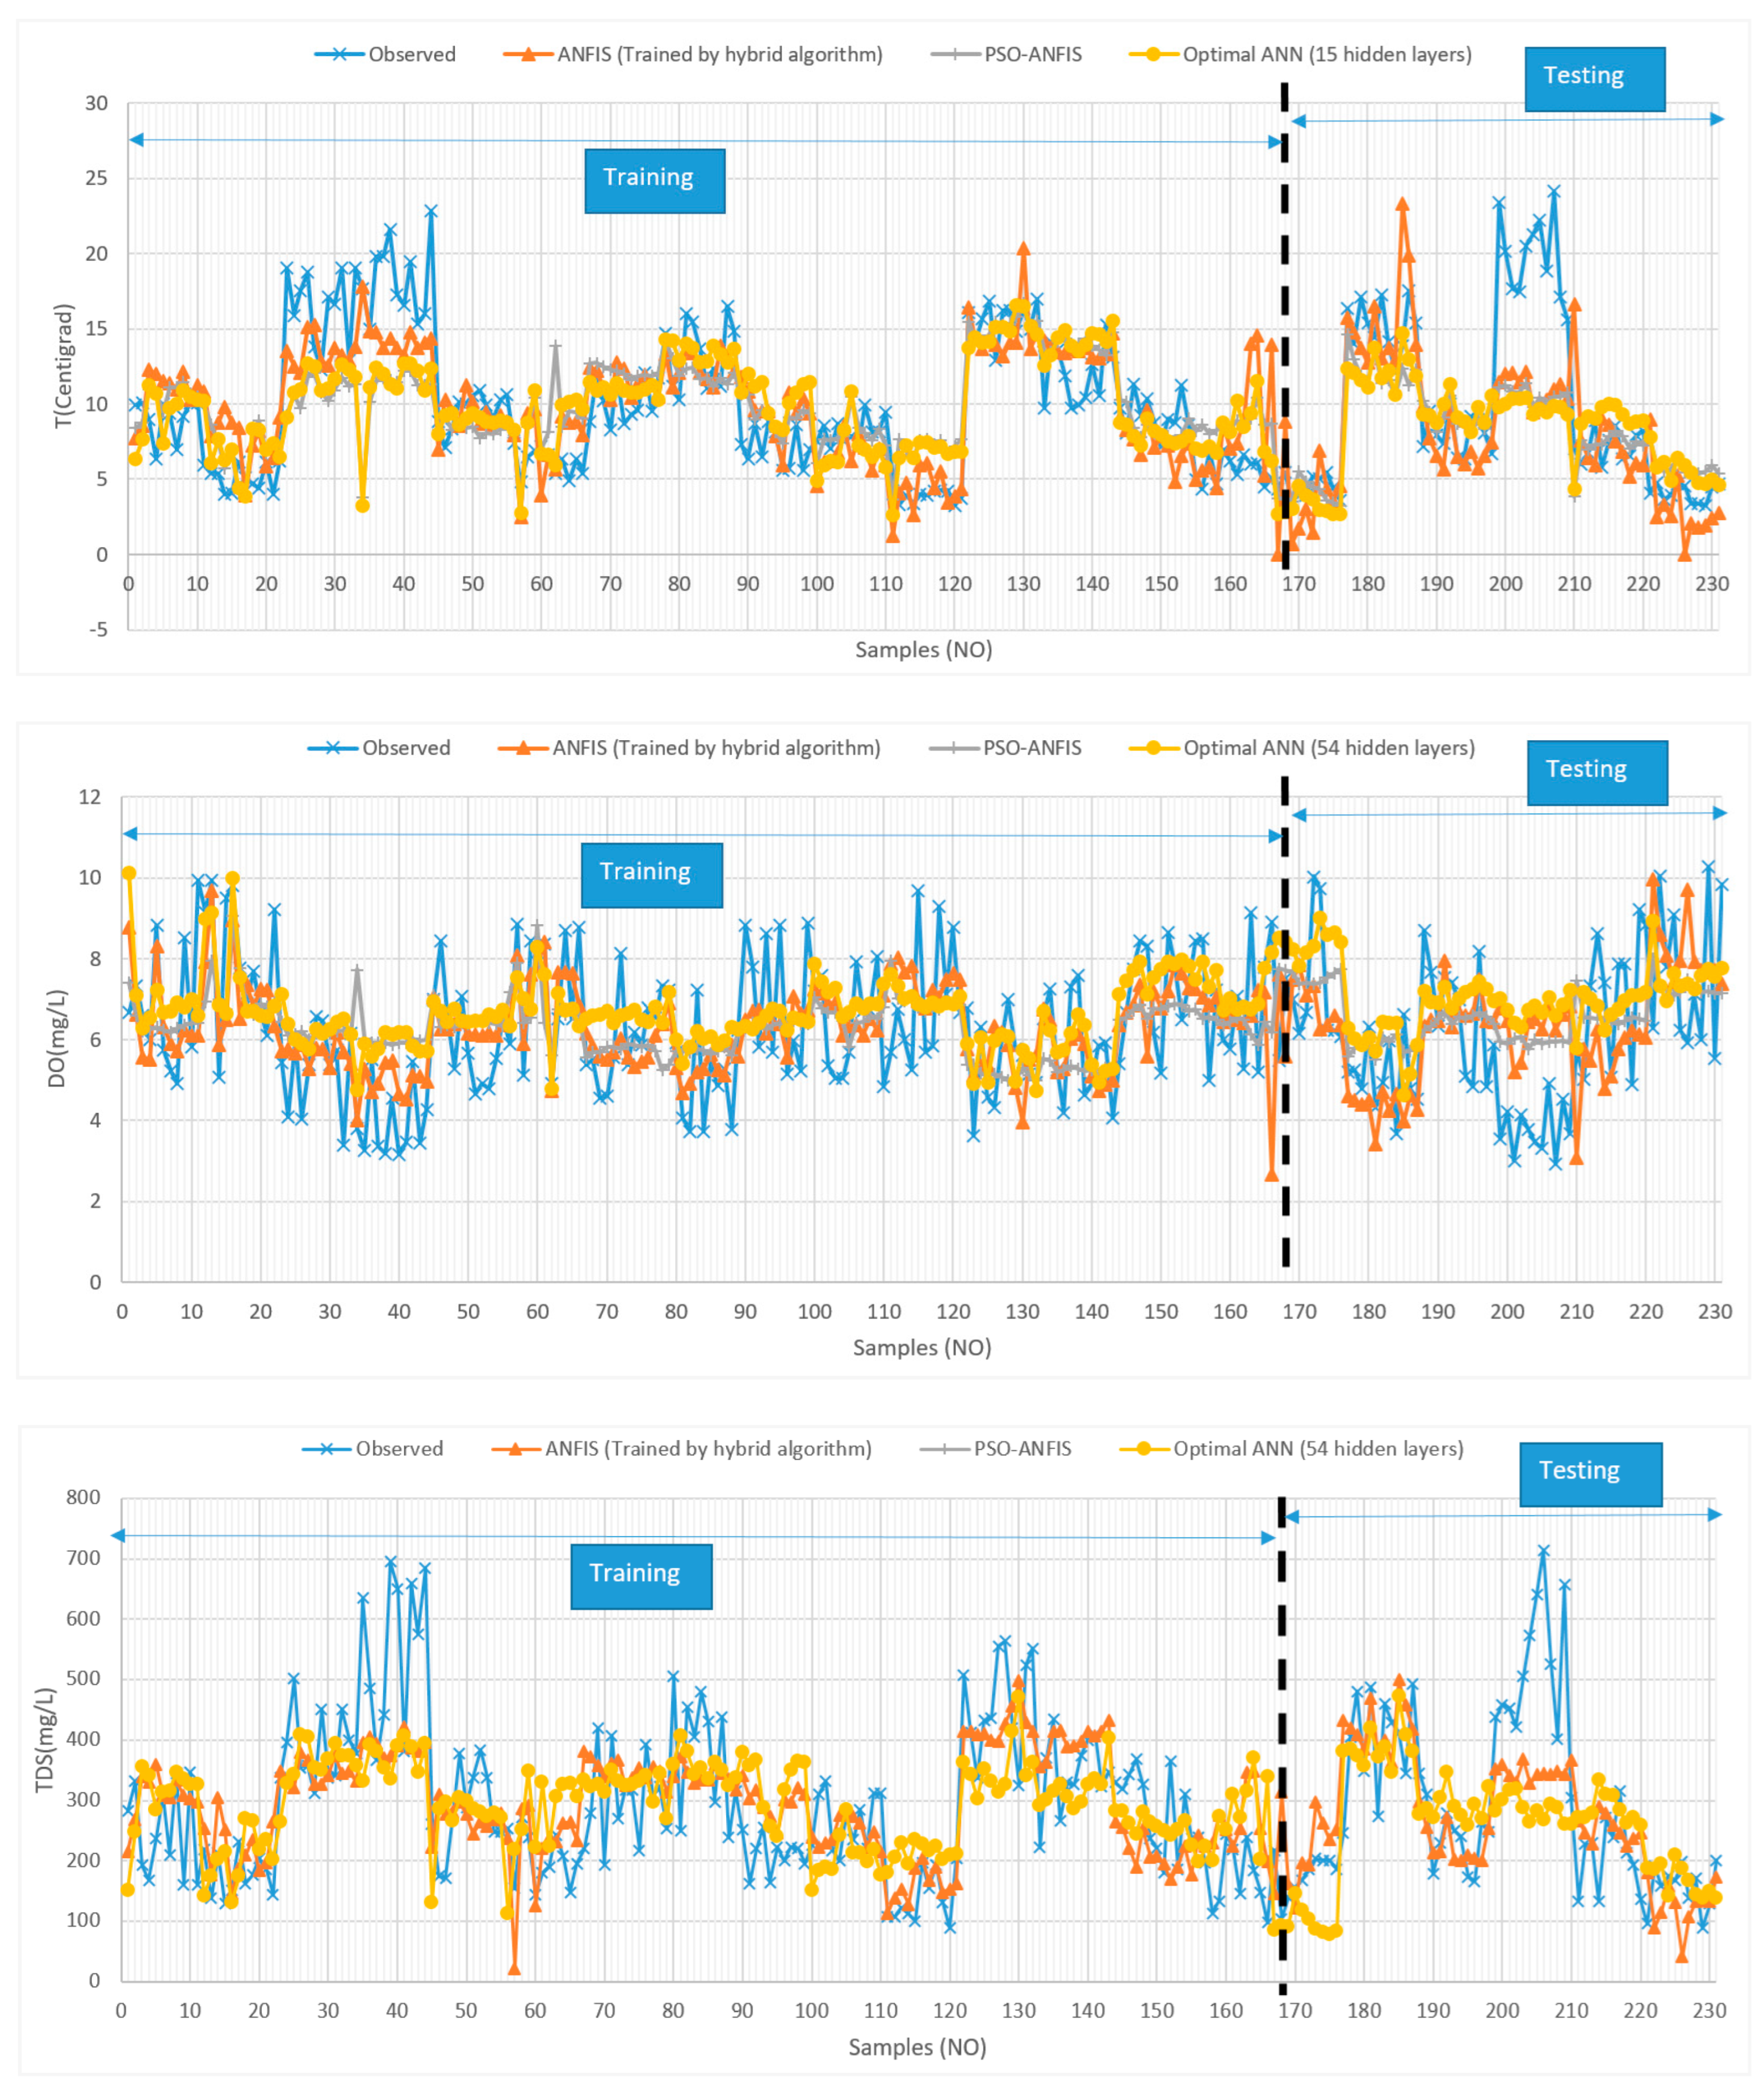
Figure 7 displays the results of the training and testing process of the data driven models used in the present study. Furthermore,
Table 4 shows the measurement indices for different models. It seems that the performance of the AI methods could be different in terms of simulating water quality in the structure of the remote sensing data processing. However, this difference is not significant regarding some methods. It seems that judgment on the performance of the AI methods is not possible without utilizing measurement indices. As presented, two indices were applied to measure the performance of the algorithms, the NSE and RMSE.
Table 4 displays computed measurement indices for different methods. In the case study, the difference performance of the algorithms is not considerable. However, selecting the proper method for obtaining the best results is essential. It should be noted that the outputs of the AI methods are only valid for the case study that means it is better to apply these methods in each case study. In other words, the results of the data driven models are strongly dependent on the available data in the case study. However, the selected methods in the present study could be applied cautiously in future studies.
It should be noted that perfect results are not expectable in the real world due to the impact of other factors and sources of uncertainties. It seems that the outputs of the models are more robust in terms of predicting the water temperature and TDS in the reservoir. In contrast, the performance of the models in terms of simulation of DO in the reservoir is not as acceptable as the other parameters. The best method for simulating the water temperature is PSO-ANFIS, in which the NSE is 0.45, that demonstrates the robust performance of the model. The results of DO are similar to water temperature in terms of selecting the best method. Thus, it is recommendable to apply the PSO-ANFIS model to predict water temperature and DO in the assessment of the water quality for cage fish farming in the case study. However, the performance of the data driven model is not robust for simulation of DO as well as water temperature. Conversely, the ANFIS model, in which the hybrid algorithm was utilized for the training process, is the best method to simulate TDS in the reservoir.
In the next step, the best methods were tested to simulate water quality parameters in a simulated period. In the case study, the summer is the critical time for managing the cages in the reservoir. In fact, water temperature is higher in these months, that might be a challenge for cold-water fish in the reservoir. Furthermore, the upstream area of the Latian reservoir is a recreational region for the people who live in the capital territory of Iran. Hence, the water pollutant load is remarkable in these months, that might be a serious threat for cage fish farming in the reservoir. Thus, three months of the summer were simulated for testing the best AI methods regarding the simulation of water quality and suitability for cage fish farming.
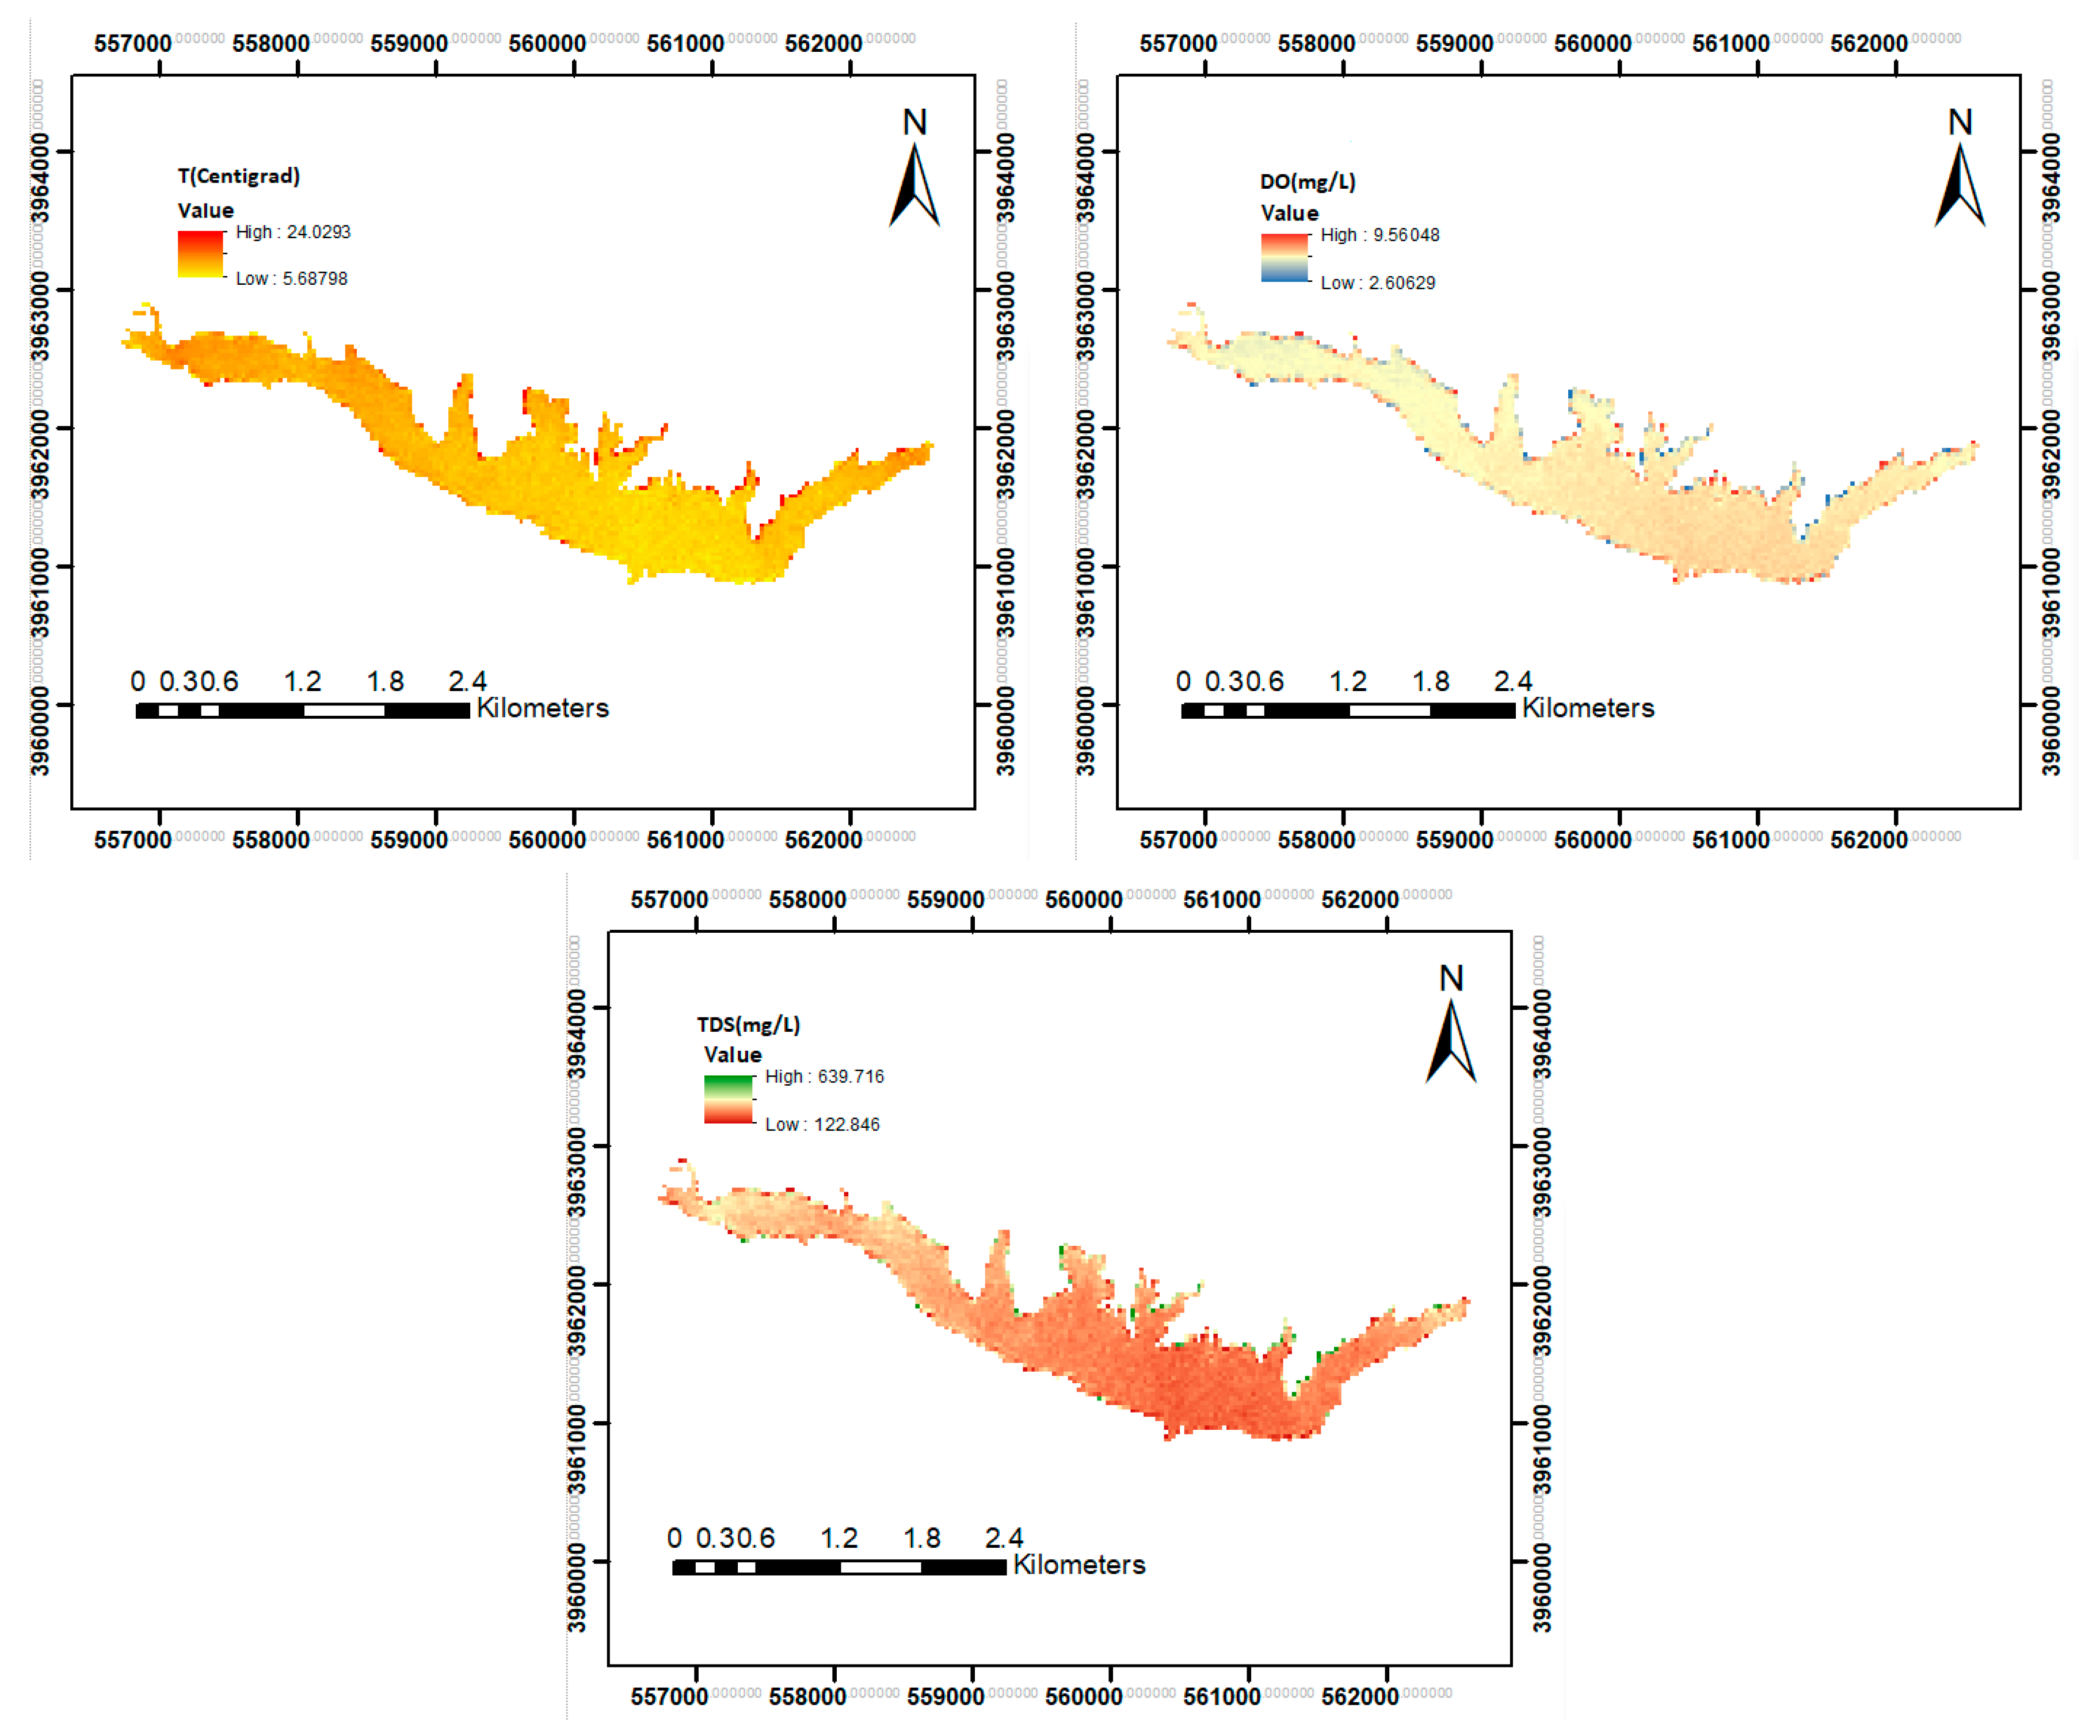
Figure 8 displays the results of simulating the water quality parameters in three months of the summer in 2020. The range of change for the three simulated parameters is considerable in the reservoir, that means the management of cage fish farming might be challenging. Hence, continuous monitoring of water quality factors is necessary in the reservoir. In fact, the combination of a high load of pollutant and high water temperature would raise concerns regarding the management of cage fish farming in the Latian reservoir.
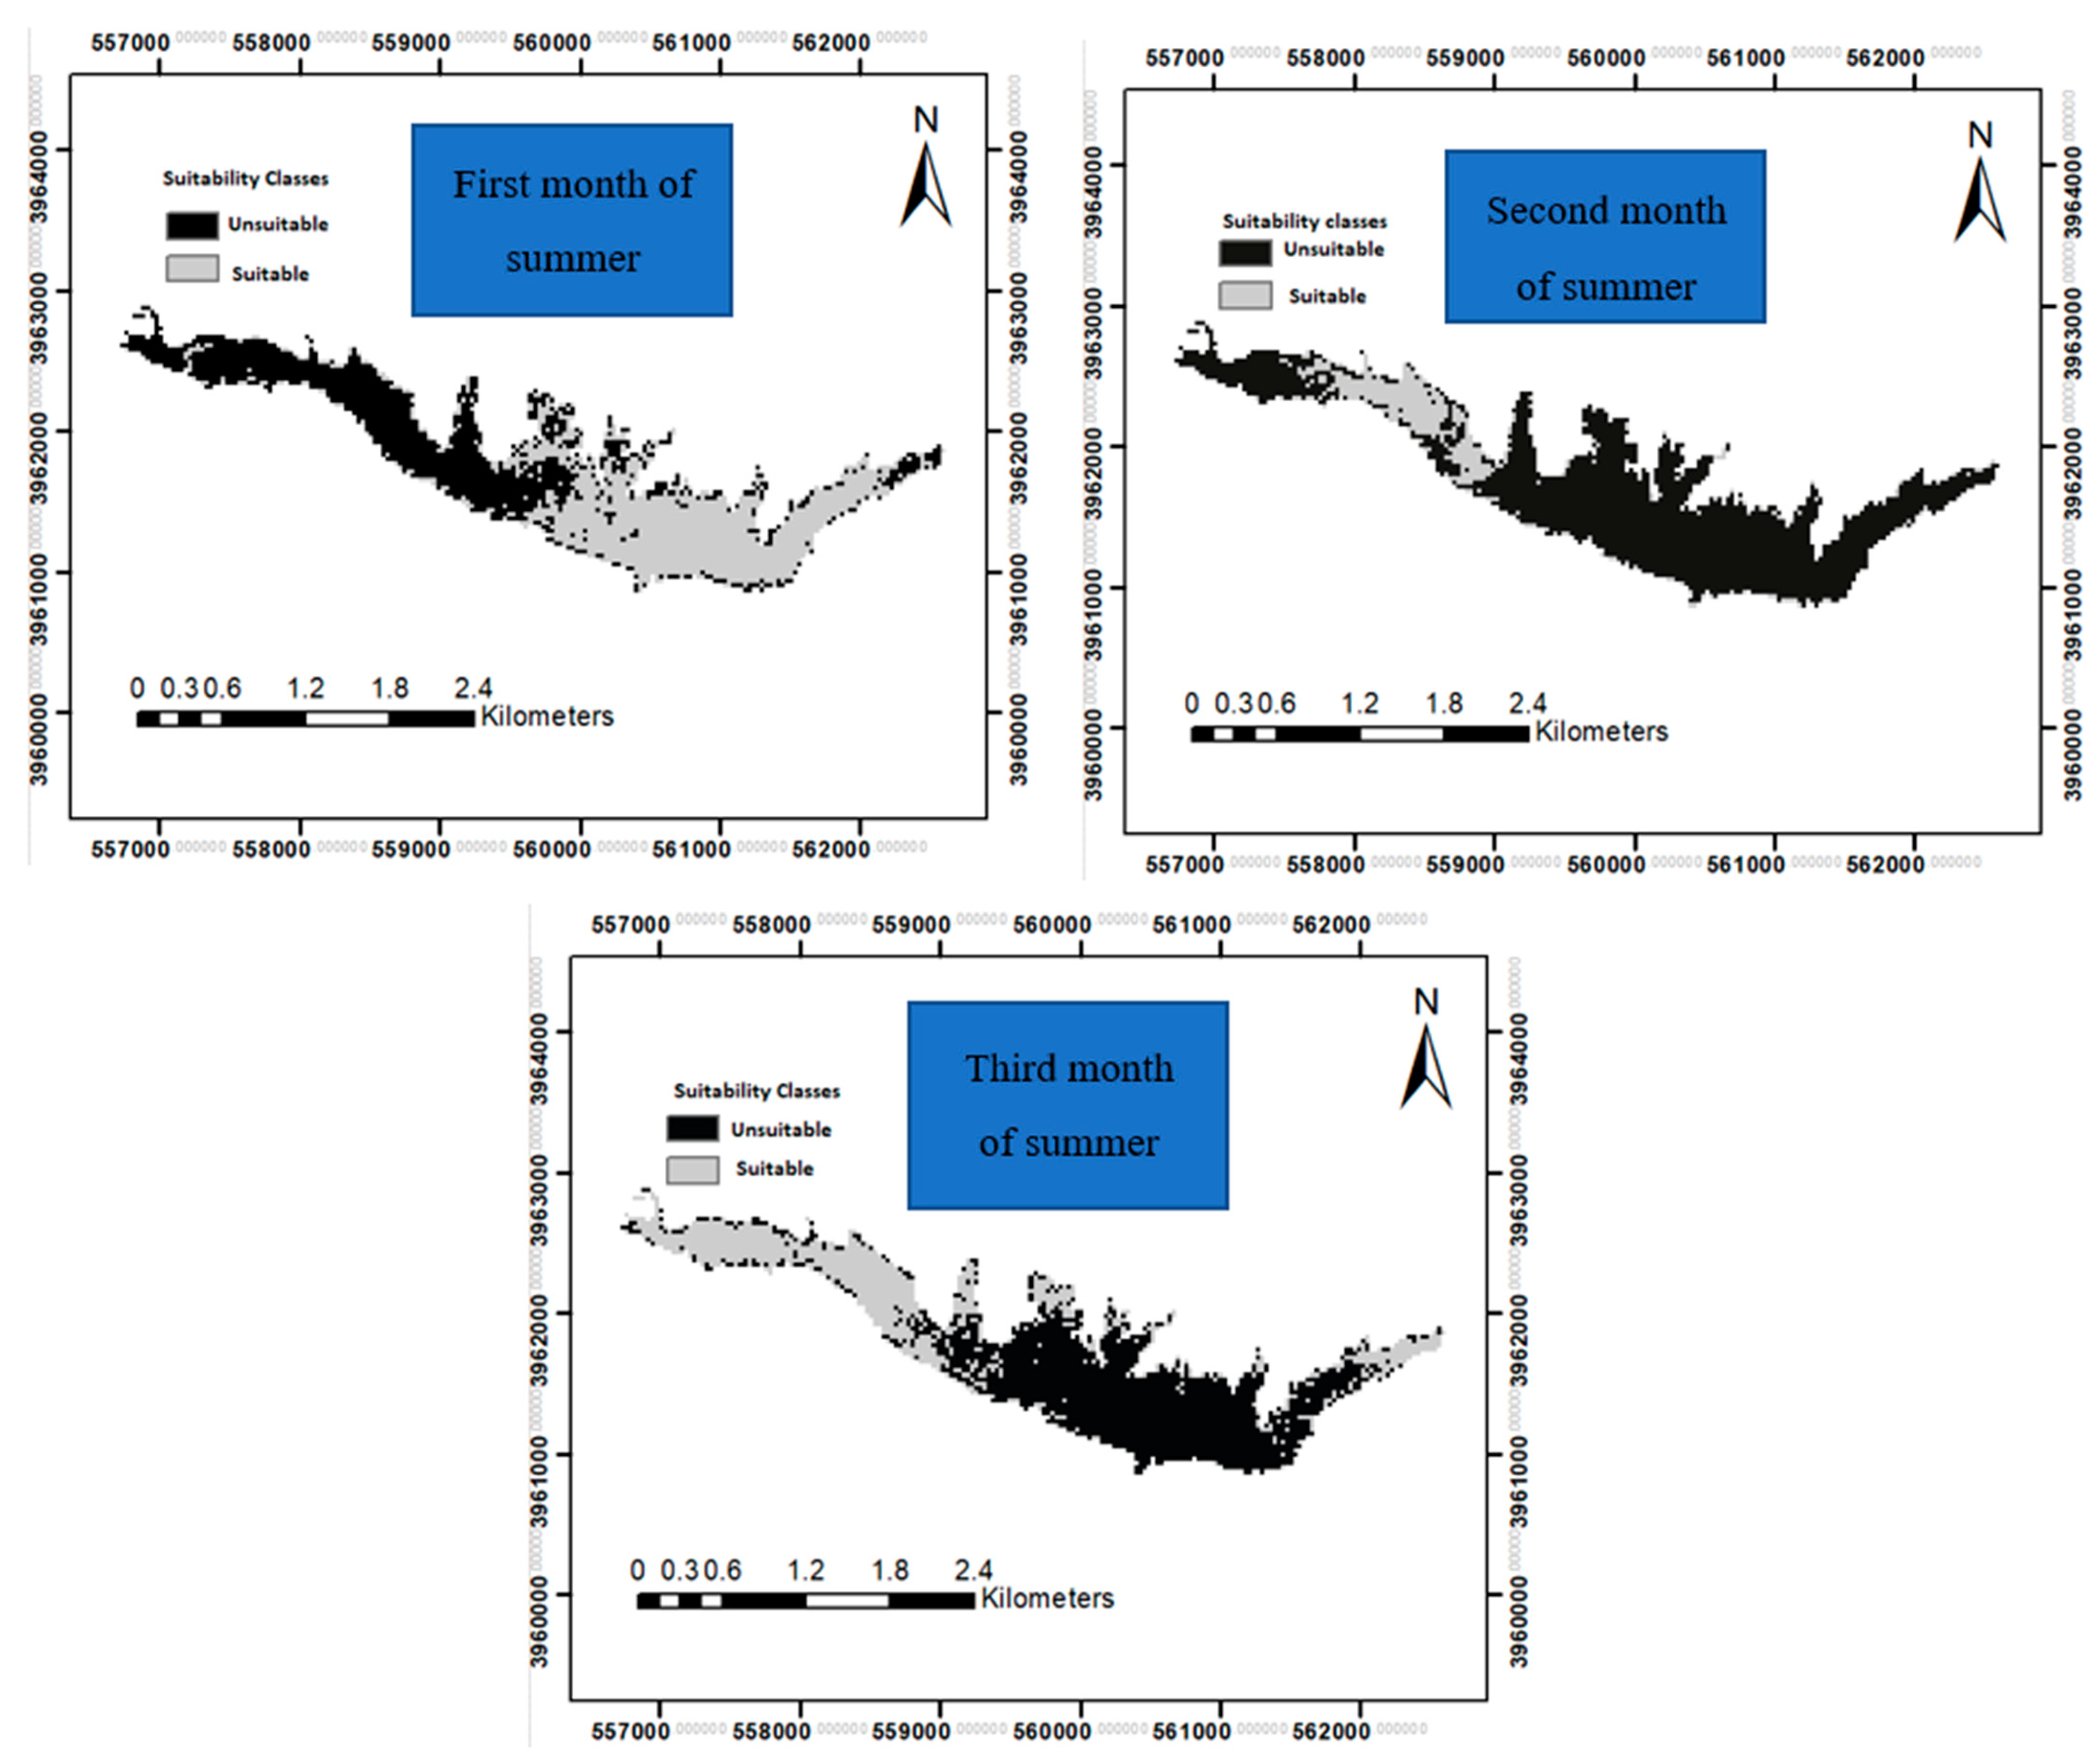
Figure 9 shows the result of the water quality assessment in three simulated months of the summer 2020. As could be observed, available lake habitats are classified into two classes, suitable and unsuitable classes. The suitability status in the second and third months of the summer is similar. However, limited differences could be observed, such as the suitability in the left tributary of the reservoir. In contrast, the suitability of the reservoir in the first month of the summer is considerably different compared with the other months. Using immovable cages is not a good option in the case study, that means high environmental stresses in terms of water quality might be problematic for having appropriate efficiency in the aquaculture.
4. Discussion
A full discussion on different aspects of the present study is essential. Three data driven models were applied in the present study. However, other models are available as well that might generate better results compared with the used methods in the present study. Thus, it is recommendable to utilize other models in future studies. For example, PSO was used in the training process of the ANFIS-based model as a standalone data driven model. However, many new generation algorithms have been developed in the literature.
Detailed comparison of the outcomes of this study with some key previous studies can be helpful for further application of the proposed models. The previous studies corroborate that some new generation algorithms, such as invasive weed optimization, might produce reliable results in the training process of the ANFIS-based models [
28]. Utilizing many evolutionary algorithms is one of the best solutions to select the best method for training the ANFIS-based model. It should be noted that using many algorithms might make it necessary to apply a robust decision-making system for selecting the best method. Multi-spectral images by Landsat have been introduced as a good option for water quality analysis [
29]. This study corroborates that using Landsat, due to its relatively high spatial resolution, can be a reliable source for practical projects. Some recent studies claimed that the back propagation (BP) neural network model can be reliable for water quality analysis through hyperspectral images [
30]. However, our study highlighted that neuro fuzzy models linked with the evolutionary algorithms can be more reliable compared with the conventional neural network models. Our study improved the models for monitoring the water quality in reservoirs through some new machine learning models. The previous studies had recommended some conventional algorithms in this regard [
31].
Moreover, it is required to discuss the limitation of the used methods in the present study. The run time of training is one of the important points in the application of data driven models. According to the observations, the run time of the training for the PSO-ANFIS model is considerably higher than the two other methods, that might be a problem for applications in real projects. In other words, computational complexities of the EA-ANFIS are higher than the other used methods. It should be noted that engineers are not willing to utilize data driven models in which computational complexities are high. In fact, they might need to train and upgrade the model numerous times, that means high computational complexities might be problematic for the projects in terms of computational costs. In contrast, using data driven models might have significant advantages in the data processing of the remote sensing analysis. For example, different bands were applied in the optimization process of the data driven model and the outputs of the optimization process selected the best weights for connection between inputs and other layers. The previous studies tried to select the best bands for developing a multiple linear regression model of water quality parameters. In other words, some bands were applied in the regression model of each water quality parameter. This issue might make for complex development of relationships for assessing water quality by the remote sensing technique. In fact, one of the main abilities of the AI techniques is to find the complex relationship between input parameters with minimum effort. In remote sensing, some or all of the bands could be used for assessing water quality factors. The proposed method might be utilizable for other water quality parameters as well. It should be noted that most of the previous studies focused on regression models to assess water quality by the remote sensing technique. However, it has been demonstrated that advanced data driven models are more capable compared with regression models in the water quality modelling. Rare studies highlighted the application of AI methods for assessing water quality. They presented reliable results in the case studies by applying simpler methods for the training process, such as the back propagation method. However, some recent studies indicated that the back propagation method is not generally a robust method for training complex neural networks in which the relationship between inputs and output is not evaluable easily. The present study proposed a framework to evaluate three data driven models in the remote sensing analysis for assessing water quality in the reservoir. Moreover, the outputs of the present study demonstrated that application of the remote sensing method might be advantageous in the simulation of cage fish farming in terms of water quality suitability.
It will be perfect to simulate all effective water quality parameters to find the best locations of cage fish farming in the reservoirs. However, some points should be considered before developing the models. First, some water quality parameters are not very effective for cage fish farming, which means they can be excluded from the list of parameters. It should be noted that developing the models for all parameters will increase the cost of the projects, including data sampling and computational time. Thus, it is recommendable to focus on the effective key parameters. Furthermore, it should be noted that water quality parameters have interactions, which means some key parameters can be good environmental indices for the overall water quality condition. Also, the ecological requirements of each case study will be highly effective for selecting the key water quality parameters. In our case study, initial ecological studies indicated that increasing the TDS is an ecological challenge for fish species. Hence, it was included as a key water quality parameter for locating the cages. Moreover, regional ecological studies had demonstrated that DO and water temperature are key environmental indices in the catchment, which have considerable interactions with other water quality factors. In other words, these three parameters were confirmed as the key water quality factors for locating the cages. Hence, adding other parameters was not essential and they can only increase the computational complexities and costs of the project unnecessarily. We recommend using this approach in future studies as well to make environmental studies easier and economic.
This study was designed based on considering the location of the cages in the surface water of the reservoir. In fact, the developed remote sensing-based technique will be only appropriate if the purpose of cage fish farming is the use of surface water in reservoirs. It should be noted that using this method cannot be useful for locating the cages in deep waters of the reservoirs due to stratification of the water masses and the change of seasons. The present study demonstrated that the application of the remote sensing technique for simulating DO is not robust. In other words, there is an improper correlation between spectral images and concertation of DO in the reservoir. In contrast, the spectral images are more reliable to simulate TDS in the reservoirs. It should be noted that previous studies reported contradictory results for using spectral images to assess water quality parameters in lakes, reservoirs or coastal regions. Hence, it seems that the abilities of remote sensing for evaluating water quality might be different case by case. It is recommendable to utilize remote sensing techniques and AI methods in each case study independently, that means the conclusions of other studies might not be reliable and incorrect outputs are possible. Finally, it is necessary to discuss the sources of the uncertainties in the present study. The main source of uncertainties in the present study is water quality sampling. In fact, two aspects should be highlighted in this regard. First, it seems that using an adequate number of sampling points is important to enhance the predictive skills of the model and reduce uncertainties for future applications. Moreover, the accurate measurement of water quality parameters is another source of uncertainties for the proposed method. It seems that utilizing robust remote sensing techniques such as the proposed method might be beneficial for cage fish farming in a reservoir. First, it might reduce the costs of the water quality assessment in the reservoirs or lakes, that is a serious concern for the stakeholders. Furthermore, the proposed framework might be helpful for long-term assessment of water quality in the reservoirs based on the available images for the previous years. This technical advantage might be highly valuable for the stakeholders. In fact, it helps the stakeholders to evaluate water quality suitability over a long-term period for different reservoirs in which water pollutant sources might be different upstream. In other words, one of the applications of the proposed framework is to select the reservoirs for cage fish farming among the available reservoirs in the study area.
5. Conclusions
The present study evaluated the application of three applicable AI methods, a conventional ANFIS-based model, EA-ANFIS and optimized ANN associated with remote sensing analysis to assess water quality in a reservoir with a focus on cage fish farming. Three water quality parameters, water temperature, DO and TDS, are highlighted. Moreover, two indices were applied to measure the robustness of the data driven models including NSE and RMSE. According to the results in the case study, the EA-ANFIS method in which PSO was utilized in the training process is the best method for simulating water temperature and DO in the reservoir. However, the ANFIS-based model in which hybrid algorithms were utilized for the training process is the best method to simulate TDS in the reservoir. The outputs of the present study demonstrated that using the spectral images for simulating DO might not be very reliable. However, applying the spectral images might be robust for simulation of water temperature as well as TDS.


