Abstract
Space probes are always obstructed by floating objects in the atmosphere (clouds, haze, rain, etc.) during imaging, resulting in the loss of a significant amount of detailed information in remote sensing images and severely reducing the quality of the remote sensing images. To address the problem of detailed information loss in remote sensing images, we propose an end-to-end detail enhancement network to directly remove haze in remote sensing images, restore detailed information of the image, and improve the quality of the image. In order to enhance the detailed information of the image, we designed a multi-scale detail enhancement unit and a stepped attention detail enhancement unit, respectively. The former extracts multi-scale information from images, integrates global and local information, and constrains the haze to enhance the image details. The latter uses the attention mechanism to adaptively process the uneven haze distribution in remote sensing images from three dimensions: deep, middle and shallow. It focuses on effective information such as haze and high frequency to further enhance the detailed information of the image. In addition, we embed the designed parallel normalization module in the network to further improve the dehazing performance and robustness of the network. Experimental results on the SateHaze1k and HRSD datasets demonstrate that our method effectively handles remote sensing images obscured by various levels of haze, restores the detailed information of the images, and outperforms the current state-of-the-art haze removal methods.
1. Introduction
With the rapid development of space-based Earth observation technology, there has been a revolutionary advancement in acquiring surface information of the Earth. Satellites and other space probes have captured a vast amount of remote sensing (RS) images with high spatial and spectral resolution [1,2]. Remote sensing images contain a wide range of surface information and have been widely applied in various fields such as geological exploration [3,4], urban planning [5,6], and meteorological observations [7,8]. However, when optical remote sensing imaging sensors capture reflected light from the Earth’s surface through the atmosphere, they inevitably encounter interference from atmospheric particles such as haze, rain, and clouds. These particles absorb and scatter the reflected light, leading to issues in remote sensing images such as texture blurring, low contrast, and color distortion [9]. The degradation of RS image quality brings huge obstacles to subsequent computer vision tasks such as image analysis and understanding [10,11]. Therefore, removing haze in RS images and improving RS image quality have important research significance and application value.
Recently, image haze removal technology has been extensively studied, and many haze removal methods have been proposed [12,13]. Currently, these dehazing methods can be categorized into two types: prior-based dehazing methods and learning-based dehazing methods. Prior-based dehazing methods estimate the transmission map and global atmospheric light based on prior assumptions. Atmospheric scattering model (ASM) is then used to recover a clear image. These methods have achieved good haze removal effects. However, in real-world hazy environments, the optimal choice of prior knowledge is still unclear. The extent to which these priors conform to image statistics and how they affect dehazing performance is still unknown [14]. With the rapid development of deep learning, learning-based haze removal methods have been widely studied. Although existing learning-based methods have achieved significant success, most of them remove haze from natural scenes [15,16]. Compared with ground-imaged natural scenes, RS images are always in large scale and complex scenes, and the haze intensity distribution of RS images is changeable and irregular. Therefore, the existing end-to-end haze removal methods may not be suitable for blurry RS images [17].
Therefore, we propose an end-to-end detail enhancement dehazing network (EDED-Net) for remote sensing images. The designed network uses U-net as the skeleton and contains a detail enhancement block (DEB), which combines a multi-scale detail enhancement unit (MSDEU) and a stepped attention detail enhancement unit (SADEU). The detail enhancement block is a transformer-style block. We replace the multi-head self-attention mechanism in the transformer with our designed MSDEU, and replace the feedforward network in the transformer with our designed SADEU. MSDEU can not only extract different scale features of the input haze image, but also has a large receptive field. In the MSDEU, we utilize dilated convolutions with dilation rates of 1, 4, 9, and 16 to integrate global features and detail features. Additionally, we employ simple local residuals to enhance high-frequency details and edge information in the image. SADEU utilizes channel attention (CA) to extract global shared information from the original features and pixel attention (PA) to extract position-related local information from the original features. Inspired by the pixel attention (PA) mechanism proposed in FFA-Net [18], we further designed deep pixel attention (DPA) and shallow pixel attention (SPA) in SADEU. They are parallelly connected with pixel attention (PA) to focus on haze and high-frequency information from three different levels: deep, middle, and shallow. Furthermore, we design a novel parallel normalization module (PNM), which is integrated into the network architecture and helps enhance robustness to appearance changes while retaining important content-related information. We embed PNM into MSDEU and SADEU, respectively, to improve the generalization ability and robustness of EDED-Net.
The main contributions presented in this article are listed as follows:
- (1)
- We design a new multi-scale detail enhancement unit. It can extract multi-scale features of input images and integrate global and detailed features. Parallel dilated convolutions have large receptive fields and long-range modeling capabilities, enabling the network to capture contextual information across a wide spatial scale and effectively enhance details in images.
- (2)
- We design a new stepped attention detail enhancement unit. It adaptively focuses on the high-frequency information of images from three dimensions: deep, middle, and shallow. It can flexibly handle images with uneven haze distribution and is more suitable for removing haze in RS images.
- (3)
- We design a new parallel normalization module. It can simultaneously learn features that are relevant to content and not affected by appearance changes, which can effectively improve the generalization ability and robustness of the network.
- (4)
- We design a new end-to-end detail-enhanced dehazing network for remote sensing images. We embed MSDEU and SADEU into EDED-Net to handle image dehazing in remote sensing scenarios. On challenging benchmark datasets (SateHaze1k [19] and HRSD [20]), our method outperforms state-of-the-art methods and is able to remove haze in RS images more effectively.
The remainder of this article is organized as follows. Section 2 provides an overview of related work. Section 3 presents the proposed methods, including MSDEU and SADEU. Section 4 conducts a series of experiments to evaluate the performance of the proposed method. Finally, Section 5 concludes the paper.
2. Related Work
Currently, image dehazing methods can be mainly classified into two categories. The first category is the prior-based methods, which rely on manually summarizing the statistical differences between blurry and clear images to establish empirical priors. The second category is the learning-based methods, which directly or indirectly learn the mapping functions from large-scale datasets of blurry and clear images. The former is generally referred to as prior-based methods, while the latter is generally referred to as learning-based methods.
Prior-based methods rely on prior knowledge about clean images to estimate the transmission map and global atmospheric light. They typically depend on atmospheric scattering models and handcrafted priors. He et al. [21] discovered that most local patches in outdoor haze-free images contain pixels with very low intensities in at least one color channel. Based on this observation, they proposed the dark channel prior (DCP). Zhu et al. [22] proposed the color attenuation prior (CAP) method, which utilizes the differences in pixel brightness and saturation within a hazy image and establishes a linear model based on the linear color attenuation prior. This method aims to recover depth information by exploiting the color attenuation in hazy scenes. However, it may not achieve satisfactory dehazing results under non-uniform atmospheric conditions. Berman et al. [23] discovered that when haze occurs, clusters of pixels in haze-free images transform into haze lines. Based on this observation, they proposed a non-local prior to characterizing clean images. Xu et al. [24] proposed an iterative dehazing method for a single RS image and defined the concept of “virtual depth”. It is beneficial for measuring the surface coverage of objects and enables the estimation of the transmission map and dehazing of RS images through the iterative process.
In recent years, deep learning technology has been highly praised by researchers in the field of image haze removal. Due to its powerful learning ability, it can directly restore blurred input images into clear images in an end-to-end manner [25,26]. Therefore, learning-based dehazing methods generally have better dehazing effects compared to prior-based methods. Cai et al. [27] were the first to apply convolutional neural networks (CNNs) to the task of image dehazing and proposed an end-to-end dehazing network. It takes the hazy image as input and generates the transmission map as output. It leverages multi-scale convolutions to extract haze-specific features. By relying on the atmospheric scattering model to recover the haze-free image, this approach significantly improves the dehazing performance compared to traditional methods. Ren et al. [28] designed a coarse-scale network and a fine-scale network model to achieve dehazing by extracting and fusing coarse transmission maps and fine transmission maps. Li et al. [29] proposed the AOD-Net dehazing network, which integrates the atmospheric light value and transmittance into one parameter through the unit transformation of the formula, effectively improving the quality of the restored image. Liu et al. [30] proposed the GridDehaze-Net dehazing network, which generates learning inputs with better diversity and more relevant features. This method effectively alleviates the limitations of traditional multi-scale estimation methods and improves the quality of the generated dehazed images. By leveraging the attention mechanism, it can selectively focus on information-rich regions and capture more relevant features, thereby enhancing the dehazing performance. Qin et al. [18] proposed an end-to-end feature fusion attention network (FFA-net). They designed a novel feature attention module that can selectively enhance information regions and suppress the effects of haze, thereby improving dehazing performance. Mei et al. [31] proposed a U-Net-type encoder–decoder deep network based on progressive feature fusion to directly learn the highly nonlinear transformation function from the observed blurred image to the blur-free image. Chen et al. [32] proposed a detail-enhanced attention block composed of detail-enhanced convolution and content-guided attention to enhance feature learning, thereby improving dehazing performance. Song et al. [33] proposed DehazeFormer by analyzing the Swin transformer and improving the normalization layer and activation function, which achieved good dehazing effects. Lu et al. [34] used multi-scale parallel large convolution kernel modules and enhanced parallel attention modules to solve the problem of uneven haze distribution. Guo et al. [35] proposed a new self-paced semi-curriculum attention network, which focused on enhancing haze-occluded areas by constructing an attention generator network and a scene reconstruction network. Li et al. [36] designed a two-stage defogging neural network, first coarse and then fine, to improve the quality of optical RS images. Zhang et al. [20] proposed a new dynamic collaborative inference learning framework that can significantly recover real surface information from dense blurred RS images. Sun et al. [37] proposed a partial Siamese multi-scale dual codec dehazing network, which solves the color and texture deviation problems of dehazed images through the partial Siam framework and the multi-scale dual codec information fusion module. Song et al. [38] proposed an RS image dehazing transformer architecture, called RSDformer. The architecture exploits detail-compensated diverted attention designed to capture global and local region dependencies to improve image content recovery.
3. EDED-Net Architecture
Figure 1 illustrates our proposed end-to-end detail-enhanced dehazing network architecture for RS images. EDED-Net is an improved 5-stage U-net, where we replace the convolutional blocks of U-net with our designed DEB. DEB consists of MSDEU and SADEU, which are used to adaptively extract multi-scale high-frequency, edge, and other detailed information. In addition, a previous study [33] proposed SK Fusion and soft reconstruction (Soft Recon.) to demonstrate better feature fusion capabilities and haze constraint capabilities, so we similarly use SK Fusion to fuse the skip branch and the main branch, and use soft reconstruction for image reconstruction to improve EDED-Net haze removal performance.

Figure 1.
Overall structure of EDED-Net. is the haze image; is the restored clear image. The input size is . Down-sampling is with a stride of 2. Up-sampling is point-wise convolution and PixelShuffle. is the number of DEBs connected sequentially.
3.1. Multi-Scale Detail Enhancement Unit
Figure 2 shows the multi-scale detail enhancement unit, which has the ability to obtain multi-scale information of input features and large receptive fields and enhance detailed information. First, let be the original input feature of MSDEU; we normalize it using PNM.
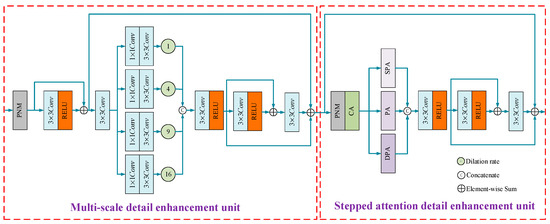
Figure 2.
Structure of DEB. It contains MSDEU and SADEU.
PNM combines instance normalization and batch normalization, which can improve the generalization ability and robustness of the network and prevent overfitting. Then, we use a local residual to initially enhance the extraction of detailed information:
where is the RELU nonlinear function; is convolution.
Inspired by the hierarchical dilated network (HDN) proposed by Chalavadi et al. [39], we concatenate with parallel dilated convolutions to learn information at different scales. The small dilated convolution focuses on restoring textured detailed information, while the large dilated convolution has a large receptive field and the ability to model distant information. It pays more attention to global features and large hazy regions.
where is with dilation rate and is the point-wise convolution. At this time, we concatenate the multi-scale information in the channel dimension. The number of channels of is four times that of .
Therefore, we use a to fuse the concatenated multi-scale information and convert the number of channels to the same number as . RELU function is used to prevent gradient vanishing.
In order to enhance the fused detailed information with multi-scale characteristics, we again use a local residual to capture the detailed features, and after passing through , sum it with and . In this way, the secondary enhancement of detailed information after multi-scale feature fusion is achieved.
Inspired by Wang et al. [40], we designed PNM, as shown in Figure 3. PNM combines instance normalization and batch normalization. Instance normalization allows the network to learn features that are invariant to appearance variations, while batch normalization helps preserve features that are content related. By combining the advantages of both techniques, PNM enhances the dehazing performance of the network. In PNM, the input feature is first processed to generate an intermediate feature . Secondly, PNM divides the channels of into two equal parts, with one half of the channels forming feature and the other half forming feature . In the branch, instance normalization (IN) and SELU nonlinearity are used, while in the branch, parameterized learnable batch normalization (BN) and SELU nonlinearity are applied. The SELU function can achieve internal normalization by adjusting the mean and variance, effectively speeding up the convergence of the network. Then, the features obtained from both branches are fused. In this way, features related to the content can be retained, and features not affected by appearance changes can be learned. Finally, a and a skip connection are used to prevent the gradient from disappearing.
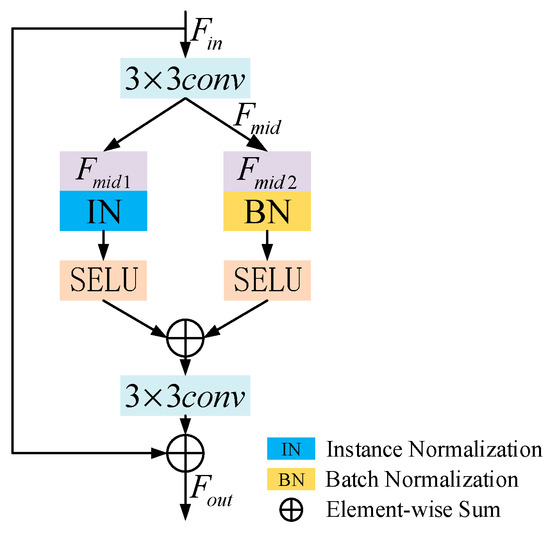
Figure 3.
Structure of PNM.
3.2. Stepped Attention Detail Enhancement Unit
Figure 2 illustrates the structure of the stepped attention detail enhancement unit, which primarily consists of PNM, CA, pixel attention at different depths, and local residual connections. The unit can focus on global information, adaptively extract haze information, and enhance detailed information. Let be the input feature of SADEU; we use PNM to normalize it by . CA can effectively extract global information and assign different weights to different channel features. We use the CA proposed by FFA [18] to redistribute the channel features of :
Pixel attention can adaptively extract unevenly distributed haze, effectively focus on local features related to location, and is suitable for processing remote sensing images with uneven haze distribution. Figure 4a,c show the shallow pixel attention and deep pixel attention that we have designed. Let the feature map shape of be . In SPA, the feature map shape is transformed to after passing . In PA, the feature map shape is transformed to through the first , and the feature map shape is transformed into after the second . In DPA, the feature map shape after the first is , the feature map shape after the second is , and the feature map shape after the third is .
where is the sigmoid function, which is used to assign weights. Since SPA, PA, and DPA are akin to a staircase connected in the channel direction, we named them as stepped fusion pixel attention (SFPA). We consider SPA, PA, and DPA to focus on the distribution of haze from three dimensions: deep, middle, and shallow, respectively. Their fusion can extract haze information more effectively.
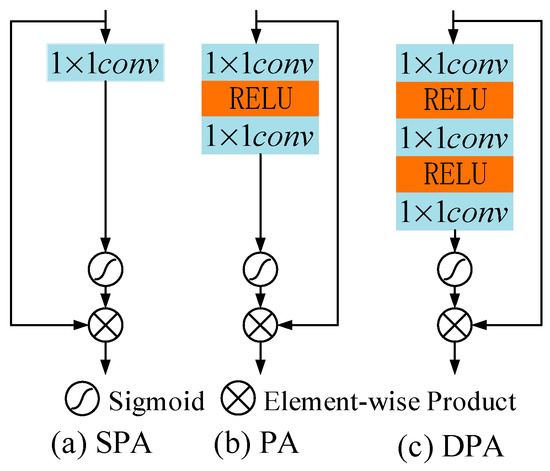
Figure 4.
Stepped fusion pixel attention (SFPA).
At this moment, the shape of is . Therefore, we use to fuse the haze information of concatenated pixels of interest, and transform the number of channels to . RELU function is used to prevent gradient vanishing.
We use a local residual to enhance the haze information after pixel attention. Then, we sum it with the output of and the input feature to achieve focused attention on the haze region and preserve detailed information.
3.3. Detail Enhancement Block
The structure of DEB is shown in Figure 2, which consists of a multi-scale detail enhancement unit and a stepped attention detail enhancement unit. MSDEU can obtain multi-scale information of images, capture haze in different areas, and restore texture details of images. SADEU is capable of effectively handling complex and diverse haze distributions in RS images. It can simultaneously focus on the global shared information of the original features and the position-related local information, thereby highlighting the detailed information in the image. Additionally, we have embedded PNM in the DEB. This integration allows DEB to learn features that are invariant to appearance variations while preserving content-related features. As a result, the capability of DEB to handle haze in RS images is improved. Our proposed EDED-Net containing DEB structure achieves state-of-the-art results on Haze1k and HRSD remote sensing dehazing datasets.
3.4. Loss Function
Nowadays, most dehazing networks utilize multiple loss functions to optimize the network, such as using MSE loss and perceptual loss simultaneously [41]. However, among some dehazing methods, the simple L1 loss achieves excellent performance in image restoration tasks [18,32]. Compared with loss functions such as L2, the L1 function has a faster convergence speed. It can promote sparse model parameters and achieve feature selection [42]. Therefore, in our implementation, we use L1 loss to normalize the learning direction of EDED-Net during training, correcting pixel differences between images.
where is the haze-free RS image restored using EDED-Net and is the ground truth RS image.
4. Experiments Results
4.1. Datasets and Metrics
We evaluate the proposed EDED-Net on two publicly available synthetic haze RS datasets: SateHaze1k [19] and Hazy Remote Sensing Dataset (HRSD) [20]. The SateHaze1k dataset consists of three sub-datasets with different haze levels: SateHaze1k-thin, SateHaze1k-moderate, and SateHaze1k-thick. In each sub-dataset, the training set contains 320 RGB images and the test set contains 45 RGB images. For synthetic thin-fog images, haze masks are fog-extracted from real cloud images. For the synthesized moderate haze image, samples overlap with mist and medium fog. For synthetic thick-fog images, their transmittance maps are extracted from dense haze. HRSD consists of two sub-datasets: Light Hazy Image Dataset (LHID) and Dense Hazy Image Dataset (DHID). LHID is a dataset synthesized based on the atmospheric scattering model. By randomly sampling the atmospheric light value and transmittance , the corresponding blurred RS image is generated. These RS images were collected from Google Earth with resolution and size . LHID contains 30517 training images and 500 test images. DHID is obtained by adding 500 transmittance maps extracted from real-haze RS images and random atmospheric light values to clear images. These clear images come from the Munich Vehicle Aerial Imagery Dataset (MVAID). DHID contains 14,990 images, of which 14,490 images are used as the training set, 500 images are used as the test set, and the image size is . An example of their training samples is shown in Figure 5. In each dataset, we show four haze images and their corresponding ground truth images.
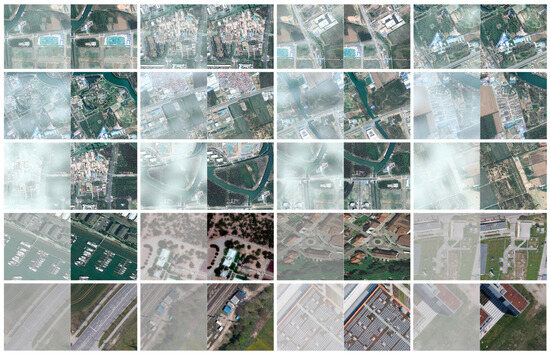
Figure 5.
Examples of training samples for SateHaze1k and HRSD datasets. The first row is an example of the thin fog dataset. The second row is an example of the moderate fog dataset. The third row is an example of thick fog dataset. The fourth row is an example of the LHID dataset. The fifth row is an example of the DHID dataset.
To evaluate the performance of our EDED-Net, we use Peak Signal Noise Ratio (PSNR), Structural Similarity (SSIM), and Learned Perceptual Image Patch Similarity (LPIPS) as evaluation metrics for quantitative evaluation. The higher the PSNR and SSIM values, the better the recovered image quality. The smaller the value of LPIPS, the more similar the two images. PSNR can be expressed as:
where represents the maximum value of the image point color, and represents the mean square error between images.
SSIM comprehensively considers the three key characteristics of the image: luminance, contrast, and structure. The definition of SSIM is as follows:
where is the mean, is the covariance, is the variance, and and are constants that maintain stability.
LPIPS is used to evaluate the similarity between the restored image and the ground truth. LPIPS can be expressed as:
where and are the ground truth RS image and the restored RS image, respectively; , .
We compared the EDED-Net with seven other state-of-the-art dehazing methods, including DCP [21], AOD-Net [29], FCTF-Net [36], PFF-Net [31], GridDehaze-Net [30], FFA-Net [18], and SCA-Net [35]. To ensure a fair comparison, we trained the deep learning-based method using the official code provided by the authors.
4.2. Experiment Details
We train and test our EDED-Net using the Pytorch framework with NVIDIA RTX8000 GPU. To augment the training dataset, we applied random rotations of 90, 180, and 270 degrees, as well as horizontal flipping. The input of our EDED-Net consists of RGB RS images that have been cropped to size . In DEB, we set , and their corresponding embedding channel is . The Adam optimizer () is used to train our EDED-Net on each sub-dataset, and the batch size is set to 4. We set the initial learning rate as and utilize the cosine annealing strategy to gradually decrease the initial learning rate to .
Figure 6 shows the learning curves plotted for the five sub-datasets through the PSNR and SSIM values obtained every 1000 steps. It is observed that our EDED-Net achieves the best learning performance on the LHID dataset and the worst learning performance on the Haze1k-thick dataset. This is because the Haze1k-thick dataset contains a significant amount of haze, making dehazing more challenging. On the other hand, the LHID dataset has less haze, making dehazing relatively easier. Overall, our EDED-Net exhibits stable performance during the training process.
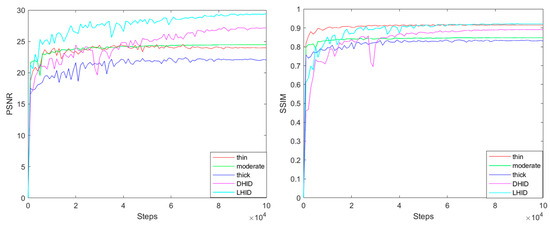
Figure 6.
PSNR and SSIM learning curves. (Left): PSNR variation curve with steps. (Right): SSIM variation curve with steps. “Thin” represents the Haze1k-thin dataset, “moderate” represents the Haze1k-moderate dataset, and “thick” represents the Haze1k-thick dataset.
4.3. Quantitative Evaluations
Table 1 and Table 2 present the quantitative evaluation results on the SateHaze1k dataset and HRSD dataset, respectively. We provide PSNR, SSIM, and LPIPS indicators and their average values for different haze density datasets. In Table 1, our EDED-Net achieves state-of-the-art dehazing performance on the thin fog, moderate fog, and thick fog datasets. Compared with thin fog and moderate fog, our method has a slightly lower dehazing effect on thick fog. Thick haze causes more severe image degradation, making it more challenging to remove heavy haze from RS images. DCP and PFF-Net have the worst haze removal performance. FFA-Net and SCA-Net achieve good dehazing results. However, when compared to the dehazing results obtained using our method, they still fall slightly insufficient. For example, our PSNR and SSIM are 0.63 and 0.021 higher than those of the second-best FFA-Net in the thick fog dataset, respectively. These results demonstrate that our EDED-Net is competitive in RS dehazing performance.

Table 1.
Quantitative comparison of dehazing results on the SateHaze1k dataset. The bold number represents the best result, the blue number represents the second-best result, and the red number represents the worst result.

Table 2.
Quantitative comparison of dehazing results on the HRSD dataset. The bold number represents the best result, the blue number represents the second-best result, and the red number represents the worst result.
4.4. Qualitative Evaluations
In this section, we qualitatively compare our EDED-Net with seven other advanced dehazing methods on the SateHaze1k and HRSD remote sensing haze image datasets.
Figure 7 shows the qualitative results of each method on the thin fog test set. DCP and PFF-Net exhibit significant residual haze in the dehazed images. AOD-Net, FCTF-Net, GridDehaze-Net, and SCA-Net achieve some level of dehazing effect, but when compared to the ground truth images, the overall restoration effect still retains a small amount of haze. FFA-Net demonstrates good dehazing performance. However, compared with the ground truth image, the grass in the middle-right side of the image restored using FFA-Net is obviously whiter. Our method generates dehazed images that exhibit results closer to the ground truth images, achieving a higher level of detail restoration.
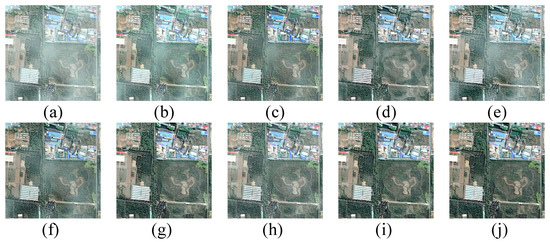
Figure 7.
Comparison of visualization results on the Haze1k-thin dataset. (a) Hazy image; (b) DCP; (c) AOD-Net; (d) FCTF-Net; (e) PFF-Net; (f) GridDehaze-Net; (g) FFA-Net; (h) SCA-Net; (i) ours; (j) ground truth.
Figure 8 shows the qualitative results of each method on the moderate fog test set. Moderate levels of haze obscure some important information in the RS image. DCP clearly shows average dehazing performance, with a large amount of haze remaining in the restored image. AOD-Net has a certain dehazing effect, but there is still obviously a lot of haze remaining in some local areas. PFF-Net suffers from obvious color distortion, such as the roof in the upper right corner of the image. FCTF-Net, GridDehaze-Net, FFA-Net, and SCA-Net all achieve good dehazing results. However, when compared to the ground truth images, there are some noticeable differences. In the images restored via FCTF-Net, the red roof in the bottom right corner appears slightly whiter. In the images restored via GridDehaze-Net and SCA-Net, the roofs in the middle left section appear noticeably redder. In the images restored via FFA-Net, there is a distinct shadow on the grass in the middle right section. In comparison, our method achieves excellent dehazing results, demonstrating better color fidelity and preserving texture details that are closer to the ground truth images.
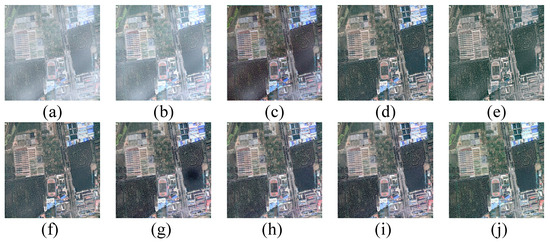
Figure 8.
Comparison of visualization results on the Haze1k-moderate dataset. (a) Hazy image; (b) DCP; (c) AOD-Net; (d) FCTF-Net; (e) PFF-Net; (f) GridDehaze-Net; (g) FFA-Net; (h) SCA-Net; (i) ours; (j) ground truth.
Figure 9 shows the qualitative results of each method on the thick fog test set. The dataset mainly consists of RS images that are obscured by dense haze, and a large amount of textured detailed information is lost. The image recovered using DCP still has a significant amount of haze residue. AOD-Net exhibits noticeable color distortion, such as an intensified depth of the blue color in the roof. PFF-Net and GridDehaze-Net show significant color shifts in the recovered images. For example, compared to the ground truth images, the color information of the blue roof is almost entirely lost in the recovered images. FCTF-Net, SCA-Net, and FFA-Net all achieve good image quality restoration. However, compared to the ground truth images, the images generated by FCTF-Net and SCA-Net are overall whiter, and the ground on the left side of the image generated by FFA-Net is partially whiter. Our method exhibits a high level of similarity to the ground truth images in terms of overall structure, local details, and color fidelity.
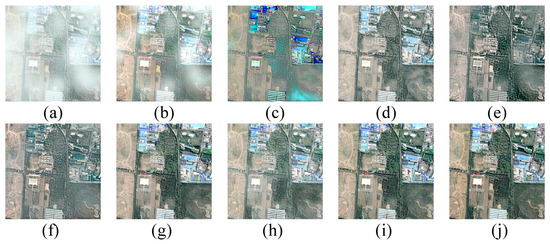
Figure 9.
Comparison of visualization results on the Haze1k-thick dataset. (a) Hazy image; (b) DCP; (c) AOD-Net; (d) FCTF-Net; (e) PFF-Net; (f) GridDehaze-Net; (g) FFA-Net; (h) SCA-Net; (i) ours; (j) ground truth.
Figure 10 shows the qualitative results of each method on the LHID test set. The images restored using DCP and AOD have obvious excessive dehazing, and the original texture details of the image are lost. Compared with the ground truth image, the image restored using PFF-Net has a noticeable dark tone, the road on the upper side of the image restored using FCTF-Net and FFA-Net is partially whiter, and the trees in the lower middle of the images generated by GridDehaze-Net and SCA-Net are darker. Our proposed EDED-Net addresses the challenges of texture restoration, enhances image details, and improves overall image quality in RS blurry images.
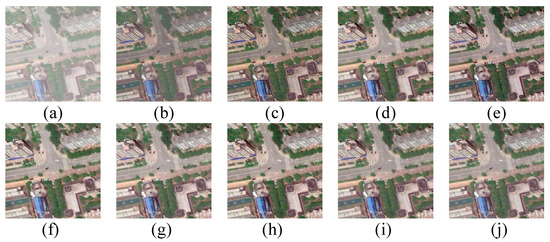
Figure 10.
Comparison of visualization results on the LHID dataset. (a) Hazy image; (b) DCP; (c) AOD-Net; (d) FCTF-Net; (e) PFF-Net; (f) GridDehaze-Net; (g) FFA-Net; (h) SCA-Net; (i) ours; (j) ground truth.
Figure 11 shows the qualitative results of each method on the DHID test set. DHID is composed of RS images obscured by dense and uniform haze. The image restored using DCP is still blurry and it is difficult to distinguish the detailed information of the image. The image restored using AOD-Net obviously loses a large amount of texture details. The image restored using PFF-Net fails to retain the color of the original image. The image restored using SCA-Net has a certain degree of color shift in local areas, such as the roof in the middle of the bottom of the image. FCTF-Net, GridDehaze-Net, and FFA-Net effectively remove the dense and uniform haze. FCTF-Net, GridDehaze-Net, and FFA-Net remove dense and uniform haze better. But the images they generate still retain more black shadows than ground truth images, such as the roof of the building on the left side of these images. Our EDED-Net performs extremely well in terms of color fidelity and texture detail, especially in restoring roof colors and lawn colors under dense haze.
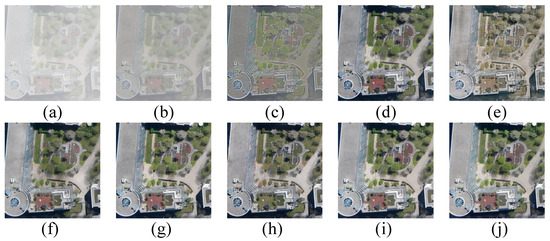
Figure 11.
Comparison of visualization results on the DHID dataset. (a) Hazy image; (b) DCP; (c) AOD-Net; (d) FCTF-Net; (e) PFF-Net; (f) GridDehaze-Net; (g)FFA-Net; (h) SCA-Net; (i) ours; (j) ground truth.
In order to test the haze removal performance of our method in real RS haze images, we uniformly used the pre-trained model under the LHID dataset to restore real RS haze images, as shown in Figure 12. There is still a lot of haze in the image restored with DCP, and the ground in the image has lost its original color. The image restored with AOD-Net shows obvious excessive dehazing. AOD-Net shows obvious excessive dehazing, and the restored image appears too dark. FCTF-Net, PFF-Net, GridDehaze-Net, FFA-Net, and SCA-Net have all achieved good dehazing effects. However, the orange roof in the lower left corner of the image recovered by FCTF-Net appears whiter. PFF-Net and SCA-Net suffer from slight over-dehazing, and the ground on the right side of the images they recover is darker. The image recovered by GridDehaze-Net has darker ground shading in the red box. The blue roof in the red box of the image recovered by FFA-Net is bluer. The images recovered by our method show excellent results in terms of color and texture preservation, which are more consistent with real-world visual effects.
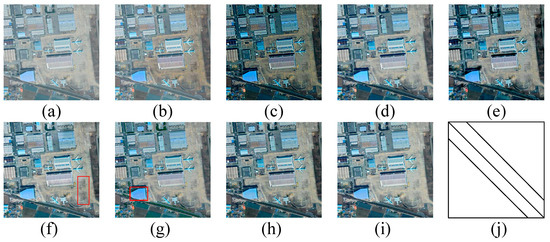
Figure 12.
Comparison of visualization results in real-world RS images. (a) Hazy image; (b) DCP; (c) AOD-Net; (d) FCTF-Net; (e) PFF-Net; (f) GridDehaze-Net; (g)FFA-Net; (h) SCA-Net; (i) ours; (j) ground truth.
4.5. Ablation Study
To validate the effectiveness of our proposed method, we conducted an ablation study on the DHID dataset to analyze the performance of our designed MSDEU, SADEU, and PNM. The quantitative evaluation results are presented in Table 3. To accelerate the training speed, we cropped the RGB image size to as input, and other configurations were the same as our implementation details.

Table 3.
Ablation study on DHID dataset. Bold numbers represent the best results.
First, we constructed a basic network in which local residuals, PNM, and SFPA were removed, denoted as “Base” in Table 3. Then, we sequentially added local residuals, PNM, and SFPA to the base network, which are represented as “Base + LR”, “Base + LR + PNM”, and “Base + LR + PNM + SFPA”, respectively, in Table 3. In addition, we removed the introduced SK Fusion and soft reconstruction from our EDED-Net, respectively, to verify their impact on the network dehazing performance, as shown in Table 3 for “EDED-SK Fusion” and “EDED-Soft Recno”.
Figure 13 shows the visual comparison of quantitative results of ablation experiments for different modules to more intuitively illustrate the effectiveness of each module of our network. According to the results of the ablation study in the DHID dataset in Table 3 and Figure 13, we can draw the following conclusions:
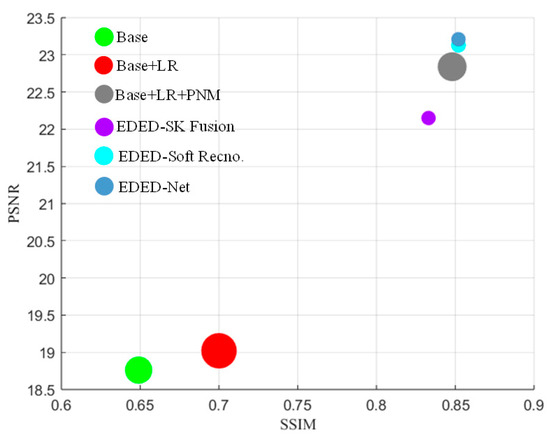
Figure 13.
Visual comparison of quantitative results of ablation experiments on the DHID dataset. The size of the circle represents the size of the LPIPS. The larger the circle, the larger the LPIPS, and the smaller the circle, the smaller the LPIPS.
- (1)
- When our proposed method does not include local residuals, PNM, and SFPA, PSNR and SSIM are the lowest, the image is severely distorted, and the quality is poor. However, the LPIPS metric is relatively low, indicating a higher similarity to the ground truth images.
- (2)
- When local residuals are added to the “Base” network, PSNR and SSIM are improved, and image quality is improved. It has been proven that local residual can improve the detailed information of the image. However, LPIPS is large and cannot maintain the similarity with ground truth images well.
- (3)
- When local residuals and PNM are added to “Base” at the same time, the network contains the MSDEU we designed. Compared with the results of the “Base” network, PSNR and SSIM have been greatly improved, with PSNR increasing by 4.08 and SSIM increasing by 0.203. The image quality has been significantly improved, which proves that the PNM and MSDEU we designed can effectively improve the dehazing performance of the network and restore the detailed information of RS blurred images.
- (4)
- When local residuals, PNM, and SFPA are added to “Base” at the same time, the network now contains SADEU, which is the EDED-Net we designed. Compared with the results of the “Base + LR + PNM” network, PSNR and SSIM have been further improved, and LPIPS has been significantly reduced, which proves the effectiveness of our designed SADEU and EDED-Net in enhancing image details and improving image quality. They can maintain the similarity with ground truth images very well.
- (5)
- When our EDED-Net removes SK Fusion and converts to pixel-wise additive fusion, the PSNR and SSIM values are significantly reduced by 1.06 and 0.019, respectively, compared to the results of our EDED-Net. This result fully demonstrates that SK Fusion can effectively improve the dehazing performance of the network.
- (6)
- When Soft Recno. was removed from our EDED-Net, although its SSIM and LPIPS results are the same as those of our method, the PSNR decreased by 0.08. This suggests that Soft Recno. is capable of fine-tuning the generated image to further enhance the quality of the image.
In Table 2, DCP exhibits the lowest PSNR and SSIM values on the LHID and DHID datasets, indicating the worst haze removal performance. PFF-Net obtains the highest LPIPS value, which indicates that it is the least similar to ground truth images. GridDehaze-Net and FFA-Net each have their own advantages in dehazing. However, when considering the average performance on the LHID and DHID datasets, FFA-Net exhibits higher PSNR values, indicating better image quality. On the other hand, GridDehaze-Net demonstrates better SSIM and LPIPS values, indicating a closer resemblance to the ground truth images. Our method achieves the best results on both DHID and LHID datasets, except for LHID, where its PSNR value is the second best. Although FCTF-Net achieves the best PSNR on the LHID dataset, it performs poorly on the DHID dataset, indicating unstable dehazing performance.
Based on the analysis of both Table 1 and Table 2, it can be concluded that SCA-Net and FFA-Net exhibit good dehazing performance on the SateHaze1k dataset. On the HRSD dataset, GridDehaze-Net demonstrates better results compared to SCA-Net. Unlike SCA-Net and GridDehaze-Net, which are suitable for different datasets, our EDED-Net achieves the best dehazing performance on SateHaze1k and HRSD, and it has better robustness. These results highlight the competitive dehazing capabilities of our method for RS images.
5. Discussion
In this paper, we propose an end-to-end detail-enhanced dehazing network for remote sensing images. Figure 7, Figure 8, Figure 9, Figure 10 and Figure 11 show the results of seven state-of-the-art dehazing methods (b–h) and our proposed EDED-Net (i) for removing haze from synthetic RS haze images. The traditional haze removal method (b) based on the atmospheric scattering model has poor effect in removing RS haze images, and a large amount of haze is left in the restored images, as shown in Figure 7b, Figure 8b, Figure 9b, Figure 10b and Figure 11b. Among the widely used learning-based dehazing methods, AOD-Net and PFF-Net have relatively unsatisfactory dehazing effects. The images they restore either lose the color and texture details of the original image, or are excessively dehazed, such as Figure 9c,e, Figure 10c and Figure 11e. FCTF-Net, GridDehaze-Net, and SCA-Net can achieve certain haze removal effects. However, their haze removal performance is unstable and they are subject to certain limitations when processing RS images with thick fog and dense haze. FCTF-Net is difficult to effectively restore images obscured by thick fog, and obvious haze still remains, as shown in Figure 9d. GridDehaze-Net and SCA-Net recovery of images obscured by thick fog and dense haze experienced color shifting phenomena, as shown in Figure 9f and Figure 11h. FFA-Net and our EDED-Net have achieved good dehazing effects in five synthetic remote sensing haze datasets and have excellent dehazing stability. However, the images recovered by FFA-Net have light haze left behind in the recovery of thin fog and moderate fog images. The recovery of some local details is slightly worse, as shown in Figure 7g and Figure 8g. Experiments show that our method has better robustness in dehazing performance, is suitable for processing RS haze images in different challenging environments, and outperforms state-of-the-art dehazing methods. However, our method is still subject to certain limitations in the recovery of color and local details in moderate fog and thick fog images. The grass in Figure 8i is darker, and a small amount of haze still remains in the grass in the lower right corner of Figure 9i. This is because RS images are obscured by medium fog and thick fog, and their detailed information is lost more seriously. It is difficult for the network to effectively capture part of the detailed information of the image, resulting in a greatly increased difficulty in recovery. The next step of our research will further focus on the recovery of RS images obscured by moderate and thick fog, in order to solve this challenging problem that RS thick haze images are difficult to recover.
The dehazing results of each method on real RS haze images are shown in Figure 12. DCP loses the texture details of the image, as shown in Figure 12b. AOD-Net removes haze excessively, as shown in Figure 12c. PFF-Net and SCA-Net have better haze removal performance, but the images they recover are slightly darker, deviating from the real-world visual perception, as shown in Figure 12e,h. FCTF-Net, GridDehaze-Net, FFA-Net, and our EDED-Net all have good haze removal performance, as shown in Figure 12d,f,g,i. But in terms of some local details, our method is closer to the real-world visual effects.
Figure 14 shows the qualitative results of ablation experiments on the DHID dataset. The “base” and “Base + LR” networks have a certain dehazing effect, but obviously change the color of the image, leaving a lot of shadows, as shown in Figure 14b,c. However, when the “Base + LR” network is integrated into our PNM so that the network contains the MSDEU we designed, the quality of the restored image is greatly improved, as shown in Figure 14d. This result is attributed to the fact that our PNM is able to efficiently learn features that are independent of appearance changes and relevant to the content, and our MSDEU facilitates the effective improvement of image quality by extracting and enhancing the detailed information of the image with multi-scale characteristics. SFPA is integrated into the “Base + LR + PNM” network to form our EDED-Net, which includes SADEU. Compared with the image restored with “Base + LR + PNM”, the details of the image restored with EDED-Net have been further improved. As shown in Figure 14g, its red box part is obviously more similar to the ground truth image. It can be seen that our SADEU relies on the attention mechanism to form effective constraints on haze from the three dimensions of deep, medium, and shallow, further improving the retention of an image’s detailed information, allowing our EDED-Net to more effectively restore RS haze image. When removing SK Fusion from our EDED-Net, the haze of the recovered images increased significantly, as shown in Figure 14e. This result reflects the good feature fusion capability of SK Fusion, which can substantially contribute to the improvement of image quality. We removed Soft Recno. from our EDED-Net, and the image quality was slightly degraded compared to our EDED-Net recovered image, such as the roadway in the right center of Figure 14f. It can be seen that Soft Recno. achieves a fine-tuning of the image quality so that the recovered image is as close as possible to the ground truth image.
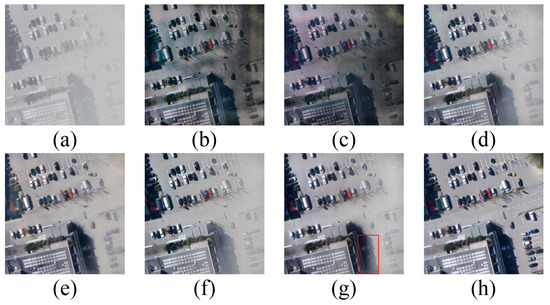
Figure 14.
Comparison of visualization results of ablation experiments on the DHID dataset. (a) Hazy image; (b) Base; (c) Base + LR; (d) Base + LR + PNM; (e) EDED-SK Fusion; (f) EDED-Soft Recno; (g) Base + LR + PNM + SFPA; (h) ground truth.
6. Conclusions
In this paper, we propose an end-to-end detail enhancement network to address the haze removal problem in RS images. EDED-Net contains a detail enhancement block consisting of a multi-scale detail enhancement unit and a stepped attention detail enhancement unit. The multi-scale detail enhancement unit obtains multi-scale information and retains detailed features. The stepped attention detail enhancement unit adaptively processes unevenly distributed haze in RS images and outputs useful features to the U-Net backbone. In order to enhance the stability and generalization ability of the model, a novel parallel normalization module is designed in the network. The results demonstrate that the MSDEU is effective in capturing haze-related information and achieving good dehazing performance. The SADEU can focus on and enhance the main information in the dehazing process, further improving the quality of dehazed RS images. The experiments show that our method achieves the most advanced haze removal effect and significantly restores an image’s detailed information on the SateHaze1k and HRSD benchmark RS blur datasets. In future work, we plan to design a novel RS image haze addition algorithm and construct a more realistic public large-scale RS haze dataset to promote research in the field of RS image dehazing.
Author Contributions
Conceptualization, W.D. and C.W.; methodology, W.D. and H.S.; software, W.D. and X.L.; validation, W.D. and Y.Z.; formal analysis, K.Z. and H.L.; investigation, resources, data curation, W.D. and Y.T.; writing—original draft preparation, W.D.; writing—review and editing, W.D. and C.W.; visualization, Y.Z. and X.L.; supervision, C.W. and X.X.; project administration, C.W.; funding acquisition, C.W. All authors have read and agreed to the published version of the manuscript.
Funding
This work was supported by the Jilin Province Science and Technology Development Plan Project (no. 20220201074GX), the Equipment Development Department of the Central Military Commission (no.1Q-2020-034-CT-010-005).
Data Availability Statement
The StateHaze1k dataset and HRSD dataset are made publicly available for research purposes. For more information, please refer to the following links: SateHaze1k https://www.dropbox.com/s/k2i3p7puuwl2g59/Haze1k.zip?dl=0 (accessed on 20 September 2023), and HRSD https://github.com/Shan-rs/DCI-Net (accessed on 20 September 2023).
Conflicts of Interest
The authors declare no conflict of interest.
References
- Arun, P.V.; Buddhiraju, K.M.; Porwal, A.; Chanussot, J. CNN-based super-resolution of hyperspectral images. IEEE Trans. Geosci. Remote Sens. 2020, 58, 6106–6121. [Google Scholar] [CrossRef]
- Peng, D.; Bruzzone, L.; Zhang, Y.; Guan, H.; Ding, H.; Huang, X. SemiCDNet: A semisupervised convolutional neural network for change detection in high resolution remote-sensing images. IEEE Trans. Geosci. Remote Sens. 2020, 59, 5891–5906. [Google Scholar] [CrossRef]
- Han, W.; Li, J.; Wang, S.; Zhang, X.; Dong, Y.; Fan, R.; Zhang, X.; Wang, L. Geological remote sensing interpretation using deep learning feature and an adaptive multisource data fusion network. IEEE Trans. Geosci. Remote Sens. 2022, 60, 4510314. [Google Scholar] [CrossRef]
- Zhang, L.; Song, L.; Du, B.; Zhang, Y. Nonlocal low-rank tensor completion for visual data. IEEE Trans. Cybern. 2019, 51, 673–685. [Google Scholar] [CrossRef] [PubMed]
- Pan, Z.; Xu, J.; Guo, Y.; Hu, Y.; Wang, G. Deep learning segmentation and classification for urban village using a worldview satellite image based on U-Net. Remote Sens. 2020, 12, 1574. [Google Scholar] [CrossRef]
- Shao, Z.; Tang, P.; Wang, Z.; Saleem, N.; Yam, S.; Sommai, C. BRRNet: A fully convolutional neural network for automatic building extraction from high-resolution remote sensing images. Remote Sens. 2020, 12, 1050. [Google Scholar] [CrossRef]
- Han, Y.; Li, Z.; Huang, C.; Zhou, Y.; Zong, S.; Hao, T.; Niu, H.; Yao, H. Monitoring droughts in the Greater Changbai Mountains using multiple remote sensing-based drought indices. Remote Sens. 2020, 12, 530. [Google Scholar] [CrossRef]
- Rousta, I.; Olafsson, H.; Moniruzzaman, M.; Zhang, H.; Liou, Y.-A.; Mushore, T.D.; Gupta, A. Impacts of drought on vegetation assessed by vegetation indices and meteorological factors in Afghanistan. Remote Sens. 2020, 12, 2433. [Google Scholar] [CrossRef]
- Ebel, P.; Xu, Y.; Schmitt, M.; Zhu, X.X. SEN12MS-CR-TS: A remote-sensing data set for multimodal multitemporal cloud removal. IEEE Trans. Geosci. Remote Sens. 2022, 60, 5222414. [Google Scholar] [CrossRef]
- Guo, J.; Yang, J.; Yue, H.; Tan, H.; Hou, C.; Li, K. RSDehazeNet: Dehazing network with channel refinement for multispectral remote sensing images. IEEE Trans. Geosci. Remote Sens. 2020, 59, 2535–2549. [Google Scholar] [CrossRef]
- Guo, Q.; Hu, H.-M.; Li, B. Haze and thin cloud removal using elliptical boundary prior for remote sensing image. IEEE Trans. Geosci. Remote Sens. 2019, 57, 9124–9137. [Google Scholar] [CrossRef]
- Wu, H.; Qu, Y.; Lin, S.; Zhou, J.; Qiao, R.; Zhang, Z.; Xie, Y.; Ma, L. Contrastive learning for compact single image dehazing. In Proceedings of the IEEE/CVF Conference on Computer Vision and Pattern Recognition, Nashville, TN, USA, 19–25 June 2021; pp. 10551–10560. [Google Scholar]
- Zhao, S.; Zhang, L.; Shen, Y.; Zhou, Y. RefineDNet: A weakly supervised refinement framework for single image dehazing. IEEE Trans. Image Process. 2021, 30, 3391–3404. [Google Scholar] [CrossRef] [PubMed]
- Zheng, Z.; Ren, W.; Cao, X.; Hu, X.; Wang, T.; Song, F.; Jia, X. Ultra-high-definition image dehazing via multi-guided bilateral learning. In Proceedings of the 2021 IEEE/CVF Conference on Computer Vision and Pattern Recognition (CVPR), Nashville, TN, USA, 19–25 June 2021; pp. 16180–16189. [Google Scholar]
- Huang, P.; Zhao, L.; Jiang, R.; Wang, T.; Zhang, X. Self-filtering image dehazing with self-supporting module. Neurocomputing 2021, 432, 57–69. [Google Scholar] [CrossRef]
- Wang, C.; Shen, H.-Z.; Fan, F.; Shao, M.-W.; Yang, C.-S.; Luo, J.-C.; Deng, L.-J. EAA-Net: A novel edge assisted attention network for single image dehazing. Knowl.-Based Syst. 2021, 228, 107279. [Google Scholar] [CrossRef]
- Huang, Y.; Chen, X. Single remote sensing image dehazing using a dual-step cascaded residual dense network. In Proceedings of the 2021 IEEE International Conference on Image Processing (ICIP), Anchorage, AK, USA, 19–22 September 2021; pp. 3852–3856. [Google Scholar]
- Qin, X.; Wang, Z.; Bai, Y.; Xie, X.; Jia, H. FFA-Net: Feature fusion attention network for single image dehazing. In Proceedings of the AAAI Conference on Artificial Intelligence, New York, NY, USA, 7–12 February 2020; pp. 11908–11915. [Google Scholar]
- Huang, B.; Zhi, L.; Yang, C.; Sun, F.; Song, Y. Single satellite optical imagery dehazing using SAR image prior based on conditional generative adversarial networks. In Proceedings of the IEEE/CVF Winter Conference on Applications of Computer Vision, Snowmass Village, CO, USA, 1–5 March 2020; pp. 1806–1813. [Google Scholar]
- Zhang, L.; Wang, S. Dense haze removal based on dynamic collaborative inference learning for remote sensing images. IEEE Trans. Geosci. Remote Sens. 2022, 60, 5631016. [Google Scholar] [CrossRef]
- He, K.; Sun, J.; Tang, X. Single image haze removal using dark channel prior. IEEE Trans. Pattern Anal. Mach. Intell. 2011, 33, 2341. [Google Scholar]
- Zhu, Q.; Mai, J.; Shao, L. A fast single image haze removal algorithm using color attenuation prior. IEEE Trans. Image Process. 2015, 24, 3522–3533. [Google Scholar]
- Berman, D.; Avidan, S. Non-local image dehazing. In Proceedings of the IEEE Conference on Computer Vision and Pattern Recognition, Las Vegas, NV, USA, 27–30 June 2016; pp. 1674–1682. [Google Scholar]
- Xu, L.; Zhao, D.; Yan, Y.; Kwong, S.; Chen, J.; Duan, L.-Y. IDeRs: Iterative dehazing method for single remote sensing image. Inf. Sci. 2019, 489, 50–62. [Google Scholar] [CrossRef]
- Li, R.; Pan, J.; He, M.; Li, Z.; Tang, J. Task-oriented network for image dehazing. IEEE Trans. Image Process. 2020, 29, 6523–6534. [Google Scholar] [CrossRef]
- Yin, S.; Wang, Y.; Yang, Y.-H. A novel image-dehazing network with a parallel attention block. Pattern Recognit. 2020, 102, 107255. [Google Scholar] [CrossRef]
- Cai, B.; Xu, X.; Jia, K.; Qing, C.; Tao, D. Dehazenet: An end-to-end system for single image haze removal. IEEE Trans. Image Process. 2016, 25, 5187–5198. [Google Scholar] [CrossRef] [PubMed]
- Ren, W.; Pan, J.; Zhang, H.; Cao, X.; Yang, M.-H. Single image dehazing via multi-scale convolutional neural networks with holistic edges. Int. J. Comput. Vis. 2020, 128, 240–259. [Google Scholar] [CrossRef]
- Li, B.; Peng, X.; Wang, Z.; Xu, J.; Feng, D. Aod-net: All-in-one dehazing network. In Proceedings of the IEEE International Conference on Computer Vision, Venice, Italy, 22–29 October 2017; pp. 4770–4778. [Google Scholar]
- Liu, X.; Ma, Y.; Shi, Z.; Chen, J. Griddehazenet: Attention-based multi-scale network for image dehazing. In Proceedings of the IEEE/CVF international conference on computer vision, Seoul, Republic of Korea, 27 October–2 November 2019; pp. 7314–7323. [Google Scholar]
- Mei, K.; Jiang, A.; Li, J.; Wang, M. Progressive feature fusion network for realistic image dehazing. In Proceedings of the Computer Vision–ACCV 2018: 14th Asian Conference on Computer Vision, Perth, Australia, 2–6 December 2018; Revised Selected Papers, Part I 14. 2019; pp. 203–215. [Google Scholar]
- Chen, Z.; He, Z.; Lu, Z.-M. DEA-Net: Single image dehazing based on detail-enhanced convolution and content-guided attention. arXiv 2023, arXiv:2301.04805. [Google Scholar]
- Song, Y.; He, Z.; Qian, H.; Du, X. Vision transformers for single image dehazing. IEEE Trans. Image Process. 2023, 32, 1927–1941. [Google Scholar] [CrossRef] [PubMed]
- Lu, L.; Xiong, Q.; Chu, D.; Xu, B. MixDehazeNet: Mix Structure Block For Image Dehazing Network. arXiv 2023, arXiv:2305.17654. [Google Scholar]
- Guo, Y.; Gao, Y.; Liu, W.; Lu, Y.; Qu, J.; He, S.; Ren, W. SCANet: Self-Paced Semi-Curricular Attention Network for Non-Homogeneous Image Dehazing. In Proceedings of the IEEE/CVF Conference on Computer Vision and Pattern Recognition, Vancouver, BC, Canada, 18–22 June 2023; pp. 1884–1893. [Google Scholar]
- Li, Y.; Chen, X. A coarse-to-fine two-stage attentive network for haze removal of remote sensing images. IEEE Geosci. Remote Sens. Lett. 2020, 18, 1751–1755. [Google Scholar] [CrossRef]
- Sun, H.; Luo, Z.; Ren, D.; Hu, W.; Du, B.; Yang, W.; Wan, J.; Zhang, L. Partial Siamese with Multiscale Bi-codec Networks for Remote Sensing Image Haze Removal. IEEE Trans. Geosci. Remote Sens. 2023, 61, 4106516. [Google Scholar] [CrossRef]
- Song, T.; Fan, S.; Li, P.; Jin, J.; Jin, G.; Fan, L. Learning An Effective Transformer for Remote Sensing Satellite Image Dehazing. IEEE Geosci. Remote Sens. Lett. 2023, 20, 8002305. [Google Scholar] [CrossRef]
- Chalavadi, V.; Jeripothula, P.; Datla, R.; Ch, S.B. mSODANet: A network for multi-scale object detection in aerial images using hierarchical dilated convolutions. Pattern Recognit. 2022, 126, 108548. [Google Scholar] [CrossRef]
- Wang, Y.; Yan, X.; Niu, Y.; Gong, L.; Guo, Y.; Wei, M. Joint Depth Estimation and Mixture of Rain Removal From a Single Image. arXiv 2023, arXiv:2303.17766. [Google Scholar]
- Wang, T.; Zhao, L.; Huang, P.; Zhang, X.; Xu, J. Haze concentration adaptive network for image dehazing. Neurocomputing 2021, 439, 75–85. [Google Scholar] [CrossRef]
- Tibshirani, R. Regression shrinkage and selection via the lasso. J. R. Stat. Soc. Ser. B Stat. Methodol. 1996, 58, 267–288. [Google Scholar] [CrossRef]
Disclaimer/Publisher’s Note: The statements, opinions and data contained in all publications are solely those of the individual author(s) and contributor(s) and not of MDPI and/or the editor(s). MDPI and/or the editor(s) disclaim responsibility for any injury to people or property resulting from any ideas, methods, instructions or products referred to in the content. |
© 2024 by the authors. Licensee MDPI, Basel, Switzerland. This article is an open access article distributed under the terms and conditions of the Creative Commons Attribution (CC BY) license (https://creativecommons.org/licenses/by/4.0/).