Abstract
Most existing target recognition methods based on high-resolution range profiles (HRRPs) use data from only one domain. However, the information contained in HRRP data from different domains is not exactly the same. Therefore, in the context of inverse synthetic aperture radar (ISAR), this paper proposes an advanced deep hybrid fusion network to utilize HRRP data from different domains for ship target recognition. First, the proposed network simultaneously processes time-domain HRRP and its corresponding time–frequency (TF) spectrogram through two branches to obtain initial features from the two HRRP domains. Next, a feature alignment module is used to make the fused features more discriminative regarding the target. Finally, a decision fusion module is designed to further improve the model’s prediction performance. We evaluated our approach using both simulated and measured data, encompassing ten different ship target types. Our experimental results on the simulated and measured datasets showed an improvement in recognition accuracy of at least 4.22% and 2.82%, respectively, compared to using single-domain data.
1. Introduction
Due to its long-range capabilities and all-weather operation, radar automatic target recognition (RATR) plays a crucial role in both military and civilian applications [1,2,3,4,5,6]. High-resolution range profile (HRRP) data can be viewed as the projection of scattering point echoes along the radar’s line of sight [7]. These data encapsulate the size and distribution of the target’s scattering points. Their acquisition process is straightforward, and unlike inverse synthetic aperture radar (ISAR) images, the quality of HRRP data is not compromised by focusing algorithms or non-cooperative target motion. As a result, HRRP target recognition has been extensively studied and implemented in RATR systems. The fundamental process of HRRP target recognition is illustrated in Figure 1.

Figure 1.
Flowchart of HRRP target recognition.
As shown in Figure 1, feature extraction plays a critical role in target recognition and directly impacts the performance of the recognition system [8]. In HRRP target recognition, there has been a significant shift from traditional feature extraction to the adoption of neural networks for this purpose. Traditional feature extraction methods can be categorized into those with physical interpretability [9] and those without [10,11,12,13]. Although these methods have achieved high accuracy on their respective datasets, the extraction of features heavily relies on the researchers’ expertise. Without such expertise, it is challenging to effectively ensure the accuracy and stability of the algorithms.
Recently, many studies have utilized deep neural network methods to analyze HRRP data, as deep learning can enhance system accuracy by eliminating the need for manual feature extraction and providing better feature representation capabilities. Some of these studies focus on time-domain HRRPs. For instance, a deep learning method for multi-static radar target recognition was used to automatically extract features from HRRP data [14]. Considering the time-shift and azimuth sensitivity of HRRP data, a convolutional neural network (CNN) with large convolution kernels and strides was proposed for target recognition [15]. Additionally, a stacked corrective autoencoder (SCAE) was used to extract features from HRRP, with the average profile employed as a correction term [16]. An enhanced variational autoencoder (VAE) was introduced to capture probabilistic latent features [17], while a sparse encoder was used to learn sparse representations of high-dimensional data, yielding better recognition performance than traditional autoencoders [18]. Furthermore, some studies have focused on the temporal information in time-domain HRRPs and have employed sequential models to address this issue [19,20,21,22,23]. Specifically, by considering the temporal correlations within the range cells of input data, a combination of CNN, bidirectional recurrent neural network (BiRNN), and attention mechanisms was used to improve the robustness of target recognition [19]. Additionally, [21] proposed a deep learning model combining CNN with transformers to recognize the spatiotemporal structures embedded in HRRPs.
In contrast to the studies focusing on time-domain HRRPs, other studies have concentrated on the time–frequency (TF) spectrogram of one-dimensional HRRPs. For example, a two-dimensional CNN was devised to extract spectrogram features from HRRP data [24]. A multi-scale CNN was proposed to address the challenging task of feature extraction in space target recognition based on TF spectrograms, yielding improved recognition results [25]. Moreover, an attentional CNN model with multi-resolution spectrograms was proposed for target recognition [26].
Although these recognition methods have potential in improving recognition performance, they only utilize HRRP data from a single domain. In fact, due to different generation mechanisms, HRRPs in different domains contain information about different aspects of the target [8,27]. By integrating multi-domain information, it may be possible to achieve a more comprehensive representation of the target. Recently, research has proposed combining multi-domain HRRP data for target recognition. Specifically, a multi-input convolutional gated recurrent unit (MIConvGRU) fusion model was introduced to fully leverage three domains of HRRP data (i.e., time-domain HRRP, TF spectrogram, and power spectral density (PSD)) for target recognition [6]. Experimental results demonstrated that this method can significantly enhance radar target recognition performance. However, it does not account for how correlation between initial features from different domains might affect the discriminative ability of the fused features. Therefore, we aimed to design a fusion method that fully considers this correlation to improve the system’s recognition performance, while utilizing only two domains of HRRP data. Fusion recognition methods can be classified by information abstraction level into data-level [28], feature-level [29], and decision-level fusion [30]. Data-level fusion is the simplest but provides minimal performance improvement. Decision-level fusion aggregates predictions from multiple classifiers, adding diversity and increasing decision reliability. However, it operates at the highest abstraction level, leading to some loss of important details. Feature-level fusion is generally considered a more flexible and effective fusion approach [31], and it can compensate for the drawbacks of decision-level fusion. To leverage the advantages of both feature-level and decision-level fusion, we propose using a hybrid fusion method for target recognition, aiming to enhance the overall performance of the model.
In this paper, we propose a deep hybrid fusion network to effectively integrate HRRP data from two domains for ship target recognition. First, in the feature extraction stage, two CNNs independently extract features from the time-domain HRRP data and their corresponding TF spectrogram. These extracted features serve as the initial input for subsequent modules. Second, considering the correlation between the two modalities, we introduce the supervised contrastive learning (SupCon) loss to align the initial features from both domains, with the expectation that the fused and aligned features will make the samples more discriminative. Finally, a neural network-based decision fusion module is implemented following the feature alignment module. This hybrid fusion strategy is expected to further improve the model’s recognition performance. The primary contributions of this work can be summarized as follows:
(1) We explored the effectiveness of combining time-domain HRRP data and their TF spectrogram for ship target recognition. We propose a deep hybrid fusion method to obtain a more comprehensive and discriminative representation of the target, thereby achieving satisfying recognition performance.
(2) In the feature-level fusion part, we design a feature alignment module based on SupCon loss to better fuse the features from the two domains. Compared to traditional feature-level fusion methods, the alignment module fully takes into account the correlation between the two modalities and its impact on the discriminability of the fused features, thereby improving recognition performance.
(3) In the decision-level fusion part, a neural network-based decision fusion module is created to enhance recognition accuracy and reliability. The method’s effectiveness was validated with both simulated and measured data.
2. Data Preprocessing
2.1. Time-Domain HRRP
The time-domain HRRP data used in this study consist of multiple HRRPs obtained before ISAR imaging. The reason for this approach is twofold: first, the primary focus of this paper is on using multi-domain HRRPs for fusion target recognition; second, the recognition process does not require azimuth focusing and is not affected by ISAR image quality. We perform some preprocessing steps to address the three sensitivities of HRRP: (1) we first perform envelope alignment on these HRRPs to overcome the time-shift sensitivity of HRRPs [32]. (2) Given the aspect sensitivity of HRRPs [16,33], studies indicate that the average HRRP yields a smoother and more concise signal shape than individual HRRPs, enhancing the depiction of a target’s scattering characteristics in a specific aspect frame [3,34,35]. From a signal processing viewpoint, the average profile consistently represents the target’s physical structure within a frame.This approach effectively reduces speckle effects and alleviates issues caused by noise spikes and amplitude variations. Therefore, we decided to compute the average profile of the aligned HRRP sequence. According to the literature [7], the average profile is defined as follows:
where represents an envelope-aligned complex-valued HRRP sequence, is the sample in the HRRP sequence, and r is the HRRP sample dimension. Since the aligned HRRP sequence remains in a complex form, and what we commonly refer to as a time-domain HRRP is in a real form, we need to perform a modulus operation on each sample in the sequence before obtaining the average profile.
Additionally, we perform amplitude normalization on the obtained average profile to address the amplitude-scale sensitivity. Our normalization calculation method is as follows:
After the above operations, the profile is used as the final representation of the time-domain HRRP for subsequent processing.
2.2. Spectrogram
For the spectrogram, we first use TF analysis to convert from the one-dimensional time-domain to the two-dimensional time–frequency domain. Short-Time Fourier Transform (STFT) captures moment-specific signal characteristics by analyzing a segment of the signal within a time window. For a discrete signal , its STFT can be expressed as follows:
where is the signal to be transformed, and is the time window function. After obtaining the STFT representation of the signal , its spectrogram is the squared magnitude of the STFT:
As indicated by the definition of the spectrogram, this representation captures the local characteristics of the HRRP within small distance units. Compared to the time-domain HRRP, it better describes variations in the HRRP. To eliminate the effect of scale, we also normalize the obtained spectrogram. The final spectrogram is then used for further processing. Figure 2 illustrates the processing of the time-domain HRRP and its amplitude-normalized spectrogram representation. After preprocessing, the time-domain HRRP and its spectrogram are treated as two distinct modalities for the subsequent fusion process.
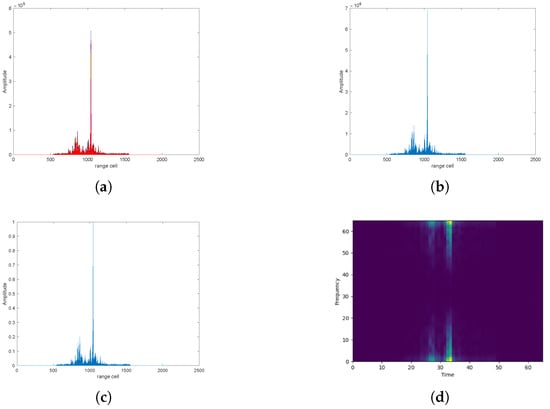
Figure 2.
Processing of a time-domain HRRP and its spectrogram. (a) Aligned multiple HRRPs; (b) average profile; (c) normalized average profile; (d) normalized spectrogram.
3. The Proposed Method
In this section, we introduce the proposed deep hybrid fusion network for multi-domain HRRP target recognition. As illustrated in Figure 3, the proposed method’s framework can be divided into three main modules: feature extraction, feature alignment, and decision fusion. In the feature extraction module, the preprocessed time-domain HRRP and its corresponding spectrogram, as described in Section 2, are fed into CNNs to extract initial features, which then serve as inputs for the subsequent modules. Then, we align the two sets of initial features to enhance their discriminative power when fused. Finally, the two aligned initial features and their integrated representations are input into the following decision fusion module.

Figure 3.
Framework of the proposed deep hybrid fusion network. In the figure, and denote the initial features extracted from the two domains of HRRP data using CNNs. and are the aligned features obtained using our method. is the integrated feature obtained by an element-wise addition of and . These three features together contribute to the decision fusion process.
3.1. Initial Feature Extraction
In deep neural networks, CNNs are particularly effective in reducing network complexity and enhancing generalization ability due to their characteristics of local connections and weight sharing [36,37,38,39,40,41]. Therefore, the proposed method utilizes CNNs to obtain initial features from both the time-domain HRRP and its spectrogram. It is worth noting that the preprocessed time-domain HRRP represents the target in one dimension, while the spectrogram is a two-dimensional representation. Consequently, a one-dimensional CNN is used for extracting initial features from the time-domain HRRP, while a two-dimensional CNN is designed to extract features from the spectrogram.
The detailed architecture of the two CNNs is depicted in Figure 4. For the spectrogram CNN, “Conc.128 × 5 × 5/BN/ReLU” indicates 128 feature maps with a kernel size of 5 × 5, followed by batch normalization (BN) [42] and a rectified linear unit (ReLU) activation function [43]. “Dropout” signifies the use of dropout regularization [44]. “Max pool 2 × 2” represents max pooling with a pool size of 2 × 2, while “Fully connected 2560 × 1000” denotes a fully connected layer with 2560 input units and 1000 output units. The softmax layer then produces the predicted labels. The CNN for time-domain HRRP data has a similar layout, with the convolutional and pooling layers utilized in one dimension rather than two.
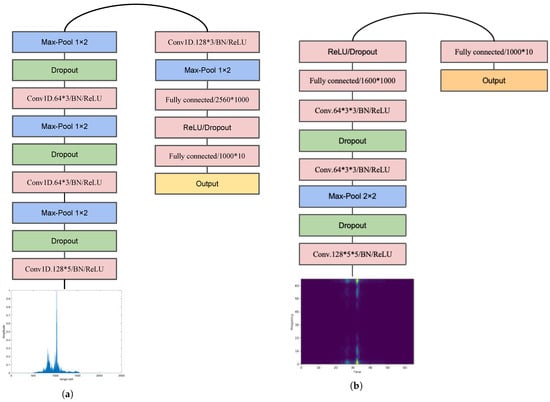
Figure 4.
(a) 1D-CNN for HRRP; (b) CNN for spectrogram.
For both networks, the output from the first fully connected layer is considered the initial feature for each modality. In our approach, if the dimensions of the initial features from the two modalities are different, we need to transform them to the same dimension for further processing. The HRRP branch takes the preprocessed HRRP, , as input to extract the initial feature . Assuming represents the CNN for HRRP with parameters , the extraction of the initial HRRP feature can be expressed as follows:
Similarly, let denote the preprocessed spectrogram and represent the initial extracted features from the spectrogram. The extraction process for the initial spectrogram features can be formally expressed as follows:
3.2. Feature Alignment
Our task is to recognize ship targets by combining a time-domain HRRP and its spectrogram. Since these two representations are generated through different mechanisms, they encapsulate distinct information about the target. We hypothesize that they possess a certain degree of complementarity, which forms the basis for our combined recognition approach. By leveraging this complementarity, we aim to enhance the model’s predictive performance. In feature-level fusion methods based on deep neural networks, the most common techniques are concatenation and summation [45], as shown in Figure 5. Concatenation involves directly merging the two features, resulting in a feature with a dimension equal to the sum of the dimensions of the original features. Summation, on the other hand, adds the two features element-wise, resulting in a fused feature with the same dimension as the original features.
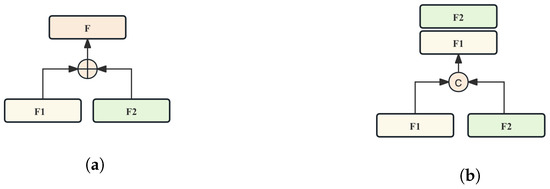
Figure 5.
Classic feature-level fusion methods. (a) Element-wise addition; (b) Concatenation.
Although these two methods, along with some existing weighted feature fusion methods, encompass all the information from the features being fused, they might overlook the correlation between the initial features of the two modalities. This could potentially limit the improvement in sample discriminability. In our task, the two modalities are HRRP and its corresponding spectrogram, which represent two different aspects of the target. As a result, the correlation between these two features is expected to be quite low. In this scenario, the feature distributions of the two modalities in the feature space might be disordered. Specifically, the feature distributions of the same category from the two modalities might not be close to each other. Conversely, the initial feature distributions of different categories from the two modalities might be close or even overlap, as shown in the left part of Figure 6. Directly utilizing the aforementioned fusion methods in such cases can result in the fused features containing similar information from different categories, leading to some ambiguity with other categories. Even though the two modalities’ features have a certain degree of complementarity, this ambiguity can restrict the performance improvement from the fusion. To address this issue, if we can minimize the inclusion of similar information from other classes in the fused features, we can reduce the ambiguity to some extent, thereby increasing the discriminability of the samples and improving the model’s predictive performance.
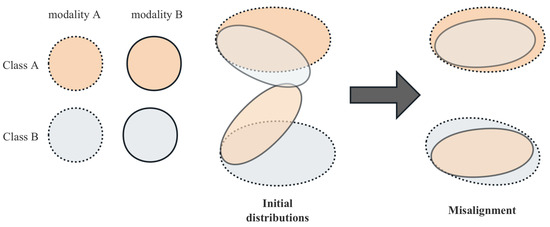
Figure 6.
Misalignment in MMD-based feature alignment.
Therefore, we propose a feature alignment method to solve this problem. We aim for feature alignment to make the distributions of the two modalities of the same class as close as possible, which can reduce the disorder and, consequently, the ambiguity in the fused features. In the field of transfer learning, the maximum mean discrepancy (MMD) loss [46,47] is frequently utilized to assess the distance between multi-domain feature distributions and has demonstrated outstanding performance. We aimed to use the MMD loss function during training to constrain the feature distributions of the two modalities to become closer, thereby achieving alignment. However, due to the low correlation, the feature distributions of the two modalities from different classes might be close to or even overlapping each other. Since the MMD loss function is a global unsupervised alignment method, it could lead to the “misalignment” phenomenon illustrated in Figure 6 [4]. This phenomenon, if it occurs, could be detrimental or even harmful to reducing the ambiguity in the fused features.
To tackle this problem, this paper introduces SupCon loss [48] as an innovative solution. Supervised contrastive learning is a specialized form of contrastive learning that uses label constraints to incorporate a large number of positive and negative sample pairs during the learning process. A positive sample pair consists of two samples that share the same class label, while a negative sample pair comprises two samples with different class labels. It has been shown to enhance the performance of a classification model by learning rich representations of the samples. For a given sample embedding , we refer to the samples in the batch that belong to the same class as positive samples . The set of positive samples is denoted as . Given a sample embedding and its positive sample set, the SupCon loss is defined as follows:
where j represents the index traversing all samples, and is a scaling parameter. The SupCon loss can be intuitively understood as the average loss defined over each positive pair. In our task, the positive pairs include samples of the same modality and class, as well as samples of the same class but different modalities. In fact, we can rewrite Equation (7) in the form of a combination of two terms as follows:
We reformulate the SupCon loss into a combination of a tightness term and a contrast term, which elucidates its fundamental purpose. The tightness term aims to maximize the similarity among samples within the same class, thereby promoting the alignment of same-class samples, including those from different modalities in our task. Conversely, the contrast term aims to minimize the similarity between samples of different classes, driving them further apart. This process can be depicted as shown in Figure 7.
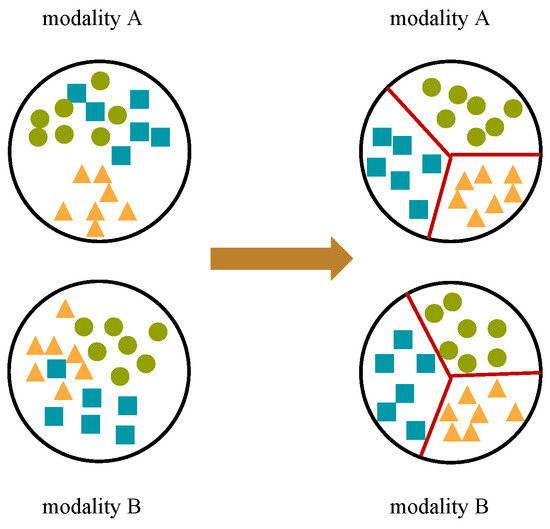
Figure 7.
Process of feature alignment.
Compared to the MMD-based alignment method, the SupCon loss offers the following advantages: (1) it uses label constraints for alignment, which can prevent misalignment; (2) the contrast term further reduces the inclusion of information from other classes in the fused features, thereby decreasing ambiguity and enhancing the discriminability of the samples.
In a batch of samples, the overall SupCon loss is the average of the losses of the N samples:
3.3. Decision Fusion
The core idea of decision fusion is to enhance the overall system’s accuracy, stability, and robustness by aggregating the results from multiple classifiers. In complex real-world scenarios, the outcome of a single classifier is often affected by various external factors, leading to significant risks and uncertainties in target recognition results. Decision-level fusion methods analyze and combine the outputs of multiple classifiers, mitigating the impact of any single classifier’s errors and thereby improving target recognition accuracy.
Therefore, this article adopts a neural network-based decision fusion method to integrate the results of multiple classifiers to enhance model performance. The two initial features described in Equations (5) and (6), after aligning the features, are referred to as and , respectively. The integrated feature obtained by the element-wise addition of the two is
For decision fusion, we construct three base classifiers . All three base classifiers are composed of fully connected layers, with network parameters denoted as . Their inputs are , , and , respectively. Assuming the prediction vectors of the three classifiers are
where k represents the total number of classes in the classification task, and is the softmax probability of classifier for the class. After obtaining the three initial decision vectors, we concatenate them and input the combined vector into a meta classifier to obtain the final prediction vector . This process can be expressed by the following equation:
where denotes the parameters of the meta-classifier network. The entire decision fusion process is illustrated in Figure 8. It is important to note that the three initial classifiers must have good classification performance to serve as a solid foundation for decision fusion. Therefore, during training, we impose a cross-entropy loss constraint on the three base classifiers to ensure their basic classification performance. This can be expressed with the following equation:
where are the cross-entropy loss functions for the three base classifier branches, respectively. Additionally, to ensure that the final integrated decision vector is effective for our task, we also impose a cross-entropy loss constraint on it, denoted as . Therefore, the total loss function of the proposed deep hybrid fusion network mainly consists of three parts. The first part is , used by the feature alignment module. The second part is , which ensures the performance of the three base classifiers. The final part is the task-specific loss function . The overall loss function is as shown in the following equation:
where and are adjustable hyperparameters used to balance these three components. To present our proposed method more clearly, we describe the training process. We train the fusion model using Adam optimizer, with a learning rate of 0.001 and a batch size of 16. The overall training procedure is outlined in Algorithm 1.
| Algorithm 1 Training Process of the Proposed Method |
| 1. Set the network architecture for the proposed method, including the number of fully connected layers, the number of units in each fully connected layer, the batch size, and other hyperparameters. |
| 2. Initialize the parameters for the two feature extraction networks ; the base classifier parameters ; and the meta-classifier parameters . |
| 3. while not converged do |
| 4. Randomly sample a batch of examples and their corresponding labels from the entire dataset. |
| 5. Following the preprocessing steps outlined in Section 2, obtain the preprocessed time-domain profile and spectrogram for each sample. |
| 6. Use and as inputs to obtain the initial features of the two modalities, and , through Equations (5) and 6, respectively. |
| 7. Using , , and , compute through Equations (8) and (9). |
| 8. In the decision fusion section, obtain the prediction vector using Equations (10)–(12). |
| 9. Calculate the total loss and update the network parameters. |
| 10. end while |
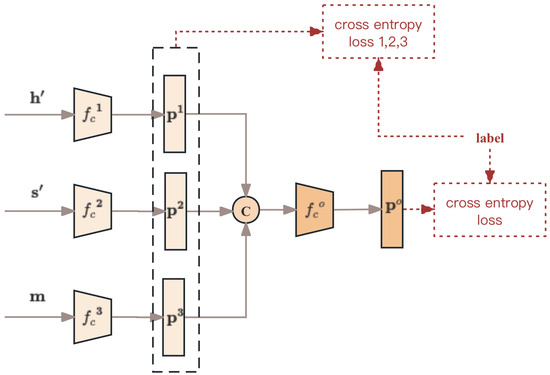
Figure 8.
Flowchart of the proposed decision fusion module.
4. Experiments and Results
4.1. Simulated Data
In our research, we exclusively utilized HRRP data obtained prior to ISAR imaging to validate the efficacy of joint multi-domain HRRPs in target recognition. To more intuitively describe the target’s motion and posture, we analyze the simulation data from the perspective of ISAR images. For the simulation data, we designed 3D models of ten types of ships to create the dataset. It is important to note that each ship category includes two pitch angles for top-view images and two azimuth angles for side-view images. For top-view images, each pitch angle features two azimuth movement patterns. An ISAR image is generated at regular angle intervals within each movement pattern, producing 25 images per movement pattern. Consequently, each pitch angle results in 50 images, with a total of 100 images for both pitch angles combined. The side-view images follow a similar pattern, resulting in 100 top-view images and 100 side-view images for each category, considering the two pitch angles and two azimuth angles. The specific imaging parameters are presented in Table 1. In this table, T1 represents target 1, and the geometric relationship between azimuth and pitch angles is illustrated in Figure 9. The radar simulation parameters are detailed in Table 2, which lists the radar’s center frequency, bandwidth, pulse repetition frequency (PRF), and accumulation time. The pitch angle is defined as the angle between the positive direction of the z-axis and the target, while the azimuth angle is defined as the angle between the projection on the plane and the positive direction of the x-axis, with the ship’s bow pointing in the positive direction of the x-axis. Ideally, the typical preprocessed HRRP data of the ten target classes are shown in Figure 10, with their corresponding spectrograms depicted in Figure 11.

Table 1.
Detailed motion parameters of ship targets.
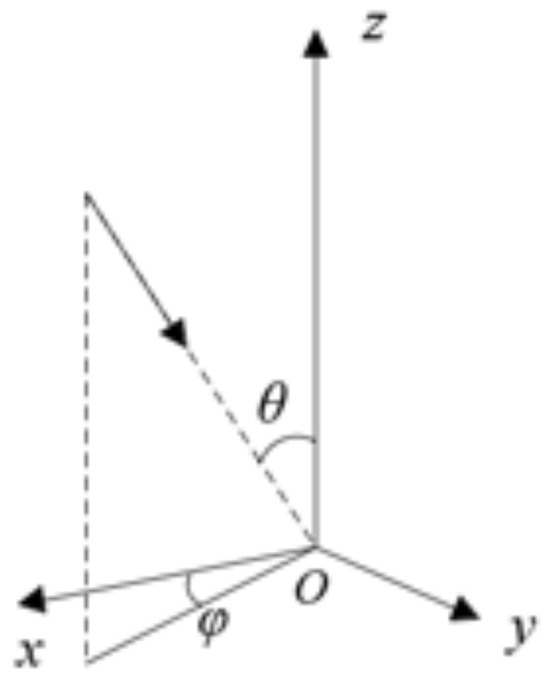
Figure 9.
Geometric relations.

Table 2.
Settings of radar parameters for simulated data.
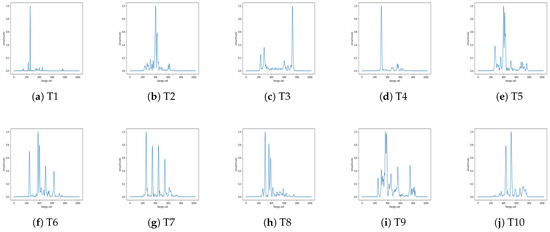
Figure 10.
Preprocessed time-domain HRRPs of targets in the simulated dataset.
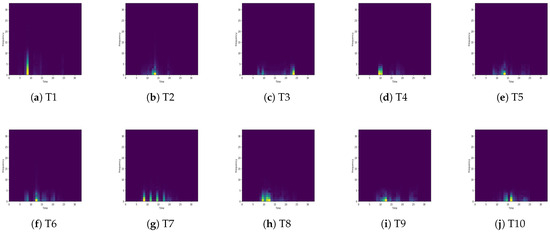
Figure 11.
Spectrograms corresponding to the targets’ time-domain HRRPs.
To evaluate the proposed method’s performance across different signal-to-noise ratios (SNRs), Gaussian noise with SNRs of 10 dB, 5 dB, and 3 dB was added to the original echoes. For each SNR dataset, we used the top-view data corresponding to a pitch angle of 80° and the side-view data corresponding to an azimuth angle of 10° as the training samples, with the rest used as test samples. The recognition accuracy of the proposed method is shown in Table 3. Additionally, we provide the confusion matrices for the three SNR levels, as shown in Figure 12.

Table 3.
Recognition accuracy of the proposed method under different SNRs.

Figure 12.
Confusion matrices of the proposed method under different SNRs.
We also conducted comparative experiments using different fusion techniques. In these experiments, the initial feature extraction network structure, batch size, learning rate, and other hyperparameters were kept consistent for fairness. The methods compared include two classical feature-level fusion techniques: the first concatenates the initial features of the two modalities before inputting them into the classifier, while the second adds the corresponding elements of the initial features before sending them to the prediction layer. Additionally, we compared two weighted methods that can learn the contribution of each modality: the extended-GRU (Ex-GRU) fusion method [49] and the attention mechanism (AM)-based fusion method [31]; as well as the MMD-based feature alignment method (MMD_align). Another method under comparison is the MIConvGRU, which combines HRRP data from three domains. Furthermore, to verify the effectiveness of the decision fusion module, we also conducted an experiment using only the proposed feature alignment method (Only_align). Comparative experiments were conducted under different SNRs, and the recognition performance of each method is shown in Table 4 and Figure 13. From Figure 13, it can be seen more intuitively that the proposed method has a better recognition performance compared to previous fusion methods. Notably, our alignment method outperforms the MMD-based feature alignment method in target recognition. Furthermore, compared to the MIConvGRU approach that combines HRRP data from three domains, our method achieves better recognition performance while using only two domains. Additionally, combining feature alignment with decision fusion for target recognition yields a higher recognition compared to using feature alignment alone.

Table 4.
Comparison of different methods with the proposed method on the simulated dataset.
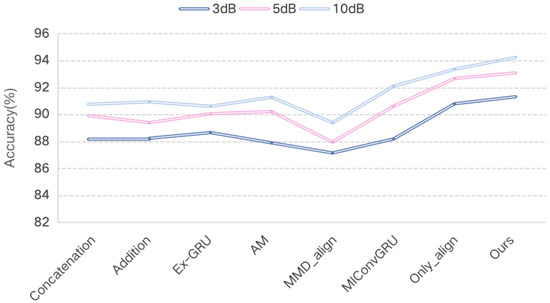
Figure 13.
Comparison of different methods with the proposed method on the simulated dataset.
4.2. Measured Data
We additionally confirmed the proposed method’s effectiveness with measured data obtained via an X-band radar. Like the simulated dataset, the real measured multi-domain HRRP data included preprocessed time-domain HRRPs and spectrograms captured before ISAR imaging. Additionally, the measured data covered ten target categories, with data collected over various periods for each category. Figure 14 shows the typical preprocessed time-domain HRRPs for these ten target categories, while Figure 15 displays the corresponding spectrograms. In this experiment, we randomly selected 50 samples from each category as training samples, with the remaining samples used for testing. The number of training and testing samples for each of the ten target categories is detailed in Table 5.
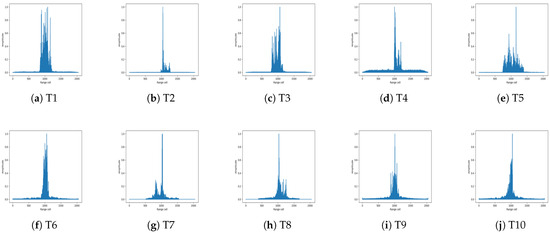
Figure 14.
Preprocessed time-domain HRRPs of targets in the measured dataset.
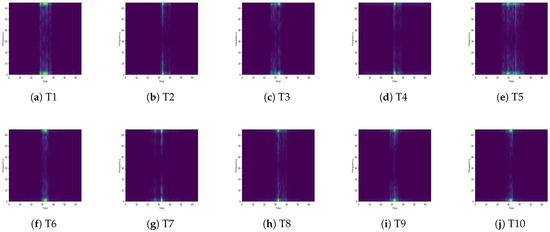
Figure 15.
Spectrograms corresponding to the targets’ time-domain HRRPs.

Table 5.
Details of Training and Test samples for the Ten-target measured Dataset.
Similar to the experiments conducted on the simulated dataset, we also performed a series of comparative experiments on the measured dataset. The comparison methods used are the same as those applied to the simulated dataset. The recognition results, shown in Table 6, demonstrate that our proposed method achieves a higher recognition rate, further validating its effectiveness. Similar to the results on simulated data, our alignment method surpasses the MMD-based feature alignment method in target recognition. Moreover, compared to the MIConvGRU approach that uses HRRP data from three domains, our method delivers better recognition performance with only two domains. Additionally, integrating feature alignment with decision fusion leads to higher recognition rates than using only feature alignment.

Table 6.
Comparison of different methods with the proposed method on the measured dataset.
4.3. Ablation Study
In this section, to validate the superiority of the proposed fusion method combining time-domain HRRPs and spectrograms over single-modality recognition, we conducted ablation experiments on both simulated and measured data under different SNRs. The feature extraction networks for the two modalities are as shown in Figure 4. The experimental results are presented in Table 7. From these results, it is evident that when only a single modality is used for target recognition, the recognition rates are relatively low, regardless of whether the data are measured or simulated. In contrast, our proposed fusion method, which integrates both modalities, consistently yields a higher recognition accuracy.

Table 7.
Ablation study.
To more intuitively demonstrate the effectiveness of the proposed method compared to single-modality recognition, we used t-distributed stochastic neighbor embedding (t-SNE) [50] to visualize the features extracted by the proposed fusion method and the two single-modality features in the test set of the measured data. The results are shown in Figure 16. Qualitatively, the figure shows that the proposed fusion method yields a better feature distribution, further confirming the effectiveness of the proposed fusion method over single-modality recognition.

Figure 16.
Visualization of three features in the test set of measured data: (a) HRRP; (b) Spectrogram; (c) Features obtained using the proposed fusion method. In these figures, the different colors represent samples from different categories.
5. Discussion
5.1. Comparison
Table 4 and Figure 13 show the comparison results between our proposed method and other fusion methods on the simulated data. Meanwhile, the comparison results on the measured data are shown in Table 6. From these tables, it is evident that our proposed method consistently outperforms other methods. The comparison experiments can be divided into two parts. First, when only using our proposed alignment method, due to our consideration of reducing the ambiguity of fused features, our method already shows certain superiority compared to some previous fusion methods. This can be seen from the first to the sixth rows of Table 4 and Table 6. Second, when we further applied a decision fusion module, the recognition accuracy improved even more. This is because decision fusion can integrate the output results of multiple classifiers to obtain more stable discrimination results, as shown in the sixth and seventh rows of Table 4 and Table 6.
5.2. Impact of Feature Alignment on Reducing Ambiguity
As mentioned in Section 3, our proposed feature alignment fusion method aims primarily to reduce the ambiguity of fused features. In this section, we quantitatively evaluate the impact of our feature alignment method on reducing ambiguity. When the ambiguity of fused features is minimized, their discriminability should be maximized. We measure this discriminability using the ratio of inter-class distance to intra-class distance (r) [8]. A larger ratio indicates higher discriminability, implying lower ambiguity. We conducted a quantitative analysis of the various comparison methods on the test set of the measured data, and the results are shown in Figure 17. The x-axis in the figure represents various fusion methods, while the y-axis indicates the ratio of inter-class distance to intra-class distance for the resulting fused features. From the figure, it is evident that the fused features obtained through our proposed alignment method have the highest discriminability compared to those obtained through other fusion methods. This demonstrates the effectiveness of our feature alignment method in reducing the ambiguity of fused features.
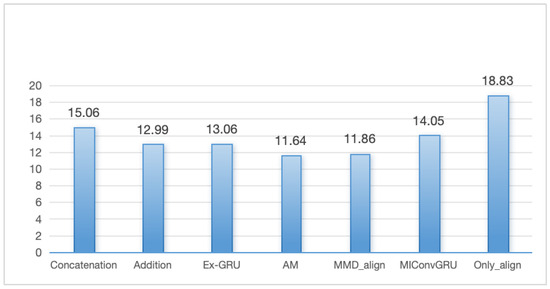
Figure 17.
Comparison of ratio of inter-class distance to intro distance with different methods.
5.3. Future Work
HRRP data often contain non-target areas, and when these regions are contaminated with noise, it can negatively affect recognition accuracy. This issue requires careful attention, as most current methods ignore the impact of redundant information in non-target areas on target recognition. In future research, we plan to focus on tackling this challenge.
6. Conclusions
In this study, we investigated the effectiveness of combining a time-domain HRRP with its spectrogram for ISAR ship target recognition. We introduced a hybrid deep fusion method that integrates these two modalities through feature alignment and decision fusion. At the feature-level fusion stage, the correlation between the two modalities and its effect on the ambiguity of the fused features were considered, and the alignment module was proposed to enhance the discriminability of the fused features, thereby improving recognition performance. Additionally, to leverage the advantages of hybrid fusion, a neural network-based decision fusion method was employed after the feature alignment module to further enhance prediction performance. The experimental validation on both simulated and measured datasets demonstrates the effectiveness of our approach in ship target recognition, highlighting its potential for practical applications.
Author Contributions
Conceptualization, J.D. and F.S.; methodology, J.D.; software, J.D.; validation, J.D.; formal analysis, J.D.; investigation, J.D.; resources, F.S.; data curation, J.D.; writing—original draft preparation, J.D.; writing—review and editing, J.D.; visualization, J.D. All authors have read and agreed to the published version of the manuscript.
Funding
This research received no external funding.
Data Availability Statement
The data are not publicly available due to the request of the data owner.
Acknowledgments
The authors would like to thank the editors and anonymous reviewers for their competent comments and suggestions to improve this article.
Conflicts of Interest
The authors declare no conflicts of interest.
References
- Du, C.; Chen, B.; Xu, B.; Guo, D.; Liu, H. Factorized discriminative conditional variational auto-encoder for radar HRRP target recognition. Signal Process. 2019, 158, 176–189. [Google Scholar] [CrossRef]
- Chen, Y.; Wang, S.; Luo, Y.; Liu, H. Measurement matrix optimization based on target prior information for radar imaging. IEEE Sens. J. 2023, 23, 9808–9819. [Google Scholar] [CrossRef]
- Xu, G.; Zhang, B.; Yu, H.; Chen, J.; Xing, M.; Hong, W. Sparse synthetic aperture radar imaging from compressed sensing and machine learning: Theories, applications, and trends. IEEE Geosci. Remote Sens. Mag. 2022, 10, 32–69. [Google Scholar] [CrossRef]
- Deng, J.; Su, F. SDRnet: A Deep Fusion Network for ISAR Ship Target Recognition Based on Feature Separation and Weighted Decision. Remote Sens. 2024, 16, 1920. [Google Scholar] [CrossRef]
- He, Y.; Yang, H.; He, H.; Yin, J.; Yang, J. A ship discrimination method based on high-frequency electromagnetic theory. Remote Sens. 2022, 14, 3893. [Google Scholar] [CrossRef]
- Zeng, Z.; Sun, J.; Han, Z.; Hong, W. Radar HRRP target recognition method based on multi-input convolutional gated recurrent unit with cascaded feature fusion. IEEE Geosci. Remote Sens. Lett. 2022, 19, 1–5. [Google Scholar] [CrossRef]
- Xing, M.; Bao, Z.; Pei, B. Properties of high-resolution range profiles. Opt. Eng. 2002, 41, 493–504. [Google Scholar] [CrossRef]
- Chen, J.; Du, L.; Guo, G.; Yin, L.; Wei, D. Target-attentional CNN for radar automatic target recognition with HRRP. Signal Process. 2022, 196, 108497. [Google Scholar] [CrossRef]
- Pilcher, C.M.; Khotanzad, A. Maritime ATR using classifier combination and high resolution range profiles. IEEE Trans. Aerosp. Electron. Syst. 2011, 47, 2558–2573. [Google Scholar] [CrossRef]
- Wang, Y.; Zhang, L.; Wang, S.; Zhao, T.; Wang, Y.; Li, Y. Radar HRRP target recognition using scattering centers fuzzy matching. In Proceedings of the 2016 CIE International Conference on Radar (RADAR), Philadelphia, PA, USA, 2–6 May 2016; pp. 1–5. [Google Scholar]
- Zhou, D. Radar target HRRP recognition based on reconstructive and discriminative dictionary learning. Signal Process. 2016, 126, 52–64. [Google Scholar] [CrossRef]
- Jiang, Y.; Han, Y.; Sheng, W. Target recognition of radar HRRP using manifold learning with feature weighting. In Proceedings of the 2016 IEEE International Workshop on Electromagnetics: Applications and Student Innovation Competition (iWEM), Nanjing, China, 16–18 May 2016; pp. 1–3. [Google Scholar]
- Liu, M.; Zou, Z.; Hao, M. Radar target recognition based on combined features of high range resolution profiles. In Proceedings of the 2009 2nd Asian-Pacific Conference on Synthetic Aperture Radar, Xi’an, China, 26–30 October 2009; pp. 876–879. [Google Scholar]
- Lundén, J.; Koivunen, V. Deep learning for HRRP-based target recognition in multistatic radar systems. In Proceedings of the 2016 IEEE Radar Conference (RadarConf), Philadelphia, PA, USA, 2–6 May 2016; pp. 1–6. [Google Scholar]
- Li, J.; Li, S.; Liu, Q.; Mei, S. A novel algorithm for HRRP target recognition based on CNN. In IoT as a Service, Proceedings of the 5th EAI International Conference, IoTaaS 2019, Xi’an, China, 16–17 November 2019; Proceedings 5; Springer: Cham, Switzarland, 2020; pp. 397–404. [Google Scholar]
- Feng, B.; Chen, B.; Liu, H. Radar HRRP target recognition with deep networks. Pattern Recognit. 2017, 61, 379–393. [Google Scholar] [CrossRef]
- Liao, L.; Du, L.; Chen, J. Class factorized complex variational auto-encoder for HRR radar target recognition. Signal Process. 2021, 182, 107932. [Google Scholar] [CrossRef]
- Yu, S.H.; Xie, Y.J. Application of a convolutional autoencoder to half space radar hrrp recognition. In Proceedings of the 2018 International Conference on Wavelet Analysis and Pattern Recognition (ICWAPR), Chengdu, China, 15–18 July 2018; pp. 48–53. [Google Scholar]
- Xu, B.; Chen, B.; Wan, J.; Liu, H.; Jin, L. Target-aware recurrent attentional network for radar HRRP target recognition. Signal Process. 2019, 155, 268–280. [Google Scholar] [CrossRef]
- Du, C.; Tian, L.; Chen, B.; Zhang, L.; Chen, W.; Liu, H. Region-factorized recurrent attentional network with deep clustering for radar HRRP target recognition. Signal Process. 2021, 183, 108010. [Google Scholar] [CrossRef]
- Wang, P.; Chen, T.; Ding, J.; Pan, M.; Tang, S. Intelligent radar HRRP target recognition based on CNN-BERT model. EURASIP J. Adv. Signal Process. 2022, 2022, 89. [Google Scholar] [CrossRef]
- Wang, X.; Wang, P.; Song, Y.; Li, J. Recognition of HRRP sequence based on TCN with attention and elastic net regularization. In Proceedings of the 2022 International Conference on Image Processing, Computer Vision and Machine Learning (ICICML), Xi’an, China, 28–30 October 2022; pp. 346–351. [Google Scholar]
- Diao, Y.; Liu, S.; Gao, X.; Liu, A. Position embedding-free transformer for radar HRRP target recognition. In Proceedings of the IGARSS 2022-2022 IEEE International Geoscience and Remote Sensing Symposium, Kuala Lumpur, Malaysia, 17–22 July 2022; pp. 1896–1899. [Google Scholar]
- Wan, J.; Chen, B.; Xu, B.; Liu, H.; Jin, L. Convolutional neural networks for radar HRRP target recognition and rejection. EURASIP J. Adv. Signal Process. 2019, 2019, 5. [Google Scholar] [CrossRef]
- Tao, Y.; Quan, P.; Yuhang, H.; Rong, X. Target recognition algorithm based on HRRP time-spectrogram feature and multi-scale asymmetric convolutional neural network. Xibei Gongye Daxue Xuebao/J. Northwestern Polytech. Univ. 2023, 41, 537–545. [Google Scholar]
- Wan, J.; Chen, B.; Yuan, Y.; Liu, H.; Jin, L. Radar HRRP recognition using attentional CNN with multi-resolution spectrograms. In Proceedings of the 2019 International Radar Conference (RADAR), Toulon, France, 23–27 September 2019; pp. 1–4. [Google Scholar]
- Pan, M.; Du, L.; Wang, P.; Liu, H.; Bao, Z. Multi-task hidden Markov modeling of spectrogram feature from radar high-resolution range profiles. EURASIP J. Adv. Signal Process. 2012, 2012, 86. [Google Scholar] [CrossRef]
- Jiang, L.; Yan, L.; Xia, Y.; Guo, Q.; Fu, M.; Lu, K. Asynchronous multirate multisensor data fusion over unreliable measurements with correlated noise. IEEE Trans. Aerosp. Electron. Syst. 2017, 53, 2427–2437. [Google Scholar] [CrossRef]
- Rasti, B.; Ghamisi, P.; Plaza, J.; Plaza, A. Fusion of hyperspectral and LiDAR data using sparse and low-rank component analysis. IEEE Trans. Geosci. Remote Sens. 2017, 55, 6354–6365. [Google Scholar] [CrossRef]
- Bassford, M.; Painter, B. Intelligent bio-environments: Exploring fuzzy logic approaches to the honeybee crisis. In Proceedings of the 2016 12th International Conference on Intelligent Environments (IE), London, UK, 14–16 September 2016; pp. 202–205. [Google Scholar]
- Zhang, Y.; Xie, Y.; Kang, L.; Li, K.; Luo, Y.; Zhang, Q. Feature-Level Fusion Recognition of Space Targets with Composite Micromotion. IEEE Trans. Aerosp. Electron. Syst. 2023, 60, 934–951. [Google Scholar] [CrossRef]
- Chen, B.; Liu, H.W.; Bao, Z. Analysis of three kinds of classification based on different absolute alignment methods. Xiandai Leida (Mod. Radar) 2006, 28, 58–62. [Google Scholar]
- Zhai, Y.; Chen, B.; Zhang, H.; Wang, Z. Robust variational auto-encoder for radar HRRP target recognition. In Intelligence Science and Big Data Engineering, Proceedings of the 7th International Conference, IScIDE 2017, Dalian, China, 22–23 September 2017; Proceedings 6; Springer: Cham, Switzerland, 2017; pp. 356–367. [Google Scholar]
- Du, L.; Liu, H.; Bao, Z.; Zhang, J. Radar automatic target recognition using complex high-resolution range profiles. IET Radar Sonar Navig. 2007, 1, 18–26. [Google Scholar] [CrossRef] [PubMed]
- Du, L.; Liu, H.; Bao, Z.; Xing, M. Radar HRRP target recognition based on higher order spectra. IEEE Trans. Signal Process. 2005, 53, 2359–2368. [Google Scholar]
- Xue, R.; Bai, X.; Zhou, F. SAISAR-Net: A robust sequential adjustment ISAR image classification network. IEEE Trans. Geosci. Remote Sens. 2021, 60, 1–15. [Google Scholar] [CrossRef]
- Ni, P.; Liu, Y.; Pei, H.; Du, H.; Li, H.; Xu, G. Clisar-net: A deformation-robust isar image classification network using contrastive learning. Remote Sens. 2022, 15, 33. [Google Scholar] [CrossRef]
- Bai, X.; Zhou, X.; Zhang, F.; Wang, L.; Xue, R.; Zhou, F. Robust pol-ISAR target recognition based on ST-MC-DCNN. IEEE Trans. Geosci. Remote Sens. 2019, 57, 9912–9927. [Google Scholar] [CrossRef]
- Zhao, W.; Heng, A.; Rosenberg, L.; Nguyen, S.T.; Hamey, L.; Orgun, M. ISAR ship classification using transfer learning. In Proceedings of the 2022 IEEE Radar Conference (RadarConf22), New York, NY, USA, 21–25 March 2022; pp. 1–6. [Google Scholar]
- Chen, J.; Du, L.; He, H.; Guo, Y. Convolutional factor analysis model with application to radar automatic target recognition. Pattern Recognit. 2019, 87, 140–156. [Google Scholar] [CrossRef]
- Chen, S.; Wang, H.; Xu, F.; Jin, Y.Q. Target classification using the deep convolutional networks for SAR images. IEEE Trans. Geosci. Remote Sens. 2016, 54, 4806–4817. [Google Scholar] [CrossRef]
- Ioffe, S.; Szegedy, C. Batch normalization: Accelerating deep network training by reducing internal covariate shift. In Proceedings of the International Conference on Machine Learning, Lille, France, 6–11 July 2015; pp. 448–456. [Google Scholar]
- Glorot, X.; Bordes, A.; Bengio, Y. Deep sparse rectifier neural networks. In Proceedings of the fourteenth international conference on artificial intelligence and statistics. JMLR Workshop and Conference Proceedings, Fort Lauderdale, FL, USA, 11–13 April 2011; pp. 315–323. [Google Scholar]
- Srivastava, N.; Hinton, G.; Krizhevsky, A.; Sutskever, I.; Salakhutdinov, R. Dropout: A simple way to prevent neural networks from overfitting. J. Mach. Learn. Res. 2014, 15, 1929–1958. [Google Scholar]
- Tian, X.; Bai, X.; Zhou, F. Recognition of micro-motion space targets based on attention-augmented cross-modal feature fusion recognition network. IEEE Trans. Geosci. Remote Sens. 2023, 61, 1–9. [Google Scholar] [CrossRef]
- Wang, J.; Wang, Z.; Tao, D.; See, S.; Wang, G. Learning common and specific features for RGB-D semantic segmentation with deconvolutional networks. In Computer Vision–ECCV 2016, Proceedings of the 14th European Conference, Amsterdam, The Netherlands, 11–14 October 2016; Proceedings, Part V 14; Springer: Cham, Switzerland, 2016; pp. 664–679. [Google Scholar]
- Long, M.; Cao, Y.; Wang, J.; Jordan, M. Learning transferable features with deep adaptation networks. In Proceedings of the International Conference on Machine Learning, PMLR, Lille, France, 6–11 July 2015; pp. 97–105. [Google Scholar]
- Khosla, P.; Teterwak, P.; Wang, C.; Sarna, A.; Tian, Y.; Isola, P.; Maschinot, A.; Liu, C.; Krishnan, D. Supervised contrastive learning. Adv. Neural Inf. Process. Syst. 2020, 33, 18661–18673. [Google Scholar]
- Du, L.; Li, L.; Guo, Y.; Wang, Y.; Ren, K.; Chen, J. Two-stream deep fusion network based on VAE and CNN for synthetic aperture radar target recognition. Remote Sens. 2021, 13, 4021. [Google Scholar] [CrossRef]
- Van der Maaten, L.; Hinton, G. Visualizing data using t-SNE. J. Mach. Learn. Res. 2008, 9, 2579–2605. [Google Scholar]
Disclaimer/Publisher’s Note: The statements, opinions and data contained in all publications are solely those of the individual author(s) and contributor(s) and not of MDPI and/or the editor(s). MDPI and/or the editor(s) disclaim responsibility for any injury to people or property resulting from any ideas, methods, instructions or products referred to in the content. |
© 2024 by the authors. Licensee MDPI, Basel, Switzerland. This article is an open access article distributed under the terms and conditions of the Creative Commons Attribution (CC BY) license (https://creativecommons.org/licenses/by/4.0/).