Article

Estimation of Soil Salinity by Combining Spectral and Texture Information from UAV Multispectral Images in the Tarim River Basin, China

1
College of Agriculture, Tarim University, Alar 843300, China
2
College of Environment and Resources, Zhejiang University, Hangzhou 310058, China
3
Department of Earth System Science, Ministry of Education Key Laboratory for Earth System Modeling, Institute for Global Change Studies, Tsinghua University, Beijing 100084, China
4
Department of Land Resource Management, School of Public Finance and Public Administration, Jiangxi University of Finance and Economics, Nanchang 330013, China
5
College of Horticulture and Forestry, Tarim University, Alar 843300, China
6
Key Laboratory of Genetic Improvement and Efficient Production for Specialty Crops in Arid Southern Xinjiang of Xinjiang Corps, Alar 843300, China
*
Author to whom correspondence should be addressed.
Remote Sens. 2024, 16(19), 3671; https://doi.org/10.3390/rs16193671
Submission received: 16 August 2024 / Revised: 12 September 2024 / Accepted: 27 September 2024 / Published: 1 October 2024

Abstract

:
Texture features have been consistently overlooked in digital soil mapping, especially in soil salinization mapping. This study aims to clarify how to leverage texture information for monitoring soil salinization through remote sensing techniques. We propose a novel method for estimating soil salinity content (SSC) that combines spectral and texture information from unmanned aerial vehicle (UAV) images. Reflectance, spectral index, and one-dimensional (OD) texture features were extracted from UAV images. Building on the one-dimensional texture features, we constructed two-dimensional (TD) and three-dimensional (THD) texture indices. The technique of Recursive Feature Elimination (RFE) was used for feature selection. Models for soil salinity estimation were built using three distinct methodologies: Random Forest (RF), Partial Least Squares Regression (PLSR), and Convolutional Neural Network (CNN). Spatial distribution maps of soil salinity were then generated for each model. The effectiveness of the proposed method is confirmed through the utilization of 240 surface soil samples gathered from an arid region in northwest China, specifically in Xinjiang, characterized by sparse vegetation. Among all texture indices, TDTeI1 has the highest correlation with SSC (|r| = 0.86). After adding multidimensional texture information, the R2 of the RF model increased from 0.76 to 0.90, with an improvement of 18%. Among the three models, the RF model outperforms PLSR and CNN. The RF model, which combines spectral and texture information (SOTT), achieves an R2 of 0.90, RMSE of 5.13 g kg−1, and RPD of 3.12. Texture information contributes 44.8% to the soil salinity prediction, with the contributions of TD and THD texture indices of 19.3% and 20.2%, respectively. This study confirms the great potential of introducing texture information for monitoring soil salinity in arid and semi-arid regions.

1. Introduction

Soil salinization severely impacts agricultural production quality and environmental sustainability, thus emerging as a critical factor contributing to land degradation and biodiversity loss [1,2]. Globally, soil salinization affects over 100 countries worldwide, with over 1 × 10⁸ hectares of land impacted [3]. As an international environmental and ecological concern, soil salinization has garnered significant attention from both academic circles and governmental bodies. Therefore, it is vital to persistently track the salinization of soil and its spatial spread to gather accurate data essential for efficiently managing salinized soils in arid and semi-arid areas.
Traditional methods for estimating soil salt, which involve extensive field sampling and subsequent laboratory quantitative analysis, require considerable time and effort. It is very difficult to monitor soil attributes at large scales [4]. Advancements in remote sensing (RS) technology have enabled the successful utilization of multispectral and hyperspectral satellite data from the Landsat, Sentinel, and Gaofen series for extensive soil salinization monitoring [5,6,7,8]. RS technology is acknowledged for its efficiency in monitoring the salinization of soil [9]. However, the spatial resolution usually decreases with an increase in the expanded spatial coverage of satellite sensors, which limits the accuracy of SSC estimation [10]. Additionally, the quality of satellite remote sensing images is significantly affected by cloud coverage [11]. UAV platforms help obtain high-quality and high-resolution images with operational flexibility by combining multispectral, hyperspectral, and LiDAR sensors. In digital soil mapping at the field scale, UAV sensors are widely used for high-precision soil attribute estimation, independent of weather conditions [12,13,14]. However, studies on SSC monitoring using texture features from UAV sensors are scarce. Previous studies have focused on extracting soil spectral information from UAV remote sensing. Therefore, further investigating the correlation between texture characteristics and soil salt content through UAV images can significantly enhance the precision of salinization monitoring.
Many studies have consistently shown that the integration of spectral and texture features enhances the precision of soil attributes and biomass estimation [15,16]. The spectral characteristics of soil closely resemble its salinity, an essential property that characterizes it [17]. In terms of the relationship between spectral characteristics and SSC, under salt stress, certain salt-tolerant plants modify the general spectral properties of saline soil [18], especially in the green and red bands. Employing salt-sensitive bands to derive vegetation indices, specifically NDVI, as indirect markers for assessing soil salinity showed high correlations between these indices and soil salinity degrees [19]. In addition, the salinity index is strongly correlated with soil salinity levels [20,21]. Current studies on estimating soil salinity have mainly focused on using soil spectral features as Supplementary Datasets or extracting spectral data to develop multidimensional spectral indices [5]. Soils in arid regions face a severe salinization degree, and salts easily accumulate in the topsoil and form salt spots and crusts due to high evaporation, scarce precipitation, and bare soil conditions [22,23]. In areas where the soil is bare and salt accumulates at the top of the soil, the salt crust with different thicknesses shows different brightness and texture characteristics. The spatial distribution of soil attributes, including the soil texture and surface-covering shape, can be effectively characterized by texture features, which can reflect the structural information of the image grayscale distribution [24,25]. Therefore, texture features can also characterize the salinization status of the soil. Digging these texture features holds considerable potential for soil type identification and high-precision digital mapping of soil salt.
The texture features of soil are often more challenging to quantify than spectral information, as they vary in pattern, shape, and size [16]. The Gray-Level Co-occurrence Matrix (GLCM) has been extensively utilized for the extraction of texture features [26,27,28]. The extraction of texture features through various GLCM parameters exerts a notable impact on the accuracy of land cover classification, particularly with regard to window size [29,30]. To date, numerous studies have utilized texture information from remote sensing images for land cover classification and biomass monitoring [31]. However, research analyzing the impact of different window sizes on the accuracy of soil salinity estimation based on texture features extracted from UAV multispectral images has rarely been reported. Additionally, constructing a multidimensional index is an effective approach to enhance the estimation accuracy [5,32]. Hence, this research delves into the impact of different window sizes on SSC prediction and compares the correlation of two-dimensional and three-dimensional texture index constructed at different window sizes with SSC.
This study combined spectral and texture data extracted from UAV images and introduced a novel approach to create two-dimensional and three-dimensional texture indices for accurately assessing soil salinity. Spectral reflectance, vegetation index, and salinity index are chosen as spectral information. Forty texture features from different bands were extracted using the optimal window size of the GLCM method and six newly constructed two-dimensional and three-dimensional texture indexes as texture information. The main objectives were: (1) to analyze the impact of texture features extracted by different window sizes on SSC estimation; (2) to construct two-dimensional and three-dimensional texture indices; (3) to analyze the correlation between multidimensional texture index and SSC; and (4) to evaluate the potential improvement of soil salinization prediction accuracy using texture information.

2. Materials and Methods

This study aimed to precisely assess SSC in the arid regions of southern Xinjiang, China, by examining the impact of spectral and texture information on SSC monitoring through UAV remote sensing technology. Firstly, the reflectance and spectral index were extracted at each sampling point to construct the spectral information dataset. Subsequently, texture information was extracted using GLCM, including one-dimensional texture features and the newly constructed two-dimensional and three-dimensional texture indices. The RFE method was used to select feature variables, which were then used to run soil salinity prediction models based on seven different datasets: (1) spectral information (SPI), (2) one-dimensional texture features (OD), (3) two-dimensional texture index (TD), (4) three-dimensional texture index (THD), (5) spectral information + one-dimensional texture features (SO), (6) spectral information + one-dimensional texture features + two-dimensional texture index (SOT), and (7) spectral information + one-dimensional texture features + two-dimensional texture index + three-dimensional texture index (SOTT). We used the models constructed by PLSR, RF, and CNN to predict SSC. Furthermore, we calculated the relative importance of various input variables to evaluate the influence of each feature variable on the accuracy of SSC prediction. Finally, a fine map of SSC was produced (Figure 1).

2.1. Study Area

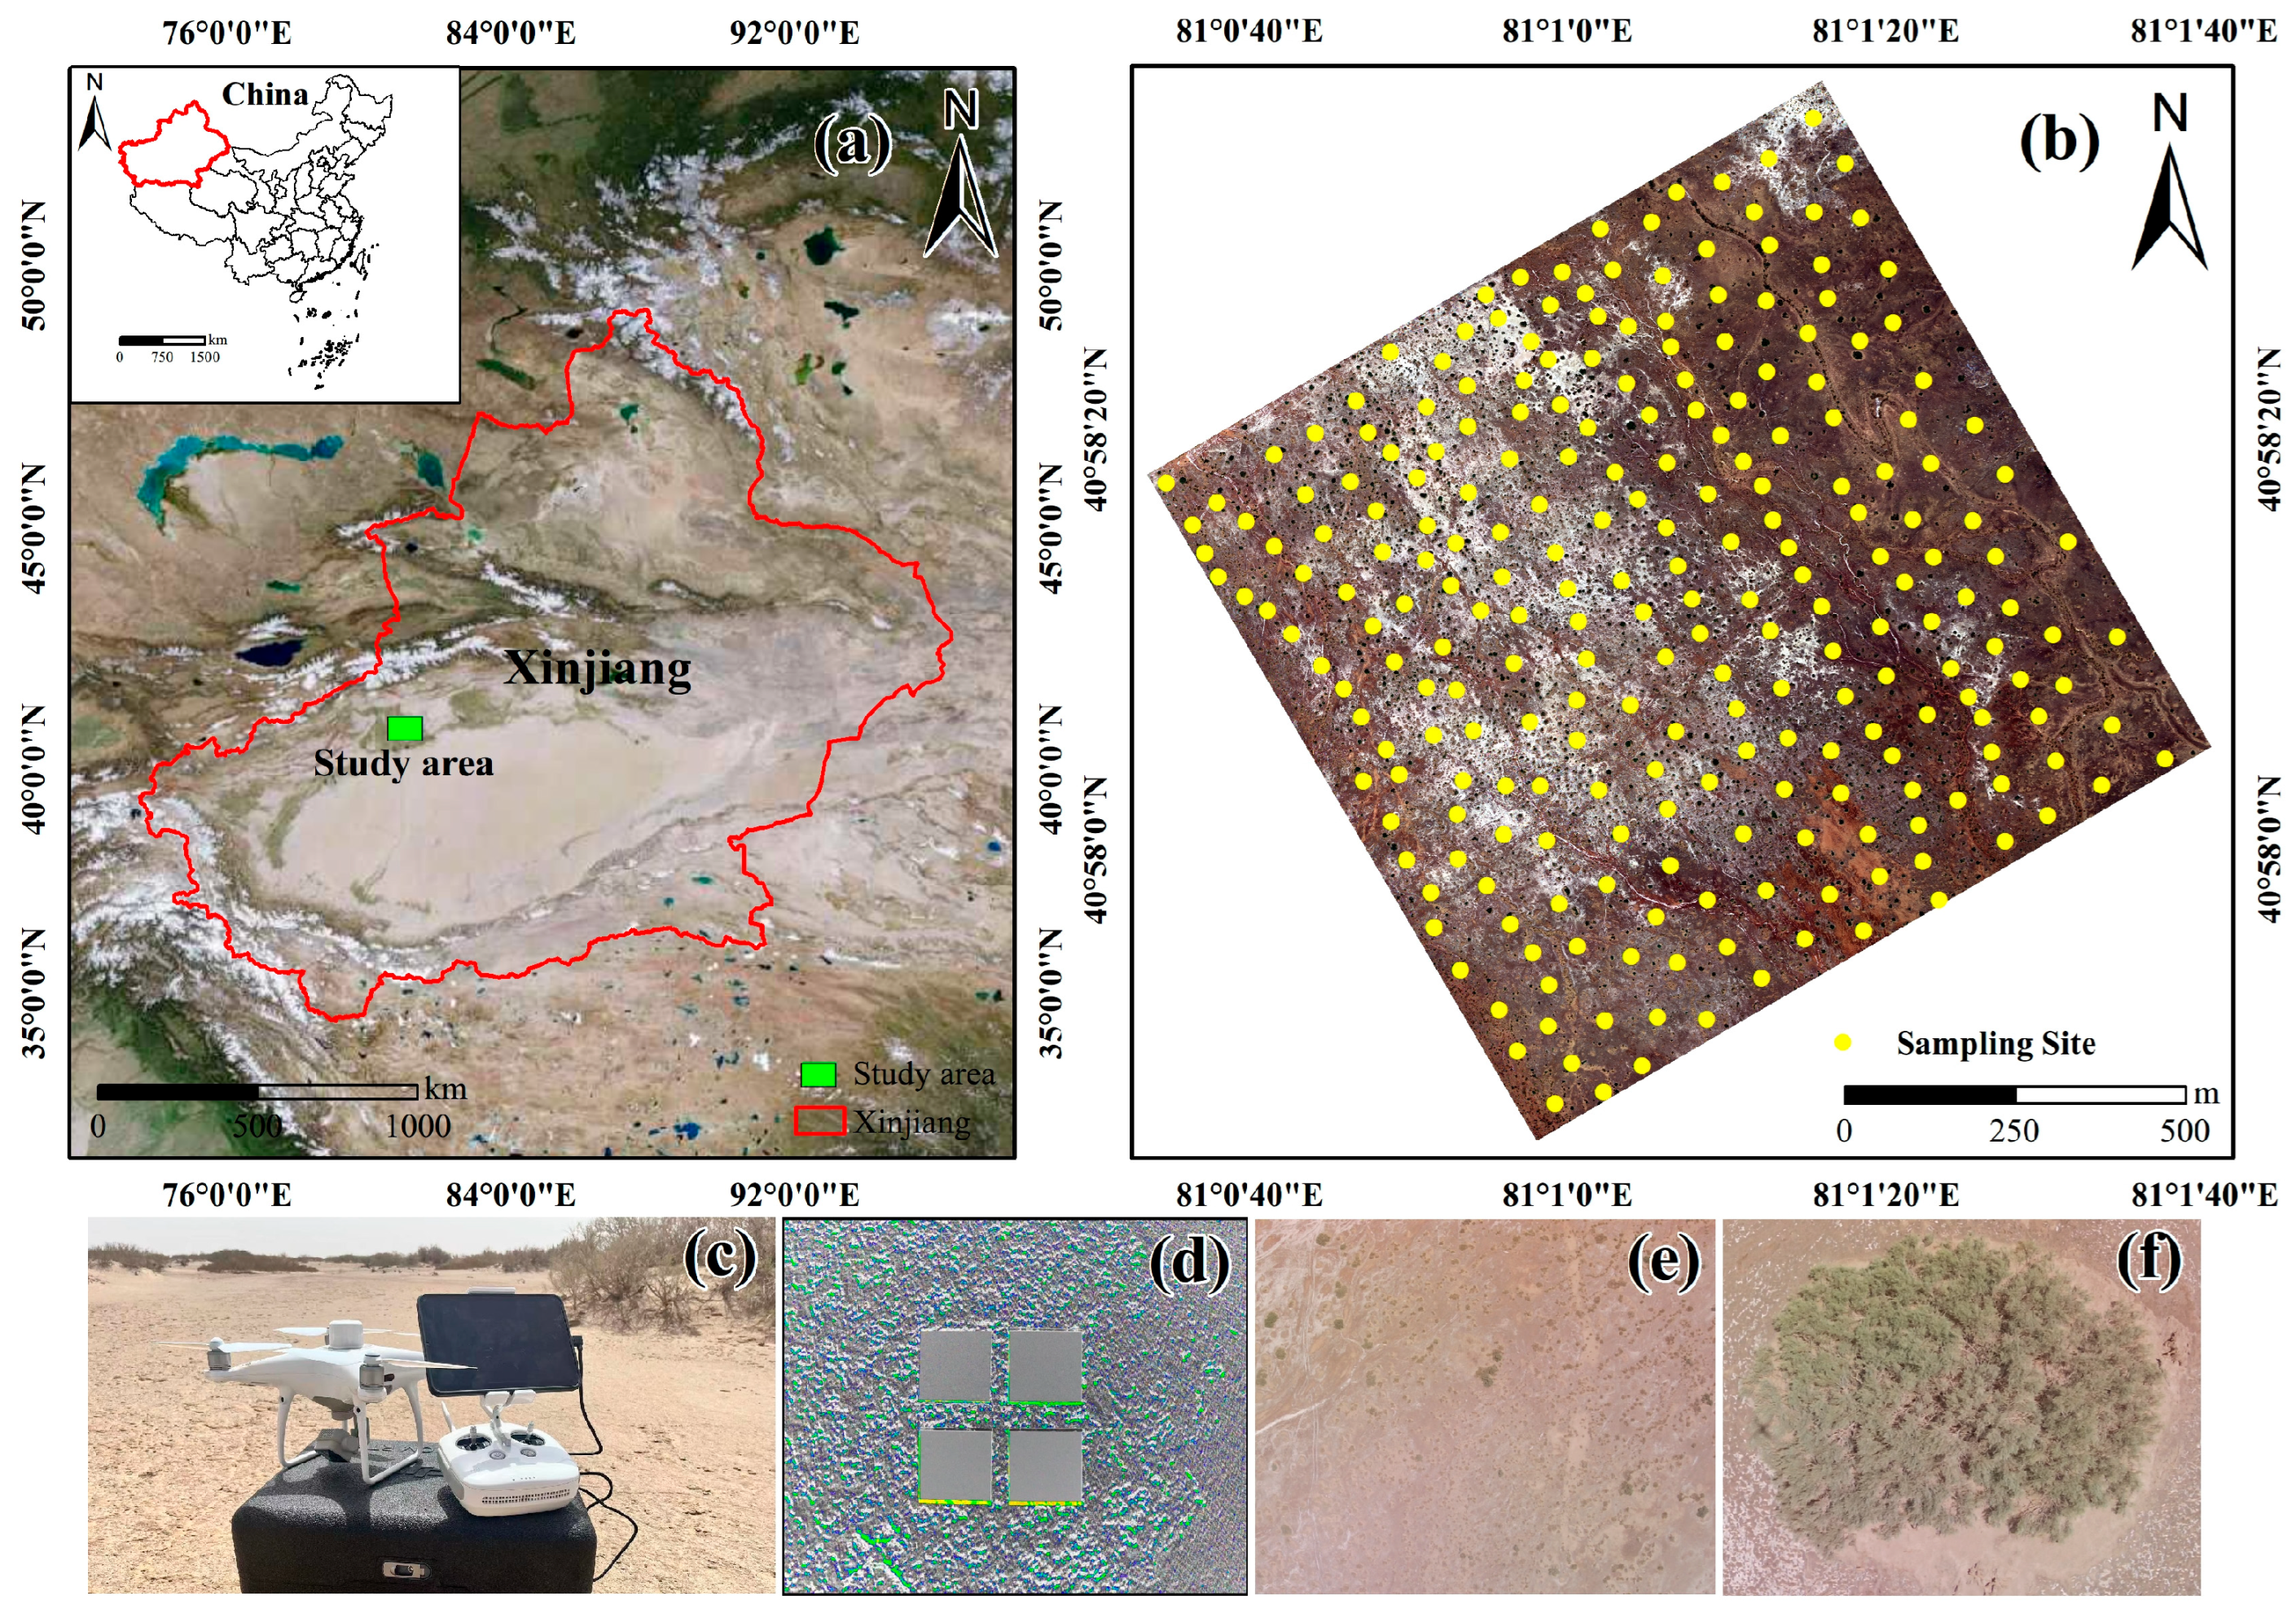
Kongtailik Ranch in Wensu County, Aksu Prefecture, southern Xinjiang, was selected as the study area (40°40′–41°32′N, 80°36′–81°41′E). The UAV flight experiment and soil sampling were conducted in a sparse vegetation region with an area of 1.3 km2 (Figure 2). The study region exhibits a typical continental warm temperate arid climate. With an average annual precipitation ranging from 46.4 to 64.5 mm, it contrasts sharply with an average annual evaporation spanning from 1992.0 to 2863.4 mm. The evapotranspiration ratio in this area is approximately 40 [33]. The study region has abundant solar and thermal energy resources, with a mean annual solar radiation ranging from 544 to 590 kJ cm−2, an annual sunshine duration spanning between 2855 and 2967 h, and a frost-free period of 205 to 219 days. The study area is predominantly desert land use, with vegetation coverage of less than 10%, and the vegetation is mainly salt-tolerant vegetation, such as Halostachys caspica, Tamarix chinensis Lour, and reed. The elevation varies from 960 to 1406 m. The terrain slopes toward the higher ground in the northern and western regions, while it slopes toward the lower ground in the southern and eastern areas. Additionally, the soil salinization degree follows a trend of increasing and decreasing from south to north. In recent years, due to the growth of the local population and the demands of economic development, a significant portion of salt-affected land in the southern region of the study area has been reclaimed as farmland [2].

2.2. Data Collection

2.2.1. UAV Image Data Collection and Processing

The UAV flight survey was conducted on a cloudless and windless day on 16 July 2023. The Phantom 4 Pro Multispectral UAV, produced by DJI Innovations in Shenzhen and equipped with a 6-channel integrated multispectral camera, was used to capture images; the detailed parameters are shown in Table 1. The positioning system of the UAVs enables seamless connectivity with the D-RTK 2 Mobile Station of High-Precision GNSS and RTK network. It uses the TimeSync synchronization system, which synchronizes the clocks of the flight controller, camera, and RTK to the microsecond level, achieving millisecond-level imaging accuracy and providing real-time centimeter-level positioning data. The DJI GS Pro Ground Station Pro application (IOS, v.2.2) was used for flight route planning and executing automated flight missions. To obtain high-resolution UAV images, the flight altitude was set at 200 m (with an image resolution of 12 cm). The forward overlap was 80%, and the side overlap was 75%. Image reflectance calibration was performed using a whiteboard prior to flight. During the flight, all settings were kept constant until the mission was completed.
Using Pix4Denterprise software (v.4.5.6), the UAV-captured images were processed and seamlessly merged. This included initialization processing, point cloud and texture generation, DSM, and orthomosaic image creation. The stitched multispectral images were imported into ENVI 5.3 software for layer stacking and wavelength processing for further analysis.

2.2.2. Ground-Measured Data

Using random sampling, 240 topsoil samples were gathered from depths ranging between 0 and 20 cm (Figure 2). During sampling, the exact locations of the sampling points were precisely recorded using the Trimble Global Positioning System (GPS), achieving an accuracy of up to 10 cm.
The soil samples were collected and subsequently cleaned to remove any plant debris, roots, and stones. They were then air-dried indoors, ground up, and finally passed through a 2 mm mesh [34]. The SSC was determined through the gravimetric method [35], employing a soil-to-water ratio of 1:5.

2.3. Feature Window Size

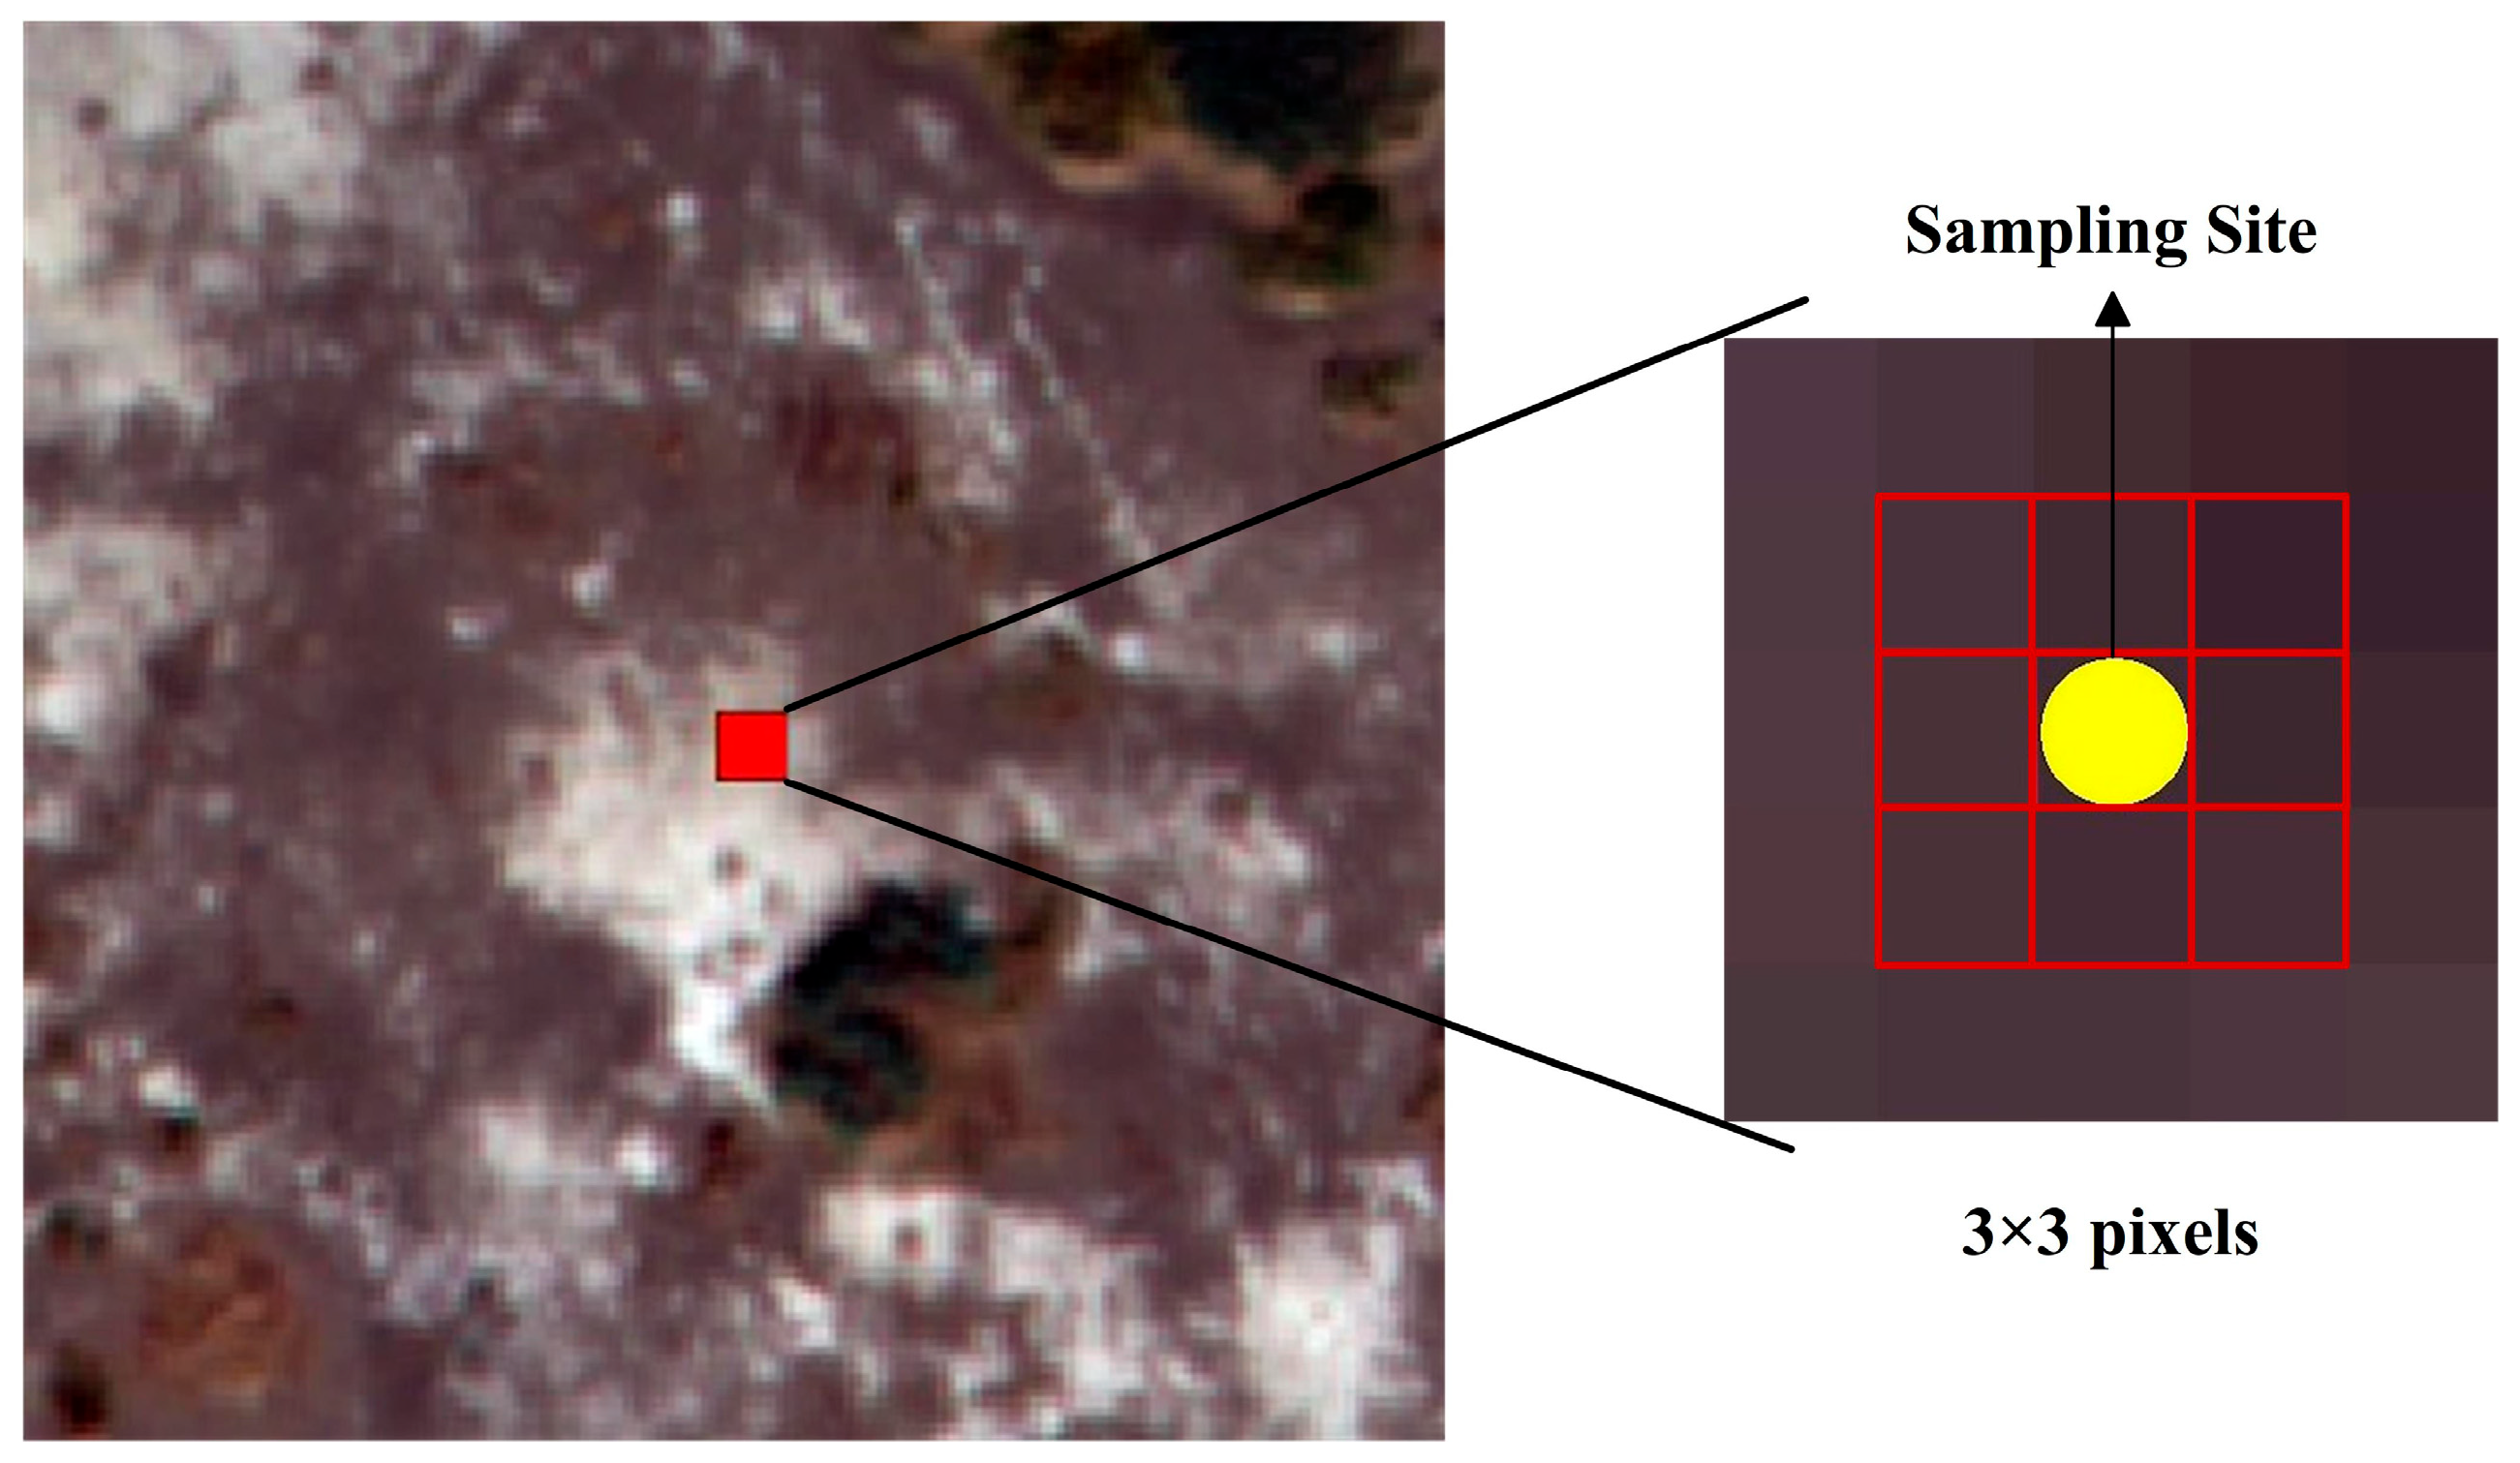
The window size of the features is crucial for extracting the texture characteristics. To ensure the effective estimation of soil salinity using texture features extracted from UAV images, it is important to determine the appropriate GLCM window size. Hence, this study aimed to assess the influence of various feature window sizes, including 3 × 3, 5 × 5, 7 × 7, 9 × 9, and 11 × 11 pixels, on the precision of soil salinity estimation (Figure 3).

2.4. Spectral and Texture Features Extraction

Spectral information includes single-band reflectance and complex spectral index [36], which have long been considered effective predictors for digital mapping of SSC [37]. The spectral information includes 12 commonly used indices for monitoring soil salinization (Table 2): spectral reflectance (B, G, R, RE, NIR), NDVI, soil-adjusted vegetation index (SAVI), difference vegetation index (DVI), salinity index 1 (SI1), salinity index 2 (SI2), salinity index 3 (SI3), and salinity index 4 (SI4).
Texture information was extracted using the GLCM method [38]. We chose 8 statistical features, which include Mean (MEA), Homogeneity (HOM), Variance (VAR), Dissimilarity (DIS), Contrast (CON), Entropy (ENT), Second Moment (SEM), and Correlation (COR). The texture features were calculated for five spectral bands (B, G, R, RE, and NIR) based on the optimal window size. This resulted in a total of forty features being extracted from the UAV images using ENVI 5.3.

2.5. Construction of the Texture Index

Obtaining indicators of soil salt from remote sensing data is a challenging task. Therefore, many scholars have used the GLCM method to extract single-band texture features as an indirect method for assessing soil salinity levels [16,39]. Constructing a multidimensional index is conducive to strengthening the reflection characteristics of different bands for soil salinization [5]. Therefore, in this work, we constructed a two-dimensional and three-dimensional texture index using mathematical calculations according to the form of the previous index.

2.5.1. Two-Dimensional Texture Index

To create the difference texture index (DTeI), normalized difference texture index (NDTeI), and ratio index (RTeI) within the two-dimensional (TD) texture index, we drew upon the mathematical calculations of the salinity and vegetation index as references. We extracted 40 texture features from the GLCM using a 3 × 3 pixel window size and calculated the TD texture index based on Equations (1)–(3):
D T e I = T 1 T 2
N D T e I = T 1 T 2 T 1 + T 2
R T e I = T 1 T 2
where T1 and T2 are the texture feature values of different bands, with T1 ≠ T2.

2.5.2. Three-Dimensional Texture Index

In this research, three types of three-dimensional texture indexes (TDTeIs) were constructed based on forty texture features extracted using a 3 × 3 pixel window size. The calculation process is based on Equations (4)–(6):
T D T e I 1 = T 1 T 2 T 1 + T 3
T D T e I 2 = T 1 T 2 + T 3
T D T e I 3 = T 1 T 2 T 1 T 2 T 2 + T 3
where T1, T2, and T3 are texture feature values of different bands, with T1 ≠ T2 ≠ T3.

2.6. Feature Selection

Choosing specific features is frequently employed to minimize repetitive data and enhance the accuracy of estimating soil properties [40,41]. Recursive Feature Elimination (RFE) is a method of ranking features by identifying the most pertinent ones [42]. Within RFE, the “sbf” function’s control parameters are formulated through the Naive Bayesian function, utilizing ridge regression as the foundational model.
This research involved inputting all spectral data, one-dimensional texture characteristics, two-dimensional texture indices, and three-dimensional texture indices into the RFE algorithm for selection. The importance of the variable factors screened by VIP analysis was used to calculate the score for each factor and finally normalize it.

2.7. Estimation Model Strategies

2.7.1. Modeling

This study used 2/3 of the total samples for model training, and 1/3 were used for validation. This study conducts a comparative analysis of three modeling approaches: statistical methods, machine learning, and deep learning. Using the RFE algorithm for feature selection, PLSR represents a statistical model, RF represents a machine learning model, and CNN represents a deep learning model.
Parameter optimization is a critical process for ensuring model accuracy. In the RFE algorithm, the iterative process uses ridge regularization regression (estimator = ridge) as the base mode [43], with a step value of 1. The selection of latent variables (LVs), number of principal components, and regularization parameter all impact the accuracy of the PLSR model [44]. The count of LVs was set to 18, with k-fold cross-validation (k = 10) used for model selection. Furthermore, L2 regularization was applied. The accuracy of the RF model depends heavily on the number of trees, their depth, and the technique employed for feature selection [45,46]. We employed 300 trees in an 18-depth configuration and optimized the feature count at each split by utilizing a grid search to attain superior performance. In the CNN model, we set the initial learning rate to 0.001 and conducted 300 iterations to enhance its accuracy.
All model training was conducted using PyCharm Community Edition 2021.1.2.

2.7.2. Accuracy Assessment

The model’s performance was assessed using the coefficient of determination (R2), root mean square error (RMSE), and ratio of performance to deviation (RPD) as metrics [47]. Higher R2 and RPD values, along with lower RMSE values, suggest a more accurate model. Conversely, lower R2 and RPD values, coupled with higher RMSE, indicate less accurate model performance. Providing a three-tier interpretation based on RPD values by Chang [48]: R2 < 0.60 and RPD < 1.4 indicate a poor model that is not recommended for use. 0.60 < R2< 0.75 and 1.4 < RPD < 2.0, indicating a moderately good model that can be used for evaluation. R2 > 0.75 and RPD > 2.0 indicate a very good model suitable for quantitative predictions.

3. Results

3.1. Descriptive Statistics of Soil Samples

Descriptive statistics of soil salinity and pH values for the 240 soil samples are shown in Table 3. The SSC ranges from 29.93 to 156.05 g kg−1, with a SD of 19.60 and a mean value of 86.38 g kg−1, indicating a high soil salinity level and severe soil salinization. The soil pH fluctuates between 7.34 and 8.36, with an average value of 8.13, signifying a marginally alkaline soil state. The CV for SSC is 22.85% in the calibration set, 22.52% in the validation set, and 22.69% in the total dataset. According to Allbed [49], CV is interpreted in three tiers: CV < 15% indicates low variability, 15% < CV < 36% indicates moderate variability, and CV > 36% indicates high variability. The CV value of SSC in the study area is 22.69%, indicating moderate variability. This indicates notable spatial variability in the distribution of soil salinity within the study area. The CV value for soil pH, which falls between 1.95% and 1.98%, suggests minimal spatial variability.

3.2. Estimation of Soil Salinity with Different Window Sizes

Using spectral information (SPI) and one-dimensional (OD) texture features extracted at different window sizes, we input these into an RF model to compute R², RMSE, and RPD. Throughout the calculation process, the spectral features remained constant. Among the five selected window sizes, the model has the highest accuracy (R2 = 0.76, RMSE = 8.47 g kg−1, RPD = 2.06) at 3 × 3 pixels (Figure 4). As the window size expands, the R2 and RPD values progressively decline, whereas the RMSE values increase (Figure 4). The model performance shows a decreasing trend with increasing window size. The soil surface structures (roughness and tone) caused by salinization are subtle features that require high-spatial resolution imagery to capture the fine differences in surface structure across varying levels of soil salinization. As the window size increases, the spatial resolution decreases, which weakens these subtle differences and makes it difficult to be accurately identified by texture information. This study effectively captures detailed differences in soil surface characteristics across varying degrees of salinization using a spatial resolution of 12 × 12 cm and a window size of 3 × 3 pixels. Therefore, subsequent calculations of the OD, TD, and THD texture indices all use a window size of 3 × 3 pixels.

3.3. Responses of Spectral Information to SSC

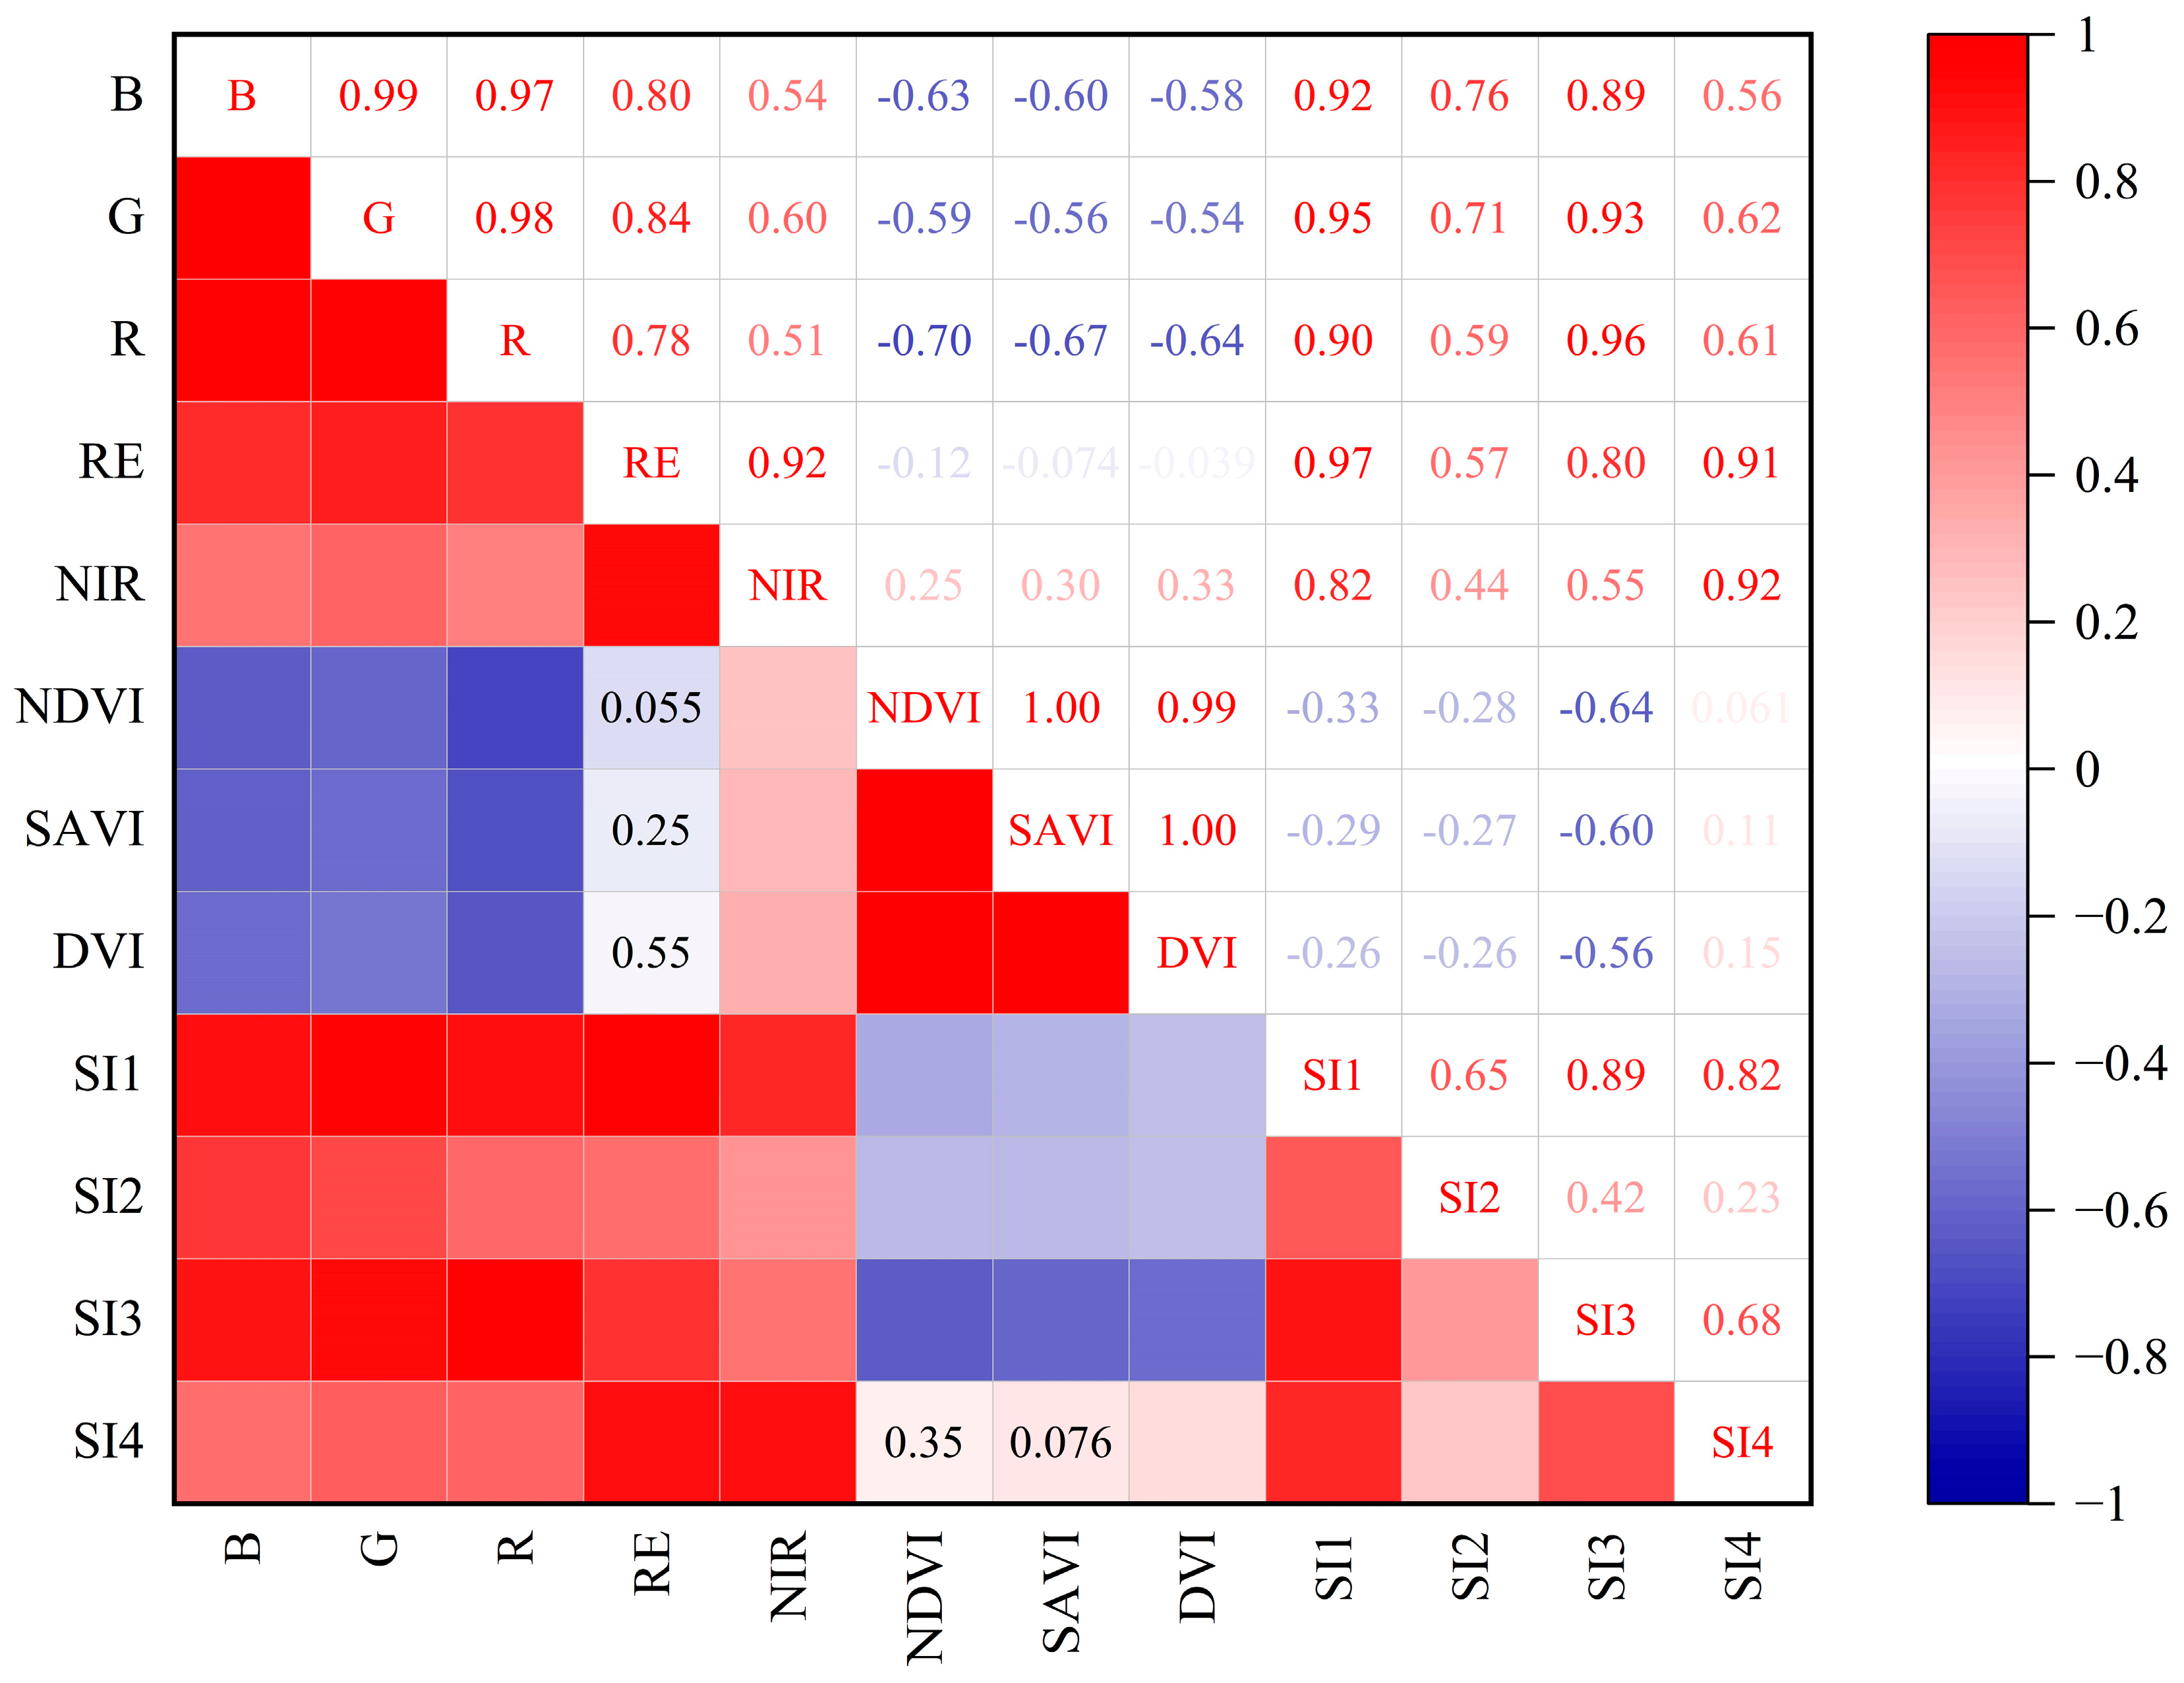
The correlation between spectral information (SPI) and SSC was calculated (Figure 5). For spectral reflectance, the R, B, and G bands demonstrate significant correlations with SSC, exhibiting correlation coefficients of approximately 0.73, 0.70, and 0.68, respectively. However, the RE and NIR bands exhibit weaker correlations with SSC, with absolute correlation coefficients below 0.40. Among the seven spectral indices, NDVI, SAVI, and DVI showed negative correlations with SSC, with |r| ranging from 0.82 to 0.84. NDVI shows the strongest correlation with SSC, with an |r| of 0.84. The four-salinity index shows positive correlations with SSC, with |r| ranging from 0.09 to 0.67. Among these indexes, SI4 exhibited the weakest correlation with SSC, with an absolute correlation coefficient less than 0.4 (|r| < 0.4), whereas SI3 exhibited the strongest correlation (|r| = 0.67). In summary, the correlation between the vegetation index and SSC is stronger than that between the reflectance and salinity index. Additionally, Figure 4 shows that these features have a high autocorrelation, indicating strong collinearity between the features. Therefore, it is necessary to apply variable selection.

3.4. Responses of Texture Information to SSC

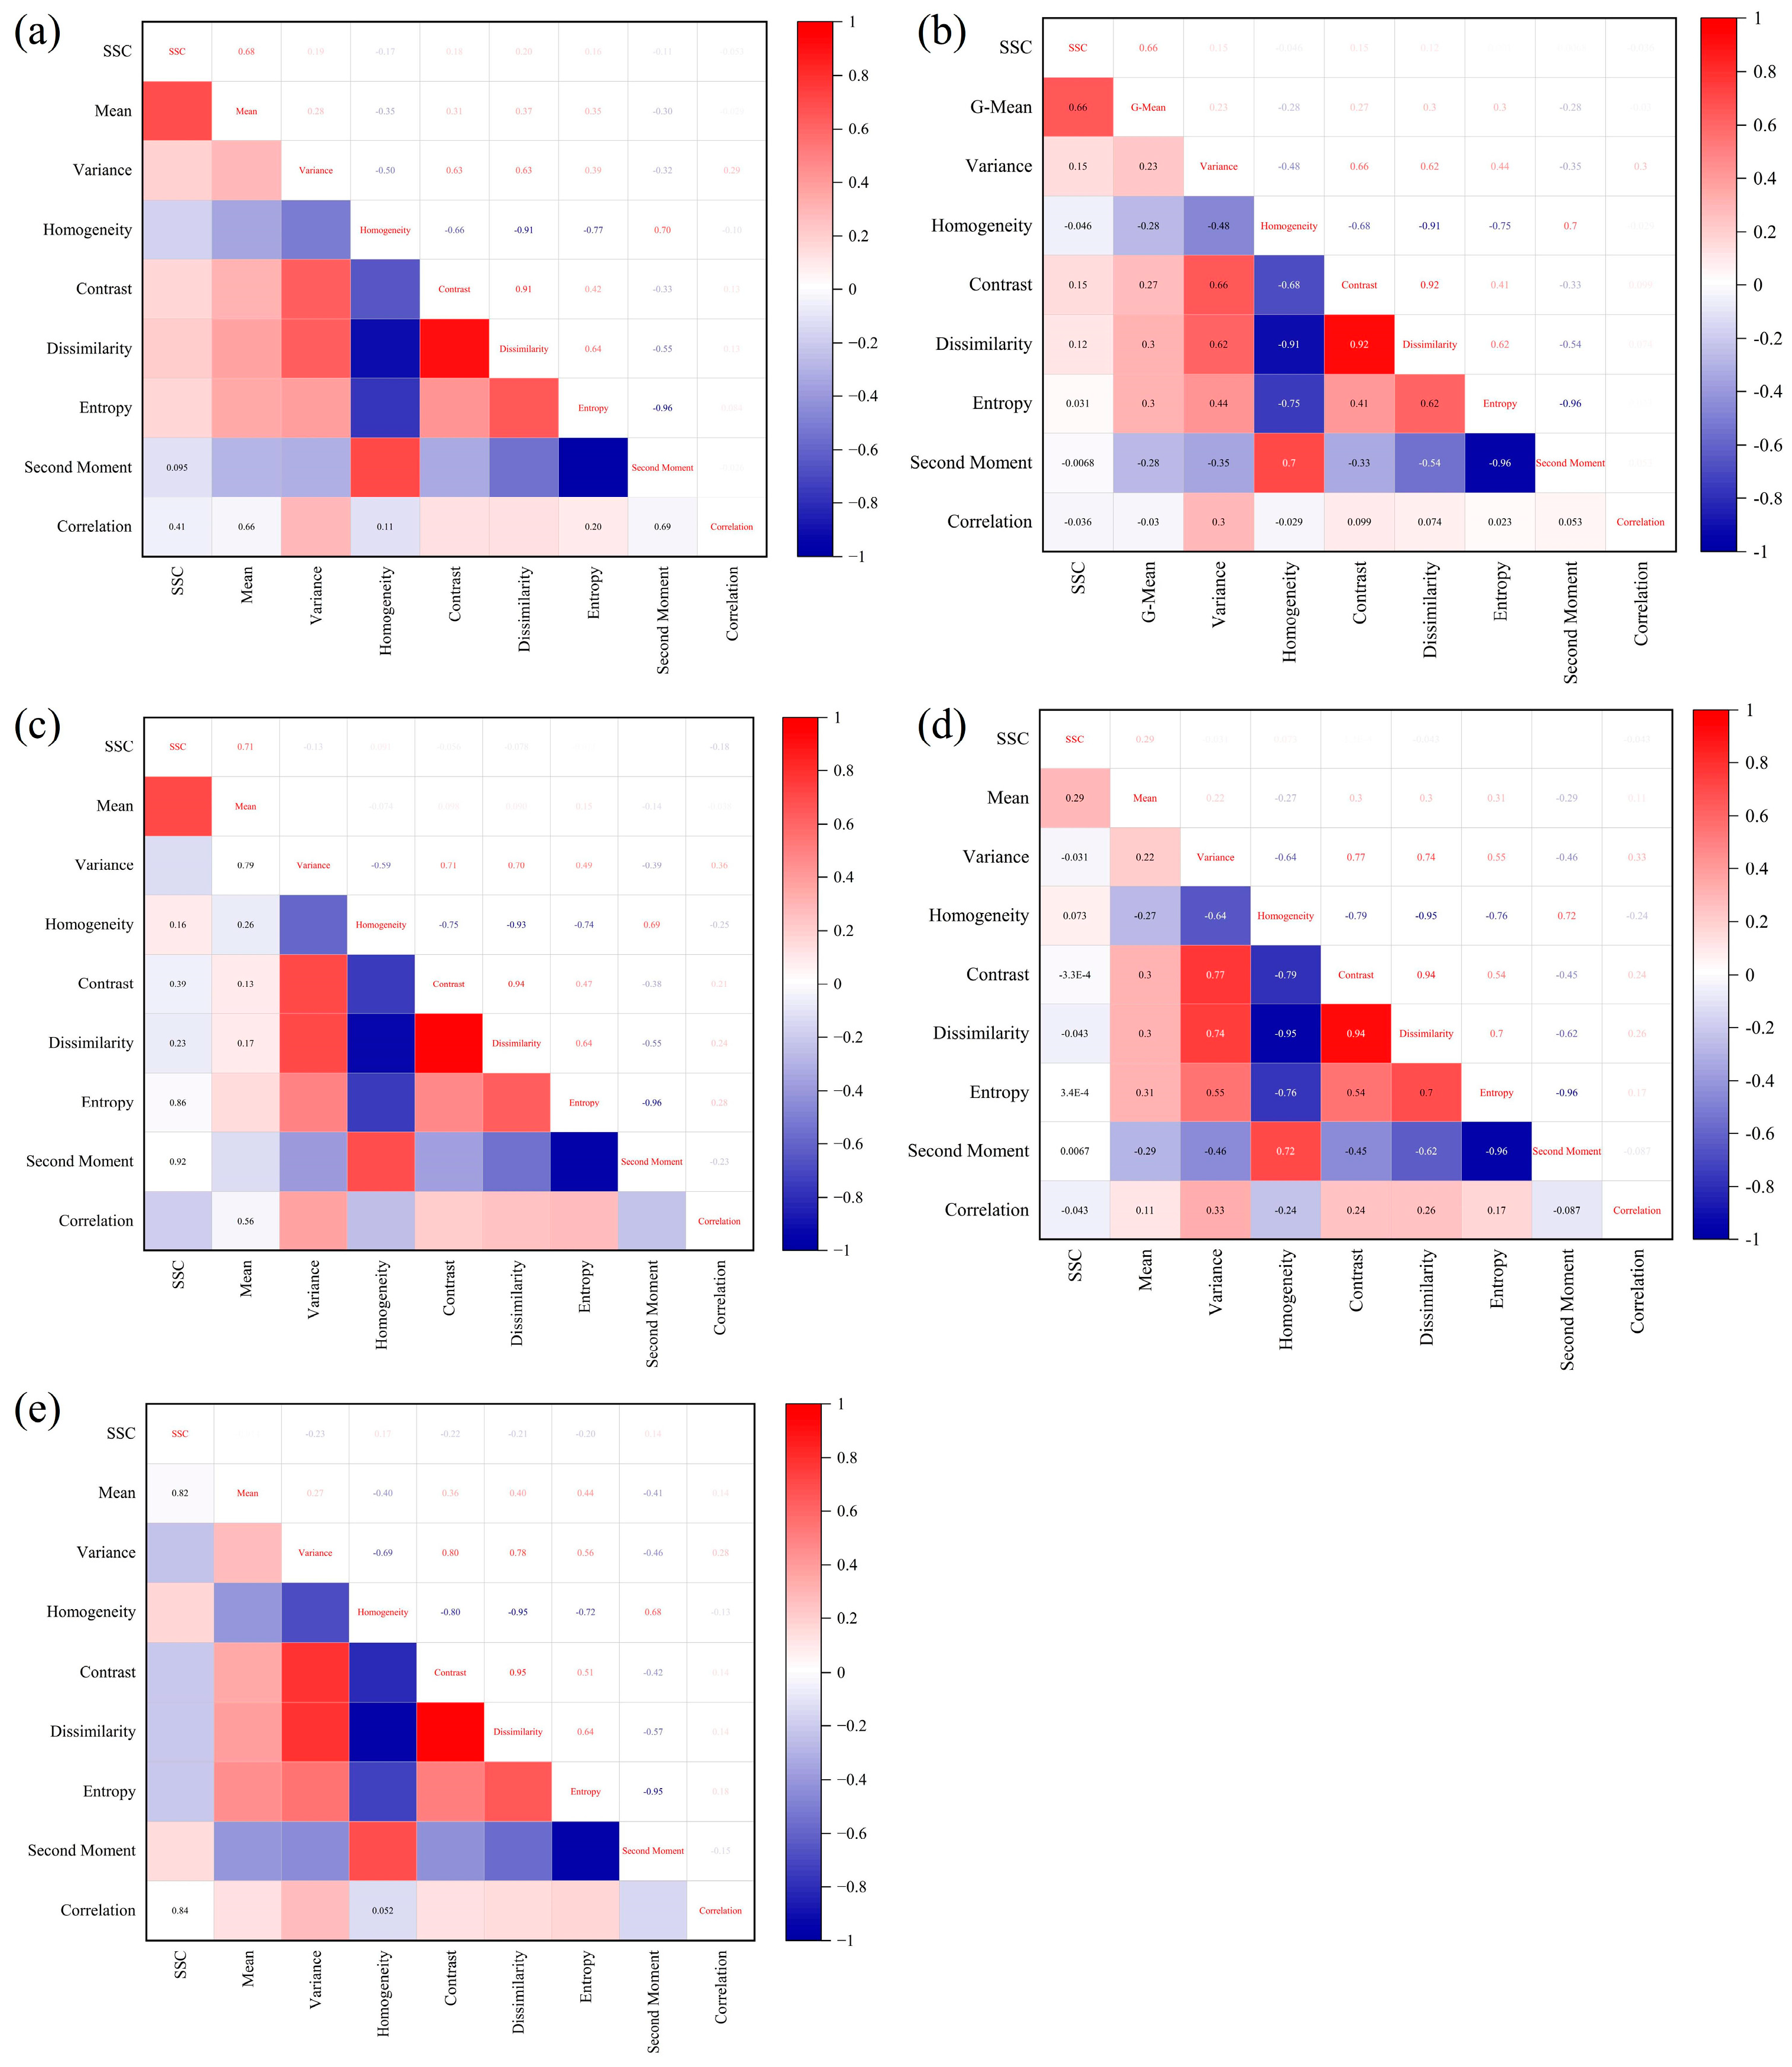
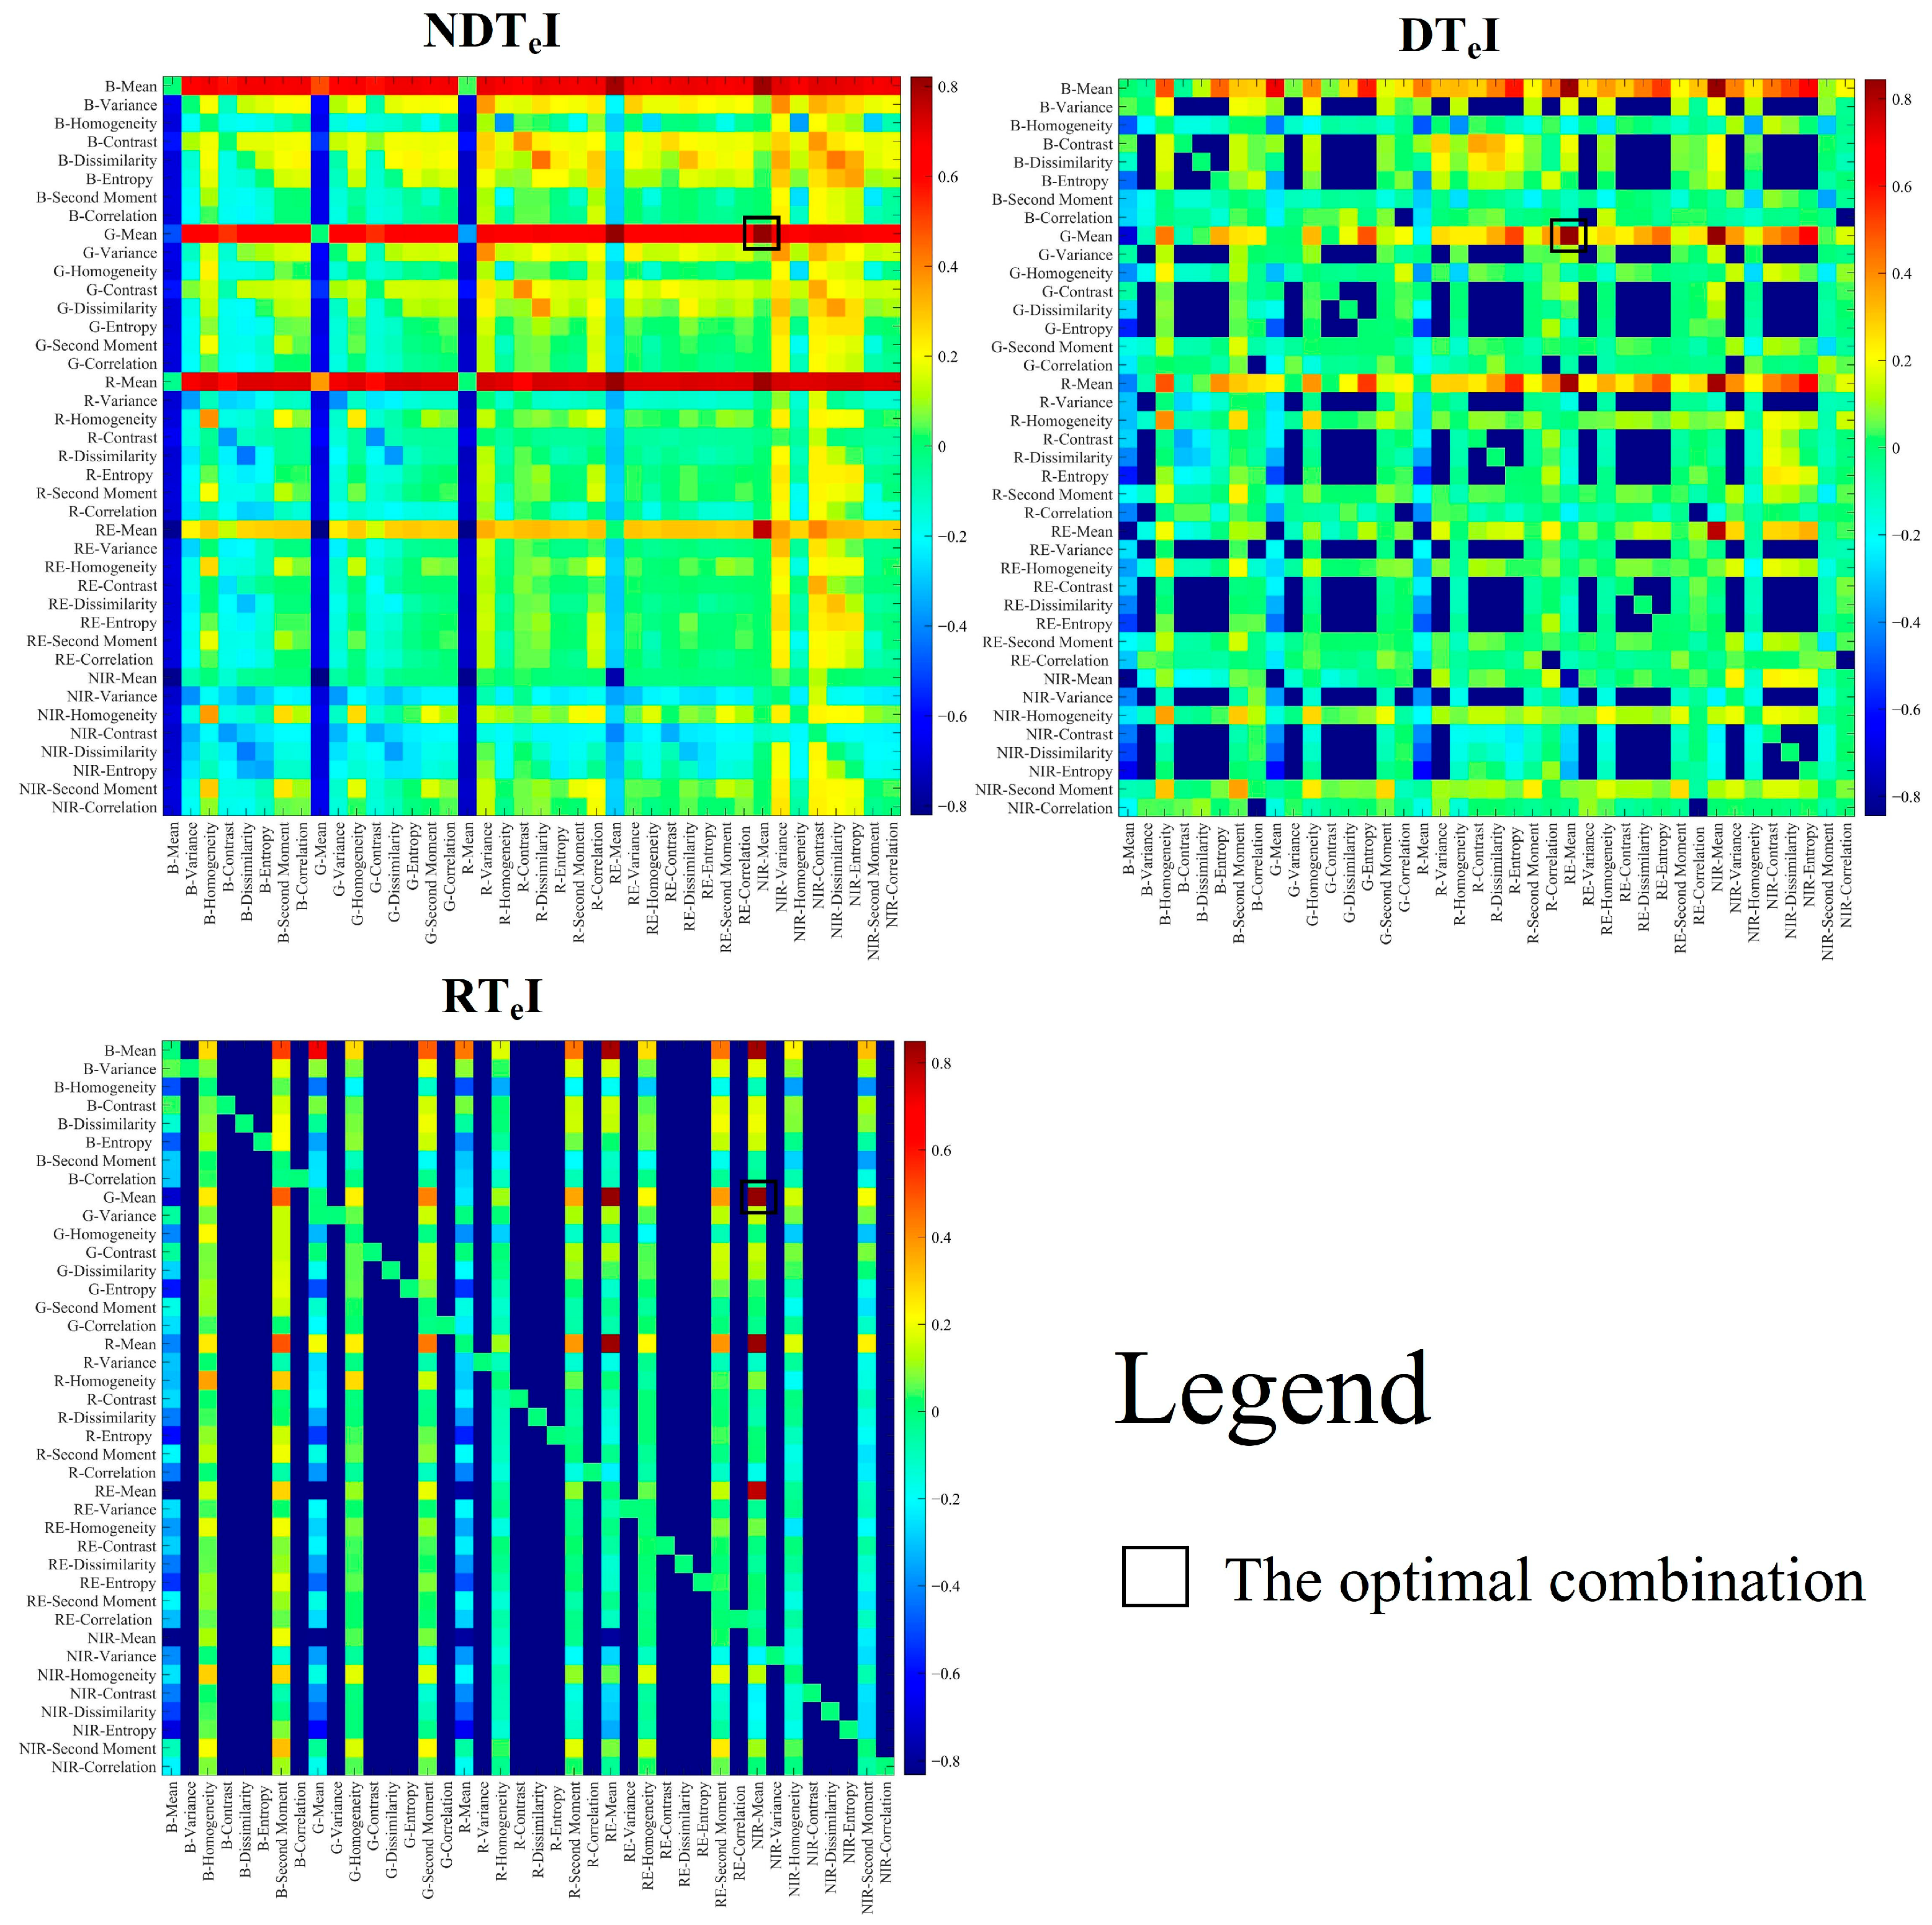
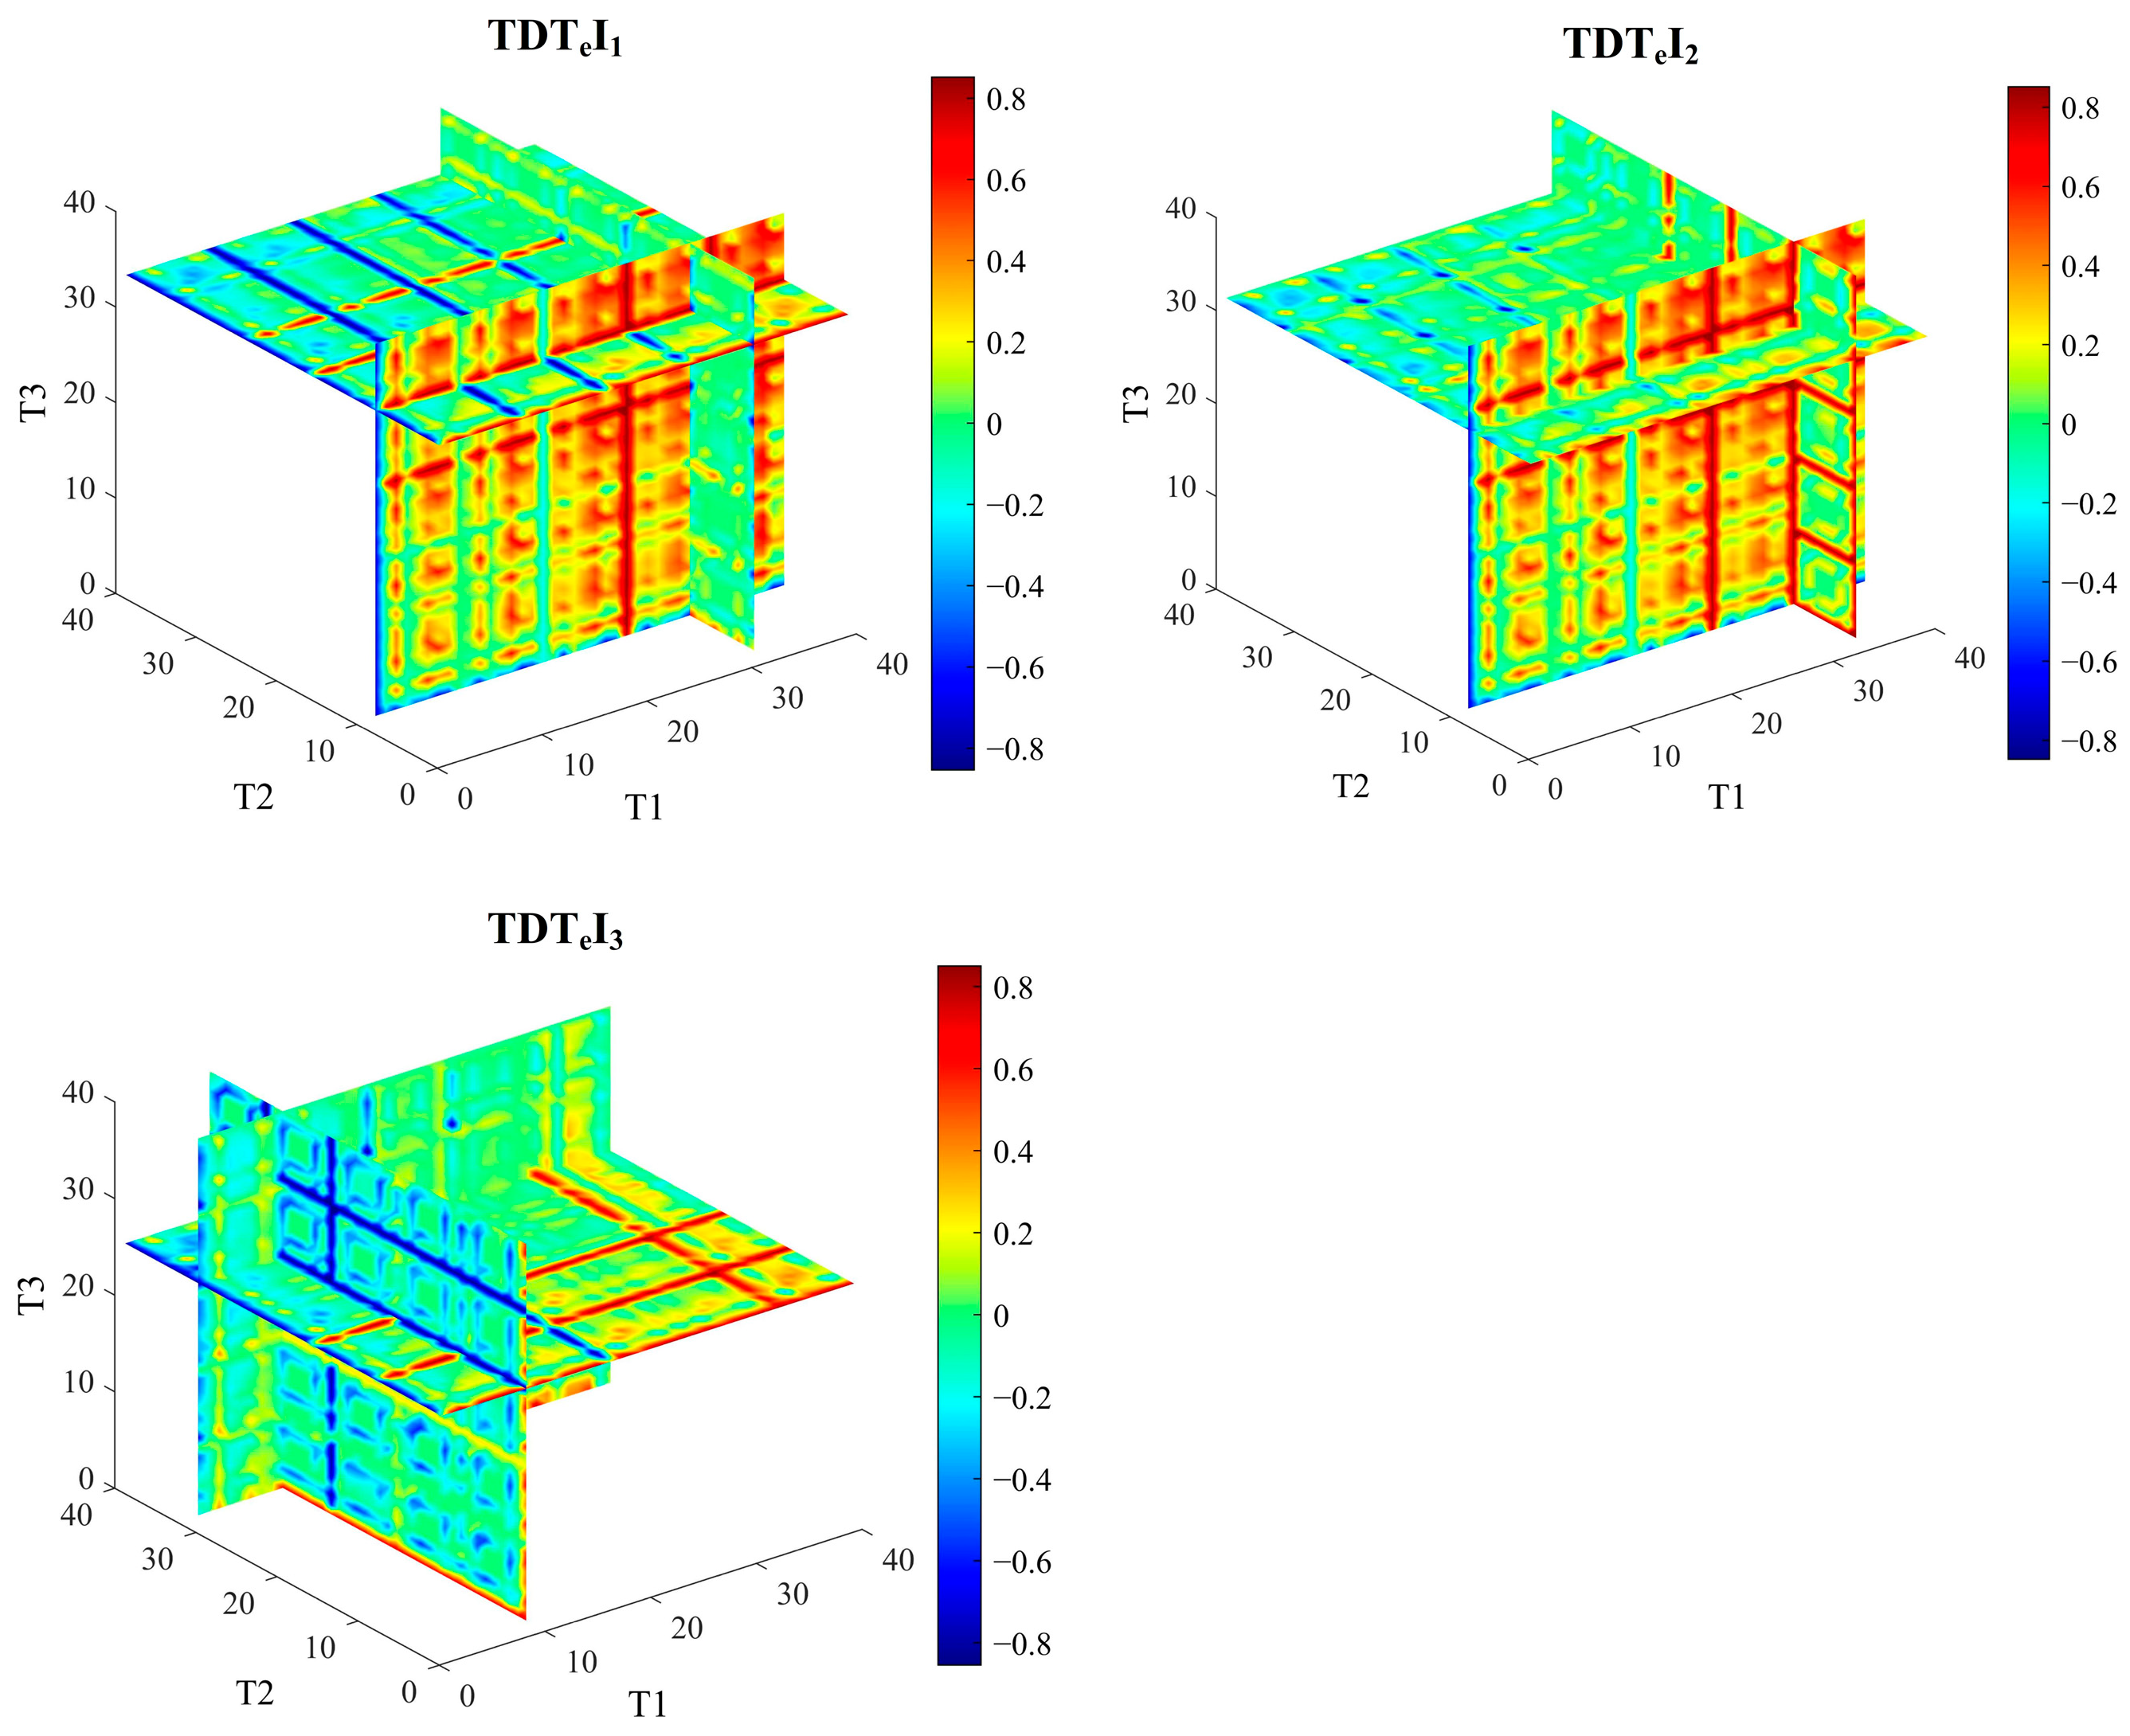
Figure 6, Figure 7, and Figure 8 illustrate the correlations between the one-dimensional (OD) texture features, two-dimensional (TD) texture index, and three-dimensional (THD) texture index with SSC, respectively. As shown in Figure 6a–e, the |r| of the OD texture features range from 0.01 to 0.71. B-Mean, G-Mean, and R-Mean exhibit significant correlations with SSC, specifically with |r| values of 0.68, 0.66, and 0.71, respectively. Other indices show lower correlations with SSC, with |r| values all less than 0.40. NDTeI is the most optimal index among the three TD texture indices, with an |r| of 0.85, when considering the TD texture index. The optimal combination of features is (G-Mean and NIR-Mean). The second index with an |r| of 0.84 is RTeI, which also has the same optimal feature combination as the first. DTeI is the third index correlated with SSC, exhibiting a |r| of 0.82. Overall, the correlation between the three TD texture indices and SSC keeps the order: NDTeI > RTeI > DTeI. Compared to the TD texture index, the THD texture index shows an improvement in correlation with SSC. The correlation coefficient for the best TDTeI1 is 0.86, while TDTeI2 and TDTeI3 both have correlation coefficients of 0.85. The optimal feature combinations for TDTeI1 are (G-Mean, RE-Sm, and NIR-Mean). In general, TDTeI1 shows the best responsiveness and the most forms among the THD texture indices, followed by TDTeI2 and TDTeI3.
The above results indicate that, regarding spectral information, the correlation between the vegetation index and SSC is higher than that between the salinity index and spectral reflectance. The highest correlated vegetation index is NDVI, with a |r| of 0.84. For texture information, the correlation between the THD texture index and SSC is higher than that between the OD and TD texture indices. Among the three THD texture indices, TDTeI1 has the best correlation coefficient of 0.86, which is 21% higher than the correlation coefficient of the highest OD texture feature (|r| = 0.71). The correlation between the texture index and SSC can be ranked as THD > TD > OD.

3.5. Modeling and Validation Base on Different Datasets

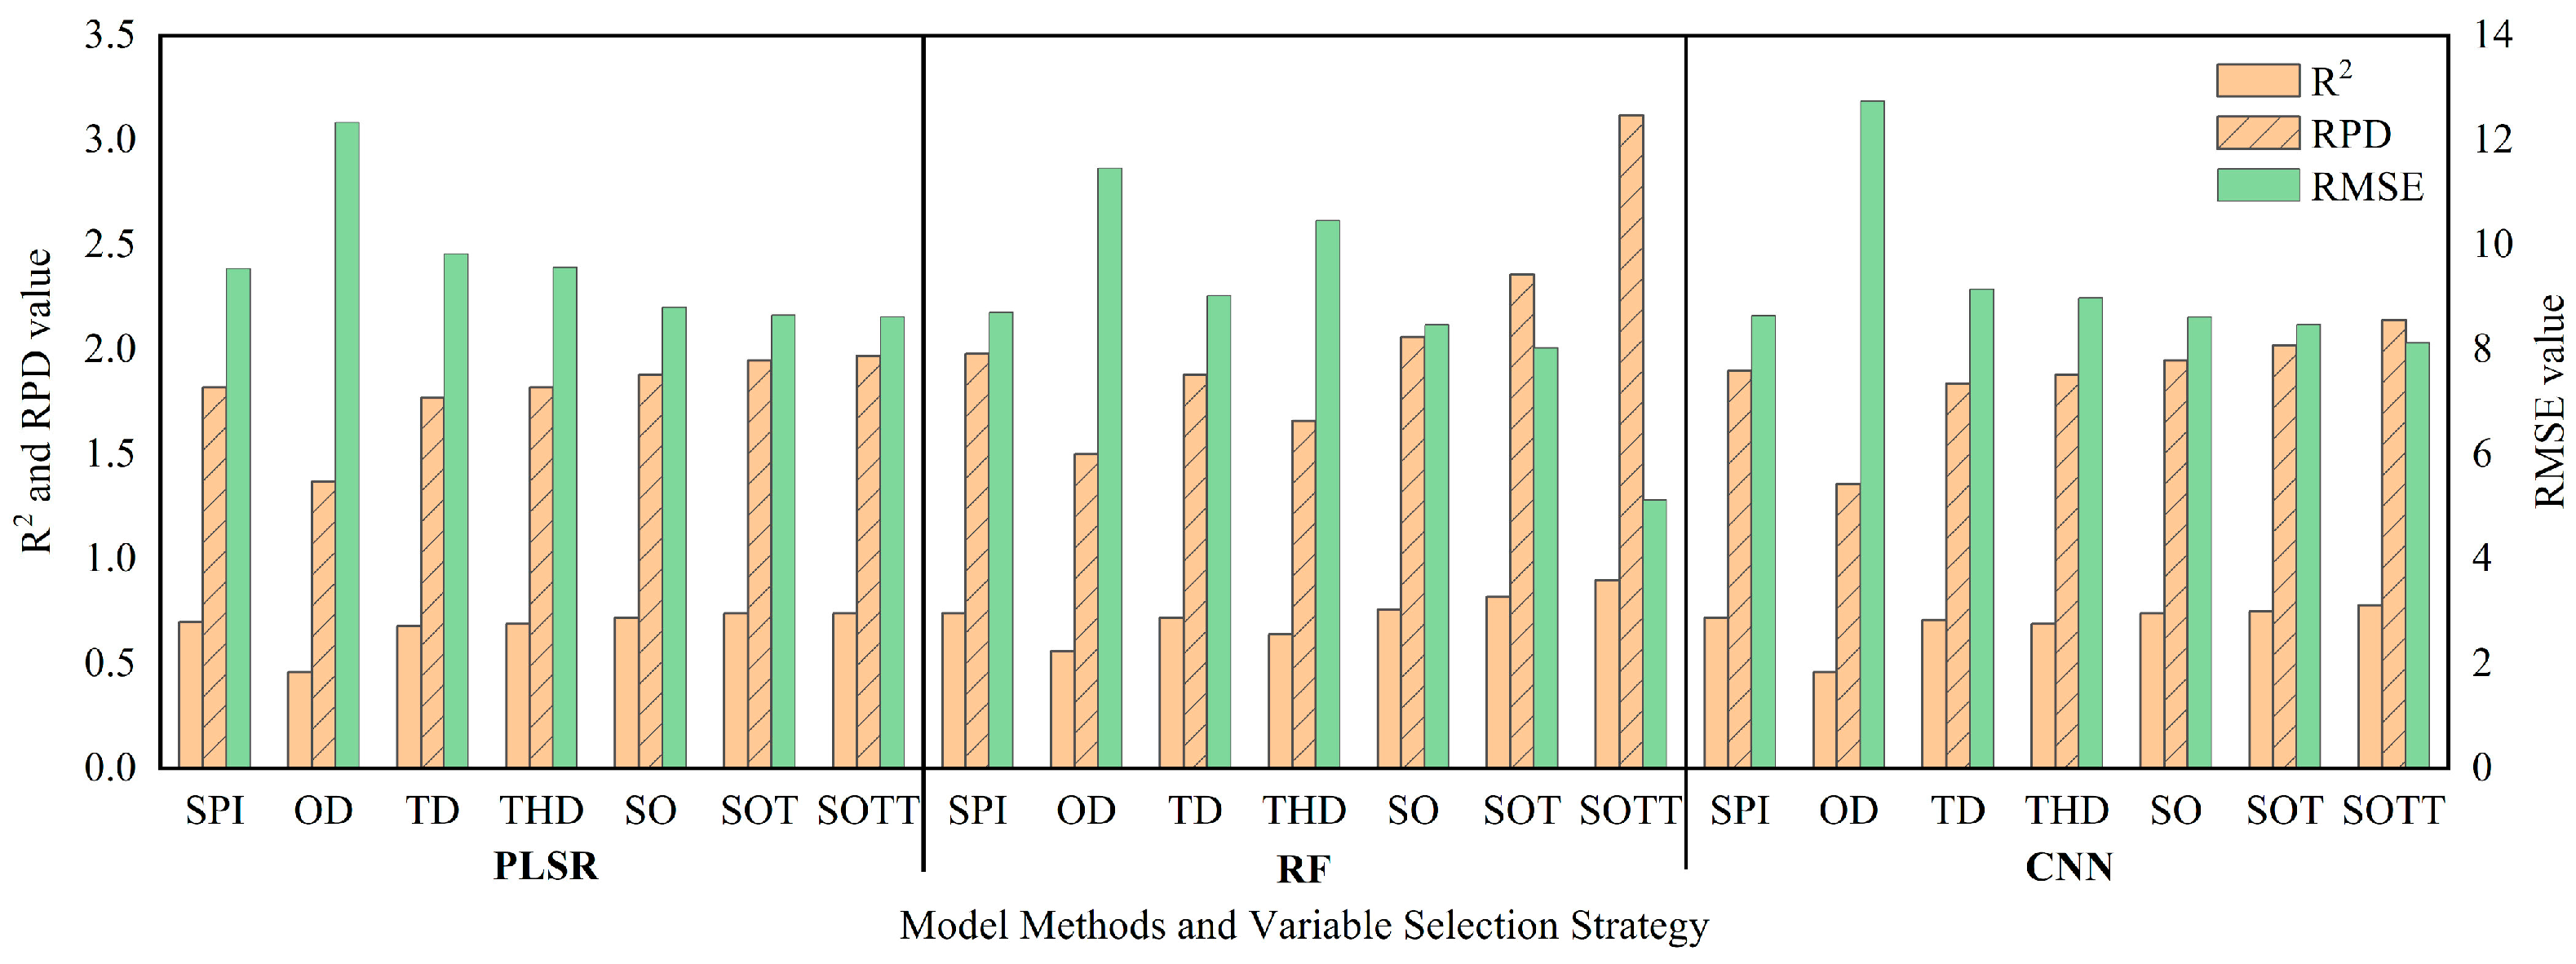
To examine the estimation capability of different types of texture information (including OD, TD, and THD texture indices) and various combinations of spectral and texture information on soil salinity, soil salinity prediction models were constructed based on feature variables selected using the RFE algorithm. Seven different datasets were used for the prediction (Figure 9). Overall, except for the three models based on the OD dataset, all models constructed using spectral features, texture features, and combined features estimate SSC with R2 value = 0.64–0.90, RPD value = 1.66–3.12 (Figure 9). Among the three models, the optimal variable combination is the ‘SPI-OD-TD-THD’ (SOTT). The optimal algorithm is RF when using the SOTT variable combination with an R2 value of 0.90, an RPD value of 3.12, and an RMSE of 5.13 g kg−1. The CNN algorithm follows RF, with an R2 of 0.75, an RPD value of 2.02, and an RMSE value of 8.13 g kg−1. PLSR has the lowest estimation accuracy, with the highest RMSE (8.63 g kg−1) and the lowest R2 (0.74) and RPD (1.95) values. Moreover, the accuracy of models based on combined datasets surpasses that of models relying solely on single datasets. For the RF model, the accuracy of various variable combinations, ranked from highest to lowest, is SOTT > SOT > SO > SPI > OD > THD > TD. Compared to the prediction accuracy of the SO variable combination for SSC, the inclusion of the newly constructed TD and THD texture index (SOTT) significantly improved the model’s accuracy. The R2 value has improved from 0.76 to 0.90, marking an 18% improvement, the RPD value has increased by 51%, and the RMSE value has decreased by 39%. These results strongly suggest that the integration of the RF model and the SOTT variable combination is effective in accurately estimating soil salinity.

3.6. Soil Salinity Maps Derived from RF, CNN and PLSR Models

The spatial distribution maps of SSC in the study area were created utilizing the PLSR, RF, and CNN models, with the integration of the SOTT variable combination (Figure 10). The SSC map produced by different models exhibits a consistent spatial pattern (Figure 10). The focal area’s northwestern region is predominantly composed of highly salinized soils, whereas the southeastern area displays comparatively lower levels of soil salinization. According to field survey results, vegetation in the study area’s northwestern region is notably scarce, in contrast to the southeastern area’s comparatively dense vegetation.
Compared with the detailed features of the SSC distribution, the zoomed-in map derived from the RF model reveals subtle variations. The RF model’s soil salinity spatial distribution map clearly illustrates distinct differences between regions of varying levels of salinization, providing a more detailed demarcation of various salinity zones. In contrast, the spatial distribution maps for SSC produced by the PLSR and CNN models exhibit relatively blurred features. The CNN model provides a detailed depiction of high-salinization areas but renders lower-salinization regions more coarsely. Conversely, the PLSR model offers a finer representation of low-salinization areas, while its depiction of high-salinization regions is relatively rough. Both the CNN and PLSR models exhibit instances of underestimating high salinity values, which results in a relatively weaker ability to capture the subtle variations in high-salinization areas.

3.7. Importance of the Variables

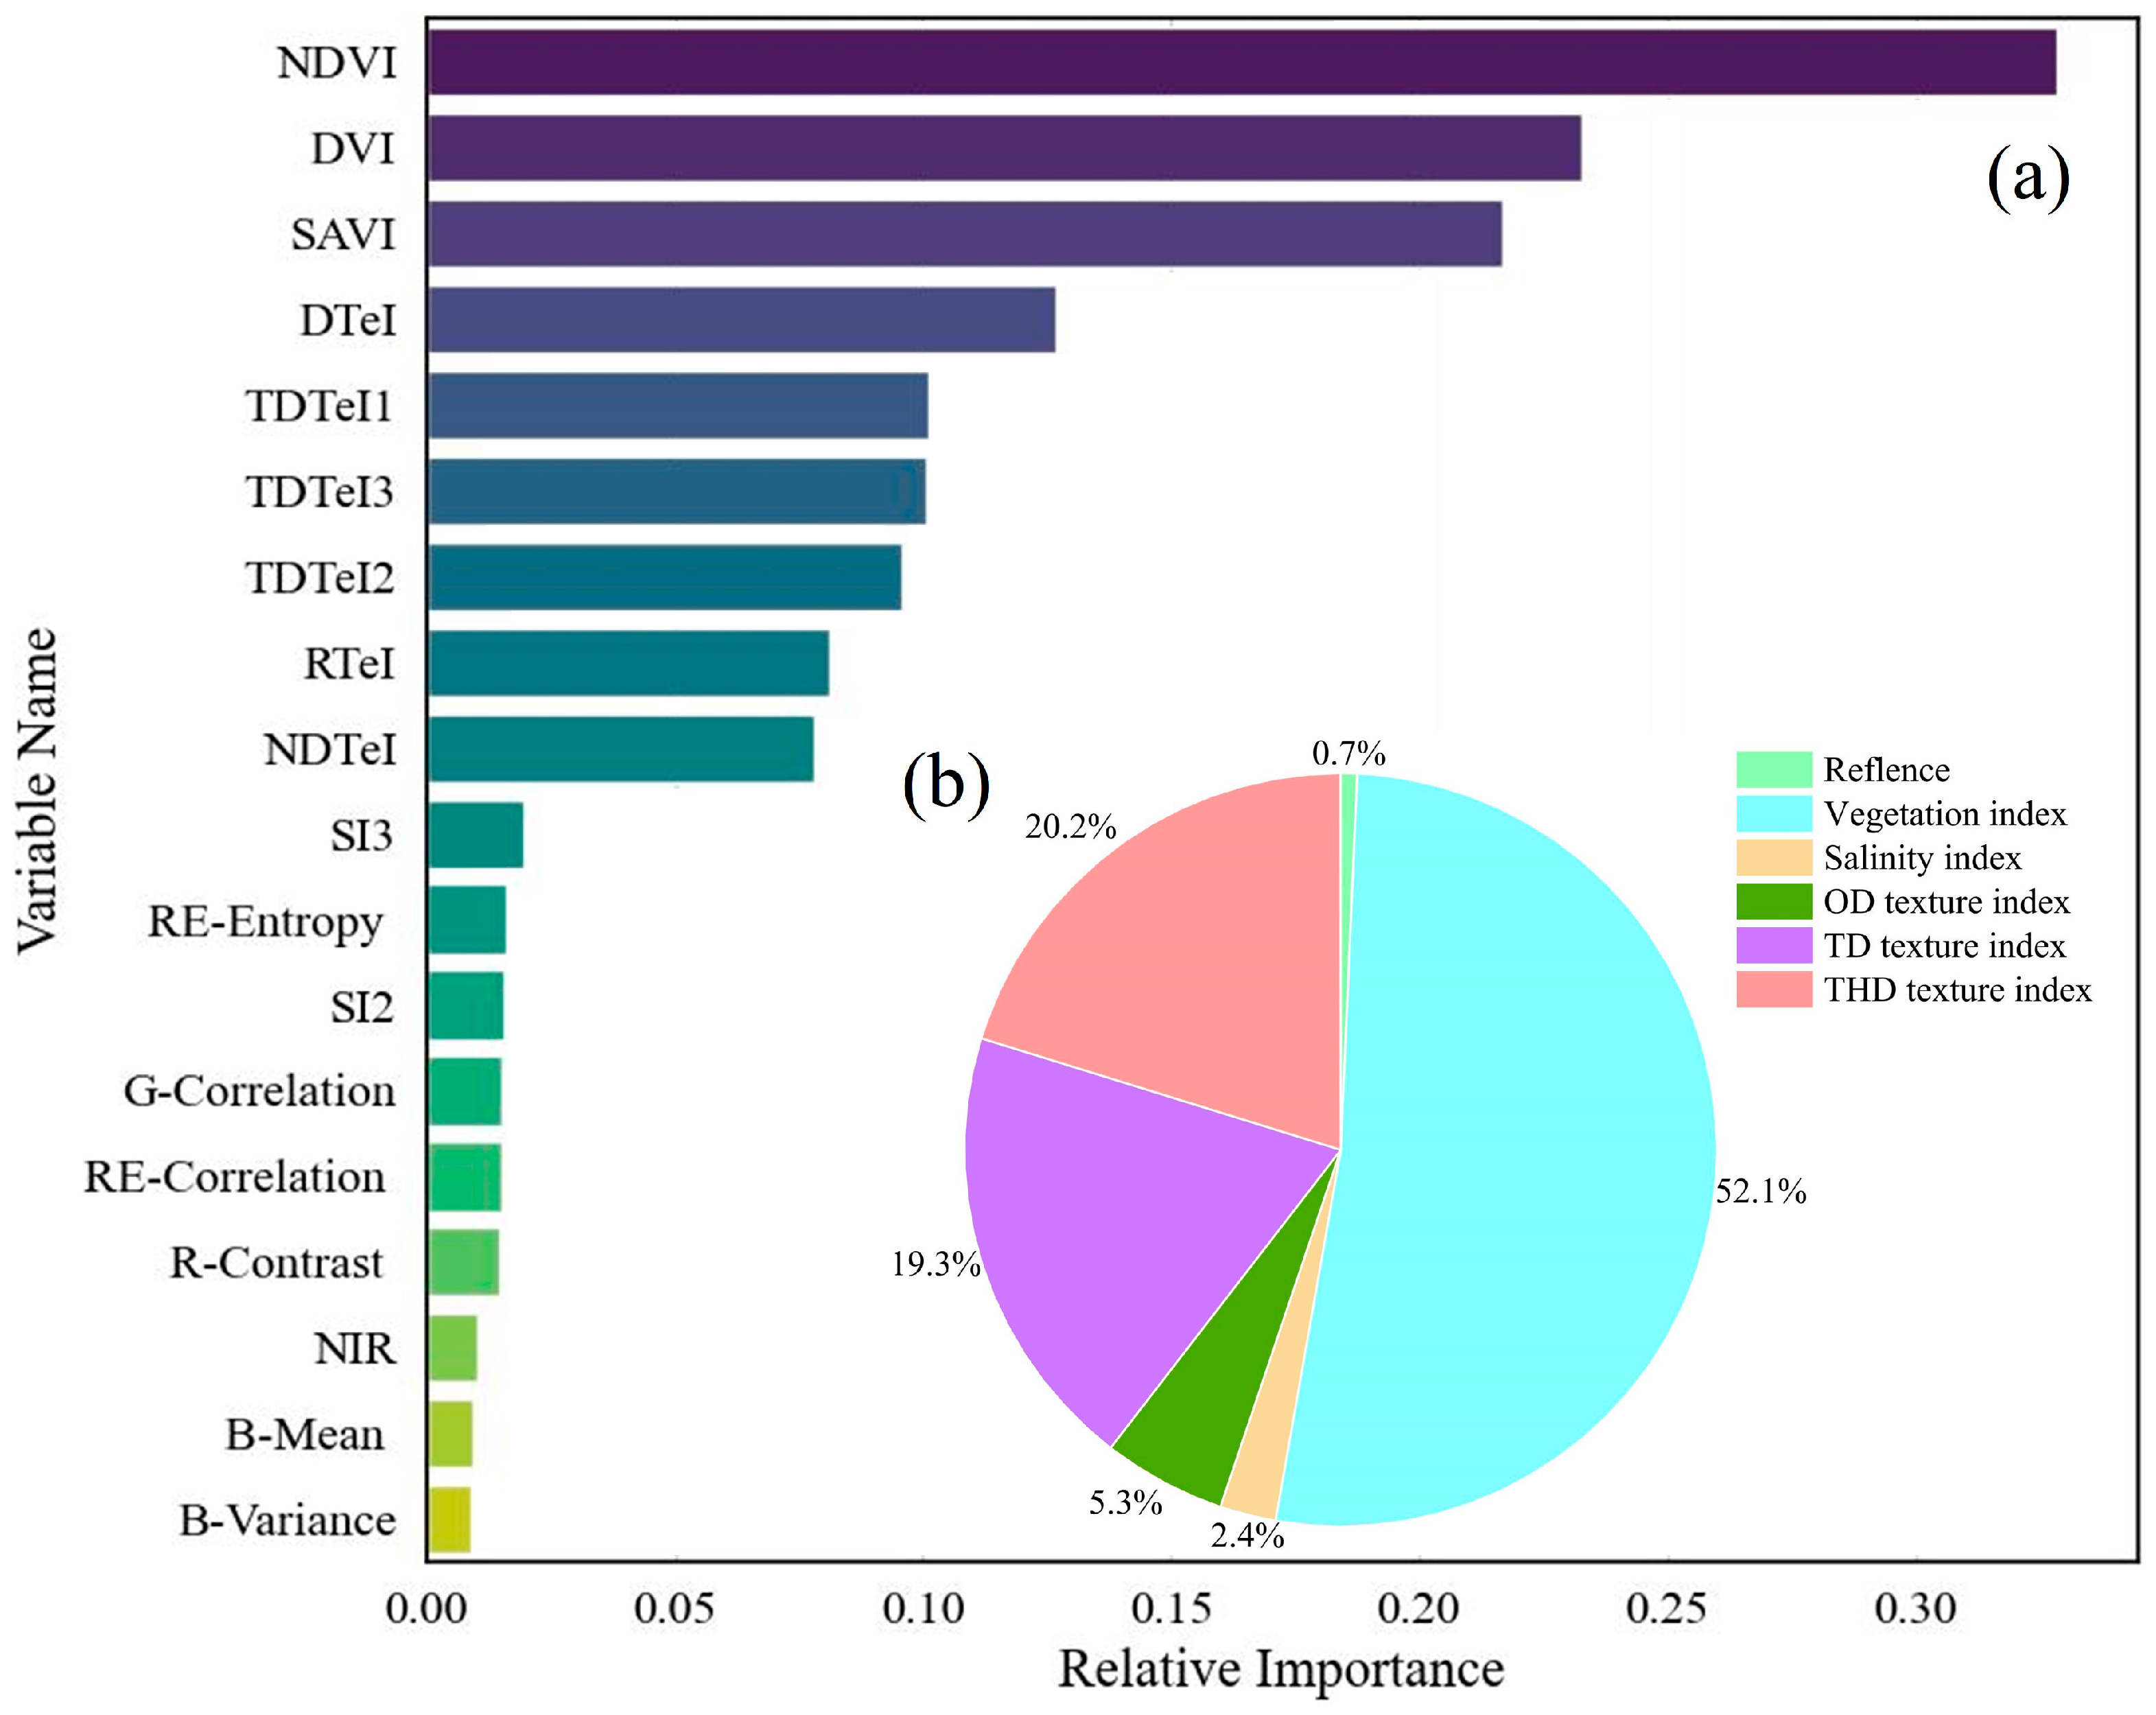
Figure 11 shows the importance of the different variables. As shown in Figure 11a, NDVI, SAVI, DVI, and DTeI are important factors influencing the soil salinity prediction model, with relative importance higher than 0.1. Additionally, we have examined the importance of various types of variables. As illustrated in Figure 11b, the highest contribution is made by the vegetation index, accounting for 52.1%. This is followed by the newly constructed two-dimensional (TD) and three-dimensional (THD) texture indices, with the THD index contributing more than the TD texture index. The contributions of the THD and TD texture indices are 20.2% and 19.3%, respectively. On the other hand, the contributions from the OD texture index (5.3%), salinity index (2.4%), and reflectance (0.7%) are relatively small. Overall, spectral information contributes 55.2% to the model, and texture information contributes 44.8%.

4. Discussion

4.1. Importance of Texture Information for Salinity Prediction

This study underscores the importance of integrating texture information to improve the precision of soil salinity estimation. Texture features effectively reflect the microscopic structure of the soil surface and are essential for indicating various soil properties [27,50]. This is especially relevant as soils with varying levels of salinization exhibit distinct texture characteristics in remote sensing images [31].
Previous studies have clearly shown that the integration of texture information with spectral data considerably enhances the precision of soil salinity estimation [16]. Many studies utilizing texture-based approaches have identified COR, ENT, and CON as the most prominent features of the GLCM technique [51,52]. This study had similar results, as shown in Figure 11. In this study, most one-dimensional texture features exhibited a poor correlation with SSC. However, the mean texture features showed a stronger correlation with SSC, with R-Mean being the most strongly correlated texture feature (|r| = 0.86). This improved correlation is likely because the mean texture features represent the average value within a moving window that encompasses both the target and background, thereby smoothing the image and minimizing interference from background factors [53]. Additionally, the experiment explored not only the relationship between individual texture features and SSC, but also utilized combined multidimensional texture indices to predict SSC. Incorporating the newly developed two-dimensional and three-dimensional texture indices significantly improved the accuracy of the RF, with an improvement of 18% in R2.
Moreover, the optimal index combinations in the two-dimensional and three-dimensional texture indices included four texture features: G-Mean, RE-Mean, NIR-Mean, and RE-Sm. Notably, texture features in the red-edge band accounted for 50%, indicating that constructing indices using wavelengths in the red-edge region can enhance the model prediction accuracy. This result aligns with those of previous studies [54,55]. The fact that these four texture features were not selected by the feature selection method further suggests that combining texture features can reveal the potential relationships between texture information and SSC. This phenomenon was identified and quantified in our study through a novel index to estimate SSC, demonstrating that texture information digging can improve SSC prediction accuracy.

4.2. Defining the Optimal GLCM Window Size for Salinity Prediction

Different parameter settings significantly affect the prediction accuracy of soil salinity, with window size being a critical factor [29,30]. Generally, the window size determines the pixel distance used in calculating texture features. Smaller windows include fewer pixels and may be more sensitive to detail, whereas larger windows can capture broader spatial relationships. Previous studies have extracted texture features using an optimal window size of 9 × 9 pixels from Gaofen-2 imagery (with a resolution of 10 m) for soil salinity estimation, achieving promising results [16]. However, their research was confined to regions with lower soil salinization in the Yellow River Delta, where the texture features extracted are heavily affected by vegetation cover [56]. However, the validity of these features in arid regions with greater salinization and limited vegetation coverage remains unclear. For this purpose, we chose several window sizes, such as 3 × 3, 5 × 5, 7 × 7, 9 × 9, and 11 × 11 pixels, to capture diverse spatial scales. These findings suggest that the model achieves its best performance with a window size of 3 × 3 pixels and that utilizing larger window sizes does not enhance the accuracy of estimating soil salinity. This suggests that the texture information extracted using the smallest window size effectively captures detailed variations in the soil surface texture. This discovery contrasts with prior research, potentially due to the improved resolution of UAV images [31]. In these high-resolution images, smaller window sizes do not amplify the differences within the window or overly smooth texture variations, leading to more precise and realistic soil texture information [53,57]. Hence, the optimal window size is contingent on the unique attributes of the dataset and environmental factors, and its determination should be based on the specific scale of the situation.

4.3. Transferability and Limitations of the Research

By utilizing one-dimensional texture features, this study formulated two-dimensional and three-dimensional texture indices, thereby significantly improving the correlation between texture characteristics and SSC. Furthermore, the two-dimensional and three-dimensional indexes contribute up to 39.5% to the soil salinity prediction model. Further research is needed to verify the model with large-scale satellite remote sensing. This study has confirmed the significant potential of utilizing two-dimensional and three-dimensional texture indices to enhance the precision of soil salinization monitoring through UAV technology. However, the monitoring scope of UAVs is inherently limited. Whether this method can be successfully applied to satellite remote sensing, with its broader coverage, still remains unclear and needs to be further investigated and validated. In theory, the data obtained from UAVs with ultra-high resolution can be upscaled to match the satellite images [58]. This theory has validated the effectiveness of texture features in GF-2 imagery by Yang [16]. Therefore, we believe that the novel index has the potential to be adapted to other images from satellite remote sensing systems, including Sentinel-2 and Landsat-8.
However, our study has several limitations. On the one hand, the optimal window size for texture feature extraction may vary depending on the sensor utilized as the spatial resolution of the images changes. On the other hand, the complexity of the models introduces some limitations. While certain models perform well in remote sensing applications, errors are inevitable during their implementation. Thus, to better apply texture information, future work should focus on optimizing algorithms, expanding data sources, and exploring feature extraction methods that can quickly capture subtle changes in soil surfaces, thereby enhancing the generalizability of this approach.

5. Conclusions

We developed two new remote sensing indices, further explored soil texture information, and proposed a framework that combines spectral and texture information with an RF model optimized through RFE feature selection to predict SSC. The results suggest that the newly developed texture index TDTeI1 exhibits the strongest correlation with SSC(|r| = 0.86), making it a crucial indicator for estimating SSC in arid and semi-arid regions. Additionally, TDTeI2, TDTeI3, NDTeI, RTeI, and NDVI also show a high correlation with SSC (|r| ≥ 0.84). Among the different variable combinations, the SOTT combination demonstrates significantly higher predictive accuracy than the others. Compared to the SO combination, the inclusion of the newly constructed two-dimensional and three-dimensional texture index (SOTT) significantly improved the accuracy, with R2 increasing from 0.76 to 0.90, with an improvement of 18%. In this study, the highest soil salinity prediction accuracy was achieved using 3×3 pixels. As the size of the window expanded, the accuracy of the model decreased. Given the significant potential of texture information for monitoring soil salinization in arid environments, we suggest testing and applying texture information in a more extensive survey of salinized soils across other representative arid regions.

Supplementary Materials

The following supporting information can be downloaded at: https://www.mdpi.com/article/10.3390/rs16193671/s1.

Author Contributions

Conceptualization, Z.S., D.L. and J.P.; methodology, J.Z., D.L. and J.P.; software, C.F.; validation, J.Z., C.F. and D.L.; formal analysis, D.L.; investigation, J.Z., C.F. and J.H.; resources, C.F.; data curation, J.Z.; writing—original draft preparation, J.Z.; writing—review and editing, N.W., B.H. and D.L.; visualization, N.W.; supervision, D.L.; project administration, B.H., J.P. and D.L.; funding acquisition, B.H., J.P. and D.L. All authors have read and agreed to the published version of the manuscript.

Funding

This research was funded by the National Science Foundation of China (Grant Nos. 42261016 and 42201073), Tarim University President’s Fund (Grant Nos. TDZKCX202205, TDZKSS202227), and the Jiangxi “Double Thousand plan” (No. jxsq202301091).

Data Availability Statement

The data that support the findings of this study are available on request from the corresponding author [J.Z.].

Acknowledgments

The authors appreciate all the data provided by each open database. The authors thank anonymous reviewers and academic editors for their comments.

Conflicts of Interest

The authors declare no conflicts of interest.

References

  1. Haj-Amor, Z.; Araya, T.; Kim, D.G.; Bouri, S.; Lee, J.; Ghiloufi, W.; Yang, Y.; Kang, H.; Jhariya, M.K.; Banerjee, A.; et al. Soil Salinity and Its Associated Effects on Soil Microorganisms, Greenhouse Gas Emissions, Crop Yield, Biodiversity and Desertification: A Review. Sci. Total Environ. 2022, 843, 156946. [Google Scholar] [CrossRef] [PubMed]
  2. Peng, J.; Biswas, A.; Jiang, Q.; Zhao, R.; Hu, J.; Hu, B.; Shi, Z. Estimating Soil Salinity from Remote Sensing and Terrain Data in Southern Xinjiang Province, China. Geoderma 2019, 337, 1309–1319. [Google Scholar] [CrossRef]
  3. Hassani, A.; Azapagic, A.; Shokri, N. Predicting Long-Term Dynamics of Soil Salinity and Sodicity on a Global Scale. Proc. Natl. Acad. Sci. USA 2020, 117, 33017–33027. [Google Scholar] [CrossRef] [PubMed]
  4. Wang, D.; Yang, H.; Qian, H.; Gao, L.; Li, C.; Xin, J.; Tan, Y.; Wang, Y.; Li, Z. Minimizing Vegetation Influence on Soil Salinity Mapping with Novel Bare Soil Pixels from Multi-Temporal Images. Geoderma 2023, 439, 116697. [Google Scholar] [CrossRef]
  5. Cao, X.; Chen, W.; Ge, X.; Chen, X.; Wang, J.; Ding, J. Multidimensional Soil Salinity Data Mining and Evaluation from Different Satellites. Sci. Total Environ. 2022, 846, 157416. [Google Scholar] [CrossRef]
  6. Guo, B.; Yang, X.; Yang, M.; Sun, D.; Zhu, W.; Zhu, D.; Wang, J. Mapping Soil Salinity Using a Combination of Vegetation Index Time Series and Single-Temporal Remote Sensing Images in the Yellow River Delta, China. Catena 2023, 231, 107313. [Google Scholar] [CrossRef]
  7. Kaplan, G.; Gašparović, M.; Alqasemi, A.S.; Aldhaheri, A.; Abuelgasim, A.; Ibrahim, M. Soil Salinity Prediction Using Machine Learning and Sentinel–2 Remote Sensing Data in Hyper–Arid Areas. Phys. Chem. Earth Parts A/B/C 2023, 130, 103400. [Google Scholar] [CrossRef]
  8. Sun, Y.; Li, X.; Shi, H.; Cui, J.; Wang, W.; Ma, H.; Chen, N. Modeling Salinized Wasteland Using Remote Sensing with the Integration of Decision Tree and Multiple Validation Approaches in Hetao Irrigation District of China. Catena 2022, 209, 105854. [Google Scholar] [CrossRef]
  9. Stenberg, B.; Viscarra Rossel, R.A.; Mouazen, A.M.; Wetterlind, J. Visible and Near Infrared Spectroscopy in Soil Science. Adv. Agron. 2010, 107, 163–215. [Google Scholar] [CrossRef]
  10. Metternicht, G.I.; Zinck, J.A. Remote Sensing of Soil Salinity: Potentials and Constraints. Remote Sens. Environ. 2003, 85, 1–20. [Google Scholar] [CrossRef]
  11. Hu, J.; Peng, J.; Zhou, Y.; Xu, D.; Zhao, R.; Jiang, Q.; Fu, T.; Wang, F.; Shi, Z. Quantitative Estimation of Soil Salinity Using UAV-Borne Hyperspectral and Satellite Multispectral Images. Remote Sens. 2019, 11, 736. [Google Scholar] [CrossRef]
  12. Nex, F.; Armenakis, C.; Cramer, M.; Cucci, D.A.; Gerke, M.; Honkavaara, E.; Kukko, A.; Persello, C.; Skaloud, J. UAV in the Advent of the Twenties: Where We Stand and What Is Next. ISPRS J. Photogramm. Remote Sens. 2022, 184, 215–242. [Google Scholar] [CrossRef]
  13. Radoglou-Grammatikis, P.; Sarigiannidis, P.; Lagkas, T.; Moscholios, I. A Compilation of UAV Applications for Precision Agriculture. Comput. Netw. 2020, 172, 107148. [Google Scholar] [CrossRef]
  14. Sankey, J.B.; Sankey, T.T.; Li, J.; Ravi, S.; Wang, G.; Caster, J.; Kasprak, A. Quantifying Plant-Soil-Nutrient Dynamics in Rangelands: Fusion of UAV Hyperspectral-LiDAR, UAV Multispectral-Photogrammetry, and Ground-Based LiDAR-Digital Photography in a Shrub-Encroached Desert Grassland. Remote Sens. Environ. 2021, 253, 112223. [Google Scholar] [CrossRef]
  15. Liang, Y.; Kou, W.; Lai, H.; Wang, J.; Wang, Q.; Xu, W.; Wang, H.; Lu, N. Improved Estimation of Aboveground Biomass in Rubber Plantations by Fusing Spectral and Textural Information from UAV-Based RGB Imagery. Ecol. Indic. 2022, 142, 109286. [Google Scholar] [CrossRef]
  16. Yang, H.; Wang, Z.; Cao, J.; Wu, Q.; Zhang, B. Estimating Soil Salinity Using Gaofen-2 Imagery: A Novel Application of Combined Spectral and Textural Features. Environ. Res. 2023, 217, 114870. [Google Scholar] [CrossRef]
  17. Wang, Y.; Hu, B.; Hong, Y.; Chen, S.; Zhao, C.; Peng, J. Minimize of Moisture Effects from Laboratory Simulations of In-Situ Vis-NIR Spectral for the Prediction of Soil Salinity. Infrared Phys. Technol. 2024, 137, 105194. [Google Scholar] [CrossRef]
  18. Ding, J.; Yu, D. Monitoring and Evaluating Spatial Variability of Soil Salinity in Dry and Wet Seasons in the Werigan–Kuqa Oasis, China, Using Remote Sensing and Electromagnetic Induction Instruments. Geoderma 2014, 235–236, 316–322. [Google Scholar] [CrossRef]
  19. Li, Y.; Chang, C.; Wang, Z.; Zhao, G. Remote Sensing Prediction and Characteristic Analysis of Cultivated Land Salinization in Different Seasons and Multiple Soil Layers in the Coastal Area. Int. J. Appl. Earth Obs. Geoinf. 2022, 111, 102838. [Google Scholar] [CrossRef]
  20. Moreira, L.C.J.; Teixeira, A.D.S.; Galvão, L.S. Potential of Multispectral and Hyperspectral Data to Detect Saline-Exposed Soils in Brazil. GIScience Remote Sens. 2015, 52, 416–436. [Google Scholar] [CrossRef]
  21. Salcedo, F.P.; Cutillas, P.P.; Cabañero, J.J.A.; Vivaldi, A.G. Use of Remote Sensing to Evaluate the Effects of Environmental Factors on Soil Salinity in a Semi-Arid Area. Sci. Total Environ. 2022, 815, 152524. [Google Scholar] [CrossRef] [PubMed]
  22. Finstad, K.; Pfeiffer, M.; McNicol, G.; Barnes, J.; Demergasso, C.; Chong, G.; Amundson, R. Rates and Geochemical Processes of Soil and Salt Crust Formation in Salars of the Atacama Desert, Chile. Geoderma 2016, 284, 57–72. [Google Scholar] [CrossRef]
  23. Grünberger, O.; Macaigne, P.; Michelot, J.L.; Hartmann, C.; Sukchan, S. Salt Crust Development in Paddy Fields Owing to Soil Evaporation and Drainage: Contribution of Chloride and Deuterium Profile Analysis. J. Hydrol. 2008, 348, 110–123. [Google Scholar] [CrossRef]
  24. Roberti de Siqueira, F.; Robson Schwartz, W.; Pedrini, H. Multi-Scale Gray Level Co-Occurrence Matrices for Texture Description. Neurocomputing 2013, 120, 336–345. [Google Scholar] [CrossRef]
  25. Howari, F.M.; Goodell, P.C.; Miyamoto, S. Spectral Properties of Salt Crusts Formed on Saline Soils. J. Environ. Qual. 2002, 31, 1453–1461. [Google Scholar] [CrossRef] [PubMed]
  26. Zhao, W.; Ma, F.; Yu, H.; Li, Z. Inversion Model of Salt Content in Alfalfa-Covered Soil Based on a Combination of UAV Spectral and Texture Information. Agriculture 2023, 13, 1530. [Google Scholar] [CrossRef]
  27. Pacifici, F.; Chini, M.; Emery, W.J. A Neural Network Approach Using Multi-Scale Textural Metrics from Very High-Resolution Panchromatic Imagery for Urban Land-Use Classification. Remote Sens. Environ. 2009, 113, 1276–1292. [Google Scholar] [CrossRef]
  28. Zhang, X.; Cui, J.; Wang, W.; Lin, C. A Study for Texture Feature Extraction of High-Resolution Satellite Images Based on a Direction Measure and Gray Level Co-Occurrence Matrix Fusion Algorithm. Sensors 2017, 17, 1474. [Google Scholar] [CrossRef]
  29. Chen, S.; Useya, J.; Mugiyo, H. Decision-Level Fusion of Sentinel-1 SAR and Landsat 8 OLI Texture Features for Crop Discrimination and Classification: Case of Masvingo, Zimbabwe. Heliyon 2020, 6, e05358. [Google Scholar] [CrossRef]
  30. Shaban, M.A.; Dikshit, O. Improvement of Classification in Urban Areas by the Use of Textural Features: The Case Study of Lucknow City, Uttar Pradesh. Int. J. Remote Sens. 2001, 22, 565–593. [Google Scholar] [CrossRef]
  31. Duan, M.; Song, X.; Li, Z.; Zhang, X.; Ding, X.; Cui, D. Identifying Soil Groups and Selecting a High-Accuracy Classification Method Based on Multi-Textural Features with Optimal Window Sizes Using Remote Sensing Images. Ecol. Inf. 2024, 81, 102563. [Google Scholar] [CrossRef]
  32. Wei, Y.; Ding, J.; Yang, S.; Wang, F.; Wang, C. Soil Salinity Prediction Based on Scale-Dependent Relationships with Environmental Variables by Discrete Wavelet Transform in the Tarim Basin. Catena 2021, 196, 104939. [Google Scholar] [CrossRef]
  33. Li, H.; Liu, X.; Hu, B.; Biswas, A.; Jiang, Q.; Liu, W.; Wang, N.; Peng, J. Field-Scale Characterization of Spatio-Temporal Variability of Soil Salinity in Three Dimensions. Remote Sens. 2020, 12, 4043. [Google Scholar] [CrossRef]
  34. Chen, T.; Chang, Q.; Liu, J.; Clevers, J.G.P.W.; Kooistra, L. Identification of Soil Heavy Metal Sources and Improvement in Spatial Mapping Based on Soil Spectral Information: A Case Study in Northwest China. Sci. Total Environ. 2016, 565, 155–164. [Google Scholar] [CrossRef] [PubMed]
  35. Karakouzian, M.; Pitchford, A.; Leonard, M.; Johnson, B. Measurements of Soluble Salt Content of Soils from Arid and Semi-Arid Regions. Geotech. Test. J. 1996, 19, 364–372. [Google Scholar] [CrossRef]
  36. Ji, L.; Peters, A.J. Performance Evaluation of Spectral Vegetation Indices Using a Statistical Sensitivity Function. Remote Sens. Environ. 2007, 106, 59–65. [Google Scholar] [CrossRef]
  37. Barreto, A.C.; Ferreira Neto, M.; de Oliveira, R.P.; Moreira, L.C.J.; de Medeiros, J.F.; Sá, F.V.d.S. Comparative Analysis of Spectral Indexes for Soil Salinity Mapping in Irrigated Areas in a Semi-Arid Region, Brazil. J. Arid. Environ. 2023, 209, 104888. [Google Scholar] [CrossRef]
  38. Haralick, R.M.; Dinstein, I.; Shanmugam, K. Textural Features for Image Classification. IEEE Trans. Syst. Man. Cybern. 1973, SMC-3, 610–621. [Google Scholar] [CrossRef]
  39. Cai, S.; Zhang, R.; Liu, L.; Zhou, D. A Method of Salt-Affected Soil Information Extraction Based on a Support Vector Machine with Texture Features. Math. Comput. Model. 2010, 51, 1319–1325. [Google Scholar] [CrossRef]
  40. Hu, B.; Xie, M.; Zhou, Y.; Chen, S.; Zhou, Y.; Ni, H.; Peng, J.; Ji, W.; Hong, Y.; Li, H.; et al. A High-Resolution Map of Soil Organic Carbon in Cropland of Southern China. Catena 2024, 237, 107813. [Google Scholar] [CrossRef]
  41. Bai, Z.; Xie, M.; Hu, B.; Luo, D.; Wan, C.; Peng, J.; Shi, Z. Estimation of Soil Organic Carbon Using Vis-NIR Spectral Data and Spectral Feature Bands Selection in Southern Xinjiang, China. Sensors 2022, 22, 6124. [Google Scholar] [CrossRef] [PubMed]
  42. Luo, C.; Zhang, X.; Wang, Y.; Men, Z.; Liu, H. Regional Soil Organic Matter Mapping Models Based on the Optimal Time Window, Feature Selection Algorithm and Google Earth Engine. Soil. Tillage Res. 2022, 219, 105325. [Google Scholar] [CrossRef]
  43. Meng, X.; Bao, Y.; Luo, C.; Zhang, X.; Liu, H. SOC Content of Global Mollisols at a 30 m Spatial Resolution from 1984 to 2021 Generated by the Novel ML-CNN Prediction Model. Remote Sens. Environ. 2024, 300, 113911. [Google Scholar] [CrossRef]
  44. Hu, B.; Bourennane, H.; Arrouays, D.; Denoroy, P.; Lemercier, B.; Saby, N.P.A. Developing Pedotransfer Functions to Harmonize Extractable Soil Phosphorus Content Measured with Different Methods: A Case Study across the Mainland of France. Geoderma 2021, 381, 114645. [Google Scholar] [CrossRef]
  45. Tajik, S.; Ayoubi, S.; Shirani, H.; Zeraatpisheh, M. Digital Mapping of Soil Invertebrates Using Environmental Attributes in a Deciduous Forest Ecosystem. Geoderma 2019, 353, 252–263. [Google Scholar] [CrossRef]
  46. Zeraatpisheh, M.; Garosi, Y.; Reza Owliaie, H.; Ayoubi, S.; Taghizadeh-Mehrjardi, R.; Scholten, T.; Xu, M. Improving the Spatial Prediction of Soil Organic Carbon Using Environmental Covariates Selection: A Comparison of a Group of Environmental Covariates. Catena 2022, 208, 105723. [Google Scholar] [CrossRef]
  47. Liu, H.; Shi, T.; Chen, Y.; Wang, J.; Fei, T.; Wu, G. Improving Spectral Estimation of Soil Organic Carbon Content through Semi-Supervised Regression. Remote Sens. 2017, 9, 29. [Google Scholar] [CrossRef]
  48. Chang, C.-W.; Laird, D.A.; Mausbach, M.J.; Hurburgh, C.R. Near-Infrared Reflectance Spectroscopy–Principal Components Regression Analyses of Soil Properties. Soil. Sci. Soc. Am. J. 2001, 65, 480–490. [Google Scholar] [CrossRef]
  49. Allbed, A.; Kumar, L.; Aldakheel, Y.Y. Assessing Soil Salinity Using Soil Salinity and Vegetation Indices Derived from IKONOS High-Spatial Resolution Imageries: Applications in a Date Palm Dominated Region. Geoderma 2014, 230–231, 1–8. [Google Scholar] [CrossRef]
  50. Duan, M.; Song, X.; Liu, X.; Cui, D.; Zhang, X. Mapping the Soil Types Combining Multi-Temporal Remote Sensing Data with Texture Features. Comput. Electron. Agric. 2022, 200, 107230. [Google Scholar] [CrossRef]
  51. Liu, Y.; Fan, Y.; Feng, H.; Chen, R.; Bian, M.; Ma, Y.; Yue, J.; Yang, G. Estimating Potato Above-Ground Biomass Based on Vegetation Indices and Texture Features Constructed from Sensitive Bands of UAV Hyperspectral Imagery. Comput. Electron. Agric. 2024, 220, 108918. [Google Scholar] [CrossRef]
  52. Saboori, M.; Asghar Torahi, A.; Reza Riyahi Bakhtyari, H. Combining Multi-Scale Textural Features from the Panchromatic Bands of High Spatial Resolution Images with ANN and MLC Classification Algorithms to Extract Urban Land Uses. Int. J. Remote Sens. 2019, 40, 8608–8634. [Google Scholar] [CrossRef]
  53. Zheng, H.; Cheng, T.; Zhou, M.; Li, D.; Yao, X.; Tian, Y.; Cao, W.; Zhu, Y. Improved Estimation of Rice Aboveground Biomass Combining Textural and Spectral Analysis of UAV Imagery. Precis. Agric. 2019, 20, 611–629. [Google Scholar] [CrossRef]
  54. Liu, Y.; Feng, H.; Yue, J.; Li, Z.; Jin, X.; Fan, Y.; Feng, Z.; Yang, G.; Laneve, G.; Yang, C.; et al. Estimation of Aboveground Biomass of Potatoes Based on Characteristic Variables Extracted from UAV Hyperspectral Imagery. Remote Sens. 2022, 14, 5121. [Google Scholar] [CrossRef]
  55. Tao, H.; Feng, H.; Xu, L.; Miao, M.; Long, H.; Yue, J.; Li, Z.; Yang, G.; Yang, X.; Fan, L. Estimation of Crop Growth Parameters Using UAV-Based Hyperspectral Remote Sensing Data. Sensors 2020, 20, 1296. [Google Scholar] [CrossRef]
  56. Marcone, A.; Impollonia, G.; Croci, M.; Blandinières, H.; Pellegrini, N.; Amaducci, S. Garlic Yield Monitoring Using Vegetation Indices and Texture Features Derived from UAV Multispectral Imagery. Smart Agric. Technol. 2024, 8, 100513. [Google Scholar] [CrossRef]
  57. Lu, H.; Liu, C.; Li, N.; Fu, X.; Li, L. Optimal Segmentation Scale Selection and Evaluation of Cultivated Land Objects Based on High-Resolution Remote Sensing Images with Spectral and Texture Features. Environ. Sci. Pollut. Res. 2021, 28, 27067–27083. [Google Scholar] [CrossRef]
  58. Mao, P.; Ding, J.; Jiang, B.; Qin, L.; Qiu, G.Y. How Can UAV Bridge the Gap between Ground and Satellite Observations for Quantifying the Biomass of Desert Shrub Community? ISPRS J. Photogramm. Remote Sens. 2022, 192, 361–376. [Google Scholar] [CrossRef]
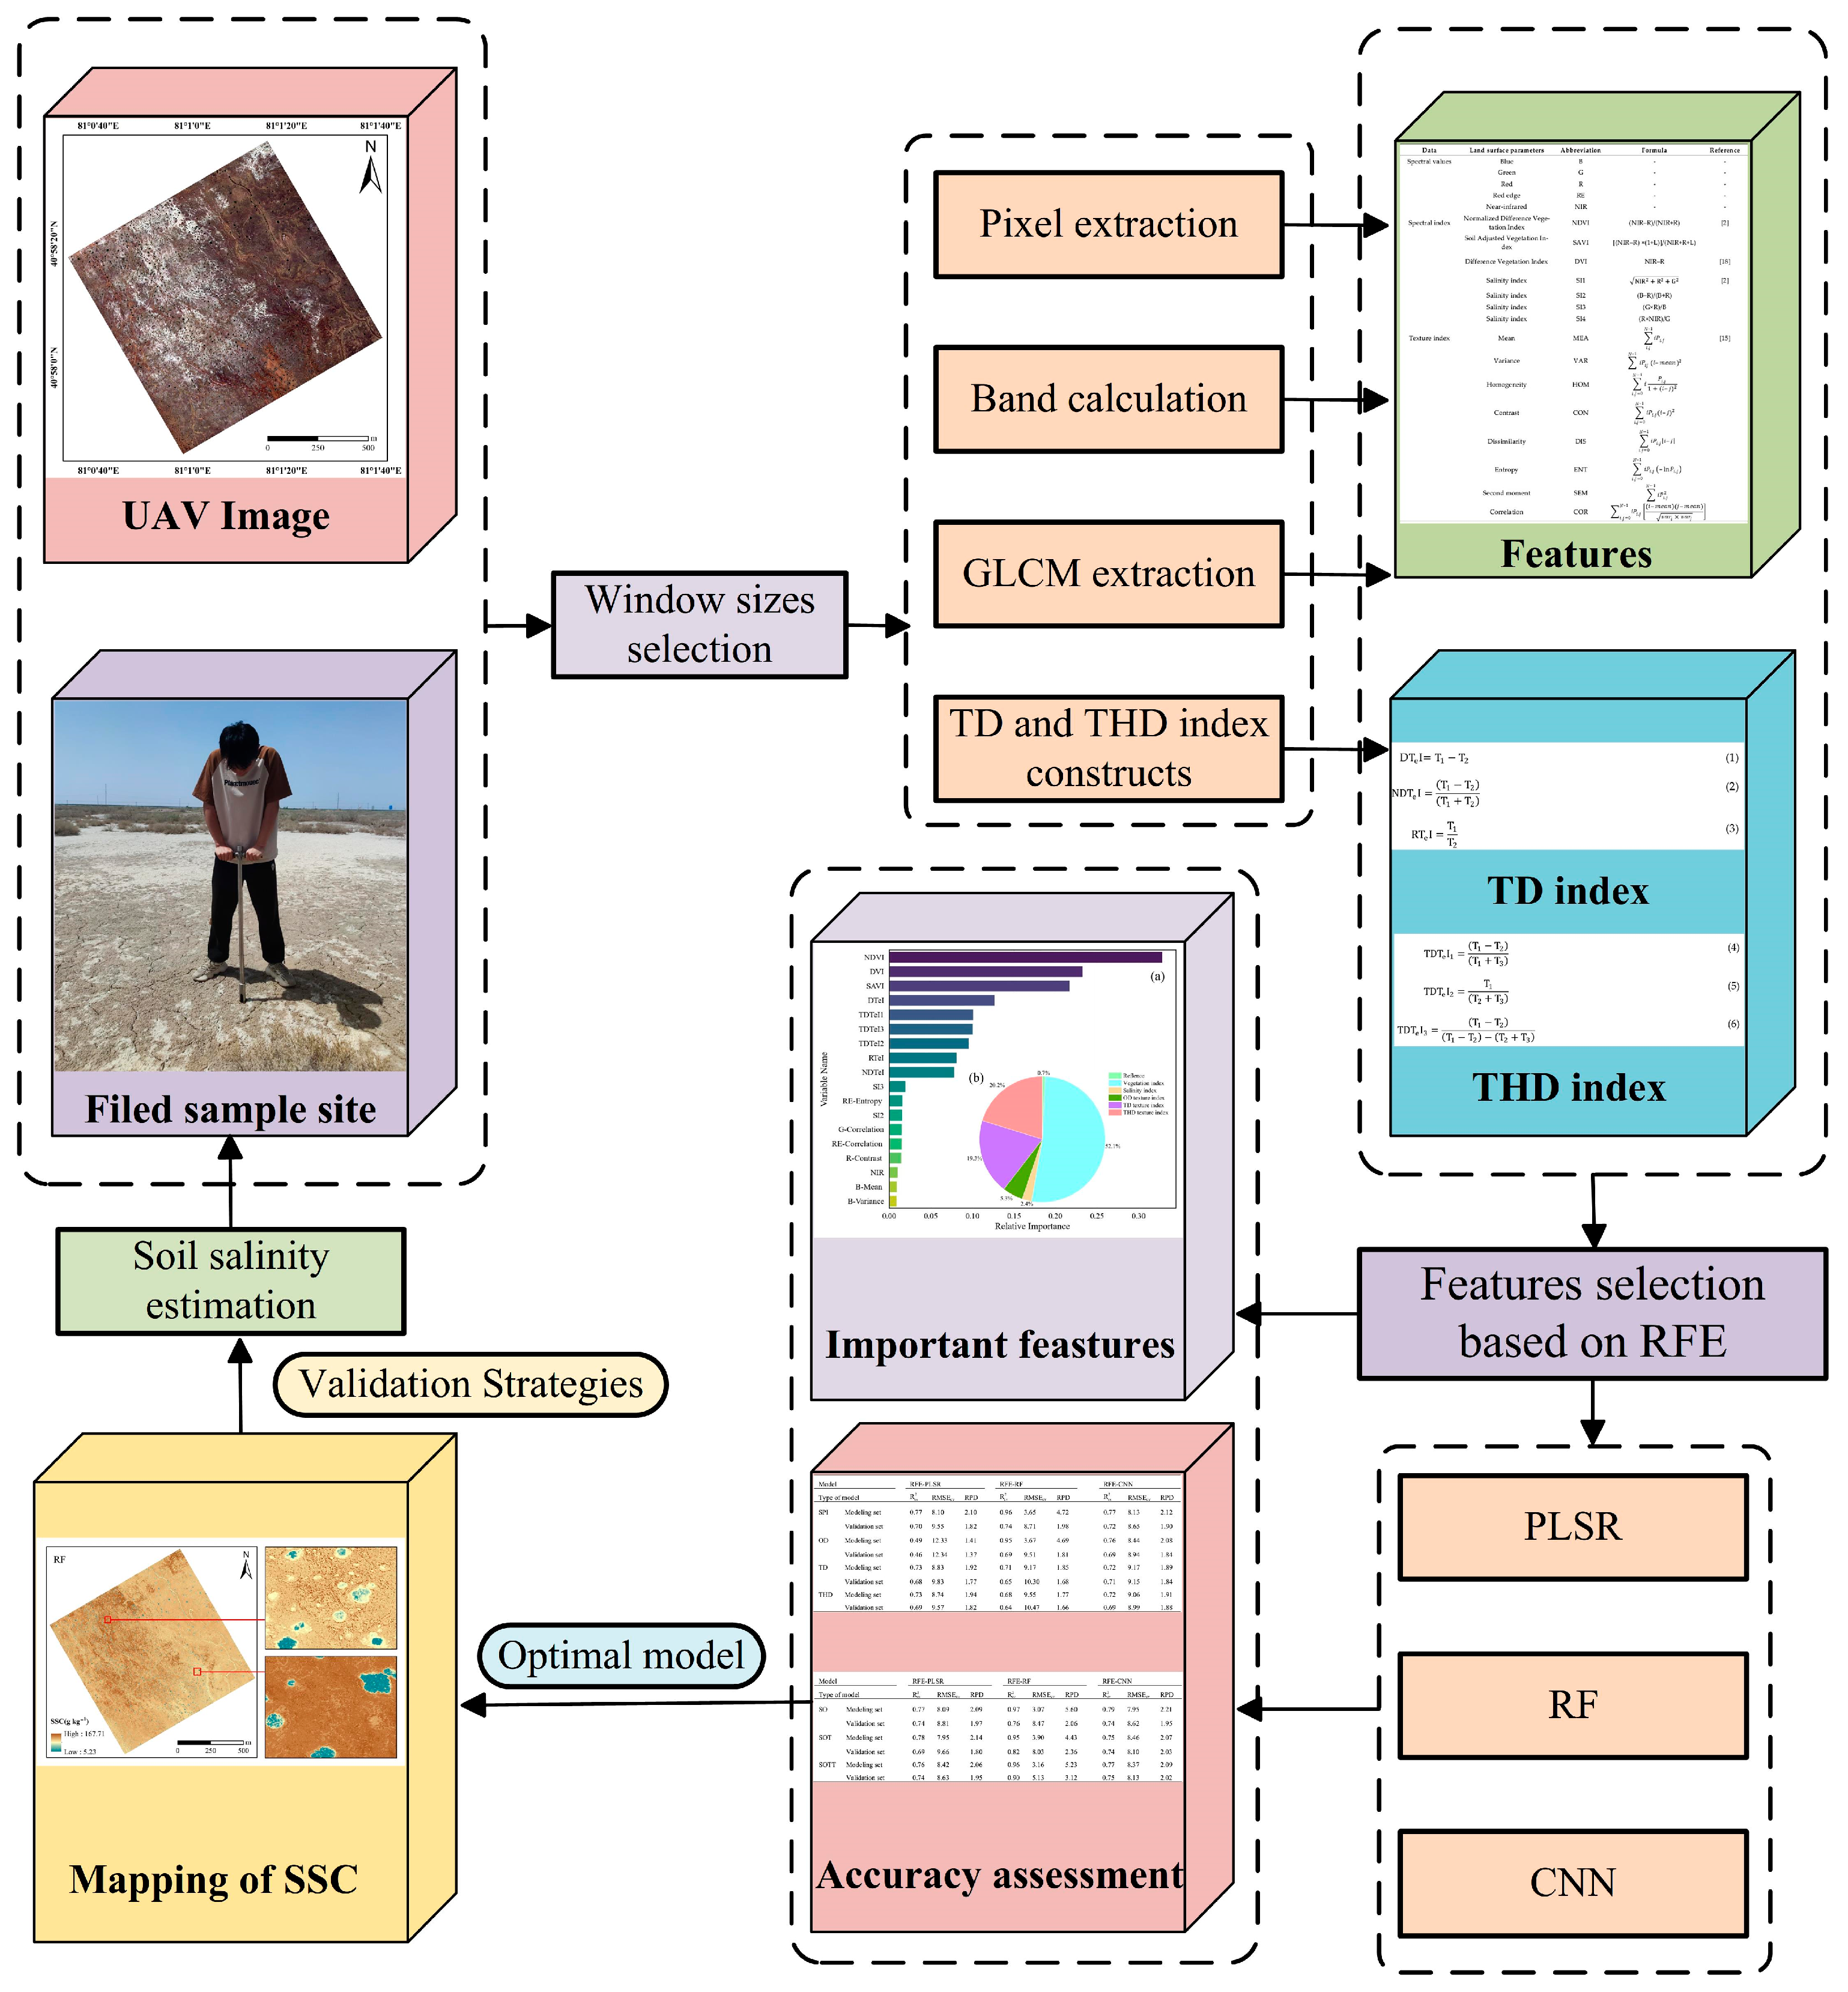
Figure 1. Flowchart of the study.
Remotesensing 16 03671 g001
Figure 2. The survey area, including: (a) location of the Xinjiang Province in China, (b) orthophoto map of the UAV and the location of sampling points, (c) DJI Phantom 4 Pro Multispectral Edition, (d) calibrated reflective panel captured by a multispectral camera, (e) the soil type, and (f) the main vegetation types.
Remotesensing 16 03671 g002
Figure 3. Feature window size.
Remotesensing 16 03671 g003
Figure 4. The estimation accuracy of RF at different feature window sizes.
Remotesensing 16 03671 g004
Figure 5. Correlation plot between spectral information and SSC.
Remotesensing 16 03671 g005
Figure 6. Correlation plot between OD texture features and SSC within (a) texture features in the blue band, (b) texture features in the green band, (c) texture features in the red band, (d) texture features in the red-edge band, and (e) texture features in the near-infrared band.
Remotesensing 16 03671 g006
Figure 7. Correlation plot between the TD texture index and SSC.
Remotesensing 16 03671 g007
Figure 8. Optimal correlation plot between the THD texture index and SSC.
Remotesensing 16 03671 g008
Figure 9. Evaluation of all feature-selected datasets and the accuracy of the three models. SPI, OD, TD, and THD represent the spectral information, one-dimensional texture index, two-dimensional texture index, and three-dimensional texture index, respectively. SO, SOT, and SOTT represent the spectral information + one-dimensional texture index, spectral information + one-dimensional texture index + two-dimensional texture index, and spectral information + one-dimensional texture index + two-dimensional texture index + three-dimensional texture index, respectively.
Remotesensing 16 03671 g009
Figure 10. SSC map derived from RF, CNN, and PLSR models.
Remotesensing 16 03671 g010
Figure 11. Variable importance of feature variables using the RF model. Where (a) represents the factor importance of different variables, and (b) represents the factor importance of different variable types.
Remotesensing 16 03671 g011
Table 1. UAV multispectral camera parameters.
FiltersBlueGreenRedRed EdgeNear-Infrared
Wavelength450 nm ± 16 nm560 nm ± 16 nm650 nm ± 16 nm730 nm ± 16 nm840 nm ± 26 nm
Table 2. Land surface parameters (spectral values, spectral index, and texture index) used to predict SSC in this study, along with their abbreviations, formulas, and references.
DataLand Surface ParametersAbbreviationFormulaReference
Spectral valuesBlueB--
GreenG--
RedR--
Red edgeRE--
Near-infraredNIR--
Spectral indexNormalized Difference Vegetation IndexNDVI(NIR − R)/(NIR + R)[2]
Soil-Adjusted Vegetation IndexSAVI[(NIR − R) × (1 + L)]/(NIR + R + L)
Difference Vegetation IndexDVINIR − R[18]
Salinity indexSI1 N I R 2 + R 2 + G 2 [2]
Salinity indexSI2(B − R)/(B + R)
Salinity indexSI3(G × R)/B
Salinity indexSI4(R × NIR)/G
Texture indexMeanMEA i , j N 1 i P i , j [15]
VarianceVAR i , j = 0 N 1 i P i j ( i m e a n ) 2
HomogeneityHOM i , j = 0 N 1 i P i , j 1 + ( i j ) 2
ContrastCON i , j = 0 N 1 i P i , j ( i j ) 2
DissimilarityDIS i , j = 0 N 1 i P i , j i j
EntropyENT i , j = 0 N 1 i P i , j ln P i , j
Second momentSEM i , j = 0 N 1 i P i , j 2
CorrelationCOR i , j = 0 N 1 i P i , j i m e a n j m e a n v a r i × v a r j
Note: The soil correction parameter L is 0.5.
Table 3. Descriptive statistics of soil properties in the calibration, validation, and total datasets.
DatasetsSoil PropertiesMaximumMinimumMeanMedianSDCV (%)
CalibrationSSC (g kg−1)156.0529.9386.4084.4719.7422.85
pH8.367.548.138.130.161.98
ValidationSSC (g kg−1)144.6435.7186.3484.4819.4422.52
pH8.307.348.128.130.141.95
TotalSSC (g kg−1)156.0529.9386.3884.4719.6022.69
Note: SD, standard deviation; CV, coefficient of variation.
Disclaimer/Publisher’s Note: The statements, opinions and data contained in all publications are solely those of the individual author(s) and contributor(s) and not of MDPI and/or the editor(s). MDPI and/or the editor(s) disclaim responsibility for any injury to people or property resulting from any ideas, methods, instructions or products referred to in the content.