Article

Mapping Earth Hummocks in Daisetsuzan National Park in Japan Using UAV-SfM Framework

1
Graduate School of Environmental Science, Hokkaido University, Sapporo 060-0810, Japan
2
Faculty of Environmental Earth Science, Hokkaido University, Sapporo 060-0810, Japan
3
Faculty of Urban Management, Fukuyama City University, Fukuyama 721-0964, Japan
*
Author to whom correspondence should be addressed.
Remote Sens. 2024, 16(19), 3610; https://doi.org/10.3390/rs16193610
Submission received: 2 September 2024 / Revised: 22 September 2024 / Accepted: 25 September 2024 / Published: 27 September 2024
(This article belongs to the Special Issue Remote Sensing for Mountain Ecosystems II)

Abstract

:
Earth hummocks are periglacial landforms that are widely distributed in arctic and alpine regions. This study employed an uncrewed aerial vehicle (UAV) and a structure from motion (SfM) framework to map and analyze the spatial distribution and morphological characteristics of earth hummocks across an extensive area in Daisetsuzan National Park, Japan. The UAV-captured images were processed using SfM photogrammetry to create orthomosaic images and high-resolution DEMs. We identified the distribution and morphological characteristics of earth hummocks using orthoimages, hillshade maps, and DEMs and analyzed how their morphological parameters relate to topographical conditions. A total of 18,838 individual earth hummocks in an area of approximately 82,599 m² were mapped and analyzed across the two study areas, surpassing the scale of existing studies. The average length, width, and height of these earth hummocks are 1.22 m, 1.03 m, and 0.15 m, respectively, and topographical features such as slope, aspect, and landforms are demonstrated to have an essential influence on the morphology of the earth hummocks. These findings enhance our understanding of topographical features. Furthermore, this study demonstrates the efficacy of utilizing the UAV-SfM framework with multi-directional hillshade mapping as an alternative to manual field measurements in studying periglacial landforms in mountainous regions.

Graphical Abstract

1. Introduction

Periglacial environments are characterized by the dominance of processes related to freezing and thawing cycles, with or without permafrost [1]. The distinctive landforms in periglacial regions produced by azonal processes collectively define the broader scope of periglacial geomorphology [2]. These dynamic landscapes result in ground movements such as cryoturbation and solifluction, which are vulnerable to climate change [3,4,5]. Relict periglacial landforms, such as ice-wedge polygons, rock glaciers, and solifluction lobes, have proven instrumental in reconstructing paleoenvironmental conditions, bridging our understanding of past to present periglacial dynamics [6,7,8,9].
Earth hummocks, one of the most widespread periglacial landforms in the alpine environment [10,11,12], refer to a specific form of non-sorted net patterned ground with a mesh characterized by a distinct three-dimensional knoblike shape and covered with vegetation [13,14], usually spaced on flat or gentle slopes [12]. The origin of earth hummocks has been explained by several theories, including the cellular circulation model [10], cryostatic and hydrostatic pressures [14,15], and differential frost heave [16,17,18], which suggest a polygenetic origin of the development process. Studies have shown that earth hummocks can exhibit unique physical, chemical, mineralogical, and micromorphological features [19] and serve as crucial paleoenvironmental proxies [20,21,22].
Recent research on earth hummocks has explored their morphological characteristics [23,24,25], spatial patterns [26,27,28], controlling environmental factors [29,30,31], and genetic processes across various geographical contexts [32,33,34]. In terms of morphological aspects, some studies have examined slope and aspect as factors influencing the shape of earth hummocks [14,35]; however, no research has yet been conducted in discontinuous mountain permafrost zones, and it remains necessary to clarify in more detail how topographical conditions affect the morphological parameters of earth hummocks. Existing studies typically examine at most several hundred earth hummocks. For example, Gurney and Hayward [36] examined the morphological attributes and developmental pathways of 650 earth hummocks in northern Norway. Ruiz-Fernández and his team [9] characterized 120 earth hummocks and their geomorphological settings in northeast Greenland. Milošević et al. [37] measured the morphological attributes of 305 hummocks in five regions of the Ponor Depression in Serbia.
Enhanced systematic quantification of vital physical parameters and their spatiotemporal variations is crucial for understanding earth hummocks [38]. The morphology of numerous earth hummocks within an extensive area still needs to be explored to avoid a fragmented understanding. In morphological studies, data collection and mapping constitute the most time-consuming and labor-intensive phases of research [39]. To expand the scale of the investigation, it is imperative to employ data collection and analysis methods that surpass traditional approaches in terms of both efficiency and precision, particularly for small-scale geomorphological features such as earth hummocks.
Structure from motion (SfM) is a sophisticated photogrammetric and computer vision method that uses a succession of overlapping two-dimensional (2D) pictures taken by a moving sensor to extract three-dimensional (3D) information [40,41]. Integrating uncrewed aerial vehicle (UAV) photogrammetry and SfM techniques has rapidly emerged as a robust survey methodology. It has been widely applied as a valuable investigative tool in surveying and related fields [42,43]. It ushered in a transformative era for geomorphological investigations and cartographic endeavors and enabled topography recording at extremely high spatial and temporal resolutions that are challenging for humans to access [44]. Recently, UAV-acquired high-resolution imagery has been used to create 3D models using SfM techniques. This enables the identification of geographical features, such as pit rim structures and hummocky landforms in debris avalanche deposits, from derived digital elevation models (DEMs) [45,46,47]. The synergistic use of UAV and SfM photogrammetry allows for precise, efficient, and cost-effective production [48], which is pivotal for identifying and analyzing the detailed characteristics of landforms. Given these benefits, the UAV-SfM research framework has been increasingly investigating periglacial landforms in recent years, including ice-wedge polygons, fan surfaces, and sorted circles [49,50,51,52]. However, extant studies have not examined detailed morphological data of earth hummocks. A detailed methodology and workflow for acquiring and analyzing extensive morphological data on a more significant number of earth hummocks is yet to be proposed.
The objectives of this study were to: (1) investigate the detailed distribution and morphological characteristics of earth hummocks in a study area using the UAV-SfM framework; (2) analyze the relationships between the morphological parameters (length, width, and height) of earth hummocks and topographical conditions using a geographic information system (GIS); and (3) validate the reliability of the UAV-SfM framework for studying earth hummocks in mountainous regions. For these objectives, we chose Daisetsuzan National Park, Japan.

2. Materials and Methods

2.1. Study Area

Daisetsuzan National Park, spanning 2267.6 km2, is in the mountainous center of Hokkaido, Japan’s northernmost island. It was established on 4 December 1934. It is one of Japan’s oldest national parks and remains the country’s second largest national park [53]. The park’s center is dominated by the Daisetsuzan Volcanic Group, which consists of several volcanoes exceeding 2000 m in elevation [54] and features Ohachi-daira, a 2000 m diameter caldera formed by volcanic eruptions approximately 30,000 years ago [55]. Volcanic activity began in the Late Pleistocene, and eruptions continued during the Holocene. The extensive, gently sloping bare lands adorned with pyroclastic deposits or lava are gentle lava plateaus that facilitate the retention of high water content in the active layer [56]. This condition makes the Daisetsu Mountains a suitable setting for developing periglacial landforms, making it potentially the largest region in Japan with permafrost and periglacial features [56,57].
The current pyroclastic deposits generated by an eruption from the caldera covered the mountains surrounding the Ohachi-daira, forming several pyroclastic flow plateaus [58]. The specific areas chosen for UAV flights were the Hokkai-daira (Area A, 1.3 km2) and Kumono-daira (Area B, 0.8 km2) plateaus located northeast and southeast of the Ohachi-daira, respectively (Figure 1). These are covered with pumice and welded tuff from volcanic eruptions, forming gentle surfaces at approximately 2000 m, concurrent with the emergence of Ohachi-daira [59]. As early as the 1960s, Koaze [60] used a traditional field plane table method to create paper-based periglacial landform maps of these areas and identified numerous periglacial landforms.
The flat summit terrain experiences heavy snowfall and strong westerly winds predominantly during winter [61]. Permafrost has been confirmed above 1700 m [62,63]. The alpine zone of Daisetsuzan is a notable example of Japan’s periglacial environment and encompasses a multitude of plant and animal species that are hypothesized to be relicts from the Pleistocene epoch [64,65].

2.2. Earth Hummocks in the Study Area

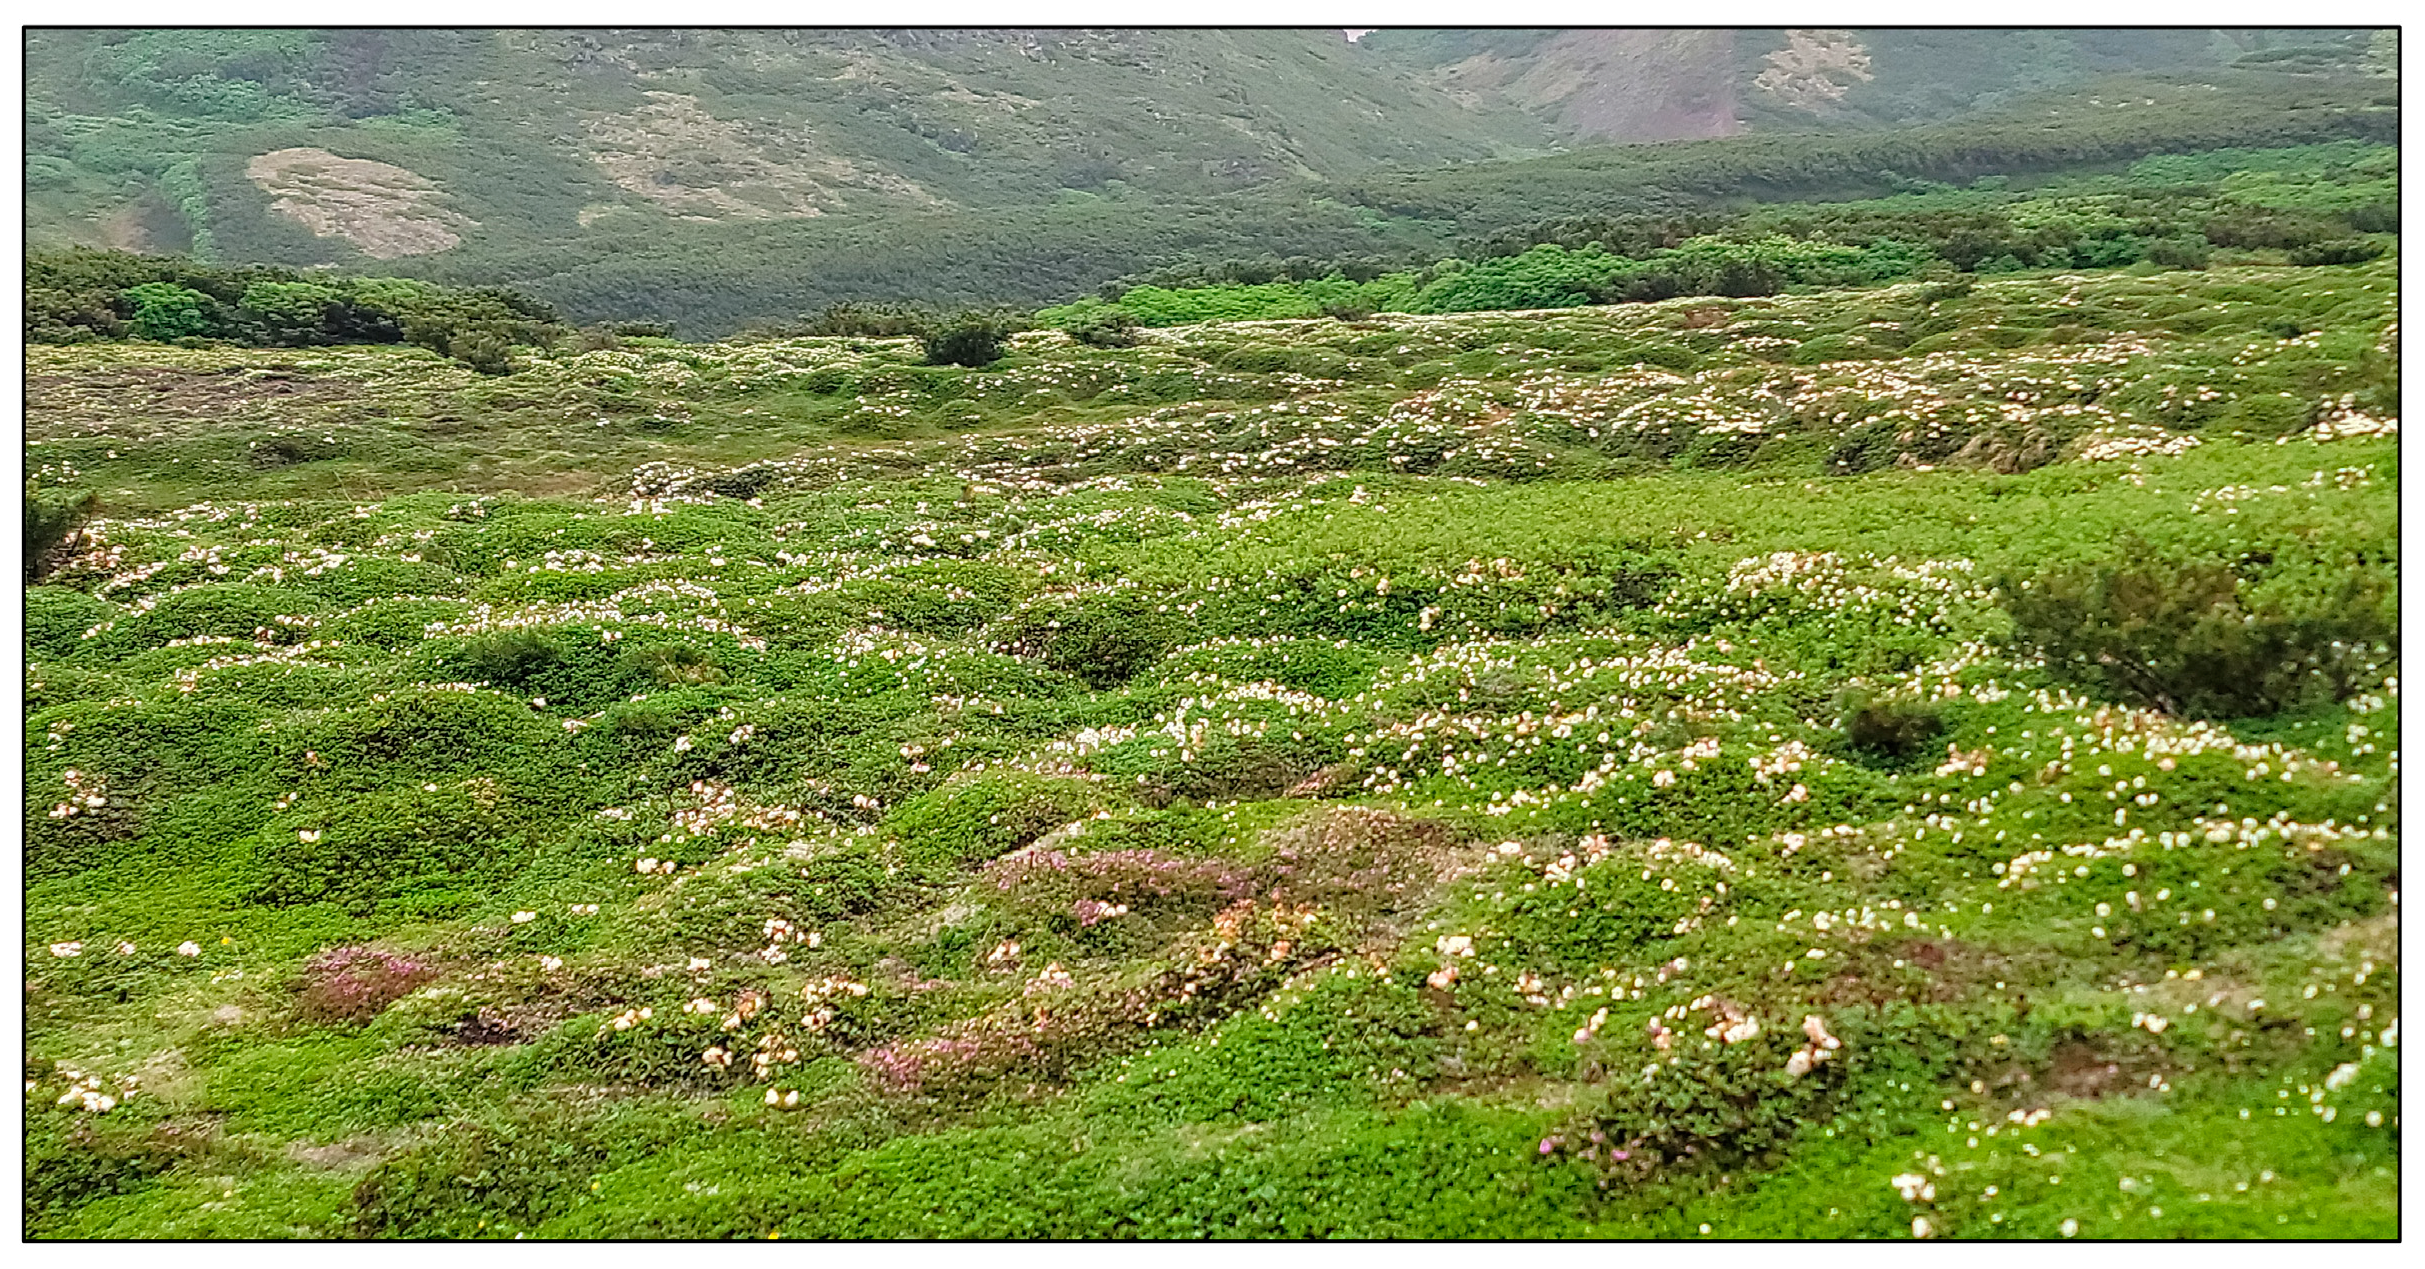
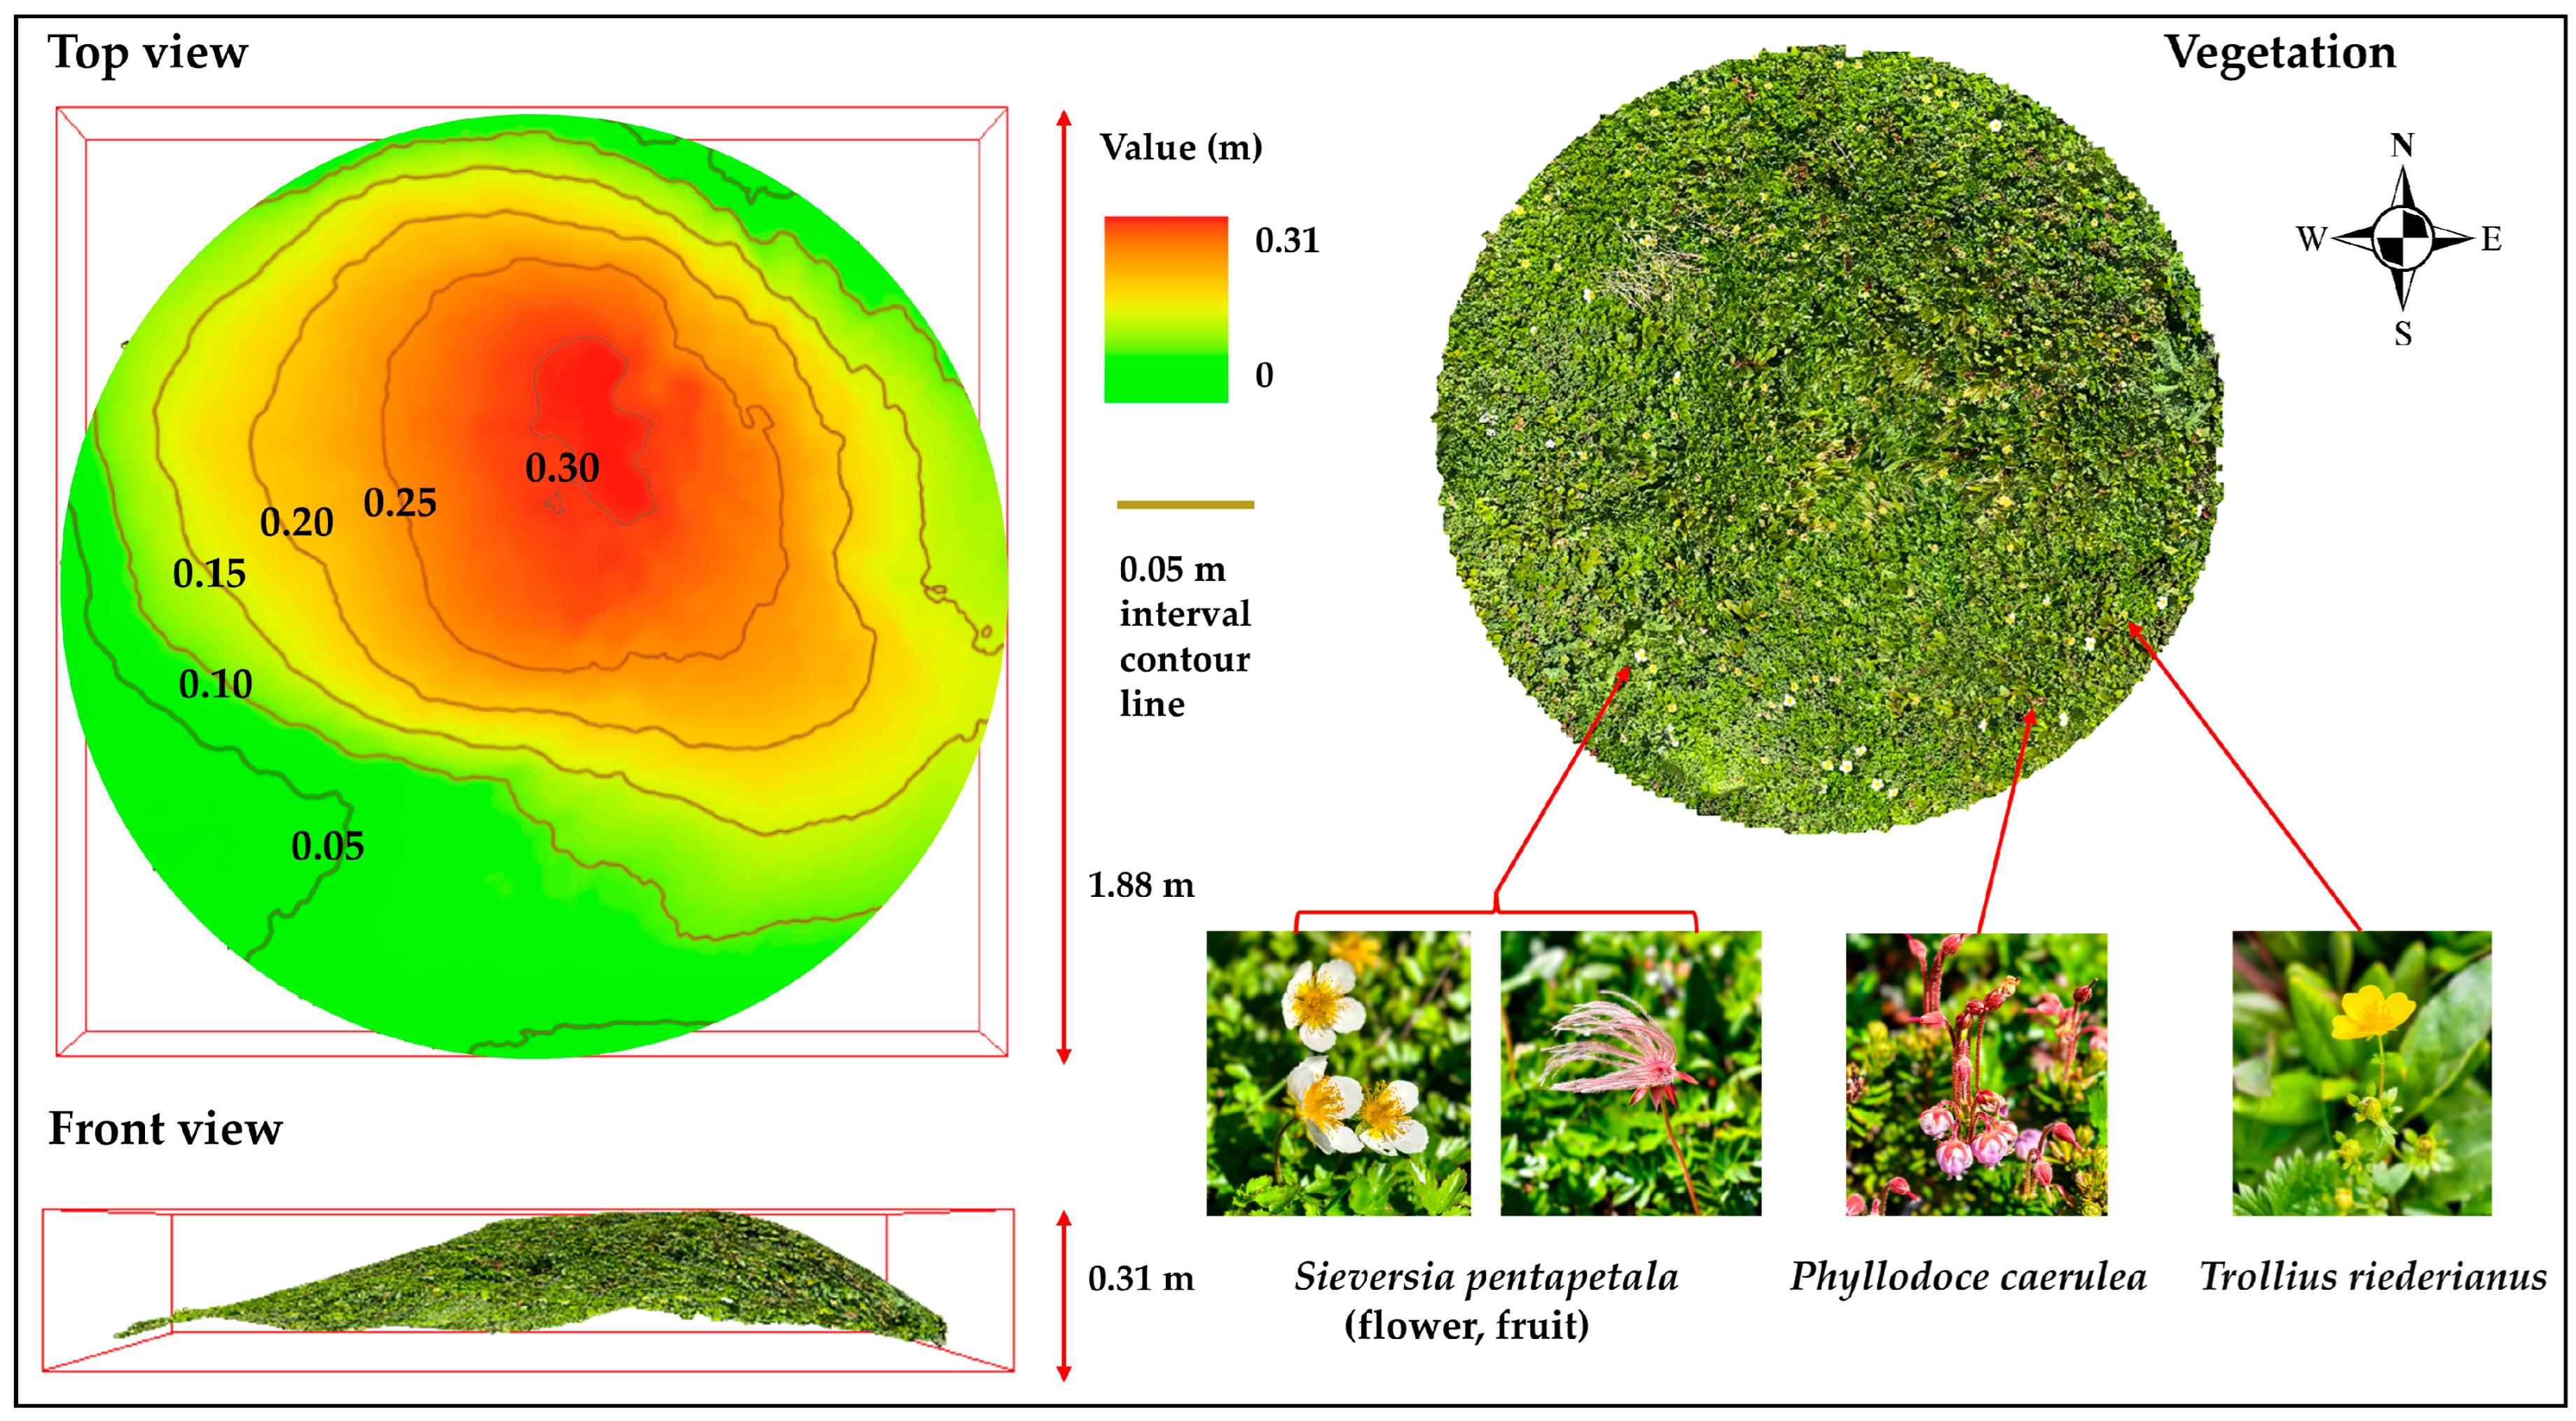
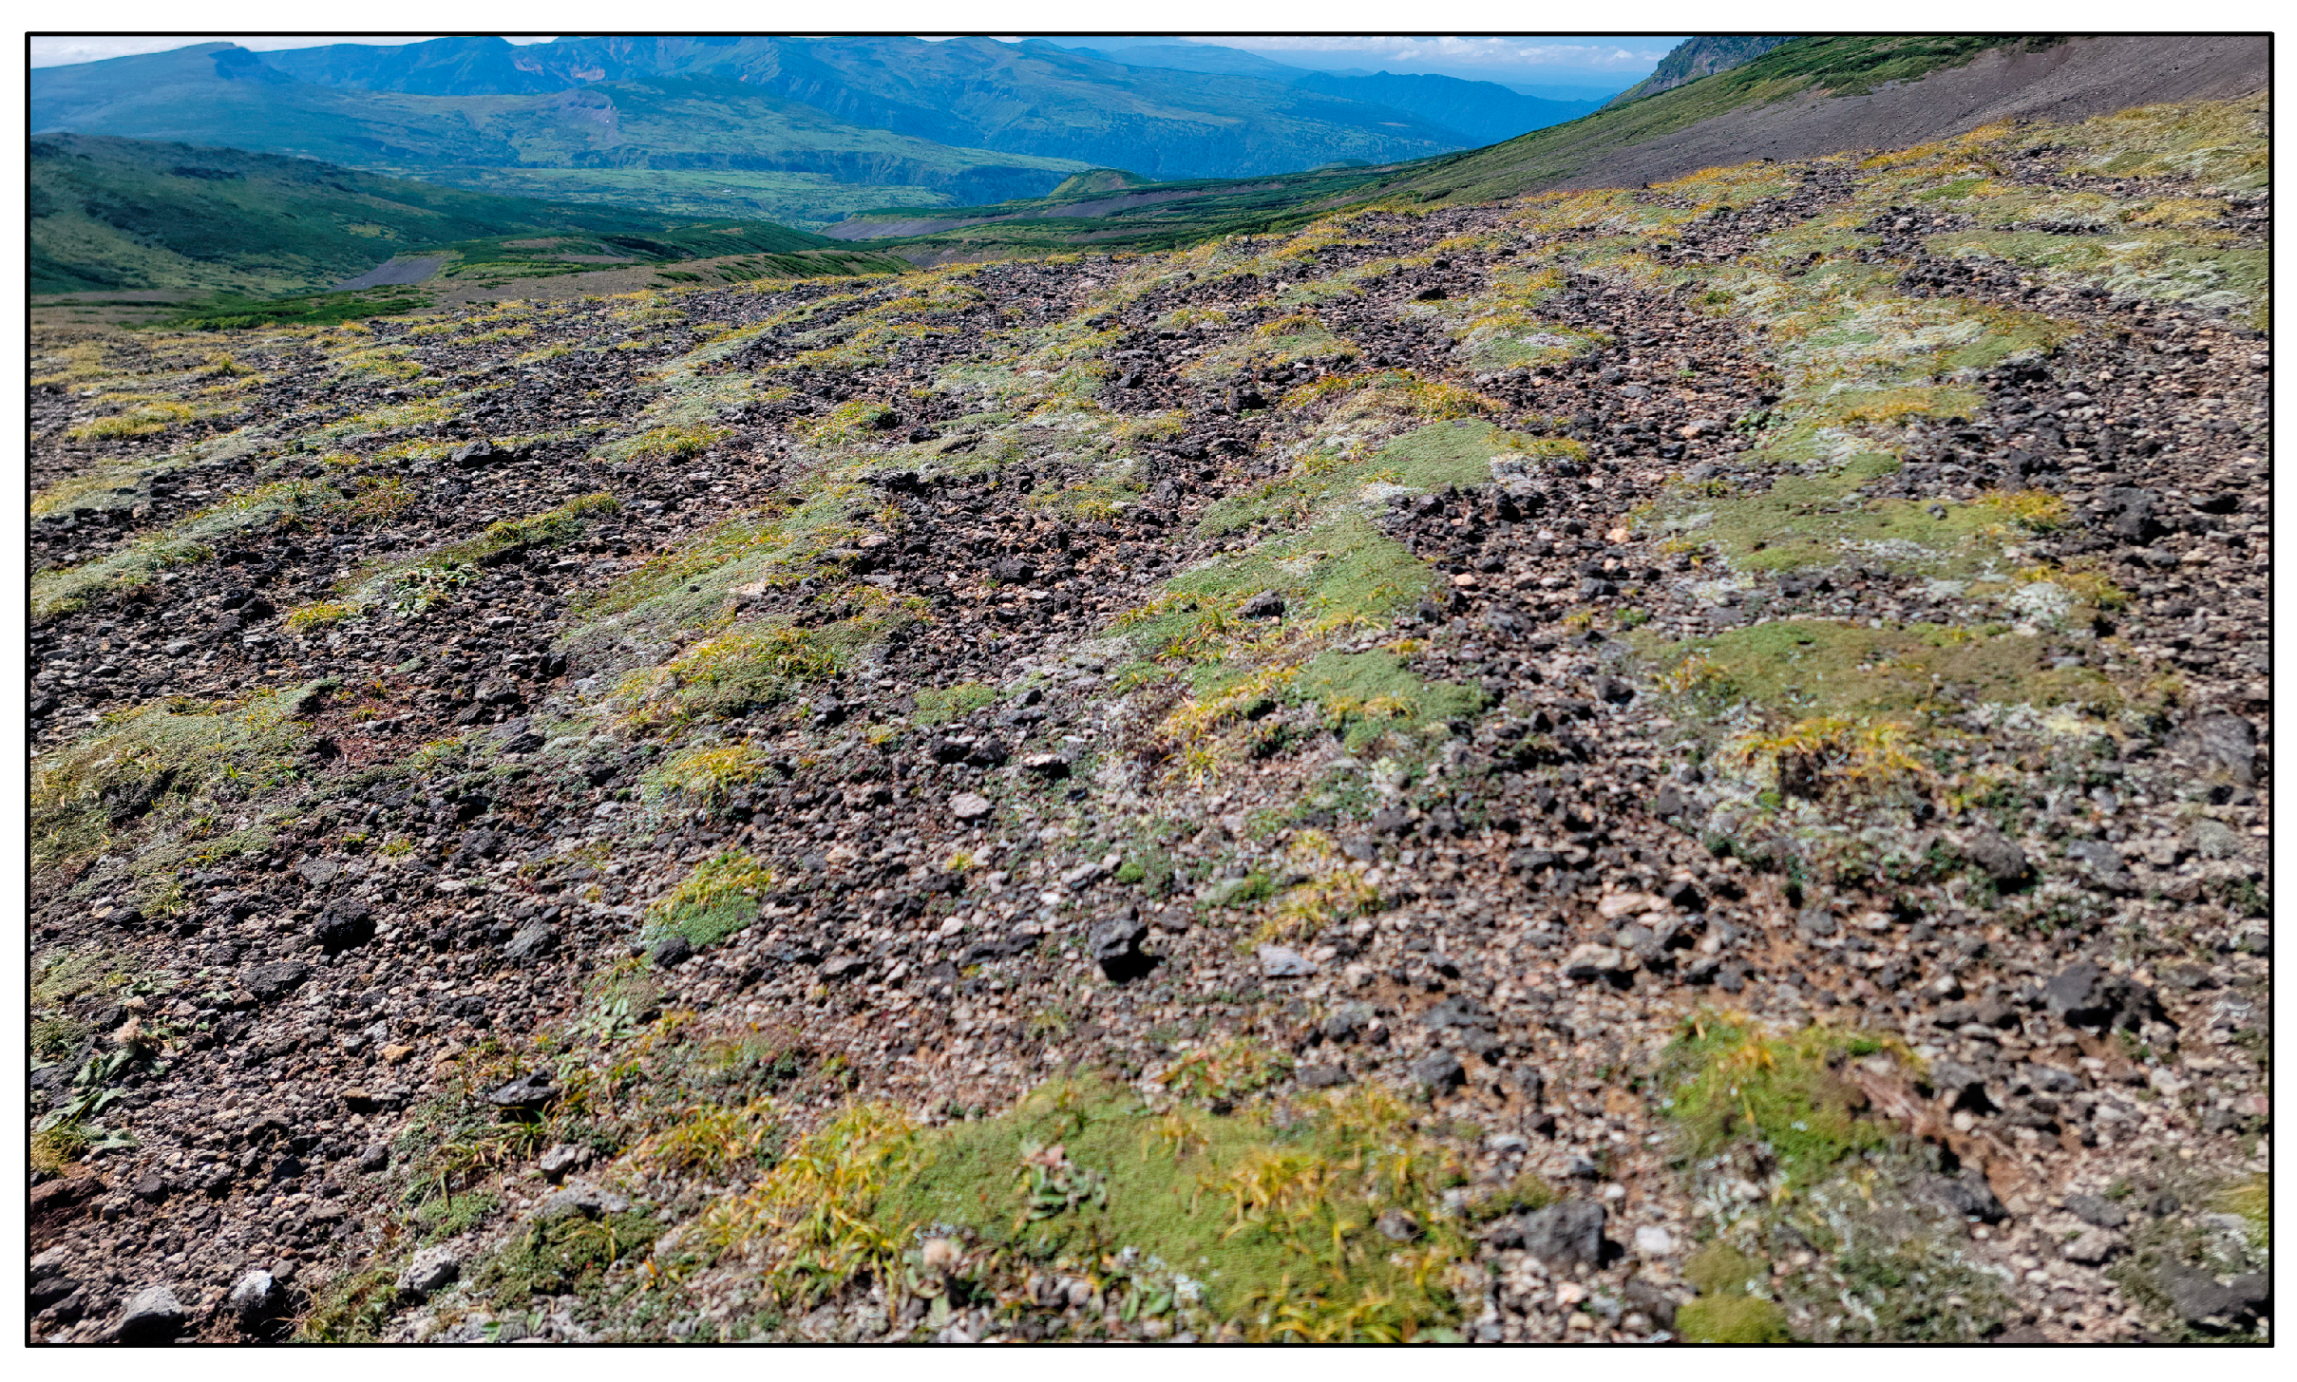
Figure 2 shows a photograph of the earth hummocks in Area B. To enhance the description of the surface cover of these earth hummocks, we conducted a 3D scan using an iPhone equipped with LiDAR technology (iPhone 15 Pro, manufactured by Apple Inc., Cupertino, California, USA, with the built-in Sony IMX591 Time of Flight (ToF) LiDAR sensor, produced by Sony Corporation, Tokyo, Japan). The scan targeted a prominent earth hummock adjacent to the hiking trail in Area B, which was digitally trimmed to a circular area using the 3D scanner app (version 2.1.3). This scan, consisting of 37.4 k triangles and 18.9 k vertices, was completed in July 2024, when we were able to see the different flowers, as shown in Figure 3. The scan revealed that the hummock was populated by various plant species, including Sieversia pentapetala, Phyllodoce caerulea, and Trollius riederianus. The distribution of vegetation varied significantly among individuals. These variations are attributable to the differing exposure of the hummocks to the wind (windward and leeward sides), snow accumulation, and moisture conditions [66]. For example, only earth hummocks near water sources have wetland plants on them.

2.3. UAV Data Acquisition Process

We used a DJI Phantom 4 RTK (manufactured by DJI, Shenzhen, China) equipped with a 1-inch 20MP CMOS sensor. The UAV has an internal Global Navigation Satellite System (GNSS) receiver to record its rover position and satellite observation data for real-time kinematic (RTK) processing with the D-RTK2 GNSS base station, which is also manufactured by DJI. The horizontal and vertical positioning accuracies of the aircraft with the FIX solutions by RTK correction are expected to be 1 cm and 2 cm, respectively. The base station was set in the field, and the positioning data of the base station were corrected later using post-processed kinematic (PPK) with a nearby permanent GNSS base station. This approach is particularly suitable for mountainous areas, where network connectivity is unavailable. According to an accuracy study, the PPK solution can offer similar levels of accuracy to the ground control point solution [67]. We used a GNSS-based Control Station located at Higashikawa (ID: 020867) provided by the Geospatial Information Authority of Japan (GSI) (https://terras.gsi.go.jp/, accessed 1 August 2024), approximately 10 km from the study area. Post-processing involved converting the DAT file’s location data from D-RTK2 to RINEX format and the PPK corrections for each D-RTK2 position using RTKLIB software (version 2.4.3) [68], achieving fixed solutions for both the Hokkai-daira (two positions) and Kumono-daira (one position). The differences between the tentative and corrected base coordinates were calculated and applied to shift the camera positions during the SfM process, ensuring high-precision georeferencing of the position data.
The UAV flights were conducted over two days on September 8th and 9th, 2022, under favorable weather conditions with light winds. Flight plans were generated by DJI GS RTK software (version v2.2.0) designed in terrain-following mode using a 10 m resolution DEMs (DEM10B) provided by the GSI as a reference surface. Aerial surveys were conducted at two distinct flight altitudes: a higher altitude of approximately 80 m for a broader area, and a lower altitude of approximately 40 m along the hiking trail for more detailed mapping. Camera angles of 70° and 75° were chosen to avoid the doming effect, which is often observed with nadir camera orientations [69]. The image overlap was set to 80% in the flight direction and 70% in the lateral direction. The UAV captured 2754 images in Area A and 1497 in Area B (Table 1).

2.4. SfM Processing to Generate Orthomosaic Images and DEMs

This study employed Agisoft Metashape Pro software (version 1.8) to process UAV images using SfM photogrammetry. Metashape has been widely validated in the literature for its reliability, particularly in processing UAV imagery. The photogrammetry steps were as follows [70]: import of images, metadata, and coordinates; inspect load images and discard unnecessary images; align the photographs and generate sparse point clouds; optimize camera positions; densify the point cloud; convert into triangulated 3D mesh and apply texture; build orthomosaic images and DEMs; and export the results.

2.5. Mapping and Visualizing the Terrain Characteristics

To comprehend and illustrate the topographic characteristics of the study areas, we focused on four vital topographic indices: slope, aspect, topographic wetness index (TWI), and Geomorphon Landforms classification. All maps of slopes, aspects, TWI, and Geomorphon Landforms were produced using tools in ArcGIS Pro (version 3.2) based on 5 m resolution DEMs (DEM5A) provided by the GSI. DEM5A data were derived from airborne laser measurements, from which artificial structures and vegetation such as trees were removed. To process the DEM5A data in ArcGIS Pro, we used a dedicated plugin. After adding the converted data to the software using the plugin, the “Elevation Void Fill” raster function was employed since water areas appear as “Nodata”. We set the [Maximum Void Width] parameter to 0 to fill all no-data areas. Subsequently, we generated a new layer and exported the processed data.
The TWI index was then employed to determine the soil moisture conditions in the study area. It is one of the most reliable soil wetness predictors [71]. The increasing availability of high-resolution DEM data has led to the growing utilization of TWI in various fields and remote regions [72]. Calculation of TWI uses the formula ln(a/tanβ), where ‘a’ denotes the upslope area draining through the specific point per unit contour length, and ‘tanβ’ denotes the terrain gradient at that point [73]. Higher TWI values represent convergence zones for water with higher soil moisture levels, typically suggesting suitability for wetlands or marsh formations. Lower TWI values represent well-drained and typically drier areas. The steps were derived from the methodology employed in calculating TWI using the System for Automated Geoscientific Analyses (SAGA GIS) [74], albeit using different software. We compared the results of TWI calculations using DEMs with different resolutions and determined that the 5 m resolution DEM5A provides sufficient detail while maintaining computational efficiency, and the results are consistent with field survey observations.
We used the Geomorphon Landforms tool in ArcGIS Pro to classify the terrain of the study area. This classification is a solid and effective depiction method for classifying and mapping landform elements derived from the DEM data [75]. It offers a benefit compared with fundamental elevation analysis, enabling classification at broader scales while maintaining the original spatial resolution. This makes it suitable for diverse geomorphological and hydrological studies [76]. We employed this method to categorize the terrain into ten common landform elements: pit, valley, footslope, hollow, slope, spur, shoulder, ridge, peak, and flat. After comparisons, we used the parameters of a 50 m search distance and 5° as an angle threshold.

2.6. Identifying the Distribution of Earth Hummocks

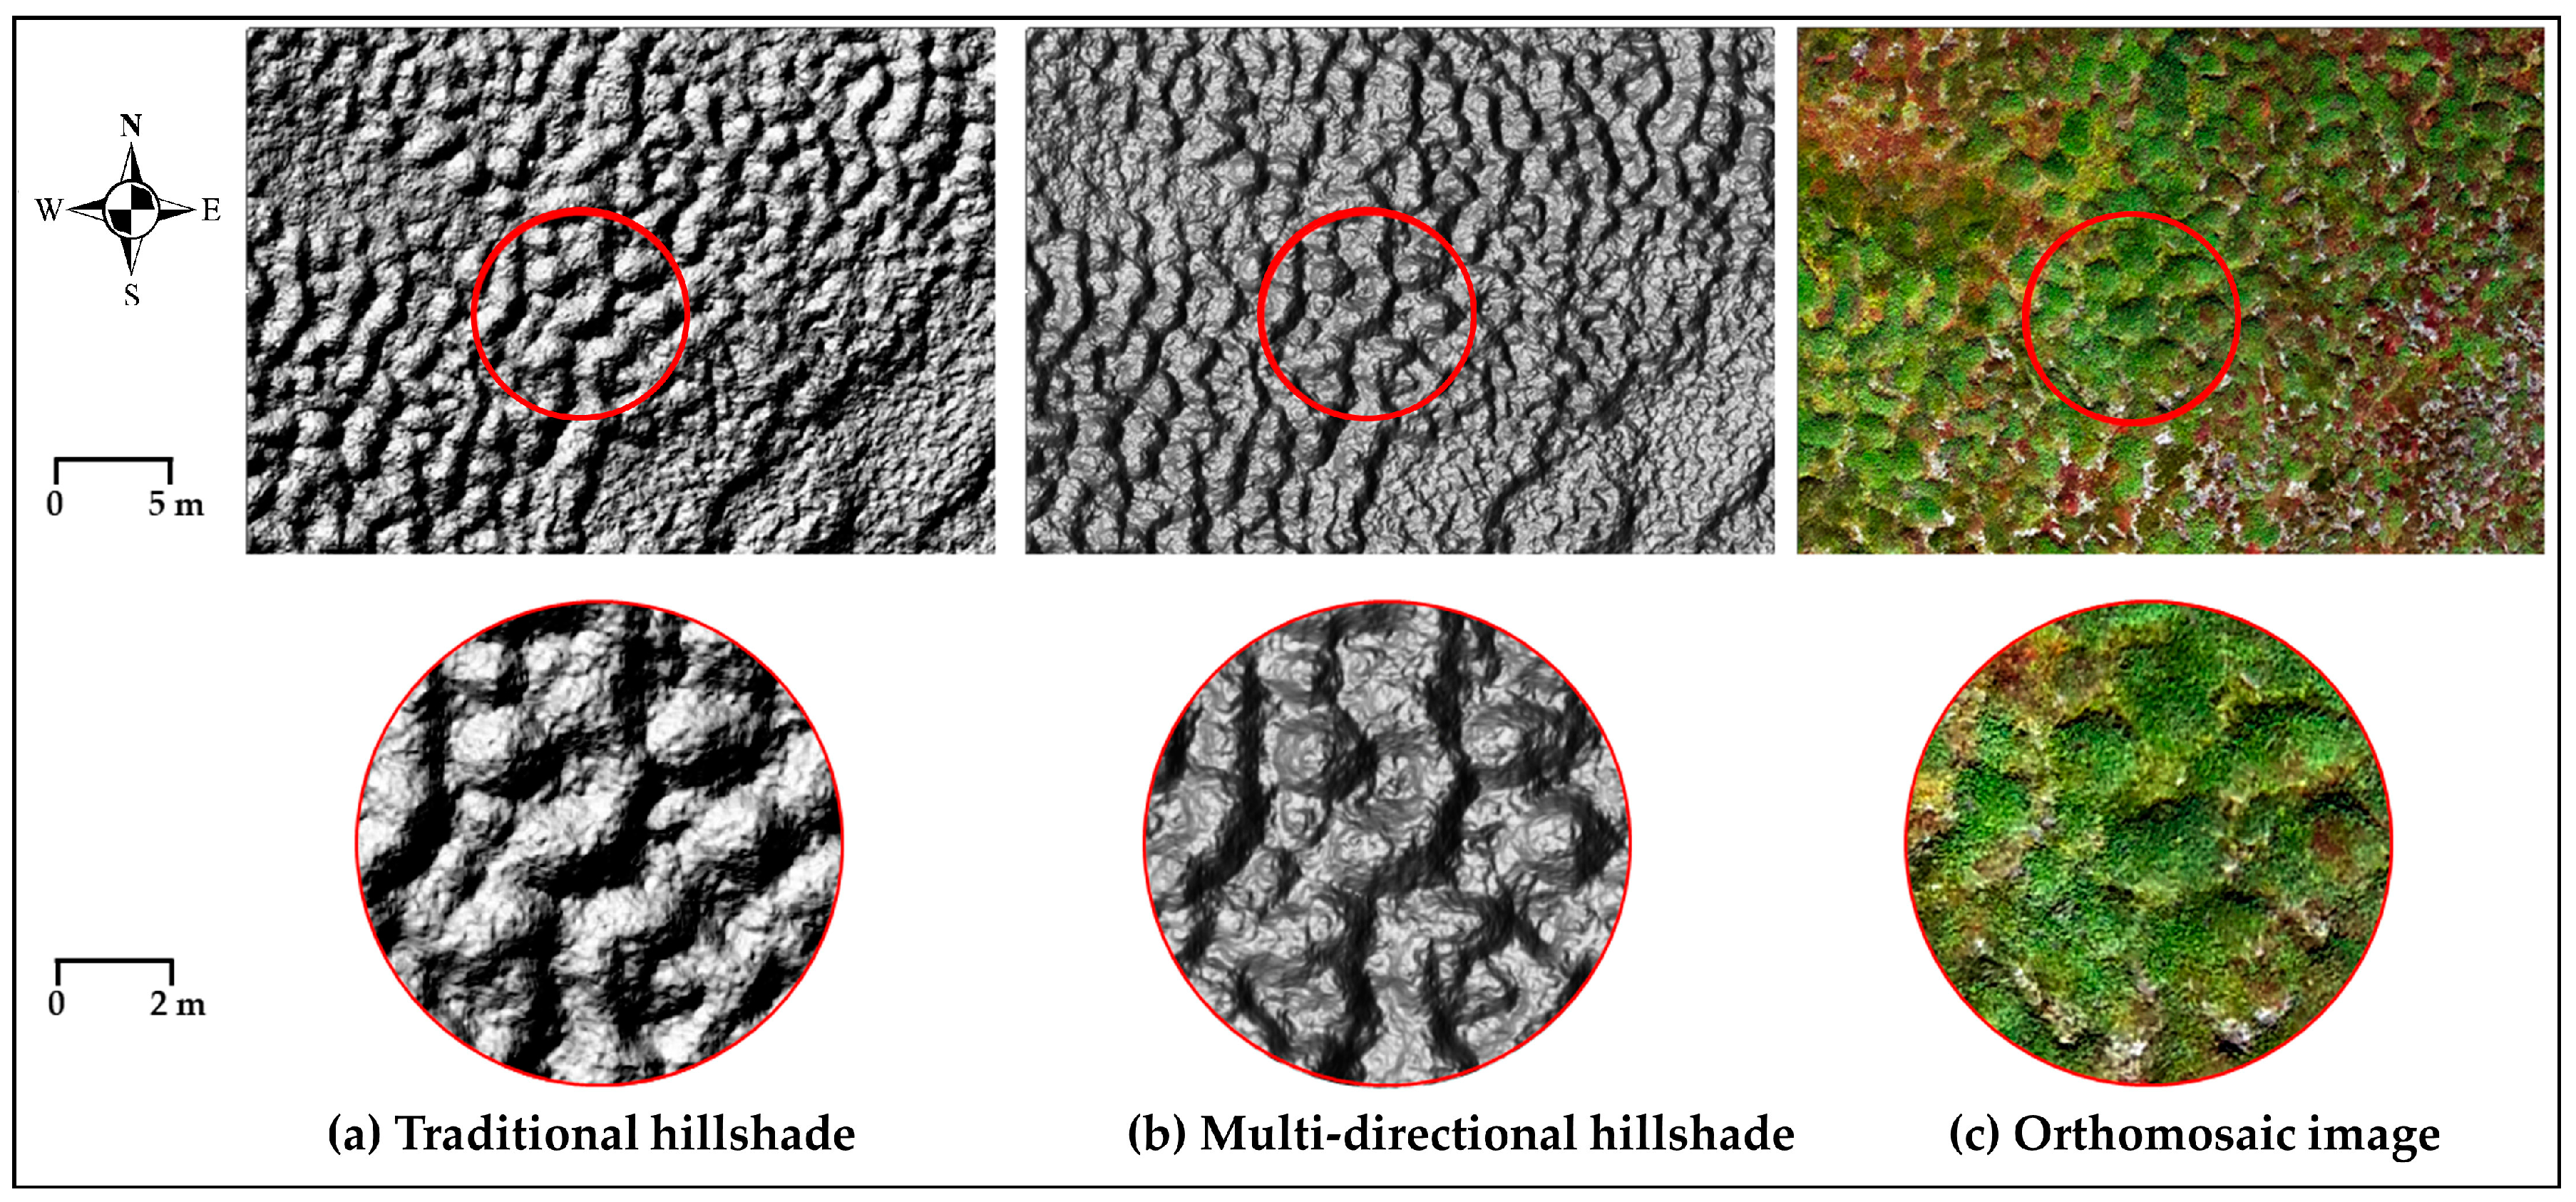
Analytical relief shading has become more prevalent with the development of DEMs, enhancing the visualization of high-resolution terrain data [77] and the interpretation of map elements [78]. However, traditional hillshade with a single light source always requires enhancement. For example, it cannot depict massif directions in mountainous terrain, and it is challenging to identify subtle variations in the relief [79]. The single direction of the light source frequently overexposes the lighted sides and hides features of the terrain on the unilluminated sides. In contrast, the multi-directional hillshade more accurately depicts the topography and balances the overexposed and unlit portions of the map by adjusting the light direction from six separate sources (Figure 4). Considering this, we employed a multi-directional hillshade to facilitate the interpretation of earth hummocks, and the height index (Z) was adjusted to 3 for a better effect.
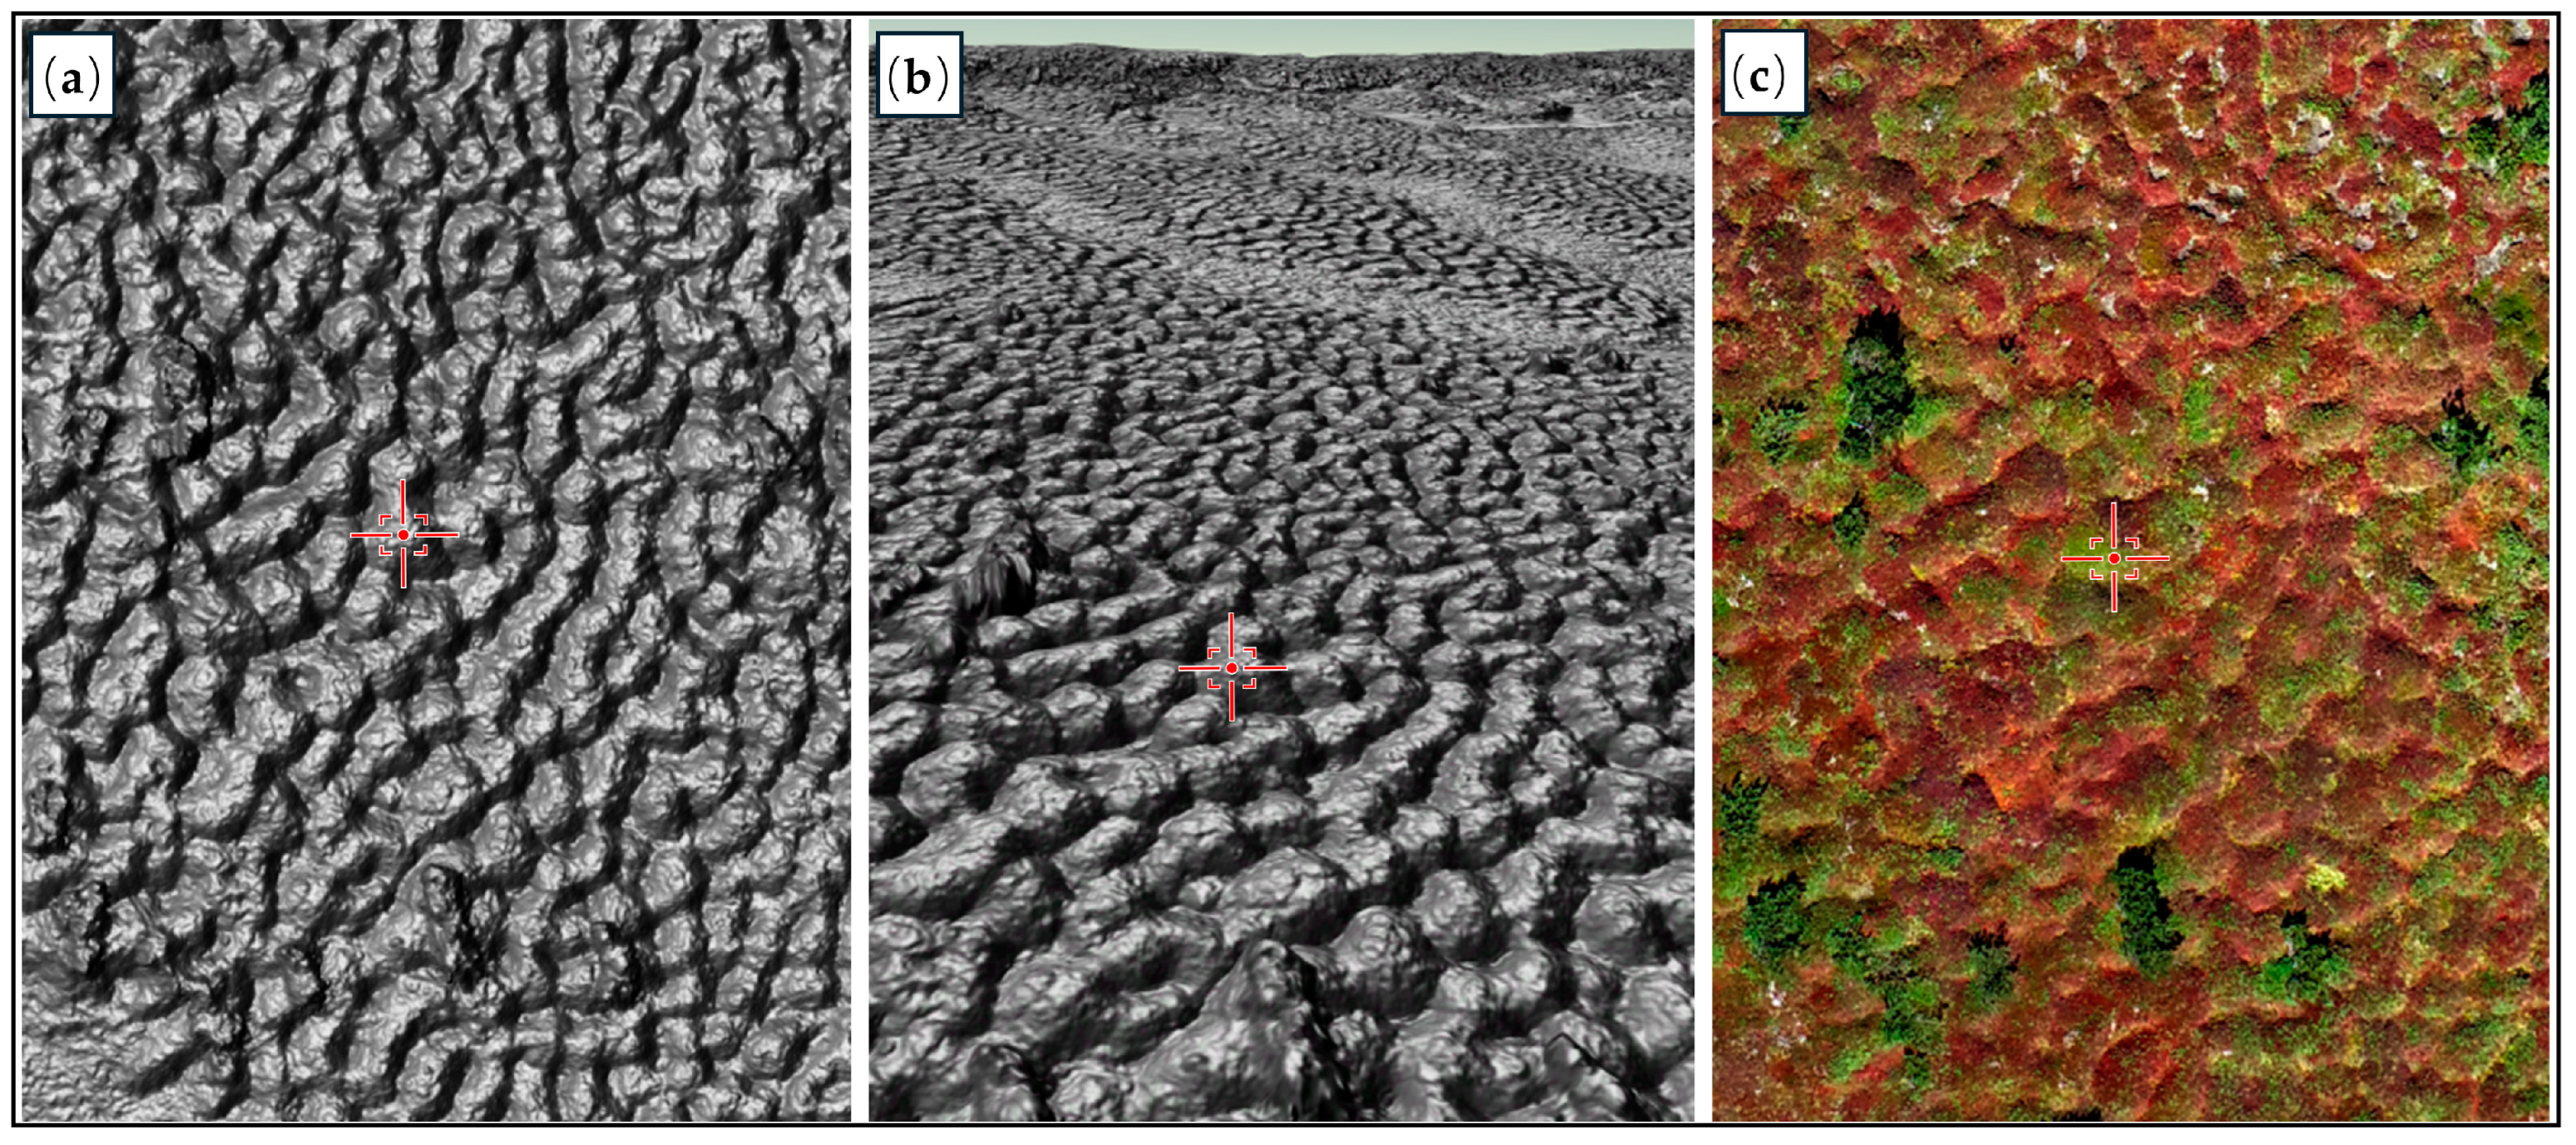
The steps are as follows: First, create three views in ArcGIS Pro and link all views together (Figure 5) to enable viewing a site from three different perspectives simultaneously. A preliminary site was selected using the terrain conditions in the 2D hillshade map (view a). Earth hummocks are more prominently visible in the hillshade map than in the orthomosaic images, displaying distinct patterns of dense and irregular mounds. These patterns help distinguish prominent earth hummock sites from other locations. Then, the hillshade map from a 3D perspective (3D height information is from the UAV-derived DEMs) is used to verify whether the terrain is raised on the 3D structure and to determine the detailed shape of each earth hummock (view b). This step allows for a better understanding of the less clear parts of the hillshade map by observing the elevation information from the DEMs in the 3D view, leading to a more accurate determination of the shapes. At the same time, the orthomosaic image rules out protrusions caused by non-earth-hummock features, such as dwarf pine or rocks (view c). For example, Pinus pumila appears as a deeper green, and rocks appear white on the image, distinctly different from the vegetation color on the earth hummocks, which is usually red or light green during the UAV flight season.

2.7. Acquiring Data on Individual Hummock Shapes

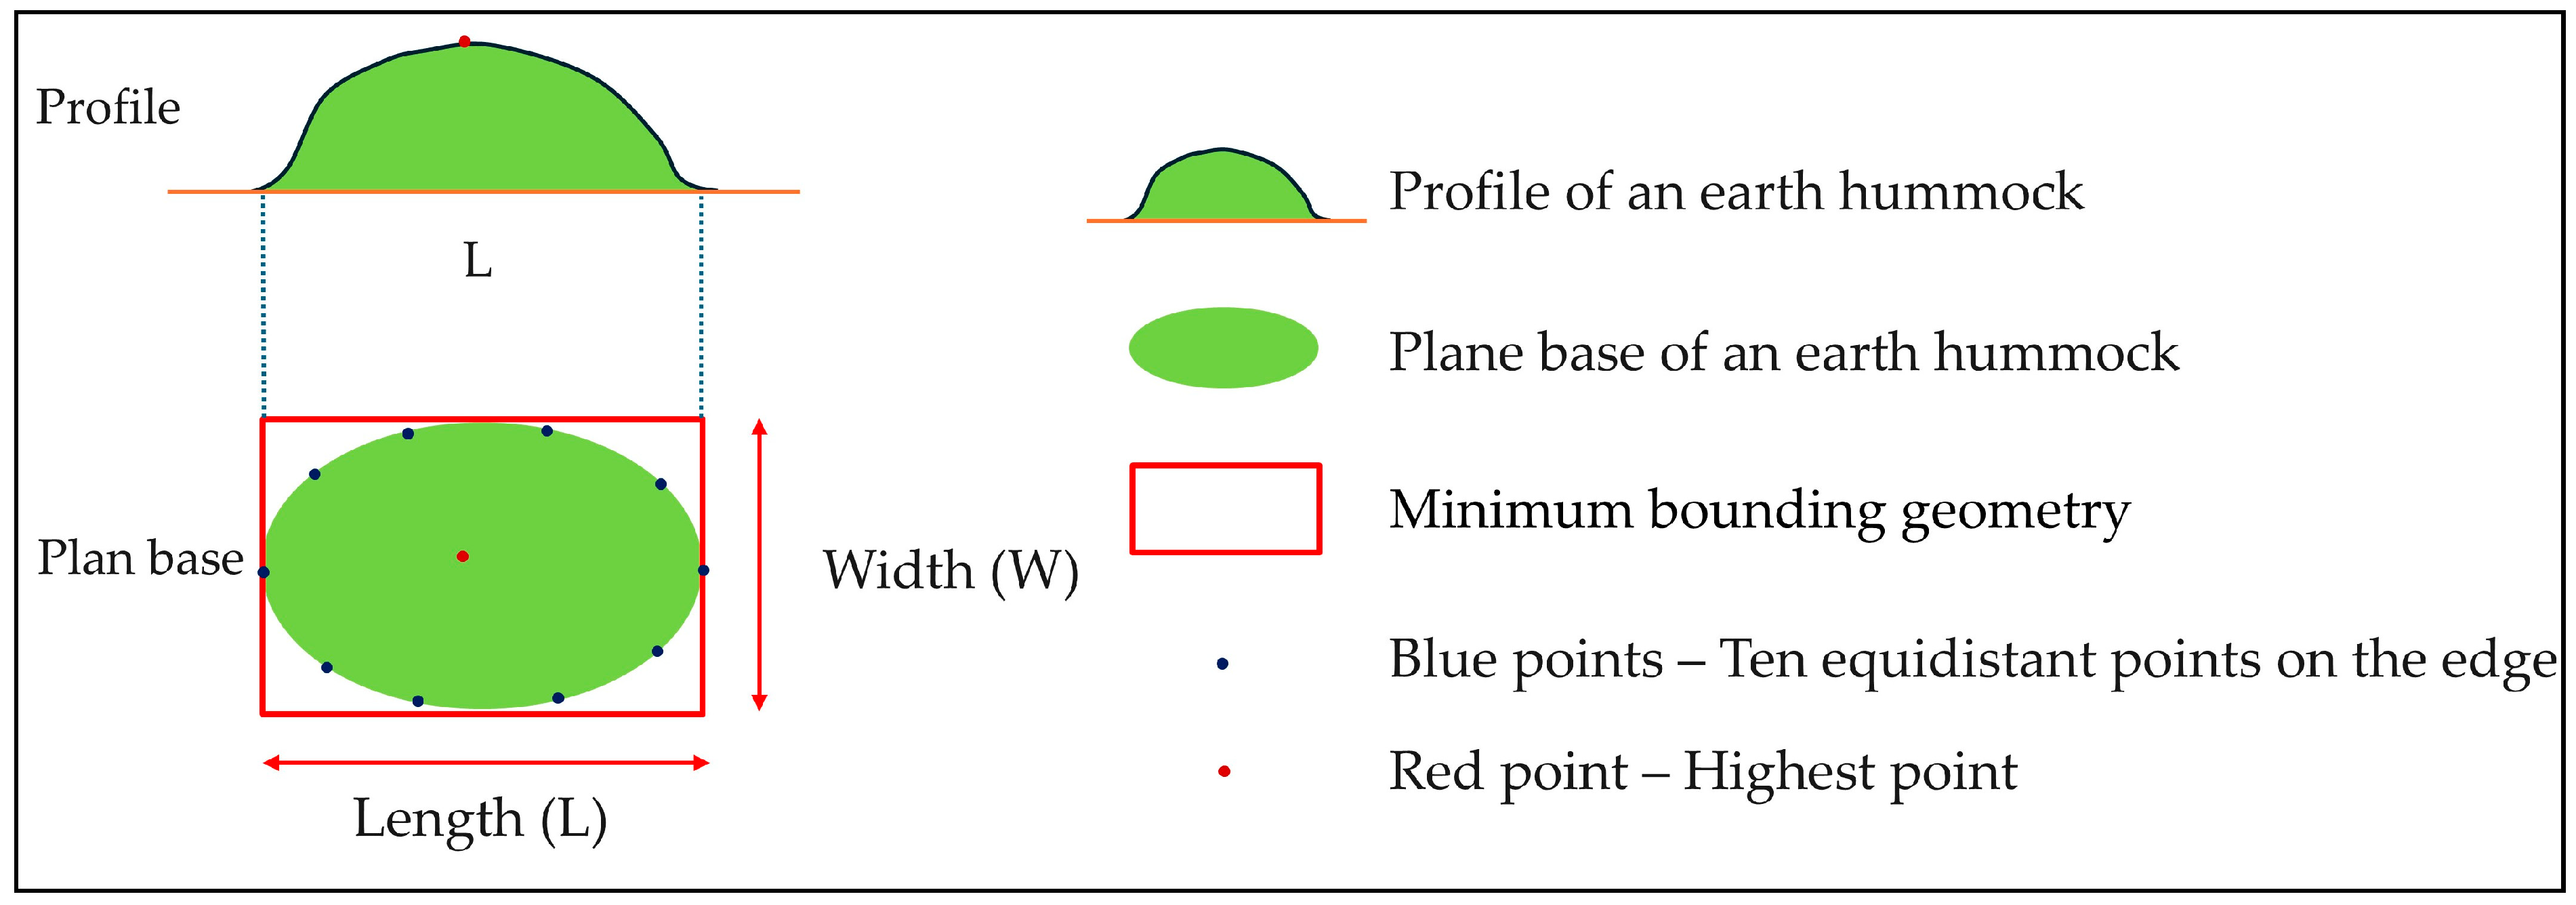
To manually delineate and vectorize the distinct individual shapes of earth hummocks, we employed a method in ArcGIS Pro that involves creating a minimum bounding polygon around the shape of each earth hummock, typically circular or elliptical. We used high-resolution DEMs obtained from the UAV for the height information, and the height of an earth hummock was determined by the difference between the highest point within the earth hummock (red point in Figure 6) and the average height of the points distributed evenly across ten divisions along the edge of the shape (blue points in Figure 6). It should be noted that measuring length and width from a top-down perspective inherently introduces errors. Because earth hummocks are distributed on slopes, the observed lengths appear to be shorter than their actual values. For instance, a 10° slope with length aligned along the slope direction could result in a maximum error of approximately 1.52%.
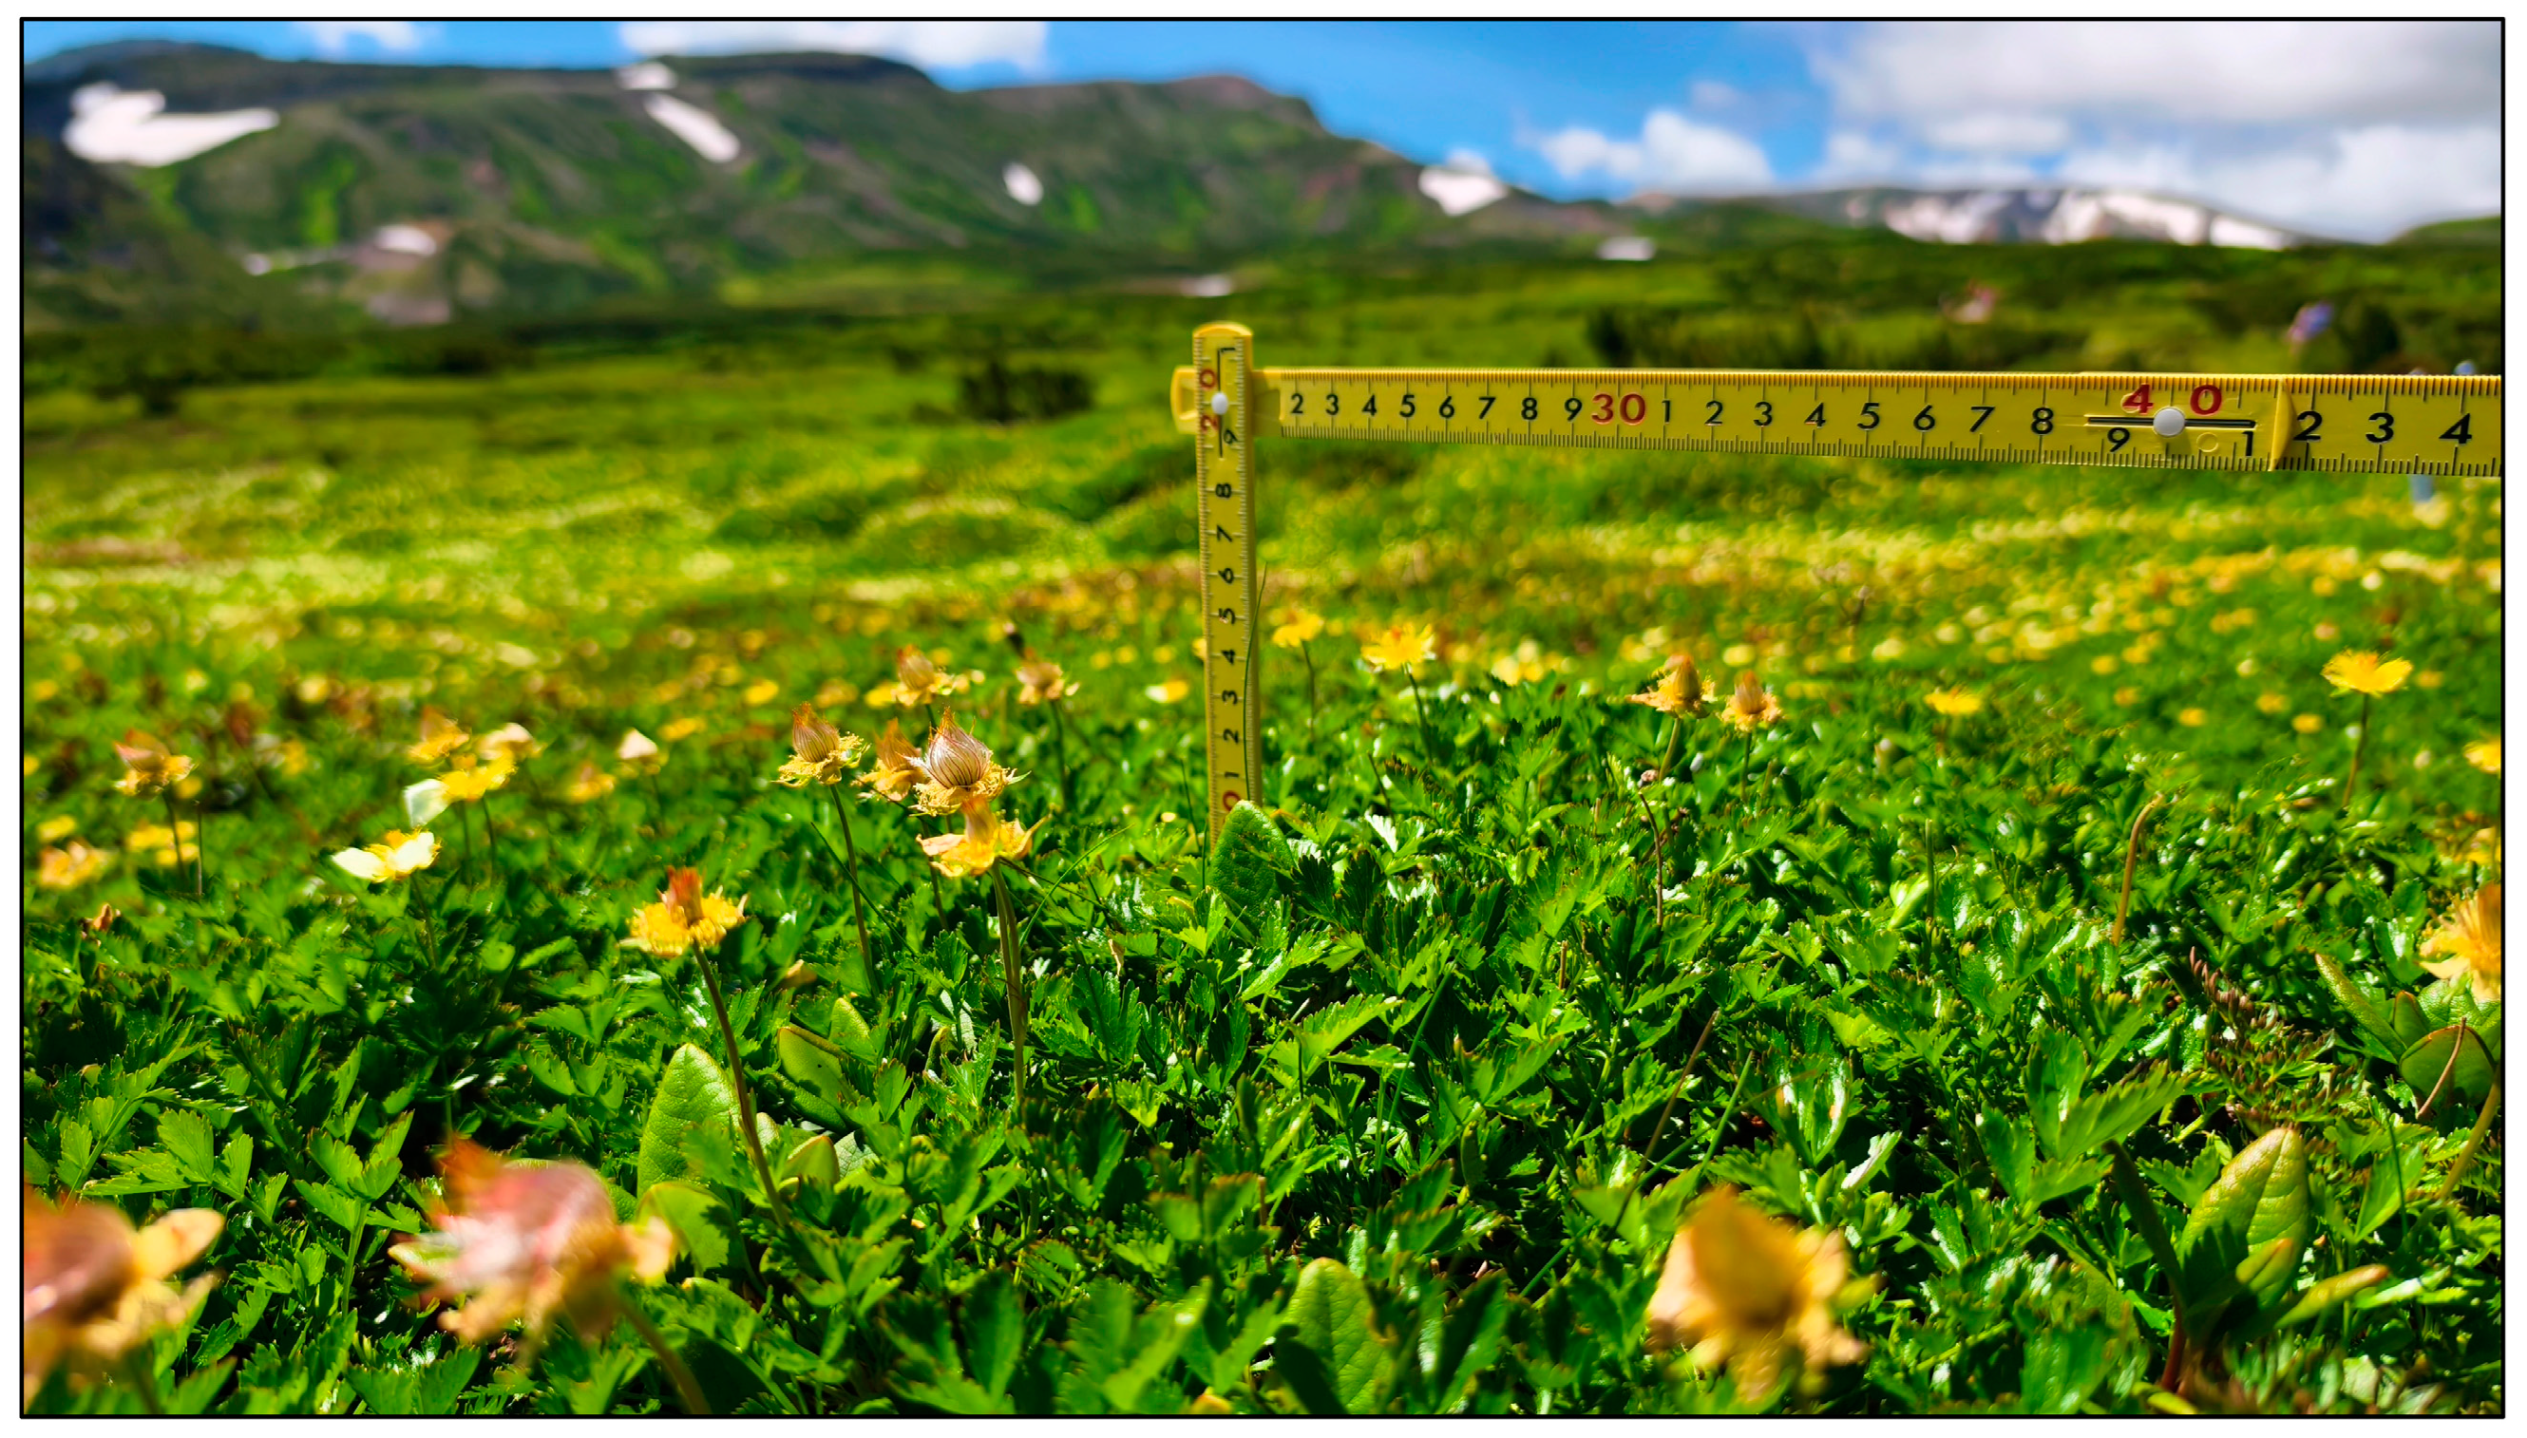
Because DEMs derived from UAV-SfM processing cannot eliminate low-lying vegetation interference, the extracted elevations are the sum of the heights of the earth hummocks and the vegetation on them. It is essential to ascertain the vegetation heights and determine whether the height changes significantly between the different parts of a single earth hummock. Thirty earth hummocks were randomly selected from Areas A and B. We collected ten values from each earth hummock’s central and peripheral parts (Figure 7). The results indicate that the average vegetation height differences from the central and peripheral parts of earth hummocks in Areas A and B are 0.68 cm and 0.58 cm, respectively. Given the minimal variation, the influence of vegetation height differences was disregarded in height calculations.
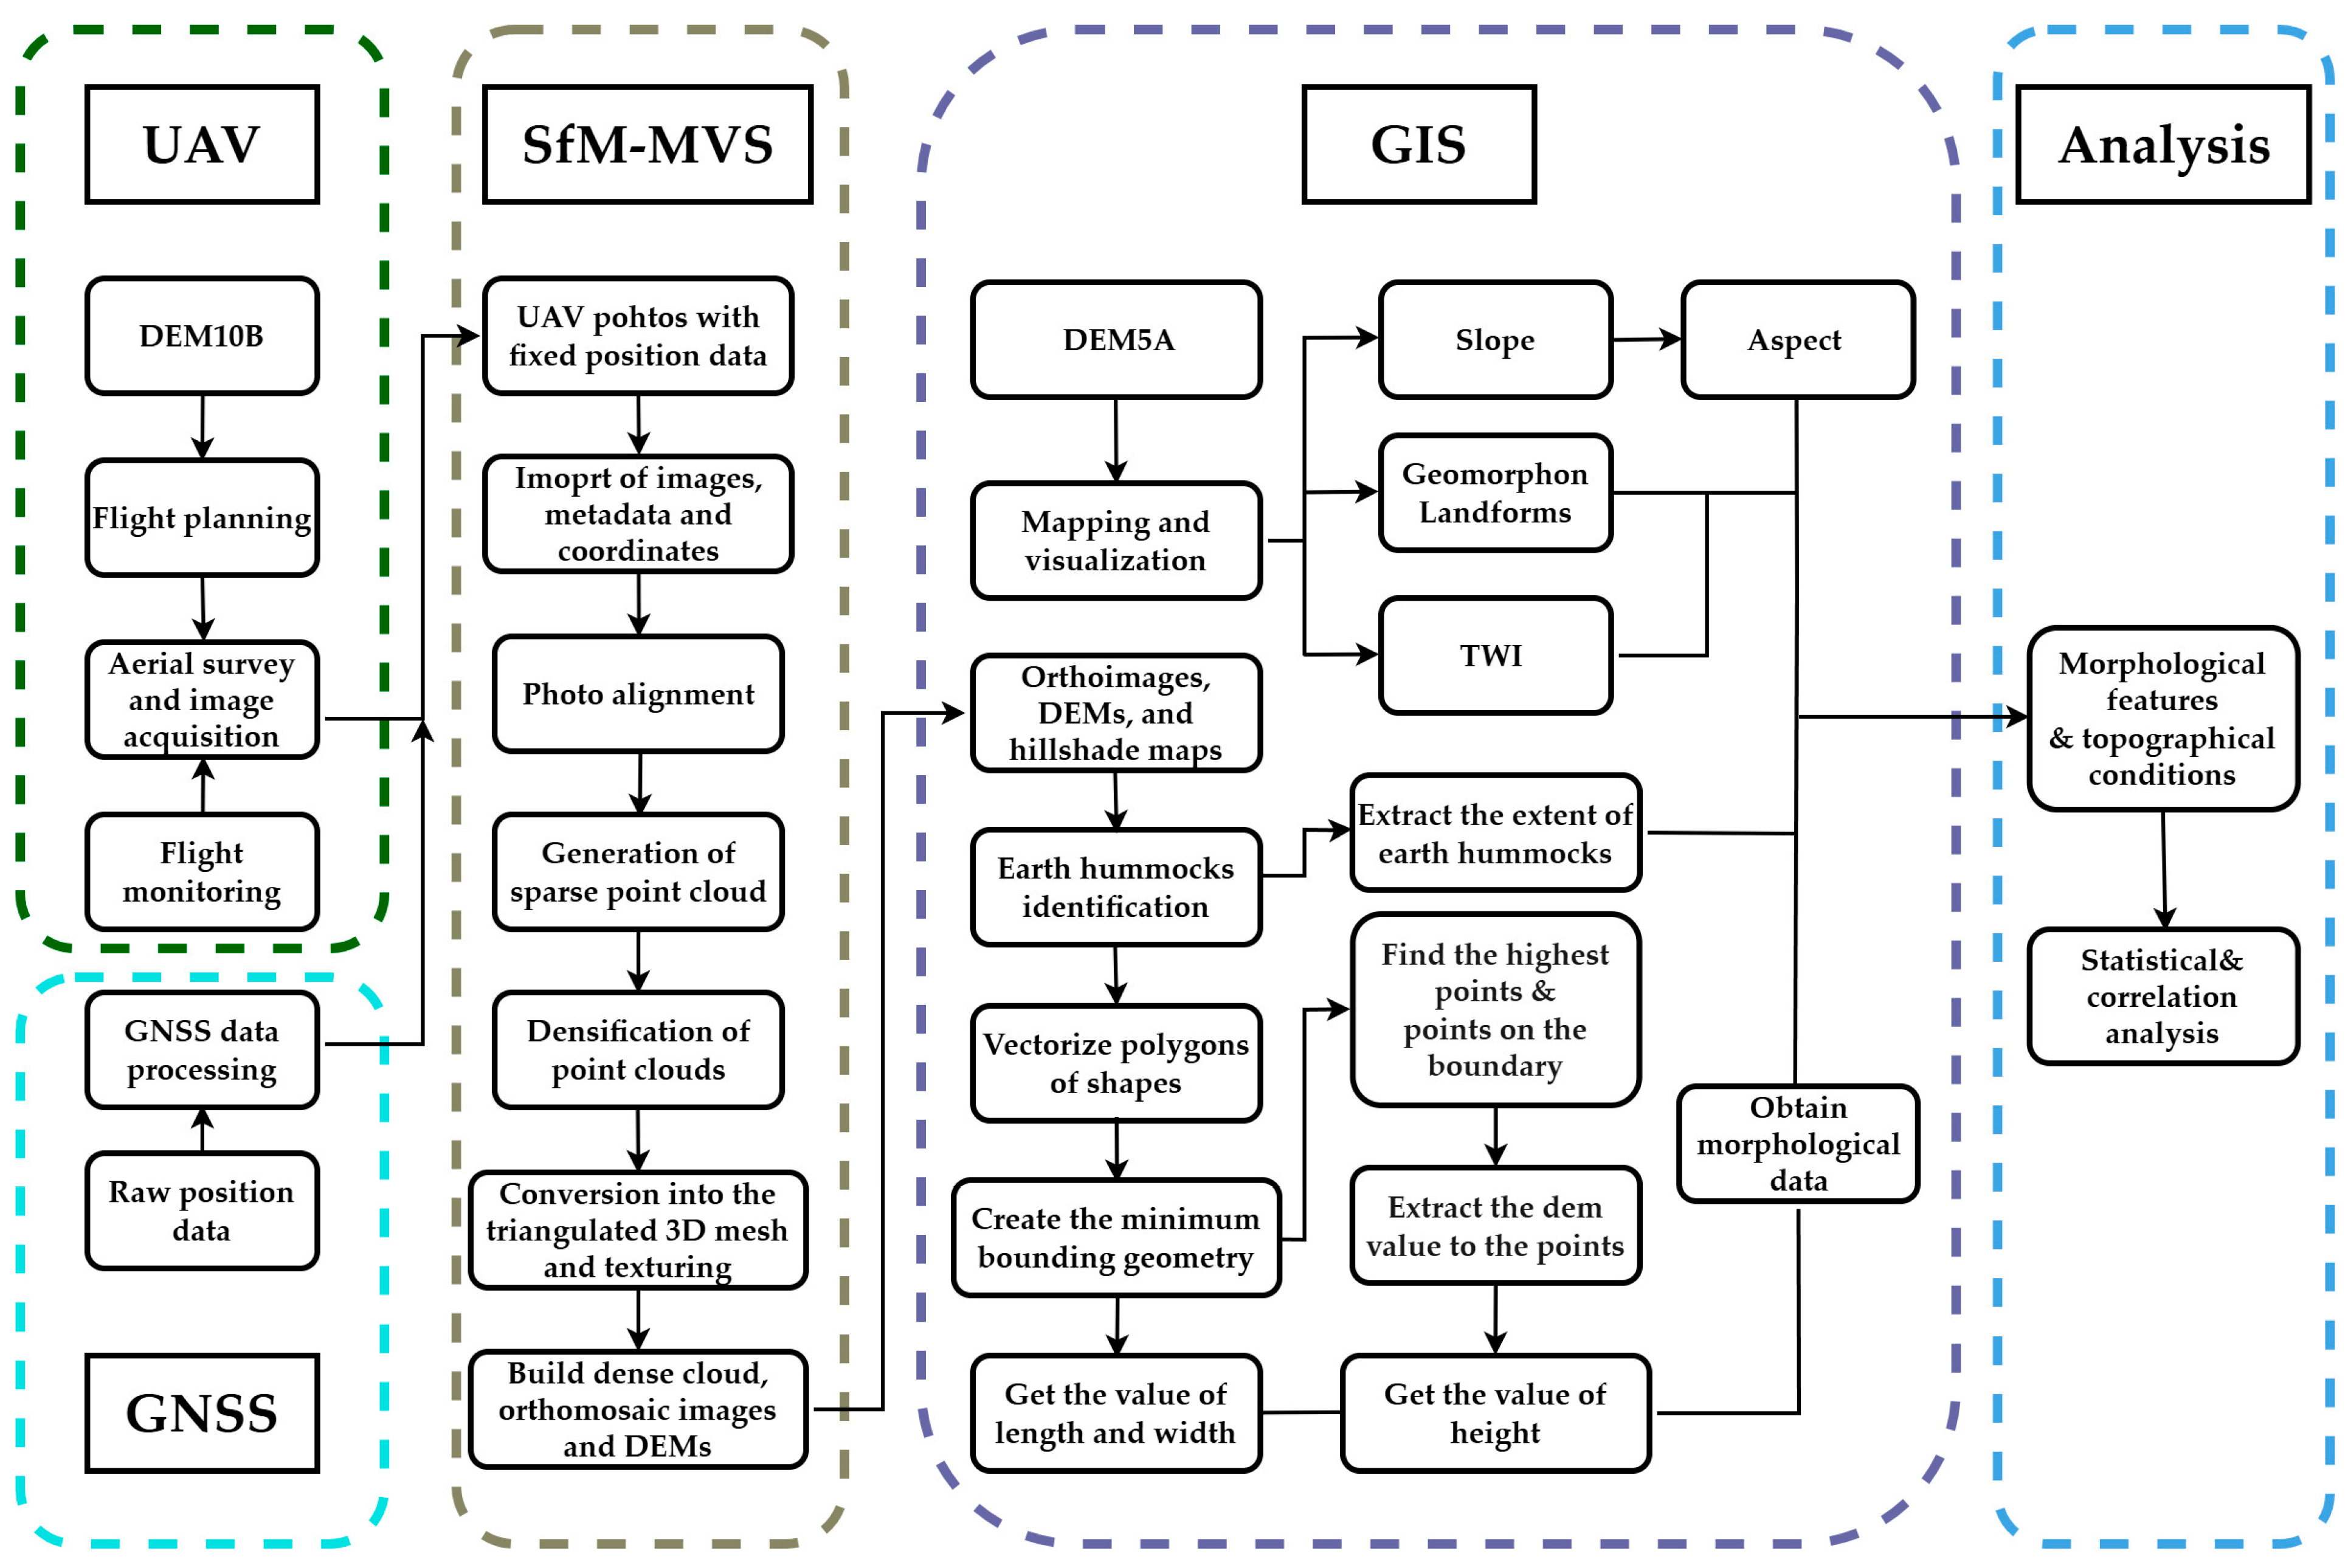
Finally, we analyzed and determined the relationships between morphology and topography based on the distribution and morphological characteristics of earth hummocks combined with topographical maps. The overall workflow is illustrated in Figure 8.

3. Results

3.1. Image Data Obtained from UAV and Terrain-Related Maps

We generated high-resolution orthomosaic images and DEM maps for our study areas using the SfM method (Figure 9). In Area A, the density of the dense point cloud was 776 pts/m², with a total camera position error of 1.3 cm. For Area B, the dense point cloud density was 870 pts/m², and the total camera position error was 9 mm. The standard deviations of the PPK-corrected positions in the north, east, and altitude directions of D-RTK2 for the two positions in Area A were 0.25 mm, 0.20 mm, 0.57 mm and 0.20 mm, 0.10 mm, 0.30 mm, respectively. In Area B, for one position, the standard deviations were 0.10 mm, 0.10 mm, and 0.20 mm. These values are considered to provide an estimation of the potential measurement error from the D-RTK2 measurements and are sufficiently small to be negligible. The resolutions of the orthomosaic images were 2.0 cm/pixel for Area A and 1.8 cm/pixel for Area B, respectively. DEM maps were produced at 3.9 cm/pixel for Area A and 3.6 cm/pixel for Area B. These high-resolution images provided the necessary details for precise landform observations.
From the imagery of Area A, we observed a large area of gentle slopes along the hiking trail, with a decrease in altitude as the distance from the trail increases, along with significant undulations and valleys. Area B exhibited dense vegetation and an overall eastward decline in elevation. Shallow snow depressions and meltwater channels were present in the southern part of Area B.
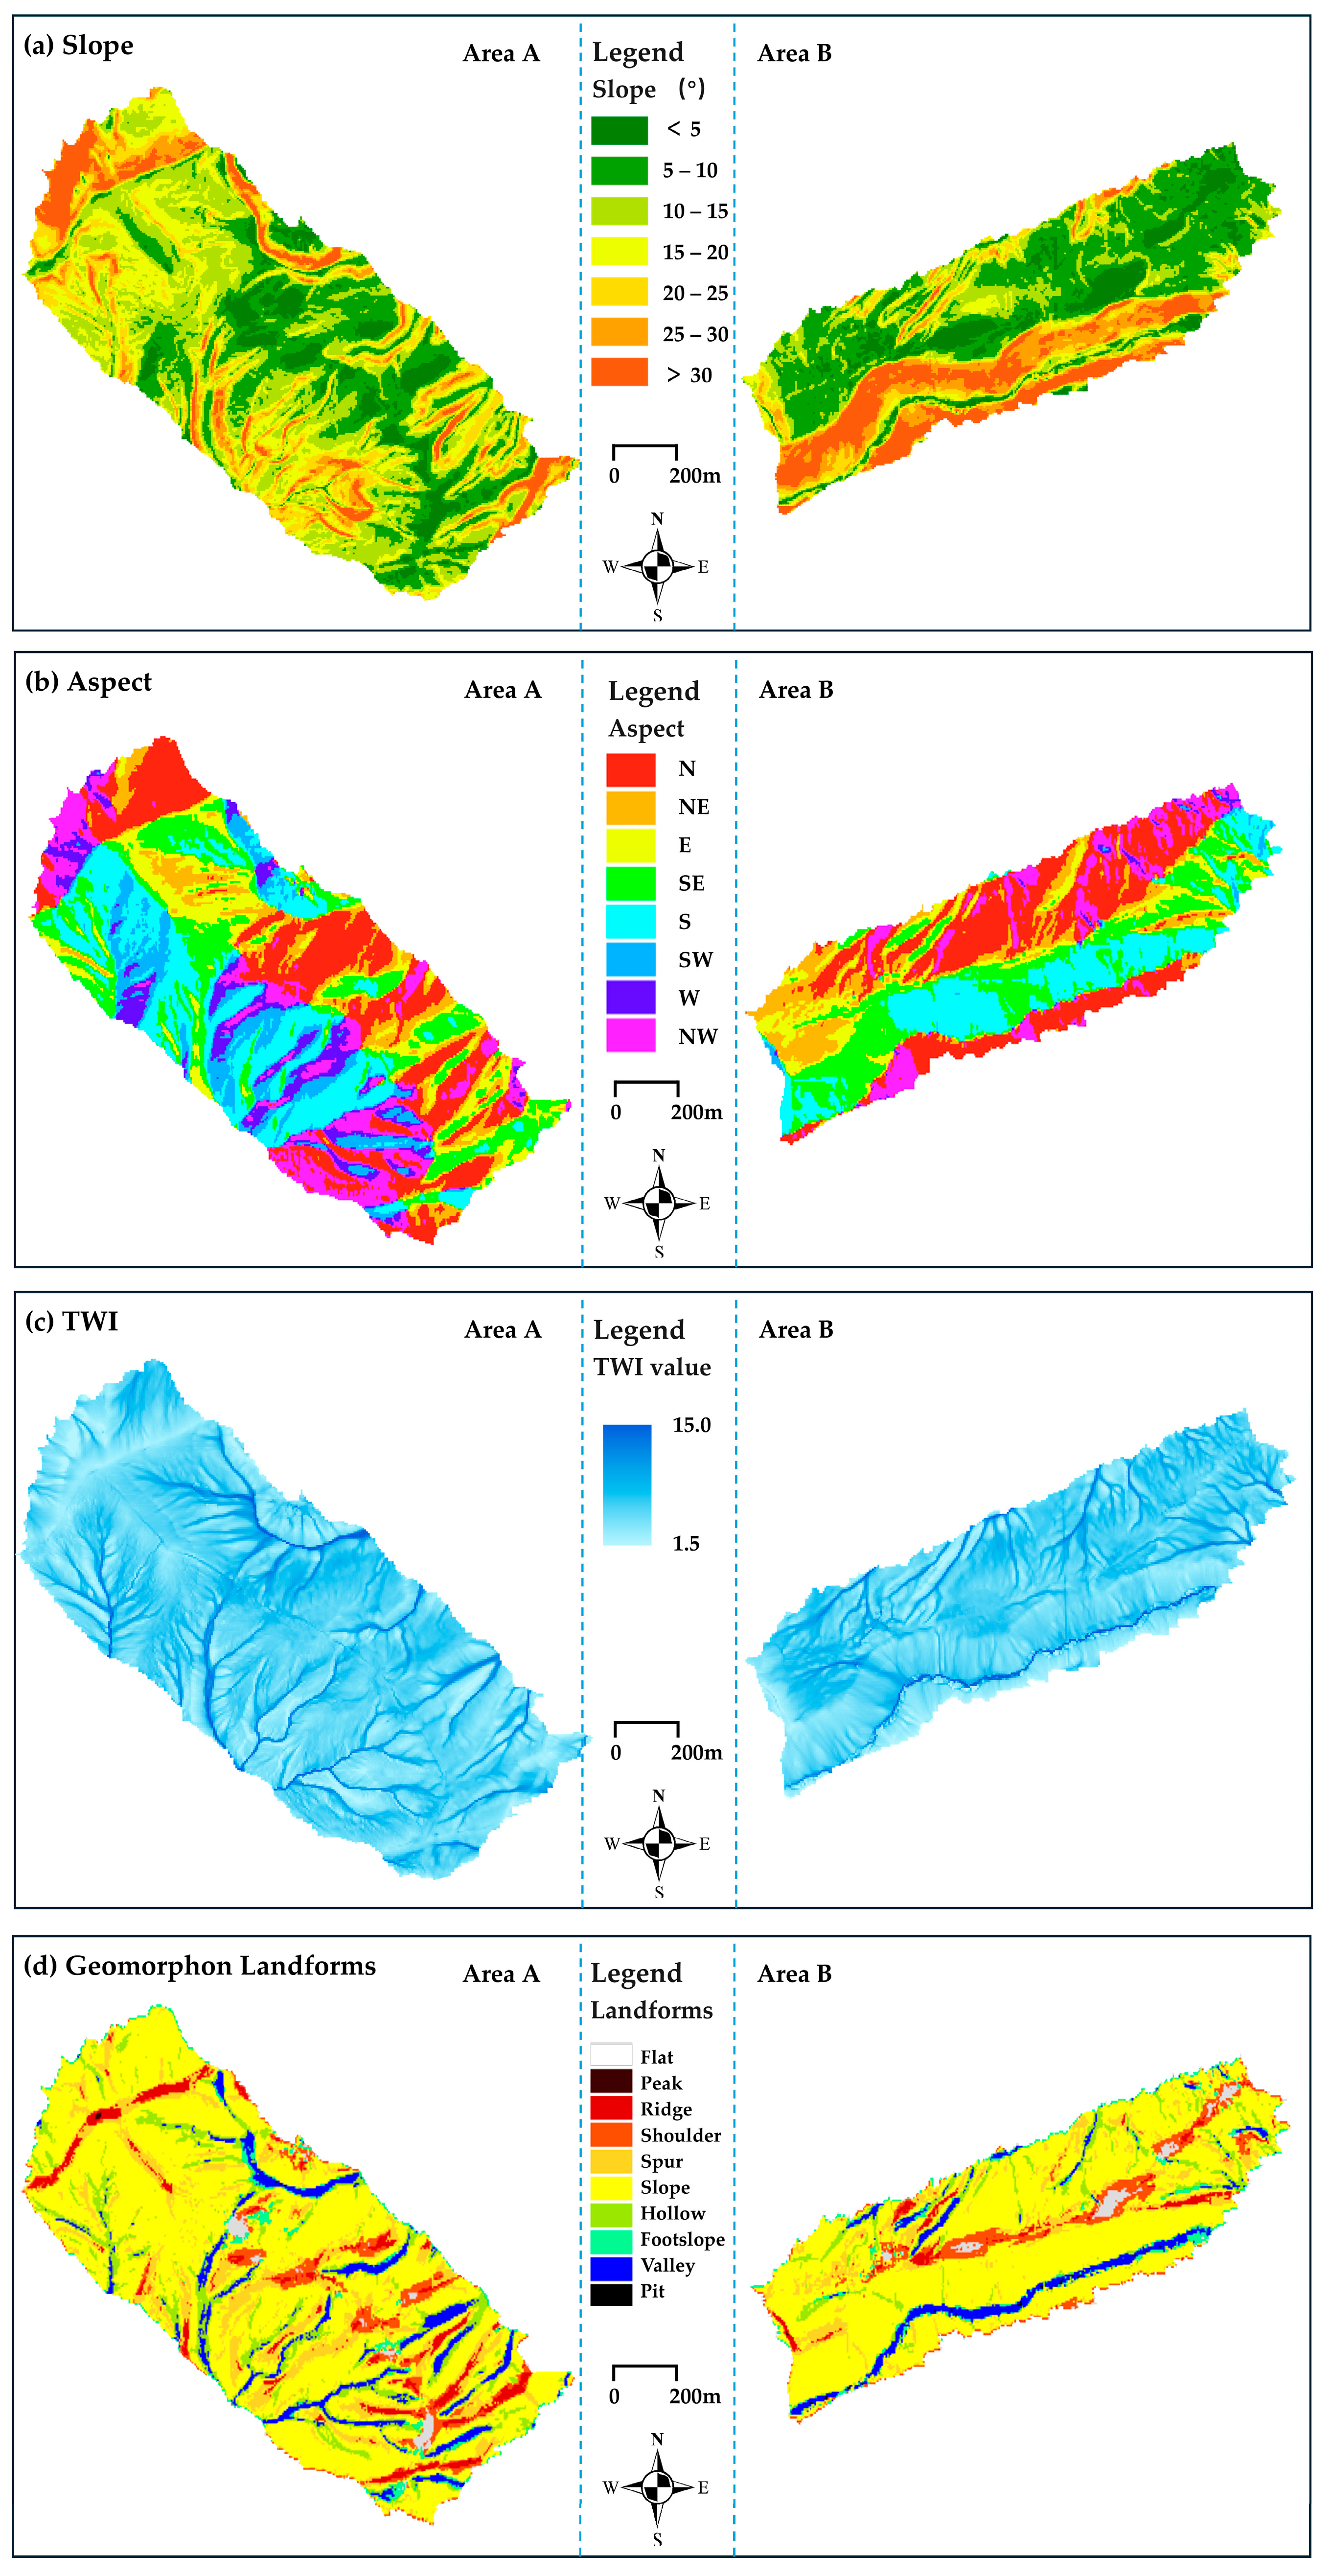
Slope, aspect, TWI, and Geomorphon Landforms maps were also created (Figure 10). These maps allowed us to identify the topographic characteristics of the two study areas.
  • Slope: The average slope in Area A was 13.7°, whereas that in Area B was 15.2°. This higher average in Area B was primarily due to the extensive steep slopes in its southern part, although the rest exhibited relatively gentle slopes.
  • Aspect: In Area A, the distribution of slope aspects is relatively uniform, whereas in Area B, the slopes predominantly face the southeast and nearby directions, with notably few slopes facing west.
  • TWI: Areas shaded in darker blue indicate higher TWI values and light blue areas indicate lower TWI values. Both study areas feature complex networks of drainage channels that typically originate near the hiking trail.
  • Geomorphon Landforms: In both study areas, the most prevalent landform was slope, accounting for 58.11% and 64.11% of the total area in Areas A and B, respectively. The distribution of peaks and pits was the least common, comprising less than 2% of each study area (Table 2).

3.2. Distribution of Earth Hummocks

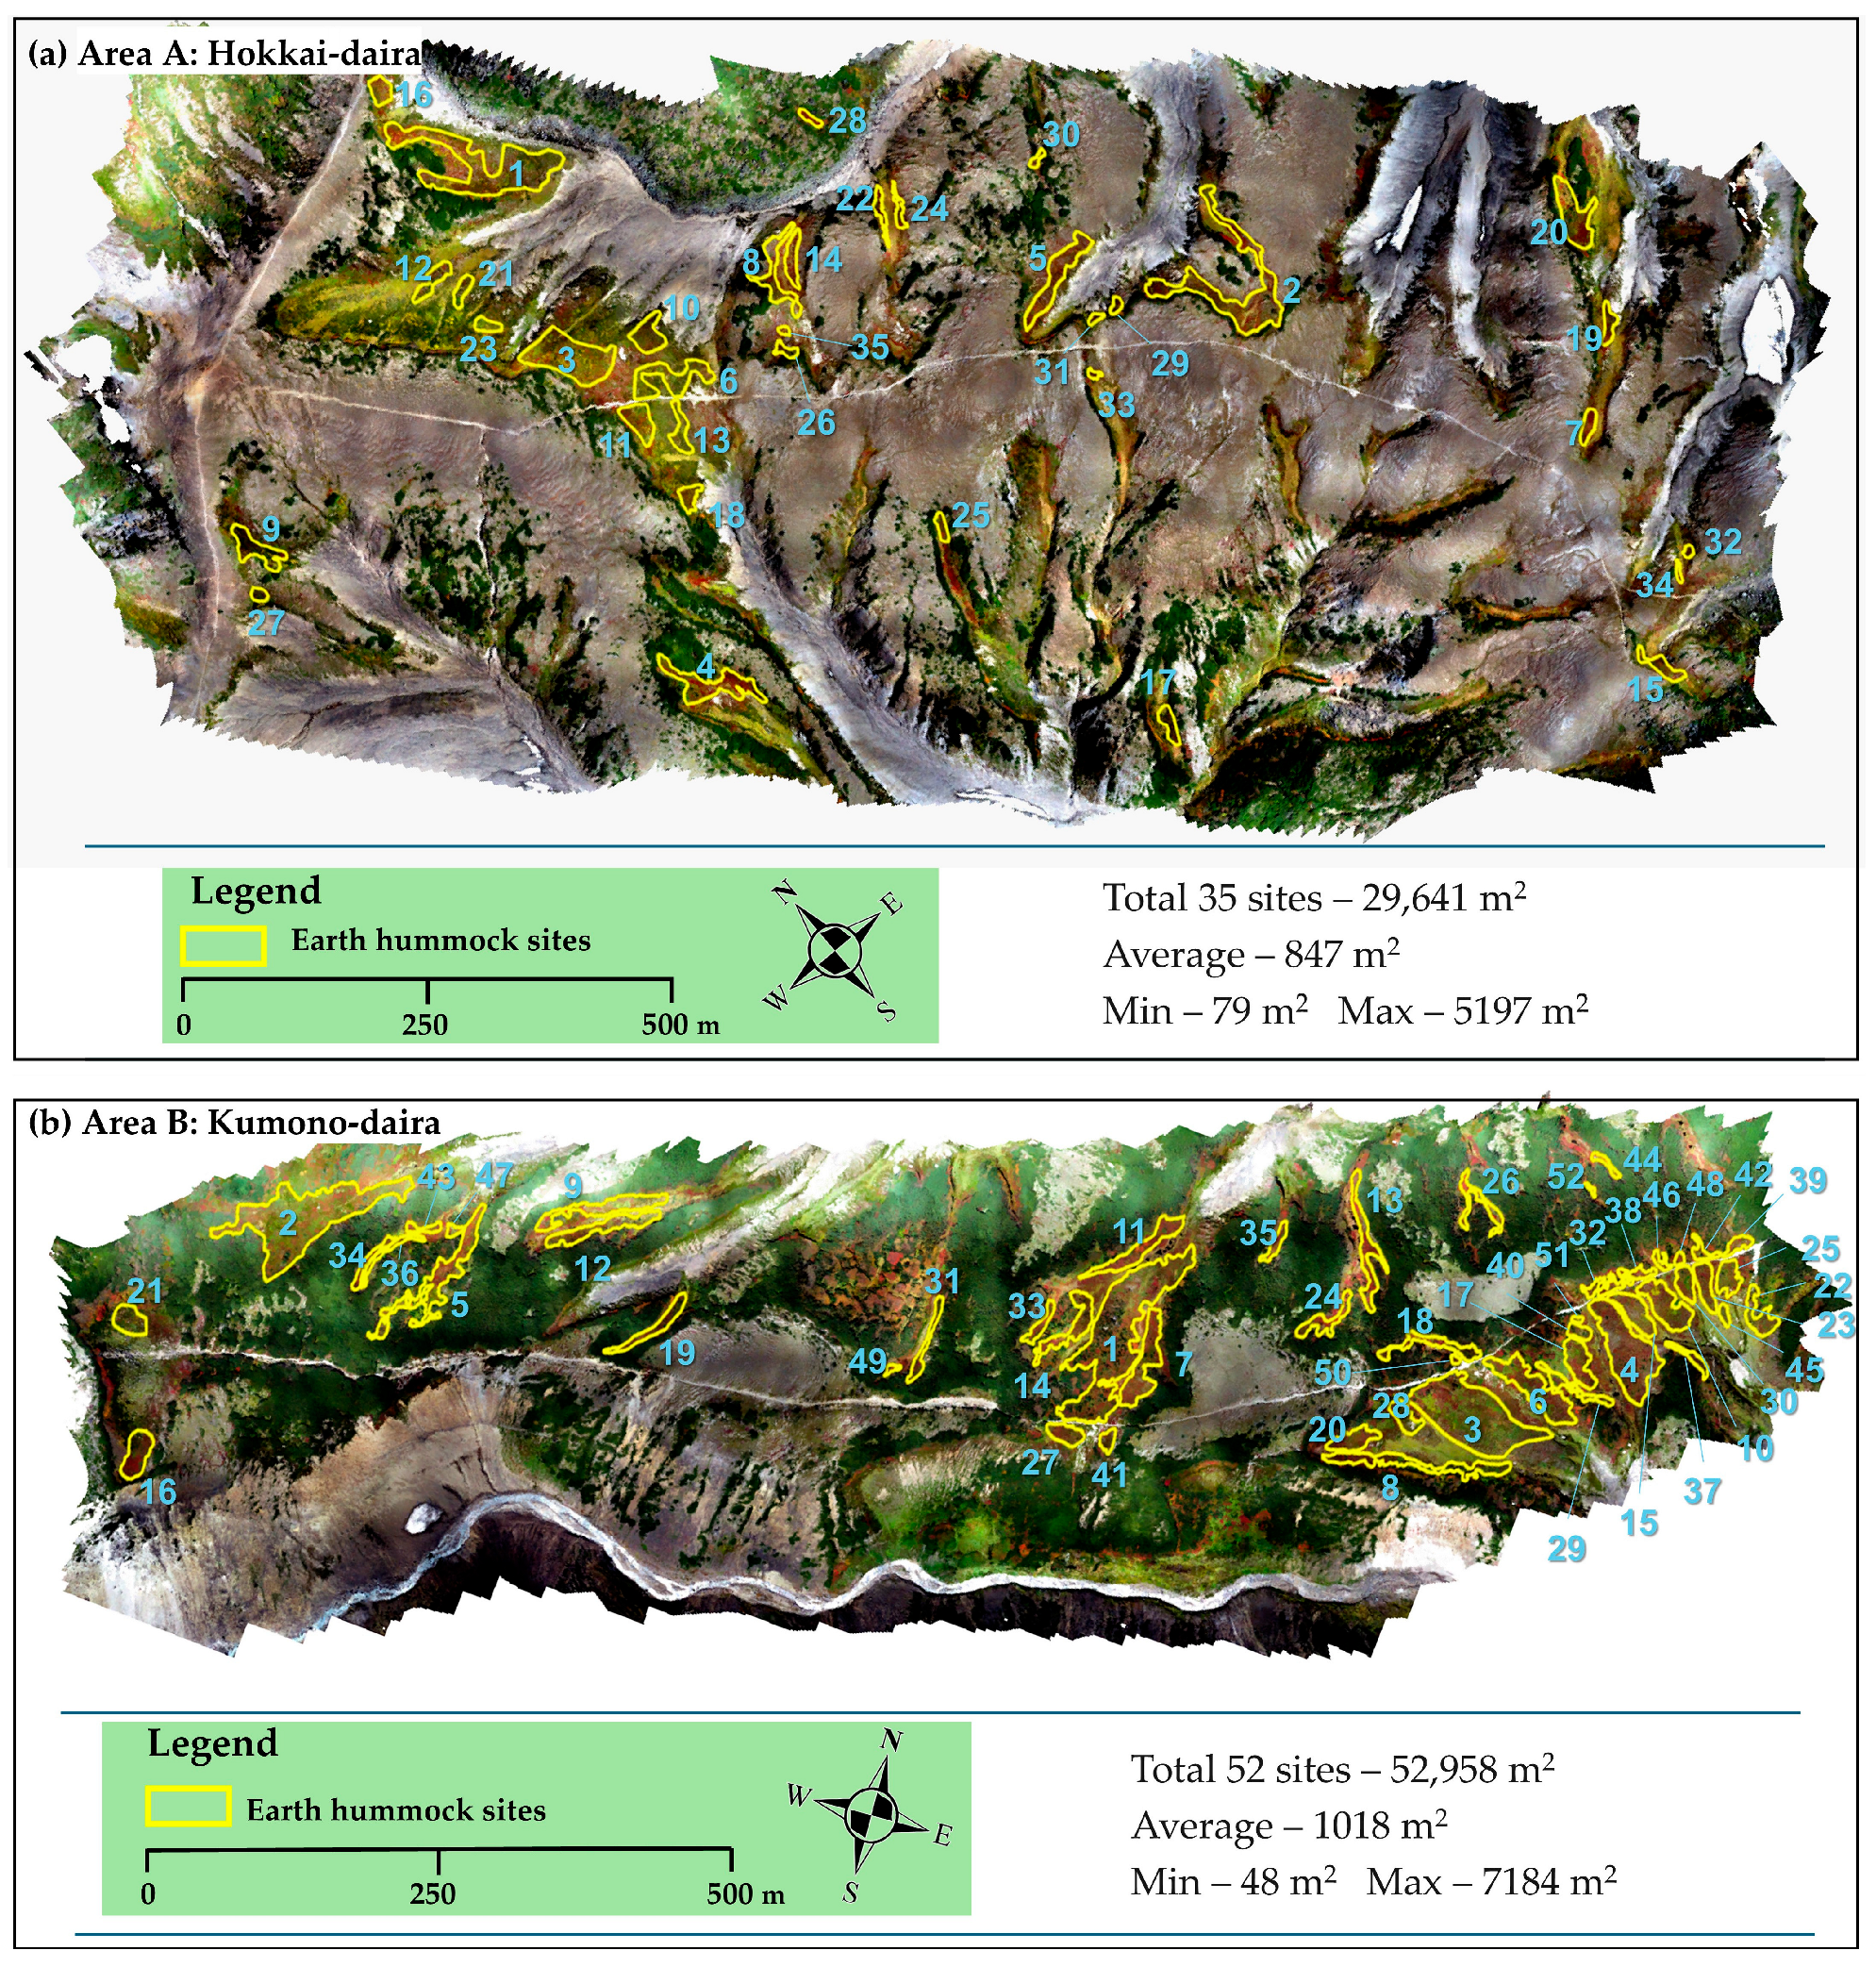
By meticulously observing orthomosaic images and hillshade maps, we identified the distribution pattern of earth hummocks in the two study areas (Figure 11). The sites containing earth hummocks are outlined in yellow, including distinct and subtle earth hummocks and inter-hummock areas, such as depressions and vegetation.
In Area A, we identified 35 earth hummock sites covering 29,641 m2, with an average area of 847 m2 for a single site. The largest of these areas spanned an area of 5197 m2. Area B exhibited a denser distribution of earth hummocks, with 52 individual sites covering a total area of 52,958 m2 and an average area of 1018 m2 at each site. The largest earth hummock site in Area B measured 7184 m2. The total area of the earth hummocks identified in both study areas amounts to 82,599 m2.
We characterized the distribution patterns of earth hummocks in the study areas. Broadly speaking, the distribution of individual earth hummocks can be classified into two types (Figure 12). The first type is an ‘isolated distribution’ (pattern a), where individual earth hummocks are not interconnected and maintain specific spacing between them. The second type is a ‘cluster distribution’, in which earth hummocks are closely distributed (pattern b1) or overlapped (pattern b2), sometimes leading to unrecognizable borders. Other studies have also reported complex coalescent forms [35,80].

3.3. Morphological Features of the Earth Hummocks

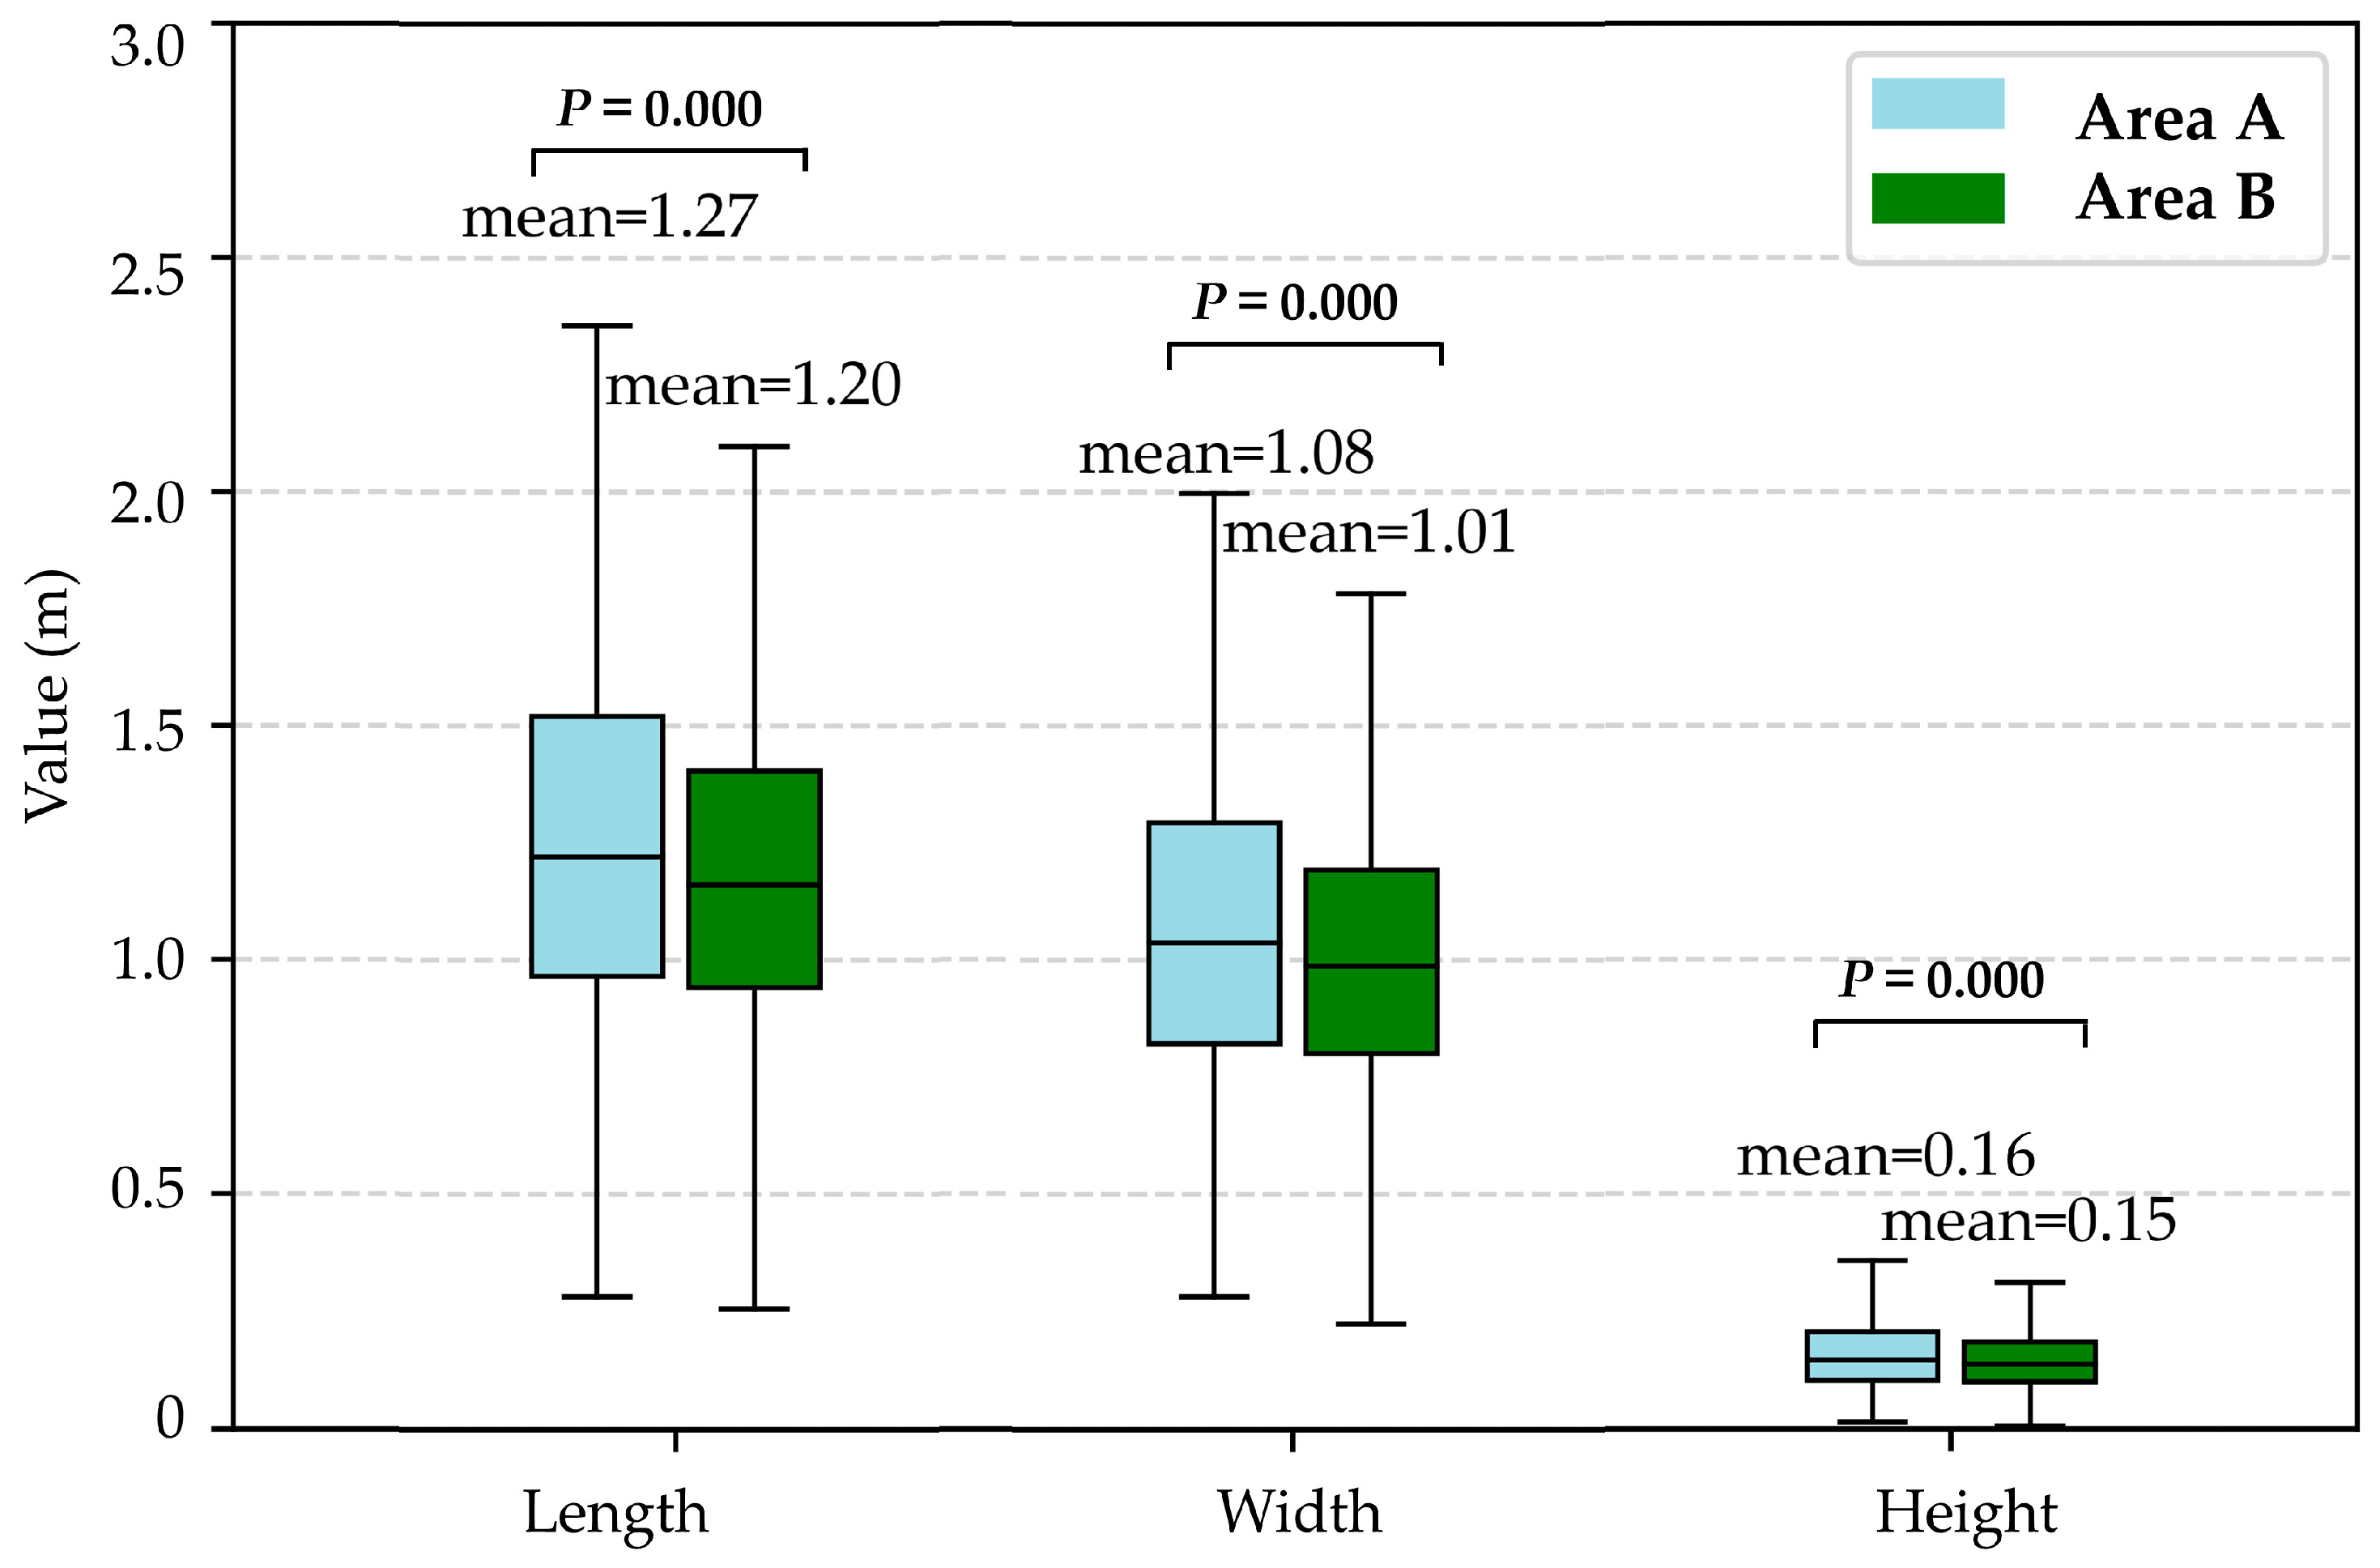
We identified the individual shapes of earth hummocks using ArcGIS Pro to vectorize the earth hummock edges. Earth hummocks with indistinguishable boundaries are disregarded because proximity or overlapping blurs the boundaries of individual earth hummocks, leading to measurement inaccuracies. The mean, median, range (using the first and third quartiles), and standard deviation (SD) of these parameters are listed in Table 3. In Area A (N = 5843), the average shapes of the earth hummocks in terms of length, width, and height were 1.27 m, 1.08 m, and 0.16 m, respectively. Area B’s corresponding values (N = 12,995) were 1.20 m, 1.01 m, and 0.15 m. The average dimensions of all earth hummocks (N = 18,838) were 1.22 m in length, 1.03 m in width, and 0.15 m in height, yielding a length/width ratio of 1.19 and a length/height ratio of 0.12.
Figure 13 indicates significant statistical differences in length, width, and height between Areas A and B (p < 0.001). These results suggest that even though these two study areas are not far apart (less than 1 km), different shapes of earth hummocks can form, most probably due to the influence of local microclimatic conditions (such as sunlight, wind speed, and temperature) and topographical factors (such as slope, aspect, TWI, and landforms).
The correlation coefficients between the length, width, and height of the earth hummocks in the two study areas are similar, with Pearson coefficients of 0.91 and 0.90 for length and width, 0.69 and 0.63 for length and height in Areas A and B, respectively (Figure 14). However, the dimensions of the earth hummocks varied between the two study areas. Combining all data from the two areas, the plane geometry is expressed by:
W = 0.7333L + 0.1368 (R2 = 0.82),
H = 0.1314L − 0.0077 (R2 = 0.40),
where W, L, and H represent width, length, and height, respectively.

3.4. Terrain Characteristics of the Distribution Area of Earth Hummocks

By integrating the identified boundaries of earth hummocks with the obtained topographical maps, we analyzed the topographical conditions of the earth hummock distributions. The overall distribution of earth hummocks is summarized in Table 4.
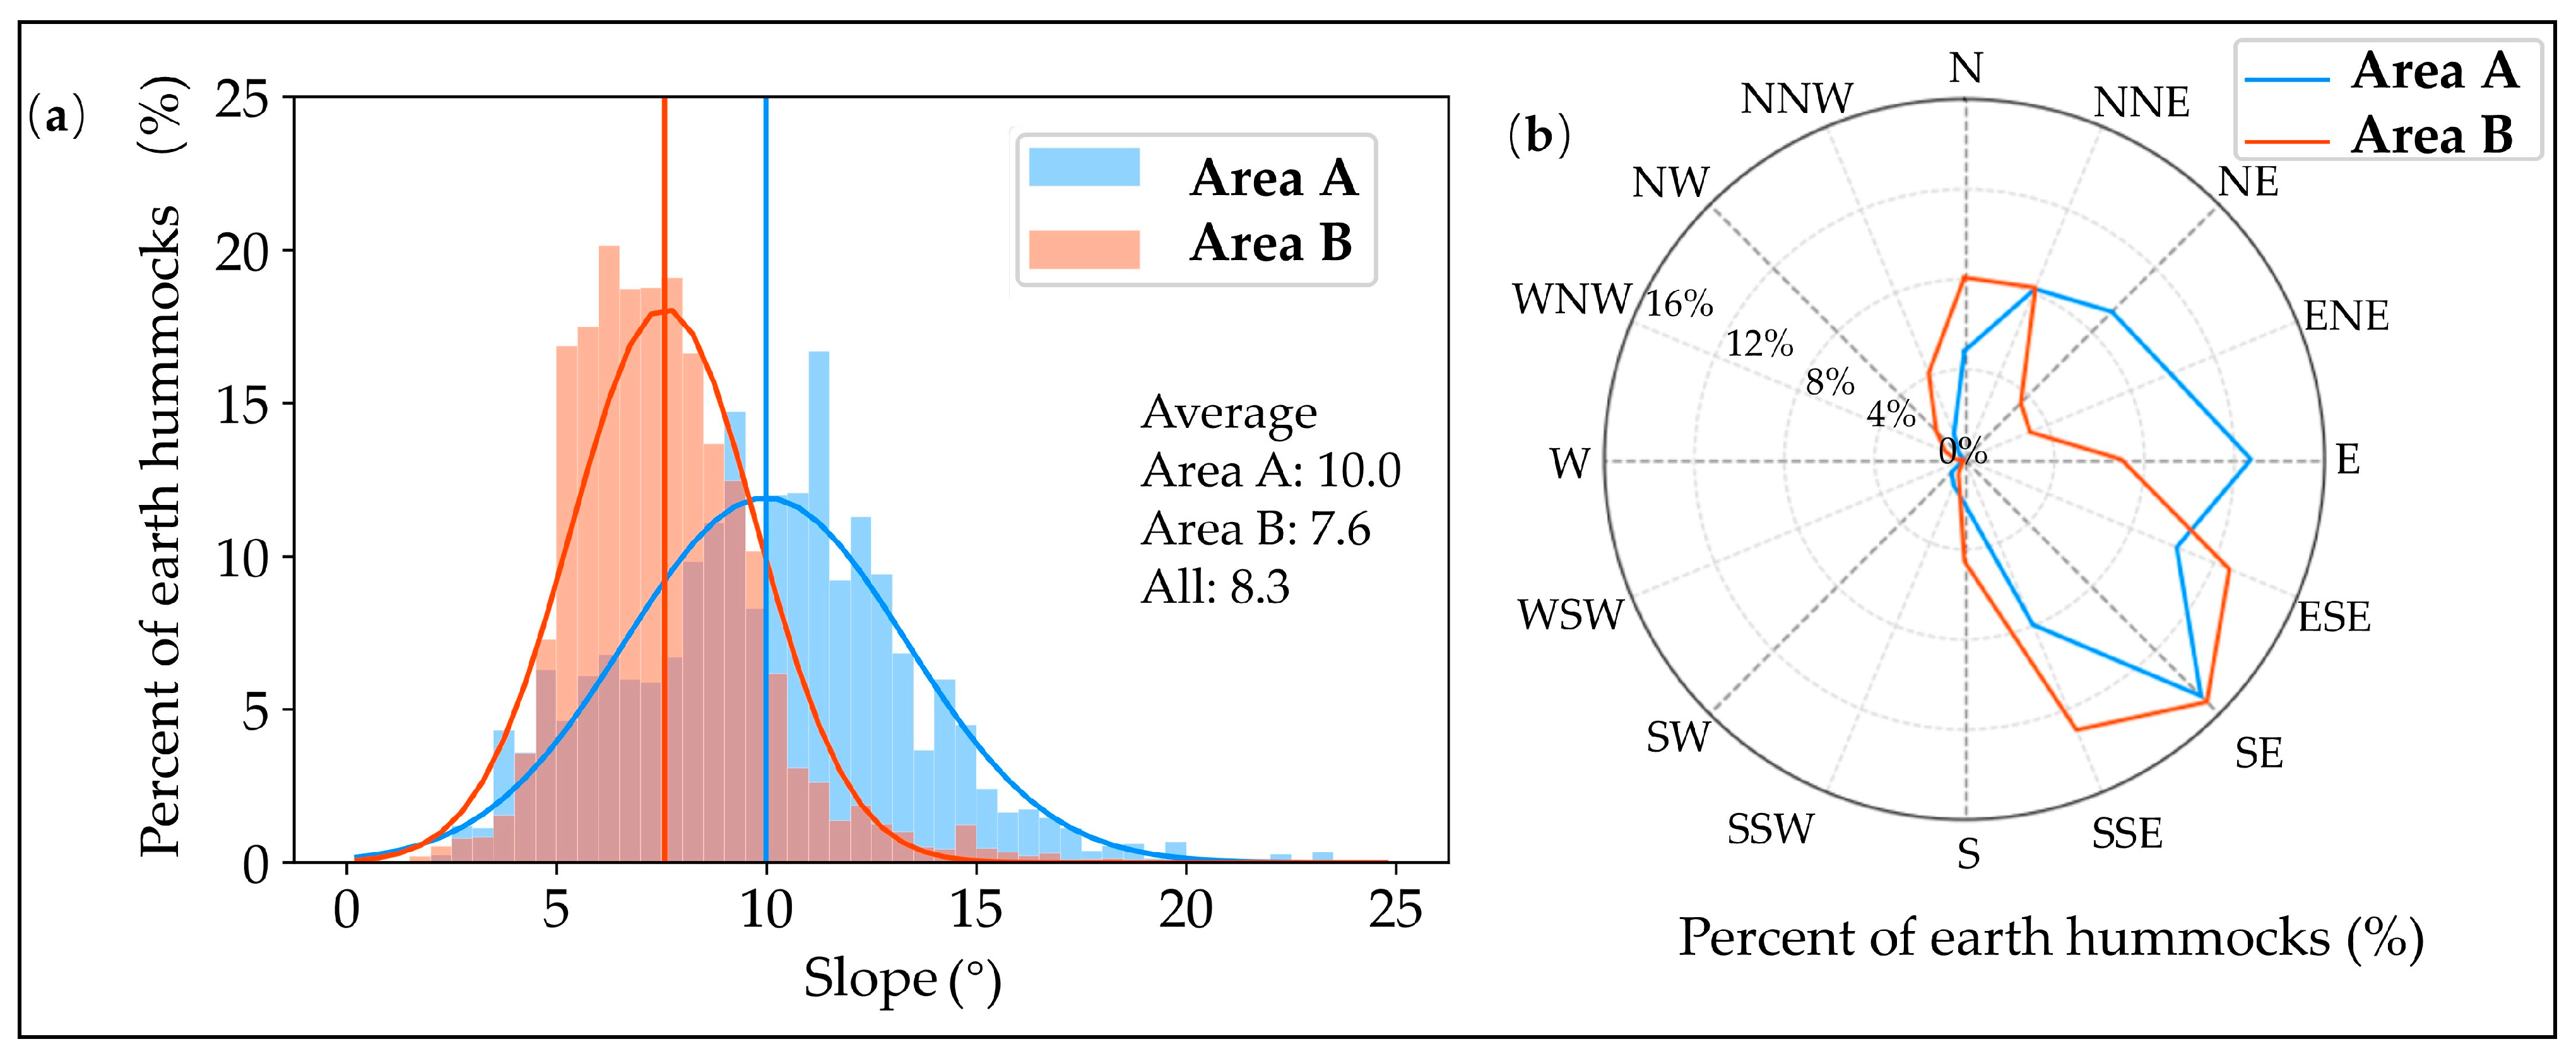
The average slopes of the earth hummock areas in Areas A and B were 10.0° and 7.6°, respectively. Earth hummocks were barely distributed on steep slopes over 20° (Figure 15a). Only a few earth hummocks were on the west-facing slopes (Figure 15b).
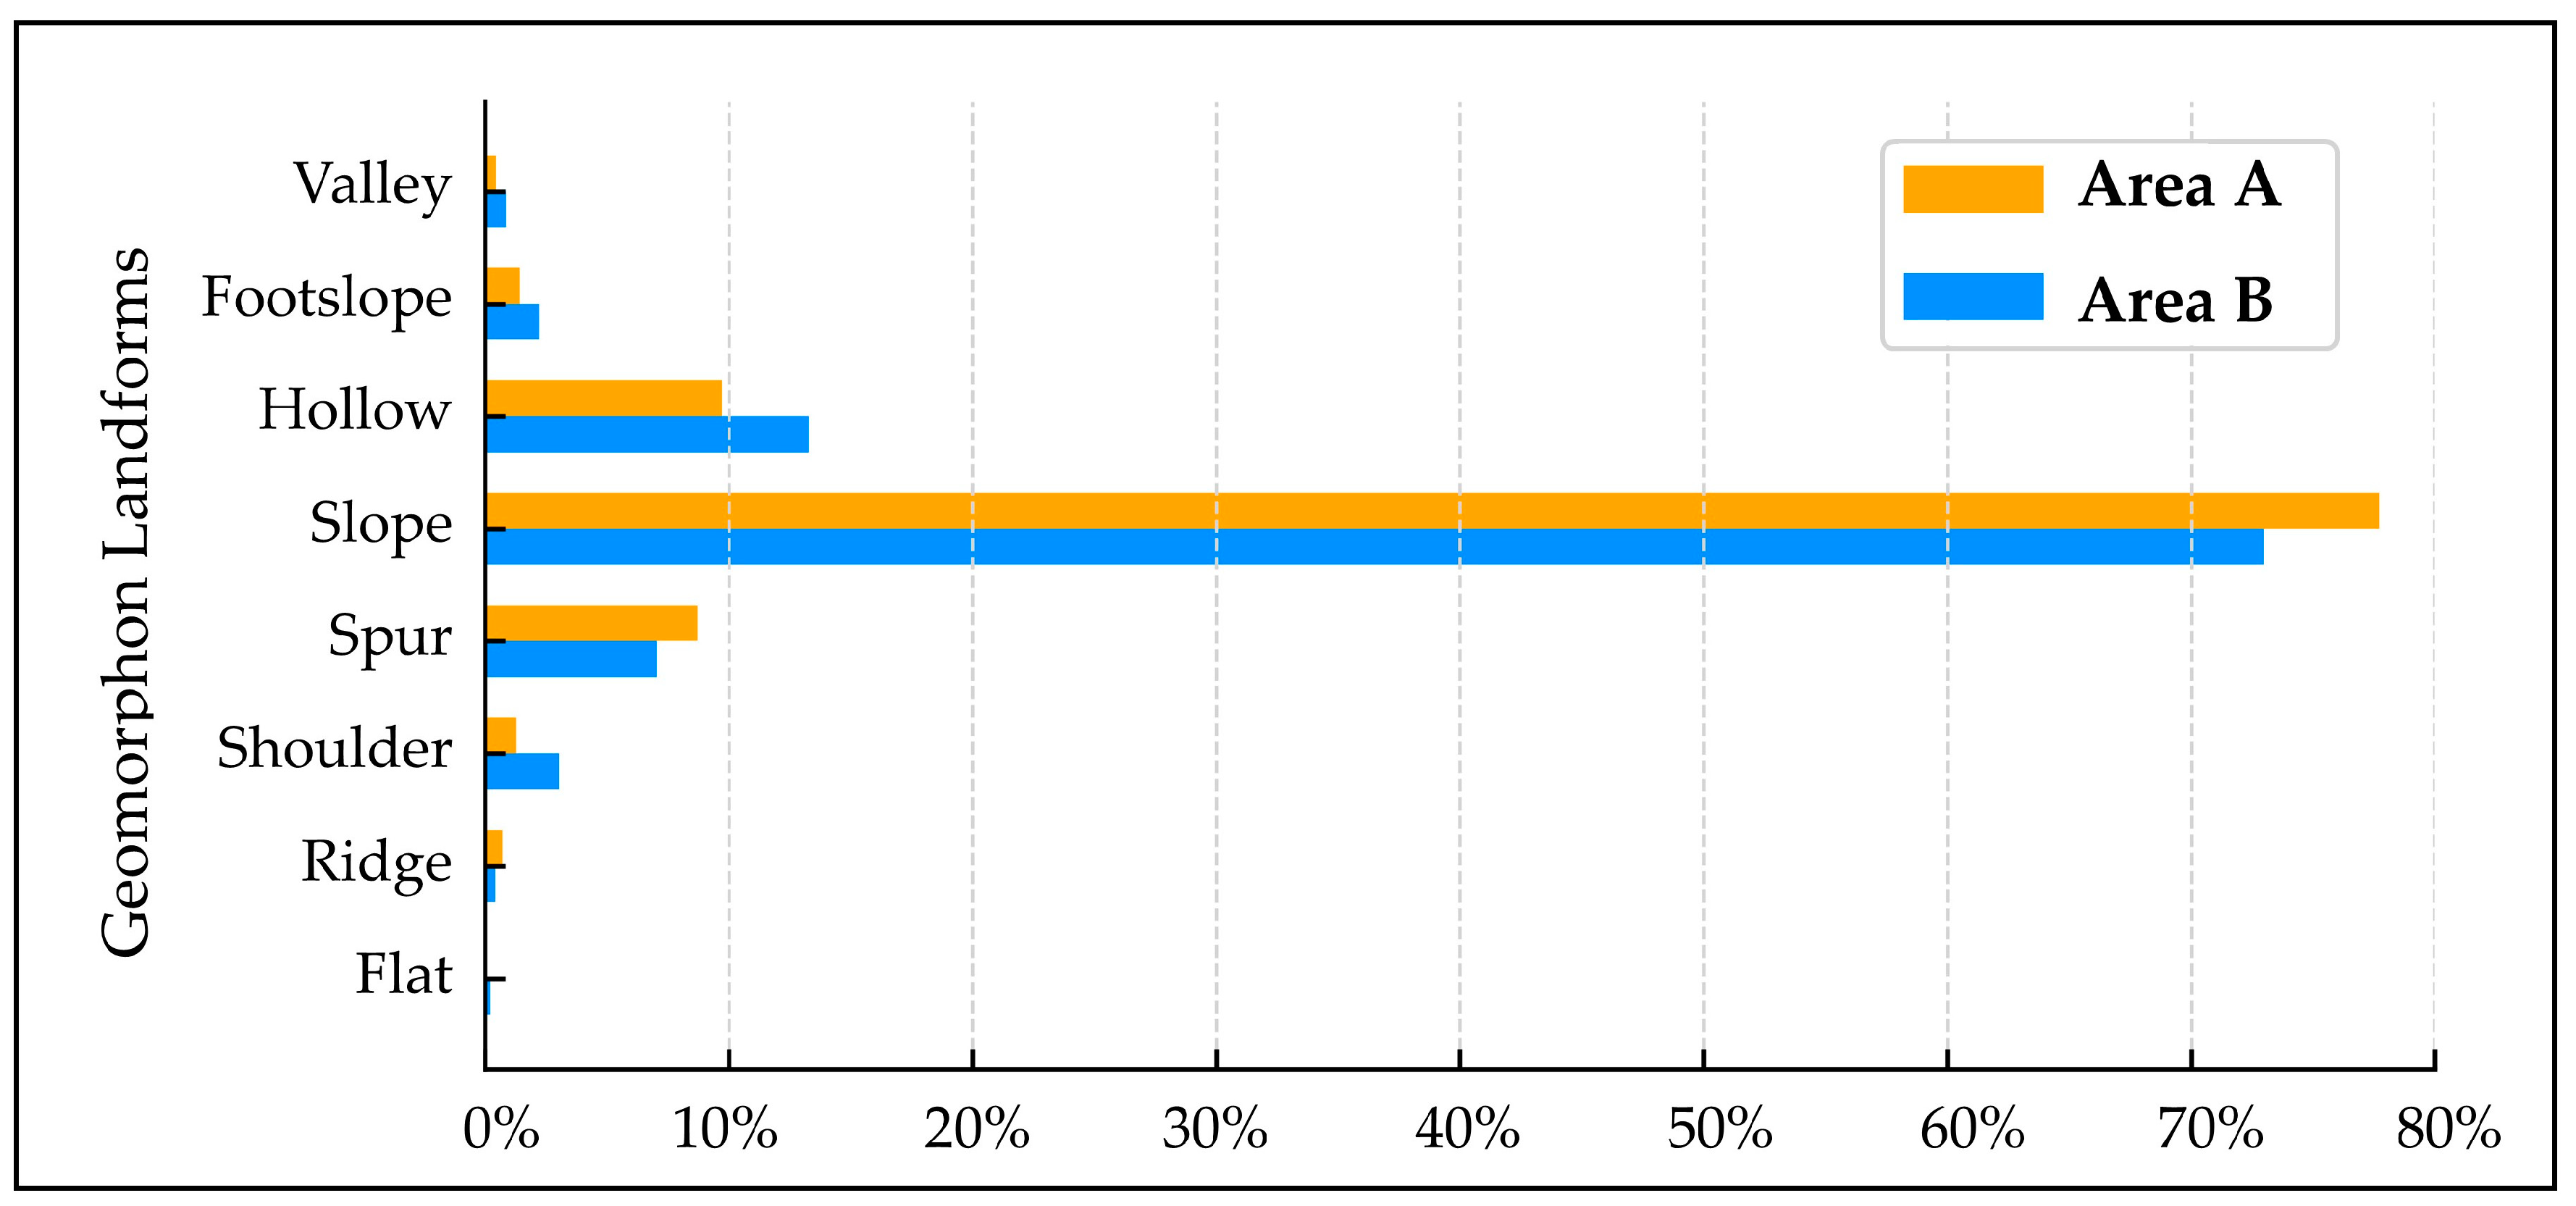
Figure 16 illustrates the characteristics of the Geomorphon Landforms. It highlights their prevalence on slopes: earth hummocks found on slopes accounted for 77.9% and 73.0% in Areas A and B, respectively. The next most common type of Geomorphon Landform hosting earth hummocks was the hollow, representing 9.8% and 13.3% in Areas A and B, respectively. The pit and peak landforms exhibited no presence of earth hummocks. This distribution suggests that the slope-type area could provide a suitable moisture environment for the formation of earth hummocks.
We also observed a pronounced tendency for earth hummocks to occur adjacent to lower-lying areas with higher TWI values, indicative of areas prone to water accumulation. A notable example is the eastern part of Area B (Figure 17), where the lowest areas, characterized by higher TWI values, formed distinct drainage lines (gullies). Earth hummock sites are commonly found near these lines and are separated by them.

3.5. Analysis of the Relationship between Morphological Features and Topographical Conditions

We explored the relationships between the datasets by calculating the Pearson correlation coefficients among four parameters: width, length, and height of the earth hummocks, and surface slope (Table 5). Observations showed that all the coefficients between the variables exhibited significant relationships and strong positive correlations among these morphological parameters (r = 0.63 to 0.90). However, the correlations between these parameters and the surface slope were weak (r = 0.17 to 0.19), suggesting a minimal influence of slope on the dimensions of earth hummocks. It is also important to note that Pearson correlation coefficients primarily measure linear relationships; therefore, these low r values may also indicate the presence of more complex, non-linear relationships not fully captured by this metric. One possible reason may be that, with steeper slopes, the shape of earth hummocks is limited [9,81], which could lead to a non-linear interaction between these variables.
One-way analysis of variance (ANOVA) tests were applied to compare the morphological parameters, specifically the width, length, and height of earth hummocks distributed across different groups of slopes, aspects, and Geomorphon Landforms. Table 6 shows the significant differences across the groups. These considerable variations confirm that these local topographical factors play a critical role in shaping the dimensions of earth hummocks.

4. Discussion

4.1. Earth Hummocks in Daisetsuzan National Park

We identified 18,838 earth hummocks covering an area of 82,598 m2. Compared to previous research on earth hummocks in Japan, this suggests that Daisetsuzan National Park is most likely the country’s largest known area of earth hummocks [82]. Their distribution and morphological features are discussed in the following subsections.

4.1.1. Distribution Characteristics

We found that earth hummocks were distributed on the slope at less than 20°, with an average of 8.3° (Figure 15a). They were rarely distributed on west-facing slopes in the two study areas (Figure 15b). This is because the west-facing slopes in the study area are relatively small, and the vegetation on the slopes is either predominantly Pinus pumila or almost bare ground due to the steep slopes, making the formation of earth hummocks difficult. Without vegetation, differential frost heaving occurs; then, it almost completely returns to its previous state during the thawing period [60].
Distribution maps of earth hummocks (Figure 11) indicate a higher density of earth hummocks in Area B than in Area A. This difference was attributed to the vegetation coverage in both areas, as shown in Figure 9. Turf-banked terraces were widely observed on steeper slopes in Area A (Figure 18). The tread surface of the terraces had no vegetation cover, and only steep risers were vegetated. Sparse vegetation cover would be insufficient to support the formation of earth hummocks, although further studies are needed.
Most earth hummocks are grouped in clusters in the study area, whereas earth hummocks with significant spacing are relatively rare, which is common in other research [36,83]. Distribution patterns may be associated with soil moisture levels and permafrost [34]. The TWI maps suggest that earth hummocks tend to be closer to drainage channels and are distributed in areas slightly elevated above the lowest gully bottoms (Figure 17). A similar situation was reported in other studies [36,37]. The formation of such patterns can be attributed to the role of earth hummocks as barriers to the flow of water. Their existence modifies the topography of the surface by dividing the ground into earth hummock areas with low hydraulic conductivity and inter-hommock areas with high hydraulic conductivity [26]. This affects the direction of water movement, influences drainage systems, and forms drainage systems and wetlands in inter-hummock areas [26,33]. Moreover, areas elevated above wetlands provide optimal conditions with moderate moisture and good drainage, preventing excessive soil saturation and offering a favorable environment for plant growth. Such conditions could benefit the soil freeze–thaw cycles and stabilization by plant root systems, further promoting the development of earth hummocks.

4.1.2. Morphological Characteristics

Morphological data (Table 3) indicate that the shape of the earth hummocks in the two study areas is close to a planar ellipsoidal base with an oblate dome-shaped protrusion. The length and width of the earth hummocks were similar to the field data recorded in Koaze’s study [60] at Hakuun-dake (less than 500 m away from Area A) in the 1960s.
Compared to previous studies in the mid-latitude regions of the Northern Hemisphere, the earth hummocks in our study areas were relatively large in terms of planar shape [37,81,84], but only one study examined earth hummocks similar in size [85]. Differences in regional climatic conditions primarily drive morphological variation. Both the thin snow cover on convex slopes due to extremely strong winter winds and the existence of permafrost in Daisetsuzan National Park lead to deep seasonal freeze–thaw cycles [61,63,86] and may promote the formation of large earth hummocks. Height was not included in the comparison because of potential errors arising from different calculation methods.

4.2. Advantages of UAV-SfM Framework in the Mountainous Area Research

This study demonstrates the advantages of using the UAV-SfM framework for geomorphological research, especially in mountainous areas. Walking off the approved hiking trail is forbidden in Japan’s national parks [53]. Even if a remote area is accessible by submitting a permit application for research activity off the trail, trampling during the survey can have adverse impacts on the alpine ecosystem, such as vegetation loss, plant community degradation, and damage to the terrain [87,88]. The distribution map produced by the UAV-SfM framework shows that some earth hummock areas extend far from the hiking trails (Figure 11). If traditional manual in situ measurements were chosen, researchers would need to enter these areas, which would inevitably have an adverse affect on alpine ecosystems. The UAV-SfM framework enables periglacial landform studies in protected areas.
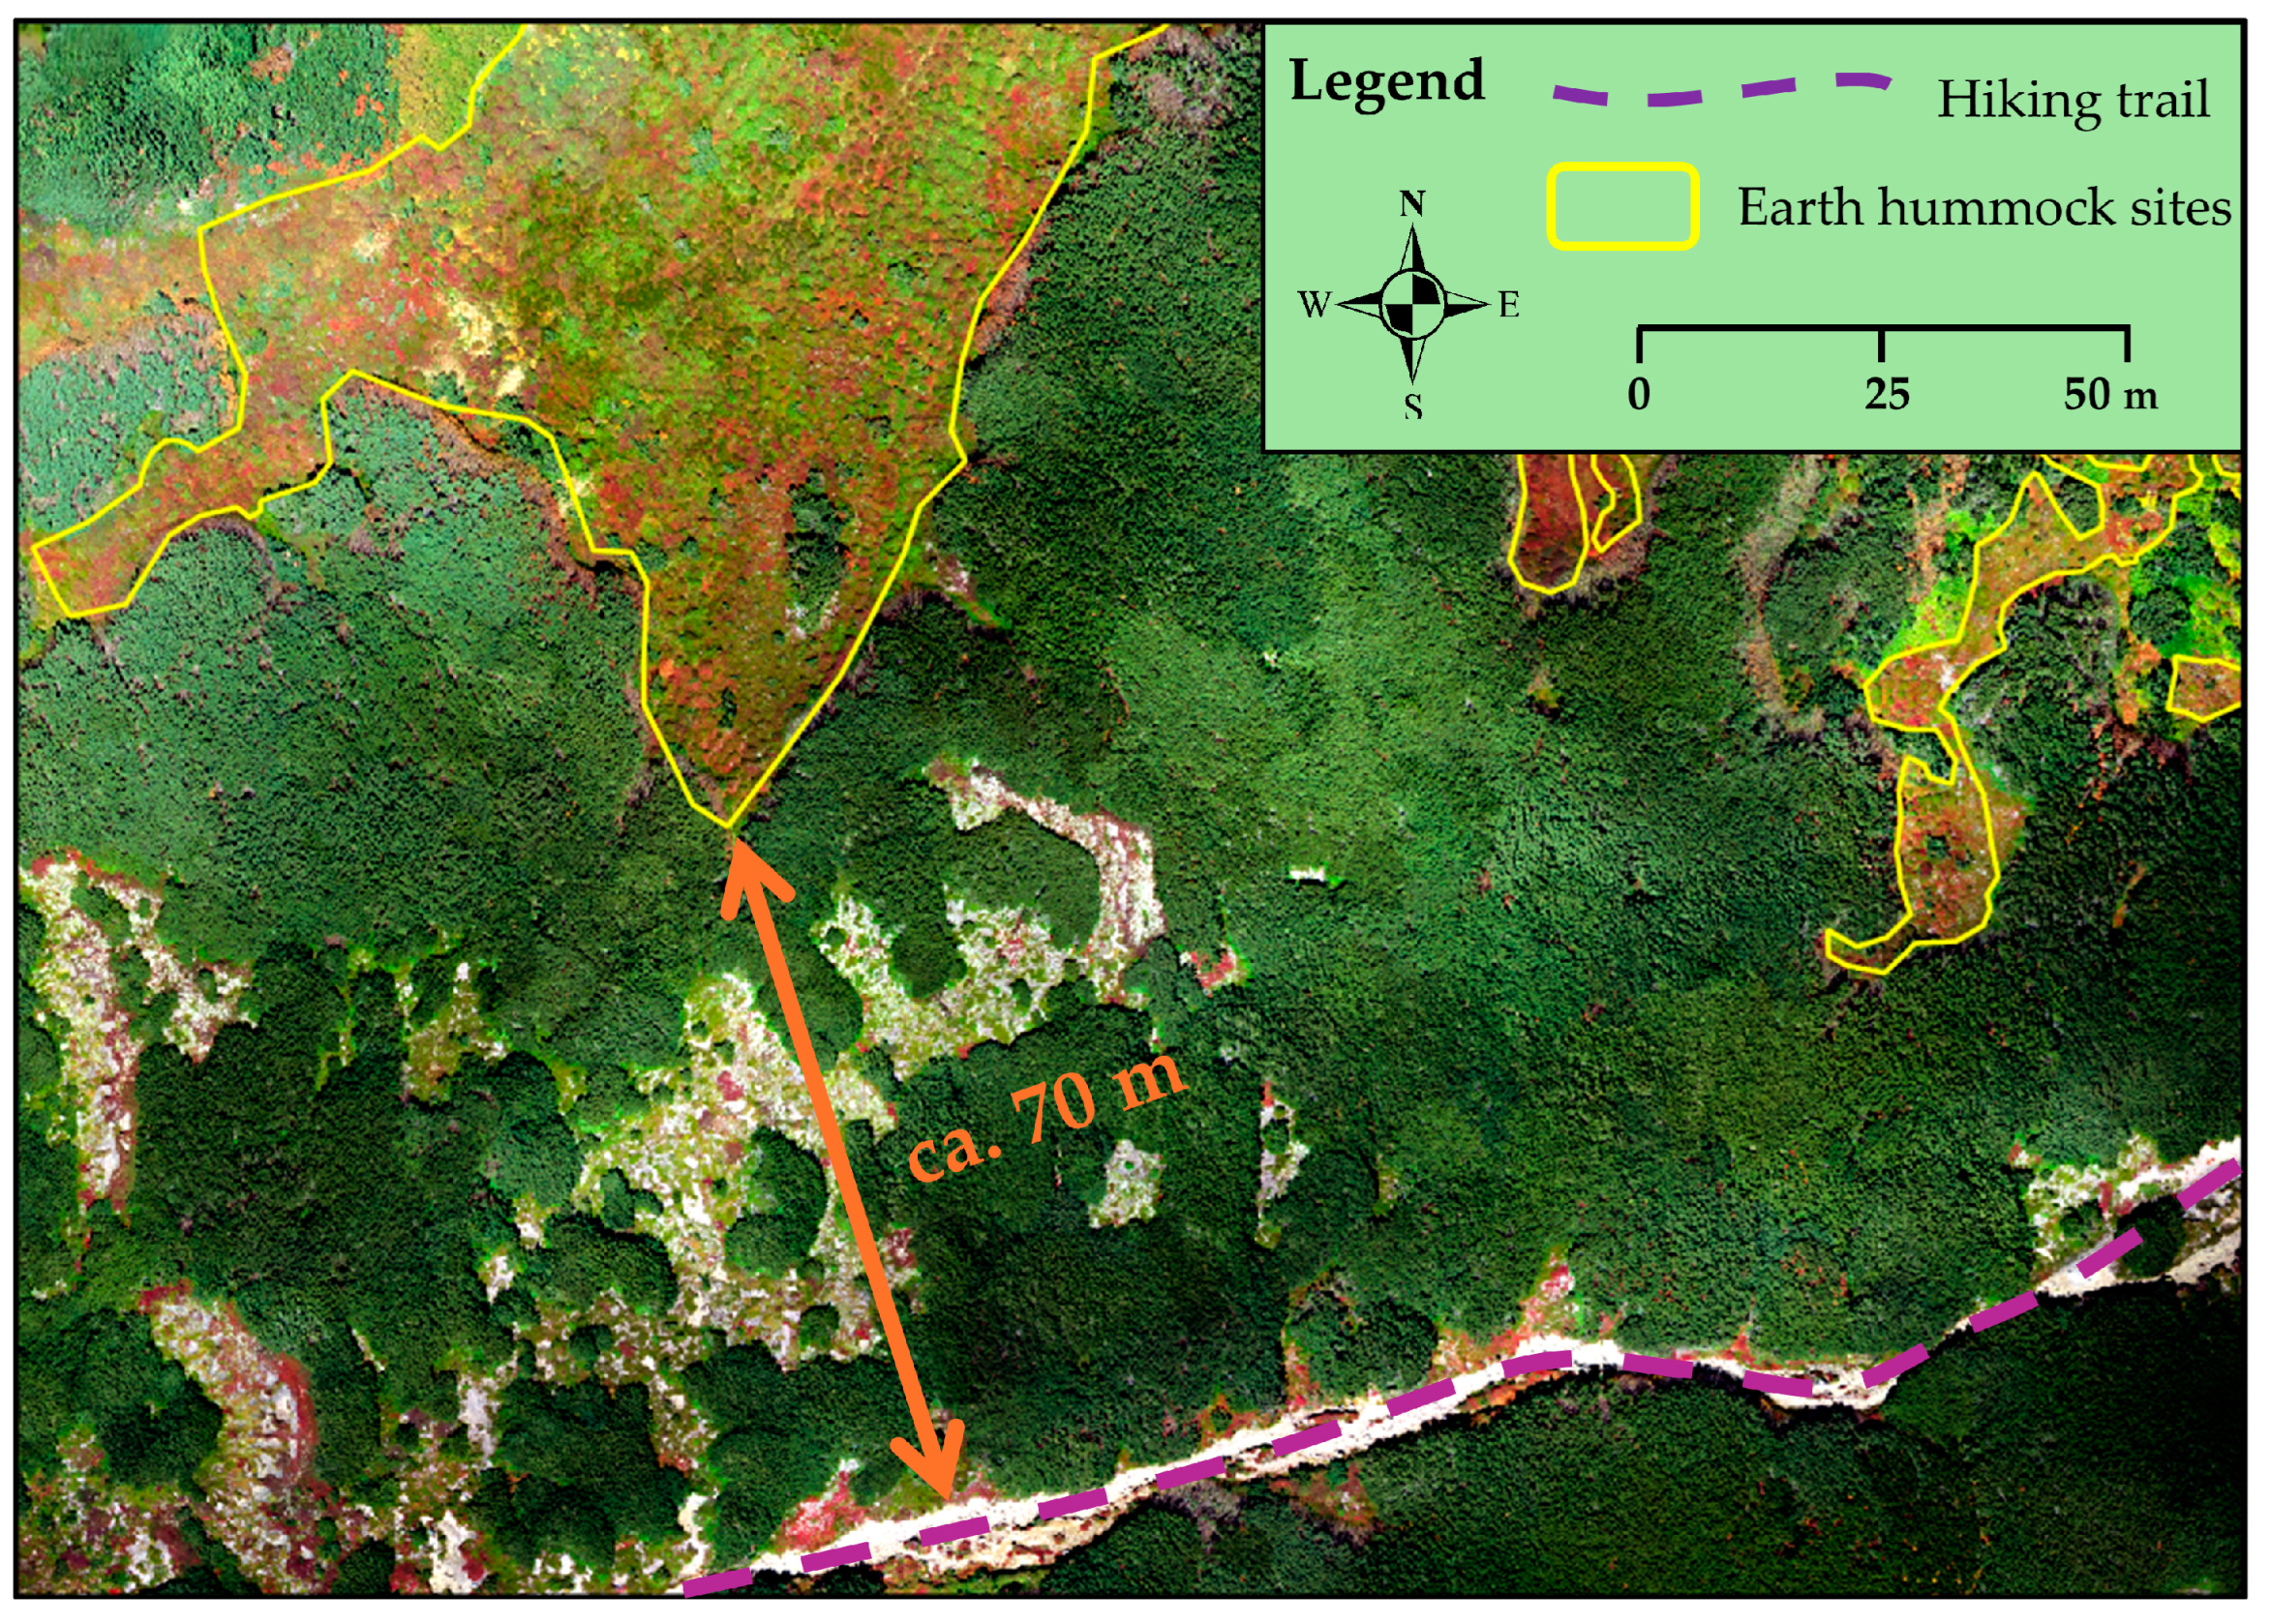
Furthermore, obstacles such as dense forests and lakes between a trail and a target site hinder the approach of the site even if researchers are allowed to go off the trail. For example, one of the earth hummock sites in Area B (Figure 19), approximately 70 m away from the hiking trail, is densely covered with Pinus pumila, approximately 1–2 m tall. In situ field surveys were virtually impossible in this case. In addition, survey activities away from hiking trails are often dangerous because of the steep slopes, unstable ground, and wildlife. The use of the UAV-SfM framework can effectively address these challenges.
The UAV-SfM framework also showed improved data collection efficiency. Current traditional measurement methods usually capture morphological data only for dozens or hundreds of earth hummocks [17,33,81,89]; this study collected 18,838 data from earth hummocks. The size of the dataset acquired for this study was unprecedented in scale, allowing for a more thorough analysis.
The most extensive study on patterned ground in Daisetsuzan National Park was conducted by Koaze [60]. He conducted an in situ field survey over seven years, between 1957 and 1964. In his study, he was able to identify less than one-tenth of all distributed periglacial landforms, including earth hummocks. It is clear that an in situ field survey in mountains is challenging when compared to the capabilities of the UAV-SfM framework.
Numerous studies have also used the UAV-SfM framework to investigate periglacial landforms, including solifluction features and patterned ground [49,52,90,91]. These studies typically rely on orthomosaic images and DEMs to map and interpret landforms. Our study introduces multi-directional hillshade maps in 2D and 3D views. The ability of the hillshade maps to more effectively reveal the details of micro-landforms greatly simplifies the visual interpretation process and provides high accuracy. Periglacial landform studies should include multi-directional hillshade mapping as part of the UAV-SfM framework.

5. Conclusions

We focused on earth hummocks distributed in Daisetsuzan National Park and successfully created highly accurate distribution maps using the UAV-SfM framework. The orthomosaic images and DEMs achieved resolutions higher than 2 cm/pixel and 4 cm/pixel, respectively. Observation of DEMs and multi-directional hillshade maps identified 18,838 individual earth hummocks at 87 sites.
Moreover, for the first time, we identified the individual shapes of massive earth hummocks based on high-resolution imagery data. The average length, width, and height were 1.22 m, 1.03 m, and 0.15 m, respectively, and the shape of the earth hummocks resembled an ellipsoidal base topped with an oblate dome-like protrusion. We used multi-directional hillshade maps derived from high-resolution DEMs in both 2D and 3D for mapping and provided detailed documentation of the entire process for calculating the morphological parameters of earth hummocks.
We also investigated the relationship between the morphology of earth hummocks and various topographical factors. Maps of the topographical conditions, including slope, aspect, TWI, and the Geomorphon Landforms of the study areas and the distribution areas of earth hummocks were examined. The average slope of the distribution areas is 8.3° (mostly below 20°), and earth hummocks tend to develop in the areas that are slightly elevated above the lowest gully bottoms.
Statistical analysis confirmed a significant correlation between morphological parameters of earth hummocks and topographical conditions such as slope, aspect, and Geomorphon Landforms in the study areas.
We highlight the advantages and importance of the UAV-SfM framework with multi-directional hillshade mapping for studying periglacial landforms, particularly in protected natural areas such as national parks and remote mountainous regions.
Finally, the imagery data obtained confirmed the existence of various other periglacial landforms in the two study areas, which will be presented elsewhere.

Author Contributions

Conceptualization, T.W. (Teiji Watanabe); methodology, Y.M., T.W. (Teiji Watanabe), Y.S.H., Y.S. and T.W. (Ting Wang); software, Y.M.; validation, Y.M., T.W. (Teiji Watanabe), Y.S.H., Y.S. and T.W. (Ting Wang); formal analysis, Y.M.; investigation, resources, and data curation, Y.M., T.W. (Teiji Watanabe), Y.S.H., Y.S. and T.W. (Ting Wang); writing—original draft preparation, Y.M.; writing—review and editing, Y.M., T.W. (Teiji Watanabe), Y.S.H., Y.S. and T.W. (Ting Wang); visualization, Y.M. and T.W. (Teiji Watanabe); supervision and project administration, T.W. (Teiji Watanabe). All authors have read and agreed to the published version of the manuscript.

Funding

This research received no external funding.

Data Availability Statement

The original contributions presented in the study are included in the article, further inquiries can be directed to the corresponding author.

Acknowledgments

The UAV flight permit was granted by the Hokkaido Regional Forest Office of the Forestry Agency and the Ministry of the Environment of Japan.

Conflicts of Interest

The authors declare no conflicts of interest.

References

  1. French, H.M. Does Lozinski’s periglacial realm exist today? A discussion relevant to modern usage of the term ‘periglacial’. Permafr. Periglac. Process. 2000, 11, 35–42. [Google Scholar] [CrossRef]
  2. Murton, J.B. What and where are periglacial landscapes? Permafr. Periglac. Process. 2021, 32, 186–212. [Google Scholar] [CrossRef]
  3. Warburton, J.; Beylich, A.A.; Etienne, S.; Etzelmüller, B.; Gordeev, V.V.; Käyhkö, J.; Tweed, F.S. Sediment budgets and rates of sediment transfer across cold environments in Europe: Introduction and background to the european science foundation network ‘sedimentary source-to-sink fluxes in cold environments’ (sediflus). Geogr. Ann. Ser. A Phys. Geogr. 2007, 89, 1–3. [Google Scholar] [CrossRef]
  4. Knight, J.; Harrison, S. Periglacial and paraglacial environments: A view from the past into the future. Geol. Soc. Lond. Spec. Publ. 2009, 320, 1–4. [Google Scholar] [CrossRef]
  5. Rouyet, L.; Karjalainen, O.; Niittynen, P.; Aalto, J.; Luoto, M.; Lauknes, T.R.; Larsen, Y.; Hjort, J. Environmental controls of InSAR-based periglacial ground dynamics in a sub-arctic landscape. J. Geophys. Res. Earth Surf. 2021, 126, e2021JF006175. [Google Scholar] [CrossRef]
  6. Engel, Z.; Křížek, M.; Braucher, R.; Uxa, T.; Krause, D.; Aster Team. 10Be exposure age for sorted polygons in the sudetes mountains. Permafr. Periglac. Process. 2021, 32, 154–168. [Google Scholar] [CrossRef]
  7. Grab, S. Characteristics and palaeoenvironmental significance of relict sorted patterned ground, Drakensberg plateau, Southern Africa. Quat. Sci. Rev. 2002, 21, 1729–1744. [Google Scholar] [CrossRef]
  8. Garankina, E.V.; Lobkov, V.A.; Shorkunov, I.G.; Belyaev, V.R. Identifying relict periglacial features in watershed landscape and deposits of Borisoglebsk Upland, Central European Russia. J. Geol. Soc. 2022, 179, jgs2021. [Google Scholar] [CrossRef]
  9. Ruiz-Fernández, J.; Oliva, M.; Otero, X.L.; García-Hernández, C. Morphometric and sedimentological characteristics of Late Holocene earth hummocks in the Zackenberg Valley (NE Greenland). Sci. Total Environ. 2020, 737, 140281. [Google Scholar] [CrossRef]
  10. Grab, S. Aspects of the geomorphology, genesis and environmental significance of earth hummocks (thúfur, pounus): Miniature cryogenic mounds. Prog. Phys. Geogr. Earth Environ. 2005, 29, 139–155. [Google Scholar] [CrossRef]
  11. Li, G.; Mu, J.; Liu, Y.; Smith, N.G.; Sun, S. Effect of microtopography on soil respiration in an alpine meadow of the Qinghai-Tibetan plateau. Plant Soil 2017, 421, 147–155. [Google Scholar] [CrossRef]
  12. Zhao, H.; Wei, D.; Yan, Y.; Wu, J.; Wang, X. Alpine hummocks drive plant diversity and soil fertile islands on the Tibetan plateau. Wetlands 2020, 40, 1217–1227. [Google Scholar] [CrossRef]
  13. Washburn, A.L. Classification of patterned ground and review of suggested origins. Geol. Soc. Am. Bull. 1956, 67, 823–866. [Google Scholar] [CrossRef]
  14. Tarnocai, C.; Zoltai, S.C. Earth hummocks of the Canadian arctic and subarctic. Arct. Alp. Res. 1978, 10, 581. [Google Scholar] [CrossRef]
  15. Mackay, J.R.; MacKay, D.K. Cryostatic pressures in nonsorted circles (mud hummocks), Inuvik, Northwest Territories. Can. J. Earth Sci. 1976, 13, 889–897. [Google Scholar] [CrossRef]
  16. Peterson, R.A.; Krantz, W.B. A Mechanism for differential frost heave and its implications for patterned-ground formation. J. Glaciol. 2003, 49, 69–80. [Google Scholar] [CrossRef]
  17. Killingbeck, J.; Ballantyne, C.K. Earth hummocks in West Dartmoor, SW England: Characteristics, age and origin. Permafr. Periglac. Process. 2012, 23, 152–161. [Google Scholar] [CrossRef]
  18. Verret, M.; Wang, Y.; Bjornson, J.; Lacelle, D. Hummocks in alpine tundra, Northern British Columbia, Canada: Distribution, morphology and organic carbon composition. Arct. Sci. 2019, 5, 127–147. [Google Scholar] [CrossRef]
  19. Pettapiece, W.W. A hummocky permafrost soil from the subarctic of Northwestern Canada and some Influences of fire. Can. J. Soil Sci. 1974, 54, 343–355. [Google Scholar] [CrossRef]
  20. Van Vliet-Lanoë, B. Patterned Ground and Climate Change. In Permafrost: Distribution, Composition and Impacts on Infrastructure and Ecosystems; Podrovsky, O., Ed.; Nova Science Publishers, Inc.: Hauppauge, NY, USA, 2014; Chapter 2; pp. 67–106. ISBN 978-162-948-830-1. [Google Scholar]
  21. Pintaldi, E.; D’Amico, M.E.; Siniscalco, C.; Cremonese, E.; Celi, L.; Filippa, G.; Prati, M.; Freppaz, M. Hummocks affect soil properties and soil-vegetation relationships in a subalpine grassland (North-Western Italian Alps). Catena 2016, 145, 214–226. [Google Scholar] [CrossRef]
  22. Lehmkuhl, F. Modern and past periglacial features in Central Asia and their implication for paleoclimate reconstructions. Prog. Phys. Geogr.-Earth Environ. 2016, 40, 369–391. [Google Scholar] [CrossRef]
  23. Feuillet, T.; Mercier, D.; Decaulne, A.; Cossart, E. Classification of sorted patterned ground areas based on their environmental characteristics (Skagafjörður, Northern Iceland). Geomorphology 2012, 139–140, 577–587. [Google Scholar] [CrossRef]
  24. Lewkowicz, A.G. Slope hummock development, Fosheim Peninsula, Ellesmere Island, Nunavut, Canada. Quat. Res. 2011, 75, 334–346. [Google Scholar] [CrossRef]
  25. Kim, T. Thufur and turf exfollation in a subalpine grassland on Mt Halla, Jeju Island, Korea. Mt. Res. Dev. 2008, 28, 272–278. [Google Scholar] [CrossRef]
  26. Quinton, W.L.; Marsh, P. The influence of mineral earth hummocks on subsurface drainage in the continuous permafrost zone. Permafr. Periglac. Process. 1998, 9, 213–228. [Google Scholar] [CrossRef]
  27. Jaworski, T.; Chutkowski, K. Genesis, morphology, age and distribution of cryogenic mounds on Kaffiøyra and Hermansenøya, Northwest Svalbard. Permafr. Periglac. Process. 2015, 26, 304–320. [Google Scholar] [CrossRef]
  28. Grab, S. Non-sorted patterned ground in the high Drakensberg, Southern Africa: Some new data. Geogr. J. 1998, 164, 19–31. [Google Scholar] [CrossRef]
  29. Walker, D.A.; Epstein, H.E.; Romanovsky, V.E.; Ping, C.L.; Michaelson, G.J.; Daanen, R.P.; Shur, Y.; Peterson, R.A.; Krantz, W.B.; Raynolds, M.K.; et al. Arctic patterned-ground ecosystems: A synthesis of field studies and models along a North American Arctic Transect. J. Geophys. Res. Biogeosci. 2008, 113, G03S01. [Google Scholar] [CrossRef]
  30. Gillespie, A.W.; Sanei, H.; Diochon, A.; Ellert, B.H.; Regier, T.Z.; Chevrier, D.; Dynes, J.J.; Tarnocai, C.; Gregorich, E.G. Perennially and annually frozen soil carbon differ in their susceptibility to decomposition: Analysis of subarctic earth hummocks by bioassay, XANES and pyrolysis. Soil Biol. Biochem. 2014, 68, 106–116. [Google Scholar] [CrossRef]
  31. Khani, H.M.; Kinnard, C.; Gascoin, S.; Levesque, E. Fine-scale environment control on ground surface temperature and thaw depth in a High Arctic tundra landscape. Permafr. Periglac. Process. 2023, 34, 467–480. [Google Scholar] [CrossRef]
  32. Biasi, C.; Wanek, W.; Rusalimova, O.; Kaiser, C.; Meyer, H.; Barsukov, P.; Richter, A. Microtopography and plant-cover controls on nitrogen dynamics in hummock tundra ecosystems in Siberia. Arct. Antarct. Alp. Res. 2005, 37, 435–443. [Google Scholar] [CrossRef]
  33. Kokelj, S.V.; Burn, C.R.; Tarnocai, C. The structure and dynamics of earth hummocks in the subarctic forest near Inuvik, Northwest Territories, Canada. Arct. Antarct. Alp. Res. 2007, 39, 99–109. [Google Scholar] [CrossRef]
  34. Luoto, M.; Seppälä, M. Characteristics of earth hummocks (pounus) with and without permafrost in Finnish Lapland. Geogr. Ann. Ser. Phys. Geogr. 2002, 84, 127–136. [Google Scholar] [CrossRef]
  35. Grab, S.W. Earth hummocks (thúfur): New insights to their thermal characteristics and development in Eastern Lesotho, Southern Africa. Earth Surf. Process. Landf. 2005, 30, 541–555. [Google Scholar] [CrossRef]
  36. Gurney, S.D.; Hayward, S. Earth hummocks in North-east Okstindan, Northern Norway: Morphology, distribution and environmental constraints. Nor. Geogr. Tidsskr.-Nor. J. Geogr. 2015, 69, 299–309. [Google Scholar] [CrossRef]
  37. Milošević, M.; Ćalić, J.; Kovačević-Majkić, J.; Milivojević, M. Thufur morphology within the Ponor depression (Stara Planina, Serbia). J. Geogr. Inst. Jovan Cvijić SASA 2022, 72, 117–132. [Google Scholar] [CrossRef]
  38. Hallet, B.; Prestrud, S. Dynamics of periglacial sorted circles in western Spitsbergen. Quat. Res. 1986, 26, 81–99. [Google Scholar] [CrossRef]
  39. Hjort, J.; Marmion, M. Effects of sample size on the accuracy of geomorphological models. Geomorphology 2008, 102, 341–350. [Google Scholar] [CrossRef]
  40. Iglhaut, J.; Cabo, C.; Puliti, S.; Piermattei, L.; O’Connor, J.; Rosette, J. Structure from motion photogrammetry in forestry: A review. Curr. For. Rep. 2019, 5, 155–168. [Google Scholar] [CrossRef]
  41. Eltner, A.; Sofia, G. Chapter 1—Structure from motion photogrammetric technique. In Developments in Earth Surface Processes; Tarolli, P., Mudd, S.M., Eds.; Remote Sensing of Geomorphology; Elsevier: Amsterdam, The Netherlands, 2020; Volume 23, pp. 1–24. ISBN 978-044-464-177-9. [Google Scholar] [CrossRef]
  42. Westoby, M.J.; Brasington, J.; Glasser, N.F.; Hambrey, M.J.; Reynolds, J.M. ‘Structure-from-Motion’ photogrammetry: A low-cost, effective tool for geoscience applications. Geomorphology 2012, 179, 300–314. [Google Scholar] [CrossRef]
  43. Deliry, S.I.; Avdan, U. Accuracy evaluation of UAS photogrammetry and structure from motion in 3D modeling and volumetric calculations. J. Appl. Remote Sens. 2023, 17, 024515. [Google Scholar] [CrossRef]
  44. Agüera-Vega, F.; Carvajal-Ramírez, F.; Martínez-Carricondo, P.; Sánchez-Hermosilla López, J.; Mesas-Carrascosa, F.J.; García-Ferrer, A.; Pérez-Porras, F.J. Reconstruction of extreme topography from UAV structure from motion photogrammetry. Measurement 2018, 121, 127–138. [Google Scholar] [CrossRef]
  45. Bi, R.; Gan, S.; Yuan, X.; Li, R.; Gao, S.; Yang, M.; Hu, L. Multi-view analysis of high-resolution geomorphic features in complex mountains based on UAV–LiDAR and SfM–MVS: A case study of the northern pit rim structure of the mountains of Lufeng, China. Appl. Sci. 2023, 13, 738. [Google Scholar] [CrossRef]
  46. Hayakawa, Y.S.; Yoshida, H.; Drǎguţ, L.; Oguchi, T. Automated extraction of hummocks in debris avalanche deposits using DEMs: A case study at Mt. Gassan, Northwest Japan. Z. Geomorphol. Suppl. Issues 2017, 61, 199–212. [Google Scholar] [CrossRef]
  47. Hayakawa, Y.S.; Yoshida, H.; Obanawa, H.; Naruhashi, R.; Okumura, K.; Zaiki, M.; Kontani, R. Characteristics of debris avalanche deposits inferred from source volume estimate and hummock morphology around Mt. Erciyes, central Turkey. Nat. Hazards Earth Syst. Sci. 2018, 18, 429–444. [Google Scholar] [CrossRef]
  48. Pepe, M.; Alfio, V.S.; Costantino, D. UAV platforms and the SfM-MVS approach in the 3D surveys and modelling: A review in the cultural heritage field. Appl. Sci. 2022, 12, 12886. [Google Scholar] [CrossRef]
  49. Lousada, M.; Pina, P.; Vieira, G.; Bandeira, L.; Mora, C. Evaluation of the use of very high resolution aerial imagery for accurate ice-wedge polygon mapping (Adventdalen, Svalbard). Sci. Total Environ. 2018, 615, 1574–1583. [Google Scholar] [CrossRef]
  50. Tomczyk, A.M.; Ewertowski, M.W.; Stawska, M.; Rachlewicz, G. Detailed alluvial fan geomorphology in a high-arctic periglacial environment, Svalbard: Application of unmanned aerial vehicle (UAV) surveys. J. Maps 2019, 15, 460–473. [Google Scholar] [CrossRef]
  51. Pereira, F.; Marques, J.S.; Heleno, S.; Pina, P. Detection and delineation of sorted stone circles in Antarctica. Remote Sens. 2020, 12, 160. [Google Scholar] [CrossRef]
  52. Dąbski, M.; Zmarz, A.; Pabjanek, P.; Korczak-Abshire, M.; Karsznia, I.; Chwedorzewska, K.J. UAV-based detection and spatial analyses of periglacial landforms on Demay Point (King George Island, South Shetland Islands, Antarctica). Geomorphology 2017, 290, 29–38. [Google Scholar] [CrossRef]
  53. Kobayashi, Y.; Watanabe, T. Evaluation of the effectiveness of trail repair works based on three-dimensional monitoring around Mount Kurodake, Daisetsuzan National Park, Japan. Sustainability 2023, 15, 12794. [Google Scholar] [CrossRef]
  54. Wang, T.; Watanabe, T. Monitoring campsite soil erosion by structure-from-motion photogrammetry: A case study of Kuro-Dake campsites in Daisetsuzan National Park, Japan. J. Environ. Manag. 2022, 314, 115106. [Google Scholar] [CrossRef] [PubMed]
  55. Katsui, Y.; Ito, T. 24. Daisetsuzan Ohachidaira Caldera. In Proceedings of the Volcanological Society of Japan Spring Meeting 1975, Tokyo, Japan, 19–21 May 1975; Volcanology Volume 20. p. 113. (In Japanese) [Google Scholar] [CrossRef]
  56. Sone, T. Permafrost environment of the Daisetsu Mountains, Hokkaido, Japan. Permafr. Periglac. Process. 1992, 3, 235–240. [Google Scholar] [CrossRef]
  57. Abe, T.; Iwahana, G.; Sone, T.; Uchida, M. Distribution of surface displacement induced by seasonal ground thaw in the Daisetsu Mountains using synthetic aperture radar. Seppyo 2022, 84, 13–27. (In Japanese) [Google Scholar] [CrossRef]
  58. Ishige, K.; Nakagawa, M. Late Pleistocene-Holocene volcanic history of Asahidake subgroup of Taisetsu volcano group, central Hokkaido, Japan. J. Geol. Soc. Jpn. 2017, 123, 73–91, (In Japanese with English Abstract). [Google Scholar] [CrossRef]
  59. Yasuda, Y.; Sato, E.; Wada, K.; Suzuki-Kamata, K. Eruption interval between two pyroclastic-flows from the Ohachidaira caldera of Taisetsu Volcano, central Hokkaido, Japan: Estimation from the paleomagnetic directions. Kazan 2015, 60, 447–459, (In Japanese with English Abstract). [Google Scholar] [CrossRef]
  60. Koaze, T. The Patterned grounds on the Daisetsu volcanic group, central Hokkaido. Geogr. Rev. Jpn. 1965, 38, 179–199. (In Japanese) [Google Scholar] [CrossRef]
  61. Ishikawa, M.; Sawagaki, T. GIS-simulation of the spatial distribution of snow cover and observed ground temperatures in the Daisetsu Mountains, Japan. Nor. Geogr. Tidsskr.-Nor. J. Geogr. 2001, 55, 212–218. [Google Scholar] [CrossRef]
  62. Sone, T. The lower limit of permafrost distribution in Daisetsuzan, Hokkaido. In Proceedings of the General Meeting of the Association of Japanese Geographers, Tokyo, Japan, 20–23 March 2016; p. 100298. (In Japanese). [Google Scholar] [CrossRef]
  63. Fukuda, M.; Kinoshita, S. Permafrost at Mt. Taisetsu, Hokkaido and its climatic environment. Quat. Res. 1974, 12, 192–202, (In Japanese with English Abstract). [Google Scholar] [CrossRef]
  64. Igarashi, Y.; Takahashi, N. Origin and vegetational succession of upland bogs in the Daisetsu Mountains, central Hokkaido (I). Quat. Res. 1985, 24, 99–109, (In Japanese with English Abstract). [Google Scholar] [CrossRef]
  65. Takahashi, N. Alpine environment of the Takanegahara plateau in the central Daisetsuzan Mountain. Hokkai Gakuen Univ. Gakuen Ronshu 2010, 144, 1–35. Available online: https://cir.nii.ac.jp/crid/1050001337523154560 (accessed on 1 August 2024). (In Japanese).
  66. Sato, K.; Takahashi, N. Specific alpine vegetation at the crater of Mt. Hakuundake, Daisetsuzan. Hokkai Gakuen Univ. Gakuen Ronshu 2016, 167, 31–48. Available online: http://hokuga.hgu.jp/dspace/handle/123456789/3063 (accessed on 1 August 2024). (In Japanese).
  67. Dinkov, D.D. 4D Monitoring of mountain areas using the UAV-PPK workflow. Silva Balcanica 2023, 24, 13–35. [Google Scholar] [CrossRef]
  68. Takasu, T.; Yasuda, A. Development of the low-cost RTK-GPS receiver with an open source program package RTKLIB. In Proceedings of the International Symposium on GPS/GNSS, International Convention Center, Jeju, Republic of Korea, 12–17 July 2009; Volume 1. [Google Scholar]
  69. Obanawa, H.; Hayakawa, Y.S.; Sakanoue, S. How to reduce doming without GCPs in RTK-UAV surveys?–Photographing and data processing that achieves cm-level accuracy. J. Jpn. Agric. Syst. Soc. 2021, 37, 29–38, (In Japanese with English Abstract). [Google Scholar] [CrossRef]
  70. Agisoft (2022) Agisoft Metahshape Manual—Standard Edition, Version 1.8. Available online: https://www.agisoft.com/pdf/metashape_1_8_en.pdf (accessed on 20 August 2024).
  71. Ågren, A.M.; Lidberg, W.; Strömgren, M.; Ogilvie, J.; Arp, P.A. Evaluating digital terrain indices for soil wetness mapping—A Swedish case study. Hydrol. Earth Syst. Sci. 2014, 18, 3623–3634. [Google Scholar] [CrossRef]
  72. Kopecký, M.; Macek, M.; Wild, J. Topographic wetness index calculation guidelines based on measured soil moisture and plant species composition. Sci. Total Environ. 2021, 757, 143785. [Google Scholar] [CrossRef]
  73. Sørensen, R.; Zinko, U.; Seibert, J. On the calculation of the topographic wetness index: Evaluation of different methods based on field observations. Hydrol. Earth Syst. Sci. 2006, 10, 101–112. [Google Scholar] [CrossRef]
  74. Mattivi, P.; Franci, F.; Lambertini, A.; Bitelli, G. TWI computation: A comparison of different open source GISs. Open Geospat. Data Softw. Stand. 2019, 4, 6. [Google Scholar] [CrossRef]
  75. Melo, P.A.; Alvarenga, L.A.; Tomasella, J.; Mello, C.R.; Martins, M.A.; Coelho, G. Sensitivity and performance analyses of the distributed hydrology–soil–vegetation model using geomorphons for landform mapping. Water 2021, 13, 2032. [Google Scholar] [CrossRef]
  76. Jasiewicz, J.; Stepinski, T.F. Geomorphons—A pattern recognition approach to classification and mapping of landforms. Geomorphology 2013, 182, 147–156. [Google Scholar] [CrossRef]
  77. Veronesi, F.; Hurni, L. A GIS tool to increase the visual quality of relief shading by automatically changing the light direction. Comput. Geosci. 2015, 74, 121–127. [Google Scholar] [CrossRef]
  78. Farmakis-Serebryakova, M.; Hurni, L. Comparison of relief shading techniques applied to landforms. ISPRS Int. J. Geo-Inf. 2020, 9, 253. [Google Scholar] [CrossRef]
  79. Loissios, D.; Tzelepis, N.; Nakos, B. A methodology for creating analytical hillshading by combining different lighting directions. In Proceedings of the 23rd International Cartographic Conference, ICC, Moscow, Russia, 4–10 August 2007. [Google Scholar] [CrossRef]
  80. Sasaki, S. Earth hummocks of Northern Hokkaido. Quat. Res. 1979, 18, 31–37, (In Japanese with English Abstract). [Google Scholar] [CrossRef]
  81. Ogata, T. Morphology and environmental factors of periglacial hummocks in the Nemuro Peninsula, Northern Japan. Geogr. Rev. Jpn. 2007, 80, 246–258. [Google Scholar] [CrossRef]
  82. Koaze, T.; Shimizu, C.; Sawada, Y.; Takeda, K.; Kawauchi, K. Earth hummocks in Obihiro, Hokkaido. Rep. Obihiro Cent. City Mus. 2020, 38, 25–32. Available online: https://ndlsearch.ndl.go.jp/books/R000000004-I033277072 (accessed on 15 August 2024). (In Japanese).
  83. Scotter, G.W.; Zoltai, S.C. Earth hummocks in the sunshine Area of the Rocky Mountains, Alberta and British Columbia. Arctic 1982, 35, 411–416. [Google Scholar] [CrossRef]
  84. Marcu, M.F. Glacial and periglacial relief in the Făgăraş Mountain, with special focus on the Vâlsan river basin. Forum Geogr. 2011, 10, 27–34. [Google Scholar] [CrossRef]
  85. Onaca, A.; Urdea, P.; Ardelean, A.; Serban, R. Assessement of internal structure of periglacial landforms from Southern Carpathians (Romania) using dc resistivity tomography. Carpathian J. Earth Environ. Sci. 2013, 8, 113–122. [Google Scholar]
  86. Matsuoka, N. Periglacial landform formation processes from the perspective of freeze-thaw mechanisms. Geogr. Rev. Jpn. Ser. A 1992, 65, 56–74. (In Japanese) [Google Scholar] [CrossRef]
  87. Pescott, O.L.; Stewart, G.B. Assessing the impact of human trampling on vegetation: A systematic review and meta-analysis of experimental evidence. PeerJ 2014, 2, e360. [Google Scholar] [CrossRef]
  88. Rawat, M.; Jägerbrand, A.K.; Molau, U.; Bai, Y.; Alatalo, J.M. Visitors off the trail: Impacts on the dominant plant, bryophyte, and lichen species in alpine heath vegetation in sub-arctic Sweden. Environ. Chall. 2021, 3, 100050. [Google Scholar] [CrossRef]
  89. Milošević, M.V.; Kovačević-Majkić, J.; Ćalić, J.; Milivojević, M. Sub-alpine periglacial morphology of thufur on the southern rim of Vlasina Lake, Serbia. Erdkunde 2015, 69, 33–47. [Google Scholar] [CrossRef]
  90. Eichel, J.; Draebing, D.; Kattenborn, T.; Senn, J.A.; Klingbeil, L.; Wieland, M.; Heinz, E. Unmanned aerial vehicle-based mapping of turf-banked solifluction lobe movement and its relation to material, geomorphometric, thermal and vegetation properties. Permafr. Periglac. Process. 2020, 31, 97–109. [Google Scholar] [CrossRef]
  91. Hu, Y.; Liu, L.; Wang, X.; Zhao, L.; Wu, T.; Cai, J.; Zhu, X.; Hao, J. Quantification of permafrost creep provides kinematic evidence for classifying a puzzling periglacial landform. Earth Surf. Process. Landf. 2021, 46, 465–477. [Google Scholar] [CrossRef]
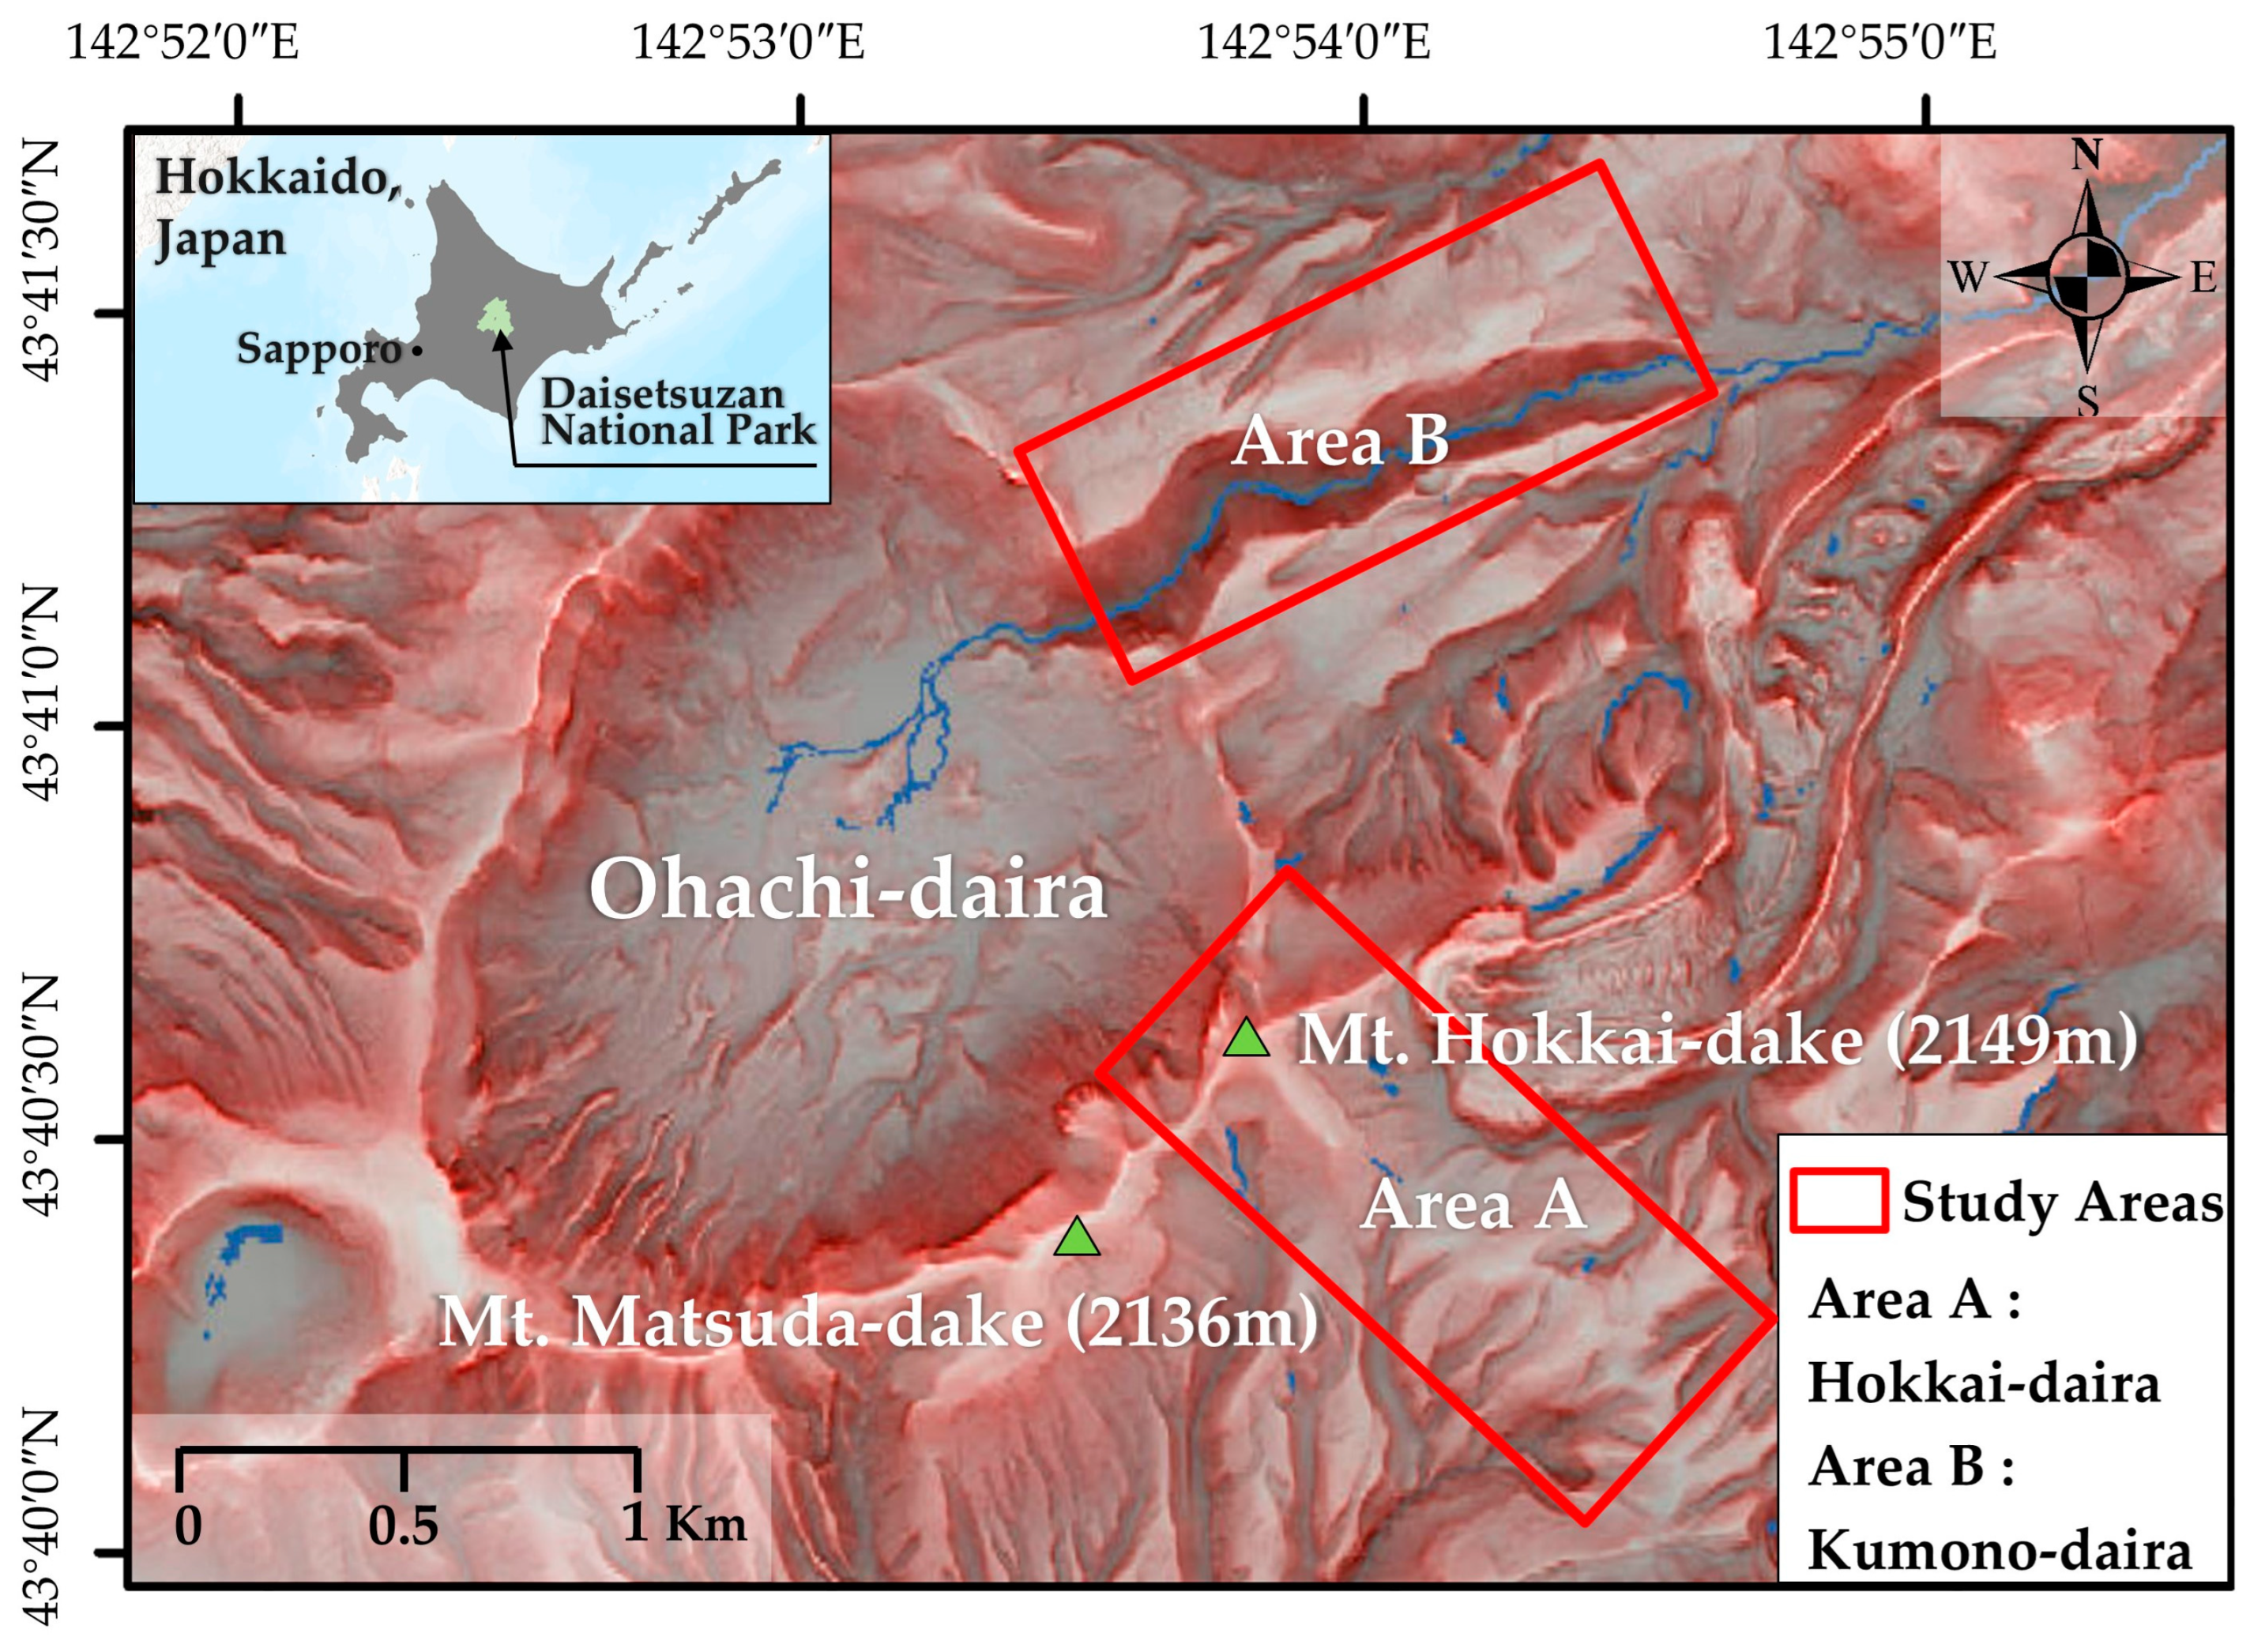
Figure 1. Map of the study areas (created using the Red Relief Image Map (RRIM) technique developed by Asia Air Survey Co., Ltd.; Patent No. 3670274, 4272146). Coordinate System: GCS_WGS_1984.
Remotesensing 16 03610 g001
Figure 2. Earth hummocks in Area B.
Remotesensing 16 03610 g002
Figure 3. Visual representations of an earth hummock: the left figures display the top view and front view of the 3D model of the earth hummock, and the right photographs present the vegetative cover of the earth hummock.
Remotesensing 16 03610 g003
Figure 4. Comparison of the two hillshade maps: (a) traditional hillshade map with an azimuth angle of 315° and an altitude angle of 45° for a single light source; (b) multi-directional hillshade map adjusted to incorporate light from six distinct sources; and (c) orthomosaic image for reference.
Remotesensing 16 03610 g004
Figure 5. The interface of the ArcGIS Pro when vectorizing the range and shape of earth hummocks: (a) multi-directional hillshade map; (b) hillshade map in 3D view; and (c) orthophoto in 2D view.
Remotesensing 16 03610 g005
Figure 6. Schematic diagram of the minimum bounding geometry and points calculating the height.
Remotesensing 16 03610 g006
Figure 7. Vegetation height measurements on earth hummocks using a folding ruler.
Remotesensing 16 03610 g007
Figure 8. Workflow of the study.
Remotesensing 16 03610 g008
Figure 9. Orthomosaic images and DEM maps of the study areas obtained from UAV-SfM: (a) orthomosaic image; (b) DEM map in Area A; (c) orthomosaic image; and (d) DEM map in Area B.
Remotesensing 16 03610 g009
Figure 10. Distribution of topographic parameters and landform classifications in Areas A (left) and B (right): (a) slope; (b) aspect; (c) TWI; and (d) Geomorphon Landforms (created using the 5 m resolution DEM5A provided by the GSI).
Remotesensing 16 03610 g010
Figure 11. Distribution maps of earth hummocks in (a) Area A and (b) Area B. Each site was assigned a number arranged in descending order based on area size.
Remotesensing 16 03610 g011
Figure 12. Distribution patterns of earth hummocks: (a) earth hummocks are widely spaced apart; (b1) earth hummocks are closely connected with minimal spacing; and (b2) earth hummocks overlap.
Remotesensing 16 03610 g012
Figure 13. Differences in the morphological parameters of earth hummocks between Areas A and B.
Remotesensing 16 03610 g013
Figure 14. The relationship between the morphological parameters of earth hummocks, shown with all data (N = 18,838) and separate area data (N = 5843 in Area A and N = 12,995 in Area B): (a) length vs. width; and (b) length vs. height. The unit of ‘pdf’ in the figure refers to the probability density function, with the light blue lines representing the linear regression fits.
Remotesensing 16 03610 g014
Figure 15. Slope (a) and aspect distribution (b) of earth hummocks in the study areas.
Remotesensing 16 03610 g015
Figure 16. Distribution of Geomorphon Landforms in Areas A and B.
Remotesensing 16 03610 g016
Figure 17. Distribution of earth hummocks with drainage patterns: (a) TWI and (b) orthomosaic map (the numbers are the same as in Figure 11).
Remotesensing 16 03610 g017
Figure 18. Turf-banked terraces in Area A widely distributed in flat areas on both sides of the hiking trail.
Remotesensing 16 03610 g018
Figure 19. A map showing inaccessibility to the earth hummock site due to Pinus pumila and distance from the hiking trail in Area B.
Remotesensing 16 03610 g019
Table 1. UAV flight details.
Study AreasSurvey DatesNumbers of FlightsFlight HeightsCoverageCamera AnglesImage NumbersGround Sample Resolution (GSD)
Area ASept. 9680 mca. 1750 m × 750 m70°17032.0 cm/pixel
340 mca. 1400 m × 100 m75°1051
Area BSept. 8280 mca. 1700 m × 500 m70°7471.8 cm/pixel
240 mca. 1200 m × 60 m75°750
Table 2. Geomorphon Landforms in the study areas.
Study AreasFlatPeakRidgeShoulderSpurSlopeHollowValleyFootslopePitTotal
Area A1.02%0.03%4.55%4.70%13.43%58.11%10.36%2.09%5.72%0.01%100.00%
Area B1.91%0.01%2.27%6.95%9.42%64.11%7.05%2.75%5.39%0.15%100.00%
Table 3. Morphological parameters of earth hummocks.
Area A (N = 5843)Area B (N = 12,995)All (N = 18,838)
Length (m)
Mean1.271.201.22
Median1.221.161.18
Range0.96–1.520.94–1.400.95–1.44
SD0.420.370.39
Width (m)
Mean1.081.011.03
Median1.040.991.00
Range0.82–1.300.80–1.190.81–1.22
SD0.340.300.32
Height (m)
Mean0.160.150.15
Median0.140.140.14
Range0.10–0.200.10–0.180.10–0.19
SD0.090.080.08
Length/Width ratio
Mean1.191.191.19
Median1.151.151.15
Range1.07–1.271.07–1.271.07–1.27
SD0.160.170.17
Height/Length ratio
Mean0.130.120.12
Median0.120.120.12
Range0.09–0.150.09–0.140.09–0.14
SD0.050.050.05
Table 4. Overall distribution of earth hummocks by topographical conditions in the study areas.
ItemsCategoriesNPercent (%)Cumulative Percent (%)
Slope (°)0–514477.687.68
10–15395120.9728.65
5–1012,98368.9297.57
>154572.43100.00
Geomorphon LandformsFlat300.160.16
Ridge940.500.66
Shoulder4682.483.14
Spur14097.4810.62
Slope14,03274.4985.11
Hollow229712.1997.30
Footslope3731.9899.28
Valley1350.72100.00
AspectE802342.5942.59
N498026.4469.03
S547429.0698.08
W3611.92100.00
Total18,838100100.00
Note: Peaks and pits are not present.
Table 5. Pearson correlation between slope, width, length, and height.
Slope (°)Width (m)Length (m)Height (m)
Slope (°)Coefficient1
p value-
Width (m)Coefficient0.19 *1
p value0-
Length (m)Coefficient0.20 *0.90 *1
p value00-
Height (m)Coefficient0.17 *0.63 *0.63 *1
p value000-
* p < 0.001.
Table 6. ANOVA results for earth hummock dimensions across different slopes, aspects, and landforms.
Slope AspectGeomorphon Landforms
FpFpFp
Width 206.9850.000 *174.5130.000 *32.4130.000 *
Length 244.4690.000 *146.6400.000 *26.0050.000 *
Height 180.0400.000 *19.7450.000 *9.5530.000 *
* p < 0.001.
Disclaimer/Publisher’s Note: The statements, opinions and data contained in all publications are solely those of the individual author(s) and contributor(s) and not of MDPI and/or the editor(s). MDPI and/or the editor(s) disclaim responsibility for any injury to people or property resulting from any ideas, methods, instructions or products referred to in the content.