Abstract
In 2023, the Chinese company PIESAT launched the multi-static X-band SAR constellation Hongtu-1 (HT1). HT1 consists of the active monostatic SAR sensor HT1-A and the three additional passive SAR receivers HT1-B, HT1-C and HT1-D. The passive sensors are arranged as a cartwheel in a circle around the active sensor. For our SAR interferometric investigation, we were able to use a multi-static HT1 recording. After a brief introduction of HT1, we describe the processing performed. Based on the phases of the six single-pass interferometric pairs, we calculated height differences relative to the Copernicus DEM. Larger deviations were observed mainly for mining areas and for forest areas. Thanks to the simultaneous acquisition of the interferometric pairs, the high spatial resolution and the good signal quality, the necessary processing was relatively easy to perform. Besides the interferometric phase, we also investigated possible applications of multi-static coherence. Forest can be recognized by its reduced single-pass coherence values. Based on our results, we expect that the multi-static HT1 coherence and its dependence on the interferometric baseline can be used to estimate parameters such as forest biomass.
1. Introduction
Satellite SAR interferometry [1,2,3] is used for a variety of applications, in particular for the creation of digital elevation models (DEM) [4,5,6,7,8] and for mapping terrain displacements [9,10,11,12,13,14,15,16,17]. While the temporal component is essential for terrain displacements, it has been shown that DEMs can be better derived from interferometric data recorded simultaneously. SAR systems that simultaneously record interferometric data with a spatial baseline use either two monostatic acquisitions or a system with one active monostatic sensor and at least one additional passive bistatic receiver. Single-pass interferometric systems are commonly used on airborne platforms. On spaceborne platforms, this technique was used in the Shuttle Radar Topographic Mission (SRTM) [18,19] and in the Tandem-X mission [20,21] to create global digital terrain models. Also indicated in the reference list are the internet addresses of the related mission home pages [22,23] and the site where the final DEM product can be downloaded [24,25].
A central problem that had to be solved in the derivation of terrain models was the unwrapping of the interferometric phase. Interferometric pairs with a long spatial baseline have a high phase to terrain height sensitivity and are therefore essential for the accuracy achieved. On the other hand, phase unwrapping is prone to errors for these pairs with denser fringes. As a central element of the solution strategy, several interferometric pairs with different spatial baselines were used to overcome the unwrapping problem while achieving high precision. In addition, ascending and descending orbit data were combined to reduce shadowing and layover effects. A major disadvantage of using multiple interferometric pairs recorded at different times is that the surface may change over time. On the one hand, the terrain surface changes, for example, due to mining and construction activities, deforestation and forest growth, volcanic activity or the melting of glaciers and ice shelves; on the other hand, seasonal changes in vegetation and snow cover lead to temporary changes in the observed terrain heights.
An attractive way to avoid these problems is to use a constellation of satellites that allows the simultaneous acquisition of several interferometric pairs with different spatial baselines. This idea, proposed around the year 2000 as the “cartwheel” mission, was described in [26] and was subsequently evaluated by the European Space Agency (ESA) as a possible mission concept. However, the idea was not realized. Operating one or several passive companion satellites was also proposed in [27,28,29], and more recently, the ESA decided to move forward its tenth Earth Explorer mission HARMONY [30]. Nevertheless, the main application addressed with these bi- and multi-static mission proposals is not DEM generation, but developing applications for bistatic data acquired with significantly larger spatial baselines, e.g., of interest to obtain different displacement components using repeat-pass interferometry.
In the meantime, however, the cartwheel idea was taken up by the Chinese company PIESAT, developed further and put into practice with the launch of the Hongtu-1 constellation in 2023. The actively transmitting satellite is also part of the constellation and not a pre-existing satellite that has already been planned or realized, as in most of the other systems proposed. In addition, the navigation data measurements have improved and there is more experience with the precise control and correction of the satellite orbits, as several satellites are successfully operated in very narrow orbital tubes.
With its commercially available SAR/InSAR software, version mid-2024, Gamma Remote Sensing AG, Gümligen, Switzerland [31] supports the processing of SAR data acquired by various SAR satellites. In order to adapt the software to Hongtu-1 and evaluate its potential, we received from PIESAT the multi-static Hongtu-1 data on which this work is based.
After a brief description of the Hongtu-1 constellation and the data used, in Section 2, we describe the processing performed. The results are then presented in Section 3. We do not concentrate on the DEM creation, as this is the topic of [32], but focus on the updating of an existing DEM, the Copernicus 1” DEM, and discuss the observed height differences. In addition, we present possible applications of multi-static interferometric coherence. Section 4 discusses our results and findings, followed by our conclusions in Section 5.
2. Materials and Methods
2.1. Hongtu-1 (HT1, Also Known as PIESAT-01)
HT1 is the world’s first multi-static SAR satellite system operating in a cartwheel formation [32]. The cartwheel formation is a unique satellite constellation in which slight differences in the eccentricity of each satellite’s orbit ensure that the main satellite remains in the center of the formation at all times and three auxiliary satellites are evenly spaced around it at 120-degree intervals [32]. Precise orbit control maintains a planar configuration of the four HT1 satellites at all times. The main satellite, HT1-A, is located in the center of the formation, and the three auxiliary satellites, HT1-B, HT1-C and HT1-D, orbit the main satellite on the same elliptical path [32]. The active main satellite, HT1-A, transmits and receives radar signals, i.e., it corresponds to a normal monostatic radar. The three additional satellites, HT1-B, HT1-C and HT1-D, each contain a passive radar receiver which receives the radar signals transmitted by HT1-A and reflected on the Earth’s surface. An HT1 acquisition therefore comprises one monostatic SAR image and three bistatic SAR images. The distance between the passive receivers and HT1-A is small (<1 km) compared to the distance of the satellites to the imaged ground (~700 km), so the bistatic angles are very small. The sun-synchronous orbit of HT1 has a repeat cycle of 15 days [32].
2.2. Hongtu-1 Multi-Static SLC Data
Some characteristics of the SLC data that were used are listed in Table 1. The monostatic backscatter image in slant-range geometry over Yongfeng Town (45.7°N, 128.6°E), China, is shown in Figure 1. The area is relatively flat, with elevations between about 120 m.a.s.l and 450 m.a.s.l. The land cover includes agriculture, forest, rivers and small lakes, and some smaller built-up areas and other infrastructure such as roads, powerlines and dams.

Table 1.
HT1 (Hongtu-1, also called PIESAT-01) stripmap mode SLC characteristics.
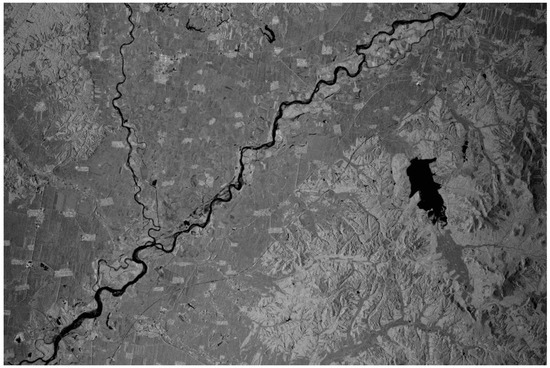
Figure 1.
Monostatic HT1-A backscatter image in slant-range geometry.
Orbit data are provided separately for each satellite (HT1-A, HT1-B, HT1-C, HT1-D). Geocoding was performed for the monostatic HT1-A image. In the geocoding process, we conducted refinement using matching between a simulated image calculated based on the Copernicus 1” DEM [25] and the multi-looked and detected SLC. The small refinement offsets of <10 m obtained confirm the high quality of the orbit data. A more comprehensive investigation of the geometric accuracy of HT1 is carried out in [33]. The bistatic images were not directly geocoded, but co-registered to the slant-range geometry of the monostatic image. The interferometric analysis was performed in the slant-range geometry of the monostatic reference. Results such as height corrections, updated heights, coherence and backscatter were then geocoded.
For each of the four SLCs, we considered the image spectrum and determined the Doppler centroid. The spectrum was determined from the SLC using 2D FFTs over small image sections. The center of the spectrum in the azimuth direction could then be used to calculate the Doppler centroid. This process was repeated over the entire image to obtain the range and azimuth-dependent Doppler centroid. Using an accurate Doppler centroid value is important to achieve good interpolation quality in the co-registration resampling step.
Considering some identified strong point-like scatterers, we investigated the point target response and estimated the range and azimuth resolution. The 3 dB range width determined was 1.6 m, and the 3 dB azimuth width was 2.3 m. The peak-to-side lobe ratios estimated were around −20 dB. Using data over a site with known, ideal point targets, such as corner reflectors or transponders, as available in [33], the characterization of the point target response could be further improved.
The HT1 data used were acquired with an incidence angle of about 42.5 degrees (relative to nadir). As a result of this relatively large incidence angle, the backscattering over smooth water surfaces was very low, lower than the system noise, so the backscatter over water surfaces could be used to determine the noise-equivalent sigma zero (NESZ). Considering several water surfaces, we determined that NESZ = −22.3 dB.
2.3. Co-Registration of Multi-Static SLCs to Monostatic Reference
The three multi-static SLCs were co-registered to the monostatic reference SLC. In the first step, a lookup table between the bistatic image and the monostatic reference was calculated, considering the individual orbit data and the terrain height, as available from the 1” Copernicus DEM [25]. This lookup table was then used to resample the reference image to the bistatic image. Then, the offsets between the resampled reference and the bistatic image were estimated and used to determine a polynomial offset refinement. The refinement polynomial was used to update the co-registration lookup table. For the co-registered SLCs, we again estimated the offsets using matching techniques to check the co-registration quality. The standard deviation of these offsets was below 0.01 SLC pixels, confirming very high co-registration quality.
2.4. Differential Interferometry
The four co-registered SLCs, one monostatic and three bistatic ones, form six interferometric pairs with different spatial baselines with perpendicular baseline components between about 60 m and 500 m (see Table 2). All four acquisitions are quasi-simultaneous, so the interferometric time difference is 0 for all six pairs.

Table 2.
Perpendicular component of interferometric baseline of investigated HT1 multi-static acquisition.
In the calculation of the orbital and topographic phases, and also later on in the interpretation of the differential interferometric phases, the bistatic nature of the pairs is considered. The two-way slant range of the pair HT1-A–HT1-B, for example, corresponds to the sum of the one-way slant range of HT1-A plus the one-way slant range of HT1-B. The resulting differential interferograms have high coherence. They all show small overall phase trends that may be related to the exact geometry of the constellation, orbit movements, the geometric and phase models used in the bistatic SAR data focusing and the geometric model used in the simulation of the topographic and orbital phases. Forests and water areas were masked in the estimation of this overall low-frequency phase term. The forest areas were not considered, as the phase clearly deviates from the low-frequency residual orbital phase. Over the water, the phase is noisy and therefore not reliable. The remaining phase was filtered, unwrapped and spatially interpolated. This low-frequency residual orbital phase was then subtracted from the differential interferogram to obtain the “detrended” differential interferogram. For clarity, the intermediate results of this detrending process are shown for one of the pairs in Figure 2. The six detrended differential interferograms are shown in Figure 3.

Figure 2.
Differential interferogram detrending steps. From left to right the images show the initial bistatic differential interferogram (including a substantial low-frequency residual orbital phase); the masked differential interferogram; the filtered, unwrapped and interpolated masked interferogram (corresponding to our estimate of the low-frequency residual orbital phase); and the detrended differential interferogram.
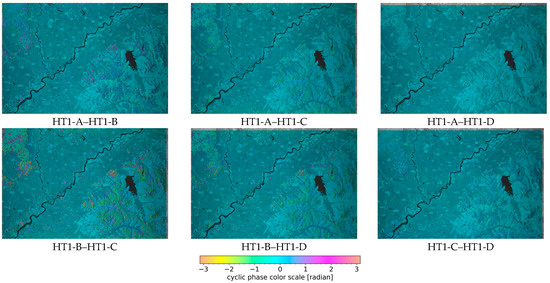
Figure 3.
Detrended differential interferograms after subtracting the overall low-frequency phase. One color cycle corresponds to one phase cycle.
2.5. Phase Unwrapping and Phase-to-Height Convertion
Phase unwrapping is a critical step in the processing of interferometric data and a well-established area of research [34,35,36,37]. Unwrapping the differential interferogram becomes simpler after subtracting the topographic phase, simulated using the Copernicus 1” DEM, and applying the detrending step described above. Having multiple interferometric pairs available over the same area offers additional possibilities. For the unwrapping we used a minimum cost flow algorithm [35], as available in the Gamma Software [31]. For the investigated dataset, the unwrapping was not critical for pairs with shorter baselines. For the longer baselines (>300 m) the solutions obtained for the shorter baselines were used to check the unwrapped phase for ambiguity errors. Before performing the unwrapping, we masked areas with very low coherence (<0.2), i.e., water surfaces and radar shadow areas, which are incoherent because of backscatter levels below the NESZ. Overall, the unwrapping was not problematic in the multi-static HT1 dataset analyzed.
For each pair, the unwrapped differential interferometric phases were converted into height corrections, , using the height-to-phase sensitivity
with representing the unwrapped interferometric phase, c the speed of light, R the slant range, the incidence angle and the baseline component perpendicular to the line of sight. In the conversion of the phase-to-height corrections, is recalculated for each pixel considering the geometry with the pre-existing terrain height from the Copernicus DEM. The ambiguity height, , corresponds to a height difference that corresponds to a 2π interferometric phase
In the investigated HT1 dataset, the ambiguity height varies from about 245 m to 29 m between the shortest and longest baselines of the multi-static pairs. For each of the six pairs listed in Table 1 a height correction is thus determined; a combined height correction is then calculated based on the six height correction results. How to best combine the six height correction results into one combined height correction is not entirely clear. Using a coherence estimate or a direct estimate of the phase noise from the data together with the phase-to-height sensitivity, reasonable weights can be determined for the different corrections. But this approach does not consider the possibility of remaining unwrapping errors and effects related to spatial filtering in a fully appropriate manner. The weights for the pairs with the longest baselines are the highest—but small areas or individual pixels may be affected by phase unwrapping errors. Zhang et al. [32] successfully used an advanced Two-Stage Programming Approach in the unwrapping and then weighted averaging and obtained good results for several HT1 acquisitions. Another approach, using a maximum likelihood algorithm for multi-baseline phase estimation, has been proposed in [38]. In our work the main objective was not really to independently determine a DEM, but to investigate the usefulness of multi-static acquisition for the estimation of DEM changes. We did not have high-quality ground-truth available to validate the result. As a compromise between avoiding outliers caused by ambiguity errors and achieving good quality in areas without ambiguity problems, we used the median over the six height correction estimates as our combined result. This method is simple, but tends to avoid outliers, e.g., by unwrapping errors, and reduces the noise in the result.
2.6. Geocoding Considering Height Correction
The terrain height was used as one of the inputs of the geocoding process. Using a terrain height with an error herr resulted in a positional error in the ground-range direction of herr/sin. For the 42.5 deg. Incidence angle of the scene considered, this means that the positional error was about 1.5 times the height error. Consequently, it is very relevant that the corrected heights were used for geocoding, as height corrections > 10 m were observed for some forests and in mining and landfill areas.
2.7. Multi-Static Coherence
For each multi-static interferometric pair, we also estimated the coherence using an estimator with a spatially adaptive window size [31], with estimator window sizes between 6 range looks × 4 azimuth looks (corresponding to an area on the ground with a diameter of about 7 m) at high coherence and 21 range looks × 14 azimuth looks (about 25 m on the ground) at very low coherence. Using a larger estimator window at low coherence levels reduces the estimation bias [39,40].
3. Results
3.1. Height Update
The phase of the detrended differential interferograms corresponds primarily to residual topographic phase and phase noise. There is no deformation phase due to the simultaneous acquisition of both images in the interferometric pair. The atmospheric path delay phase [41,42,43,44] is also negligible and only non-zero because of the slight spatial separation of the observation paths (by up to a few hundred meters). The residual topographic phase depends linearly on the difference between the true effective height of the scatterer and the assumed height based on the used DEM and linearly on the baseline component that is perpendicular to the line of sight. For a longer perpendicular baseline, the same height difference results in a larger differential interferometric phase—accordingly, pairs with longer baselines have higher phase-to-height sensitivity. While this has the positive effect of more precise height estimation, it also means that the higher phase gradients make phase unwrapping more challenging. Figure 4 shows the geocoded differential interferogram phase of a smaller section of the scene for three pairs with different baseline lengths. A significant non-zero phase is observed for forest areas and for areas where the topography has changed, e.g., due to mining or landfill. While the deviations from the zero phase are smaller than half a phase cycle for the shortest baseline—which makes phase unwrapping trivial—more significant phases are present in the pairs with longer baselines.

Figure 4.
Images showing 9 km × 9 km sections of geocoded, detrended, multi-static HT1 differential interferograms. The sensor combination and the estimated perpendicular baseline are indicated below the images. One color cycle corresponds to one phase cycle.
The determined height corrections are shown in Figure 5. Positive values indicate that the height estimated with the HT1 data of 5 September 2023 is higher than the 1” Copernicus DEM height. Both positive and negative height corrections are observed. No height correction was estimated for water areas and radar shadow, where the signal noise dominates. In the updating of the DEM, the height of the pre-existing DEM was used for these areas.
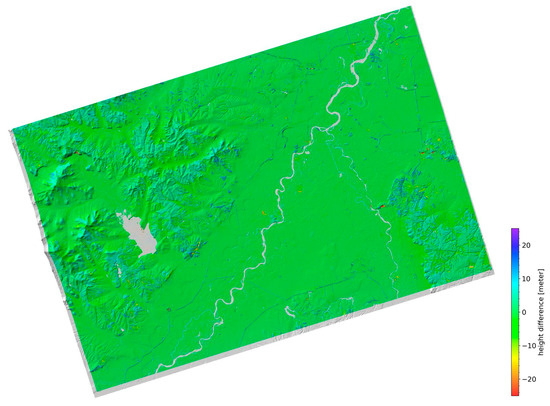
Figure 5.
Height corrections relative to 1” Copernicus DEM heights. The image brightness corresponds to the shaded relief calculated from the corrected terrain heights. In areas without color, no height correction was determined. In the updating of the DEM, the height of the pre-existing DEM was used for these areas.
For a more detailed illustration of the different reasons for height changes, Figure 6 shows a smaller area of about 4.2 km × 3.3 km that includes Zuomu Village and a section of the Liangzhu River.
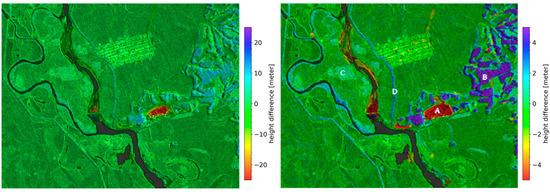
Figure 6.
A 4.2 km × 3.3 km section of height corrections relative to 1” Copernicus DEM heights, derived from multi-static HT1 acquisition. The image brightness corresponds to the radar backscatter. Different color scales are used in the two visualizations. With the finer color scale used in the image to the right, small, meter-scale corrections become visible. The letters A to D indicate areas with different types of height changes (A: mining area; B: forest area; C: agricultural field; D: trees/hedges along a road) further discussed in the text.
The 1” Copernicus DEM used as topographic reference and the HT1 multi-static acquisition used to calculate height differences correspond to different dates. The Copernicus DEM is generated based on TanDEM-X/WorldDEM data acquired between December 2010 and January 2015 and ICESat GLAS reference point data acquired between 2003 and 2009. A more detailed description of the Copernicus DEM is provided in the Copernicus DEM Product Handbook [45]. The HT1 multi-static dataset used in this work was acquired on 5 September 2023. During the more than eight years between the acquisition of the two datasets, the terrain height changed in some areas. Location A in Figure 6 indicates a mining area—as confirmed with optical imagery found in Google Earth. The observed height difference of more than −20 m relates to lowering of the surface height by the mining activity during the period between the dates of the two datasets. Other examples of such temporal height changes include landfill sites, rock falls and landslides, glacier ice melt, and volcanic and seismic activity. Identifying such changes is well supported by a multi-static SAR constellation such as HT1. Having a well-defined date for the information is a clear advantage over using data acquired over a longer time period. The next HT1 acquisition could be used to map the height change occurring in this well-defined period between the two acquisitions.
Positive height differences, mostly in the range of 5 m to 10 m, are observed over forests. This means that the HT1-based height is higher than the 1” Copernicus DEM height. An example of this is location B in Figure 6. The single-pass interferometric height of a forest is expected to lie somewhere between the ground and the top of the canopy, depending on various factors, including the used radar frequency and the incidence angle, and possibly also the baseline length. The interferometric Tandem-X data used for Copernicus DEM generation and HT1 are both operated in the X-band—so the frequency is the same. Using different incidence angles may be an explanation for the different heights observed over forest. The incidence angle of the HT1 acquisition is 42.5 deg. The Tandem-X data used for DEM generation is also acquired at lower incidence angles, but still above 30 deg. Based on the available information, it is difficult to provide a definitive explanation for the significant positive height difference observed over the forest. Seasonal effects, along with the used baselines and the estimation process, may also be relevant factors. We also observe examples of forest areas with negative height differences in the range of −5 m to −10 m which correspond to forests present in 2019 and then cut before the HT1 acquisition. This clearly shows that the Copernicus DEM height of a forest is not the ground elevation. Consequently, the height differences in forest areas have to be interpreted with caution, as both values lie somewhere within the canopy and do not perfectly represent neither the ground elevation nor the canopy top. The calculated height difference is clearly not a direct measurement of the canopy height. For the forest stand at location B in Figure 6, the average height difference calculated was 7.4 m with a standard deviation of 3.3 m. Applying spatial filtering reduces the standard deviation—median filtering with 7 × 7 pixels reduces the standard deviation to 1.5 m. The standard deviation value is partly related to phase noise and partly to the forest structure.
There are also small relative height differences around one meter observed for some agricultural fields (e.g., at location C in Figure 6). The plausible explanation is that these are fields with crops such as maize or rice which may still not have been harvested in early September. Being able to discriminate a 1 m height difference between such a field and neighboring fields may also be used to characterize the precision of the method. It indicates that meter-scale height changes can be identified for homogeneous areas with a size in the order of 100 m.
Interesting features in the resulting height difference include the relatively long and narrow linear structures with height corrections of several meters (see D in Figure 6). These features correspond to hedges and trees located along roads and water canals. In the 1” Copernicus DEM with a spatial sampling of about 30 m, we do not see these features. This clearly demonstrates the finer spatial details obtained using the HT1 dataset. This is also confirmed by the shaded reliefs of the 1” Copernicus DEM and the height updated with the HT1 data shown in Figure 7. Consequently, in addition to updating a DEM temporally, improving the spatial resolution of a DEM with a spatial resolution larger than 10 m may be an attractive application for HT1 data.
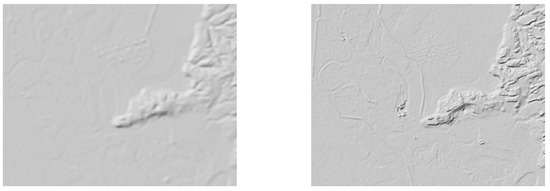
Figure 7.
A 4.2 km × 3.3 km section of the 1” Copernicus DEM (oversampled to the sampling of the updated DEM, which is about 3.3 m, (left)), and the DEM updated with the multi-static HT1 data (right) is shown with shaded reliefs.
3.2. Coherence
In addition to the interferometric phase, the coherence is also of interest. It characterizes the phase noise and is therefore useful, e.g., in phase unwrapping. But beyond this, the coherence relates to the characteristics of the target. Figure 8 shows the multi-static coherence for three pairs with short to long baselines. For much of the area, the coherence is high as there is no temporal decorrelation. However, we clearly observe reduced coherence levels over forests—this in spite of the simultaneous acquisition of the set of multi-static SLCs. The reason for the reduced coherence is volume decorrelation [46]. With an increasing baseline, the average coherence level over a given forest stand decreases (Figure 9). This behavior is well known and can be used to estimate forest parameters such as the forest stand height or biomass. Simultaneously obtaining multiple single-pass coherence images with different spatial baselines is very attractive for these applications as it permits us to prevent confusing baseline-related effects with effects caused by temporal changes in the targets, such as seasonal changes, leaf-on leaf-off effects and vegetation growth.

Figure 8.
Images of 9 km × 9 km sections of geocoded, detrended, multi-static HT1 X-band coherence. The sensor combination and the estimated perpendicular baseline are indicated below the image. The SAR backscatter is used as image brightness.
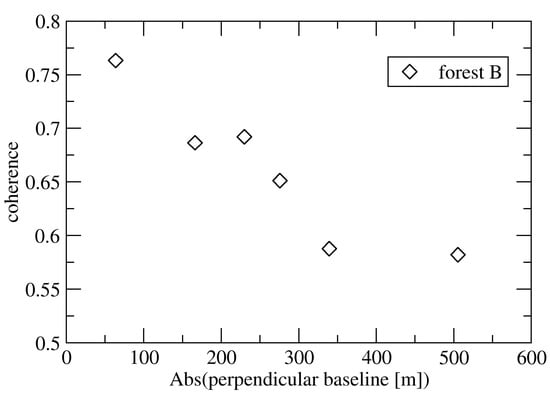
Figure 9.
Baseline dependence of average multi-static single-pass coherence over forest stand B (see Figure 6).
The backscatter is very low over water surfaces and in radar shadow areas; in fact, it is below the NESZ. Here, the radar signal is dominated by noise, and therefore, the coherence level is very low.
The coherence of repeat-pass SAR interferometric pairs with relatively short temporal separation provides useful landcover information, as demonstrated using ERS-1/2 Tandem acquisitions at the C-band with one-day time intervals [40]. Combining the coherence, the average backscatter and the backscatter change between the two acquisitions into an RGB color composite provides a color image that permits visually recognizing the main landcover classes [40]. This RGB composite is often called a “coherence product”. As for the C-band repeat-pass case, the multi-static X-band coherence is lower over forest than over open unvegetated or sparsely vegetated areas—which permits defining a “multi-static coherence product” with characteristics similar to the repeat-pass coherence product. Figure 10 shows a section of the multi-static coherence product generated with the HT1 data. For the red channel, the average of the six estimated coherence values was used, with linear scaling. For the green channel, the average backscatter over the four mono- and bistatic acquisitions was used with logarithmic scaling for visualization. For the blue channel, the standard deviation of the four backscatter values was used with logarithmic scaling for visualization. Forests appear in a green color thanks to the reduced red and blue values. Water surfaces appear blue thanks to the low red and green values. The blue value (backscatter standard deviation) is relatively high as noise dominates the HT1 backscattering over water. The same characteristics are also observed for radar shadow, e.g., visible in Figure 10 behind forests. Orange colors are observed over agricultural fields, relating to high coherence (red), intermediate backscatter (green) and low backscatter standard deviation (blue). Similar characteristics are observed for other open surfaces such as river banks. Built up areas with high coherence (red), high backscatter (green) and low backscatter standard deviation (blue) appear in yellow, with high spatial variability of the backscatter.
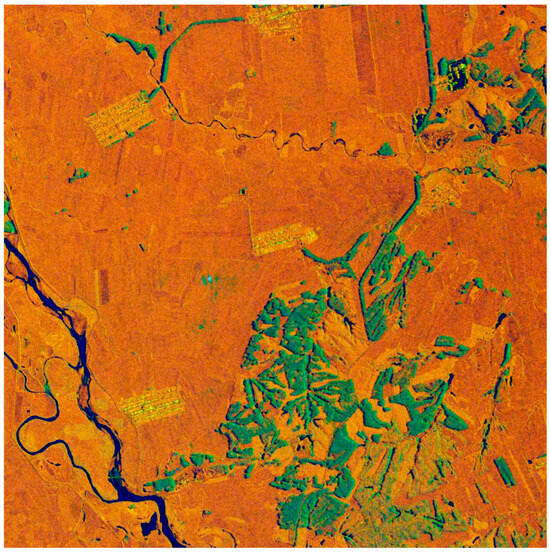
Figure 10.
Image of 9 km × 9 km section of geocoded, HT1 multi-static coherence product. RGB composite of average coherence (red), average backscatter (green) and the backscatter variability between multi-static scenes (blue).
4. Discussion
The Hongtu-1 Multi-Static X-band SAR Constellation permits simultaneously acquiring one monostatic and three bistatic SAR scenes. With processing bandwidths of 100 MHz in the range direction and 3775 Hz in the azimuth direction, it provides high-resolution SAR imagery. Thanks to the simultaneous acquisition of the scenes and interferometric baselines much smaller than the critical baseline, the coherence level is generally very high, with reduced coherence levels for volume scatterers (e.g., forest areas) and very low coherence levels for areas with very low backscattering, below the NESZ, where noise dominates (e.g., smooth water surfaces and radar shadow).
Having six simultaneously acquired single-pass interferometric pairs available has significant advantages for the interferometric processing performed to retrieve height differences relative to a pre-existing DEM. Thanks to the single-pass nature of the pairs, there is no temporal decorrelation, no deformation phase and almost no atmospheric path delay phase. Having multiple pairs available facilitates phase unwrapping and permits optimizing the results (reducing noise, reducing the presence of ambiguity errors). Deriving the height difference relative to an existing DEM, here shown relative to the 1” Copernicus DEM, is relatively straightforward. Using only data acquired in a single acquisition means that the results refer to a single date. This is of high interest to study multi-temporal developments in terrain height changes (e.g., for volcanoes, mines and land-fill areas) or surface cover such as forest, other types of vegetation, ice and snow.
The HT1 data investigated demonstrated promising potential for mapping height changes at high spatial resolution (e.g., 5 m) or for updating DEMs at such spatial resolution. And it would be possible to do this at short temporal intervals, e.g., every 15 days.
Determining the height difference compared to the 1” Copernicus DEM heights, derived from Tandem-X data acquired between December 2010 and January 2015, permitted identifying height changes related to mining and landfill that look very plausible. Furthermore, positive height differences up to 10 m were observed for forest stands. Here, we think the change does not so much relate to a significantly changing forest height, but rather, to different characteristics between Tandem-X and HT1, such as the flatter incidence angle of HT1. There are also a few forest areas with negative height differences, relating to forests which were cut between the Tandem-X and HT1 acquisitions. For more open areas (e.g., agricultural fields, grassland) the height corrections determined are very small (<1 m). This good correspondence is understood as an indication that both the Copernicus DEM and the determined updated height are of good quality. But it cannot be interpreted as a validation of the results. Besides updating the existing DEM to a newer date, an important aspect is that the updated DEM was generated with a higher spatial resolution.
In addition to the interferometric phase, the coherence is also of interest. On one hand, the coherence serves as a quality parameter for the interferometric phase and is used to calculate weights in phase unwrapping. On the other hand, it relates to the characteristics of the target. For forests, the single-pass coherence becomes lower with increasing forest height as well as with increasing baseline length. Consequently, the coherence can be used to retrieve forest parameters, particularly if it is available over the same forest at the same time with different baselines. We expect similar behavior for other volume scatterers such as ice, snow and dry sand, and recommend investigating the related potential of X-band multi-static phase and coherence data.
The HT1 X-band multi-static coherence product showed good potential to visually discriminate important landcover classes such as forest, open areas, urban areas and water. It differs from previously used coherence products in that it uses data acquired on a single date.
5. Conclusions
Investigating multi-static single-pass interferometric data acquired by HT1 confirmed the high potential of such an X-band constellation, above all to map height changes and update DEMs, but not only for these purposes. Thanks to the simultaneous acquisition of the data, there is no temporal decorrelation, no deformation phase and almost no atmospheric path delay phase—which facilitates processing and makes the results more accurate. Furthermore, retrieving landcover information and forest information such as biomass or forest heights based on the multi-static coherence is an additional promising use of the data.
Author Contributions
Conceptualization, all authors; methodology, all authors; software, C.M. and U.W.; validation, U.W. and C.M.; formal analysis, U.W. and O.F.; investigation, all authors; writing—original draft preparation, U.W.; writing—review and editing, O.F. and C.M.; visualization, U.W. and C.M.; supervision, U.W.; project administration, U.W.; funding acquisition, all authors. All authors have read and agreed to the published version of the manuscript.
Funding
This research received no external funding.
Data Availability Statement
Restrictions apply to the availability of these data. The HT1 SLC data were obtained from PlESAT Information Technology Co., Ltd., YiYuan A-1-5, Xingshikou Road, Haidian District, Beijing, China, 100195.
Acknowledgments
HT1 original data copyright PlESAT Information Technology Co., Ltd., YiYuan A-1-5, Xingshikou Road, Haidian District, Beijing, China, 100195. We thank the PlESAT team for making the data available for our analysis.
Conflicts of Interest
Author Urs Wegmüller, Christophe Magnard and Othmar Frey were employed by the company Gamma Remote Sensing AG. The authors declare that the research was conducted in the absence of any commercial or financial relationships that could be construed as a potential conflict of interest.
References
- Gens, R.; van Genderen, J.L. SAR Interferometry—Issues, Techniques, Applications. Int. J. Remote Sens. 1996, 17, 1803–1835. [Google Scholar] [CrossRef]
- Bamler, R.; Hartl, P. Synthetic Aperture Radar Interferometry. Inverse Probl. 1998, 14, R1–R54. [Google Scholar] [CrossRef]
- Rosen, P.; Hensley, S.; Joughin, I.; Li, F.; Madsen, S.; Rodriguez, E.; Goldstein, R.M. Synthetic aperture radar interferometry. Proc. IEEE 2000, 88, 333–382. [Google Scholar] [CrossRef]
- Graham, L.C. Synthetic interferometer radar for topographic mapping. Proc. IEEE 1974, 62, 763–768. [Google Scholar] [CrossRef]
- Zebker, H.A.; Goldstein, R.M. Topographic mapping from interferometric synthetic aperture radar observations. J. Geophys. Res. 1986, 91, 4993–4999. [Google Scholar] [CrossRef]
- Li, F.K.; Goldstein, R.M. Studies of multibaseline spaceborne interferometric synthetic aperture radars. IEEE Trans. Geosci. Remote Sens. 1990, 28, 88–97. [Google Scholar] [CrossRef]
- Rodriguez, E.; Martin, J.M. Theory and design of interferometric synthetic aperture radars. IEE Proc.-F 1992, 139, 147–159. [Google Scholar] [CrossRef]
- Madsen, S.N.; Zebker, H.A.; Martin, J. Topographic mapping using radar interferometry: Processing techniques. IEEE Trans. Geosci. Remote Sens. 1993, 31, 246–255. [Google Scholar] [CrossRef]
- Gabriel, A.K.; Goldstein, R.M.; Zebker, H.A. Mapping small elevation changes over large areas: Differential radar interferometry. J. Geophy. Res. 1989, 94, 9183–9191. [Google Scholar] [CrossRef]
- Villasenor, J.; Zebker, H.A. Studies of temporal change using radar interferometry. Proc. SPIE 1992, 1630, 187–198. [Google Scholar]
- Massonnet, D.; Rossi, M.; Carmona, C.; Adragna, F.; Peltzer, G.; Feigl, K.; Rabaute, T. The displacement field of the Landers earthquake mapped by SAR interferometry. Nature 1993, 364, 138–142. [Google Scholar] [CrossRef]
- Goldstein, R.M.; Engelhardt, R.; Kamb, B.; Frolich, R. Satellite Radar Interferometry for Monitoring Ice Sheet Motion: Application to an Antarctic Ice Stream. Science 1993, 262, 1525–1530. [Google Scholar] [CrossRef] [PubMed]
- Joughin, I.; Kwok, R.; Fahnestock, M. Estimation of ice-sheet motion using satellite radar interferometry: Method and error analysis with application to Humboldt Glacier, Greenland. J. Glaciol. 1996, 42, 564–575. [Google Scholar] [CrossRef]
- Massonnet, D.; Feigl, K.L. Radar interferometry and its application to changes in the earth’s surface. Rev. Geophys. 1998, 36, 441–500. [Google Scholar] [CrossRef]
- Lu, Z.; Mann, D.; Freymueller, J.T.; Meyer, D.J. Synthetic aperture radar interferometry of Okmok volcano, Alaska: Radar observations. J. Geophys. Res. 2000, 105, 10791–10806. [Google Scholar] [CrossRef]
- Colesanti, C.; Wasowski, J. Investigating landslides with space-borne Synthetic Aperture Radar (SAR) interferometry. Eng. Geol. 2006, 88, 173–199. [Google Scholar] [CrossRef]
- Strozzi, T.; Ambrosi, C.; Raetzo, H. Interpretation of Aerial Photographs and Satellite SAR Interferometry for the Inventory of Landslides. Remote Sens. 2013, 5, 2554–2570. [Google Scholar] [CrossRef]
- Van Zyl, J.J. The Shuttle Radar Topography Mission (SRTM): A breakthrough in remote sensing of topography. Acta Astronaut. 2001, 48, 559–565. [Google Scholar] [CrossRef]
- Farr, T.G.; Rosen, P.A.; Caro, E.; Crippen, R.; Duren, R.; Hensley, S.; Kobrick, M.; Paller, M.; Rodriguez, E.; Roth, L.; et al. The shuttle radar topography mission. Rev. Geophys. 2007, 45, RG2004. [Google Scholar] [CrossRef]
- Krieger, G.; Moreira, A.; Fiedler, H.; Hajnsek, I.; Werner, M.; Younis, M.; Zink, M. TanDEM-X: A satellite formation for high-resolution SAR interferometry. IEEE Trans. Geosci. Remote Sens. 2007, 45, 3317–3341. [Google Scholar] [CrossRef]
- Zink, M.; Moreira, A. TanDEM-X mission status: The new topography of the earth takes shape. In Proceedings of the 2014 IEEE Geoscience and Remote Sensing Symposium, Quebec City, QC, Canada, 13–18 July 2014; pp. 3386–3389. [Google Scholar]
- Shuttle Radar Topography Mission (SRTM). 2024. Available online: https://eospso.nasa.gov/missions/shuttle-radar-topography-mission (accessed on 21 August 2024).
- TanDEM-X—A New High Resolution Interferometric SAR Mission. 2024. Available online: https://tandemx-science.dlr.de (accessed on 21 August 2024).
- NASA Earthdata, Open Access for Open Science. 2024. Available online: https://www.earthdata.nasa.gov/sensors/srtm (accessed on 21 August 2024).
- Copernicus DEM—Global and European Digital Elevation Model (COP-DEM). 2024. Available online: https://spacedata.copernicus.eu/collections/copernicus-digital-elevation-model (accessed on 21 August 2024).
- Massonnet, D. The interferometric cartwheel, a constellation of low cost receiving satellites to produce radar images that can be coherently combined. Int. J. Remote Sens. 2001, 22, 2413–2430. [Google Scholar] [CrossRef]
- D’Errico, M.; Grassi, M.; Vetrella, S. A bistatic SAR mission for earth observation based on a small satellite. Acta Astronaut. 1996, 39, 837–846, ISSN 0094-5765. [Google Scholar] [CrossRef]
- Krieger, G.; Hajnsek, I.; Papathanassiou, K.P.; Younis, M.; Moreira, A. Interferometric Synthetic Aperture Radar (SAR) Missions Employing Formation Flying. Proc. IEEE 2010, 98, 816–843. [Google Scholar] [CrossRef]
- Gebert, N.; Carnicero Dominguez, B.; Davidson, M.W.J.; Diaz Martin, M.; Silvestrin, P. SAOCOM-CS—A passive companion to SAOCOM for single-pass L-band SAR interferometry. In Proceedings of the EUSAR 2014, 10th European Conference on Synthetic Aperture Radar, Berlin, Germany, 3–5 June 2014. [Google Scholar]
- ESA Selects Harmony as Tenth Earth Explorer Mission. 2024. Available online: https://www.esa.int/Applications/Observing_the_Earth/FutureEO/ESA_selects_Harmony_as_tenth_Earth_Explorer_mission (accessed on 21 August 2024).
- Gamma Software Information. 2024. Available online: https://gamma-rs.ch/software (accessed on 21 August 2024).
- Zhang, T.; Qian, Y.; Li, C.; Lu, J.; Fu, J.; Guo, Q.; Guo, S.; Wang, Y. Imaging and Interferometric Mapping Exploration for PIESAT-01: The World’s First Four-Satellite “Cartwheel” Formation Constellation. Atmosphere 2024, 15, 621. [Google Scholar] [CrossRef]
- Mou1, J.; Wang, Y.; Fu, X.; Guo, S.; Lu, J.; Yang, R.; Ma, X.; Hong, J. Initial Results of Geometric Calibration of Interferometric Cartwheel SAR HT-1. In Proceedings of the IGARSS 2024—2024 IEEE International Geoscience and Remote Sensing Symposium, Athens, Greece, 7–12 July 2024; pp. 9961–9965. [Google Scholar]
- Goldstein, R.; Zebker, H.; Werner, C. Satellite radar interferometry: Two dimensional phase unwrapping. Radio Sci. 1988, 23, 713–720. [Google Scholar] [CrossRef]
- Costantini, M. A novel phase unwrapping method based on network programming. IEEE Trans. Geosci. Remote Sens. 1998, 36, 813–821. [Google Scholar] [CrossRef]
- Yu, H.; Lan, Y. Robust Two-Dimensional Phase Unwrapping for Multibaseline SAR Interferograms: A Two-Stage Programming Approach. IEEE Trans. Geosci. Remote Sens. 2016, 54, 5217–5225. [Google Scholar] [CrossRef]
- Zhou, L.; Yu, H. A Novel Mathematical Framework for Multibaseline InSAR Phase Unwrapping. IEEE Trans. Geosci. Remote Sens. 2023, 61, 1–8. [Google Scholar] [CrossRef]
- Lombardini, F.; Griffiths, H.D. Optimum and suboptimum estimator performance for multibaseline InSAR. Frequenz 2001, 55, 114–118. [Google Scholar] [CrossRef]
- Lee, J.-S.; Hoppel, K.W.; Mango, S.A.; Miller, A.R. Intensity and Phase Statistics of Multilook Polarimetric and Interferometric SAR Imagery. IEEE Trans. Geosci. Remote Sens. 1994, 32, 1017–1028. [Google Scholar]
- Wegmüller, U.; Werner, C.L. SAR interferometric signatures of forest. IEEE Trans. Geosci. Remote Sens. 1995, 33, 1153–1161. [Google Scholar] [CrossRef]
- Goldstein, R. Atmospheric Limitations to repeat-pass Interferometry. Geophys. Res. Lett. 1995, 22, 2517–2520. [Google Scholar] [CrossRef]
- Tarayre, H.; Massonnet, D. Atmospheric propagation inhomogeneities revealed by ERS-1 interferometry. Geophys. Res. Lett. 1996, 23, 989–992. [Google Scholar] [CrossRef]
- Zebker, H.A.; Rosen, P. Atmospheric Artifacts in Interferometric SAR Surface Deformation and Topographic Maps. J. Geophys. Res.-Solid Earth 1997, 102, 7547–7563. [Google Scholar] [CrossRef]
- Hanssen, R.F. Radar Interferometry: Data Interpretation and Error Analysis; Kluwer Academic Publishers: Dordrecht, The Netherlands, 2001. [Google Scholar] [CrossRef]
- Copernicus DEM—Product Handbook. 2024. Available online: https://spacedata.copernicus.eu/documents/20123/121239/GEO1988-CopernicusDEM-SPE-002_ProductHandbook_I4.0.pdf (accessed on 21 August 2024).
- Weber Hoen, E.; Zebker, H. Penetration Depths inferred from interferometric volume decorrelation observed over the Greenland Ice Sheet. IEEE Trans. Geosci. Remote Sens. 2000, 38, 2571–2583. [Google Scholar]
Disclaimer/Publisher’s Note: The statements, opinions and data contained in all publications are solely those of the individual author(s) and contributor(s) and not of MDPI and/or the editor(s). MDPI and/or the editor(s) disclaim responsibility for any injury to people or property resulting from any ideas, methods, instructions or products referred to in the content. |
© 2024 by the authors. Licensee MDPI, Basel, Switzerland. This article is an open access article distributed under the terms and conditions of the Creative Commons Attribution (CC BY) license (https://creativecommons.org/licenses/by/4.0/).