Abstract
The SWOT satellite, carrying the KaRIN first wide-swath onboard altimeter, was launched in December 2022, and has now delivered more than a year of surface water elevation data over the ocean and inland lakes/rivers. These data are affected by systematic errors which constitute the dominant part of the error budget at scales larger than a few thousands of kilometers. Some strategies for their estimation and calibration were explored during the pre-launch studies with performance estimations. Now, based on the real data, we propose in this study to assess the systematic error budget with statistical methods relying on spectral and co-spectral analysis. From this assessment, suggesting very low error levels (below requirements), we propose the implementation of the calibration algorithms at Level-2 and Level-3 with a few minor adjustments justified by the error spectra. The calibrated products are then validated with usual CalVal metrics.
1. Introduction
Since the SWOT [] launch in December 2022, the KaRIN (Ka band Radar Interferometer) instrument has delivered more than 1-year of data on its fast-sampling orbit (April–July 2023) and on its nominal orbit (since August 2023). The firsts post-launch analyses [] have already shown two-dimensional topography images of exceptional quality over the short spatial scales (<50 km wavelength) where nadir altimetry is noisy and limited to one-dimensional profiles. In this present study, we mostly focus on larger wavenumbers, where systematic errors [] are supposed to be present in uncalibrated Level-2 data and removed after a proper calibration.
Several studies performed during the pre-launch phase of SWOT have already explored different diagnostics to validate the Karin data. In particular for systematic errors, the authors of [] have shown, based on the SWOT simulator [,], that a co-spectral analysis of the Karin data self-consistency can provide a spectrum of the main systematic error terms. A first goal is now the application of this method to the real in-flight Karin data to assess the uncalibrated systematic error budget.
The calibration of these systematic errors is an essential component prior to the use of the KaRIN data for both inland and ocean applications. It was designed very early during the first concept studies of wide-swath altimetry, in particular for the crossover approach []. Then, some performance evaluations were carried out with the SWOT simulator, along with the development of new algorithm declinations, including the direct, collinear and crossover-hybrid methods [,] at Level-3 (i.e., relying on the external altimetry constellation). A second goal of this study is, therefore, to evaluate the performance of the calibration on the real data. The crossover (Level-2) and direct (Level-3) methods will be applied with a few adjustments, and their performances will be assessed with variance reduction and spectral diagnostics. The analysis will mostly focus on the nominal orbit, since the Level-3 correction performs similarly in both orbital phases, while the Level-2 correction is known to be unsuitable for the fast-sampling orbit.
The manuscript is organized as follows. Section 2 focuses on the Level-2 uncalibrated error budget, relying on the spectral analysis implemented in []. Section 3 describes the implementation of the calibration algorithms at Level-2 and Level-3, based on []. Then, Section 4 and Section 5 are dedicated to the performance assessment of the calibrated datasets over both inland and ocean surfaces, followed by a conclusion in Section 6.
2. Uncalibrated Systematic Error Budget
We first propose a visualization of the topography signal over a long series, as shown in Figure 1. If the topography on a single crossover (left panel) does not obviously highlight systematic errors (the offsets or linear cross-track differences could be attributed to either ocean variability or errors), the long series on the upper-middle panel reveal a clear presence of a roll-shaped signal of nearly 30 cm amplitude. Indeed, there is no reason for a geophysical signal to exhibit such a natural variability along orbit circles drifting in longitude. This will be quantified in the spectral diagnostics, but at this stage it is clear that, at first order, a linear shape oscillating near the orbital frequency dominates, and will have to be calibrated.
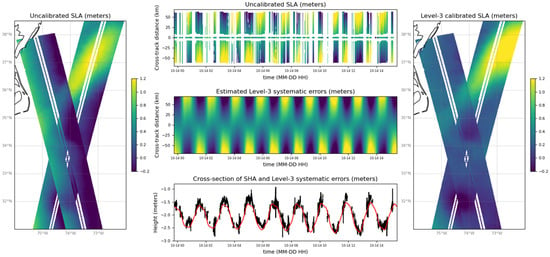
Figure 1.
Illustration of the Karin SLA at different scales. On the right, the uncalibrated topography on a SWOT crossover in the Gulf-Stream region. The upper-middle panel is the same, represented during 16 h along the horizontal axis. The center-middle panel shows the estimated systematic errors at Level-3. The lower middle panel is a cross-section at 58 km range of the above variables (in black for the uncalibrated SLA and in red for the Level-3 error estimation) The left panel shows the same as the right panel but after the correction at Level-3 has been applied.
2.1. Direct Spectral Analysis
A spectral analysis has been conducted on this Karin signal, with 14-orbit long segments of given cross-track distances, based on six months during the science phase (September 2023–February 2024). The missing data (along land segments primarily) have been filled with a low-pass convolution whose cutoff frequency is adjusted to the size of each missing segment. This minimizes spurious aliasing effects, but removes a portion of the actual energy. This later is compensated for by a factor applied to the spectra. To do so, we generated synthetic 1-D signals following the different spectra, based on an approach detailed in []. Then the mask of the SWOT missing data is applied to the synthetic data, followed by the convolution-based data-filling described above (suppressing some energy). Finally, the spectra are computed on the processed synthetic data, and the ratio with the initial spectra represents a loss of energy factor, as a function of wavenumber, due to the missing data segments. This factor (near 2 at short wavelength and 1 at long wavelength) is applied after the computation of the SWOT data spectra. The results, shown on Figure 2, compare the power spectral densities obtained after this processing, at different cross-track distances (16 km, 34 km and 56 km), as well as the power spectral density of the SWOT nadir altimeter.
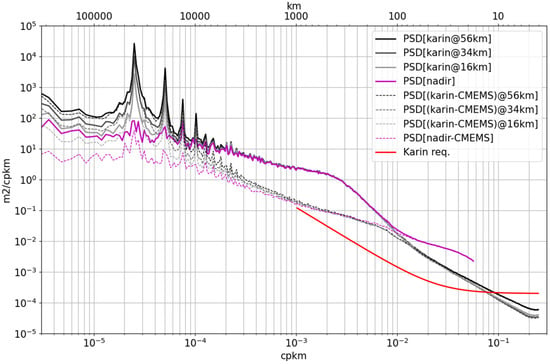
Figure 2.
Power spectra of SLA at different cross-track distances represented by light-gray (near-nadir) to black (far-nadir) colors. The purple spectrum is that of the nadir altimeter SLA shown as a reference. The purple lines are the same spectra after removing the CMEMS Level 4 altimetry maps.
The first striking feature is indeed the presence of a strong orbital signal of energy growing with the cross-track distance (gray to black lines), which is consistent with the roll-shape identified earlier. The orbital peak, near 40,000 km in wavelength, is not a pure harmonic, as indicated by the succession of secondary peaks at a multiple of the orbital frequency. Beyond these orbital peaks of low-frequency, we can note an exceptional match in energy below 3000 km between Karin and the Nadir altimeter, down to nearly 100 km, where the nadir altimeter noise starts to impact the spectral energy as expected. The use of the CMEMS multi-altimeter gridded topography [] (not including SWOT) as a prior field to subtract is interesting in highlighting the innovation signal seen by SWOT on top of what is already known. The spectra of these signals are shown as dashed in Figure 2. The match between Karin and nadir is still very good between 1000 km and 100 km, while the increase in Karin energy starts to be detectable above 1000 km.
This result suggests that the systematic errors are meaningful only above 1000 km (at this wavelength, they are more than a decade below the total signal) and are comparable to the geophysical signal only beyond 5000 km wavelength, where they start to dominate.
To separate and estimate the different contributions of the systematic errors (biases, linear and quadratic terms named, respectively, B, L, and Q in the following), we can fit an order-2 polynomial function for the cross-track coordinate and look at the magnitude of the terms. This is particularly instructive for long wavelengths, where these systematic errors dominate over the geophysical signal. To do so, a decomposition is performed on cross-sections of the 2-km grid, by fitting the following polynomial functions:
where x is the cross-track coordinate (negative/positive in the left/right swath respectively). The fit of result is performed with the following least-square formula:
where the matrix operator H is defined by and h if the SLA section is relative to the CMEMS Level-4 solution. Only the values where x is between 10 km and 60 km off nadir are considered. We chose to work here relative to the CMEMS Level-4 solution to mitigate the leakage of large (and already known) mesoscale eddies in the polynomial functions, in order to focus on the systematic errors.
From the decomposition, the time series of each term of the vector can be processed in power spectral density with the same processing as described for the spectral analysis of Figure 2 (also along 14-orbit segments to allow good resolution near the orbital frequency). For an easy comparison of the relative magnitude of the terms, the spectra have been scaled to the equivalent contribution in averaged energy over the 10–60 km off nadir band. These spectra are shown on Figure 3, with the spectrum of the total SLA in black. On the right-hand side, for wavelengths shorter than 3000 km, we suspect that the plateaux are the effect of the geophysical signals on the polynomial decomposition, and this will be confirmed later. However, for long wavelengths, the energy can be reasonably attributed to the systematic errors (or at least to an upper bound). The L term clearly dominates above 10,000 km, explaining the main orbital peaks of the total signal. It also features a broadband spectrum clearly visible between 20,000 km and 3000 km with a minus 2 decay law, which may prolongate toward shorter wavelengths below the dominant geophysical contribution. This −2 slope was expected from the gyroscope residual error contribution []. The B term, which has been calculated relative to the SWOT Nadir Altimeter SLA, is also an important contributor with clear spectral peaks (the secondary peak being larger than the primary). A broadband spectrum is also suspected, as discussed later. Beyond these two main contributors, the levels of the other terms are low, mostly composed of orbital harmonics. The integrated values in centimeters will be given and discussed in the next section.
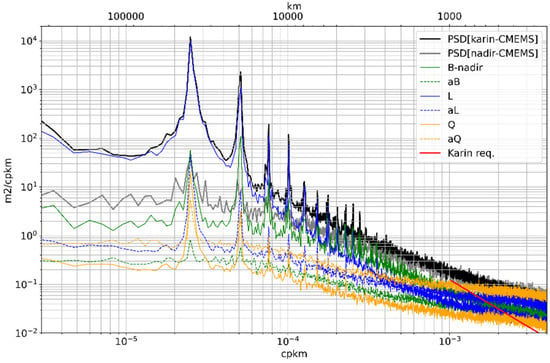
Figure 3.
Power spectra of the bias, linear and quadratic fits shown in different colors and the power spectrum of the SLA (in CMEMS maps anomaly) used for the fit, in black. The spectra originate from different sets of fits explained in the text.
This direct analysis was complemented by a few tests to verify that no other terms with a cross-track signature at an order 3 or above were present in the signal variability at large scales, at least in the orbital frame, where most systematic errors are described. To do so, we subtracted the successive cross-track polynomial fits and looked at the residual signal in the orbital frame, averaged over 1-day, as represented in Figure 4. The left panel (1st order fit removing Bias only) exhibits the dominant roll signal. The middle panel (2nd order fit removing bias and linear shapes) exhibits the centimetric residuals of quadratic shapes. Finally, the right panel (removing bias, linear and quadratic shapes) confirms that cross-track order 3 signatures are quasi-absent or millimetric.
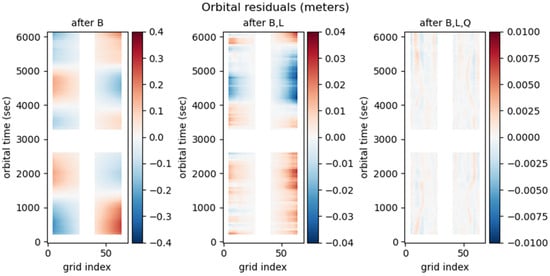
Figure 4.
SLA averaged over 1 day, as a function of the orbital coordinate (in seconds) and the cross-track direction, after removing a zero (biases only), first (bias+linear) and second (bias+linear+quadratic) order fits, from left to right.
2.2. Cross-Spectral Analysis
The polynomial analysis presented so far does not separate the actual systematic errors from the geophysical signal likely dominating below 3000 km wavelength, as anticipated. As explored in [], a cross-spectral analysis can be conducted to separate the contributions specific to the cross-track distance. Under assumptions that the geophysical signals have similar statistics for any cross-track distance in the Karin swath (after a few orbits when SWOT samples cover many different regions), it is possible to quantify the amount of energy owing to the errors related to the cross-track distance, as explained in detail in this study. Here, we propose to apply the same analysis, with a few adjustments. The first is the extension of the segment length, as performed in the spectral analysis described above, to provide estimations over all wavelengths up to the orbital scales. The second is the introduction of the cross-spectra between Karin and the nadir altimeter. As mentioned in [] he Karin bias is hardly separable from the isotropic signal, especially at long wavelength. Here, with the introduction of the nadir altimeter, the long wavelength bias energy due to Karin only can be identified (the biases common to nadir and Karin, such as those resulting from orbital errors, cannot be detected). This extension of the cross-spectral density analysis includes the definition of new models to project the contribution, as illustrated on Figure 5.
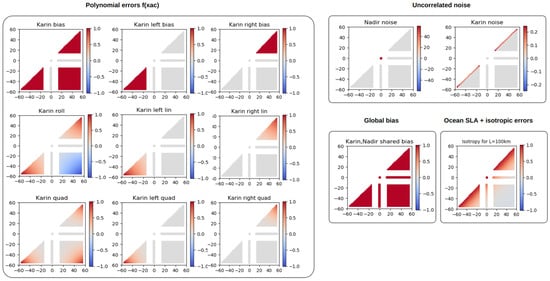
Figure 5.
Illustration of the different projection models for the systematic errors on the left (denominated as polynomial errors), for the uncorrelated noise (top right), for the global bias (shared by the nadir and Karin altimeters) and for all isotropic terms, on the lower-right.
The left panel shows the ensemble of polynomial errors on Karin, similar to that presented in []. On the upper right is the noise model for each instrument (nadir and Karin), considered as independent. On the lower right is what is seen by both instruments, global bias (seen by the nadir and Karin, such as orbital errors), and the geophysical signals considered as a function invariant with the difference in cross-track distance (supposed to include the real sea level anomalies and geophysical errors not directly related to the cross-track coordinate).
The first six months of the science-phase data have been processed by averaging the cross-spectra of SLA between all range combinations in the 10 km–60 km interval, along with the nadir SLA. After the first step of the processing, we obtain mean cross-spectral slices, as shown on Figure 6 for illustration at three different wavenumbers.

Figure 6.
The Cross-Spectral Density (XSD) slice computed and averaged over the whole dataset, for three different wavelengths: 40,000 km, 487 km and 4 km.
At this step, we can already recognize the dominance of some expected models, shown in Figure 5. At the orbital frequency (~40,000 km, left panel), the Cross-Spectral Density (XSD in the following) slice exhibits the dominance of the roll-shape signal model. The presence of negative XSD indicates anticorrelation between the left and right swath, characteristic of the roll signal where the linear shape is opposite for the right and left swaths. This is consistent with the dominance of the roll at orbital frequency found in Section 1. In the mesoscale band near 500 km, the XSD slice is more similar to the isotropy model, with invariance along isolines of cross-track distance. The pattern extends to the (nadir, Karin) lines of cross-spectral densities with similar values, suggesting that this signal is seen by both instruments, as expected if it mainly represents actual sea level anomalies. Finally, at the shortest scale (4 km, the Niquist of the 2 km grid) we can see the dominance of the expected noise with energy increasing at near and far range, but with no other spurious correlations visible.
The second step of the processing is the projection of the slices on the systematic error models to obtain quantitative spectral densities averaged in the 10–60 km band, as explained in []. The results have been represented in Figure 7: the brown curve is the sum of the polynomial errors that, indeed, dominate the signal at long wavelength and explain the first orbital peaks mentioned earlier. Below 10,000 km, the errors drop and do not exhibit the plateau, as in the direct polynomial spectral analysis contaminated by the geophysical signal. Here, we think that the geophysical signals (named ISO on the figure, which may also contain some other errors) are properly separated from the systematic errors. Indeed, the blue curve dominates the signal below 3000 km, and the systematic errors, dominated by the linear shape, follow approximately a −2 power law even toward the shortest scales. The bias part of Karin (thin red curve) also seems to follow a −2 power law. An estimation of the nadir error is also given from the model decomposition thanks to the detection of energy that is present in the nadir, but not in the Karin data. This is represented by the gray curve, featuring the expected noise plateau a little below 10−2 m2/km/cy. Above 800 km wavelength, an increase in error level is detected on top of the plateau.
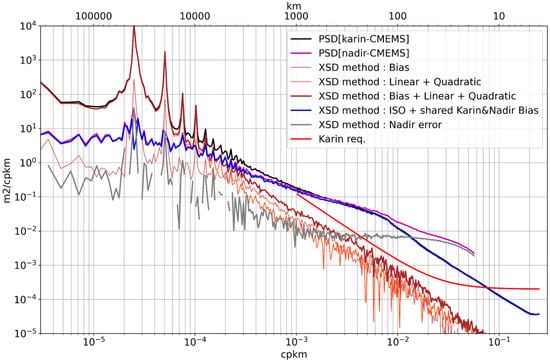
Figure 7.
Power spectra of the estimated terms’ decomposition from the cross-spectral analysis. The estimated Nadir error is in gray, the Karin systematic errors are in red-orange red colors, and the isotropic terms are in blue. The power spectrum of the nadir (purple) and Karin (black) are shown for comparison.
2.3. Magnitudes of the Systematic Error Terms
Based on the spectral estimations, we can integrate the power spectral densities of the different polynomial terms over different bands, as represented on Table 1. The ‘Beta’ scale denotes the largest scales related to the angle of the satellite orbital plane with the sun, which rotates over a cycle of 120 days. The orbital scale includes the first four harmonics of the main orbital frequency, and the broadband scales are everywhere below the orbital frequency, excluding the orbital peaks.

Table 1.
Integrated values of the spectral densities (scales in centimeters) for the 6-term systematic error decomposition, for different spectral bands.
Note that the values at Beta scale are not obtained by the spectral integration that would not cover a full beta cycle, but are computed from the variance of the zero frequency of all independent spectral computations. Table 1 summarizes the key numbers to characterize the systematic errors. These averaged values can actually fluctuate over time. In particular, the ~15 cm orbital roll (in the L term) fluctuates between 10 cm and 30 cm along the beta cycle, as illustrated later in Section 3.
To further validate these results, we performed an additional analysis presented in Appendix A. Based on the spectral energy increase across the swath, the analysis validates the consistency of the spectrum for the linear (L + aL) and quadratic (Q + aQ) terms. This analysis cannot apply to the Bias term (not separated from the Oceanic variability). However, the spectrum for the Bias is consistent with the Karin/Nadir analysis detailed in [], also suggesting a −2 spectrum slope below the requirement curve. These consistent results give further confidence in the XSD analysis, suggesting that the systematic error spectrum is well below the requirements at all scales.
3. Implementation of Level-2 and Level-3 Algorithms
The uncalibrated error analysis shown in Section 2 was essential to validate the use of the calibration algorithms designed during the pre-launch studies [,]. Indeed, below 1000 km, the systematic errors are fairly below the requirements, so the calibration does not need to operate at these wavelengths, as expected. This is where the calibration would have been particularly challenging, with risks of absorbing natural ocean variability []. Therefore, in this band, there is no need to update any algorithm.
Above 1000 km, the calibration is necessary for inland hydrology and is also highly desirable for many ocean applications. The analysis presented in Section 2 confirmed that uncalibrated topography data feature large scale cross-track errors of similar to higher energy (O(15–20 cm) than the ocean geophysical signal at these large scales (O(1–10 cm)) These errors are quite close to what was expected in simulation [], with the dominance of a strong roll-shape signal at orbital frequency, a spectral plateau above (maintained with the star-tracker estimations), and a −2 spectral slope below (a characteristic of the gyroscope performance). However, the secondary peaks that clearly show up in the error estimations were not accounted for in the simulations for the roll []. Although they should not impact the calibration significantly (this will be verified), we will propose an adjustment of the algorithm at Level-3.
3.1. Implementation at Level-2
The implementation of the Level-2 calibration is an essential component in the processing chain, in particular to keep the inland error budget within requirements. The analysis of uncalibrated data presented in Section 2 is very encouraging, with good similarities to that which was hypothesized in simulations [,]. Therefore, it does not justify any particular change to the calibration algorithm described in [] in its baseline configuration. An important aspect was to verify that the orbital perturbation thickness of the peak is sufficient to apply the 8-passes orbital fit for roll, and that no other strong orbital perturbations were present beyond the roll. This was demonstrated in Section 2 and, despite the presence of secondary orbital peaks revealed in the spectral analysis for roll, the amplitude did not require particular updates of the orbital filter. Therefore, the main KaRIn–KaRIn crossover method is used, as described in []. The exact implementation is described in the dedicated Algorithm Theoretical Basis Document [SWOT-NT-CDM-2150-CNES]. The key elements are the editing of land, ice and spurious data using the product variables, and the integration in the ground-segment configuration leading to a daily production. The operational processing chain used a time window of 10 days in the past. It is also regularly reprocessed offline using a centered temporal window of 10 days, both in the past and in the future, for better precision (doubling the number of available crossovers). The performances that will be shown in this study derive from the offline reprocessing.
3.2. Implementation at Level-3
At Level-3, the so-called ‘Direct’ method from [] has been implemented, formerly based on the CMEMS Time-delayed Level-4 multi-altimeter product. As mentioned in [], a key aspect of this algorithm is the proper dynamic filter cutoff to separate the Karin ocean variability (expected to be above the short-scales that are not resolved by the CMEMS maps, but below the large scales where the systematic errors dominate). The direct spectral analysis presented in Section 2.1, in comparison with the cross-spectral analysis in Section 2.2, suggests that the geophysical variability impacts the polynomial fit from the shortest scales, up to about 3000 km wavelength (the plateau for ‘L’ and ‘B’ on Figure 2). This value may appear important, since the CMEMS maps are supposed to be accurate at these large wavelengths [] and therefore suppress the remaining ocean variability seen by Karin. However, here, we are aiming at tackling very small systematic errors (below original requirements) and, therefore, even small errors in the CMEMS maps may have an impact on the separation. Therefore, we chose to keep this 3000 km cutoff for L and B dynamic filtering, to mitigate geophysical contamination. For the minor error terms (aB, aL, Q and aQ), the direct spectral analysis in Figure 3 does not suggest the presence of any clear broadband error spectrum. Therefore, only the orbital fit is implemented for these terms, without any dynamic filtering, to further mitigate potential leakages. The orbital fits for all terms (also including L and B) have been updated from [] to better capture the secondary peaks. The first four harmonics are fitted over a 1.5 orbit time sliding window centered on each pass sequentially.
Figure 8 shows the time series over approximately 12 h (14 passes) of the parameters before (black dots) and after the orbital fit and dynamic filtering (coloured lines) during the science phase. These coloured lines on the figure constitute the estimates of the Level-3 correction.
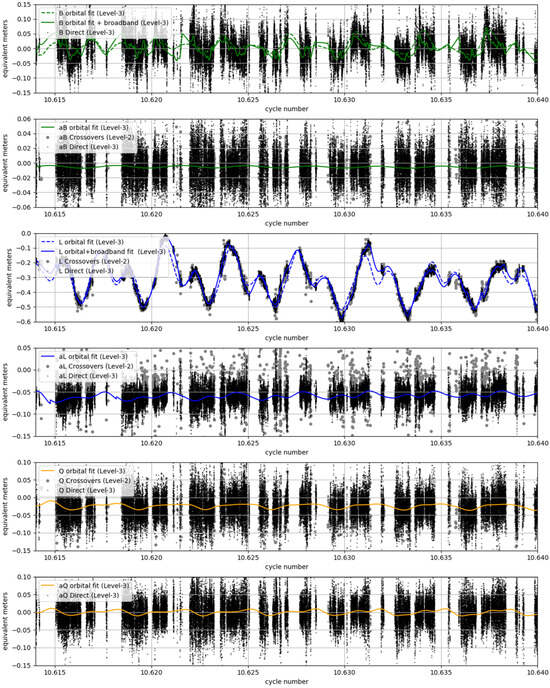
Figure 8.
Time series over 14 passes (approximately 12 h) of the fitted geometrical terms, as labeled on the legends from the top to the bottom, during the science phase (21-day orbit). The black dots represent the raw fits, and the colored plain lines represent the filtered fits. The gray dots represent the crossover estimations obtained at Level-2.
Before the fit, the noise that dominates the estimations of all terms except ‘L’ is attributed to the geophysical variability (or additional errors) and is therefore not captured by the low-frequency fit. This noise is also similarly present for L, but somehow masked by the orbital signal of nearly 30 cm amplitude on the figure. For the minor terms (aB, aL, Q and aQ), we confirm that there is no clear apparent signal to fit beyond the orbital harmonics, as suggested by the direct spectral analysis.
Figure 9 shows a broader view of the fitted parameters over 8 months. Note that the satellite yaw-flip events have been accounted for by reversing the cross-track coordinate (otherwise, discontinuities were found due to the swath flip swapping the left and right parameters).
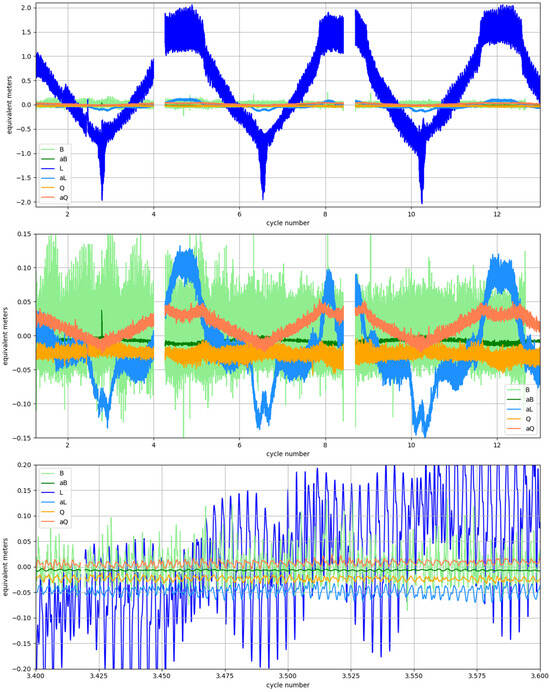
Figure 9.
As Figure 8, but representing only the fitted parameters over more than 20 cycles (210 days) on the top, with a zoom on the y-axis in the middle panel excluding the large ‘L’ term (middle panel) and a zoom on the x-axis (lower panel).
This figure allows us to complement the magnitude analysis shown in Section 2. In particular, for the slow variations, it is interesting to visualize the clear signature of the Beta orbital plan cycle in the solar referential (120 days long) for the L, aL and aQ terms. However, the repeat patterns are not exact, probably because the light conditions change for each new beta cycle as the earth’s inclination with the sun is also changing. The Karin-nadir bias term (‘B’) seems to be slightly reduced from cycle 6, but we do not yet have any explanation.
4. Level-2 and Level-3 Calibration Performance
The level of uncalibrated systematic errors, holding requirements at all wavelengths, gives good confidence that the algorithms developed in simulation with similar or even higher input errors allow a successful calibration, meeting the calibrated data requirements. The estimation of performance is obviously not as easy to perform as in simulation, where a reference scene was available. However, several diagnostics can be applied to assess indirectly the level of residual systematic errors. A first diagnostic is the computation of the variance as a function of the cross-track distance, as presented in Annex A and here plotted in Figure 10 for the Level-2 and Level-3 calibrated products.
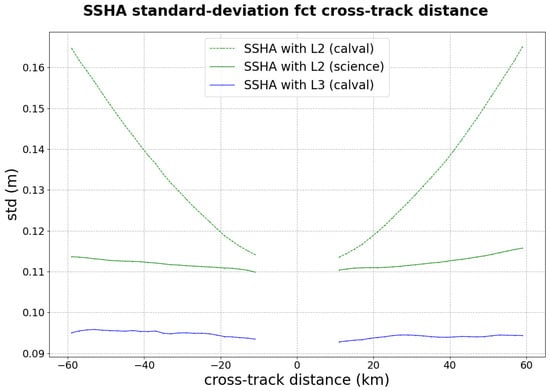
Figure 10.
Standard deviation (in meters) of the calibrated signal as a function of the cross-track distance, averaged over the global ocean surfaces.
The main message to address from this figure is that the Level-2 calibration for the CalVal phase (1-day orbit) is not appropriate. Linear and Quadratic errors that explain the STD increase in the cross-track direction are also important. These values are for ocean surfaces only, and we expect additional errors inland where no calibration constraint is used. This result was already anticipated in simulation [] and is directly explained by the very limited number of crossovers in the 1-day orbit. The Level-2 calibration for the science phase features reasonable increase of energy (this will be discussed later in the spectral analysis). The Level-3 calibration features no clear energy increase at all. It is interesting to note that the level of standard deviation is lower than the L2 in every case. One explanation is that the Level-2 nadir data on which the Karin bias is calibrated contains more variability than the Level-3 data used to fit the Karin Bias in the Level-3 Karin product. Note that the Level-3 has similar performances over the CalVal and science phase, since its performance is only related to the nadir altimetry constellation.
The following diagnostics presented geographically (Figure 11) and spectrally (Figure 12) are all performed from the first 15 cycles of the science phase.
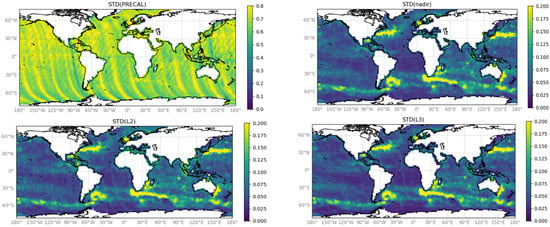
Figure 11.
Standard deviation (in meters) of the uncalibrated Karin SLA (upper left), of the SWOT nadir SLA (upper right), of the Level-2 calibrated Karin SLA (lower left) and of the Level-3 calibrated Karin SLA (lower right).
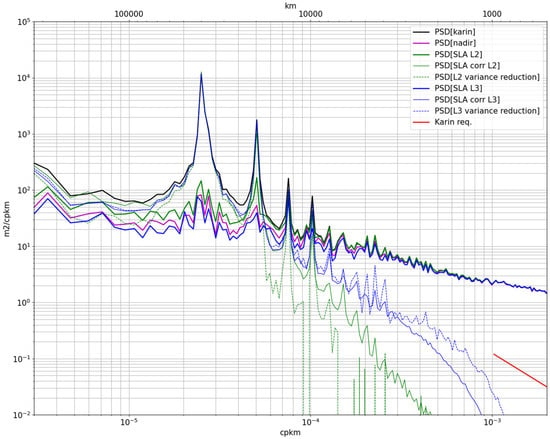
Figure 12.
Power spectra of the Level-2 and Level-3 calibrated SLA (thick green and thick blue respectively). The thin curves of the same colors represent the power spectra of the correction signals. The dashed curves represent the difference between the uncorrected and corrected SLA spectra, denoted as “variance reduction”.
In Figure 11, the drop of energy from calibrated to uncalibrated data is obvious and, in both Level-2 and Level-3, the variability is very similar to that observed in conventional altimetry (the SWOT nadir data on the upper-right panel). We note slightly more energy in the Level-2 data, which is consistent with the global variance diagnostic in Figure 9. Beyond this, we did not detect any spurious pattern, even next to the coasts, the polar regions, or continental shelves, where the calibration could be more challenging.
The consistency of the standard deviation maps does not guarantee the absence of residual errors, which are certainly present after calibration. A finer or more quantitative analysis can be provided by spectral computations confronting the original signal, the corrected signal and the correction signal. Indeed, since the systematic errors are independent of the geophysical signals, the variance reduction from the uncorrected to the corrected signal should match the variance of the correction signal if this latter is correct. The variance deviation between these two quantities indicates errors in the calibration, which is the diagnostic proposed in Figure 12.
As for the Level-2, we note that the main orbital peak (explained by the roll) disappears with the calibration, with the variance in the correction (thin green) matching the variance reduction (dotted thin green). This indicates that the orbital filter performs correctly with the crossover approach to capture the first harmonic of the roll perturbation. This is not as obvious for the secondary peaks, although the variance is clearly reduced. One possible reason is that the secondary peaks are not accounted for in the orbital fit at Level-2, so they are only corrected by the dynamic filter, known to be less efficient in capturing orbital signals. These results suggest that the Level-2 algorithm may be improved to handle the secondary peaks, although not necessarily to meet the mission requirements. This might be implemented in the future, as no side degradations are found by increasing the number of harmonics.
As for the Level-3, we note a better match for both the first four orbital peaks, and also for the broadband part with the −2 spectral slope down to 3000 km wavelength. Below, the variance reduction (dotted blue) exceeds the variance of the correction (plain blue). which may be an effect of slight geophysical leakage. However, this leakage would remain more than a decade below the signal (black curve).
5. Inland Assessment of the Calibration
As mentioned, the systematic errors of SWOT have an amplitude of about several tens of centimeters at the swath scale. The SWOT calibration processing is thus mandatory for the performance of inland waters monitoring. This section aims to assess its performance during the ongoing science phase of SWOT over inland waters. Although a seasonality of the performances is expected inland due to the changing availability or Arctic ocean crossovers [], we carried out the analysis over the whole of the September 2023–April 2024 period, which covers a full winter season. This is, therefore, conservative with respect to the yearly average, and future studies will certainly assess the seasonality in detail when several years of data will be available.
SWOT Level-2 Water Mask Pixel Cloud Data products (Product Description Document [] and the Algorithm Theoretical Basis Document []) have been used to evaluate the performance of the calibration processing (Level-2 and Level-3). The L2_HR_PIXC product is dedicated to inland water observations. This product is organized in tiles, about 64 km long (along-track direction) and about 64 km wide (cross-track direction from near to far range). Each product can be represented as a sparse 2-D array with longitude/latitude coordinates and height information.
Water surface slopes in the cross-track direction are studied w.r.t the calibration version Level-2 (official PIC0) and Level-3 (offline calculation), or its non-use. Figure 13 shows the impact over the Tana Lake (Ethiopia, 2 March 2024, cycle 11 pass 471 tile 175L). Quite a significant slope (value of about 4.2 cm/km in the cross-track direction) can be observed before calibration. Then, this slope is greatly reduced to 0.2 cm/km using calibration (Level-2 in this example).
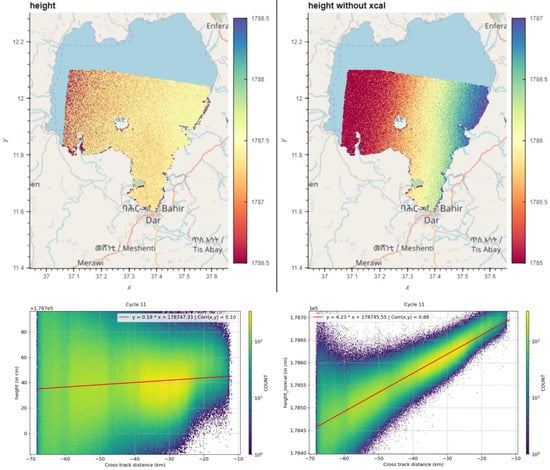
Figure 13.
Impact of SWOT’s systematic errors calibration over the Tana Lake (Ethiopia). L2_HR_PIXC product (2 March 2024 cycle 11 pass 471 tile 175L) is used. Height w.r.t cross-track distance are shown with Level-2 calibration (left panel) and without calibration (right panel).
This example illustrates our approach in deriving the reduction in height variance related to SWOT calibrations. Indeed, estimates of water surface slopes over lakes provide useful information on the calibration performance. Once the geoid is corrected, lake height estimates should be theoretically flat (i.e., 0 cm/km in the cross-track direction). Concerning our validation dataset, we selected the largest lakes, below 50° North, to avoid potentially frozen lakes. Only one single SWOT HR tile per cycle, track and lake is kept. We use the PIC0 version of the L2_HR_PIXC products i.e., from 23 November 2023 to 4 April 2024. During this period, about 2400 different tiles have been analyzed over about 200 large lakes (Figure 14).
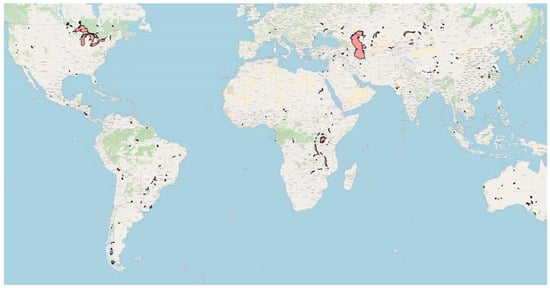
Figure 14.
Distribution of about 200 large lakes analyzed to estimate the height variance reduction obtained after SWOT calibration.
For each tile, pixels are first selected based on the lake polygons from the Prior Lake Database []. Then, heights are extracted between 10 km and 60 km cross-track distance corresponding to the nominal swath []. Potential height outliers are rejected from the product classification flag. We use the classification flag “4”, i.e., “open water”, available at the pixel scale. For each tile and lake, the maximum deviation of water heights from the lake median value is also set at 10 times the median absolute deviation. Slopes are then computed. The following distributions (Figure 15) represent the results when rejecting slopes higher than 5 cm/km and three times the standard deviations (after calibration). 85% of the entire dataset is retained. Figure 15 (left panel) shows the slope distribution with Level-2 calibration and without the use of the SWOT calibration processing. The slope distributions are well centered on 0 cm/km. One can clearly note a reduction in the variance of the estimated slopes. The standard deviation of the residual slopes is about 1.3 cm/km (with Level-2 calibration) against about 3 cm/km without calibration. This represents differences about several tens of centimeters at the tile scale. Concerning the calibration processing methods, these standard deviation values of the slopes are similar (about 1.3 cm/km), whether we use Level-2 or Level-3. Figure 15 (right panel) shows the slope differences from Level-2 and Level-3 calibration. The height variance reduction is similar (same standard deviation of 1.3 cm/km for the slopes distribution). The height variability is about a few cm at the scale tile using Level-2 or Level-3 calibration.

Figure 15.
Slope distribution in the cross-track direction with Level-2 (green) and without (blue) the use of the SWOT calibration processing (left panel). Slope differences between Level-2 and Level-3 calibration (right panel).
These results demonstrated a significant reduction in SWOT’s systematic errors with such calibration processing. This correction is mandatory in order to be able to meet the scientific requirements of 1.7 cm/km for river slopes [].
These estimates of slopes over large lakes should be considered as an upper limit. Indeed, other effects than SWOT systematic errors affect these results. Among them, we can cite the uncertainties related to the geoid model (EGM08). Geoid models can have significant inaccuracies on large lakes, with average errors (depending on location) of about 18 cm, as described in [].
We also compare SWOT HR data w.r.t. in situ data. This allows the detection of potential biases that may be induced by the SWOT calibration process. This section does not aim to perform the SWOT HR validation. The objective is to obtain a first estimate of the performance as part of the SWOT calibration processes. The SWOT LakeSP products (Product Description Document [] and Algorithm Theoretical Basis Document []) are compared to in situ data. PIC0 products (with Level-2 calibration) are used during the science phase (from 1 December 2023 to 15 May 2024).
In situ data from Swiss (BAFU Current monitoring data on bodies of water (admin.ch), https://www.bafu.admin.ch/bafu/en/home/topics/water/state/data/current-monitoring-data-on-bodies-of-water.html, accessed on 5 June 2024), and American (USGS Current Water Data for the Nation, https://waterdata.usgs.gov/nwis/rt, accessed on 5 June 2024) lakes networks are used as external reference data. One can mention that in situ data was leveled w.r.t geoid (EGM08) using ICESat-2 ALT13 data (ICESat-2 (nsidc.org), https://nsidc.org/data/icesat-2, accessed on 5 June 2024) to allow absolute comparison for the USGS dataset. SWOT LakeSP and contemporary in situ data are compared (difference less than 1 day). Figure 16 represents the distribution of the differences between in situ and LakeSP data. About 2464 comparisons over 141 lakes (PLD [] reference area higher than 1 km2) have been found. We obtained a residual bias of about 0.3 cm (median value) and a median absolute deviation of 9.9 cm (50% percentile). These comparisons demonstrate the good behavior of the calibration processes, particularly regarding potential bias due to calibration.
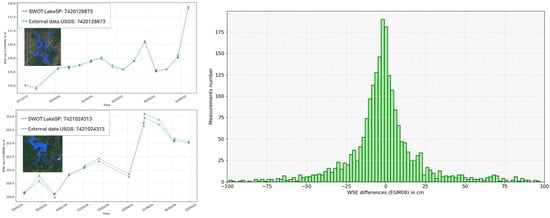
Figure 16.
In situ data (green lines) and SWOT LakeSP (blue lines) elevation time series w.r.t EGM08 are shown on the McGee Creek Reservoir (top left) and the Cave run lake (bottom left) as examples. The distribution of these differences over all the sites studied (Swiss and American lakes) is displayed on the right panel.
6. Conclusions
This study proposed an assessment of the Karin in-flight Sea Level Anomaly systematic errors to validate their level with respect to the requirements (and pre-launch simulations) over the nominal orbit (science phase). At large wavelengths (above 3000 km), these errors clearly dominate the variability of the signal, and particularly the roll-shape signal with a peak of ~15 cm amplitude near the orbital frequency. The other terms of the across-track polynomial decomposition are also present up to the second order (quadratic terms), as expected during the simulation studies before launch. The left–right differential bias (aB) is found to be very small (~1 cm), as well as the two quadratic terms (Q and aQ of 2–3 cm), although aQ was generally not considered in the simulations. At short wavelengths, the XSD decomposition method [] allowed us to estimate these systematic errors with precision, revealing very low levels following a −2 slope spectrum, well below the requirement level. This suggests the very good performances and high stability of the Karin instrument, while confirming the importance of the calibration for large wavenumbers.
This assessment of systematic errors was also necessary to validate the baseline implementation of the calibration algorithms that are (1) designed to calibrate cross-track signatures of along-track wavelength above 1000 km over the ocean, and (2) designed to calibrate orbital perturbations of these signatures from multi-orbital fits, assuming error stability in the orbital frame. Below 1000 km wavelength, the baseline algorithm leaving the SLA unchanged is obviously suited. Concerning orbital perturbation, we checked that the stability justifies the 8-passes orbital roll filter at Level-2, capturing most of the orbital signal. However, at Level-3, the detailed description of the primary and secondary peaks for each cross-track signature justified the implementation of a new filter for the six terms to calibrate. In particular, the small (~1–2 cm) orbital variations of the quadratic signatures relatively between left and right swaths were not accounted for in the simulation. The impact of this additional term did not justify any adjustment at Level-2, but was accounted for at Level-3. We also verified that higher-order cross-track term variability is quasi-absent at orbital scales, although we noted slow variations of the so-called ‘phase-screen’. This justified an implementation of an across-track function removal, computed from along-track means over a period long enough (1 day) to avoid any geophysical signal contamination.
The corrected Sea Level Anomalies at Level-2 and Level-3 have been finally compared with that of the nadir, and feature overall very similar energy and variability distributions, mostly explained by the large mesoscales observed by both instruments. In further detail, a spectral analysis of the corrected fields compared with the field of correction revealed interesting differences between Level-2 and Level-3. At Level-3, the spectrum of the correction compares well with the spectrum of variance reduction (obtained by the difference of the spectrum before and after correction) along a wider range than the Level-2, down to 3000 km. This suggests a successful separation with mitigated leakage and error introduction. However, in Level-2, the spectrum of the variance reductions tends to be lower than that of the correction, suggesting the presence of additional errors in the Level-2 correction (a signal that does not reduce the variance after application). At Level-3, a mitigated but existing leakage is suspected below 3000 km as the variance reduction overpasses the correction. However, this latter is very small, as suggested by the spectrum level of correction, well below the total signal spectrum below 3000 km. Finally, the impact of the calibration has been assessed over inland data, providing the expected reduction in the variability of the elevations, while this data is totally independent from the calibration processing chain.
This study proposed an initial assessment of the uncalibrated error budget and calibration performance, offering a baseline for the future implementation of more advanced calibration algorithms, like those tested in simulations by [].
Author Contributions
Conceptualization, C.U. and G.D.; methodology, G.D. and C.U.; software, A.D., F.B., G.B. and B.F.; validation, M.V., B.F., P.P. and E.C.; formal analysis, C.U.; investigation, G.D. and C.U.; writing—original draft preparation, C.U., M.V. and B.F.; writing—review and editing, C.U. and M.V.; visualization, A.D., B.F. and E.C.; supervision, G.D., C.U., P.P. and M.R.; project administration, Y.F. and G.D.; funding acquisition, G.D. and Y.F. All authors have read and agreed to the published version of the manuscript.
Funding
This research was funded by the Centre National d’Etudes Spatiales, DUACS grant.
Data Availability Statement
All datasets discussed in this manuscript are preserved and distributed by the Agencies’ data repositories in compliance with FAIR requirements (e.g. Core Trust Seal certified, or ongoing certification from the Research Data Alliance). The Level-3 SWOT products generated in the frame of this study are distributed by the AVISO repository from CNES from the following DOI: https://doi.org/10.24400/527896/a01-2023.017. The SWOT Level 2 KaRIn Low Rate Sea Surface Height Data Product, Version 1.1. available on the two centers with two DOIs: https://doi.org/10.24400/527896/a01-2023.015 (AVISO, beta prevalidated collection) or https://doi.org/10.5067/SWOT-SSH-1.1 (PODAAC, collection ID: SWOT_L2_LR_SSH_1.1). The SWOT Level-2 Nadir Altimeter Data Product (AVISO, collection: L2_NALT_IGDR) available from the following DOI https://doi.org/10.24400/527896/a01-2023.005).
Conflicts of Interest
The authors declare no conflict of interest.
Appendix A. Additional Validation of the Linear and Quadratic Terms with the Energy Increase Approach
This Appendix proposes an alternate and simpler method to the XSD diagnostics, here providing the sum of the Linear (L + aL) and Quadratic (Q, aQ) contributions. As opposed to the biases, the linear and quadratic terms have a direct impact on the energy increase in the cross-track directions, while the SLA is supposed to be statistically invariant in energy (especially during the science orbit, as SWOT samples a sufficiently large variety of areas to obtain a homogeneous energy at any cross-track distance). Therefore, the energy increase should be principally explained by the linear and quadratic terms, with additional contributions from other errors that may be dependent on the cross-track distance (the Karin noise for example). Under the assumption of independence between the error terms, we can reasonably consider the energy increase as an upper-bound of the linear and quadratic contributions.
From the power spectral densities already computed in the XSD algorithm (the diagonal terms of the cube slices), we can fit the linear and quadratic contributions with a least-square decomposition, as illustrated on Figure A1 for a given wavelength.
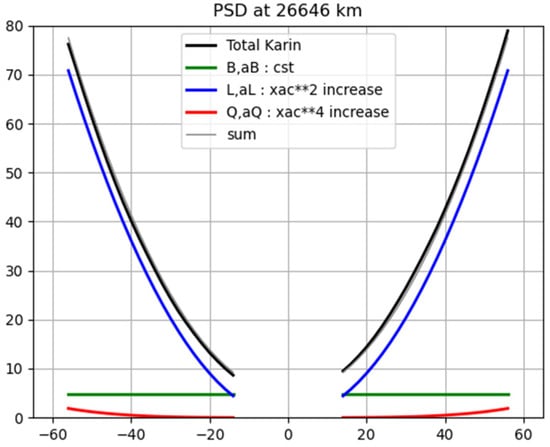
Figure A1.
Cross-section of the power-spectral density along the cross-track coordinate, here at wavelength 26,646 km, of the uncalibrated Karin SLA. The green, blue and red curves are the least-square decomposition of the square of a bias (constant), linear (xac**2) and quadratic (xac**4) shape respectively.
The black line (power spectral density section) clearly features the energy increase along the cross-track axis, similar for negative (left swath) and positive (right swath) coordinates. The least-square decomposition, represented by the three coloured lines, shows the dominance of the L term in this case. Note that the B term here (green curve) is where all the oceanic variability (invariant along the cross-track coordinate) should project. The result of this least-square decomposition, averaged in the cross-track direction, is presented on Figure A2 as a function of wavelength, and compared with the spectra computed from the XSD method.
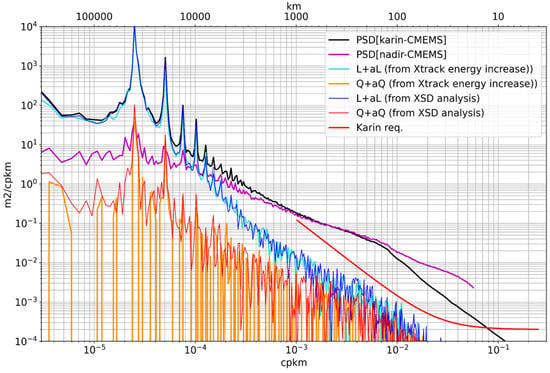
Figure A2.
Power spectral densities, averaged over 10–60 km, of the linear and quadratic terms contribution in blue and red, respectively. The turquoise and orange curves are the power spectral density estimates from the cross-spectral method for the same linear and quadratic terms respectively.
The spectrum for (L + aL) in turquoise for this energy-increase method compares well with the equivalent estimation from the XSD analysis in blue. This is also the case for (Q + aQ), although the estimations are relatively noisier because of the very low energy. In particular, at short wavenumbers where the systematic errors are hardly detectable because of the oceanic variability, it is very encouraging to verify the agreement between the two methods, both suggesting a very low contribution of systematic errors.
References
- Fu, L.-L.; Alsdorf, D.; Morrow, R.; Rodriguez, E.; Mognard, N. (Eds.) SWOT: The Surface Water and Ocean Topography Mission; Wide-Swath Altimetric Measurement of Water Elevation on Earth; JPL Publ. 12-05; Jet Propulsion Laboratory, National Aeronautics and Space Administration: Pasadena, CA, USA, 2012; 228p. [Google Scholar]
- Fu, L.-L.; Pavelsky, T.; Cretaux, J.-F.; Morrow, R.; Farrar, J.T.; Vaze, P.; Sengenes, P.; Vinogradova-Shiffer, N.; Sylvestre-Baron, A.; Picot, N.; et al. The Surface Water and Ocean Topography Mission: A breakthrough in radar remote sensing of the ocean and land surface water. Geophys. Res. Lett. 2024, 51, e2023GL107652. [Google Scholar] [CrossRef]
- Peral, E.; Esteban-Fernandez, D. Swot Mission Performance and Error Budget. In Proceedings of the IGARSS 2018—2018 IEEE International Geoscience and Remote Sensing Symposium, Valencia, Spain, 22–27 July 2018; pp. 8625–8628. [Google Scholar] [CrossRef]
- Ubelmann, C.; Dibarboure, G.; Dubois, P. A Cross-Spectral Approach to Measure the Error Budget of the SWOT Altimetry Mission over the Ocean. J. Atmos. Ocean. Technol. 2018, 35, 845–857. [Google Scholar] [CrossRef]
- Gaultier, L.; Ubelmann, C.; Fu, L.-L. The Challenge of Using Future SWOT Data for Oceanic Field Reconstruction. J. Atmos. Ocean. Technol. 2016, 33, 119–126. [Google Scholar] [CrossRef]
- Gaultier, L.; Ubelmann, C. SWOT Science Ocean Simulator Open Source Repository. 2019. Available online: https://github.com/SWOTsimulator/swotsimulator (accessed on 19 July 2022).
- Rodriguez, E.; Pollard, B. The measurement capabilities of wide-swath ocean altimeters. In Proceedings of the High-resolution Ocean Topography Science Working Group (HOTSWG) Meeting Proceeding, Washington, DC, USA, April 2001; pp. 190–215. [Google Scholar]
- Dibarboure, G.; Ubelmann, C. Investigating the Performance of Four Empirical Cross-Calibration Methods for the Proposed SWOT Mission. Remote Sens. 2014, 6, 4831–4869. [Google Scholar] [CrossRef]
- Dibarboure, G.; Ubelmann, C.; Flamant, B.; Briol, F.; Peral, E.; Bracher, G.; Vergara, O.; Faugère, Y.; Soulat, F.; Picot, N. Data-Driven Calibration Algorithm and Pre-Launch Performance Simulations for the SWOT Mission. Remote Sens. 2022, 14, 6070. [Google Scholar] [CrossRef]
- Ubelmann, C.; Fu, L.; Brown, S.; Peral, E.; Esteban-Fernandez, D. The Effect of Atmospheric Water Vapor Content on the Performance of Future Wide-Swath Ocean Altimetry Measurement. J. Atmos. Ocean. Technol. 2014, 31, 1446–1454. [Google Scholar] [CrossRef]
- Global Ocean Gridded L 4 Sea Surface Heights and Derived Variables Reprocessed 1993 Ongoing; E.U. Copernicus Marine Service Information (CMEMS); Marine Data Store (MDS): Ramonville-Saint-Agne, France, 2023. [CrossRef]
- Nencioli, F.; Prandi, P.; Cadier, E.; Raynal, M.; Ubelmann, C.; Dibarboure, G. Assessment of SWOT KaRIn spectral error requirements during the 1-day repeat orbit. In preparation.
- Ballarotta, M.; Ubelmann, C.; Pujol, M.-I.; Taburet, G.; Fournier, F.; Legeais, J.-F.; Faugère, Y.; Delepoulle, A.; Chelton, D.; Dibarboure, G.; et al. On the resolutions of ocean altimetry maps. Ocean Sci. 2019, 15, 1091–1109. [Google Scholar] [CrossRef]
- Product Description Document. Available online: https://archive.podaac.earthdata.nasa.gov/podaac-ops-cumulus-docs/web-misc/swot_mission_docs/pdd/D-56411_SWOT_Product_Description_L2_HR_PIXC_20231026_RevBcite.pdf (accessed on 5 June 2024).
- Algorithm Theoretical Basis Document. Available online: https://archive.podaac.earthdata.nasa.gov/podaac-ops-cumulus-docs/web-misc/swot_mission_docs/atbd/D-105504_SWOT_ATBD_L2_HR_PIXC_20230713a_cite.pdf (accessed on 5 June 2024).
- Wang, J.; Pottier, C.; Cazals, C.; Battude, M.; Sheng, Y.; Song, C.; Sikder, M.S.; Yang, X.; Ke, L.; Gosset, M.; et al. The Surface Water and Ocean Topography Mission (SWOT) Prior Lake Database (PLD): Lake Mask and Operational Auxiliaries; Authorea: Hoboken, NJ, USA, 14 December 2023. [Google Scholar]
- Science Requirements Document. Available online: https://swot.jpl.nasa.gov/system/documents/files/2176_2176_D-61923_SRD_Rev_B_20181113.pdf (accessed on 5 June 2024).
- Bergé-Nguyen, M.; Crétaux, J.F.; Calmant, S.; Fleury, S.; Satylkanov, R.; Chontoev, D.; Bonnefond, P. Mapping mean lake surface from satellite altimetry and GPS kinematic surveys. Adv. Space Res. 2021, 67, 985–1001. [Google Scholar] [CrossRef]
- Product Description Document. Available online: https://archive.podaac.earthdata.nasa.gov/podaac-ops-cumulus-docs/web-misc/swot_mission_docs/pdd/SWOT-TN-CDM-0673-CNES_Product_Description_L2_HR_LakeSP_20231208_RevB_signed.pdf (accessed on 5 June 2024).
- Algorithm Theoretical Basis Document. Available online: https://archive.podaac.earthdata.nasa.gov/podaac-ops-cumulus-docs/web-misc/swot_mission_docs/atbd/SWOT-NT-CDM-1753-CNES_ATBD_LakeSP_20230726_Initial_w-sigs.pdf (accessed on 5 June 2024).
- Febvre, Q.; Fablet, R.; Le Sommer, J.; Ubelmann, C. Joint calibration and mapping of satellite altimetry data using trainable variational models. In Proceedings of the ICASSP 2022—2022 IEEE International Conference on Acoustics, Speech and Signal Processing (ICASSP), Singapore, 23–27 May 2022; IEEE: Piscataway, NJ, USA, 2022; pp. 1536–1540. [Google Scholar]
Disclaimer/Publisher’s Note: The statements, opinions and data contained in all publications are solely those of the individual author(s) and contributor(s) and not of MDPI and/or the editor(s). MDPI and/or the editor(s) disclaim responsibility for any injury to people or property resulting from any ideas, methods, instructions or products referred to in the content. |
© 2024 by the authors. Licensee MDPI, Basel, Switzerland. This article is an open access article distributed under the terms and conditions of the Creative Commons Attribution (CC BY) license (https://creativecommons.org/licenses/by/4.0/).