Article

Classification and Mapping of Fuels in Mediterranean Forest Landscapes Using a UAV-LiDAR System and Integration Possibilities with Handheld Mobile Laser Scanner Systems

by
Raúl Hoffrén
1,2,
María Teresa Lamelas
2,3,* and
Juan de la Riva
1,2
1
Department of Geography and Land Management, University of Zaragoza, Calle Pedro Cerbuna 12, 50009 Zaragoza, Spain
2
Geoforest Group, University Institute for Research in Environmental Sciences of Aragón (IUCA), University of Zaragoza, Calle Pedro Cerbuna 12, 50009 Zaragoza, Spain
3
Centro Universitario de la Defensa, Academia General Militar, Ctra. Huesca s/n, 50090 Zaragoza, Spain
*
Author to whom correspondence should be addressed.
Remote Sens. 2024, 16(18), 3536; https://doi.org/10.3390/rs16183536
Submission received: 18 June 2024 / Revised: 16 September 2024 / Accepted: 20 September 2024 / Published: 23 September 2024
(This article belongs to the Section Environmental Remote Sensing)

Abstract

:
In this study, we evaluated the capability of an unmanned aerial vehicle with a LiDAR sensor (UAV-LiDAR) to classify and map fuel types based on the Prometheus classification in Mediterranean environments. UAV data were collected across 73 forest plots located in NE of Spain. Furthermore, data collected from a handheld mobile laser scanner system (HMLS) in 43 out of the 73 plots were used to assess the extent of improvement in fuel identification resulting from the fusion of UAV and HMLS data. UAV three-dimensional point clouds (average density: 452 points/m2) allowed the generation of LiDAR metrics and indices related to vegetation structure. Additionally, voxels of 5 cm3 derived from HMLS three-dimensional point clouds (average density: 63,148 points/m2) facilitated the calculation of fuel volume at each Prometheus fuel type height stratum (0.60, 2, and 4 m). Two different models based on three machine learning techniques (Random Forest, Linear Support Vector Machine, and Radial Support Vector Machine) were employed to classify the fuel types: one including only UAV variables and the other incorporating HMLS volume data. The most relevant UAV variables introduced into the classification models, according to Dunn’s test, were the 99th and 10th percentile of the vegetation heights, the standard deviation of the heights, the total returns above 4 m, and the LiDAR Height Diversity Index (LHDI). The best classification using only UAV data was achieved with Random Forest (overall accuracy = 81.28%), with confusion mainly found between similar shrub and tree fuel types. The integration of fuel volume from HMLS data yielded a substantial improvement, especially in Random Forest (overall accuracy = 95.05%). The mapping of the UAV model correctly estimated the fuel types in the total area of 55 plots and at least part of the area of 59 plots. These results confirm that UAV-LiDAR systems are valid and operational tools for forest fuel classification and mapping and show how fusion with HMLS data refines the identification of fuel types, contributing to more effective management of forest ecosystems.

1. Introduction

Wildfires are an inherent disturbance of forest ecosystems, yet various factors are contributing to an increase in their frequency and intensity [1,2,3]. Some causes of this alteration are attributed to climate change [4,5], land use changes [6], reforestation policies [7,8], and urban growth in the wildland–urban interface [9]. As a consequence, forests are more exposed to the negative processes of recurrent and extreme wildfires, beyond the deterioration or loss of vegetation cover by fire, such as soil degradation [10] and biodiversity loss [11,12,13], also leading to an increase in carbon emissions into the atmosphere [14,15].
Mediterranean environments are particularly prone to wildfires due to the characteristics of climate and vegetation [16]. Moreover, the exposure of these regions to extreme wildfires is projected to increase in the future [17,18,19], heightening the vulnerability of these valuable ecosystems. A key mechanism for preventing and mitigating wildfires is understanding the spatial distribution of forest fuels, which constitute all living or dead matter available in forest landscapes for combustion. The characterization of fuels helps to predict fire rate of spread, fireline intensity, and propagation axes across heterogeneous forest landscapes during hypothetical fire scenarios, enabling fuel mapping across large areas [20,21,22]. Given that the structural complexity of forest fuels often makes their identification a complex task [23], several fuel classifications have been developed in the last decades. For Mediterranean environments, the Prometheus fuel classification [24] uses indicators/thresholds of vegetation height and percentage cover of shrubs and trees to classify fuels according to the type, height, and density of the main element of propagation (grass, shrub, or leaf litter). It comprises seven fuel types (FTs): FT1 for grass fuels; FT2, FT3, and FT4 for shrub fuels (low, medium, and high, respectively); and FT5, FT6, and FT7 for tree fuels (without understory, with non-continuous understory to canopy, and with continuous understory to canopy, respectively). Remote sensing has been extensively employed for the identification of forest fuels and, specifically, LiDAR (Light Detection and Ranging) systems, thanks to the ability of laser pulses to work their way through the canopy and interact at different heights with the vegetation cover, enabling the representation of forests’ three-dimensional structure. LiDAR sensors can be mounted on different platforms. For instance, NASA’s Global Ecosystem Dynamics Investigation system onboard the International Space Station allows for characterizing fuels across vast areas [25,26] and can be coupled with multispectral imagery to enhance fuel classification [27]. On the other hand, airborne laser scanner (ALS) systems facilitate the identification of fuels at regional scales with high spatial resolution, integrating multispectral indices [28,29] and hyperspectral images [30].
In recent years, proximal remote sensing platforms, such as unmanned aerial vehicles (UAVs) and ground-based laser scanner systems, have become highly promising technologies for fuel identification and classification in heterogeneous environments. One of the primary advantages of the joint use of UAVs and ground-based systems is the ability of the latter to collect data without the constraints of drone flights, as long as there is real accessibility to the forest stand and with very high spatial resolutions [23]. UAVs have demonstrated their effectiveness even when equipped with photogrammetric sensors, such as visible or multispectral cameras, instead of LiDAR. In this respect, Shin et al. (2018) [31] found that photogrammetric UAVs can efficiently estimate canopy cover and canopy height in conifer forest stands. Hoffrén et al. (2023) [32] successfully classified the Prometheus fuel types in almost the same study area as in this study by combining very high-density three-dimensional point clouds with multispectral images and textural data from a photogrammetric UAV. However, in this study, the authors noticed very discrete classification rates when classifying the Prometheus fuel types FT3 and FT6. This limitation could be attributed to the inability of photogrammetric UAVs to capture data below the upper canopy. In this regard, Hillman et al. (2021) [33] demonstrated that UAVs with LiDAR sensors are better able to describe the entire vertical structure of vegetation below canopies than photogrammetric UAVs in a dry sclerophyll forest in Australia. Additionally, they noted very similar estimates of canopy and sub-canopy cover in both UAV-LiDAR and ground-based systems. Conversely, findings from Hyyppä et al. (2020) [34] suggest that ground-based systems provide better results for collecting tree-level structural data than above-canopy UAV-LiDAR systems. Consequently, the capacity of UAV-LiDAR systems to characterize fuels below canopies may be compromised by the penetration capabilities of the laser pulses into the canopy and the maximum number of returns that the sensor is able to record in a single pulse. Identifying the shrubland is very important since it is usually the place through which fires are mainly spread. Ground-based systems can address this challenge since they operate at ground level with an extremely high-density scanning rate, enabling a more precise characterization of understory fuels. Indeed, these systems have been successfully utilized by Chen et al. (2016) [35] to identify all vertical fuel layers in a forest stand and by Wilson et al. (2022) [36] to evaluate the impact of fuel structure on wildfire severity. However, despite these favorable findings, data collection with ground-based systems may pose operational challenges in terms of time and cost [37], particularly when compared to the relatively shorter time periods required for data collection with UAVs.
In this context, considering the demonstrated efficacy of UAVs and LiDAR remote sensing in identifying forest fuels, both individually and in combination, in this study, we aim to assess the capability of a UAV-LiDAR system for the identification of the Prometheus fuel types in Mediterranean forest stands and their classification using modeling techniques based on machine learning for the subsequent fuel mapping across larger areas. In this study, we focus primarily on shrub and tree understory fuels. The initial hypothesis is that the capacity of UAV-LiDAR systems to characterize vegetation and fuel structure enables the classification of the Prometheus fuel types with high levels of accuracy. Furthermore, recognizing the uncertainty surrounding UAV-LiDAR systems’ ability to identify fuels below canopies, in this study, we also utilize data collected in a previous work [38] employing a ground-based handheld mobile laser scanning (HMLS) system. In this context, the secondary objective is to assess the extent of improvement in fuel identification resulting from the integration of UAV-collected data with HMLS data, especially shrub fuels, to better differentiate between shrub and tree understory fuel types. The hypothesis is that HMLS systems have the potential to mitigate classification errors that occur between fuel types with high structural heterogeneity, particularly in the middle and lower strata. Ultimately, in this work, we aim to underscore the utility of UAV-LiDAR systems and their potential synergy with ground-based laser scanner systems to improve forest management practices related to forest fuels and, thus, mitigate the negative impacts of wildfires on the ecosystem.

2. Materials and Methods

2.1. Study Area

The study area was located in five sectors within the Autonomous Community of Aragón (NE of Spain): Almudévar, Ayerbe, Uncastillo, Villarluengo, and Zuera. UAV data were collected across 73 forest plots of 15 m circular radius, except for one plot of 10 m radius due to terrain constraints (a comprehensive description of the forest plots is available in Table S1 of the Supplementary Materials). HMLS data were obtained in 43 out of the 73 forest plots in the context of a previous work (for further details, see Hoffrén et al., 2024 [38]). The center of each plot was determined using a Leica Viva® GS15 CS10 GNSS Real-Time Kinematic (RTK) Global Positioning System with sub-meter accuracy. To form the ground-truth for the classification models, the fuel type of each plot was estimated by visual analyses in the field and validated with the processed HMLS point cloud in the plots where HMLS data were collected [38]. The number of plots for each fuel type is shown in Table 1. Note that, in this work, FT1 (grass fuel) was not considered as the study focuses on shrubs and tree understory fuel types. Figure 1 shows six study plots in frontal view using the UAV’s colored point cloud, each with a different fuel type.
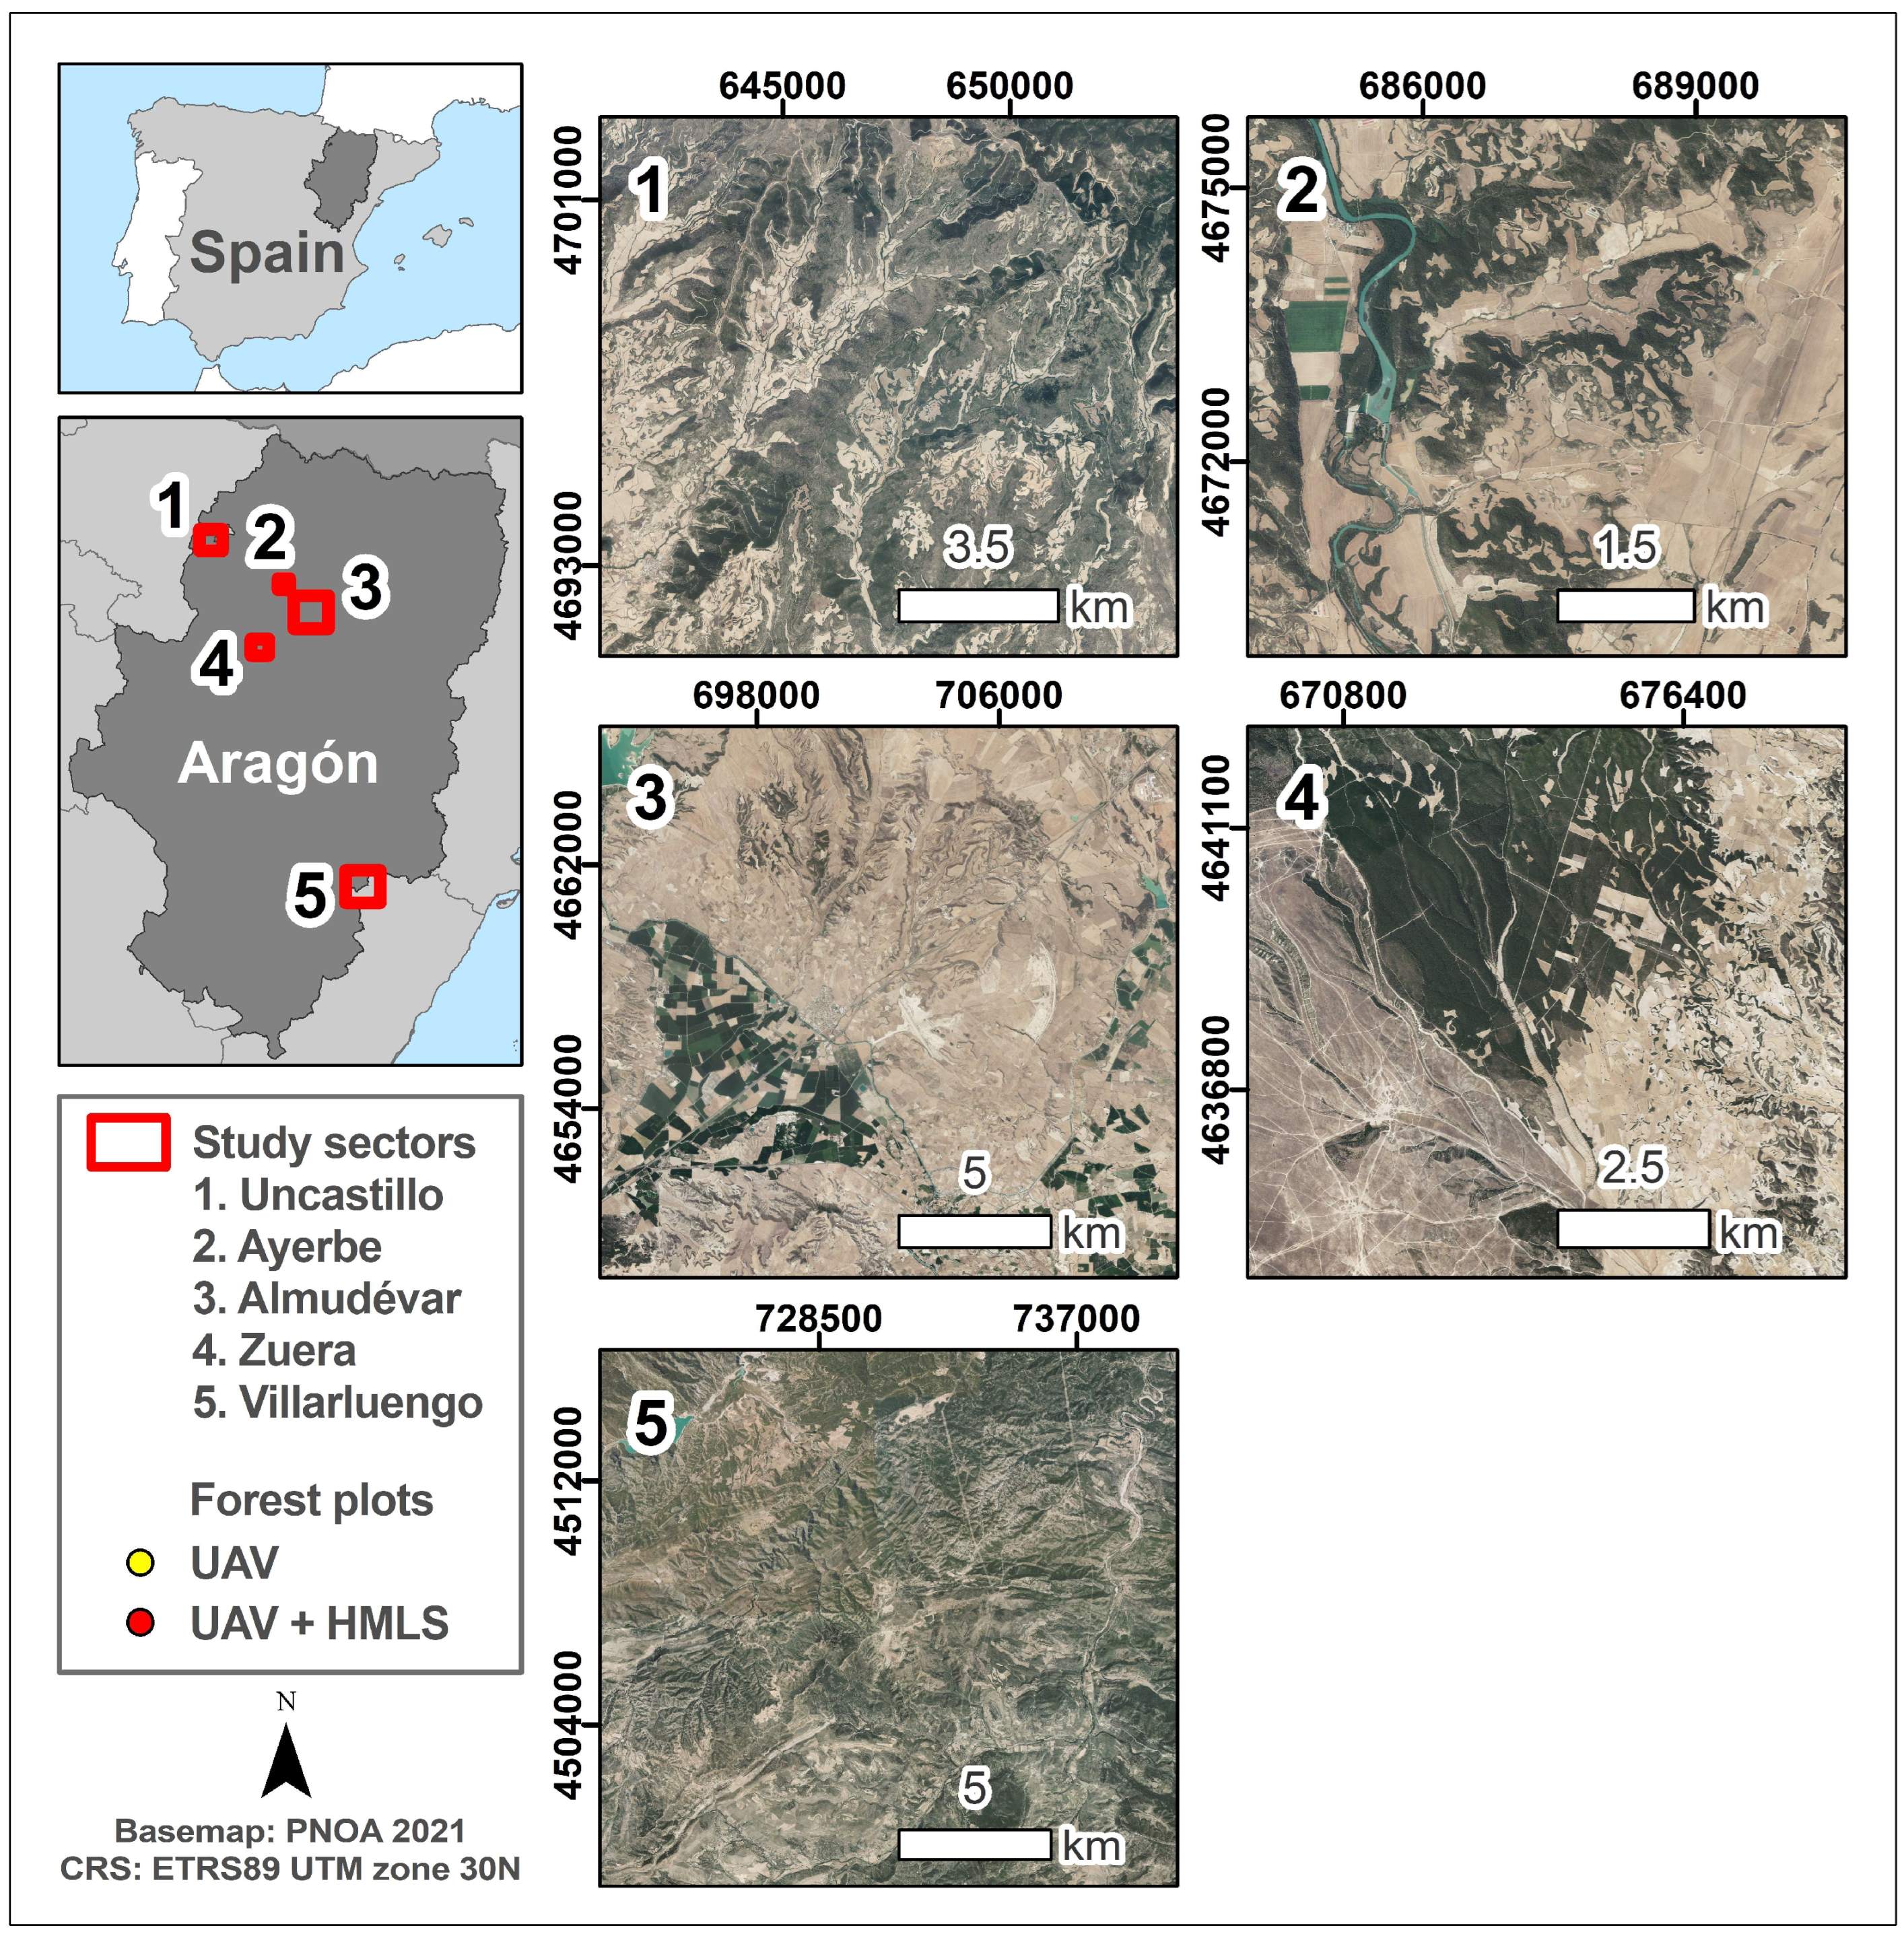
All sectors experience a predominant Mediterranean climate with continental influence (Figure 2). The sectors of Almudévar, Ayerbe, and Zuera are situated in the Central Ebro Valley, characterized by substantial daily and annual temperature fluctuations, featuring hot summers, cold winters, and scarce rainfall throughout the year (less than 500 mm/year). The sector of Uncastillo, located to the north of the Central Ebro Valley in the foothills of the Pre-Pyrenees, experiences less pronounced temperature variations compared to the aforementioned sectors, although they are still high, and average annual rainfall is somewhat higher (~700 mm/year). The sector of Villarluengo, placed in the southernmost part of Aragón within the Iberian mountain range, also experiences pronounced daily and annual temperature fluctuations. However, its highest mean altitude results in cooler summers than those observed in the Central Ebro Valley, albeit winters are colder. The average annual precipitation is somewhat higher (~800 mm/year), with a high possibility of winter snowfall. Convective storms are frequent in this sector, often accompanied by lighting due to its proximity to the Mediterranean Sea and the convergence of prevailing winds [39]. All forest plots are predominantly characterized by Mediterranean-type vegetation, well adapted to the climatic conditions. The most representative forest types within the plots include Aleppo pine (Pinus halepensis Mill.) and bog pine (Pinus nigra Mill.) forests, mixed with understory vegetation dominated by boxwood (Buxus sempervirens), junipers (Juniperus oxycedrus), oaks (Quercus coccifera, Quercus faginea, and Quercus ilex subsp. rotundifolia), rosemary (Rosmarinus officinalis), and thyme (Thymus vulgaris) [40].

2.2. LiDAR Data Collection and Processing

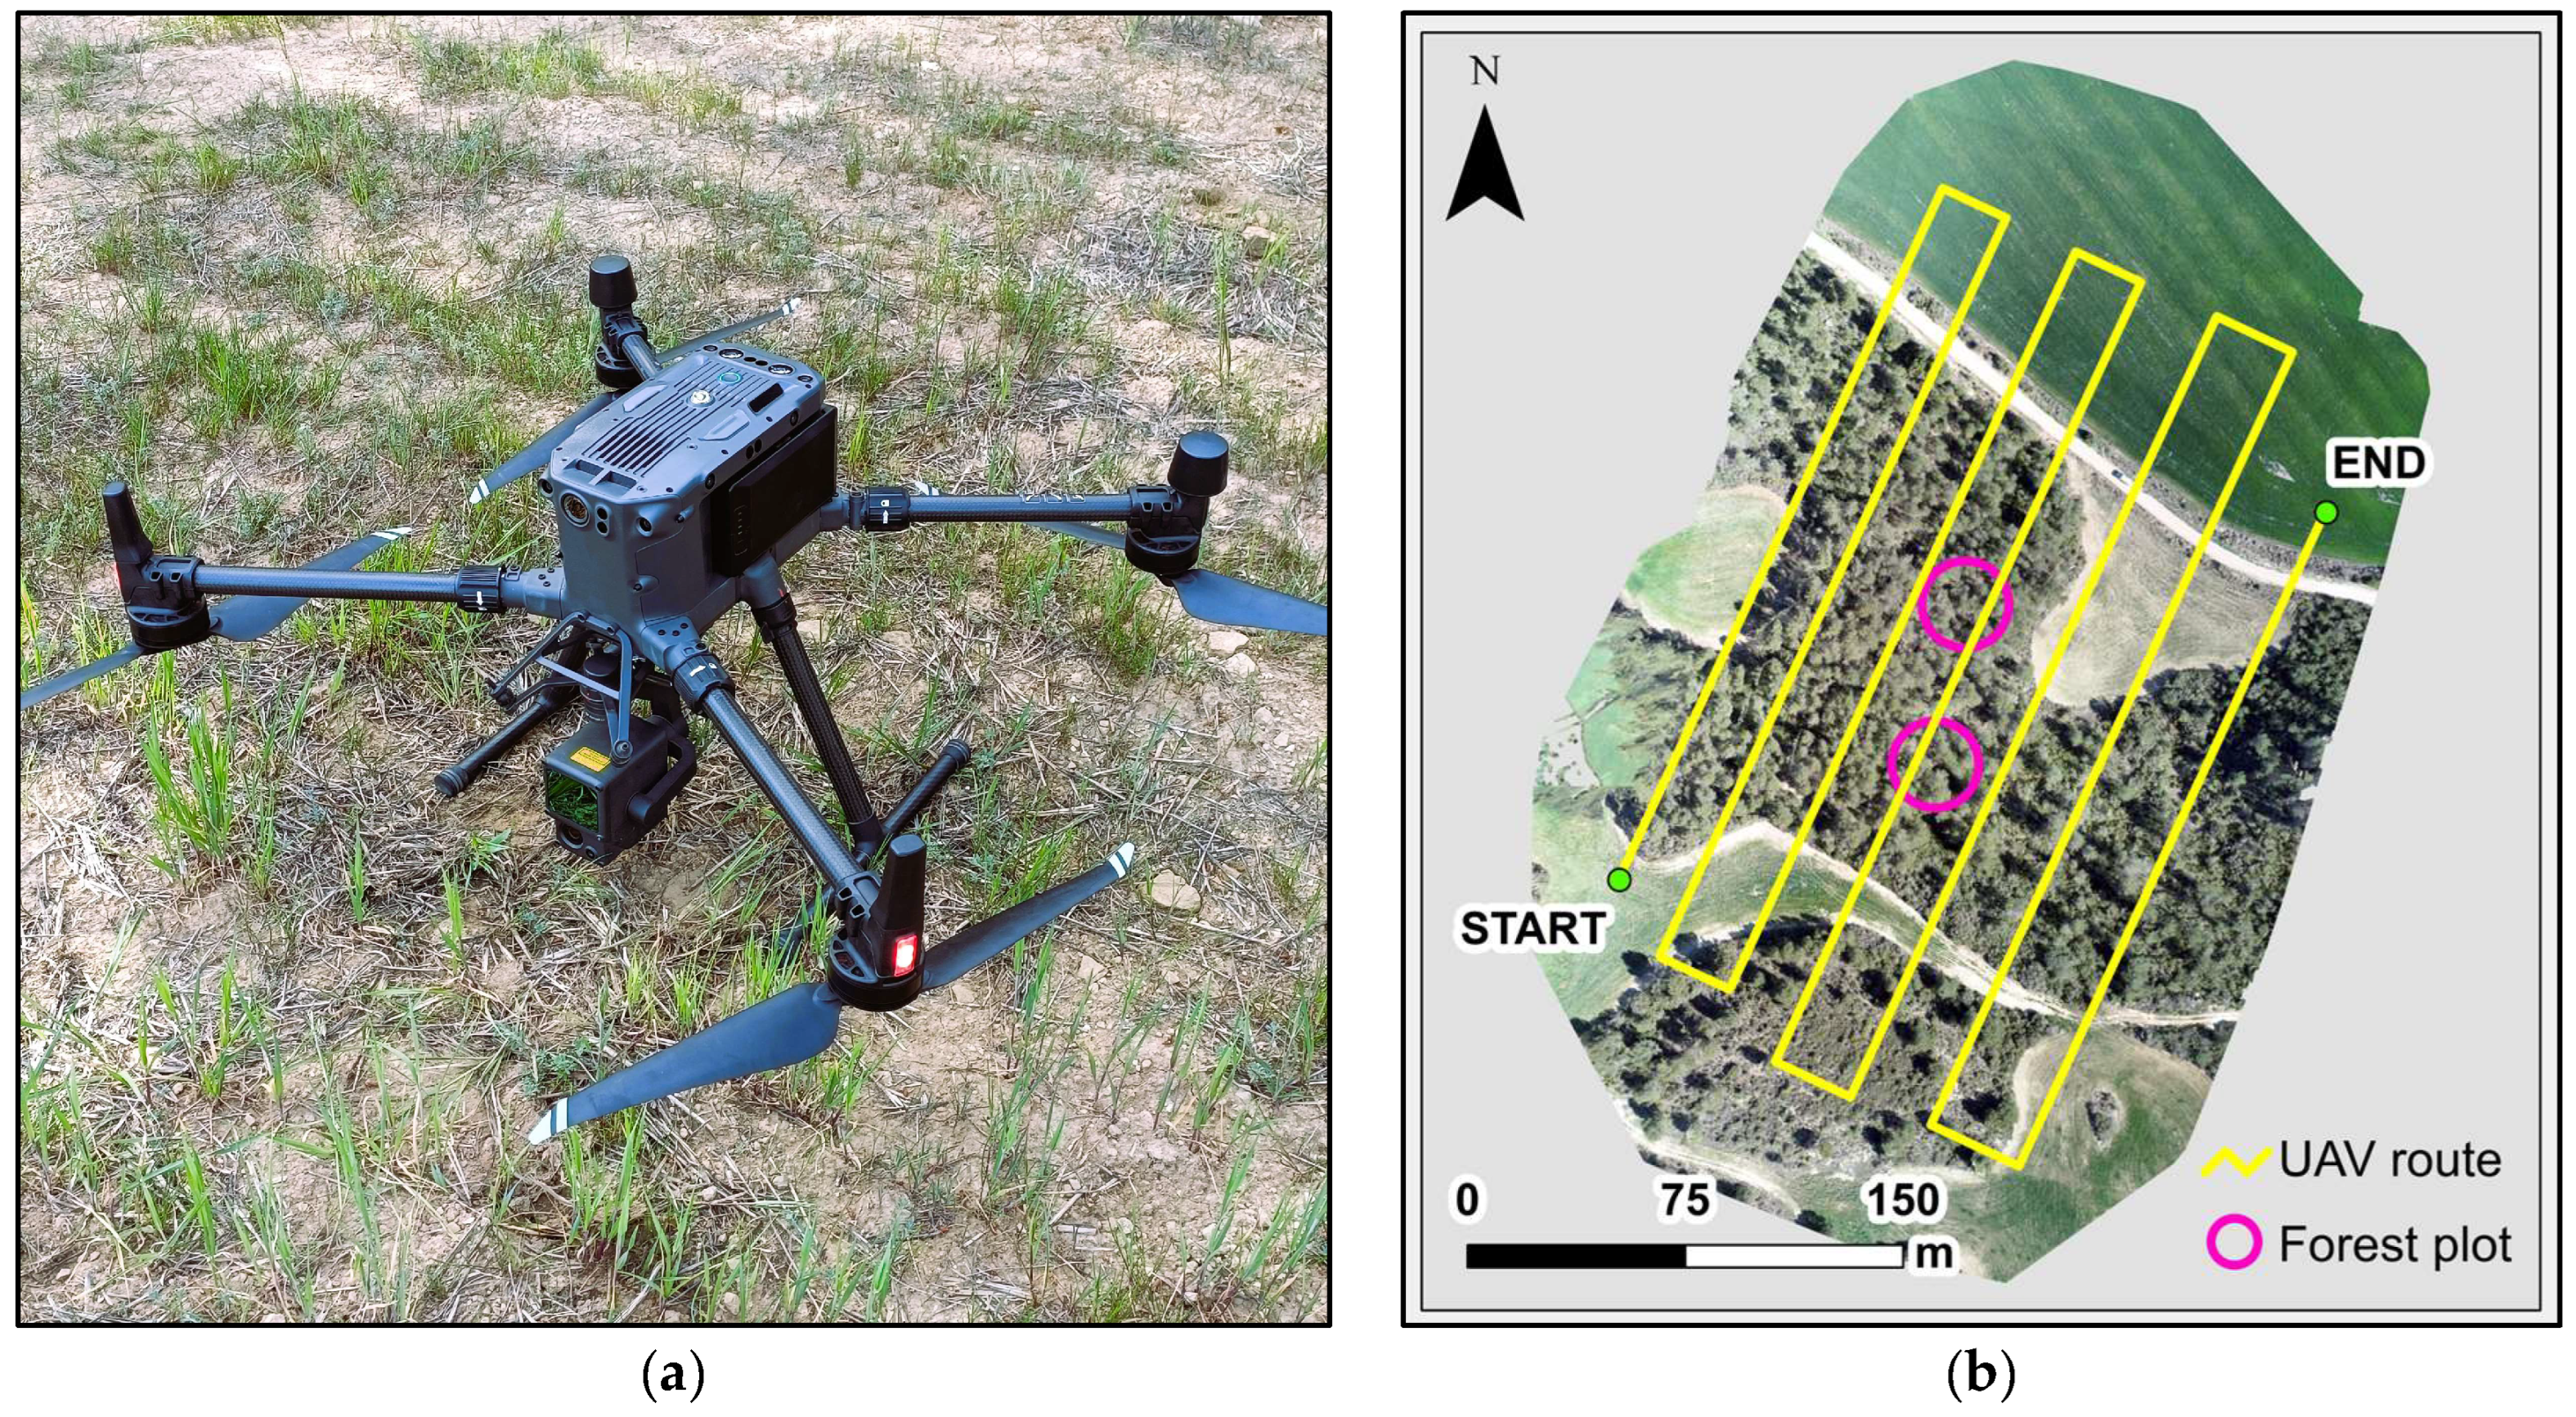
The primary instrument utilized to collect data in the 73 plots was a quadcopter DJI Matrice 300 RTK UAV unit (DJI, Shenzhen, China) equipped with a DJI Zenmuse L1 LiDAR sensor (Figure 3a). Additionally, data were collected in 43 out of the 73 plots with a GeoSLAM ZEB-Horizon HMLS system (GeoSLAM, Ruddington, UK) at the end of May 2023 as part of the study developed by Hoffrén et al. (2024) [38]. A comprehensive description of HMLS data acquisition and processing methods can be found in Hoffrén et al. (2024) [38].
UAV data were acquired in several field campaigns performed between March and May 2023. The UAV flights over the plots were automated using the DJI Pilot 2 application. A flight altitude of 100 m above ground level was established based on 1 m resolution Digital Elevation Models (DEMs) derived from ALS-LiDAR data from the 2nd coverage of the Spanish National Orthophotography Project (PNOA, 2024: https://pnoa.ign.es/web/portal/pnoa-lidar/, accessed on 13 June 2024). A serpentine mapping pattern was utilized with an 80% overlap between scans in both cross-track and along-track directions, along with a zenith angle of incidence and a flight speed of 7 m/s. An illustrative example of the UAV flight scheme over the plots is presented in Figure 3b. The LiDAR sensor on the UAV operated at a scanning rate of 240,000 points per second, allowing for up to 3 returns in a single laser pulse. These scans facilitated the generation of very high-density three-dimensional point clouds, with an average density of 452 points/m2 (further details are available in Table S1 of the Supplementary Materials). The UAV was equipped with an RTK system, enabling the georeferencing of data in real-time without the necessity for ground control points in the field. The RTK system allows the UAV’s global navigation system to connect via the Internet to the Geodetic Reference Stations of the Spanish National Geographic Institute and, in cases where coverage was deficient, to the UAV’s RTK total station, providing differential corrections for the average positioning error of GNSS satellites and thus ensuring sub-meter accuracies.
The UAV scans underwent initial preprocessing using DJI Terra v.3.6.7 proprietary software. The data were converted into LAS files and georeferenced to the local reference system (EPSG: 25830–ETRS89/UTM zone 30N) for XY coordinates and to the EGM-96 geoidal model for Z coordinates. Subsequently, point clouds from the LAS files were categorized into ground and non-ground points. To achieve this, the Multiscale Curvature Classification algorithm was employed utilizing the MCC-LiDAR v.2.1 command line tool [41], following the parameters established by Montealegre et al. (2015) [42]. Points classified as ground were utilized to create DEMs with a 0.20 m spatial resolution using the TIN-to-raster interpolation method [43]. To accomplish this, the rasterize terrain function from the “lidR” package [44,45] for R environment [46] was employed. The heights of the point clouds were normalized with respect to ground level using the previously created DEMs through the normalize heights function from the “lidR” package. Lastly, metrics related to fuel structure and diversity indices were extracted at the plot scale. To mitigate uncertainty in Z coordinates, points below 5 cm in height were excluded from subsequent analyses to prevent the inclusion of data potentially associated with the ground rather than vegetation, as a vertical accuracy of 1.5 cm + 1 ppm is reported by the UAV manufacturer (https://enterprise.dji.com/es/matrice-300/specs, last accessed on 13 June 2024). Three types of structural metrics were generated utilizing the Cloudmetrics function from FUSION/LDV v.4.21 software [47]: heights distribution (e.g., minimum, mean, and maximum elevation, and elevation at different height percentiles), heights variability (e.g., standard deviation, variance, skewness, kurtosis, and L-moments of heights), and canopy cover density (e.g., percentage of cover within specific height intervals of the Prometheus fuel classification: below 0.60 m, 0.60–2 m, 2–4 m, and above 4 m). In addition to structural metrics, three forest diversity indices were computed: the LiDAR Height Diversity Index (LHDI) (Equation (1)), which is a modified version of the Shannon–Wiener diversity index (H’); the LiDAR Evenness Diversity Index (LHEI) (Equation (2)), which adapts the Pielou’s evenness index; and the rumple index, defined as the ratio between the Canopy Surface Model (CSM) and ground area (Equation (3)). Both LHDI and LHEI were initially introduced by Listopad et al. (2015) [48] and, for their computation, the proportion of returns within each height interval of the Prometheus fuel classification was estimated according to Domingo et al. (2020) [29] using the Cloudmetrics function from FUSION/LDV software. For the rumple index, CSMs and ground area were calculated using the Canopymodel and Surfacestats functions from FUSION/LDV software, with a pixel resolution of 0.50 m and a 3 × 3 smoothing algorithm, accounting for the density of the UAV point cloud. Rumple index was also calculated for each height interval of the Prometheus fuel classification and additionally for the entire forest canopy structure within each plot.
L H D I = [ P h × ln P h ]
L H E I = L H D I l n ( P h )
R u m p l e   i n d e x = 3 D   c a n o p y   s u r f a c e   a r e a g r o u n d   a r e a
where P is the proportion of returns at the defined Prometheus classification intervals ( h ).

2.3. Variables Selection and Classification of Prometheus Fuel Types

The Prometheus fuel types were classified using machine learning classification algorithms. Specifically, three non-parametric classification models were evaluated: Random Forest (RF), Linear Support Vector Machine (SVM-L), and Radial Support Vector Machine (SVM-R). This will provide insight into the most suitable classification technique for the classification of the Prometheus fuel types using UAV-LiDAR in combination with HMLS systems, as to date, there is no evidence of a preponderant technique [29,32,49,50].
A preliminary selection of variables was conducted to identify the most relevant ones for inclusion in the classification models. This selection process utilized the post hoc non-parametric Dunn’s test for multiple comparisons [51], which is similar to the Kruskal–Wallis test but provides the ability to pinpoint precisely which groups (i.e., pairs of fuel types: FT2–FT3, FT2–FT4, etc.) differ from each other (Dunn’s test, p ≤ 0.05). The principle of parsimony was also followed in the final selection of variables so that the most relevant of the four types of metrics and variables generated (i.e., height distribution, height variability, canopy cover density, and diversity indices) were included. Subsequently, the classification models were performed using the “caret” package [52] for R. Two different types of models were evaluated: a model incorporating relevant variables derived from the data collected with the UAV in the 73 forest plots and a model that encompasses the relevant UAV variables along with vegetation volume at specific height intervals of the Prometheus classification, extracted from the HMLS-derived voxels in the 43 forest plots [38]. RF models were parametrized by employing between 2 and 10 decision trees at each node. SVM-L and SVM-R models were fitted by adjusting a cost parameter within the range of 1–1000. Following the recommendation by Andersen et al. (2005) [53] for small datasets, model validation was conducted using the k-fold cross-validation method with groups of 10 observations and 10 repeats in each instance. The overall performance of each model was evaluated using the overall accuracy (OA) coefficient. The classification accuracy of each fuel type was estimated using confusion matrices, the Producer’s and User’s accuracy metrics (also known as the “recall” and the “precision”, respectively [54]), and the F-score (F), which combines the Producer’s and User’s accuracy into a single metric to assess the overall performance of the classification for each fuel type.

2.4. Spatialization Mapping of the Prometheus Fuel Types Model

The mapping of the Prometheus fuel types was performed using the most accurate model, exclusively considering the UAV data. This decision was made because UAV data were captured over larger areas both within and outside the forest plots. In contrast, HMLS data were solely recorded within the plots. Fuel mapping was carried out at a spatial resolution of 20 m, deemed suitable due to its similarity to the diameter of the forest plots under study. Furthermore, the spatialization of fuels at higher resolutions may prove impractical for the effective management of forest fuels, which require lower resolution for large-scale mapping [23]. Similarly, fuels tend to be distributed at the scale of forest stands in their fire behavior. The mapped areas corresponded to the designated UAV flight zones, encompassing the locations of the forest plots. To achieve this, the variables introduced into the classification models were generated at a pixel scale of 20 m resolution using the Gridmetrics function from FUSION/LDV software and subsequently mapped using the CSV2Grid function from FUSION/LDV software. Finally, the spatial model was performed using the “predict” function of the terra package [55] for R. Afterwards, for each forest plot, a comparison was made between the observed fuel type (i.e., the ground truth) and those estimated by the model in the mappings. To accomplish this, the spatialized pixels within each plot were extracted and checked to see if the majority of those that were mapped aligned with the observed fuel type.

3. Results

3.1. Classification of Prometheus Fuel Types Using UAV Data

The most relevant variables according to Dunn’s test (p ≤ 0.05) and, consequently, included in the models were the 99th (“Elev. P99”) and 10th (“Elev. P10”) percentile of the point cloud height distribution, the standard deviation of the heights (“Elev. stdev.”), the total returns above 4 m (“All returns > 4 m”), and the LiDAR Height Diversity Index (“LHDI”). The complete results of Dunn’s test are detailed in Table S2 of the Supplementary Materials. The variable “Elev. P99” was among the group of height distribution metrics that distinguished the highest number of pairs of fuel types (up to eight), whereas the variable “Elev. P10” managed to differentiate seven pairs. The variable “Elev. stdev.” was part of the second group of metrics related to height variability that distinguished the most pairs (up to seven), but it was selected due to the improvement its inclusion in the model implied. The variable “All returns > 4 m”, related to the canopy cover density, also distinguished up to seven pairs of Prometheus fuel types, the maximum within this group of metrics. Fewer pairs were differentiated by the vegetation indices, with the “rumple index” distinguishing the most fuel types. However, significant collinearity was found between this variable and “Elev. stdev.”, leading to the selection of the next relevant index, “LHDI”.
Table 2 shows the best performance of the three classification models using the UAV data. The best classification model was RF, reaching an OA of 81.28%. SVM-L and SVM-R achieved OAs of 75.10% and 78.32%, respectively. Table 3 shows the confusion matrix of the best classification model (RF). Confusion matrices of the SVM-L and SVM-R can be found in Tables S3 and S5 of the Supplementary Materials, respectively. In general terms, confusions were observed to primarily occur among similar fuel types, with minimal confusion between types of different dominant strata, i.e., between shrubs (FT2 to FT4) and trees (FT5 to FT7). The lowest hit rates were observed for FT3, which was primarily confused with FT2 and occasionally misclassified as FT5 (resulting in omission errors) and FT7 (both commission and omission errors). Additionally, there was confusion between FT6 and FT7, although hit rates for both types exceeded 70%. FT5 exhibited minor confusion with FT3 and FT7, yet its hit rates surpassed 85%. FT2 and FT4 emerged as the most accurately classified fuel types, boasting hit rates exceeding 90% and no commission errors noted for FT4. Regarding the F-score (Table 4), the highest coefficients were observed in FT4, followed by FT5, while the lowest coefficients were associated with the intermediate shrub (FT3) and tree (FT6) fuel types. Results of the F-score for SVM-L and SVM-R can be found in Tables S4 and S6 of the Supplementary Materials, respectively.

3.2. Classification of Prometheus Fuel Types Combining UAV and HMLS Data

The inclusion of the volume of vegetation from the HMLS voxelized dataset resulted in a substantial enhancement of accuracy across all three classification models (Table 5) and minimized confusion between fuel types (Table 6). Notably, the Prometheus height interval that demonstrated the most significant improvement was the volume between 0.60 and 2 m in height. Integration of this variable boosted the RF model to achieve an OA of 95.05%. Furthermore, there was a notable enhancement of the SVM-R model, achieving an OA of 86.17% and, to a lesser extent, in the SVM-L model, attaining an OA of 81.73%. While the volume at other Prometheus height intervals also contributed to model improvement, its impact was comparatively smaller (Table 5). Confusions between fuel types in the best-performing classification model (RF) were limited to FT2 and FT3 (Table 6). Similarly, the F-score was maximum in all fuel types except for FT2 and FT3 (Table 7), where confounding occurred. However, both types exhibited high performances. In the case of SVM-L and SVM-R models, confusions were observed among other fuel types, yet hit rates and the F-score remained consistently high across all types (Tables S7–S10 of the Supplementary Materials, respectively).

3.3. Mapping of Prometheus Fuel Types

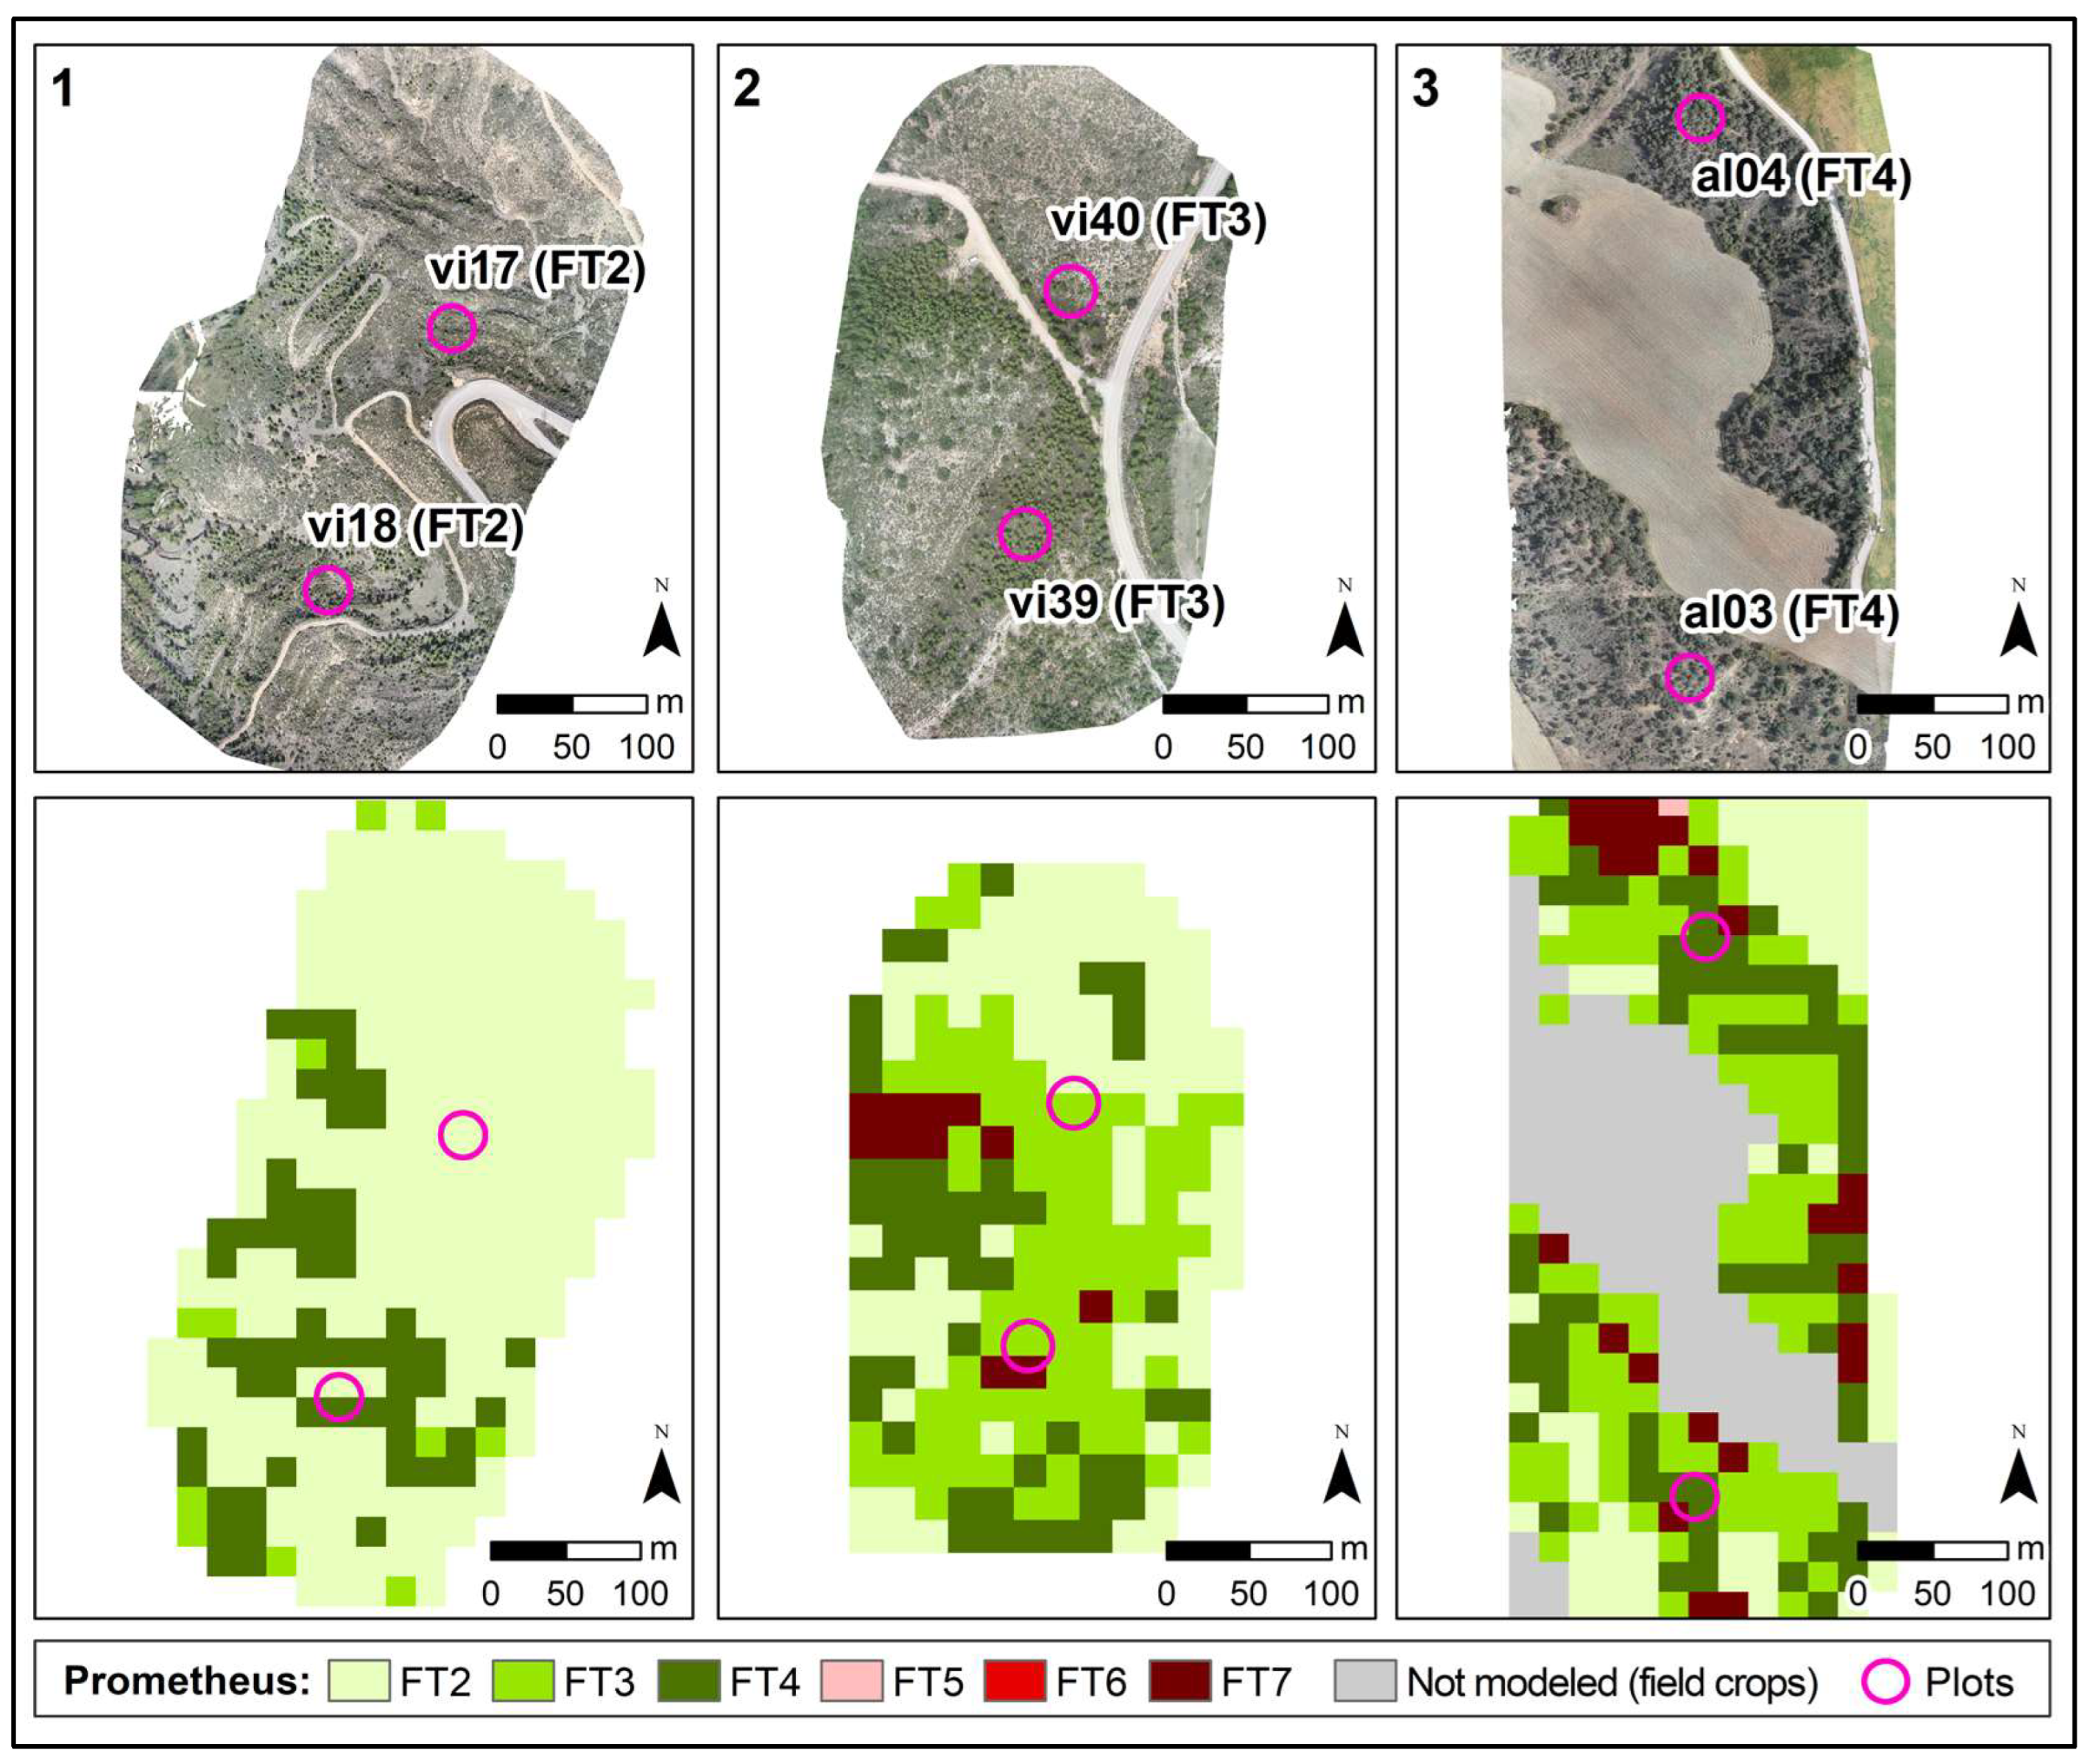
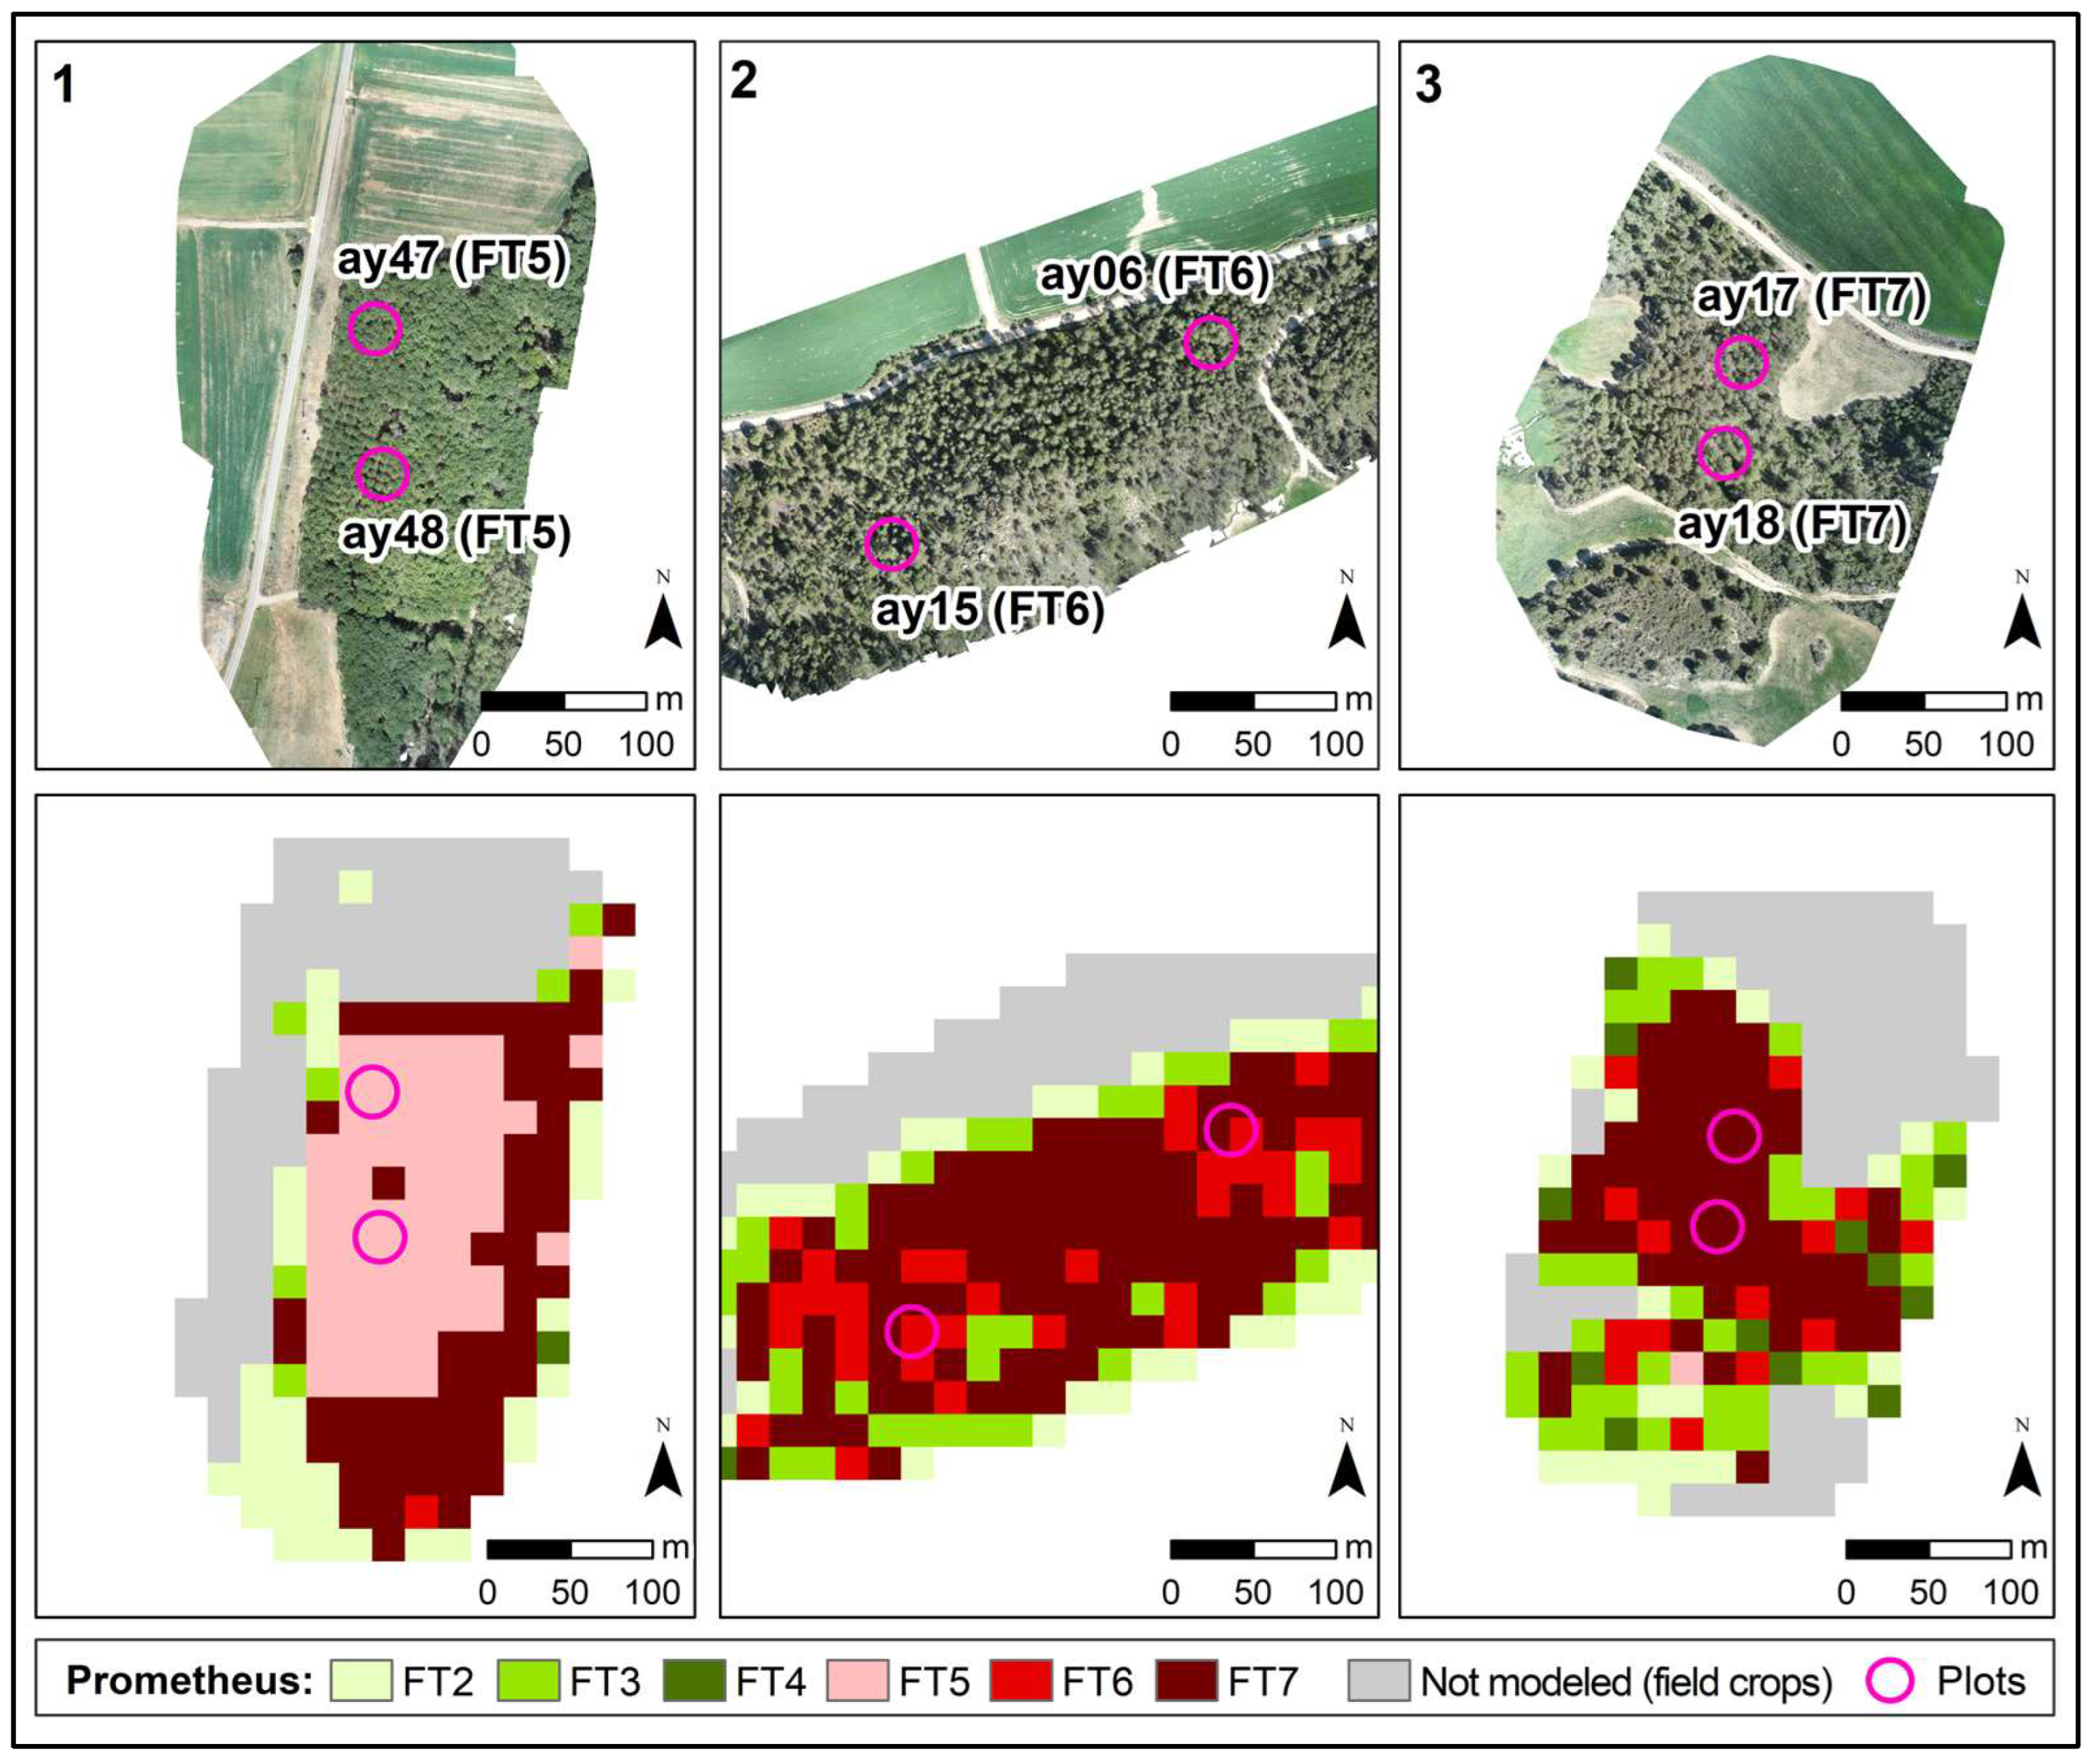
Figure 4 and Figure 5 illustrate the mapping of Prometheus fuel types according to the spatialization of the best classification model of the UAV data (RF). It is important to note that, by disregarding the FT1 fuel type in this study, it is assumed that some pixels classified as FT2 may actually correspond to FT1, as well as roads or bare soil. However, for crop areas, a mask has been applied to exclude the spatialized pixels, as these areas have not been modeled. Each figure presents three different areas, each containing two plots representing the different Prometheus fuel types considered in this study. Additional mapping can be found in Figures S1–S13 of the Supplementary Materials. Fuel types were accurately determined across the entire area of 55 plots (75.34% of the total plots) and in at least part of the area of 59 plots (80.82% of the total plots). Among shrub fuel type plots, FT2 was correctly classified in 8 out of 11 plots (88.89%), with 2 plots classified as FT3 and 1 as FT4. In FT3 plots, the correct fuel type was mapped in 6 out of 7 plots (85.71%), with only 1 plot misclassified as FT4. Additionally, FT4 was accurately mapped in 100% of the plots with this observed type. Regarding tree fuel type plots, 11 out of 14 plots identified as FT5 (78.57%) were spatialized with their correct fuel type, while 3 plots were incorrectly classified as FT7. The highest error rate was observed in FT6 plots, with only 3 out of 12 plots (25%) being accurately spatialized. Furthermore, two additional plots contained some FT6 pixels, albeit not in the majority, resulting in only five plots of this type (41.67%) containing all or part of the pixels with their correct type. Misclassified FT6 plots were consistently categorized as FT7. Finally, 22 out of 24 observed FT7 plots (91.67%) were classified with their correct fuel type, with 100% of these plots containing some FT7 pixels.
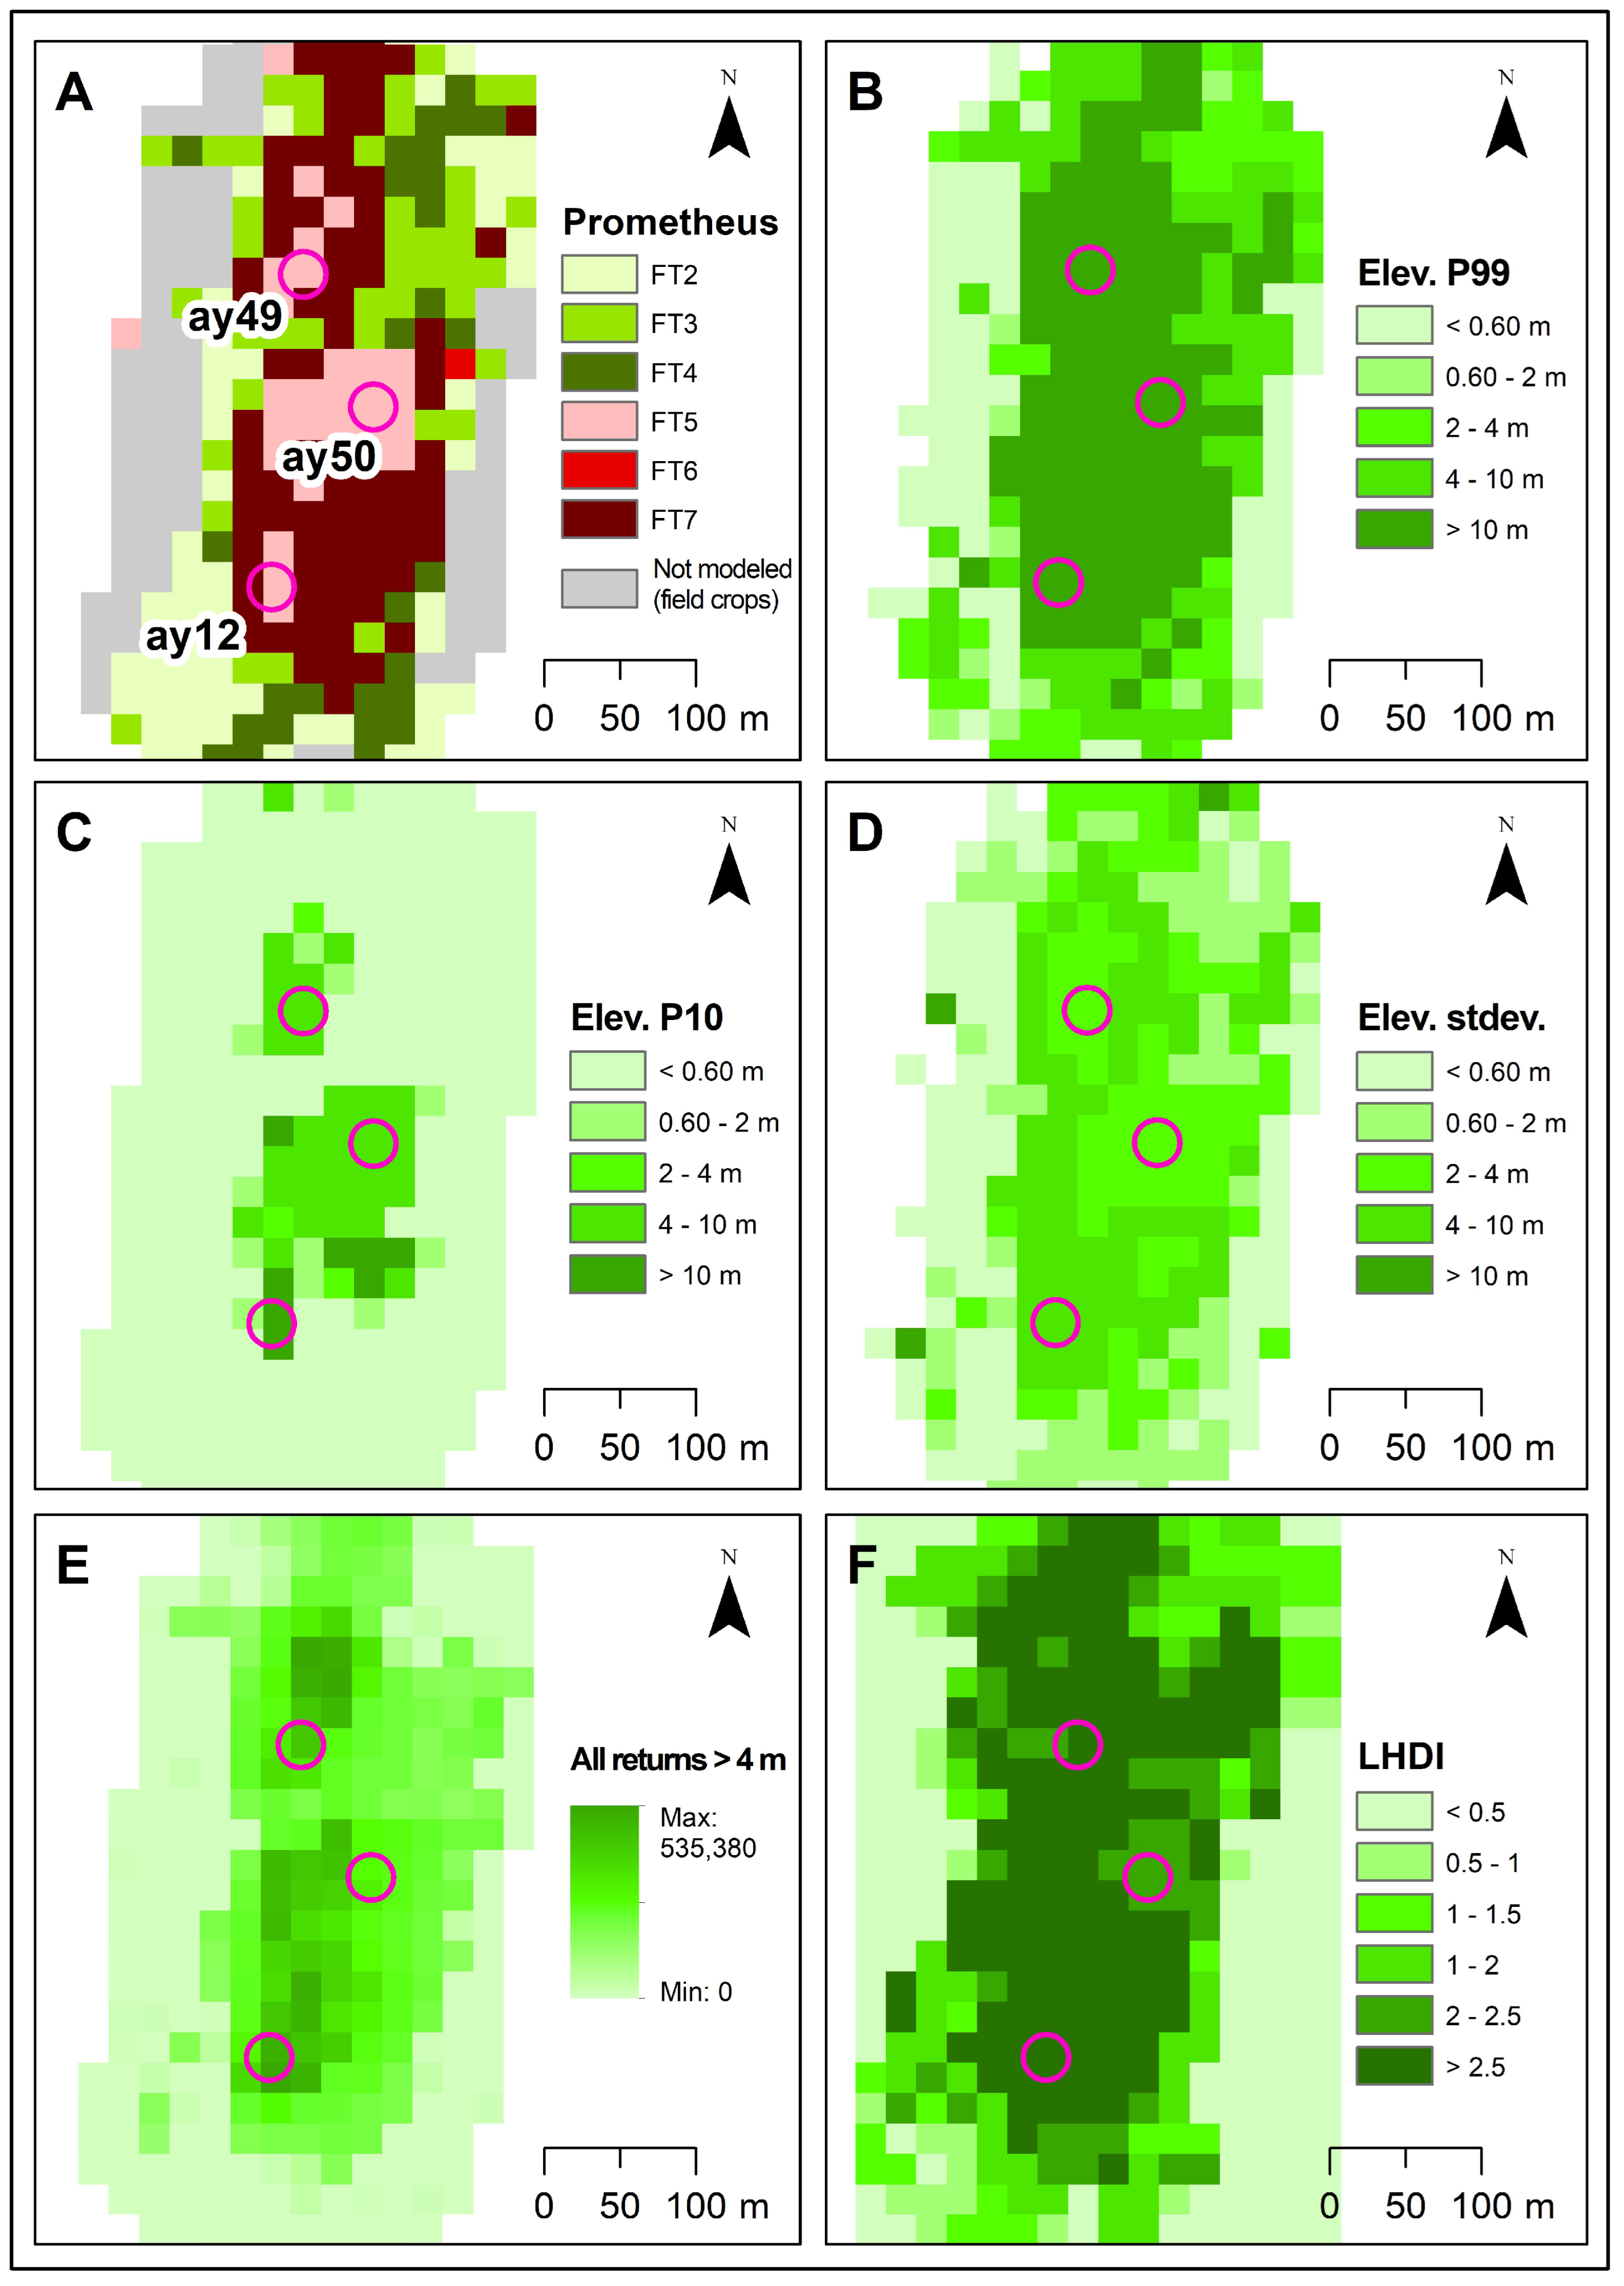
The convergence of various fuel types depicted in the mapping enables showing the structural heterogeneity and mixture of fuels in Mediterranean forests. The observed ground truth represents a generalization of the fuel type across the entire plot, which primarily relies on the predominant cover percentage (i.e., vegetation height and density) within the plots. However, as an example, Figure 6 illustrates the heterogeneity of three forest plots whose assigned ground truth was FT5, showcasing the structural metrics and the diversity index that were introduced into the models. In plot “ay12”, the convergence of FT5 and FT7 is observed, primarily due to variations in vegetation height at the 10th percentile and different canopy cover densities above 4 m within the plot, thus indicating a higher presence of understory in the pixels categorized as FT7. In plot “ay49”, only a small sector is covered by FT7, primarily due to variations in canopy cover density above 4 m compared to the rest of the plot categorized as FT5. Lastly, in plot “ay50”, variations in canopy cover density are again observed, but they do not appear to exert as much influence as seen in the previous cases since the plot exhibits FT5 in its entire area.

4. Discussion

The increasing frequency and intensity of wildfires require the formulation of prevention and mitigation plans to minimize adverse impacts on the territory. Mediterranean environments rank among the most fire-prone ecosystems globally, and the looming threat of climate change may potentially cause certain regions to acquire Mediterranean characteristics in the future, thus increasing the wildfire issue [56]. Mapping of forest fuels helps to understand fire spread and velocity within forested areas, serving as a crucial tool for effective forest management. The findings of this study underscore the efficacy of utilizing UAVs equipped with LiDAR sensors for forest fuel identification, as well as the substantial enhancement in the classification achieved through the integration of UAV and HMLS data, particularly when identifying the understory fuel between 0.60 and 2 m in height. Overall, the spatialization of Prometheus fuel types yielded satisfactory results, albeit encountering some challenges with the FT6 fuel type, thus validating the utility of UAV-LiDAR systems for fuel mapping across extensive areas.

4.1. Adequacy of the Modeled Variables in Identifying the Prometheus Fuel Types

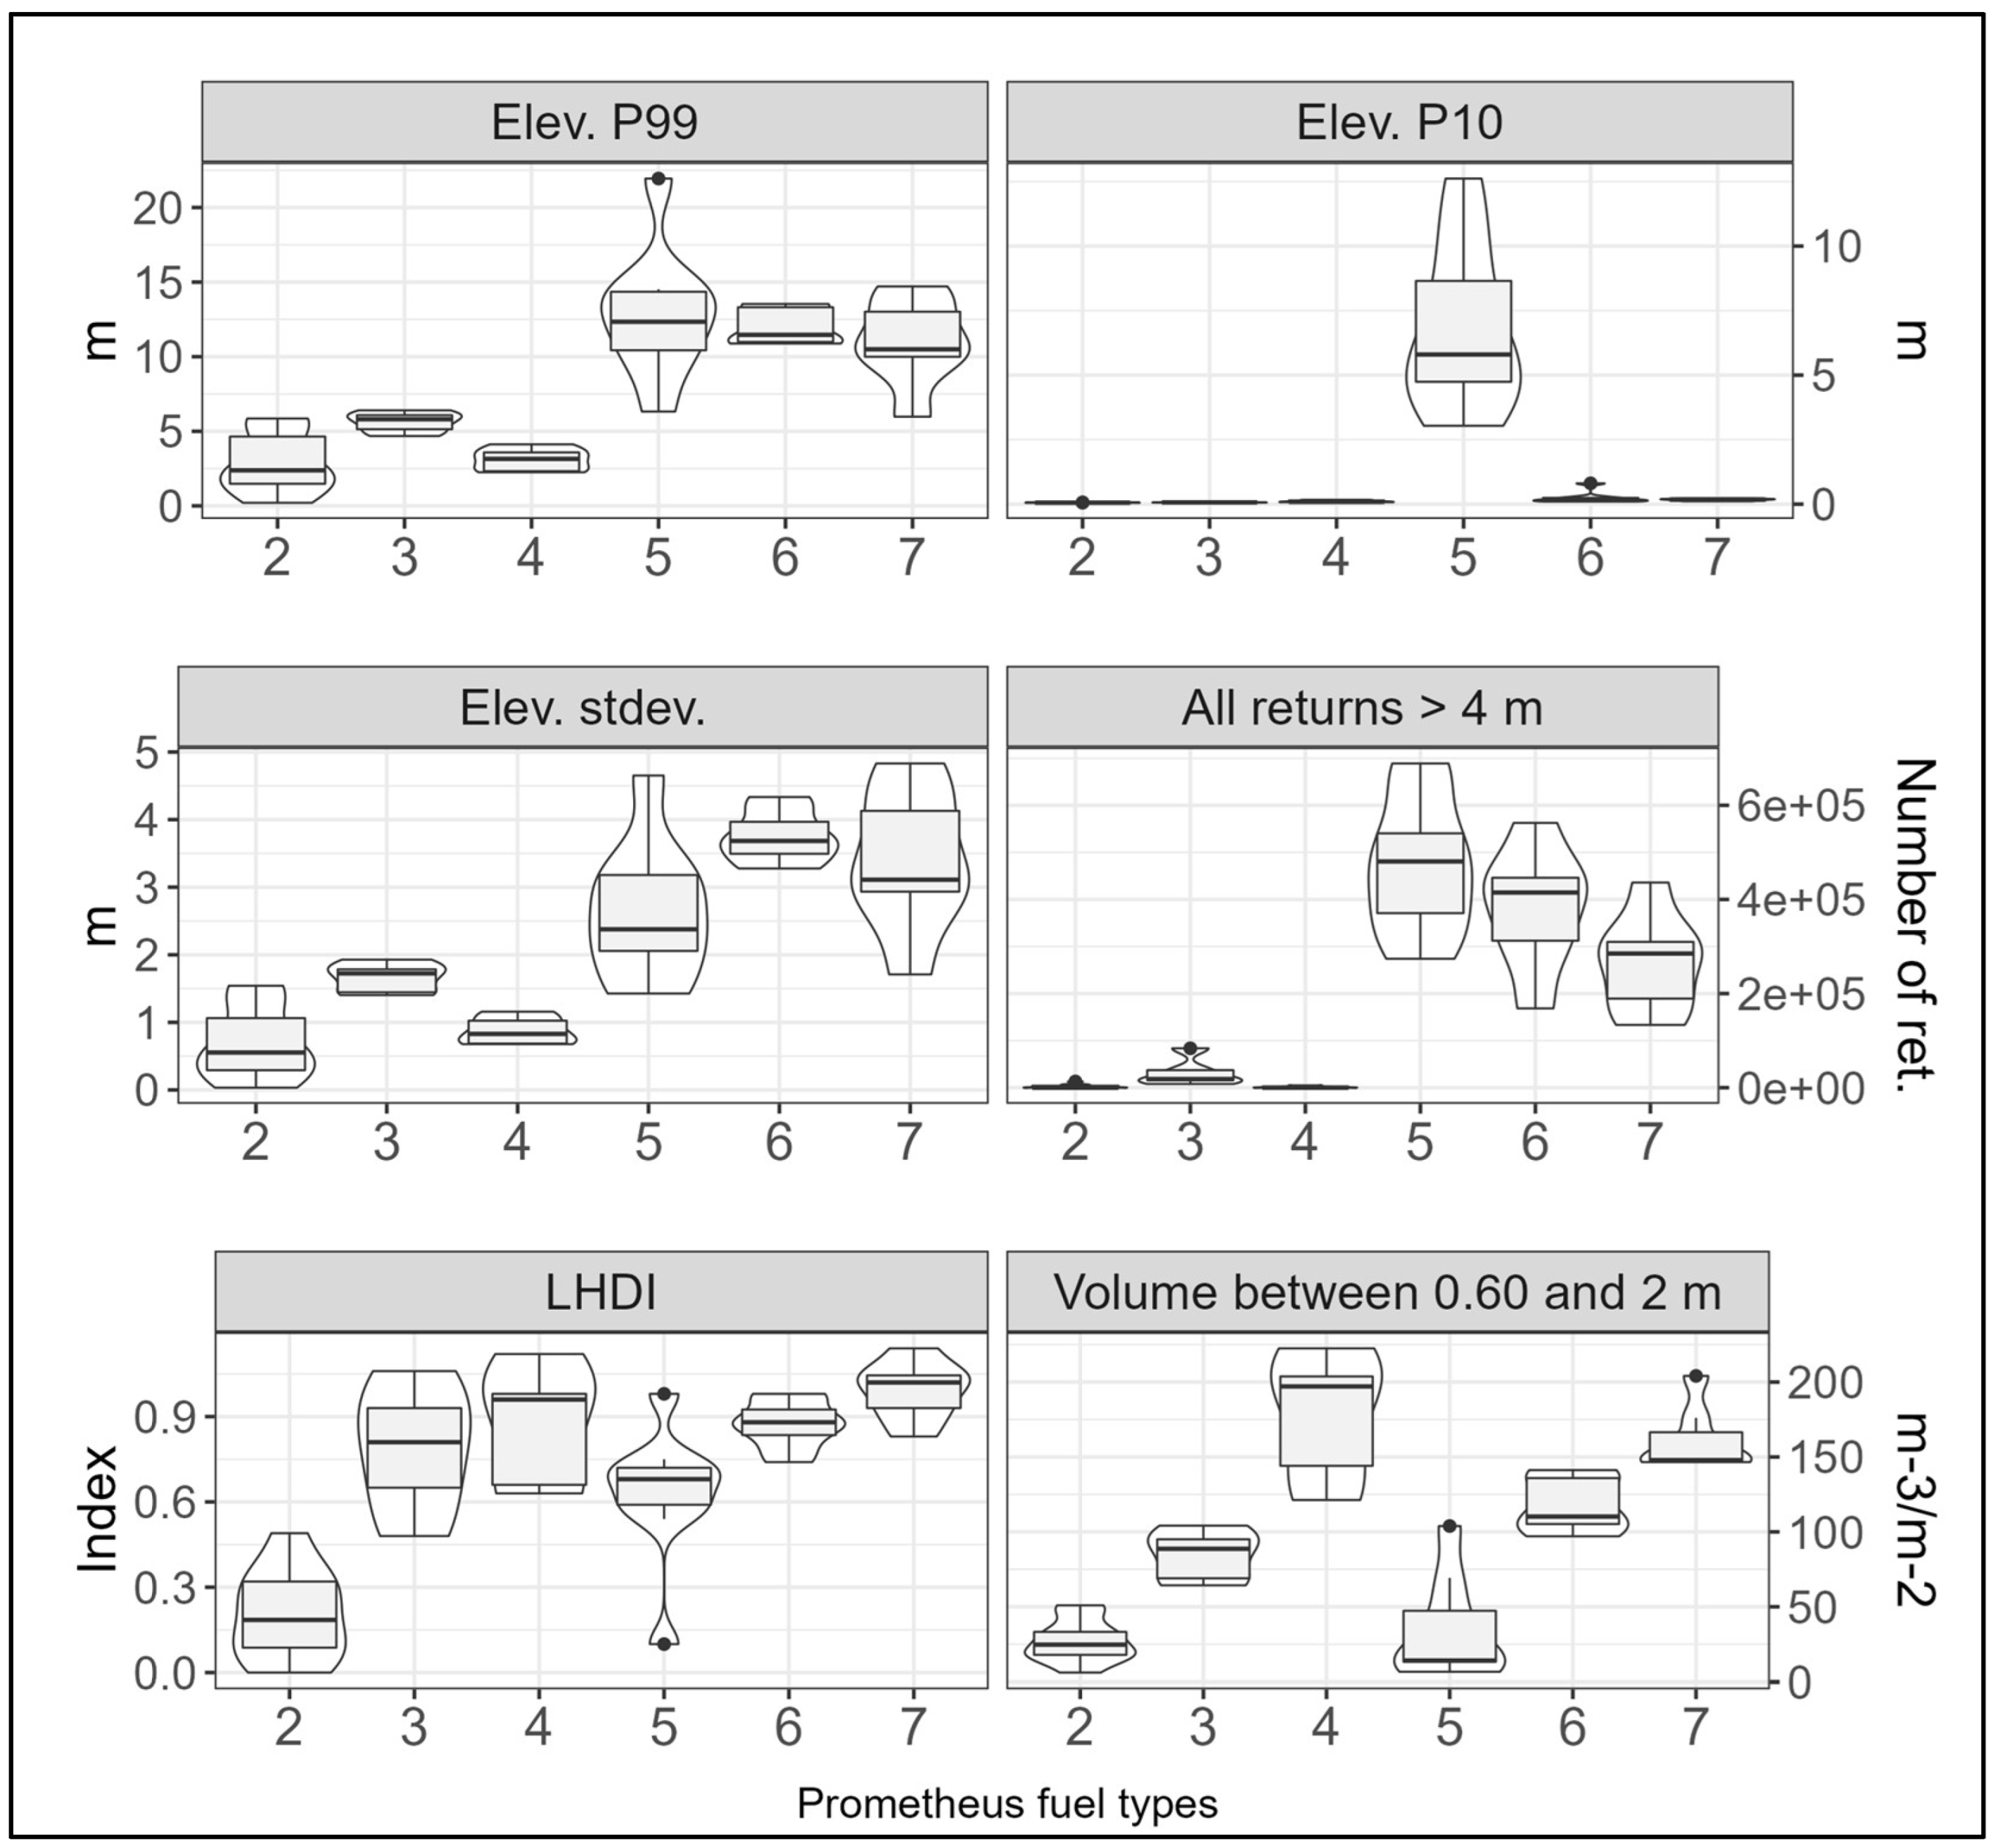
The UAV variables introduced into the classification models were selected according to the results given by Dunn’s test, a method already employed in previous forest-related studies in order to determine differences between groups (e.g., [57,58]). The use of Dunn’s test allows the variables included in the models to have a more logical explanatory meaning than that derived from the automatic selection of other procedures (e.g., VSURF), which tends to optimize the results by including metrics that may be similar. This may complicate the model and make the results less interpretable. Figure 7 provides insights into the consistency and discriminatory ability of the model variables in distinguishing between the different fuel types. The variable “Elev. P99”, representing maximum vegetation or canopy height, effectively differentiates between shrub fuel types (FT2, FT3, FT4) and tree fuel types (FT5, FT6, FT7), thereby preventing confusion between these two groups. This is consistent with other studies that have identified canopy height as an effective metric for characterizing fuels [53,59]. Similarly, “Elev. P10” clearly distinguishes FT5 from other types. Given that this type represents forests with minimal understory, the heights at the 10th percentile tend to be higher, aiding in correctly classifying FT6 and FT7. The effectiveness of LiDAR-derived low vegetation height metrics for characterizing fuels has already been observed by Domingo et al. (2020) [29]. “Elev. stdev.” reflects the variability of height distributions, facilitating differentiation between shrub and tree fuel types, although some overlap is observed, particularly in FT3 with FT5 and FT7. Concerning “All returns > 4 m”, this metric is very useful for distinguishing between tree fuel types [50]. It identifies the quantity of fuel above 4 m (indicative of tree fuel), yet values are distributed similarly within shrub and tree fuel types, leading here to limited discriminatory power. FT2, FT3, and FT4 exhibit minimal returns above 4 m, likely attributed to scattered small trees or tall shrubs within the plots. Conversely, FT5 demonstrates maximum fuel above 4 m, possibly due to larger trees or denser canopy cover inhibiting laser penetration to lower strata. Additionally, laser returns penetrating the crowns may have been misclassified as ground, given the sparse understory vegetation in FT5 plots. FT6 and FT7 show fewer returns above 4 m compared to FT5, suggesting smaller-sized trees or greater canopy openness facilitating laser penetration to lower strata. The variable “LHDI” serves to identify the relative abundance of fuel, regardless of vegetation height. This variable has also been effective for classifying fuel types in previous work [60], as well as for characterizing forest structures [61]. While “LHDI” may not distinguish between shrub and tree types, it effectively discriminates between types within a dominant stratum. “LHDI” clearly delineates FT2 from other types, which aligns logically with FT2 being a low-shrub type characterized by minimal structural diversity. Additionally, it facilitates strong differentiation among the three tree types, with low values in FT5, medium values in FT6, and high values in FT7. However, “LHDI” may not differentiate between FT3 and FT4, as these types exhibit overlapping values. Lastly, the volume between 0.60 and 2 m derived from the HMLS voxelized data demonstrates considerable variation across fuel types, particularly among tree types. As expected, values are minimal in FT2 and FT5, reflecting the low shrub type and limited understory characteristic of these types, respectively. Intermediate values are evident in FT3 and FT6, reflecting their transitional nature between low (FT2) and high (FT4) shrubs and between minimal understory (FT5) and complete vertical canopy continuity (FT7), respectively. Consequently, maximum volumes are observed in FT4 and FT7, where vertical fuel continuity is pronounced. Furthermore, minimal variability is observed in FT7 values, suggesting homogeneity in volume within this height stratum across plots.

4.2. Capabilities of UAV-LiDAR and HMLS Systems to Classify Prometheus Fuel Types

The classification of the Prometheus fuel types was conducted utilizing machine learning techniques, a methodology widely employed in previous studies with satisfactory outcomes (e.g., [29,32,50,62]), although recent studies have also shown promising results in fuel classification modeling based on deep learning methods [62,63,64,65]. The RF model emerged as the most effective in this study, achieving the highest overall accuracy among the models tested. RF also yielded the most balanced confusion matrices, primarily demonstrating confusion between similar fuel types and minimal errors between types of different dominant strata. The SVM-L and SVM-R models also exhibited satisfactory overall accuracies. In this sense, all the classification models improved their performance compared to those conducted by Hoffrén et al. (2023) [32] on almost the same study plots. That work offers a robust validation of the capacity of the UAV-LiDAR system employed in this study, given the similarity in the study area and the use of identical machine learning techniques, albeit Hoffrén et al. (2023) [32] used variables derived from UAV photogrammetric data. Notably, all fuel types were classified more accurately with the UAV-LiDAR system compared to the photogrammetric UAV data, with significant improvements observed, particularly in the classification of FT3, FT4, and FT6 types. These findings are consistent with those reported by Wallace et al. (2016) [66], who similarly compared UAVs with LiDAR and photogrammetric sensors in dry sclerophyll eucalypt forest stands, noting that both systems could effectively describe terrain and canopy properties, although the performance of photogrammetric UAVs was compromised in densely forested areas. This aspect was also observed by Hillman et al. (2021) [33] again in sclerophyll eucalypt forests, who noted underperformance in characterizing canopy and below-canopy structures. Furthermore, the results from classification models presented here improve upon fits of fuel classification models based on ALS and multispectral data reported in previous studies (e.g., [29,67,68]), though they are somewhat lower compared to those of García et al. (2011) [50], who applied decision rules to the classification outputs. Hoffrén et al. (2023) [27] achieved lower classification accuracies when using LiDAR data from NASA’s Global Ecosystem Dynamics Investigation satellite system, though performances were comparable to this study when LiDAR-derived metrics were combined with multispectral imageries from Landsat-8 OLI.
The integration of UAV variables with vegetation volume data derived from HMLS-voxelized point clouds yielded a significant enhancement in the classification models. The fuel volume between 0.60 and 2 m reached the most promising results for the models, although other heights strata also contributed to improving accuracies, but to a lesser extent. This outcome aligns logically with the operational characteristics of HMLS systems, which, operating from the ground, are less susceptible to canopy bounce effects compared to UAVs. Consequently, this integration minimized confusion between similar fuel types and notably eradicated them almost entirely, with the inclusion of vegetation volume between 0.60 and 2 m. In this study, we benefited from HMLS data collected in a prior work [38], which aimed to characterize Prometheus fuel types using high-density voxels (5 cm3) generated from HMLS point clouds. In that study, the analysis of the vertical distribution of fuels based on the voxels for each observed fuel type revealed significant confusion in field identification between types FT2-FT3, FT5-FT6, and FT6-FT7, consistent with the highest error rates observed in this study (FT3) and in Hoffrén et al. (2023) [32] (FT3 and FT6). Therefore, the HMLS system effectively captured the structural heterogeneity of understory fuels—a prevalent scenario in Mediterranean forests—and minimized confusion between Prometheus fuel types by amalgamating its data with UAV-LiDAR data. This synergy between both systems has also demonstrated effectiveness in previous studies [33], albeit with slightly superior estimates achieved by TLS in identifying elevated canopy cover in a dry schlerophyll forest. Furthermore, Hyyppä et al. (2020) [34] found better identification of forest understory attributes using a ground-based mobile laser scanner (MLS) and an under-canopy UAV system in a boreal forest. Additionally, the fusion of UAV and MLS data facilitated the effective quantification of post-fire tree structures in a mixed forest in Western Canada [69]. Other authors underscore the importance of combining TLS, MLS, and UAV systems for validating spaceborne LiDAR, radar, and optical missions [70]. Despite these promising findings, the use of ground-based LiDAR systems may not always be practical in terms of productivity, as data collection requires more time and access within the forest, which can be challenging due to terrain obstacles (e.g., steep slopes, water masses, or rocky cliffs), dense vegetation, or wildlife. In contrast, UAVs enable faster data collection over larger areas without direct penetration into forests, offering a significant advantage. Thus, in this study we cannot spatialize the UAV-HMLS model because it was impracticable to collect data in the whole UAV flight areas in terms of time, cost, and effort. In this sense, the capacity of UAVs themselves to cover greater extents and generate fuel maps presents a very valuable opportunity for effective forest management.

4.3. Fuels Mapping from UAV Data

The analysis of the spatialized fuel types within the forest plots yielded good overall correspondences with the ground truth observations. In some cases, the plots exhibited a mix of several fuel types, as depicted in Figure 6—an expected scenario given the inherent heterogeneity of fuel types, particularly in Mediterranean areas, characterized by high forest structural complexity. Primary challenges arose in categorizing the FT6 fuel type, which was inaccurately spatialized in many of its corresponding plots, and furthermore, there were few such pixels spatialized in general on the maps. In all plots where FT6 was misclassified, the spatialized fuel type was FT7, which confirms the high confusion between these two fuel types already observed in many previous studies [29,32,49,50,68]. Discrepancies between the hit rate percentages of FT6 in the RF classification model, which were relatively high, and the resulting mapping could potentially be attributed to the tendency of RF models to overfit, a phenomenon documented in prior studies [71,72]. Additionally, these confusions may stem from a limitation of the model variables in discerning between FT6 and FT7. Examination of the complete results of Dunn’s test (Table S2 of the Supplementary Materials) reveals that none of the variables were able to differentiate between these two types. Furthermore, Figure 7 illustrates that the distribution of values of the UAV variables in FT6 and FT7 consistently overlap, unlike other fuel types, where such overlap is absent in at least one variable. However, it is important to note the converse scenario, wherein the FT3 fuel type obtained the highest error rates in the classification model, yet all observed FT3 type plots, except one, were correctly assigned their respective fuel types in the maps. Ultimately, despite some observed limitations, the maps of fuel types have shown good performance and confirm UAV-LiDAR systems as powerful tools for better understanding the distribution of fuels across large areas.
Fuel maps are critical tools for improving decision-making and risk management of wildfires, especially in highly fire-prone regions such as Mediterranean ecosystems. These maps aid in the development of structural mitigation plans, including activities such as clearing, grazing, scrub removal, and periodic necromass cleaning over time. Furthermore, their integration with other cartographic data adds significant value to improve fire risk prevention over ecosystems and populations. In this study, the Prometheus fuel types were successfully classified and mapped across the UAV flight areas. Although it is outside the scope of our research, scaling up from our small test areas to a landscape scale, which is more effective for establishing fire management strategies, could be achieved through multi-sensor integration. The collection of highly accurate UAV data offers a method that improves both the time efficiency and accuracy of traditional forest inventory based on fieldwork while enhancing the precision of data obtained from remote sensors, such as ALS or SLS, which is critical in complex environments like Mediterranean forest landscapes. In this way, UAV data would serve as the ground truth for subsequently spatializing the results to larger areas using sensors that cover broader spatial scales.

5. Conclusions

The identification and mapping of forest fuels play a crucial role in wildfire prevention and mitigation efforts. The integration of two remote sensing technologies, LiDAR and UAVs, known for their efficacy in estimating vegetation structural characteristics, as well as the use of machine learning-based classification algorithms, has facilitated the classification of Prometheus fuel types in Mediterranean forest stands and the generation of fuel maps with high levels of accuracy. While further research is necessary to explore the potential and limitations of these instruments, as well as their integration with other platforms and sensors (such as TLS, multispectral, or hyperspectral imaging), the findings of this study underscore the capabilities of UAV-LiDAR systems as high-valuable instruments to identify and map forest fuels and, ultimately, for improving efficient management of forest ecosystems at local and regional scales.

Supplementary Materials

The following supporting information can be downloaded at: https://www.mdpi.com/article/10.3390/rs16183536/s1, Figure S1: Mapping of Prometheus fuel types from the best classification model (RF) of the UAV data at 20 m spatial resolution. (1) Plots “al01” and “al02”. (2) Plots “al05”, “al06”, “al07”, “al08”, and “al09”. (3) Plot “ay01”; Figure S2: Mapping of Prometheus fuel types from the best classification model (RF) of the UAV data at 20 m spatial resolution. (1) Plots “ay02” and “ay03”. (2) Plots “ay04” and “ay08”. (3) Plots “ay05” and “ay09”; Figure S3: Mapping of Prometheus fuel types from the best classification model (RF) of the UAV data at 20 m spatial resolution. (1) Plot “ay07”. (2) Plots “ay10” and “ay11”. (3) Plots “ay12”, “ay49”, and “ay50”; Figure S4: Mapping of Prometheus fuel types from the best classification model (RF) of the UAV data at 20 m spatial resolution. (1) Plots “ay13” and “ay14”. (2) Plot “ay16”. (3) Plots “ay19” and “ay20”; Figure S5: Mapping of Prometheus fuel types from the best classification model (RF) of the UAV data at 20 m spatial resolution. (1) Plot “ay21”. (2) Plot “ay22”. (3) Plot “ay28”; Figure S6: Mapping of Prometheus fuel types from the best classification model (RF) of the UAV data at 20 m spatial resolution. (1) Plots “ay29” and “ay31”. (2) Plot “ay30”. (3) Plots “ay44” and “ay45”; Figure S7: Mapping of Prometheus fuel types from the best classification model (RF) of the UAV data at 20 m spatial resolution. (1) Plot “ay46”. (2) Plot “un02”. (3) Plot “un03”; Figure S8: Mapping of Prometheus fuel types from the best classification model (RF) of the UAV data at 20 m spatial resolution. (1) Plot “un04”. (2) Plot “un05”. (3) Plots “un11” and “un12”; Figure S9: Mapping of Prometheus fuel types from the best classification model (RF) of the UAV data at 20 m spatial resolution. (1) Plot “un13”. (2) Plot “un28”. (3) Plot “vi14”; Figure S10: Mapping of Prometheus fuel types from the best classification model (RF) of the UAV data at 20 m spatial resolution. (1) Plots “vi15” and “vi16”. (2) Plots “vi19” and “vi20”. (3) Plot “vi27”; Figure S11: Mapping of Prometheus fuel types from the best classification model (RF) of the UAV data at 20 m spatial resolution. (1) Plots “vi29” and “vi30”. (2) Plots “vi36” and “vi37”. (3) Plots “vi38” and “vi41”; Figure S12: Mapping of Prometheus fuel types from the best classification model (RF) of the UAV data at 20 m spatial resolution. (1) Plot “zu30”. (2) Plot “zu31”. (3) Plot “zu32”; Figure S13: Mapping of Prometheus fuel types from the best classification model (RF) of the UAV data at 20 m spatial resolution. (1) Plot “zu35”. (2) Plot “zu38”. (3) Plots “zu201” and “zu202”; Table S1: Description and general characteristics of the forest plots. XY coordinates in ETRS89/UTM zone 30N (EPSG: 25830); Table S2: Number of pairs of Prometheus fuel types able to differentiate (value 1 means Dunn’s test, p ≤ 0.05) by the UAV variables; Table S3: Confusion matrix of the SVM-L classification model of the UAV data; Table S4: F-score (F) coefficient for each fuel type of the SVM-L classification model of the UAV data; Table S5: Confusion matrix of the SVM-R classification model of the UAV data; Table S6: F-score (F) coefficient for each fuel type of the SVM-R classification model of the UAV data; Table S7: Confusion matrix of the SVM-L classification model of the UAV-HMLS data; Table S8: F-score (F) coefficient for each fuel type of the SVM-L classification model of the UAV-HMLS data; Table S9: Confusion matrix of the SVM-R classification model of the UAV-HMLS data; Table S10: F-score (F) coefficient for each fuel type of the SVM-R classification model of the UAV-HMLS data.

Author Contributions

Conceptualization, R.H., M.T.L. and J.d.l.R.; methodology, R.H., M.T.L. and J.d.l.R.; software, R.H.; validation, R.H., M.T.L. and J.d.l.R.; formal analysis, R.H.; investigation, R.H., M.T.L. and J.d.l.R.; resources, R.H., M.T.L. and J.d.l.R.; data curation, R.H.; writing—original draft preparation, R.H.; writing—review and editing, R.H., M.T.L. and J.d.l.R. All authors have read and agreed to the published version of the manuscript.

Funding

This work was supported by the Spanish Ministry of Science, Innovation, and Universities through an FPU predoctoral contract granted to R.H. [FPU18/05027]; by the Government of Aragón [Geoforest S51_23R co-financed with FEDER “Construyendo Europa desde Aragón”]; and by the University Institute for Research in Environmental Sciences of Aragón (IUCA) of the University of Zaragoza, which covered the cost of renting the GeoSLAM ZEB-Horizon HMLS unit and the GeoSLAM Connect v.2.3.0 software.

Data Availability Statement

The original contributions presented in the study are included in the article, further inquiries can be directed to the corresponding author.

Acknowledgments

The authors would like to thank Grafinta S.A. (Av. Filipinas 46, 28003 Madrid, Spain) for providing the GeoSLAM ZEB-Horizon HMLS unit and the GeoSLAM Connect v.2.3.0 software. The authors also thank Darío Domingo for his support in the fieldwork.

Conflicts of Interest

The authors declare no conflicts of interest.

References

  1. Pausas, J.G.; Keeley, J.E. Wildfires and global change. Front. Ecol. Environ. 2021, 19, 387–395. [Google Scholar] [CrossRef]
  2. Jones, M.W.; Abatzoglou, J.T.; Veraverbeke, S.; Andela, N.; Lasslop, G.; Forkel, M.; Smith, A.J.P.; Burton, C.; Betts, R.A.; van der Werf, G.; et al. Global and regional trends and drivers of fire under climate change. Rev. Geophys. 2022, 60, e2020RG000726. [Google Scholar] [CrossRef]
  3. Cunningham, C.X.; Williamson, G.J.; Bowman, D.M.J.S. Increasing frequency and intensity of the most extreme wildfires on Earth. Nat. Ecol. Evol. 2024, 8, 1420–1425. [Google Scholar] [CrossRef] [PubMed]
  4. Abatzoglou, J.T.; Williams, A.P.; Barbero, R. Global emergence of anthropogenic climate change in fire weather indices. Geophys. Res. Lett. 2019, 46, 326–336. [Google Scholar] [CrossRef]
  5. Abram, N.J.; Henley, B.J.; Gupta, A.S.; Lippmann, T.J.R.; Clarke, H.; Dowdy, A.J.; Sharples, J.J.; Nolan, R.H.; Zhang, T.; Wooster, M.J.; et al. Connections of climate change and variability to large and extreme forest fires in southeast Australia. Commun. Earth Environ. 2021, 2, 8. [Google Scholar] [CrossRef]
  6. Ascoli, D.; Moris, J.V.; Marchetti, M.; Sallustio, L. Land use change towards forests and wooded land correlates with large and frequent wildfires in Italy. Ann. Silvic. Res. 2021, 46, 177–188. [Google Scholar] [CrossRef]
  7. White, A.M.; Long, J.W. Understanding ecological contexts for active reforestation following wildfires. New For. 2019, 50, 41–56. [Google Scholar] [CrossRef]
  8. Papatheodorou, I.; Kitikidou, K.; Stampoulidis, A.; Milios, E. Analyzing the impact of reforestation on forest fires and the economic outcome in an area in northern Greece: Should we reforest areas with conifers? Yes or no? Ecol. Quest. 2023, 34, 1–17. [Google Scholar] [CrossRef]
  9. Kramer, H.A.; Mockrin, M.H.; Alexandre, P.M.; Radeloff, V.C. High wildfire damage in interface communities in California. Int. J. Wildland Fire 2019, 28, 641–650. [Google Scholar] [CrossRef]
  10. Hohner, A.K.; Rhoades, C.C.; Wilkerson, P.; Rosario-Ortiz, F.L. Wildfires alter forest watersheds and threaten drinking water quality. Acc. Chem. Res. 2019, 52, 1234–1244. [Google Scholar] [CrossRef]
  11. Díaz-Delgado, R.; Lloret, F.; Pons, X.; Terradas, J. Satellite evidence of decreasing resilience in Mediterranean plant communities after recurrent wildfires. Ecology 2002, 83, 2293–2303. [Google Scholar] [CrossRef]
  12. Kelly, L.T.; Giljohann, K.M.; Duane, A.; Aquilué, N.; Archibald, S.; Batllori, E.; Bennett, A.F.; Buckland, S.T.; Canelles, Q.; Clarke, M.F.; et al. Fire and biodiversity in the Anthropocene. Science 2020, 370, eabb0355. [Google Scholar] [CrossRef] [PubMed]
  13. Legge, S.; Rumpff, L.; Woinarski, J.C.Z.; Whiterod, N.S.; Ward, M.; Southwell, D.G.; Scheele, B.C.; Nimmo, D.G.; Lintermans, M.; Geyle, H.M.; et al. The conservation impacts of ecological disturbance: Time-bound estimates of population loss and recovery for fauna affected by the 2019–2020 Australian megafires. Glob. Ecol. Biogeogr. 2022, 31, 2085–2104. [Google Scholar] [CrossRef]
  14. Ponomarev, E.; Yakimov, N.; Ponomareva, T.; Yakubailik, O.; Conrad, S.G. Current trend of carbon emissions from wildfires in Siberia. Atmosphere 2021, 12, 559. [Google Scholar] [CrossRef]
  15. Phillips, C.A.; Rogers, B.M.; Elder, M.; Cooperdock, S.; Moubarak, M.; Randerson, J.T.; Frumhoff, P.C. Escalating carbon emissions from North American boreal forest wildfires and the climate mitigation potential of fire management. Sci. Adv. 2022, 8, 17. [Google Scholar] [CrossRef]
  16. Pausas, J.G.; Llovet, J.; Rodrigo, A.; Vallejo, R. Are wildfires a disaster in the Mediterranean basin?—A review. Int. J. Wildland Fire 2008, 17, 713–723. [Google Scholar] [CrossRef]
  17. Dupuy, J.-L.; Fargeon, H.; Martin-StPaul, N.; Pimont, F.; Ruffault, J.; Guijarro, M.; Hernando, C.; Madrigal, J.; Fernandes, P. Climate change impact on future wildfire danger and activity in southern Europe: A review. Ann. For. Sci. 2020, 77, 35. [Google Scholar] [CrossRef]
  18. Ruffault, J.; Curt, T.; Moron, V.; Trigo, R.M.; Mouillot, F.; Koutsias, N.; Pimont, F.; Martin-StPaul, N.; Barbero, R.; Dupuy, J.-L.; et al. Increased likelihood of heat-induced large wildfires in the Mediterranean Basin. Sci. Rep. 2020, 10, 13790. [Google Scholar] [CrossRef]
  19. Richards, J.; Huser, R.; Bevacqua, E.; Zscheischler, J. Insights into the drivers and spatiotemporal trends of extreme Mediterranean wildfires with statistical deep learning. Artif. Intell. Earth Syst. 2023, 2, e220095. [Google Scholar] [CrossRef]
  20. Lasaponara, R.; Lanorte, A. Remotely sensed characterization of forest fuel types by using satellite ASTER data. Int. J. Appl. Earth. Obs. Geoinf. 2006, 9, 225–234. [Google Scholar] [CrossRef]
  21. Novo, A.; Fariñas-Álvarez, N.; Martínez-Sánchez, J.; González-Jorge, H.; Fernández-Alonso, J.M.; Lorenzo, H. Mapping forest fire risk—A case of study in Galicia (Spain). Remote Sens. 2020, 12, 3705. [Google Scholar] [CrossRef]
  22. Aragoneses, E.; Chuvieco, E. Generation and mapping of fuel types for fire risk assessment. Fire 2021, 4, 59. [Google Scholar] [CrossRef]
  23. Abdollahi, A.; Yebra, M. Forest fuel type classification: Review of remote sensing techniques, constraints and future trends. J. Environ. Manag. 2023, 342, 118315. [Google Scholar] [CrossRef] [PubMed]
  24. Prometheus. Management Techniques for Optimization of Suppression and Minimization of Wildfires Effects; System Validation, European Commission, DG XII, ENVIR & CLIMATE, Contract Number ENV4-CT98-0716; European Commission: Luxembourg, 1999. [Google Scholar]
  25. Ashworth, A.; Evans, D.L.; Cookie, W.H.; Londo, A.; Collins, C.; Neuenschwander, A. Predicting southeastern forest canopy heights and fire fuel models using GLAS data. Photogramm. Eng. Remote Sens. 2010, 76, 915–922. [Google Scholar] [CrossRef]
  26. Leite, R.V.; Silva, C.A.; Broadbent, E.N.; do Amaral, C.H.; Liesenberg, V.; de Almeida, D.R.A.; Mohan, M.; Godinho, S.; Cardil, A.; Hamamura, C.; et al. Large scale multi-layer fuel load characterization in tropical savanna using GEDI spaceborne LiDAR data. Remote Sens. Environ. 2022, 268, 112764. [Google Scholar] [CrossRef]
  27. Hoffrén, R.; Lamelas, M.T.; de la Riva, J.; Domingo, D.; Montealegre, A.L.; García-Martín, A.; Revilla, S. Assessing GEDI-NASA system for forest fuels classification using machine learning techniques. Int. J. Appl. Earth. Obs. Geoinf. 2023, 116, 103175. [Google Scholar] [CrossRef]
  28. Chirici, G.; Scotti, R.; Montaghi, A.; Barbati, A.; Cartisano, R.; López, G.; Marchetti, M.; McRoberts, R.E.; Olsson, H.; Corona, P. Stochastic gradient boosting classification trees for forest fuel types mapping through airborne laser scanning and IRS LISS-III imagery. Int. J. Appl. Earth Obs. Geoinf. 2013, 25, 87–97. [Google Scholar] [CrossRef]
  29. Domingo, D.; de la Riva, J.; Lamelas, M.T.; García-Martín, A.; Ibarra, P.; Echeverría, M.T.; Hoffrén, R. Fuel type classification using airborne laser scanning and Sentinel-2 data in Mediterranean forest affected by wildfires. Remote Sens. 2020, 12, 3660. [Google Scholar] [CrossRef]
  30. Romero-Ramírez, F.J.; Navarro-Cerrillo, R.M.; Varo-Martínez, M.A.; Quero, J.L.; Doerr, S.; Hernández-Clemente, R. Determination of forest fuels characteristics in mortality-affected Pinus forests using integrated hyperspectral and ALS data. Int. J. Appl. Earth. Obs. Geoinf. 2018, 68, 157–167. [Google Scholar] [CrossRef]
  31. Shin, P.; Sankey, T.; Moore, M.M.; Thode, A.E. Evaluating unmanned aerial vehicle images for estimating forest canopy fuels in a Ponderosa pine stand. Remote Sens. 2018, 10, 1266. [Google Scholar] [CrossRef]
  32. Hoffrén, R.; Lamelas, M.T.; de la Riva, J. UAV-derived photogrammetric point clouds and multispectral indices for fuel estimation in Mediterranean forests. Remote Sens. Appl. Soc. Environ. 2023, 31, 100997. [Google Scholar] [CrossRef]
  33. Hillman, S.; Wallace, L.; Lucieer, A.; Reinke, K.; Turner, D.; Jones, S. A comparison of terrestrial and UAS sensors for measuring fuel hazard in a dry sclerophyll forest. Int. J. Appl. Earth Obs. Geoinf. 2021, 95, 102261. [Google Scholar] [CrossRef]
  34. Hyyppä, E.; Yu, X.; Kaartinen, H.; Hakala, T.; Kukko, A.; Vastaranta, M.; Hyyppä, J. Comparison of backpack, handheld, under-canopy UAV, and above-canopy UAV laser scanning for field reference data collection in boreal forests. Remote Sens. 2020, 12, 3327. [Google Scholar] [CrossRef]
  35. Chen, Y.; Zhu, X.; Yebra, M.; Harris, S.; Tapper, N. Strata-based forest fuel classification for wild fire hazard assessment using terrestrial LiDAR. J. Appl. Remote Sens. 2016, 10, 046025. [Google Scholar] [CrossRef]
  36. Wilson, N.; Bradstock, R.; Bedward, M. Influence of fuel structure derived from terrestrial laser scanning (TLS) on wildfire severity in logged forests. J. Environ. Manag. 2022, 302 Pt A, 114011. [Google Scholar] [CrossRef]
  37. Hyyppä, E.; Hyyppä, J.; Hakala, T.; Kukko, A.; Wulder, M.A.; White, J.C.; Pyöräla, J.; Yu, X.; Wang, Y.; Virtanen, J.P.; et al. Under-canopy UAV laser scanning for accurate forest field measurements. ISPRS J. Photogramm. Remote Sens. 2020, 164, 41–60. [Google Scholar] [CrossRef]
  38. Hoffrén, R.; Lamelas, M.T.; de la Riva, J. Evaluation of handheld mobile laser scanner systems for the definition of fuel types in structurally complex Mediterranean forest stands. Fire 2024, 7, 59. [Google Scholar] [CrossRef]
  39. Amatulli, G.; Pérez-Cabello, F.; de la Riva, J. Mapping lightning/human-caused wildfires occurrence under ignition point location uncertainty. Ecol. Modell. 2007, 200, 321–333. [Google Scholar] [CrossRef]
  40. Loidi, J. (Ed.) The Ebro Basin. In The Vegetation of the Iberian Peninsula. Plant and Vegetation; Springer: Cham, Switzerland, 2017; Volume 12, pp. 513–547. [Google Scholar]
  41. Evans, J.S.; Hudak, A.T. A multiscale curvature algorithm for classifying discrete return LiDAR in forested environments. IEEE Trans. Geosci. Remote Sens. 2007, 45, 1029–1038. [Google Scholar] [CrossRef]
  42. Montealegre, A.L.; Lamelas, M.T.; de la Riva, J.; García-Martín, A.; Escribano, F. A comparison of open-source LiDAR filtering algorithms in a Mediterranean forest environment. IEEE J. Sel. Top. Appl. Earth Obs. Remote Sens. 2015, 8, 4072–4085. [Google Scholar] [CrossRef]
  43. Renslow, M. Manual of Airborne Topographic LiDAR; ASPRS: Bethesda, MD, USA, 2013; ISBN 978-1570830976. [Google Scholar]
  44. Roussel, J.R.; Auty, D.; Coops, N.C.; Tompalski, P.; Goodboy, T.R.H.; Sánchez-Meador, A.; Bourdon, J.F.; de Boissieu, F.; Achim, A. ‘lidR’: An R package for analysis of Airborne Laser Scanning (ALS) data. Remote Sens. Environ. 2020, 251, 112061. [Google Scholar] [CrossRef]
  45. Roussel, J.R.; Auty, D. Airborne LiDAR Data Manipulation and Visualization for Forestry Applications. R Package Version 4.0.1. 2022. Available online: https://cran.r-project.org/package=lidR (accessed on 13 June 2024).
  46. R Core Team. R: A Language and Environment for Statistical Computing; R Foundation for Statistical Computing: Vienna, Austria, 2020; Available online: https://www.R-project.org (accessed on 13 June 2024).
  47. McGaughey, R.J. FUSION/LDV: Software for LiDAR Data Analysis and Visualization v.4.21; USDA Forest Service: Washington, DC, USA, 2021. [Google Scholar]
  48. Listopad, C.M.C.S.; Masters, R.E.; Drake, J.; Weishampel, J.; Branquinho, C. Structural diversity indices based on airborne LiDAR as ecological indicators for managing highly dynamic landscapes. Ecol. Indic. 2015, 57, 268–279. [Google Scholar] [CrossRef]
  49. García-Cimarras, A.; Manzanera, J.A.; Valbuena, R. Analysis of Mediterranean vegetation fuel type changes using multitemporal LiDAR. Forests 2021, 12, 335. [Google Scholar] [CrossRef]
  50. García, M.; Riaño, D.; Chuvieco, E.; Salas, J.; Danson, F.M. Multispectral and LiDAR data fusion for fuel type mapping using Support Vector Machine and decision rules. Remote Sens. Environ. 2011, 115, 1369–1379. [Google Scholar] [CrossRef]
  51. Dunn, O.J. Multiple comparisons using rank sums. Technometrics 1964, 6, 241–252. [Google Scholar] [CrossRef]
  52. Kuhn, M. Building predictive models in R using the caret package. J. Stat. Softw. 2008, 28, 1–26. [Google Scholar] [CrossRef]
  53. Andersen, H.E.; McGaughey, R.J.; Reutebuch, S.E. Estimating forest canopy fuel parameters using LiDAR data. Remote Sens. Environ. 2005, 94, 441–449. [Google Scholar] [CrossRef]
  54. Nicolau, A.P.; Dyson, K.; Saah, D.; Clinton, N. Accuracy assessment: Quantifying classification quality. In Cloud-Based Remote Sensing with Google Earth Engine; Cardille, J.A., Crowley, M.A., Saah, D., Clinton, N.E., Eds.; Springer: Cham, Switzerland, 2023; pp. 135–145. [Google Scholar] [CrossRef]
  55. Hijmans, R. ‘terra’: Spatial Data Analysis. R Package Version 1.5-21. 2022. Available online: https://cran.r-project.org/package=terra (accessed on 13 June 2024).
  56. Birot, Y. Living with Wildfires: What Science Can Tell Us; Discussion Paper 15; European Forest Institute: Joensuu, Finland, 2009; ISBN 987-952-5453-29-4. [Google Scholar]
  57. Varol, T.; Emir, T.; Akgul, M.; Ozel, H.B.; Acar, H.H.; Cetin, M. Impacts of small-scale mechanized logging equipment on soil compaction in forests. J. Soil Sci. Plant Nutr. 2020, 20, 953–963. [Google Scholar] [CrossRef]
  58. García-Galar, A.; Lamelas, M.T.; Domingo, D. Assessment of oak groves conservation statuses in Natura 2000 sacs with single photon LiDAR and Sentinel-2 data. Remote Sens. 2023, 15, 710. [Google Scholar] [CrossRef]
  59. Jakubowksi, M.K.; Guo, Q.; Collins, B.; Stephens, S.; Kelly, M. Predicting surface fuel models and fuel metrics using LiDAR and CIR imagery in dense, mountainous forest. Photogramm. Eng. Remote Sens. 2013, 1, 37–49. [Google Scholar] [CrossRef]
  60. Revilla, S.; Lamelas, M.T.; Domingo, D.; de la Riva, J.; Montorio, R.; Montealegre, A.L.; García-Martín, A. Assessing the potential of the DART model to discrete return LiDAR simulation—Application to fuel type mapping. Remote Sens. 2021, 13, 342. [Google Scholar] [CrossRef]
  61. Gelabert, P.J.; Montealegre, A.L.; Lamelas, M.T.; Domingo, D. Forest structural diversity characterization in Mediterranean landscapes affected by fires using Airborne Laser Scanning data. GIScience Remote Sens. 2020, 57, 497–509. [Google Scholar] [CrossRef]
  62. Azim, M.R.; Keskin, M.; Do, N.; Gül, M. Automated classification of fuel types using roadside images via deep learning. Int. J. Wildland Fire 2022, 31, 982–987. [Google Scholar] [CrossRef]
  63. Labenski, P.; Ewald, M.; Schmidtlein, S.; Fassnacht, F.E. Classifying surface fuel types based on forest stand photographs and satellite time series using deep learning. Int. J. Appl. Earth Obs. Geoinf. 2022, 109, 102799. [Google Scholar] [CrossRef]
  64. Alipour, M.; La Puma, I.; Picotte, J.; Shamsaei, K.; Rowell, E.; Watts, A.; Kosovic, B.; Ebrahimian, H.; Tacirogl, E. A multimodal data fusion and deep learning framework for large-scale wildfire surface fuel mapping. Fire 2023, 6, 36. [Google Scholar] [CrossRef]
  65. Carbone, A.; Spiller, D.; Laneve, G. Fuel type mapping using a CNN-based remote sensing approach: A case study in Sardinia. Fire 2023, 6, 395. [Google Scholar] [CrossRef]
  66. Wallace, L.; Lucieer, A.; Malenovský, Z.; Turner, D.; Vopěnka, P. Assessment of forest structure using two UAV techniques: A comparison of airborne laser scanning and Structure from Motion (SfM) point clouds. Forests 2016, 7, 62. [Google Scholar] [CrossRef]
  67. Marino, E.; Ranz, P.; Tomé, J.L.; Noriega, M.Á.; Esteban, J.; Madrigal, J. Generation of high-resolution fuel model maps from discrete airborne laser scanner and Landsat-8 OLI: A low-cost and highly updated methodology for large areas. Remote Sens. Environ. 2016, 187, 267–280. [Google Scholar] [CrossRef]
  68. Huesca, M.; Riaño, D.; Ustin, S.L. Spectral mapping methods applied to LiDAR data: Application to fuel type mapping. Int. J. Appl. Earth Obs. Geoinf. 2019, 74, 159–168. [Google Scholar] [CrossRef]
  69. Qi, Y.; Coops, N.C.; Daniels, L.D.; Butson, C.R. Assessing the effects of burn severity on post-fire tree structures using the fused drone and mobile laser scanning point clouds. Front. Environ. Sci. 2022, 10, 949442. [Google Scholar] [CrossRef]
  70. Levick, S.R.; Whiteside, T.; Loewensteiner, D.A.; Rudge, M.; Bartolo, R. Leveraging TLS as a calibration and validation tool for MLS and ULS mapping of savanna structure and biomass at landscape-scales. Remote Sens. 2021, 13, 257. [Google Scholar] [CrossRef]
  71. Arellano-Pérez, S.; Castedo-Dorado, F.; López-Sánchez, C.A.; González-Ferreiro, E.; Yang, Z.; Díaz-Varela, R.A.; Álvarez-González, J.G.; Vega, J.A.; Ruiz-González, A.D. Potential of Sentinel-2 data to model surface and canopy fuel characteristics in relation to crown fire hazard. Remote Sens. 2018, 10, 1645. [Google Scholar] [CrossRef]
  72. Hu, Y.; Xu, X.; Wu, F.; Sun, Z.; Xia, H.; Meng, Q.; Huang, W.; Zhou, H.; Gao, J.; Li, W.; et al. Estimating forest stock volume in Hunan Province, China, by integrating in situ plot data, Sentinel-2 images, and linear and machine learning regression models. Remote Sens. 2020, 12, 186. [Google Scholar] [CrossRef]
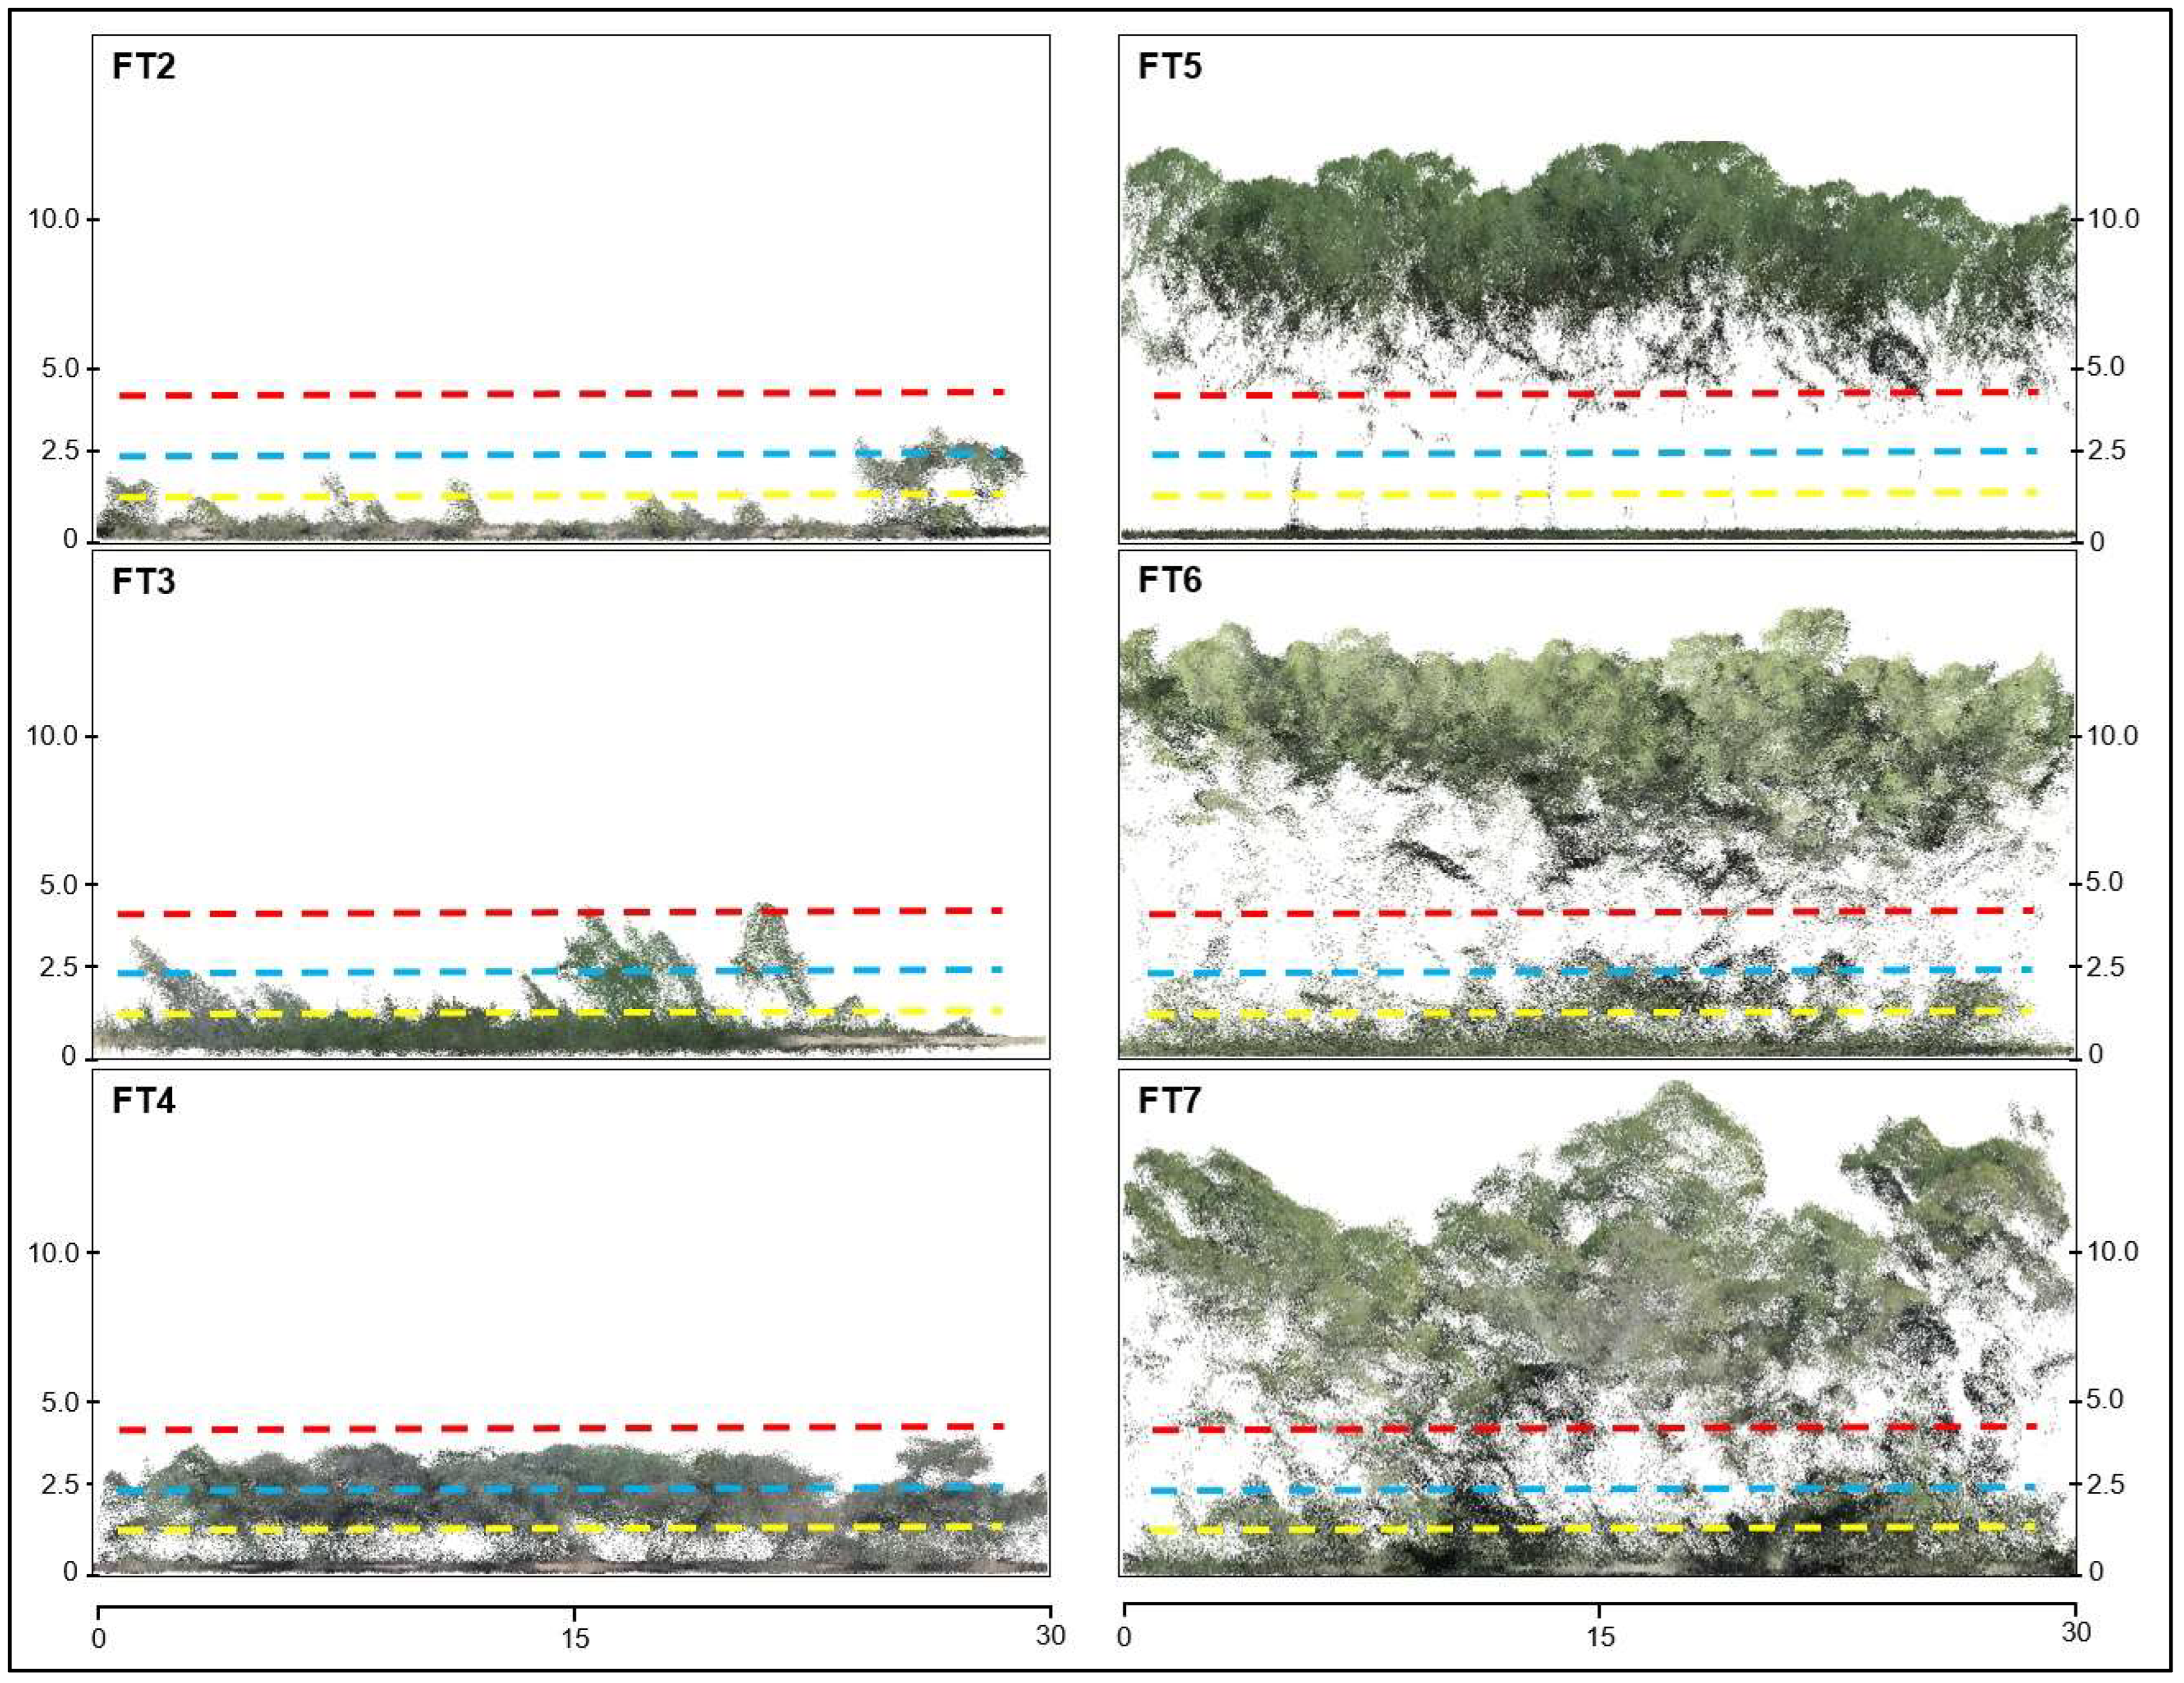
Figure 1. Graphical representation from the UAV’s colored point cloud of the structural differences of the Prometheus fuel types considered in this study. Units are in meters. The yellow, blue, and red dotted lines correspond to the height thresholds of the Prometheus classification (0.60, 2, and 4 m, respectively).
Remotesensing 16 03536 g001
Figure 2. Spatial distribution of study sectors and forest plots where UAV and HMLS data were collected in the Autonomous Community of Aragón (NE Spain).
Remotesensing 16 03536 g002
Figure 3. (a) DJI Matrice 300 RTK UAV unit with DJI Zenmuse L1 LiDAR sensor and (b) general flight scheme for UAV data collection on two forest plots.
Remotesensing 16 03536 g003
Figure 4. Mapping of Prometheus fuel types from the best classification model (RF) of the UAV data at 20 m spatial resolution. Results in areas with shrub types forest plots: (1) Plots “vi17” and “vi18”: FT2; (2) Plots “vi39” and “vi40”: FT3; (3) Plots “al03” and “al04”: FT4.
Remotesensing 16 03536 g004
Figure 5. Mapping of Prometheus fuel types from the best classification model (RF) of the UAV data at 20 m spatial resolution. Results in areas with tree types forest plots: (1) plots “ay47” and “ay48”: FT5; (2) plots “ay06” and “ay15”: FT6; (3) plots “ay17” and “ay18”: FT7.
Remotesensing 16 03536 g005
Figure 6. Spatial distribution of the Prometheus fuel types identified by the best UAV classification model (A) and the variables introduced into the models (BF) in the UAV flight area of plots “ay12”, “ay49”, and “ay50” (represented as pink circles).
Remotesensing 16 03536 g006
Figure 7. Distribution of values by each Prometheus fuel type for the five UAV variables and the HMLS variable introduced in the classification models.
Remotesensing 16 03536 g007
Table 1. The Prometheus fuel types: general characteristics and number of forest plots for each fuel type and platform considered in this study. The difference between FT6 and FT7 is the vertical difference between shrubs and trees, which is >0.5 m in FT6 and <0.5 m in FT7.
Fuel TypeCoverShrub Mean HeightUAV
Plots
UAV and HMLS Plots
FT2>60% grass and <50% trees (>4 m)0.30–0.60 m1110
FT30.60–2.00 m75
FT42.00–4.00 m55
FT5<30% shrub and >50% trees (>4 m) 149
FT6>30% shrub and >50% trees (>4 m) 127
FT7 247
Table 2. Performances of the three classification models using the overall accuracy (OA) coefficient for the five selected variables of the UAV data.
VariablesModelOA
Elev. P99, Elev. P10, Elev. stdev.,
All returns > 4 m, LHDI
RF81.28%
SVM-L75.10%
SVM-R78.32%
Table 3. Confusion matrix of the best UAV classification model (RF).
Fuel
Types
PredictedProd.’s
Accuracy
FT2FT3FT4FT5FT6FT7
ActualFT29920000083.19%
FT310420100860.00%
FT4105000098.04%
FT500012001092.31%
FT60000913174.59%
FT7080102919180.25%
User’s
accuracy
90.00%60.00%100.00%85.71%75.83%79.58%
Table 4. F-score (F) coefficient for each fuel type of the best UAV classification model (RF).
FT2FT3FT4FT5FT6FT7
F0.870.571.000.890.690.74
Table 5. Performances of the three classification models for UAV data incorporating the four HMLS variables using the overall accuracy (OA) coefficient.
VariablesRFSVM-LSVM-R
UAVHMLSOAOAOA
Elev. P99, Elev. P10, Elev. stdev.,
All returns > 4 m, LHDI
Volume < 0.60 m83.83%80.65%81.00%
Volume 0.60–2 m95.05%81.73%86.17%
Volume 2–4 m83.76%79.90%85.85%
Volume > 4 m82.50%81.27%82.15%
Table 6. Confusion matrix of the best classification model (RF) integrating UAV and HMLS data.
Fuel TypePredictedProd.’s
Accuracy
FT2FT3FT4FT5FT6FT7
ActualFT29010000090.00%
FT31040000080.00%
FT40050000100.00%
FT50009000100.00%
FT60000700100.00%
FT70000070100.00%
User’s
accuracy
90.00%80.00%100.00%100.00%100.00%100.00%
Table 7. F-score (F) coefficient for each fuel type of the best classification model (RF) integrating UAV and HMLS data.
FT2FT3FT4FT5FT6FT7
F0.900.801.001.001.001.00
Disclaimer/Publisher’s Note: The statements, opinions and data contained in all publications are solely those of the individual author(s) and contributor(s) and not of MDPI and/or the editor(s). MDPI and/or the editor(s) disclaim responsibility for any injury to people or property resulting from any ideas, methods, instructions or products referred to in the content.