Abstract
Optical remote sensing images often feature high resolution, dense target distribution, and uneven target sizes, while transformer-based detectors like DETR reduce manually designed components, DETR does not support arbitrary-oriented object detection and suffers from high computational costs and slow convergence when handling large sequences of images. Additionally, bipartite graph matching and the limit on the number of queries result in transformer-based detectors performing poorly in scenarios with multiple objects and small object sizes. We propose an improved DETR detector for Oriented remote sensing object detection with Feature Reconstruction and Dynamic Query, termed DETR-ORD. It introduces rotation into the transformer architecture for oriented object detection, reduces computational cost with a hybrid encoder, and includes an IFR (image feature reconstruction) module to address the loss of positional information due to the flattening operation. It also uses ATSS to select auxiliary dynamic training queries for the decoder. This improved DETR-based detector enhances detection performance in challenging oriented optical remote sensing scenarios with similar backbone network parameters. Our approach achieves superior results on most optical remote sensing datasets, such as DOTA-v1.5 (72.07% mAP) and DIOR-R (66.60% mAP), surpassing the baseline detector.
1. Introduction
Object detection in remote sensing is a challenging task due to the arbitrary orientations of objects and the unbalanced distribution of objects within a single image. For instance, one image may contain hundreds of vehicles, while another may only have a single tennis court.
Detectors based on CNNs [1,2,3,4,5,6,7,8,9,10,11,12,13,14] have achieved significant results in object detection tasks for optical remote sensing images. These methods can be divided into two categories based on the presence of anchors: anchor-based and anchor-free. Anchor-based methods [2,7,8] work by pre-setting anchor boxes and then adjusting them during prediction to obtain the final results. In contrast, anchor-free methods [11,12,13,14] do not predict the offsets of anchor boxes directly; instead, they often use the center point as a reference, obtaining predictions through horizontal, vertical, or rotational adjustments. Based on the stage of detection, they can be further divided into single-stage and two-stage detectors. Single-stage detectors [7,8,9,10] directly yield prediction results, offering fast speeds but generally lower accuracy. Two-stage detection methods [1,2,4,5] initially generate proposals through a region proposal network (RPN) that are then classified and further refined by subsequent networks to produce predictions, resulting in slower speeds but higher accuracy.
However, methods [1,2,3,4,5,6,7,8,9,10,11,12,13,14] starting from either rotating boxes or center points generate a large number of background samples that interfere with the detector’s judgment and require manually designed preprocessing and postprocessing components to meet the needs of optical remote sensing object detection. These components not only increase the complexity of model design but also limit the universality and flexibility of the model.
Recently, transformer-based detectors, like DETR [15], have brought revolutionary changes to object detection tasks, especially by discarding the manually designed components and directly predicting the categories and bounding boxes of objects through an end-to-end training approach.
To address the issue of slow convergence, researchers have been using deformable attention to reduce the amount of computation [16], understanding the semantic and positional information of queries [17], employing denoising with added noise [18,19], and utilizing auxiliary training heads [20] to accelerate convergence, thus making improvements to various aspects of DETR [15].
However, existing DETR-based detectors still have some limitations in rotated object detection tasks, and the number of queries can seriously affect the amount of computation. When facing arbitrary-oriented object detection tasks, introducing the angle of bounding boxes into the transformer-based detector (with DINO [19] as the baseline in this paper) still experiences the following three challenges: (1) choice of an appropriate format to define rotating boxes; (2) adjustment of the method for calculating reference points in deformable attention to accommodate rotating boxes; (3) iteratively correction of the rotating box angles in the decoder when the values of are all between 0 and 1.
In this paper, we aim to adapt transformer-based detectors for oriented object detection and specifically enhance the accuracy and speed in arbitrary-oriented object detection tasks. For adapting the transformer-based detector for oriented object detection, we propose a method to define rotating boxes in the format, which is a natural extension of the format. We designed an algorithm for rotating reference points to ensure that the interaction reference points generated by the encoder’s output for rotating box proposals remain within the box. We developed activation and inverse activation functions specific to rotation, similar to mapping to the 0–1 range to match image predictions, to accommodate different standards of rotating angle descriptions. Consequently, to address the limitations of computational cost and slow convergence in transformer-based detectors, inspired by RT-DETR [21], we employed a hybrid encoder [21] to reduce the computational cost and number of parameters while maintaining the same level of accuracy. Then, for the loss of memory positional information, we propose an Image Feature Reconstruction (IFR) module to supervise the memory obtained through feature interactions via self-attention in the encoder. By restoring the memory to multi-layer features and upsampling them to the original image size for feature reconstruction, we can effectively compensate for the loss of spatial positioning information caused by the flattening operation necessary for self-attention. Finally, for the issue of the bipartite graph matching and the limit on the number of queries, we propose a method to select auxiliary dynamic training queries for the decoder, which can improve the quality of the top-k proposals selected by the encoder and mitigate the issue encountered during prediction, where using only the top-k scores to obtain proposals can result in high classification scores but low-quality bounding boxes.
In conclusion, the main contributions of this paper can be summarized as follows:
- We adapted a transformer-based detector to accommodate arbitrary-oriented object detection tasks, using enhancements in deformable attention, iterative corrections in the decoder, and methods of adding noise to rotating bounding boxes;
- By employing a hybrid encoder, we effectively reduced the computational cost and number of parameters while maintaining accuracy to effectively improve the limitations of computational cost and slow convergence in transformer-based detectors;
- We introduced an image feature reconstruction (IFR) module to supervise the memory obtained through feature interactions via self-attention within the hybrid encoder. By restoring the memory to multi-layer features and upsampling them to the original image size for feature reconstruction, we can effectively compensate for the loss of spatial positioning information;
- We developed a method to select auxiliary dynamic training queries for the decoder, enhancing the quality of the top-k proposals generated by the encoder. It can mitigate issues encountered during prediction when there are high classification scores but low-quality bounding boxes.
2. Related Works
CNN Architecture-Based Detectors. Detection algorithms based on CNN architectures primarily focus on improvements in three key areas: feature alignment, positive and negative sample matching, and the regression of rotated bounding boxes.
Han et al. [7] proposed a single-shot alignment network (S²A-Net) consisting of two modules, a feature alignment module (FAM) and an oriented detection module (ODM), to alleviate the inconsistency between classification score and localization accuracy. Yang et al. [8] proposed an end-to-end refined single-stage rotation detector for fast and accurate object detection using a progressive regression approach from coarse to fine granularity. Hou et al. [12] proposed novel flexible shape-adaptive selection (SA-S) and shape-adaptive measurement (SA-M) strategies for oriented object detection, which comprise an SA-S strategy for sample selection and SA-M strategy for the quality estimation of positive samples. Li et al. [14] proposed an effective adaptive point learning approach to aerial object detection by taking advantage of the adaptive point representation, which can capture the geometric information of the arbitrary-oriented instances.
Although detectors based on CNN architectures have achieved significant results, they still require complex preprocessing and postprocessing.
Transformer Architecture-Based Detectors. Transformer-based detectors can be divided into two categories. The first category combines self-attention, cross-attention, and CNNs to enhance the network’s capability for image feature extraction and interaction. The second category includes DETR-like detectors, which are applied to tasks involving arbitrary-oriented object detection.
For the first category, Li et al. [22] proposed a method that combines a transformer with a transfer CNN for object detection in remote sensing images. The transformer is used to process a feature pyramid of the image, while the CNN is used to extract features. Zhang et al. [23] introduced GANsformer, a detection network that combines a convolutional network with a transformer for aerial image analysis. The transformer is employed as a branch network to improve CNN’s ability to encode global features. Tang et al. [24] proposed a method that utilizes feature sampling and grouping for scene text detection in remote sensing images. Their approach combines a transformer with a CNN to effectively detect text in complex scenes. Liu et al. [25] proposed a hybrid network architecture called TransConvNet, which combined the advantages of CNNs and transformers by aggregating global and local information. They also designed an adaptive feature fusion network to capture information from multiple resolutions. Pu et al. [26] introduced an Adaptive Rotated Convolution (ARC) module to identify and locate objects in images with arbitrary orientation.
For the second category, Zheng et al. [27] developed ADT-Det, an adaptive dynamic refined single-stage transformer detector for arbitrary-oriented object detection in satellite optical imagery. Their approach utilizes a transformer-based architecture to achieve accurate detection results. Dai et al. [28] introduced RODFormer, a high-precision design for rotating object detection with transformers. Their method utilizes a transformer-based architecture to accurately detect and localize rotating objects in remote sensing images. Ma et al. [29] introduces a novel approach to oriented object detection by leveraging transformers to bypass complex rotated anchors and incorporates a memory-efficient encoder with depthwise separable convolution. Lee et al. [30] proposed a transformer-based oriented object detector named Rotated DETR with oriented bounding boxes (OBBs) labeling. They employed a scoring network for background token reduction and an innovative proposal generator with iterative refinement for precise angle-aware proposals. Dai et al. [31] proposed an Arbitrary-Oriented Object DEtection TRansformer framework, termed AO2-DETR, which incorporates an oriented proposal generation, adaptive proposal refinement for rotation-invariant features and a rotation-aware set matching loss within a transformer framework. Zhou et al. [32] introduced dynamic queries for efficiency without loss in performance and deployed a novel label re-assignment strategy. Their framework is based on DETR, with the box regression head replaced with a point prediction head. Hu et al. [33] introduced a Reassigned Bipartite Graph Matching (RBGM) to filter high-quality negative samples, an Ignored Sample Predicted Head (ISPH) for precise negative sample prediction, and a Reassigned Hungarian Loss to enhance model training with high-quality negative samples. Pu et al. [34] introduced Rank-DETR, an enhanced DETR-based object detection framework that prioritizes high localization accuracy in bounding box predictions to improve ranking accuracy and overall object detection performance, especially under high Intersection over Union (IoU) thresholds.
Our method belongs to the second category, employing a relatively simple strategy to apply DETR to arbitrary-oriented object detection, and achieving competitive results.
Label Assignment Strategy in Transformers. Since the introduction of the transformer architecture into object detection tasks by DETR [15], the Hungarian one-to-one matching and set prediction approach in the DETR architecture has remained the mainstream in DETR-like algorithms. This matching method allows object detection to forego the NMS operation inherent in CNN architectures. As a result, the preprocessing and postprocessing stages of detection algorithms have been greatly simplified. However, Hungarian matching introduces new challenges in object prediction. It increases the instability of the queries, as the same query often corresponds to different objects during the iterative process across multiple layers of the decoder, thereby reducing the network’s convergence speed. Additionally, when the number of objects in an image approaches the number of queries, this can lead to a significant drop in prediction accuracy. DAB-DETR [17] improved detection accuracy through iterative correction using multi-layer decoder iterations. DN-DETR [18] DN-DETR (De-Noising DETR) introduced denoising of the noise-added ground truth to enhance the decoder’s predictive capability for queries. However, neither of these methods adopt the approach of Co-DETR [20], which utilizes an additional matching method to improve the iterative pattern of queries. The positive and negative sample allocation method proposed in this paper is similar to that of Co-DETR [20], but it does not employ additional bounding box and class prediction branches. Instead, it merely involves the reallocation of the encoder’s output. By utilizing the effective positive and negative sample allocation methods found in CNN architectures, our approach provides more positive samples to aid in the convergence of queries.
3. Methods
3.1. Model Overview
Given an optical remote sensing image, we first process it through a backbone to extract multi-layer features. We employ ResNet50 [35] as the backbone and utilize , , , and , along with (the latter obtained through additional convolution) as the multi-layer features extracted from the backbone. These features are then fed into a hybrid encoder for self-attention feature interaction, resulting in the formation of a memory. Finally, the memory proceeds in two directions. The first direction involves restoring the flattened memory to the shape of multi-scale features, which are then processed through the image feature restoration (IFR) module proposed in this paper for image feature recovery, supervised using the input image. The second direction involves feeding the memory into a decoder, which engages in cross-attention with queries for object prediction. Next, we will elaborate in detail on each module. The structure is illustrated as Figure 1.
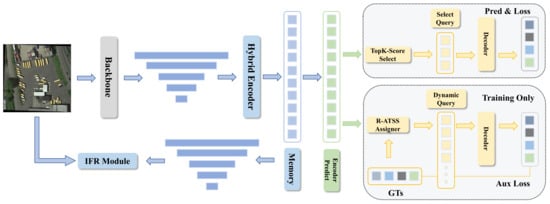
Figure 1.
Illustration of our proposed framework. DETR-ORD adapts the standard deformable DETR for the AOOD task by (1) introducing rotation into the transformer architecture, (2) reducing the computational cost by employing a hybrid encoder, (3) proposing an IFR module to supervise the feature memory obtained from encoder interactions, and (4) using ATSS [36] to select auxiliary dynamic training queries for the decoder.
3.2. Rotation in Transformer
3.2.1. Rotated Bounding Boxes
In the architecture of DETR-like detection algorithms, the regression of bounding boxes is typically executed in the format (x-coordinate, y-coordinate, width, height) relative to the entire image, and during the iterative prediction process, this is converted into the format (two sets of x- and y-coordinates representing opposite corners of the box). Unlike traditional bounding boxes, which are aligned with the image axes and defined by two coordinates, rotated bounding boxes can be oriented at any angle relative to the image axes. This allows them to more closely fit objects that are not aligned with the image axes. To conveniently incorporate rotational aspects, we add a rotation angle directly to the representation, thus adopting an format to represent rotated bounding boxes.
3.2.2. Deformable Attention
The introduction of deformable attention has substantially resolved the issue of excessive computational demand in self-attention and cross-attention mechanisms within the transformer architecture. In traditional MultiHeadAttention, each query interacts with all keys. However, in deformable attention, each query interacts only with ‘K’ specific keys. Concurrently, it is necessary to provide ‘K’ reference points to indicate the locations of these ‘K’ keys. This approach significantly reduces the computational complexity by focusing on a select set of relevant key points rather than the entire set. If the reference points are defined in the format, then the sample locations can be calculated according to Figure 1, represents the offsets of the reference points predicted by the network, and are sampling points, and and are the predicted points.
This approach is adopted to ensure that the positions of the keys used for interaction are confined within the provided bounding box, specified in the format. By doing so, the scope of interaction is effectively restricted, enhancing the efficiency and relevance of the deformable attention mechanism.
To integrate the rotation angle into this framework, it is necessary to modify the existing formulae accordingly. We define the provided proposals by the encoder in the format. This adaptation will allow the incorporation of rotational aspects into the deformable attention mechanism, effectively addressing the orientation of objects within the image. First, we calculate the sampling points:
Then, we calculate the offsets of the sampling points relative to the center of the bounding box considering the center of the box as the origin.
Then, we apply a rotation matrix generated by as Equation (6) to these offsets to obtain the rotated offsets.
Finally, by adding these rotated offsets to the center of the bounding box, we obtain the positions of the sampling points with rotation information applied.
3.2.3. Iterative Decoder
The decoder in our proposed detector largely follows the decoder in Deformable DETR, with modifications made to the iterative refinement part to accommodate rotations. Our decoder’s structure is illustrated as shown in Figure 2.
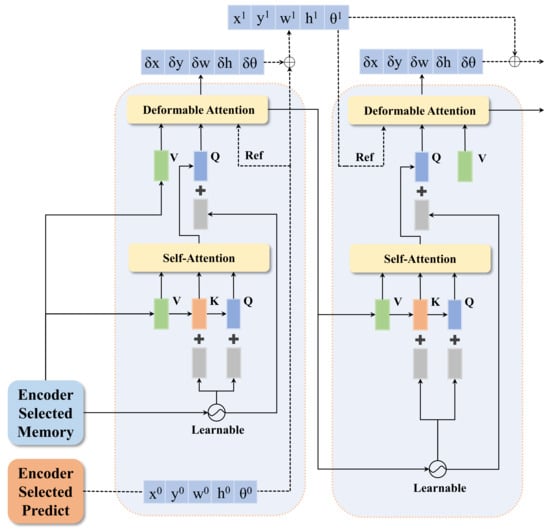
Figure 2.
Illustration of the iterative decoder of the proposed method DETR-ORD. Given the memory selected by the encoder and the predicted proposals, treat the memory as for self-attention. Then, treat the proposals as reference points for cross-attention, and pass the output of this layer to the next layer. The output of this layer, after passing through a feed-forward network (FFN), obtains correction values to adjust the reference points. Iteratively, this process continues layer by layer to achieve the final result.
We obtain the proposals filtered by the encoder as the reference points for deformable attention and the starting points for iterative refinement in the first layer of the decoder. The memory filtered by the encoder serves as , and V for the first layer of the decoder, and learnable positional embedding is used to encode the positions of the memory. Starting from the second layer of the decoder, , and V utilize the output of the deformable attention from the previous layer decoder. The reference points for the deformable attention are the summation of the reference points from the previous layer and the corrections outputted by the last layer decoder.
We denote the reference points of the decoder as and the predictions outputted by each layer of the decoder as . represents the sigmoid function and represents the rotation sigmoid function under version.
represents the inverse rotation sigmoid function under version.
denotes the activation operation. function denotes concatenating data from different sources. The format represents the x-coordinate, y-coordinate, width and height.
denotes the inverse activation operation.
and represent the value of bounding boxes and the value predicted by the network. So, we can calculate the reference points of the as follows:
The reference points and the iterative correction of predictions by each layer of the decoder are illustrated as follows.
3.2.4. IoU Loss
Due to the complexity of rotated bounding boxes, calculating their intersection over union (IoU) is far more intricate compared to traditional axis-aligned bounding boxes, which can utilize variants like IoU, CIoU, DIoU, GIoU, etc. Therefore, we adopt the most fundamental and commonly used method for calculating IoU for rotated boxes. This involves computing the area of the polygon formed by the intersecting line segments of two rotated bounding boxes as their intersection. Based on this, we calculate the IoU and employ a linear approach for computing the IoU Loss like Equation (12).
3.3. Hybrid Encoder
Inspired by Rt-DETR [21], we adapt a hybrid encoder in this paper. However, due to the issue of scale variation in optical remote sensing images, we adopt five scales from the backbone. We use MultiHeadAttention only on the layer of features with the highest downsample rate and have conducted corresponding experimental comparisons to validate this approach. In the described process, the feature with the highest sampling multiplier, S6, is first flattened to serve as . represents flatten operation.
Following this, the resulting undergoes a multi-head attention mechanism and is reshaped into a two-dimensional form to obtain , represents restoring the shape of the feature to the same as , MA represents MultiHeadAttention and CCFM represents cross-scale feature-fusion module to replace the inter-layer attention used in multi-scale deformable attention in Deformable-DETR [16].
Finally, the features S2, , , , and are fed into the CCFM (cross-channel feature modulation) module to produce the interacted feature, referred to as “memory”.
This approach enhances feature interaction and integration, leveraging the strengths of multi-head attention and cross-channel modulation for improved representation learning.
3.4. IFR Module
Due to the flattening operations of the encoder and decoder, the interacted features often lose two-dimensional positional information. Additionally, optical remote sensing images often have the characteristics of being unclear or blurry. Thus, supplementing and supervising the positional information of the memory is necessary. Therefore, we restore the memory, which engages in cross-attention with the query, back into multi-scale features. These are then inputted into the IFR module to progressively restore them into three-channel RGB images. It should be noted that after feature fusion, we have replaced nearest neighbor interpolation upsampling with transposed convolution. The reason for this substitution is that nearest-neighbor interpolation does not cater to the restoration of features for each pixel. Therefore, we employ transposed convolution, a method that learns the features of each pixel, to address this limitation. The structure of the IFR (image feature restoration) module is as shown in Figure 3. We can formulate this process as follows Equations (16)–(20):
where represents restoring the shape of the feature to the same as the hybrid encoder, represents nearest neighbor interpolation for 2× upsampling, represents transposed convolution, represents a standard convolution used for channel alignment, and Rupsample represents N blocks, each composed of transposed convolutions, batch normalization (BN), and ReLU activation. These are utilized for progressively upsampling the fused features to restore them to the original image size.
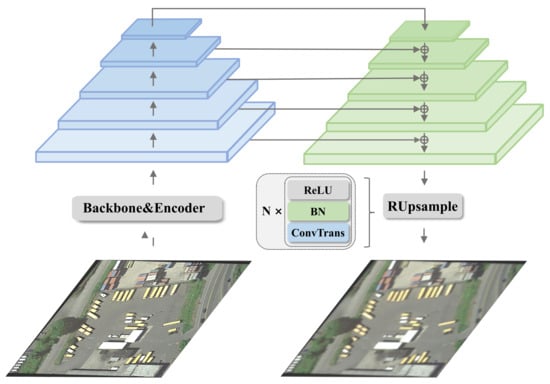
Figure 3.
Illustration of the IFR module of the proposed DETR-ORD method. Given the feature maps that have been processed by the backbone and hybrid encoder and restored to multiple scales, we adopt an architecture similar to the FPN to fully integrate multi-scale features, obtaining the feature map with the smallest downsampling factor. Then, through N RUsample modules, we obtain features of the original image size. The RUsample modules consist of transposed convolution, batch normalization (BN), and ReLU activation.
In the aspect of supervision for original image restoration, besides using loss, we have also adopted loss. The loss is an image quality assessment metric highly aligned with human visual perception characteristics. Its main advantage lies in its closer approximation to the human eye’s sensitivity to the structural information of images, thereby providing an image quality evaluation more consistent with human visual perception. Compared to traditional loss functions based on pixel differences, loss significantly optimizes the performance of image reconstruction, denoising, and other tasks by emphasizing the preservation of image structural information, especially in maintaining details and overall layout. Moreover, its flexibility allows it to be combined with other loss functions to balance pixel accuracy and structural similarity, further enhancing the model’s performance in image processing tasks. SSIM considers changes in three dimensions: luminance, contrast, and structure, offering a comprehensive range of image quality assessments according to Equation (21). This makes it widely applicable in various image content and quality evaluation scenarios.
where and are the mean luminance of images x and y, respectively. and are the variance of images x and y, respectively. - is the covariance between images x and y. and are small constants added to maintain stability. From this, we derive and according to Equations (22) and (23).
3.5. Dynamic Query
Deformable DETR [16] posits that providing queries with position information closer to the annotations to the decoder helps accelerate the convergence of the transformer architecture detector and improve its accuracy. Deformable DETR introduces a two-stage DETR, which predicts object bounding boxes and confidence scores for each pixel following the encoder and supervises this process through one-to-one matching with the ground truth using Hungarian matching. Subsequently, it selects the top-k queries based on confidence scores to be fed into the decoder.
This approach often selects detection boxes that have high scores but low detection quality, leading to a decrease in detection performance. Therefore, in the context of optical remote sensing images, this paper introduces an additional auxiliary training branch. For the proposals given by the encoder’s prediction branch, it uses the ATSS [36] matching method to allocate more predictive samples to each true annotation. This accelerates the convergence of the detector and improves detection accuracy.
Because a traditional encoder is not used, and instead, a hybrid encoder is adopted, the semantic information of the query does not utilize randomly initialized values but is selected from the memory generated by the encoder.
For the training of the auxiliary branch, if the number of positive samples matched exceeds the number of queries, random sampling is employed according to Equation (25). If it is insufficient, negative samples are used to fill the gap as in Equation (25):
where represents the proposals generated by the encoder, and represent the positive and negative samples allocated through ATSS, represents the position information of the query, represents the operation of random selection, represents the set number of queries for auxiliary training, and represents concatenation.
For the positively selected samples, both category and bounding box losses are calculated, and for the negatively selected samples, only the category loss is calculated in the auxiliary training branch.
4. Experiment
This section presents the details of experiment settings, including the dataset, the experimental environment and the evaluation indicators. Each subsection elaborates on specific aspects of the experiments’ settings.
4.1. Dataset
To demonstrate the effectiveness of our algorithm, this section first introduces the hyperparameters settings and training environment configurations for the DETR-ORD detector. Subsequently, we evaluate the optimized detector on multiple public optical remote sensing datasets, including DOTA [37] (DOTA-v1.0 and DOTA-v1.5 [37]), DIOR-R [38], and HRSC2016 [39]. The results are then compared against the leading detection algorithms on the respective datasets.
DOTA [37] is one of the largest datasets for oriented object detection, with three main versions currently available: DOTA-v1.0, DOTA-v1.5, and DOTA-v2.0. In this paper, we conduct comparative experiments using versions 1.0 and 1.5. Due to the large size of the DOTA-v2.0 dataset, our hardware resources are insufficient to meet its training requirements, and thus experiments on version 2.0 were not conducted. DOTA-v1.0 consists of 2806 large aerial images with pixel sizes ranging from 800 × 800 to 20,000 × 20,000, containing objects of various sizes, orientations, and shapes. The release time, number of categories, number of images, and number of instances for the three versions of the dataset are shown in Table 1.

Table 1.
DOTA dataset version details.
DOTA-v1.0 and DOTA-v1.5 have the same number of images, with 1411 images in the training set, 458 images in the validation set, and 937 images in the test set. DOTA-v1.0 contains 188,282 annotated instances covering 15 common categories: Plane (PL), Baseball Diamond (BD), Bridge (BR), Ground Track Field (GTF), Small Vehicle (SV), Large Vehicle (LV), Ship (SH), Tennis Court (TC), Basketball Court (BC), Storage Tank (ST), Soccer-Ball Field (SBF), Roundabout (RA), Harbor (HA), Swimming Pool (SP), and Helicopter (HC) [37]. DOTA-v1.5 adds one more category, Container Crane (CC), and includes 402,089 annotated instances. Due to the varying sizes of images in the DOTA dataset, we followed the official data preprocessing method, splitting the images with a stride of 200 pixels and a resolution of 1024 × 1024. The split images were then used for detection, and the results were merged. After splitting, the DOTA-v1.0 and DOTA-v1.5 training sets contain 15,749 images, and the validation sets contain 5297 images. In our experiments on the DOTA dataset, we merged the training and validation sets for training and performed inference on the test set, submitting the results to the official DOTA evaluation server. The distribution of the number of annotations per image for DOTA-v1.5 is shown in Figure 4. The DOTA-v1.5 dataset exhibits a long-tail distribution, with most images having 0–50 annotations. To evaluate the detector’s performance on the DOTA dataset, we conducted experiments on DOTA-v1.0 and DOTA-v1.5, setting the number of queries to 400 and the number of denoising queries to 100, using ResNet50 as the backbone network and training for 36 epochs.
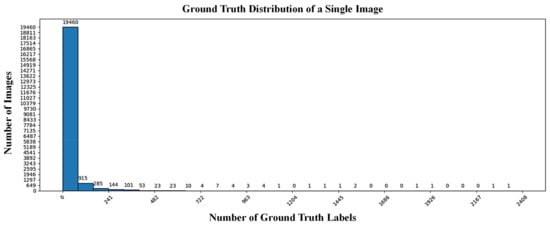
Figure 4.
Distribution of ground-truth per image in DOTA-v1.5.
The DIOR-R [38] dataset is a re-annotated version of the DIOR dataset’s images. The DIOR-R dataset contains a total of 23,463 images and 192,518 ground-truth annotations. Each image in the dataset has a size of 800 × 800 pixels, with spatial resolutions ranging from 0.5 m∼30 m. The training and validation sets combined consist of 11,725 images, while the test set includes 11,738 images. The dataset covers 20 categories: Airplane (APL), Airport (APO), Baseball Field (BF), Basketball Court (BC), Bridge (BR), Chimney (CH), Expressway Service Area (ESA), Expressway Toll Station (ETS), Dam (DAM), Golf Course (GF), Ground Track Field (GTF), Harbor (HA), Overpass (OP), Ship (SH), Stadium (STA), Storage Tank (STO), Tennis Court (TC), Train Station (TS), Vehicle (VE), and Windmill (WM) [38]. The distribution of ground-truth annotations per image in the dataset is shown in Figure 5.
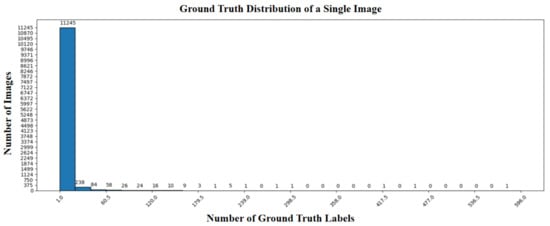
Figure 5.
DIOR-R ground-truth distribution per image.
To validate the detector’s performance on the DIOR-R dataset, we used 200 queries and 50 denoising queries, scaled the images to a resolution of 512 × 512, and employed the ResNet50 backbone network, training for 36 epochs.
HRSC2016 [39] comprises images of ships collected from six well-known ports. The dataset contains only one category: ship. Image sizes range from 300 × 300 to 1500 × 900. The HRSC2016 dataset includes a total of 1061 images (436 for training, 181 for validation, and 444 for testing) which are used for training and testing. The target distribution per image is shown in Figure 6. We used 20 queries and 5 denoising queries, scaled the images to a resolution of 512 × 512, and employed the ResNet50 backbone network, training for 36 epochs.
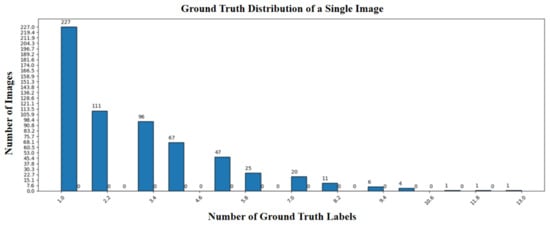
Figure 6.
HRSC2016 distribution of ground-truth per image.
4.2. Experimental Environment
Due to the inconsistency in target number distribution across different datasets, the number of queries used for detection and denoising is set differently. These specific settings will be detailed separately for each dataset, while other hyperparameter settings remain consistent. Some parameters are some of the most commonly chosen for DETR detectors such as learning rate, optimizer, the number of query items. They are crucial for ensuring the model effectively learns and performs optimally across object detection tasks. For example, an appropriate learning rate helps the model converge quickly and accurately, avoiding issues like instability from too high a rate or slow convergence from too low a rate. The optimizer determines the specific algorithm for parameter updates. The number of query items directly affects the model’s output capabilities and computational demands. The hyperparameter settings for the detector in this paper are shown in Table 2, and the training hardware platform utilized is presented in Table 3.

Table 2.
Detector hyperparameter settings.

Table 3.
Detector operating environment.
4.3. Evaluation Indicators
In terms of evaluation indicators for the detector, the commonly used VOC metrics for rotated bounding boxes are adopted. To assess the effectiveness of detection, it is desirable for the detected results to closely match the ground-truth. Therefore, the concepts of precision and recall are introduced. Precision refers to the proportion of detected targets that are considered true positives, while recall refers to the proportion of true targets that are correctly detected by the detector. The formulas for calculating precision and recall are shown in Equation (26).
Here represents the number of detection boxes for the current predicted category with an intersection over union (IoU) greater than the specified IoU threshold. denotes the number of detection boxes for the current predicted category with an IoU less than the specified threshold, and indicates the number of true annotations in the current category that were not detected. The mAP mentioned in this paper uses an IoU threshold of 0.5, and the mAP calculated using this threshold is referred to as mAP@0.5. The formula for calculating mAP is shown in Equation (27).
Here, represents the average precision for a single category, denotes the interpolated precision at recall r, and N represents the number of categories. According to the VOC07 evaluation standard, interpolation is performed at 11 points, whereas in the VOC12 evaluation standard, it is based on the area under the precision-recall curve.
In addition to mAP, our paper also introduces the F1 score. The F1 score is the harmonic mean of precision and recall, and its calculation formula is shown in Equation (28).
In the subsequent experiments, DOTA-v1.0, DOTA-v1.5, and DIOR-R use the VOC07 mAP@0.5 evaluation standard. HRSC2016 uses both VOC07 and VOC12 mAP@0.5 evaluation standards.
4.4. Ablation Study
In the ablation study, to verify the effectiveness of the dynamic query method, an analysis was first conducted on the distribution of the number of targets per image in the DOTA-v1.0 dataset. Subsequently, the number of queries that are less than or close to the average distribution was selected to address the problem of query number limitations in the detector’s performance. Additionally, the number of queries exceeding the target distribution was chosen for an ablation study of the dynamic query algorithm.
The impact of different query numbers on the detection results is shown in Table 4. The experimental results presented do not incorporate denoising and image feature restoration modules. The model was trained on the DOTA-v1.0 dataset for 12 epochs, and the results were validated with a validation set at the 3rd, 6th, 9th, and 12th epochs. As can be seen from the table, the introduction of dynamic queries significantly enhanced the performance of the detector when the number of queries was close to or less than the average number of targets. Specifically, with 50 queries, the mAP value of the dynamic query improved by 6.5% compared to the baseline model. With 100 queries, there was a 3.2% improvement, demonstrating the effectiveness of the dynamic query algorithm in addressing query number limitations. When the number of queries met the model’s prediction, at 400, the dynamic query still achieved a 2.1% improvement, proving that the dynamic query algorithm can not only eliminate the restrictions on query numbers but also simultaneously enhance model performance.

Table 4.
Effect of different number of query on detection results.
The results of the DETR-ORD ablation study are shown in Table 5. Note that in the ablation study, the number of queries used is 400, the number of denoising queries is 100, and ATSS selects up to a maximum of 400 queries. The images of 1024 × 1024 are resized to 512 × 512 for training. From the results of the ablation study, it can be observed that there is no significant change in accuracy when comparing the hybrid encoder with the traditional encoder. After introducing the IFR module, the mAP increased by 0.8%. With the introduction of ATSS-assisted dynamic queries, the mAP increased by 2.8%. The dynamic queries comparison results are showned in Figure A1 and the IFR modules comparison results are showned in Figure A2.

Table 5.
Ablation Study.
4.5. Implementation Details
In terms of code implementation, we utilize the open-source deep learning detection toolboxes, MMDetection [40] and MMRotate [41], and introduced rotation into DINO [19], we refer to it as R-DINO, as our baseline. These toolboxes offer a comprehensive, flexible, and extensible framework for object detection tasks, including support for various state-of-the-art models and algorithms. MMDetection provides a rich collection of object detection and instance segmentation methods, while MMRotate extends these capabilities to efficiently handle rotated objects, which is crucial for aerial image analysis. By leveraging these toolboxes, we were able to significantly streamline our development process, enabling rapid experimentation with different models and configurations to optimize our detection performance on optical remote sensing datasets.
Taking the DOTA-v1.0 [37] as an example, it is split according to a size of 1024 and a gap of 200. In the ablation study section, we trained for 12 epochs on the training set using eight NVIDIA TITAN RTX GPUs and compared metrics on the validation set. In the comparison with the SOTA (state-of-the-art) methods, we utilized the same hardware setup and trained for 36 epochs using both the training and validation sets combined. The performance of the test set is evaluated on the official DOTA evaluation server.
5. Results
This section presents the comparison results of our study on multiple remote sensing datasets, including the DOTA dataset, DIOR-R dataset, and HRSC2016 dataset. Each subsection contains a comprehensive assessment of the performance of the proposed DETR-ORD model and comparison results with other advanced algorithms on each dataset.
5.1. Validation on DOTA Dataset
The experimental results on DOTA-v1.0 are shown in Table 6. As can be seen from the table, our detector achieves competitive results. It achieves the highest detection performance in the categories of Small Vehicle (SV), Ship (SH), and Tennis Court (TC), with an improvement of 2.02% compared to the baseline detector incorporating image feature reconstruction and dynamic query algorithms. However, overall, there is still a gap compared to the state-of-the-art methods.

Table 6.
DOTA-v1.0 results comparison.
The results on DOTA-v1.5 are shown in Table 7. As can be seen from the table, under the parameter settings of the ResNet50 backbone for various algorithms, our detector achieves the best results in terms of training and validation across multiple scales, specifically in the categories of Baseball Diamond (BD), Bridge (BR), Ground Track Field (GTF), Large Vehicle (LV), Basketball Court (BC), Harbor (HA), Swimming Pool (SP), and mean average precision (mAP).

Table 7.
DOTA-v1.5 results comparison.
We also selected visualization results of the detectors pre- and post-improvement to demonstrate the effectiveness of the improvements, as shown in Figure 7 and Figure 8. The inference results are divided into three parts: the leftmost image shows the ground-truth annotations, the middle image shows the inference results of the detector before improvement, and the rightmost image shows the results after improvement. Figure 7 displays the inference results on DOTA-v1.0. From Figure 7a, it can be seen that in scenes with densely distributed image targets, the improved detector maintains the detection performance for small targets (small vehicles) while showing better performance for other targets. From Figure 7b, it is evident that in scenes with sparsely and repetitively distributed targets, the improved detector achieves higher detection rates and better detection quality.
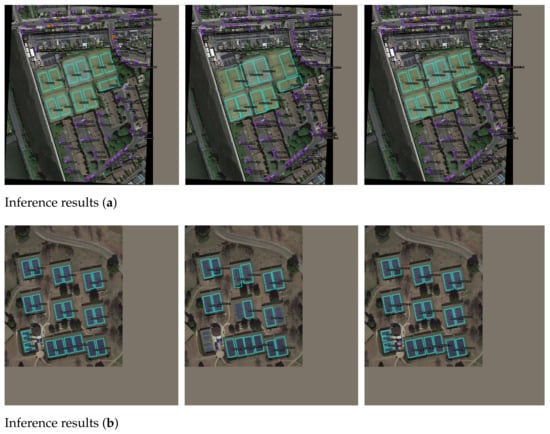
Figure 7.
DOTA-v1.0 Inference results pre- and post-improvement.
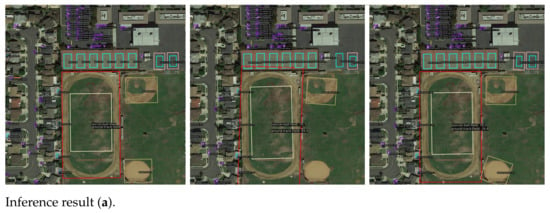
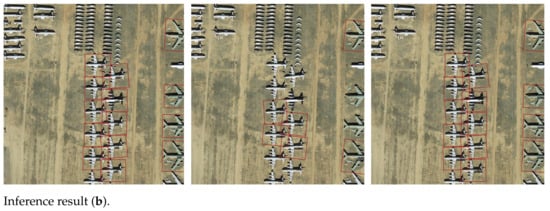
Figure 8.
DOTA-v1.5 inference results pre- and post-improvement.
Figure 8 shows the inference results on DOTA-v1.5. From Figure 8a, it can be seen that in scenes where large, medium, and small targets are all present, the improved detector achieves better accuracy in rotated bounding boxes. From Figure 8b, it is evident that the improved detector achieves higher detection accuracy and recall in scenes with repetitive and overlapping distributions of a single category.
5.2. Validation on DIOR-R Dataset
The comparison results with current mainstream algorithms are shown in Table 8. It can be seen that the detector designed in this paper achieves the optimal overall results with the ResNet50 backbone network. Furthermore, it achieves the best results in the categories of Airport, Bridge, Chimney, Dam, Expressway Toll Station, Golf Course, Harbor, Overpass, Tennis Court, and Vehicle.

Table 8.
Comparison between state-of-the-art detectors using the DIOR-R dataset.
The visualization results pre- and post-improvement are shown in Figure 9. From Figure 9a, it can be seen that in overlapping target scenarios, the improved detector shows no missed detections and provides more accurate predictions. From Figure 9b, it is evident that in regularly repetitive distribution scenarios, the improved detector has no false detections and achieves higher accuracy.
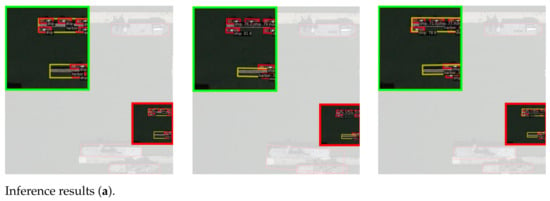
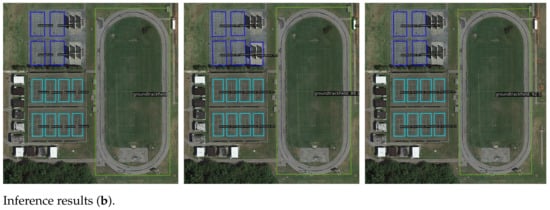
Figure 9.
Inference results pre- and post-improvement on DIOR-R.
5.3. Validation on HRSC2016 Dataset
The performance comparison of the detectors pre- and post-improvement on the HRSC2016 dataset is shown in Table 9. From the table, it can be seen that the detector designed in our paper achieved the optimal overall results on the HRSC2016 dataset and competitive results in both mAP(VOC07) and mAP(VOC12).

Table 9.
Comparison between state-of-the-art detectors using the HRSC2016 dataset.
The detection results with pre- and post-improvement are shown in Figure 10. From the figure, it can be seen that the improved detector has a higher recall rate in scenarios with overlapping and closely spaced objects.

Figure 10.
HRSC2016 inference results with pre- and post-improvement.
6. Discussion
In optical remote sensing image analysis tasks, there are still some challenges when dealing with rotating or arbitrarily oriented targets in complex scenes and problems such as inconsistent size of target distribution and uneven image quality, which are effectively addressed by our proposed model.
6.1. Comparison with Other Models
In the paper, we compare the performance of the DETR-ORD model before and after the improvement and the performance of each state-of-the-art model on each dataset. The improved detector achieves competitive overall results on each dataset. Experimental results on several remote sensing datasets show that the DETR-ORD model proposed in this paper improves mAP by 2.02% compared to the pre-improvement model on the DOTA-v1.0 dataset in the task of optical remote sensing image analysis. On the DOTA-v1.5 dataset, DETR-ORD improves the mAP by 0.28% compared to the superior algorithm and 5.2% compared to the pre-improvement model. On the DIOR-R dataset, DETR-ORD improves the mAP by 2.19% compared to the superior algorithm and by 2.9% compared to the pre-improvement model. On the HRSC2016 dataset, DETR-ORD improves the mAP by 1.41% compared to the pre-improvement model. The figures indicate that the improved detector maintains high precision, accuracy, and recall in scenarios with large variations in target size, densely packed small targets, and overlapping targets. The improved detector in our paper achieved the optimal overall results on the DOTA-v1.5 and DIOR-R datasets and competitive results in both DOTA-v1.0 and HRSC2016 datasets.
6.2. Future Directions: Multi-Scene Optical Oriented Target Detection Task
This paper focuses on the study of a transformer-based DETR-like detector applied to the task of oriented target detection on optical remote sensing images. For future research work, the application of the transformer-based DETR-like detector on low-computing-power devices can be further explored, and the model can be extended to more application scenarios, such as video target detection, multi-target tracking, in order to improve the practicability and adaptability and to increase the speed of the detectors while guaranteeing the detection accuracy. Our model has been extended and validated on retail merchandise image dataset SKU110K-R, scene text detection image dataset MSRA-TD500, and private rubber forest dataset with competitive results.
6.3. Limitations
Like most research, while the DETR-ORD model demonstrates improvements in oriented object detection, there are still some conditions and limitations in which our models sometimes can not obtain more effective results. In certain scenarios with a dense distribution of image targets, the DETR-ORD model sometimes fails to obtain the best detection results on all kinds of targets, and there are still computational efficiency issues in processing the large-scale dataset. In our future work, we will optimize the structure of the DETR-ORD model to improve efficiency and accuracy in oriented remote sensing object detection tasks and apply it to more detection scenarios.
7. Conclusions
In our paper, in light of the limitations of existing DETR-based detectors, which are unsuitable for arbitrary-oriented object detection, the issue of positional information loss due to the transformer architecture, and the constraints on detection performance in dense target scenarios, we propose an oriented object detector based on image structure reconstruction and dynamic queries. This detector optimizes the transformer-based DETR detector by integrating rotational detection, image feature reconstruction, and dynamic query algorithms. The resulting design is an efficient and precisely oriented object detector suitable for multi-task scenarios, demonstrating strong adaptability and practical value.
We presented significant advancements in oriented object detection by integrating the prediction of rotation into the transformer architecture, specifically enhancing the DETR detector. Our adoption of a hybrid encoder, as opposed to the conventional encoder, has notably decreased the computational complexity and the model’s parameter count without sacrificing accuracy. This efficiency is achieved through a novel representation and prediction method for rotating boxes, utilizing the format, and the introduction of algorithms for rotating reference points to ensure encoder-generated interaction reference points for rotating box proposals remain accurate. Moreover, the development of activation and inverse activation functions tailored for rotation accommodates varying standards of rotating angle descriptions, streamlining the prediction process.
Further, we introduced the IFR module, an addition that supervises the memory from feature interactions via self-attention in the encoder. By restoring this memory to multi-layer features and upsampling them back to the original image size, our method effectively counters the loss of spatial positioning information, a common issue in the flattening operation required for self-attention. This module boosts the detector’s performance by enhancing feature reconstruction.
Additionally, we introduced dynamic query by integrating the ATSS method to supplement the Hungarian matching assignment. This innovation includes an extra training branch that allocates more positive samples to each ground truth, significantly improving the quality of the top-k proposals selected by the encoder. This approach addresses the challenge of obtaining high-quality bounding boxes, which has been a problem when relying solely on top-k scores for proposal selection, leading to proposals with high classification scores but low bounding box quality.
In the validation experiments, our improved DETR-based detector demonstrates improvements in optical remote sensing image analysis applications. On the DOTA-v1.0 dataset, it achieves a 2.02% increase in mAP compared to its previous version. On the DOTA-v1.5 dataset, it surpasses leading algorithms by 0.28% mAP and improves 5.2% over its previous version. On the DIOR-R dataset, it exceeds top-performing algorithms by 2.19% mAP and shows a 2.9% improvement over its previous version. For the HRSC2016 dataset, there is a mAP improvement of 1.41% compared to its previous version. These results demonstrate that the improved detector has strong practical value and broad applicability across various scenarios and applications.
Author Contributions
Conceptualization, X.H., K.L. and W.Z.; Methodology, X.H., K.L., W.Z., Z.J., Z.Z. and X.T.; Software, X.H., K.L. and Z.J.; Validation, X.H., K.L. and Z.J.; Formal analysis, X.H.; Investigation, X.H.; Resources, X.H.; Data curation, X.H.; Writing—original draft, X.H.; Writing—review & editing, X.H. and F.L.; Visualization, X.H.; Supervision, X.H.; Project administration, X.H.; Funding acquisition, W.Z. All authors have read and agreed to the published version of the manuscript.
Funding
This work was supported by the Technology and Development Joint Research Foundation of Henan Province (225200810070).
Data Availability Statement
The data presented in this study are available on request from the corresponding author. The data are not publicly available due to privacy.
Conflicts of Interest
The authors declare no conflicts of interest.
Appendix A. Images for Comparison
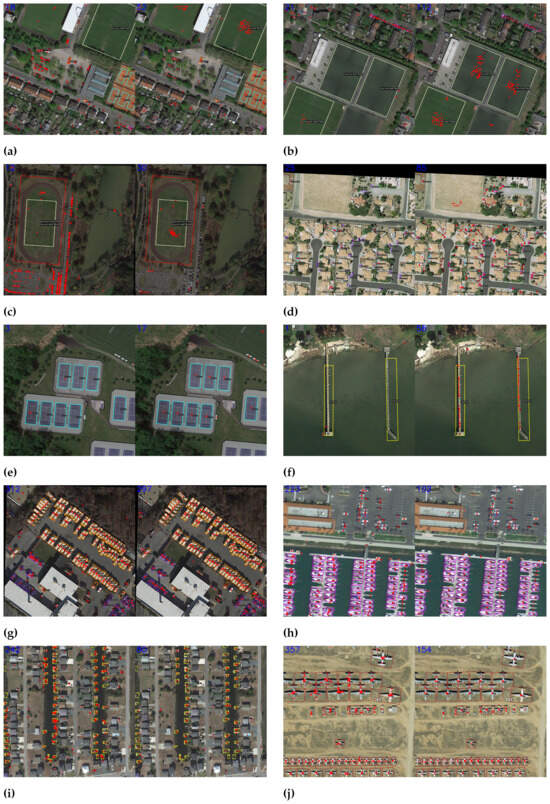
Figure A1.
In each sub-figure, the figures (a,c,e,g,i) show the results without using dynamic queries, while the figure (b,d,f,h,j) shows the results with the use of dynamic queries on the DOTA-v1.0 dataset. The red dots in the images represent the centers of the rotated bounding boxes selected by ATSS used for the query position encoding and reference points in decoder iteration. The blue numbers in the top left corner indicate the number of center points located within the ground truth.
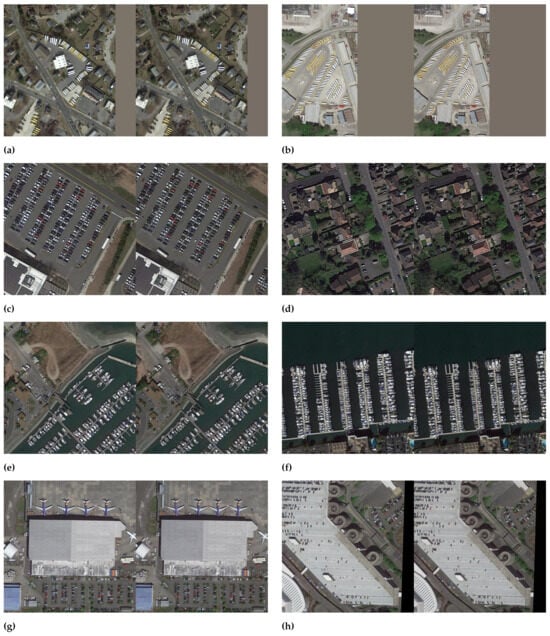
Figure A2.
The inference results of the IFR module. In each sub-figure, the figures (a,c,e,g) are the original images, and the figures (b,d,f,h) are the images reconstructed and restored.
References
- Ding, J.; Xue, N.; Long, Y.; Xia, G.S.; Lu, Q. Learning RoI Transformer for Oriented Object Detection in Aerial Images. In Proceedings of the IEEE/CVF Conference on Computer Vision and Pattern Recognition, Long Beach, CA, USA, 15–20 June 2019; pp. 2849–2858. [Google Scholar]
- Yang, X.; Yang, J.; Yan, J.; Zhang, Y.; Zhang, T.; Guo, Z.; Sun, X.; Fu, K. Scrdet: Towards More Robust Detection for Small, Cluttered and Rotated Objects. In Proceedings of the IEEE/CVF International Conference on Computer Vision, Seoul, Republic of Korea, 27 October–2 November 2019; pp. 8232–8241. [Google Scholar]
- Yang, X.; Yan, J. Arbitrary-Oriented Object Detection with Circular Smooth Label. In Computer Vision—ECCV 2020; Vedaldi, A., Bischof, H., Brox, T., Frahm, J.M., Eds.; Springer International Publishing: Cham, Switzerland, 2020; Volume 12353, pp. 677–694. [Google Scholar] [CrossRef]
- Xu, Y.; Fu, M.; Wang, Q.; Wang, Y.; Chen, K.; Xia, G.S.; Bai, X. Gliding Vertex on the Horizontal Bounding Box for Multi-Oriented Object Detection. IEEE Trans. Pattern Anal. Mach. Intell. 2021, 43, 1452–1459. [Google Scholar] [CrossRef] [PubMed]
- Xie, X.; Cheng, G.; Wang, J.; Yao, X.; Han, J. Oriented R-CNN for Object Detection. In Proceedings of the IEEE/CVF International Conference on Computer Vision, Montreal, BC, Canada, 11–17 October 2021; pp. 3520–3529. [Google Scholar]
- Han, J.; Ding, J.; Xue, N.; Xia, G.S. ReDet: A Rotation-Equivariant Detector for Aerial Object Detection. In Proceedings of the IEEE/CVF Conference on Computer Vision and Pattern Recognition, Nashville, TN, USA, 20–25 June 2021; pp. 2786–2795. [Google Scholar]
- Han, J.; Ding, J.; Li, J.; Xia, G.S. Align Deep Features for Oriented Object Detection. IEEE Trans. Geosci. Remote. Sens. 2022, 60, 5602511. [Google Scholar] [CrossRef]
- Yang, X.; Yan, J.; Feng, Z.; He, T. R3Det: Refined Single-Stage Detector with Feature Refinement for Rotating Object. Proc. AAAI Conf. Artif. Intell. 2021, 35, 3163–3171. [Google Scholar] [CrossRef]
- Yang, X.; Yang, X.; Yang, J.; Ming, Q.; Wang, W.; Tian, Q.; Yan, J. Learning High-Precision Bounding Box for Rotated Object Detection via Kullback-Leibler Divergence. In Proceedings of the Advances in Neural Information Processing Systems; Curran Associates, Inc.: New York, NY, USA, 2021; Volume 34, pp. 18381–18394. [Google Scholar]
- Ming, Q.; Zhou, Z.; Miao, L.; Zhang, H.; Li, L. Dynamic Anchor Learning for Arbitrary-Oriented Object Detection. Proc. AAAI Conf. Artif. Intell. 2021, 35, 2355–2363. [Google Scholar] [CrossRef]
- Pan, X.; Ren, Y.; Sheng, K.; Dong, W.; Yuan, H.; Guo, X.; Ma, C.; Xu, C. Dynamic Refinement Network for Oriented and Densely Packed Object Detection. In Proceedings of the IEEE/CVF Conference on Computer Vision and Pattern Recognition, Seattle, WA, USA, 13–19 June 2020; pp. 11207–11216. [Google Scholar]
- Hou, L.; Lu, K.; Xue, J.; Li, Y. Shape-Adaptive Selection and Measurement for Oriented Object Detection. Proc. AAAI Conf. Artif. Intell. 2022, 36, 923–932. [Google Scholar] [CrossRef]
- Guo, Z.; Zhang, X.; Liu, C.; Ji, X.; Jiao, J.; Ye, Q. Convex-Hull Feature Adaptation for Oriented and Densely Packed Object Detection. IEEE Trans. Circuits Syst. Video Technol. 2022, 32, 5252–5265. [Google Scholar] [CrossRef]
- Li, W.; Chen, Y.; Hu, K.; Zhu, J. Oriented RepPoints for Aerial Object Detection. In Proceedings of the IEEE/CVF Conference on Computer Vision and Pattern Recognition, New Orleans, LA, USA, 18–24 June 2022; pp. 1829–1838. [Google Scholar]
- Carion, N.; Massa, F.; Synnaeve, G.; Usunier, N.; Kirillov, A.; Zagoruyko, S. End-to-End Object Detection with Transformers. arXiv 2020, arXiv:2005.12872. [Google Scholar] [CrossRef]
- Zhu, X.; Su, W.; Lu, L.; Li, B.; Wang, X.; Dai, J. Deformable DETR: Deformable Transformers for End-to-End Object Detection. arXiv 2021, arXiv:2010.04159. [Google Scholar] [CrossRef]
- Liu, S.; Li, F.; Zhang, H.; Yang, X.; Qi, X.; Su, H.; Zhu, J.; Zhang, L. DAB-DETR: Dynamic Anchor Boxes Are Better Queries for DETR. arXiv 2022, arXiv:2201.12329. [Google Scholar] [CrossRef]
- Li, F.; Zhang, H.; Liu, S.; Guo, J.; Ni, L.M.; Zhang, L. DN-DETR: Accelerate DETR Training by Introducing Query DeNoising. In Proceedings of the IEEE/CVF Conference on Computer Vision and Pattern Recognition, New Orleans, LA, USA, 18–24 June 2022; pp. 13619–13627. [Google Scholar]
- Zhang, H.; Li, F.; Liu, S.; Zhang, L.; Su, H.; Zhu, J.; Ni, L.M.; Shum, H.Y. DINO: DETR with Improved DeNoising Anchor Boxes for End-to-End Object Detection. arXiv 2022, arXiv:2203.03605. [Google Scholar] [CrossRef]
- Zong, Z.; Song, G.; Liu, Y. DETRs with Collaborative Hybrid Assignments Training. arXiv 2023, arXiv:2211.12860. [Google Scholar] [CrossRef]
- Lv, W.; Xu, S.; Zhao, Y.; Wang, G.; Wei, J.; Cui, C.; Du, Y.; Dang, Q.; Liu, Y. DETRs Beat YOLOs on Real-time Object Detection. arXiv 2023, arXiv:2304.08069. [Google Scholar] [CrossRef]
- Li, Q.; Chen, Y.; Zeng, Y. Transformer with Transfer CNN for Remote-Sensing-Image Object Detection. Remote Sens. 2022, 14, 984. [Google Scholar] [CrossRef]
- Zhang, Y.; Liu, X.; Wa, S.; Chen, S.; Ma, Q. GANsformer: A Detection Network for Aerial Images with High Performance Combining Convolutional Network and Transformer. Remote Sens. 2022, 14, 923. [Google Scholar] [CrossRef]
- Tang, J.; Zhang, W.; Liu, H.; Yang, M.; Jiang, B.; Hu, G.; Bai, X. Few Could Be Better than All: Feature Sampling and Grouping for Scene Text Detection. In Proceedings of the IEEE/CVF Conference on Computer Vision and Pattern Recognition, New Orleans, LA, USA, 18–24 June 2022; pp. 4563–4572. [Google Scholar]
- Liu, X.; Ma, S.; He, L.; Wang, C.; Chen, Z. Hybrid Network Model: TransConvNet for Oriented Object Detection in Remote Sensing Images. Remote. Sens. 2022, 14, 2090. [Google Scholar] [CrossRef]
- Pu, Y.; Wang, Y.; Xia, Z.; Han, Y.; Wang, Y.; Gan, W.; Wang, Z.; Song, S.; Huang, G. Adaptive Rotated Convolution for Rotated Object Detection. In Proceedings of the 2023 IEEE/CVF International Conference on Computer Vision (ICCV), Paris, France, 1–6 October 2023; pp. 6566–6577. [Google Scholar] [CrossRef]
- Zheng, Y.; Sun, P.; Zhou, Z.; Xu, W.; Ren, Q. ADT-Det: Adaptive Dynamic Refined Single-Stage Transformer Detector for Arbitrary-Oriented Object Detection in Satellite Optical Imagery. Remote Sens. 2021, 13, 2623. [Google Scholar] [CrossRef]
- Dai, Y.; Yu, J.; Zhang, D.; Hu, T.; Zheng, X. RODFormer: High-Precision Design for Rotating Object Detection with Transformers. Sensors 2022, 22, 2633. [Google Scholar] [CrossRef]
- Ma, T.; Mao, M.; Zheng, H.; Gao, P.; Wang, X.; Han, S.; Ding, E.; Zhang, B.; Doermann, D. Oriented Object Detection with Transformer. arXiv 2021, arXiv:2106.03146. [Google Scholar] [CrossRef]
- Lee, G.; Kim, J.; Kim, T.; Woo, S. Rotated-DETR: An End-to-End Transformer-based Oriented Object Detector for Aerial Images. In Proceedings of the 38th ACM/SIGAPP Symposium on Applied Computing, Tallinn, Estonia, 27–31 March 2023; pp. 1248–1255. [Google Scholar] [CrossRef]
- Dai, L.; Liu, H.; Tang, H.; Wu, Z.; Song, P. AO2-DETR: Arbitrary-Oriented Object Detection Transformer. IEEE Trans. Circuits Syst. Video Technol. 2023, 33, 2342–2356. [Google Scholar] [CrossRef]
- Zhou, Q.; Yu, C.; Wang, Z.; Wang, F. D2Q-DETR: Decoupling and Dynamic Queries for Oriented Object Detection with Transformers. In Proceedings of the ICASSP 2023—2023 IEEE International Conference on Acoustics, Speech and Signal Processing (ICASSP), Rhodes Island, Greece, 4–10 June 2023; pp. 1–5. [Google Scholar] [CrossRef]
- Hu, Z.; Gao, K.; Zhang, X.; Wang, J.; Wang, H.; Yang, Z.; Li, C.; Li, W. EMO2-DETR: Efficient-Matching Oriented Object Detection With Transformers. IEEE Trans. Geosci. Remote Sens. 2023, 61, 5616814. [Google Scholar] [CrossRef]
- Pu, Y.; Liang, W.; Hao, Y.; YUAN, Y.; Yang, Y.; Zhang, C.; Hu, H.; Huang, G. Rank-DETR for High Quality Object Detection. In Proceedings of the Advances in Neural Information Processing Systems; Oh, A., Naumann, T., Globerson, A., Saenko, K., Hardt, M., Levine, S., Eds.; Curran Associates, Inc.: New York, NY, USA, 2023; Volume 36, pp. 16100–16113. [Google Scholar]
- He, K.; Zhang, X.; Ren, S.; Sun, J. Deep Residual Learning for Image Recognition. In Proceedings of the IEEE Conference on Computer Vision and Pattern Recognition, Las Vegas, NV, USA, 27–30 June 2016; pp. 770–778. [Google Scholar]
- Zhang, S.; Chi, C.; Yao, Y.; Lei, Z.; Li, S.Z. Bridging the Gap Between Anchor-based and Anchor-free Detection via Adaptive Training Sample Selection. arXiv 2020, arXiv:1912.02424. [Google Scholar] [CrossRef]
- Xia, G.S.; Bai, X.; Ding, J.; Zhu, Z.; Belongie, S.; Luo, J.; Datcu, M.; Pelillo, M.; Zhang, L. DOTA: A Large-Scale Dataset for Object Detection in Aerial Images. In Proceedings of the IEEE Conference on Computer Vision and Pattern Recognition, Salt Lake City, UT, USA, 18–23 June 2018; pp. 3974–3983. [Google Scholar]
- Cheng, G.; Wang, J.; Li, K.; Xie, X.; Lang, C.; Yao, Y.; Han, J. Anchor-Free Oriented Proposal Generator for Object Detection. IEEE Trans. Geosci. Remote. Sens. 2022, 60, 5625411. [Google Scholar] [CrossRef]
- Liu, Z.; Yuan, L.; Weng, L.; Yang, Y. A High Resolution Optical Satellite Image Dataset for Ship Recognition and Some New Baselines. In Proceedings of the International Conference on Pattern Recognition Applications and Methods, Porto, Portugal, 24–26 February 2017; SCITEPRESS: Setúbal, Portugal, 2017; Volume 2, pp. 324–331. [Google Scholar] [CrossRef]
- Chen, K.; Wang, J.; Pang, J.; Cao, Y.; Xiong, Y.; Li, X.; Sun, S.; Feng, W.; Liu, Z.; Xu, J.; et al. MMDetection: Open MMLab Detection Toolbox and Benchmark. arXiv 2019, arXiv:1906.07155. [Google Scholar]
- Zhou, Y.; Yang, X.; Zhang, G.; Wang, J.; Liu, Y.; Hou, L.; Jiang, X.; Liu, X.; Yan, J.; Lyu, C.; et al. MMRotate: A Rotated Object Detection Benchmark using PyTorch. In Proceedings of the 30th ACM International Conference on Multimedia, Lisbon, Portugal, 10–14 October 2022. [Google Scholar]
- Zeng, Y.; Yang, X.; Li, Q.; Chen, Y.; Yan, J. ARS-DETR: Aspect Ratio Sensitive Oriented Object Detection with Transformer. arXiv 2023, arXiv:2303.04989. [Google Scholar] [CrossRef]
- Lin, T.Y.; Goyal, P.; Girshick, R.; He, K.; Dollar, P. Focal Loss for Dense Object Detection. In Proceedings of the IEEE International Conference on Computer Vision, Venice, Italy, 22–29 October 2017; pp. 2980–2988. [Google Scholar]
- He, K.; Gkioxari, G.; Dollar, P.; Girshick, R. Mask R-CNN. In Proceedings of the IEEE International Conference on Computer Vision, Venice, Italy, 22–29 October 2017; pp. 2961–2969. [Google Scholar]
- Chen, K.; Pang, J.; Wang, J.; Xiong, Y.; Li, X.; Sun, S.; Feng, W.; Liu, Z.; Shi, J.; Ouyang, W.; et al. Hybrid Task Cascade for Instance Segmentation. In Proceedings of the IEEE/CVF Conference on Computer Vision and Pattern Recognition, Long Beach, CA, USA, 15–20 June 2019; pp. 4974–4983. [Google Scholar]
- Ren, S.; He, K.; Girshick, R.; Sun, J. Faster R-CNN: Towards Real-Time Object Detection with Region Proposal Networks. IEEE Trans. Pattern Anal. Mach. Intell. 2017, 39, 1137–1149. [Google Scholar] [CrossRef]
Disclaimer/Publisher’s Note: The statements, opinions and data contained in all publications are solely those of the individual author(s) and contributor(s) and not of MDPI and/or the editor(s). MDPI and/or the editor(s) disclaim responsibility for any injury to people or property resulting from any ideas, methods, instructions or products referred to in the content. |
© 2024 by the authors. Licensee MDPI, Basel, Switzerland. This article is an open access article distributed under the terms and conditions of the Creative Commons Attribution (CC BY) license (https://creativecommons.org/licenses/by/4.0/).