Abstract
This paper investigates the impact characteristics of the 4 November 2021 magnetic storm across different frequency bands based on the electric field data (EFD) from the China Seismo-Electromagnetic Satellite (CSES), categorized into four frequency bands: ULF (Ultra-Low-Frequency, DC to 16 Hz), ELF (Extremely Low-Frequency, 6 Hz to 2.2 kHz), VLF (Very Low-Frequency, 1.8 to 20 kHz), and HF (High-Frequency, 18 kHz to 3.5 MHz). The study reveals that in the ULF band, magnetic storm-induced electric field disturbances are primarily in the range of 0 to 5 Hz, with a significant disturbance frequency at 3.9 ± 1.0 Hz. Magnetic storms also enhance Schumann waves in the ULF band, with 8 Hz Schumann waves dominating in the southern hemisphere and 13 Hz Schumann waves dominating in the northern hemisphere. In the ELF band, the more pronounced anomalies occur at 300 Hz–900 Hz and above 1.8 kHz, with the 300 Hz–900 Hz band anomalies around 780 Hz being the most significant. In the VLF band, the electric field anomalies are mainly concentrated in the 3–15 kHz range. The ELF and VLF bands exhibit lower absolute and relative disturbance increments compared to the ULF band, with the relative perturbation growth rate in the ULF band being approximately 10% higher than in the ELF and VLF bands. Magnetic storm-induced electric field disturbances predominantly occur in the ULF, ELF, and VLF bands, with the most significant disturbances in the ULF band. The electric field perturbations in these three frequency bands exhibit hemispheric asymmetry, with strong perturbations in the northern hemisphere occurring earlier than in the southern hemisphere, corresponding to different Dst minima. No electric field disturbances were observed in the HF band (above 18 kHz). The conclusions of this paper are highly significant for future anti-jamming designs in spacecraft and communication equipment, as well as for the further study of magnetic storms.
1. Introduction
Magnetic storms, also known as solar storms, are phenomena where energetic particles and magnetic fields in the solar wind interact with the Earth’s magnetic field. These interactions can lead to violent disturbances in the Earth’s magnetosphere, causing sharp changes in the Earth’s magnetic field [1,2]. Geomagnetic storms are typically caused by disturbances in solar wind and are accompanied by a prolonged southward interplanetary magnetic field. These events release substantial amounts of energy and charged particles, which are carried through space by the solar wind [3,4,5]. When these charged particles interact with the Earth’s magnetic field, they can trigger a complex array of phenomena. In extreme cases, magnetic storms can severely impact the Earth’s communication and navigation systems [6,7,8,9]. Identifying the specific frequencies affected by magnetic storms will not only aid in the in-depth study of these phenomena, but also be crucial for the anti-jamming design of spacecraft and communication equipment.
The primary data used to study magnetic storms include interplanetary magnetic field and solar wind data, ionospheric and magnetospheric data, and geomagnetic disturbance indices. However, interplanetary signature data or geomagnetic disturbance indices do not identify specific frequencies and bands affected by magnetic storms. It is the use of electric and magnetic field data that allows for in-depth study of this topic. With advances in space technology, mankind began to utilize satellites and other space probes to observe solar activity and magnetic storms. Observation of the Earth’s magnetic field from space began more than 60 years ago. However, continuous monitoring of the geomagnetic field using low-Earth-orbit (LEO) satellites did not begin until 1999 [10]. Since the launch of DEMETER in 2004, the satellite has provided technical support for direct observation of the ionospheric electric field [11]. In 2018, the CSES-1 satellite was launched and became the second LEO satellite capable of directly observing changes in the electric field in space in the F-region of the ionosphere [12].
The use of satellite electric and magnetic field data to study frequencies with significant perturbations caused by anomalous space phenomena has been partially investigated by previous researchers. In 2002, Trautner [13] analyzed electric field data in the frequency range of 10 Hz to 300 Hz during magnetic storms, including the Schumann resonance frequency, and concluded that the peaks of the perturbation signals were concentrated in the range of 10 to 200 Hz. Parkhomov [14] observed short bursts of geomagnetic pulsations in the frequency range of 0.2 to 5 Hz during magnetic storms, with a global maximum at a frequency of 2.78 ± 0.38 Hz. Although a preliminary range of anomalous frequencies has been identified in the ULF band, the most significant specific frequencies affected by magnetic storms have not yet been determined.
In the ULF band, the study of Pc waves constitutes a significant aspect of ULF wave research. As early as 1993, Fraser-Smith [15] conducted electromagnetic monitoring of ULF waves and found that ELF/VLF waves are much less affected than ULF waves when a magnetic storm is approaching. It has been demonstrated that the response of ULF waves during magnetic storms is closely related to geomagnetic activity and solar parameters [16]. ULF wave power is linearly correlated with the absolute value of the SYM-H index during the main phase of the storm and exponentially correlated with the absolute value of the SYM-H index during the recovery phase [17]. The intensity of geomagnetic pulsations with a frequency of 27 mHz during the initial phase of the magnetic storm reaches a maximum in the morning and night segments at polar and auroral latitudes, respectively. Daytime Pc5 wave pulsations are strongest during the main phase of the magnetic storm, not during the recovery phase as previously thought [18,19]. Different interplanetary sources cause varying pulsation strengths. The higher latitude position of the Pc5 pulsation intensity maximum in CIR storms suggests larger dimensions of the daytime magnetosphere during CIR storms compared to CME storms [20].
In the ELF and VLF bands, Tatsuta [21] analyzed two years of nightly data from the VLF/LF observation network in Japan and found that high latitudes are more affected by geomagnetic activity compared to mid-latitude and low-mid-latitude paths. During the strong magnetic storm from 8 to 10 November 2004, intense electromagnetic harmonic emissions between 500 and 2000 Hz were detected at mid-latitudes. Similar emissions were also observed on 21–22 January 2005 and on 15 May 2005 during two magnetic storms of lower intensity [22]. Pinto and Gonzalez [23] suggest that the enhancement of these waves during geomagnetic storms and substorms is characterized by a peak at 550 Hz and that their intensity is highly dependent on magnetic activity. Zhima [24,25] found that very low-frequency waves below 3 kHz were significantly enhanced throughout the magnetic storm, whereas high-frequency waves above 3 kHz were significantly enhanced in the later part of the main phase and the earlier part of the recovery phase.
In the study of the HF band, Blagoveshchenskii [26] analyzed the manifestation of the so-called main ionospheric effect on the propagation properties of ten-meter waves during geomagnetic storms. Specifically, these parameters increase before the active phase of the disturbance, decrease during the active phase, and increase again after this phase. Since the response of magnetic storms in the HF band is not as pronounced as in the ULF/ELF/VLF bands, fewer studies have been conducted on magnetic storms using the HF band.
Although it is widely accepted that magnetic storms affect different frequencies and bands differently, detailed conclusions regarding specific frequencies and bands are lacking. In this paper, we utilize EFD spectrum data from CSES-1 to investigate the spectral characteristics of frequencies and bands exhibiting strong disturbances in different regions during the magnetic storm activity (Dst < −100 nT) on 4 November 2021. This paper fills a gap in the study of the frequency and band of strong ionospheric disturbances during magnetic storms.
2. Materials and Methods
The main scientific objective of the CSES-1 [12] is to monitor ionospheric perturbations associated with natural hazards in the quest for possible anomaly forecasting. The CSES-1 completes 15.2 orbits around Earth per day, with an orbital period of ~94.6 min and a five-day recursive period over the same geographic area with the ascending/descending node local time of 02 a.m./02 p.m., respectively. Orbit altitude is 507 km. Eight payloads are assembled on CSES-1, that is, a high-precision magnetometer (HPM), search coil magnetometer (SCM), electric field detector (EFD), Langmuir probe (LA), plasma analyzer (PAP), high-energy particle detector (HEPD), GNSS occultation receiver (GOR), and tri-band beacon (TBB). The entire satellite is capable of acquiring 17.6 h of scientific exploration data per day and has the capability of continuous exploration within the latitude of 65° north and south at all hours of the day [27].
The electric field is detected by an electric field detector (EFD). The EFD is an advanced detector for space-based measurements of electric fields in a wide frequency band, specifically conceived for operation in the ionosphere–magnetosphere transition zone. The instrument, designed to be installed on the 3-axis stabilized CSES-1 satellite, includes: 4 probes exposed to the ionospheric plasma, accommodated on the tips of 4 booms (each of them four meters long, deployed far from the spacecraft body in order to reduce the electromagnetic disturbances induced by the satellite equipment) and a data acquisition unit (for signal conditioning, sampling of input signals and spectral analysis). The electric field detector (EFD) data of the CSES-1 satellite has waveform data (mV/m) and PSD (Hz) data. The PSD data are obtained by Fourier transform of the waveform data. EFD retrieves the electric field components measured between pairs of probes in the following bands: ULF (Ultra-Low-Frequency, DC to 16 Hz), ELF (Extremely Low-Frequency, from 6 Hz to 2.2 kHz), VLF (Very Low-Frequency, 1.8 to 20 kHz), and HF (High-Frequency, from 18 kHz to 3.5 MHz), with sampling rates of 128 Hz, 5 kHz, 50 kHz, and 10 MHz, respectively.
In this paper, EFD power spectrum data (PSD) and Dst data are used to study the spatial and temporal characteristics of different magnetic storms, where the PSD data of the electric field are from CSES-1 (https://www.leos.ac.cn/), the SML index data are from the website (https://supermag.jhuapl.edu/), and the Dst data are from the website (https://wdc.kugi.kyoto-u.ac.jp/index.html (accessed on 10 May 2024)).
2.1. Satellite Data Process
We use the average degree of difference between electric field data and the background field data during magnetic storms, which we call the D value, as a criterion for determining the magnitude of the effect of magnetic storms. The background field data are set to be a revisited orbit in a quiet period (with Dst values ranging from −30 to 30 nT) within one month before the current orbit. Since the revisit period of the CSES-1 satellite is 5 days, a date with an interval of multiple of 5 can be used as the background field. Because the Dst values from 28 October 2021 to 1 November 2021 are within the range above, it is a quiet period. Therefore, the electric field power spectrum data of these 5 days are selected as the background field data. The power spectrum of the satellite electric field with background noise removed for the selected latitude width is
The average degree of difference of frequency j is
The variation growth rate is
is the selected latitude width. is the satellite electric field power spectrum for the selected latitude width. is the value of the quiet period.
2.2. Wavelet Coherence (WTC) Analysis
This work uses wavelet coherence (WTC) to analyze the correlation between electric field power sequences and Dst values at different frequencies. Continuous Wavelet Transform (CWT) and Discrete Wavelet Transform (DWT) are the two types of WT. Because of its appropriate time and frequency localization, the Morlet wavelet (dimensionless frequency, ) is an ideal option for extracting features [28]. The WTC spectrum quantifies the degree to which two-time series co-vary as functions of time and frequency. The XWT spectrum exposes large shared power areas and relative phases between two-time series in time frequency space [29,30]. The XWT of two-time series X(t) and Y(t) is defined as
The CWT coefficients of sequences and at frequency scale s are denoted by , and respectively, and denotes the complex conjugate.
The square of the wavelet coherence factor is defined as
is the smoothing operator and is the scale. WTC values around 1 indicate a higher degree of resemblance across time series, whilst coherence values near 0 indicate no correlation.
This paper focuses on the analysis of the 4 January 2021 magnetic storm by examining data from two days before and two days after the storm, covering the initial, main, and recovery phases. After removing background noise through satellite data processing, we conducted a quantitative analysis of the magnetic storm’s impact on different hemispheres and frequency bands using D value analysis, variation growth rate analysis, and WTC analysis. This analysis identified the strong disturbance frequencies and frequency bands of the magnetic storm, as well as its spatial and temporal characteristics. The technical route of this paper is shown in Figure 1.
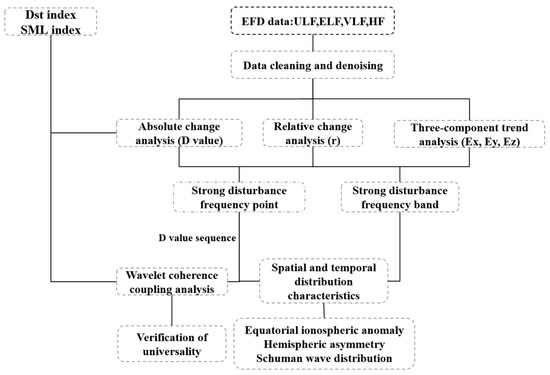
Figure 1.
Technical route flow chart.
3. Results
3.1. Single-Frequency PSD Analysis
To understand the responses of different frequency bands to magnetic storms, we first denoised the satellite electric field data and then obtained the power spectrum data (PSD) of four frequency bands (Figure 2 and Figure 3). Figure 2 and Figure 3 illustrate three frequencies from the ULF, ELF, VLF, and HF bands, respectively, to observe the changes during the initial, main, and recovery phases of the magnetic storms. The main phase is highlighted by red rectangles.
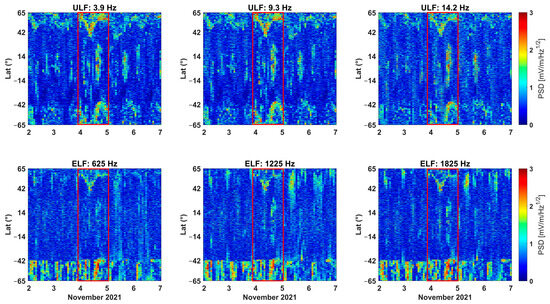
Figure 2.
ULF, ELF single-frequency PSD (the red rectangle is the main phase period).
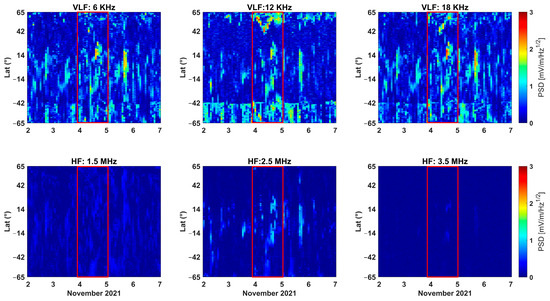
Figure 3.
VLF, HF single-frequency PSD (the red rectangle is the main phase period).
Three frequencies, 3.9 Hz, 9.3 Hz, and 14.2 Hz, were selected for the ULF band. These three frequencies showed significant disturbance enhancement on 4 November 2021 (blue indicates quiet, red indicates disturbance). The main disturbance area is above 22°, and the latitudinal extent of the disturbance varies over time. In the southern hemisphere, the latitudinal extent of the disturbance gradually widens. In the northern hemisphere, the latitudinal range of the disturbance first widens and then narrows. An electric field disturbance with a duration of about 1 h (two orbits have color anomalies and one orbit’s observation time is 0.5 h) occurs in the middle and low latitudes. The red anomalies at 3.9 Hz and 9.3 Hz are darker than those at 14.2 Hz, indicating that the disturbance strength at these two frequencies is greater than that at 14.2 Hz.
In the ELF band, significant electric field disturbances were observed in the northern hemisphere during the main phase of the magnetic storm. The disturbance pattern is similar to that of the ULF band, with the red anomalous region being smaller in color intensity and density. This indicates that the disturbance intensity and extent in the ELF band are smaller than those in the ULF band. In the southern hemisphere, there is a constant electric field disturbance in the range of 42°N to 65°N. A deepening of the red color during the main phase indicates a strengthening of the constant electric field perturbation, although the exact perturbation requires quantitative analysis later. Among the three frequencies in the ELF band, the electric field perturbation is stronger at 1825 Hz than at 625 Hz and 1225 Hz.
There are significant differences in the perturbations at different frequencies in the VLF band. The 12 kHz frequency point shows obvious disturbances in the northern hemisphere, the 18 kHz frequency point shows slightly weaker disturbances, and the 6 kHz frequency point shows almost no disturbances. In the southern hemisphere, there is a constant disturbance in the VLF band in the range of 42°N to 65°N, which is weaker than that in the ELF band. No significant electric field perturbations are observed at any of the three frequencies in the HF band.
Comparing the four frequency bands, the frequencies in the ULF, ELF, and VLF bands all show electric field perturbations during magnetic storms, whereas the frequencies in the HF band show almost no perturbations. From the several frequencies illustrated in the figure, the ULF band shows obvious electric field disturbances in both the northern and southern hemispheres, while the ELF and VLF bands show obvious electric field disturbances only in the northern hemisphere. The range of electric field disturbances in the ULF band is larger than that in the ELF and VLF bands. Magnetic storms do not significantly affect the HF band.
3.2. ULF Band’ D Value Analysis
As discussed above, the responses of magnetic storms observed at different frequencies are different. The prevalent view of the storm–substorm relationship has been that substorms are the main building blocks of storms [13]. Although this view was questioned, both magnetic storms and substorms have an effect on the ionosphere [1], and magnetic storms and substorms generally occur in tandem. A substorm event was also present during the 4 November 2021 magnetic storm event. The disturbances recorded in the satellite electric field were the result of a combination of magnetic storms and substorms.
Each frequency band contains many frequencies, and it is insufficient to analyze them using the PSD plots of a single frequency point. Therefore, it is necessary to analyze all frequencies collectively to identify the frequencies and bands most disturbed by magnetic storms. From the above analysis, the disturbance caused by magnetic storms varies across different regions. Therefore, the world is divided into three regions for analysis: 65°S to 65°N, 22°S to 65°S, 22°S to 22°N, and 22°N to 65°N. Table 1 lists the maximum D values of the different bands, the corresponding frequencies, and the frequency bands that are most disturbed.

Table 1.
Statistics of significant disturbances in frequencies and bands (with maximum disturbance frequencies in parentheses).
Figure 4 shows the Dst index (a), SML index (b), and the D values from 1 November 2021 to 7 November 2021. The Dst index represents the intensity of the magnetic storm and the SML index represents the intensity of the substorm. The Dst index decreases sharply during magnetic storms, and the D values also show significant changes. The D values in all four regions increase from approximately 0–1 to about 2 during the quiet period. Comparing the high and middle-to-low latitudes in the northern and southern hemispheres reveals a clear difference in the anomalous enhancement of the electric field in the ULF band. In the ranges 65°S to 65°N (c), 22°S to 65°S (d), and 22°S to 22°N (e), the maximum perturbation orbits correspond to the second Dst minimum. The maximum perturbation orbits in the range 22°N to 65°N (f) correspond to the first minimum. A clear hemispheric asymmetry is observed. The maximum D value in the range of 65°S to 65°N (c) occurs near 13 Hz, and the D value is essentially above 1.8 throughout the band. This is consistent with the perturbation in the range 22°S to 22°N (e), where the maximum frequency point of the perturbation is 13.2 Hz, corresponding to a maximum D value of 2.83. In contrast, the maximum frequency point of the perturbation in the ranges 22°S to 65°S and 22°N to 65°N is not around 13 Hz, but is in the frequency band of 0–5 Hz. The maximum D value in the range of 22°S to 65°S (d) is 1.81, corresponding to a frequency point of 4.4 Hz. The maximum D value in the range of 22°N to 65°N (f) is 2.30, corresponding to a frequency point of 2.9 Hz. In the different regions, the orbits with large disturbances are generally two orbits (each with an observation time of about 0.5 h), indicating that the time from strong disturbance to recovery is about 1 h.
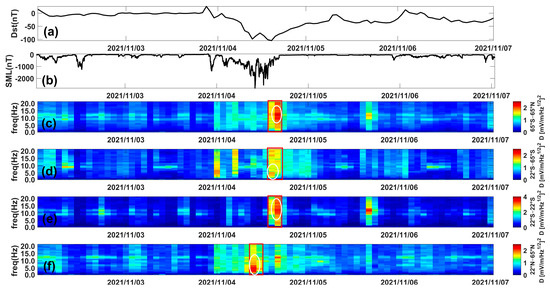
Figure 4.
(a) Dst, (b) SML, and (c) ULF value in 65°N–65°S; (d) ULF value in 22°S–65°S; (e) ULF value in 22°N–22°S; (f) ULF value in 22°N–65°N (the red rectangle is the most disturbed orbits, and strongly disturbed frequency bands are circled in white).
3.3. ELF Band’ D Value Analysis
In the ELF band, disturbance is intensified by a change in the full-band D value from 0–1 to 1–2 at the second Dst minimum across the range of 65°S to 65°N. As analyzed in Section 3.1, there is a constant electric field perturbation in the ELF band in the southern hemisphere, making it impossible to directly observe the electric field perturbation induced by magnetic storms in this region. According to Figure 5, there is a disturbance corresponding to the second minimum value of Dst in the range of 65°S to 65°N (c), with a disturbance strength of approximately 1. However, the D values in the ranges of 22°N to 22°S (e) and 22°N to 65°N (f) are generally less than 1. Therefore, the disturbance of D values in the range of 65°S to 65°N (c) originates from the range of 22°S to 65°S (d). There is a perturbed response to magnetic storms in the range of 22°S to 65°S (d) with a perturbation intensity greater than 1. The maximum D value in the range of 22°S to 65°S (d) is 3.25 (Table 1), corresponding to a frequency point of 2441 Hz. Due to the presence of a constant perturbation, the value of 3.25 cannot be considered as the magnitude of the perturbation caused by the magnetic storm. Besides the frequency 2500 Hz, there is also a strong disturbance band between 300 Hz and 900 Hz. Zhang et al. (2022) used satellite electric field data at 225, 725, 1125, 5000, 7500, and 13,500 Hz in their study of electric field disturbances induced by magnetic storms. Their results show that the electric field anomalies are most pronounced at 725 Hz, which agrees with the conclusions of our analysis.
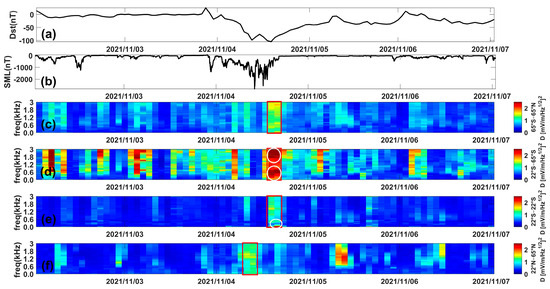
Figure 5.
Same as Figure 4 but for the ELF band (the red rectangle is the most disturbed orbits, and strongly disturbed frequency bands are circled in white).
The maximum D value in the range of 22°N to 65°N (f) does not exceed 2, and no distinct strong perturbation frequency point or band is observed. In the range of 22°S to 22°N (e), there is a strong perturbation band below 300 Hz. Due to the broad range of the ELF band, specific strong perturbation frequency bands cannot be directly identified. Consequently, we analyze the frequency range from 0 to 300 Hz by segmenting the ELF band (Figure 6). It can be observed that electric field disturbances in the range of 22°S to 22°N (e) are primarily below 100 Hz. During this magnetic storm event, the frequency band of equatorial ionospheric anomalies, induced by penetrating electric fields from high to low latitudes, ranges from 0 to 100 Hz.

Figure 6.
The latitude range is 22°S–22°N and the frequency range is 0–300 Hz (the red rectangle is the most disturbed orbits).
3.4. VLF Band’ D Value Analysis
In the VLF band, magnetic storm-induced electric field anomalies are concentrated in the frequency range of 2.5 to 10 kHz across the latitude range of 65°S to 65°N (Figure 7). A constant electric field disturbance is observed around 4–5 kHz, primarily originating from the southern hemisphere. Magnetic storm-induced anomalies at high latitudes in the southern hemisphere are primarily concentrated between 3 and 10 kHz, with the strongest anomaly occurring at 5396 Hz, corresponding to a D value of 3.82. Since this frequency falls within the range of constant disturbances, the D value cannot be used to quantify the strength of magnetic storm disturbances. However, aside from the constant interference band, the 3–10 kHz range shows significant enhancement, with D values exceeding 2. Electric field disturbances in the 22°N to 22°S (d) range are also slightly enhanced. However, disturbances at middle and low latitudes are weak and insignificant compared to those at high latitudes in both hemispheres. In the northern hemisphere, electric field anomalies are concentrated between 6 and 15 kHz, with a peak anomaly frequency around 8887 Hz and a maximum D value of 1.93. As there is no constant electric field perturbation in the northern hemisphere, the D value of 1.93 can be considered indicative of the strength of magnetic storm-induced electric field perturbations. The anomalous bands in the northern and southern hemispheres roughly overlap, with VLF band anomalies caused by strong magnetic storms predominantly occurring in the 3 to 15 kHz range. Electric field disturbances in the VLF band above 18 kHz are relatively minor.
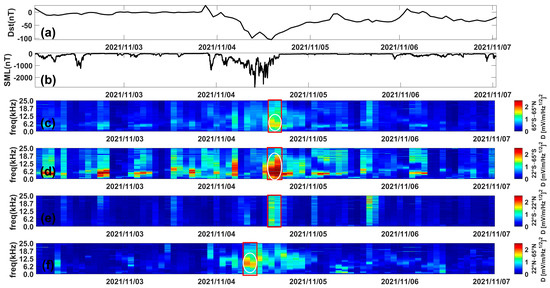
Figure 7.
Same as Figure 4 but for the VLF band (the red rectangle is the most disturbed orbits, and strongly disturbed frequency bands are circled in white).
3.5. HF Band’ D Value Analysis
In the HF band, the impact of magnetic storms is nearly negligible compared to the electric field anomalies observed in the ULF, ELF, and VLF bands, with maximum D values in different regions being less than 1 (Figure 8). Consistent with the findings in the VLF band, the impact of magnetic storms diminishes above 18 kHz and is virtually negligible in the HF band.
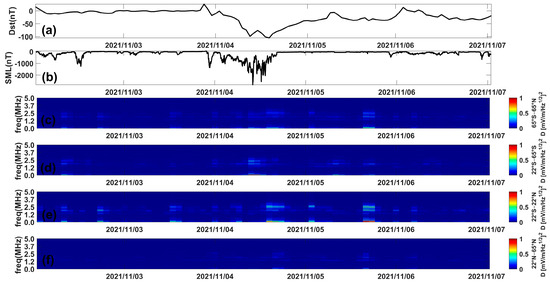
Figure 8.
Same as Figure 4 but for the HF band.
In conclusion, the frequency bands affected by magnetic storms are the ULF, ELF, and VLF bands. All three bands exhibit more pronounced perturbations at high latitudes, with only the ULF band showing significant enhancement of electric field perturbations near the Schumann wave frequency point at middle and low latitudes. Overall, the ULF band shows a greater response to magnetic storms compared to the ELF and VLF bands. However, the D value only indicates the absolute increment. To obtain a more accurate assessment, the growth rate of perturbations across different frequency bands needs to be calculated.
3.6. Comparison of Ex, Ey and Ez
Since the satellite electric field has three components, and the Ex component was used in the previous study, to ensure the reliability of the conclusions, the trends of all three components need to be consistent. This section discusses the consistency of the three components based on the disturbance maximal orbit. Since the electric field components Ex, Ey, and Ez, after background noise removal, exhibit more outliers, we employ the median absolute deviation (MAD) method to eliminate these anomaly outliers. Subsequently, the sliding averages method [31] is applied to smooth the signal, which reduces random noise while preserving the original trend. Figure 9 illustrates the three-component electric field plots for the 22°S to 65°S and 22°N to 65°N ranges across the four bands of the perturbed maximum orbit. The figure shows that the trends of the curves for the different electric field components Ex, Ey, and Ez are essentially consistent, with only slight variations in the magnitudes of the energy amplitudes.
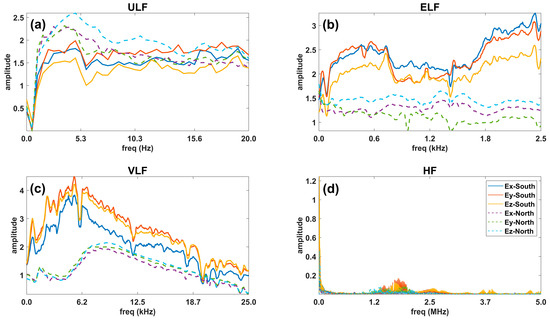
Figure 9.
Three-component comparison of the disturbance maximal orbital quad band. (a) ULF, (b) ELF, (c) VLF, (d) HF.
In the ULF band, the trend is consistent between the northern and southern hemispheres, characterized by an initial increase followed by a decrease, with an extreme value observed in the 0–5 Hz range. This value decreases after reaching its peak and subsequently stabilizes. In contrast, trends in the ELF and VLF bands are not consistent between the hemispheres. In the ELF band, the southern hemisphere shows a maximum near 2441 Hz, whereas the northern hemisphere does not exhibit any significant extreme values. In the VLF band, the southern hemisphere exhibits an extreme value at 5.40 kHz, while the northern hemisphere shows an extreme value at 8.89 kHz. The three-component perturbations in the HF band remain below 0.2.
3.7. Analysis of Variation Growth Rate
The analysis of D values in Section 3.2, Section 3.3, Section 3.4 and Section 3.5 only reflects the absolute changes in disturbances. To verify conclusions such as the ULF band being the most affected by magnetic storms, this section will calculate the growth rate of perturbations, or the relative change, across different frequency bands.
Figure 10 illustrates the perturbation growth rates across the four frequency bands for the period of magnetic storms in November 2021. In the ULF band, the most significant relative changes occur at frequencies below 5 Hz, with notable relative changes also observed around 8 Hz and 13 Hz. The relative changes in the ELF and VLF bands are considerably weaker compared to those in the ULF band. The high-frequency band exhibits the smallest relative change, which is not discernible as a color difference in the figure. Therefore, magnetic storms have the most significant effect on the ULF band and a negligible impact on the HF band.
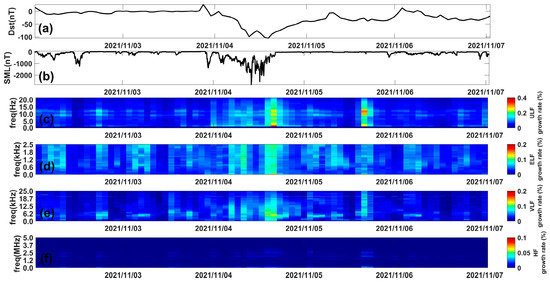
Figure 10.
(a) Dst, (b) SML, growth rate of ULF D value: (c) ULF, (d) ELF, (e) VLF, (f) HF.
In order to quantitatively analyze the disturbance growth rate in the four frequency bands, we draw the curve of the maximum orbit of the disturbance growth rate (Figure 11). The figure shows that the disturbance growth rate in the ULF band tends to decrease. It decays sharply at 0–5 Hz and gradually stabilizes after 5 Hz. In the 0–5 Hz band, the disturbance growth rate is greater than 20%. Above 5 Hz, the disturbance growth rate remains around 20% and gradually decreases. Around 8 Hz and 13 Hz, there is a slight increase in the perturbation growth rate. The disturbance growth rate in the ELF band remains around 8%. The disturbance growth rate in the VLF band reaches an extreme value (greater than 10%) near 5 KHz, and then gradually decreases, basically not exceeding 10%. The disturbance growth rate in the HF band is in the neighborhood of 2%.
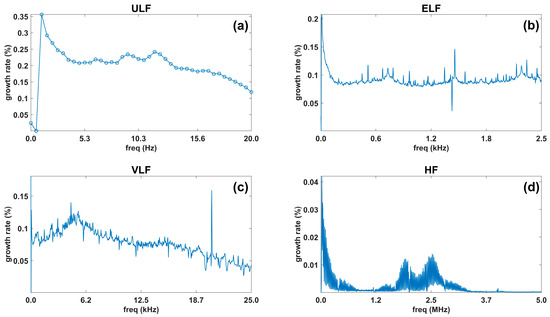
Figure 11.
Maximum growth rate curve: (a) ULF, (b) ELF, (c) VLF, (d) HF.
3.8. Wavelet Coherence (WTC) Analysis
From the analysis above, it is clear that the ULF frequency band exhibits the strongest response to magnetic storms. To determine the correlation between different frequencies in the ULF band and magnetic storms, wavelet coherence analysis was performed on the Dst curves and D value curves at various frequencies. We obtained wavelet coherence spectrograms for the 22°S–65°S, 22°S–22°N, and 22°N–65°N regions. Spectrogram values approaching 1 indicate high-energy regions (yellow areas), which represent strong correlations.
In the wavelet coherence spectrograms of Dst versus D value curves for the 22°S–65°S range (Figure 12), there are significantly more high-energy zones at 2.9 Hz, 3.9 Hz, and 4.9 Hz compared to other frequencies. High-energy regions are clearly observed near periods 4 and 16. Small, high-energy regions are noted at 11.2 Hz and 13.2 Hz (Schumann wave frequency point) near periods 4 and 16, while 8.8 Hz shows almost no high-energy regions. The frequencies 2.9 Hz, 3.9 Hz, and 4.9 Hz exhibit the strongest correlations with magnetic storms and are significantly perturbed by their effects. In contrast, at 8.8 Hz, the correlation with magnetic storms is very weak, indicating minimal impact from the storms.
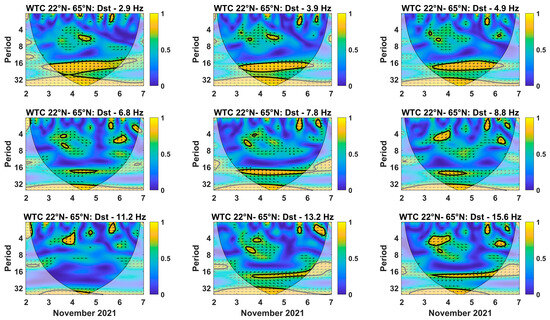
Figure 12.
Wavelet coherence in the latitude range of 22°S-65°S.
In the 22°N–65°N range, high-energy regions remain more prominent at 2.9 Hz, 3.9 Hz, and 4.9 Hz compared to other frequencies (Figure 13). The periods of these high-energy regions are approximately 4 and 16. In contrast to 22°S–65°S, 7.8 Hz and 13.2 Hz also exhibit distinct and prolonged high-energy regions at period 16. Since these two frequencies correspond to Schumann wave frequencies, Schumann waves are more affected by magnetic storm perturbations in the northern hemisphere compared to the southern hemisphere.
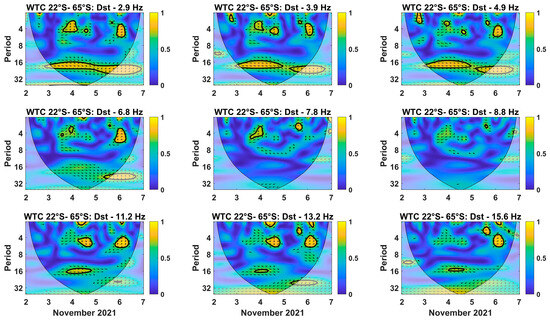
Figure 13.
Wavelet coherence in the latitude range of 22°N–65°N.
In the 22°S–22°N range, no high-energy regions are observed during the main phase of the magnetic storm, either at the 0–5 Hz frequency range or at the Schumann wave frequency (Figure 14). The D value curves in this latitude range show a weak correlation with the Dst curves. The correlation between electric field disturbances and magnetic storms at mid and low latitudes is not significant, indicating that magnetic storms do not directly or significantly induce electric field disturbances in the ionosphere at these latitudes. In contrast, electric field disturbances at high latitudes are strongly correlated with magnetic storm activity.
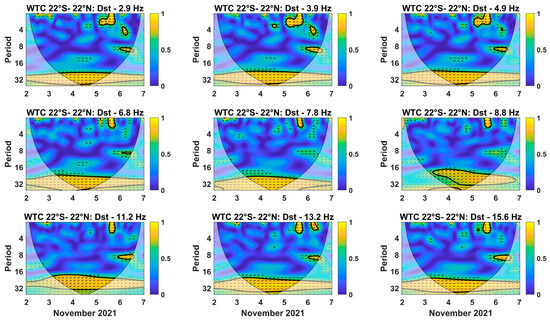
Figure 14.
Wavelet coherence in the latitude range of 22°S–22°N.
4. Discussion
This paper analyzes the response of the ionospheric electric field to the November 4, 2021 magnetic storm using EFD data from the four frequency bands of the CSES-1 satellite electric field. The analysis is conducted through power spectrogram analysis, D value analysis, growth rate analysis, and wavelet coherence.
4.1. Comparison of Dayside and Nightside Data
The CSES-1 satellite observation data encompass both dayside and nightside measurements. To compare the differences between dayside and nightside data, the ULF frequency band was selected for PSD and D value analysis. Figure 15 presents a comparison of the PSD at a single frequency point between the dayside and nightside. The red anomalies at 3.9 Hz, 9.3 Hz, and 14.2 Hz are observed to be more widely distributed and denser on the nightside compared to the dayside. Whether at high latitudes in the northern or southern hemisphere or at the equator, the distinction between periods of magnetic storms and periods of calm is not apparent in the dayside data. The nightside data also reveal red anomalies at the equator and at low and mid latitudes, whereas during calm periods, no such anomalies are observed on the nightside. At 14.2 Hz, there is still a red anomaly area difference between the nightside data during the magnetic storm and those during calm periods, but the PSD of the dayside data during the magnetic storm period is not significantly different from that of the calm period. It is possible that there are also covered perturbations in the dayside data, but the size of the perturbations is negligible for the nightside data.
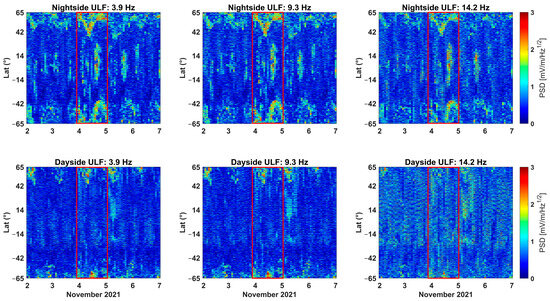
Figure 15.
Dayside and nightside single frequency PSD (the red rectangle is the main phase period).
To quantitatively assess the ability of dayside data to monitor magnetic storms, D value analysis was conducted on the ULF band data from the dayside. As shown in Figure 16, during the main phase of the magnetic storm, no significant difference between the D value during the magnetic storm and that of the quiet period is evident across 65°S–65°N or at high latitudes in both hemispheres, where the impact of the magnetic storm is typically strongest. In the D value analysis of the nightside data, the difference between the D value at the maximum perturbation orbit and that of the quiet period reaches 2. Conversely, in the D value analysis of the dayside data, the difference between the D value and that of the quiet period is less than 1. Therefore, the nightside data prove to be more effective than the dayside data in monitoring magnetic storms.
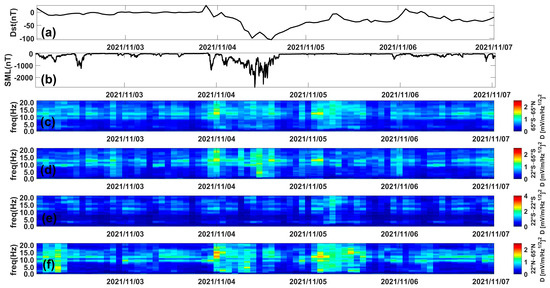
Figure 16.
(a) Dst, (b) SML, ULF dayside value: (c) 65°N–65°S, (d) 22°S–65°S, (e) 22°N–22°S, (f) 22°N–65°N.
4.2. Strongly Disturbed Frequencies
Among the four frequency bands—ULF, ELF, VLF, and HF—the ULF band exhibits the largest perturbation during a magnetic storm, while the HF band shows almost no perturbation. In the ULF band, magnetic storms have the greatest effect at 0–5 Hz, and a strong disturbance frequency of 3.9 ± 1.0 Hz is observed within this range. Parkhomov [14] found that short pulses of geomagnetic pulsations in the 0.2 to 5 Hz range were observed during magnetic storms, with a global maximum frequency of 2.78 ± 0.38 Hz. This observation aligns with the conclusion of this paper, which suggests that the global maximum frequency due to magnetic storms may vary, but generally remains around 3 Hz.
To verify the generality of the conclusion that the 3.9 ± 1.0 Hz frequency point represents the perturbation pole, four additional strong magnetic storms (Dst < −100 nT) observed by the CSES-1 satellite were selected for analysis (Table 2, Figure 17). The D values for the ULF band during these five magnetic storms were analyzed within the latitude range of 22°–65°. In the southern hemisphere, a rapid increase in D values was observed within the 0–3.9 Hz range, reaching an extreme value near 3.9 Hz (e.g., the 11 May 2024 magnetic storm reached an extreme value at 4.4 Hz). After reaching the extreme value, the D values began to fluctuate and then decrease. In the northern hemisphere, the five magnetic storms generally reached an extreme value around 2.9 Hz (e.g., the 11 May 2024 storm reached 4.8 Hz), after which the D values began to fluctuate and decrease. The magnetic storms of 27 February 2023 and 6 November 2023 exhibited extreme values at the Schumann resonance frequency of 13 Hz. Within the 0–5 Hz range, the magnitude of the D values of the five magnetic storms was generally negatively correlated with the magnitude of the Dst values, with the exception of the 24 April 2023 storm, which had a relatively small D value in the northern hemisphere. In the ULF band, the disturbance extreme frequencies of the magnetic storms were predominantly distributed around 3.9 ± 1.0 Hz, with a few storms showing extremes near the Schumann resonance frequency of 13 Hz.

Table 2.
Date and Dst minimum.
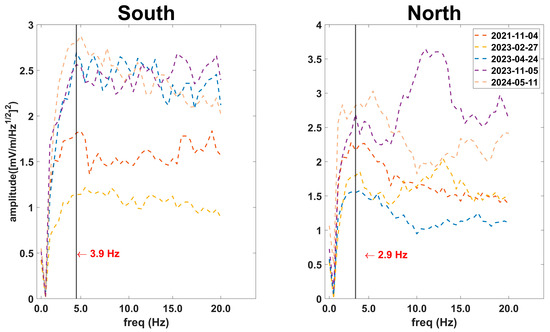
Figure 17.
Frequencies of significant disturbances in multiple magnetic storms.
The ULF band exhibited significant perturbation enhancements near 8 Hz and 13 Hz, in addition to the strong perturbation observed in the 0–5 Hz range. These perturbations were also present during quiet periods. According to Sanfui [32], the maximum values of the Schumann resonance first-, second-, and third-order mode frequencies were 8.51 Hz, 14.71 Hz, and 21.22 Hz, respectively, and constant perturbations from Schumann waves were clearly observed in this context as well. Therefore, the perturbations near 8 Hz and 13 Hz identified in the D value analysis of the ULF band were primarily due to Schumann waves. These Schumann waves were also enhanced by magnetic storms, with the enhancement at 13 Hz being greater than at 8 Hz. Additionally, there were hemispheric differences in Schumann waves: 8 Hz predominated from 22°S to 65°S, while 13 Hz predominated from 22°N to 65°N.
4.3. Equatorial Ionospheric Anomaly
Magnetic storms primarily affect middle and high latitudes, but they also impact equatorial and low latitudes. In the PSD analysis presented in Section 3.1, the ULF band exhibits a notable disturbance enhancement at middle and low latitudes, though not as pronounced as in the ELF and VLF bands. The D value analyses covering the range of 22°S to 22°N in Section 3.2, Section 3.3 and Section 3.4 reveal a significant enhancement of disturbances in the ULF band, whereas disturbances in the ELF and VLF bands are comparatively weaker. The ELF and VLF bands experience less pronounced perturbations than the ULF band.
The electric field perturbations observed in the equatorial ionosphere primarily result from the penetration of electric fields from middle and high latitudes [33,34]. The ionosphere at middle and low latitudes largely shields the effects of high-latitude electric fields. A sudden increase in magnetospheric convection causes the lower and middle latitude ionosphere to be influenced by the enhanced dusk-to-dawn convective electric field from the high-latitude ionosphere, until the magnetospheric structure realigns and a new shielding state is established. Conversely, a rapid decrease in magnetospheric convection leads to a temporary excess of dusk-to-dawn shielding electric fields, which affects lower latitudes until shielding is re-established. The time scale for this shielding process is typically less than one hour [35]. In this study, strong perturbation orbits in the 22°S to 22°N region are typically 1–2 orbits, with each orbit observed for about 0.5 h, and the duration of strong perturbations is less than 1 h. The D value of the ULF band in this region is generally greater than 2, while the D values of the ELF and VLF bands do not exceed 2. Analysis in Section 3.3 shows that the anomalous frequency bands of the equatorial ionospheric electric field are concentrated in the 0–100 Hz range, with frequency bands above 100 Hz being less affected by the high-latitude penetrating electric field.
To validate the hypothesis that equatorial ionospheric anomalies primarily occur below 100 Hz, we plotted D value analyses for latitudes below 22° during the main phases of five magnetic storms (Table 2) within the 0–300 Hz range (Figure 18). The horizontal axis represents the time of the orbital observations. The equatorial ionospheric anomaly on 4 November 2021 was observed to be the strongest, with D values in the 0–100 Hz band reaching nearly 2. The anomaly on 24 April 2023 was slightly weaker than that of 4 November 2021, exhibiting significant perturbations in the 0–50 Hz band. In contrast, the anomalies on 27 February 2023, 5 November 2023, and 11 May 2024 showed prominent perturbations below 50 Hz. Notably, the Dst minimum of the 11 May 2024 magnetic storm reached −409 nT, yet it caused fewer equatorial ionospheric anomalies compared to the 4 November 2021 storm. Thus, perturbations in the equatorial ionosphere induced by magnetic storms are not directly correlated with the magnitude of the storms. Additionally, the frequency band of ionospheric anomalies in the equatorial region is concentrated below 100 Hz.
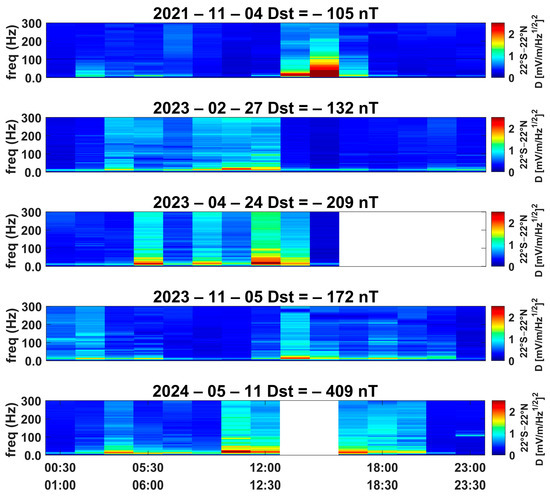
Figure 18.
D value below 22° in the 0–300 Hz band during the main phases of different magnetic storms.
4.4. Hemispheric Asymmetry
There is a clear hemispheric asymmetry observed in this magnetic storm. In this study, the maximum disturbance in the northern hemisphere corresponds to the first minimum of Dst, while the maximum disturbance in the southern hemisphere corresponds to the second minimum of Dst. The response of the high-latitude ionosphere in the northern hemisphere occurs approximately 4 h earlier than that in the southern hemisphere. Different extreme values of Dst result in varying levels of perturbation due to hemispheric energy imbalances caused by solar wind energy deposition. De Abreu [36] found, using TEC data, that during the recovery phase, the mid-latitude region in North America experienced a strong and persistent negative storm phase, whereas the mid-latitude region in South America exhibited calm daytime behavior. They proposed that the hemispheric asymmetric response in the F-region of the ionosphere might reflect different mechanisms for equatorial spread-F (ESF) generation across latitudinal regions during perturbations. Terefe and Nigussie [37] investigated the drivers of the ionospheric response to the storm of 17–18 March 2015 and found that the response of the high-latitude ionosphere in the Northern Hemisphere occurred about 12 h earlier than in the Southern Hemisphere. They suggested that spatial and temporal variations in solar wind energy deposition were responsible for the hemispheric asymmetry in ionospheric response. In addition, IMF By has an impact on hemispheric asymmetry. The impacts of the interplanetary magnetic field (IMF) east–west component (By) on the interhemispheric asymmetry of ∑O/N2 depletion was investigated. Comparisons of simulation results with and without real By show that the dominant positive IMF By results in the Joule heating maximum occurred in the local afternoon of northern hemisphere and local morning in the southern hemisphere during the initial phase of the storm, which generated the corresponding ∑O/N2 changes [38].
Zhima [25] proposed that ELF and VLF waves with frequencies below 6 kHz are primarily observed during the early main phase and recovery phases of magnetic storms, while wide-bandwidth waves from fcp to 20 kHz are significantly excited during the main and early recovery phases. In this paper, analysis shows that waves below 6 kHz are consistently present in the southern hemisphere, whereas the northern hemisphere is not affected. During the main phase of magnetic storms, the excited wave frequencies are predominantly below 18 kHz. Frequencies above 18 kHz, including those in the HF band, experience minimal interference from magnetic storms. Therefore, the HF band is particularly suitable for use in the design of future spacecraft and communication equipment [39].
In summary, for the design of future spacecraft and communication equipment, it is advisable to prioritize frequency bands above 18 kHz to mitigate interference from magnetic storms. In the ELF/VLF bands, it is recommended to avoid frequencies below 6 kHz due to persistent interference observed in the southern hemisphere. Although the ULF band exhibits the strongest response to magnetic storms, certain frequencies within this band show reduced susceptibility to interference. For instance, the wavelet analysis presented in Section 3.8 of this paper indicates that the correlation between magnetic storms and frequencies of 6.8 Hz and 8.8 Hz is weak. Furthermore, relying solely on the minimum value of Dst to classify magnetic storm intensity may be insufficient due to the effects of solar wind energy deposition. For example, the Dst curve of this magnetic storm exhibits a double-peak structure, indicating a greater accumulation of solar wind energy compared to a storm with a single Dst peak. Thus, the D value index of electric field disturbances may offer a more accurate classification metric in the future.
5. Conclusions
The analysis of this paper leads us to the following conclusions:
- (1)
- The ULF, ELF, and VLF bands are more significantly perturbed by magnetic storms, with the ULF band exhibiting the strongest response. Not only is the absolute increment in the D value larger in the ULF band compared to the ELF and VLF bands, but the relative increment is also more pronounced, exceeding that of the ELF and VLF bands by more than 10%. Within the ULF band, the 0–5 Hz range is particularly sensitive, featuring an extreme value frequency point at 3.9 ± 1.0 Hz. In contrast, the HF band (above 18 kHz) remains unaffected by magnetic storms and can be primarily utilized in the design of future spacecraft and communication equipment.
- (2)
- The effects of magnetic storms exhibit hemispheric asymmetry. The timing and intensity of maximum disturbances differ between the hemispheres. In the ULF/ELF/VLF band, strong disturbances in the ULF band were observed earlier and with greater intensity in the northern hemisphere compared to the southern hemisphere. In addition, in the ELF and VLF bands, constant perturbations below 6 kHz were present in the southern hemisphere, but not in the northern hemisphere. Consequently, in both bands, the strength of the electric field perturbation in the northern hemisphere was more indicative of the overall magnitude of magnetic storms.
- (3)
- Schumann waves exhibit hemispheric asymmetry. In the southern hemisphere, 8 Hz Schumann waves dominate, while in the northern hemisphere, 13 Hz Schumann waves are more prevalent. Schumann waves are also enhanced during magnetic storms.
- (4)
- The frequency band of the equatorial ionospheric electric field anomaly during this magnetic storm was concentrated in the 0–100 Hz range, while frequencies above 100 Hz were less affected by the high-latitude penetrating electric field.
Author Contributions
Methodology, J.Z.; software, J.Z.; validation, J.Z.; resources, J.H.; data curation, J.Z.; writing—original draft preparation, J.Z.; writing—review and editing, J.H.; supervision, Z.L., W.L., Y.H., H.L. and Z.Z.; project administration, Z.L., W.L., Y.H. and H.L.; funding acquisition, J.H. and Z.L. All authors have read and agreed to the published version of the manuscript.
Funding
This work made use of data from the CSES mission, a project funded by China National Space Administration (CNSA) and China Earthquake Administration (CEA). This work was supported by the National Key R&D Program of intergovernmental cooperation in science and technology (Grant No. 2023YFE0117300), the International Space Science Institute (ISSI in Bern, Switzerland and ISSI-BJ in Beijing, China), supporting International Team 23-583 led by Dedalo Marchetti and Essam Ghamry.
Data Availability Statement
CSES data were obtained from https://www.leos.ac.cn/ and Dst data were obtained from https://wdc.kugi.kyoto-u.ac.jp/index.html (accessed on 10 May 2024).
Acknowledgments
The data used in this paper are supported by the CSES-1 satellite (https://www.leos.ac.cn/) and https://wdc.kugi.kyoto-u.ac.jp/index.html (accessed on 10 May 2024). We thank the editors and reviewers for their kind words and consideration. We thank the authors of the literature for their excellent contributions.
Conflicts of Interest
The authors declare no conflicts of interest.
References
- Blagoveshchenskii, D.V. Effect of Geomagnetic Storms (Substorms) on the Ionosphere: 1. A Review. Geomagn. Aeron. 2013, 53, 275–290. [Google Scholar] [CrossRef]
- Piddington, J.H. Geomagnetic Storms, Auroras and Associated Effects. Space Sci. Rev. 1964, 3, 724–780. [Google Scholar] [CrossRef]
- Gonzalez, W.D.; Joselyn, J.A.; Kamide, Y.; Kroehl, H.W.; Rostoker, G.; Tsurutani, B.T.; Vasyliunas, V.M. What Is a Geomagnetic Storm? J. Geophys. Res. 1994, 99, 5771–5792. [Google Scholar] [CrossRef]
- Gonzalez, W.D.; Echer, E.; Clua-Gonzalez, A.L.; Tsurutani, B.T. Interplanetary Origin of Intense Geomagnetic Storms (Dst < −100 nT) during Solar Cycle 23. Geophys. Res. Lett. 2007, 34, 2006GL028879. [Google Scholar] [CrossRef]
- Zong, Q.-G.; Reinisch, B.W.; Song, P.; Wei, Y.; Galkin, I.A. Dayside Ionospheric Response to the Intense Interplanetary Shocks–Solar Wind Discontinuities: Observations from the Digisonde Global Ionospheric Radio Observatory. J. Geophys. Res. 2010, 115, 2009JA014796. [Google Scholar] [CrossRef]
- Lakhina, G.S.; Alex, S.; Tsurutani, B.T.; Gonzalez, W.D. Supermagnetic Storms: Hazard to Society. In Geophysical Monograph Series; Sharma, A.S., Bunde, A., Dimri, V.P., Baker, D.N., Eds.; American Geophysical Union: Washington, DC, USA, 2012; Volume 196, pp. 267–278. ISBN 978-0-87590-486-3. [Google Scholar]
- Lakhina, G.S.; Tsurutani, B.T. Geomagnetic Storms: Historical Perspective to Modern View. Geosci. Lett. 2016, 3, 5. [Google Scholar] [CrossRef]
- Rama Rao, P.V.S.; Gopi Krishna, S.; Vara Prasad, J.; Prasad, S.N.V.S.; Prasad, D.S.V.V.D.; Niranjan, K. Geomagnetic Storm Effects on GPS Based Navigation. Ann. Geophys. 2009, 27, 2101–2110. [Google Scholar] [CrossRef]
- Roodman, D. The Risk of Geomagnetic Storms to the Grid: A Preliminary Review. GiveWell. 29 June 2015. Available online: http://files.givewell.org/files/labs/geomagnetic-storms/The_risk_of_geomagnetic_storms_5_dr.pdf (accessed on 1 July 2017).
- Olsen, N.; Stolle, C. Satellite Geomagnetism. Annu. Rev. Earth Planet. Sci. 2012, 40, 441–465. [Google Scholar] [CrossRef]
- Berthelier, J.J.; Godefroy, M.; Leblanc, F.; Malingre, M.; Menvielle, M.; Lagoutte, D.; Brochot, J.Y.; Colin, F.; Elie, F.; Legendre, C.; et al. ICE, the Electric Field Experiment on DEMETER. Planet. Space Sci. 2006, 54, 456–471. [Google Scholar] [CrossRef]
- Shen, X.; Zhang, X.; Yuan, S.; Wang, L.; Cao, J.; Huang, J.; Zhu, X.; Piergiorgio, P.; Dai, J. The State-of-the-Art of the China Seismo-Electromagnetic Satellite Mission. Sci. China Technol. Sci. 2018, 61, 634–642. [Google Scholar] [CrossRef]
- Trautner, R.; Koschny, D.; Witasse, O.; Zender, J.; Knöfel, A. ULF–VLF electric field measurements during the 2001 Leonid storm. In Proceedings of the Asteroids, Comets, Meteors, ACM-2002, International Conference, Berlin, Germany, 29 July–2 August 2002; Warmbein, B., Ed.; ESA: Noordwijk, The Netherlands, 2002; pp. 161–164. [Google Scholar]
- Parkhomov, V.A.; Borodkova, N.L.; Yahnin, A.G.; Suvorova, A.V.; Dovbnya, B.V.; Pashinin, A.Y.; Kozelov, B.V. Global Impulse Burst of Geomagnetic Pulsations in the Frequency Range of 0.2–5 Hz as a Precursor of the Sudden Commencement of St. Patrick’s Day 2015 Geomagnetic Storm. Cosm. Res 2017, 55, 307–317. [Google Scholar] [CrossRef]
- Fraser-Smith, A.C.; Kjono, S.N. The ULF Magnetic Fields Generated by Thunderstorms: A Source of ULF Geomagnetic Pulsations? Radio Sci. 2014, 49, 1162–1170. [Google Scholar] [CrossRef]
- Ahmad, S.N.A.; Jusoh, M.H.; Kasran, F.A.M.; Abdullah, M.; Veenadhari, B.; Uozumi, T.; Abe, S.; Yoshikawa, A.; Cardinal, M.G. Variations of ULF and VLF during Moderate Geomagnetic Storm at Equatorial Region. In Proceedings of the 2015 International Conference on Space Science and Communication (IconSpace), Langkawi, Malaysia, 10–12 August 2015; pp. 256–261. [Google Scholar]
- Li, Y.; Yue, C.; Liu, J.; Zong, Q.; Hu, H.; Zhou, X.; Hu, Z.; Yang, F.; Zhao, X. The Distribution and Evolution of Storm Time Pc3-5 ULF Wave Power Based on Satellite and Ground Observations. JGR Space Phys. 2023, 128, e2023JA031775. [Google Scholar] [CrossRef]
- Kozyreva, O.V.; Kleimenova, N.G. Estimation of Storm-Time Level of Day-Side Wave Geomagnetic Activity Using a New ULF Index. Geomagn. Aeron. 2008, 48, 491–498. [Google Scholar] [CrossRef]
- Kozyreva, O.V.; Kleimenova, N.G. Variations in the ULF Index of Geomagnetic Pulsations during Strong Magnetic Storms. Geomagn. Aeron. 2009, 49, 425–437. [Google Scholar] [CrossRef]
- Kozyreva, O.V.; Kleimenova, N.G. Variations in the ULF Index of Daytime Geomagnetic Pulsations during Recurrent Magnetic Storms. Geomagn. Aeron. 2010, 50, 770–780. [Google Scholar] [CrossRef]
- Tatsuta, K.; Hobara, Y.; Pal, S.; Balikhin, M. Sub-Ionospheric VLF Signal Anomaly Due to Geomagnetic Storms: A Statistical Study. Ann. Geophys. 2015, 33, 1457–1467. [Google Scholar] [CrossRef]
- Parrot, M.; Buzzi, A.; Santolík, O.; Berthelier, J.J.; Sauvaud, J.A.; Lebreton, J.P. New Observations of Electromagnetic Harmonic ELF Emissions in the Ionosphere by the DEMETER Satellite during Large Magnetic Storms. J. Geophys. Res. 2006, 111, 2005JA011583. [Google Scholar] [CrossRef]
- Pinto, O.; Gonzalez, W.D. Energetic Electron Precipitation at the South Atlantic Magnetic Anomaly: A Review. J. Atmos. Terr. Phys. 1989, 51, 351–365. [Google Scholar] [CrossRef]
- Zhima, Z.; Cao, J.; Liu, W.; Fu, H.; Wang, T.; Zhang, X.; Shen, X. Storm Time Evolution of ELF/VLF Waves Observed by DEMETER Satellite. J. Geophys. Res. Space Phys. 2014, 119, 2612–2622. [Google Scholar] [CrossRef]
- Zhima, Z.; Hu, Y.; Shen, X.; Chu, W.; Piersanti, M.; Parmentier, A.; Zhang, Z.; Wang, Q.; Huang, J.; Zhao, S.; et al. Storm-Time Features of the Ionospheric ELF/VLF Waves and Energetic Electron Fluxes Revealed by the China Seismo-Electromagnetic Satellite. Appl. Sci. 2021, 11, 2617. [Google Scholar] [CrossRef]
- Blagoveshchenskii, D.V. Effect of Magnetic Storms (Substorms) on HF Propagation: A Review. Geomagn. Aeron. 2013, 53, 409–423. [Google Scholar] [CrossRef]
- Yuan, S.G.; Zhu, X.H.; Huang, J.P. System Design and Key Technology of China Seismo-Electromagnetic Satellite. Natl. Remote Sens. Bull. 2018, 22, 32–38. [Google Scholar] [CrossRef]
- Grinsted, A.; Moore, J.C.; Jevrejeva, S. Application of the Cross Wavelet Transform and Wavelet Coherence to Geophysical Time Series. Nonlin. Process. Geophys. 2004, 11, 561–566. [Google Scholar] [CrossRef]
- Giri, A.; Adhikari, B.; Shrestha, B.; Rimal, S. Wavelet Coherence Analysis foF2 over Boulder Station during Different Geomagnetic Activity. Himal. Phys. 2023, 10, 66–77. [Google Scholar] [CrossRef]
- Xiang, Y.; Gao, Y.; Shi, J.; Xu, C. Consistency and Analysis of Ionospheric Observables Obtained from Three Precise Point Positioning Models. J. Geod. 2019, 93, 1161–1170. [Google Scholar] [CrossRef]
- Smith, S.W. Digital Signal Processing: A Practical Guide for Engineers and Scientists; Demystifying Technology Series; Newnes: Amsterdam, The Netherlands; Boston, UK, 2003; ISBN 978-0-7506-7444-7. [Google Scholar]
- Sanfui, M.; Haldar, D.K.; Biswas, D. Studies on Different Geophysical and Extra-Terrestrial Events within the Earth-Ionosphere Cavity in Terms of ULF/ELF/VLF Radio Waves. Astrophys. Space Sci. 2016, 361, 325. [Google Scholar] [CrossRef]
- Lissa, D.; Srinivasu, V.K.D.; Prasad, D.S.V.V.D.; Niranjan, K. Ionospheric Response to the 26 August 2018 Geomagnetic Storm Using GPS-TEC Observations along 80° E and 120° E Longitudes in the Asian Sector. Adv. Space Res. 2020, 66, 1427–1440. [Google Scholar] [CrossRef]
- Wu, Q.; Wang, W.; Lin, D.; Huang, C.; Zhang, Y. Penetrating Electric Field during the Nov 3–4, 2021 Geomagnetic Storm. J. Atmos. Sol.-Terr. Phys. 2024, 257, 106219. [Google Scholar] [CrossRef]
- Yamazaki, Y.; Kosch, M.J. The Equatorial Electrojet during Geomagnetic Storms and Substorms. JGR Space Phys. 2015, 120, 2276–2287. [Google Scholar] [CrossRef]
- De Abreu, A.J.; Fagundes, P.R.; Sahai, Y.; De Jesus, R.; Bittencourt, J.A.; Brunini, C.; Gende, M.; Pillat, V.G.; Lima, W.L.C.; Abalde, J.R.; et al. Hemispheric Asymmetries in the Ionospheric Response Observed in the American Sector during an Intense Geomagnetic Storm. J. Geophys. Res. 2010, 115, 2010JA015661. [Google Scholar] [CrossRef]
- Terefe, D.A.; Nigussie, M. Spatio-Temporal Evolution of Global Ionospheric Storm Drivers and Hemispherical Asymmetry During 17–18 March 2015 Geomagnetic Storm. JGR Space Phys. 2021, 126, e2021JA029348. [Google Scholar] [CrossRef]
- Yu, T.; Cai, X.; Ren, Z.; Wang, Z.; Pedatella, N.M.; Jin, Y. Investigation of Interhemispheric Asymmetry of the Thermospheric Composition Observed by GOLD During the First Strong Geomagnetic Storm in Solar-Cycle 25, 1: IMF By Effects. JGR Space Phys. 2023, 128, e2023JA031429. [Google Scholar] [CrossRef]
- Wang, J.; Shi, Y.; Yang, C.; Feng, F. A Review and Prospects of Operational Frequency Selecting Techniques for HF Radio Communication. Adv. Space Res. 2022, 69, 2989–2999. [Google Scholar] [CrossRef]
Disclaimer/Publisher’s Note: The statements, opinions and data contained in all publications are solely those of the individual author(s) and contributor(s) and not of MDPI and/or the editor(s). MDPI and/or the editor(s) disclaim responsibility for any injury to people or property resulting from any ideas, methods, instructions or products referred to in the content. |
© 2024 by the authors. Licensee MDPI, Basel, Switzerland. This article is an open access article distributed under the terms and conditions of the Creative Commons Attribution (CC BY) license (https://creativecommons.org/licenses/by/4.0/).