1. Introduction
As an active Earth observation system, synthetic aperture radar (SAR) facilitates all-weather and all-day surveillance with extensive coverage [
1,
2]. The acquisition of high-resolution SAR images has attracted significant attention for target detection, particularly in oceanic applications, where it serves as an effective tool [
3]. When a moving ship sails on a rough sea surface, the generated wake patterns appear on the surface in large sizes. The visible appearances of the wake patterns are mainly associated with the ship’s parameters, such as the speed, the ship hull size, and so on [
4,
5,
6]. These moving-ship parameters can also be inverted through analysis of the ship wake captured in an SAR image [
3]. Thus, detecting ship wake patterns in SAR images plays a crucial role in marine environment monitoring [
7,
8].
Ship wake patterns are generally modeled as linear structures [
9,
10], given that they have typical linear characteristics and appear as bright or dark lines in SAR images. As a result, the detection of a ship’s wake is formulated using lines identified against the sea clutter background in SAR images in the existing literature [
7,
8,
9,
10,
11,
12,
13]. There is significant utilization of the Radon transform (RT) and Hough transform (HT) for detecting these linear wake structures, benefiting from their superior line recognition abilities [
9,
13]. The RT is used to calculate the image pixel accumulation in various directions and then map lines in image domains into peak points in the Radon domain. Compared with the HT, the RT has the capability of canceling out the impact of noise fluctuations by integrating image pixels in specific directions [
14]. This principle makes the RT more prevalent in wake detection in SAR images [
15,
16]. When employing the RT for wake detection, the bright (dark) lines in the SAR image domain are transformed into bright (dark) peak points in the Radon domain. These distinctive peak points of wake signatures can be identified and extracted against an appropriate threshold [
17]. Murphy adopted the RT to detect the linear characteristics of wakes in SAR images for the first time and demonstrated that the linear features of wakes are enhanced during the process of image pixel integration. The enhanced features produced good detection results [
18]. Meanwhile, the study also pointed out that more investigations are required for wake patterns in complex environments. Wake patterns are disturbances of the sea surface that generate interactions with sea gravity and capillary waves. Then, the roughness of the sea surface is changed, and wakes can appear in SAR images based on the mechanism of wake pattern SAR imaging. Wake patterns can be considered a superposition above the sea’s surface. The observability of wake patterns is flexibly influenced by complex image backgrounds. Heavy sea clutter at a high sea wave height can cause high false-alarm probability and even conceal wake patterns [
10]. It is a challenge to obtain great performance against these complex backgrounds in ship wake detection in SAR images. Thus, these RT-based wake detection methods are mainly promoted by improving the wake’s signal-to-noise ratio (SNR), which aims to reduce the influence of these backgrounds.
Combining image preprocessing techniques with the Radon transform is a common strategy [
9,
10]. High-pass filters and Wiener filters are used in the image and Radon domains, respectively, in order to suppress sea clutter and reduce the appearance rate of false ship wakes [
18]. The localized Radon transform proposed by Copeland et al. uses a series of local windows to isolate and locate peak points to reduce some false alarms [
12]. The wavelet transform based on an orthogonal basis was developed to generate multi-scale high-pass images [
19], and the edges of wakes can be enhanced by correlating the high-pass image modulus, thus reducing false points in the Radon domain. Stochastic matched filtering was combined with the RT to enhance wake shapes in the frequency domain; the wake showed X-shaped features, and the RT was still used to detect the lines of X-shaped features [
20]. In addition, a few ship wake detection methods have been developed based on deep learning [
10]. However, most of them are data-driven and have a high dependence on large-scale wake datasets, which are difficult to obtain [
10,
21]. The idea of compressed sensing has recently been introduced to tackle the wake detection problem. The key is to separate wake patterns from the image background, following which the separated wake patterns are still detected using the RT. A sparse dictionary for ship wake textures and a sparse dictionary for sea clutter textures were designed by Yang et al. [
22], which adopted morphological component analysis to extract the wake components, and RT was adopted to identify the wake. The generalized minimax concave (GMC) [
15] function was introduced as another sparse regularization approach to enhance the linear features of the wake and reduce false alarms in the Radon domain.
Inspired by sparse regularization, approaches based on low-rank plus sparse decomposition (LRSD) have been successfully utilized for the task of wake detection in a single SAR image [
23,
24]. Low rank is a prior characteristic of SAR images and represents a high correlation among images [
25]. Based on this, an observed SAR image can be naturally decomposed into an approximately low-rank structure and a sparse structure through performing LRSD. Then, the ship’s wake patterns are restored in the sparse structure and detected using the RT. Biondi introduced LRSD for the first time to separate wakes and image backgrounds. LRSD is utilized both in the image and Radon domains to reduce the false alarms of the background, and then the RT is used to identify wakes [
23]. In addition, there has been an extension of using LRSD in processing polarized SAR images for wake detection by using polarization information to enhance the wake features and mitigate false ship wakes [
24]. On this basis, random sampling consensus was further exploited on wakes separated using LRSD to finely characterize their linear structure [
25]. These existing methods have obtained success in ship detection. It has been demonstrated that the effectiveness of LRSD depends on the assumption of the high correlation of the background [
26].
However, these methods mainly depend on local spatial correlations between adjacent pixels to indicate correlations, which may be corrupted by noise and significant amounts of sea clutter [
26]. In fact, there are often many repetitive local patches across a whole image, which are present as nonlocal similarities [
27,
28]. Unlike local similarities, these repetitive patches can be grouped together in a nonlocal matrix with high correlation to serve a low-rank structure. On the basis of this, the usage of nonlocal similarity makes a breakthrough in the application of SAR image detection and denoising. However, the existing LRSD-based ship wake methods rarely consider nonlocal similarities. On the other hand, there are also other line-shaped sea waves on the sea surface, including those induced by strong speckle noise accumulation [
3,
11]. These line-shaped objects are also represented as bright (dark) peak points in the Radon domain. It is difficult to distinguish between the differences in peak points between wakes and other linear structures during the threshold-based identification process [
15]. As a result, the precision of wake detection is limited, and the rate of false alarms is high, especially in complex scenarios.
To address the above problems, a novel ship wake detection method based on nonlocal LRSD and an enhanced feature map for a single SAR image is proposed. First, an SAR image is divided into a grid of many image patches. To enhance the correlation, a nonlocal similarity criterion based on image entropy is employed. For each patch, a group of patches are collected based on the nonlocal entropy similarity to construct a matrix of nonlocally similar image patches, and a decomposition function is set up to modify the LRSD. Then, the FOE model is introduced to establish an enhanced feature map in order to improve the reliability of wake decisions in the nonlocal LRSD detection procedure. Finally, connected region clustering (CRC) is further executed in the Radon domain to extract the peak points of the potential wake and filter out the false points with prior knowledge of the wake breadth. Real SAR images are adopted to illustrate the effectiveness of the proposed method. The main contributions of the proposed method are as follows:
- (1)
Nonlocal low-rank and sparse decomposition is proposed to separate a wake from the sea background in a single SAR image. The nonlocal entropy similarity criterion is employed to measure the similarity of nonlocal image patches in a search window, and then these similar image patches are constructed as an image patch matrix to set up an objective function for LRSD.
- (2)
An FOE model is further introduced to improve the decision reliability of the nonlocal LRSD ship wake detection procedure. The enhanced feature map is obtained by fusing a series of multi-view feature maps, which are generated by convolution with the FOE model filters. The sparse wake obtained through nonlocal LRSD is enhanced by performing a logical “and” operation on the center points of the Radon transform results for both the sparse wake and the enhanced feature map after applying CRC to Radon images to extract central points.
The rest of this article is organized as follows. In
Section 2, the principles of LRSD are overviewed, while the proposed wake detection method is presented in
Section 3. The experimental results are provided in
Section 4. The last section discusses the results and concludes the article.
2. LRSD for Ship Wake Detection
The redundancy and correlation in SAR images inherently stem from the repetitive nature of their internal elements. This indicates that SAR images have the properties of a low-rank structure, which is a priori knowledge in SAR images [
27]. The combination of low-rank a priori knowledge of SAR images and low-rank decomposition techniques has been successfully developed in the fields of SAR image denoising and target detection [
27,
28,
29,
30,
31]. Specifically, low-rank decomposition can be used to effectively separate low-rank background components with persistent features and sparse components representing local variations, which may correspond to targets or other objects of interest in an image, from SAR images [
32]. Methods based on low-rank priors of SAR images have recently been investigated for the problem of ship detection. They assume that the stable background of SAR images exhibits a low-rank structure and approximately consider ship wake patterns, strong sea clutter, and noise as sparse components [
23]. Using low-rank decomposition, the background interference can be reduced from ship wake patterns [
24]. In the process, ship wake separation is formulated as an optimization problem that is subject to the condition of sparsity [
23]. The LRSD-based technique for ship wake detection unfolds in a two-step procedure: the separation of ship wake components from the background through LRSD and the detection of the wake’s linear structure with the RT. The following is a brief introduction to the procedure.
A given SAR image, denoted as a two-dimensional matrix
, can be mathematically modeled as
, where
represents the low-rank component corresponding to the sea background, and
denotes the sparse component corresponding to the ship wake [
23]. The issue of wake detection, which involves separating the ship wake from the background, is reformulated as a rank minimization optimization problem and can be approximately expressed as:
where
is the nuclear norm, and
is the
norm. The regularization parameter
is used to control the balance between the two terms. The nuclear norm represents the sum of all singular values of
. The norm
is the sum of the absolute values of the non-zero elements in
. Equation (1) is a convex optimization problem and is often solved using the augmented Lagrange multiplier with alternating-direction minimization [
29]. The objective function is rewritten as:
where
is the Lagrangian operator,
is a positive penalty scalar,
denotes the inner product of the matrix, and
is the Frobenius norm. Then, Equation (2) is iteratively solved for one variable by fixing the others. Taking iteration
as an example, we update
by fixing
,
, and
:
where
is a positive scale that represents a singular value-shrinkage function. Its definition is
, which is a kind of soft threshold operator, and
denotes the sign function.
is updated by fixing the others:
where
is a singular value-shrinkage function with the parameter
.
is updated:
The loop procedure terminates when the maximum number of iterations is reached or the loss satisfies with the error tolerance .
After the decomposition, the ship wake patterns are obtained in and then detected with the RT method. The RT is applied to to provide a Radon image . The mean value and the standard deviation of the Radon image are estimated. A decision threshold value interval is utilized to extract the potential wake peak points, and it is expressed as . The parameters of and are empirically determined and conventionally set within the range of 2 to 4. These points outside the threshold interval are retained to be identified as potential wake peak points.
As shown in Equation (2), the core of analyzing low-rank priors is exploring low-rank components. For example, the background of continuous video frames involves low-rank components, since they are linearly correlated in the temporal domain [
25]. The efficacy of LRSD fundamentally depends on images having low-rank properties. The more obvious the low-rank structure, the more effective the separation between the background and target, i.e., the ship wake [
31]. The current LRSD-based methods for ship wake detection assume that the low-rank structure is characterized by a high correlation among adjacent pixels in an SAR image [
29]. However, the correlations between neighboring pixels can be corrupted by the complexity of a scene and speckle noise [
27,
28]. Consequently, the performance of LRSD is confronted with this limitation, which may reduce accuracy in separating a wake from the background.
On the other hand, the success of a threshold application in the Radon domain depends on the assumption that there are distinct differences in brightness between wake components and the residual background. However, wake components are often characterized by their faint signals [
33], which makes them less observable and causes differences in brightness with respect to the background to be less prominent. As a result, it is difficult to determine an appropriate threshold interval. Moreover, other linear structures, such as swell waves, also exhibit similar peak values to those of wakes in the Radon domain. Thus, this will lead to high rates of false detection alarms in the extraction of wake peak points when using a threshold decision.
3. The Proposed Method
To tackle the above problems, a novel ship wake detection method based on nonlocal LRSD and an enhanced feature map for a single SAR image is proposed. Unlike the existing LRSD method, which relies on similarity between neighboring pixels, the proposed method leverages non-local similarity in SAR images, where image patches at different spatial locations may have similar structural features [
27]. Based on a predefined measurement criterion, similar image patches can be collected, and patch matrixes with a high correlation can be formed [
30,
31]. These nonlocal image patch matrices (NPMs) are employed to replace the original SAR images in LRSD. The entropy-based measurement criterion is also proposed to find similar image patches. As a result, the low-rank structure of an NPM is more obvious than that of the original SAR image. The separation between the wake and the background is improved by the proposed nonlocal LRSD.
In order to improve the reliability of wake decision making, it is particularly crucial to characterize the features of wake patterns. The FOE model, which has a series of high-order filters, has demonstrated its powerful ability to depict images with complex textures or structures, including edges, textures, and other high-frequency information. This model demonstrates its performance in image enhancement tasks by revealing richer and more-detailed visual details in different directions. Motivated by its characterization ability, the filters of the FOE model are introduced to generate multi-view feature maps. These maps are integrated as enhanced feature maps to support subsequent wake judgments related to sparse wakes in the Radon domain, thereby improving the reliability of decisions. Subsequently, the wake breadth is used as a filtering criterion, and CRC is performed on Radon images to extract the cluster center points of sparse wakes and enhanced feature maps. Through logical operations on the center points of their Radon images, false wakes are further removed, and the potential wake peak points are identified.
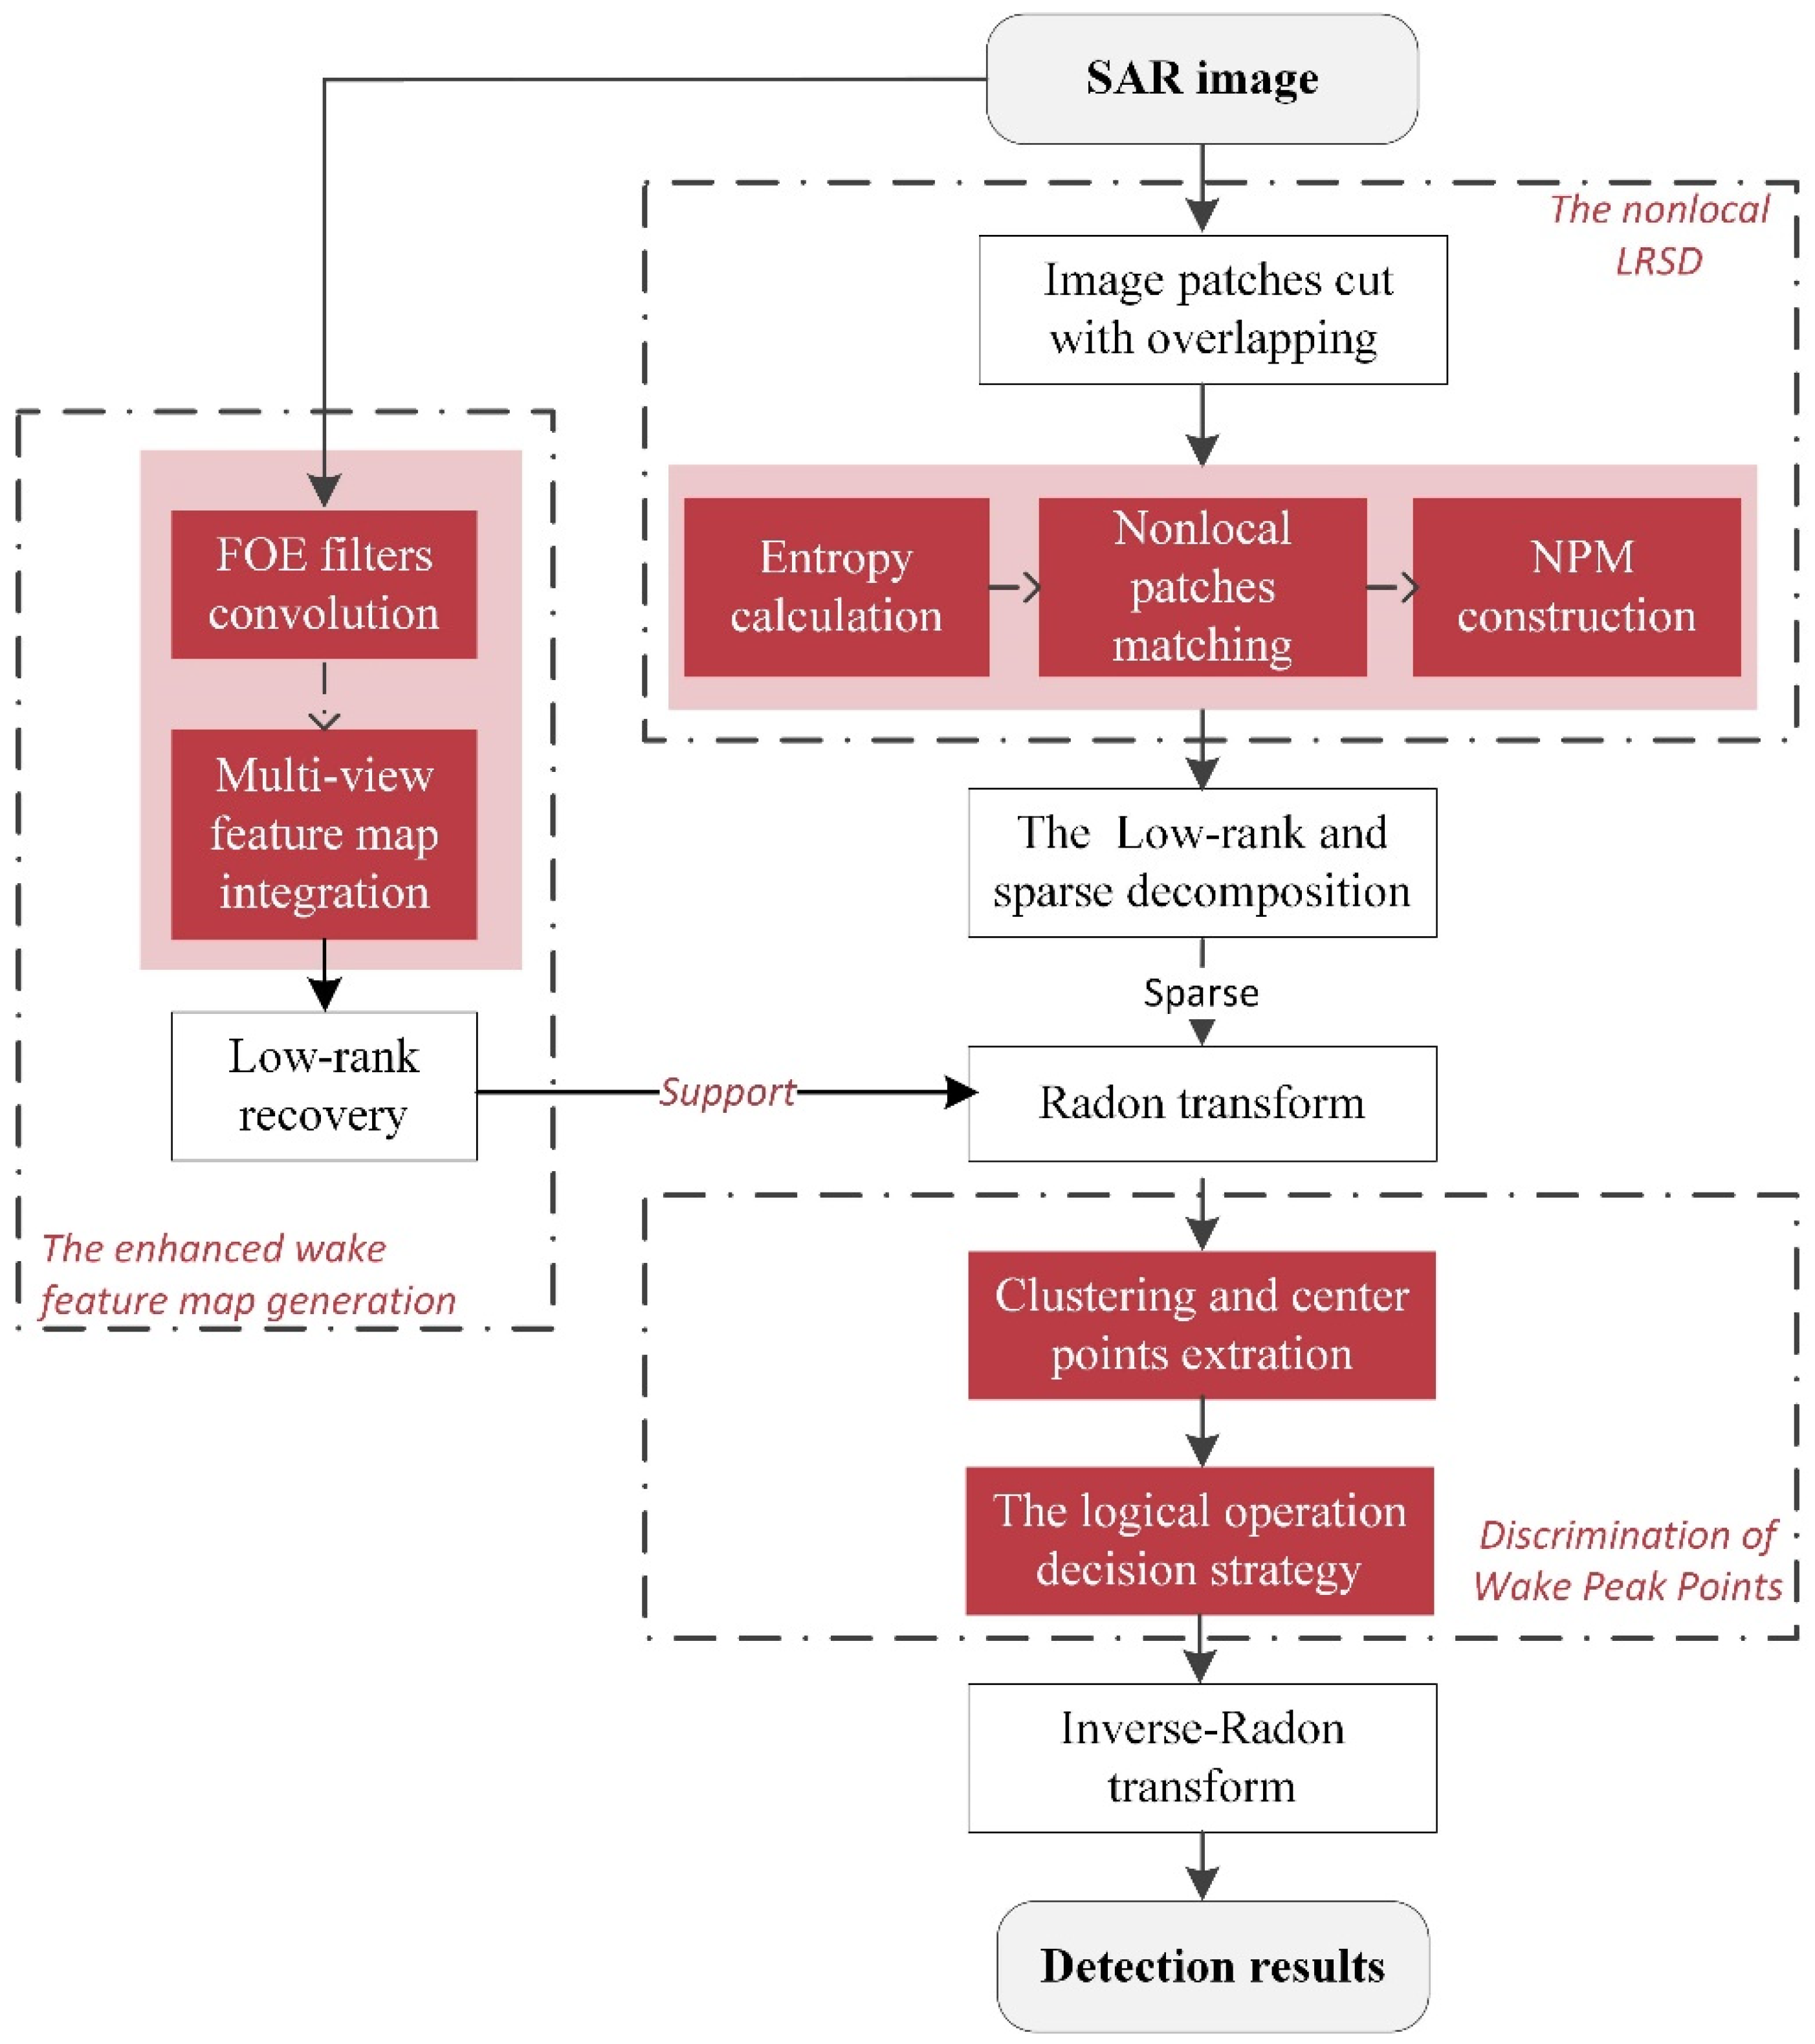
The proposed wake detection framework is overviewed in
Figure 1. Initially, the SAR image is cut into a series of image patches. For each reference patch, its image entropy is calculated, and a group of patches with entropy values that are approximately the same as that of the reference patch are selected. Then, an NPM is constructed by stacking and vectorizing similar patches, and sparse wakes are separated by performing LRSD on the NPM. Secondly, the SAR image is convolved with the filters of the FOE model to obtain multi-view wake feature maps. An enhanced feature map is produced through the integration of the multi-view maps, and then low-rank matrix recovery is adopted to reduce the noise. Finally, the RT is executed on both the sparse wake and the enhanced feature map. CRC is employed, the center points of clusters are extracted from the Radon images, and a logical “and” operation is applied on the center points to extract the peak points of the sparse wake. The wake decision results are provided by the inverse RT.
The three main steps are illustrated in detail as follows.
Figure 1.
The outline of the proposed wake detection framework.
Figure 1.
The outline of the proposed wake detection framework.
3.1. Modified Nonlocal LRSD
In reality, some image patches are located in different positions with similar structures. This is a typical property of SAR images and is called nonlocal similarity. Nonlocal-similarity-based methods have been investigated in SAR image denoising, restoration, and detection. These studies have demonstrated that grouped nonlocal similarity image patches can be considered as low-rank matrices. As stated previously, the successful application of LRSD depends on the low-rank structure of the SAR image. In this section, the low-rank structure of a matrix of nonlocally similar patches is exploited with similar structures, and this is incorporated into LRSD as a core concept.
Given a reference image patch, each patch can be matched with other patches according to their similarity, which is called patch matching. The key to patch matching is defining the similarity criterion. Some measurements have been adopted to evaluate the similarity of image patches, among which the most commonly adopted measurement is based on the grayscale Euclidean distance [
30]. However, the large variation in the gray absolute intensity caused by noise in SAR images makes the grayscale Euclidean distance less effective. The SAR wake imaging mechanism indicates that the textural roughness of the sea surface is changed by the wake’s modulation of gravity–capillary waves on the sea surface. This textural difference enables wakes to become visible in SAR images [
10]. A recent study also demonstrated that wakes and the sea surface are significantly different in texture [
13]. Inspired by this, texture information was utilized to assess the similarity between patches. As a classical texture feature, entropy was introduced to quantify this similarity in this study.
An SAR image with a size of
can be partitioned into numerous patches with a fixed size
and fixed step
. There are
image patches. For one image patch
with a size of
, the entropy is calculated as follows:
where
.
refers to the gray intensity of
at
. To eliminate the influence of the patch size, the entropy value is normalized as follows:
As entropy is the joint contribution of all pixels in the patch, and it is not sensitive to noise in the gray intensity [
32]. The similarity criterion between the two patches can be defined using the entropy distance as follows:
where
is the entropy of patch
. Then, according to the criterion in Equation (8), an NPM can be constructed for the referenced patch
. For each patch, the entropy of the candidate patches in a searching window is computed using Equations (7) and (8) for
. These candidate patches are ranked in ascending order of similarity distance. The
smallest distances are selected, and they represent the
most similar patches to the referenced patch. All of the similar patches are stretched as columns with
and stacked to form a low-rank NPM
, where the first column denotes the referenced patch
.
is defined as
where the matrix
has dimensions of
rows by
columns. Since the correlation between the adjacent columns in
is higher than that in the original SAR image, there are fewer sea clutter residuals in the sparse wake components. The observed image matrix
in Equation (1) is replaced by the NPM
. Similarly, a Lagrangian operator with an augmented Lagrange multiplier and alternating-direction minimization is applied to solve for each
.
An illustration of the construction of the NPM is depicted in
Figure 2. The similarities among patches of ship hulls labeled with a purple box are higher than those of the surrounding sea background. The
most similar candidate patches based on the entropy similarity distance are selected, as shown in the middle of
Figure 2, while the construction of
is shown on the right. The Lagrangian operator with augmented Lagrange multiplier and alternating-direction minimization is applied to solve for each
, and the whole process is summarized in Algorithm 1.
| Algorithm 1: Modified nonlocal LRSD based on entropy similarity |
| 1: Input: An SAR image , the maximum number of iterations , the tolerance , the size of the square patch , and the step between the neighboring patches. |
| 2: Divide into patches, find the most similar patches, and stack the similar patch matrix based on Equation (9); the NPM number is set to . |
| 3: For each in : |
| 4: For , do the following: |
| 5: Update using |
| 6: Update using |
| 7: Update using |
| 8: Update |
| 9: End |
| 10: End |
| 11: Aggregate and |
| 12: Output |
3.2. The Generation of an Enhanced Wake Feature Map
In terms of a sparse wake, it is important to enhance the linear structure characteristics, since the enhanced structure can provide supplementary information for peak point detection and improve the reliability of detection. In traditional research, regularization methods based on the weighted kernel norm and total variation (TV) are widely used to enhance the features of wakes [
28]. They maintain image details by adjusting the weights of singular values or constraining the gradient information in an image. However, these methods often rely on local image priors or low-order derivative analysis factors, such as first-order derivatives, which limits their potential for describing image features. To overcome this limitation, Markov random fields (MRFs) are introduced into the detection framework, as they have shown the ability to capture image details and model spatial priors in SAR images [
34]. In particular, a high-order MRF model (e.g., the FOE model) can capture global image priors through the application of a series of high-order filters [
35]. These filters generate multi-view feature maps by convolving with the image and providing rich directional texture information, which is difficult to achieve with traditional methods.
Here, the high-order filters in [
36] are directly employed to generate multi-view feature maps via convolution with the original SAR image, and they are written as follows:
where
denotes the
filter, which is trained with numerous natural images.
is the
feature map.
is related to the number of filters, and further details can be found by referring to [
36,
37]. For instance, 8 filters have a size of
, and 24 filters have a size of
. The intricate edges and details of the images in diverse orientations are enhanced through these multi-view feature maps.
Then, an average-weighting strategy is adopted to integrate the generated feature maps into an enhanced feature map as follows:
where each feature map is assigned the same weight, since the contributions made to the feature description are the same but in different directions. The fusion process preserves the multi-view features inherent in SAR images.
Next, noise reduction is performed on the enhanced feature map by using low-rank matrix recovery.
where
is the estimated enhanced wake feature map. A singular value-shrinkage function [
23] is used to solve the optimization problem in Equation (12).
To demonstrate the effectiveness of the enhanced wake feature map with the FOE model, a group of 24 filters with a size of
[
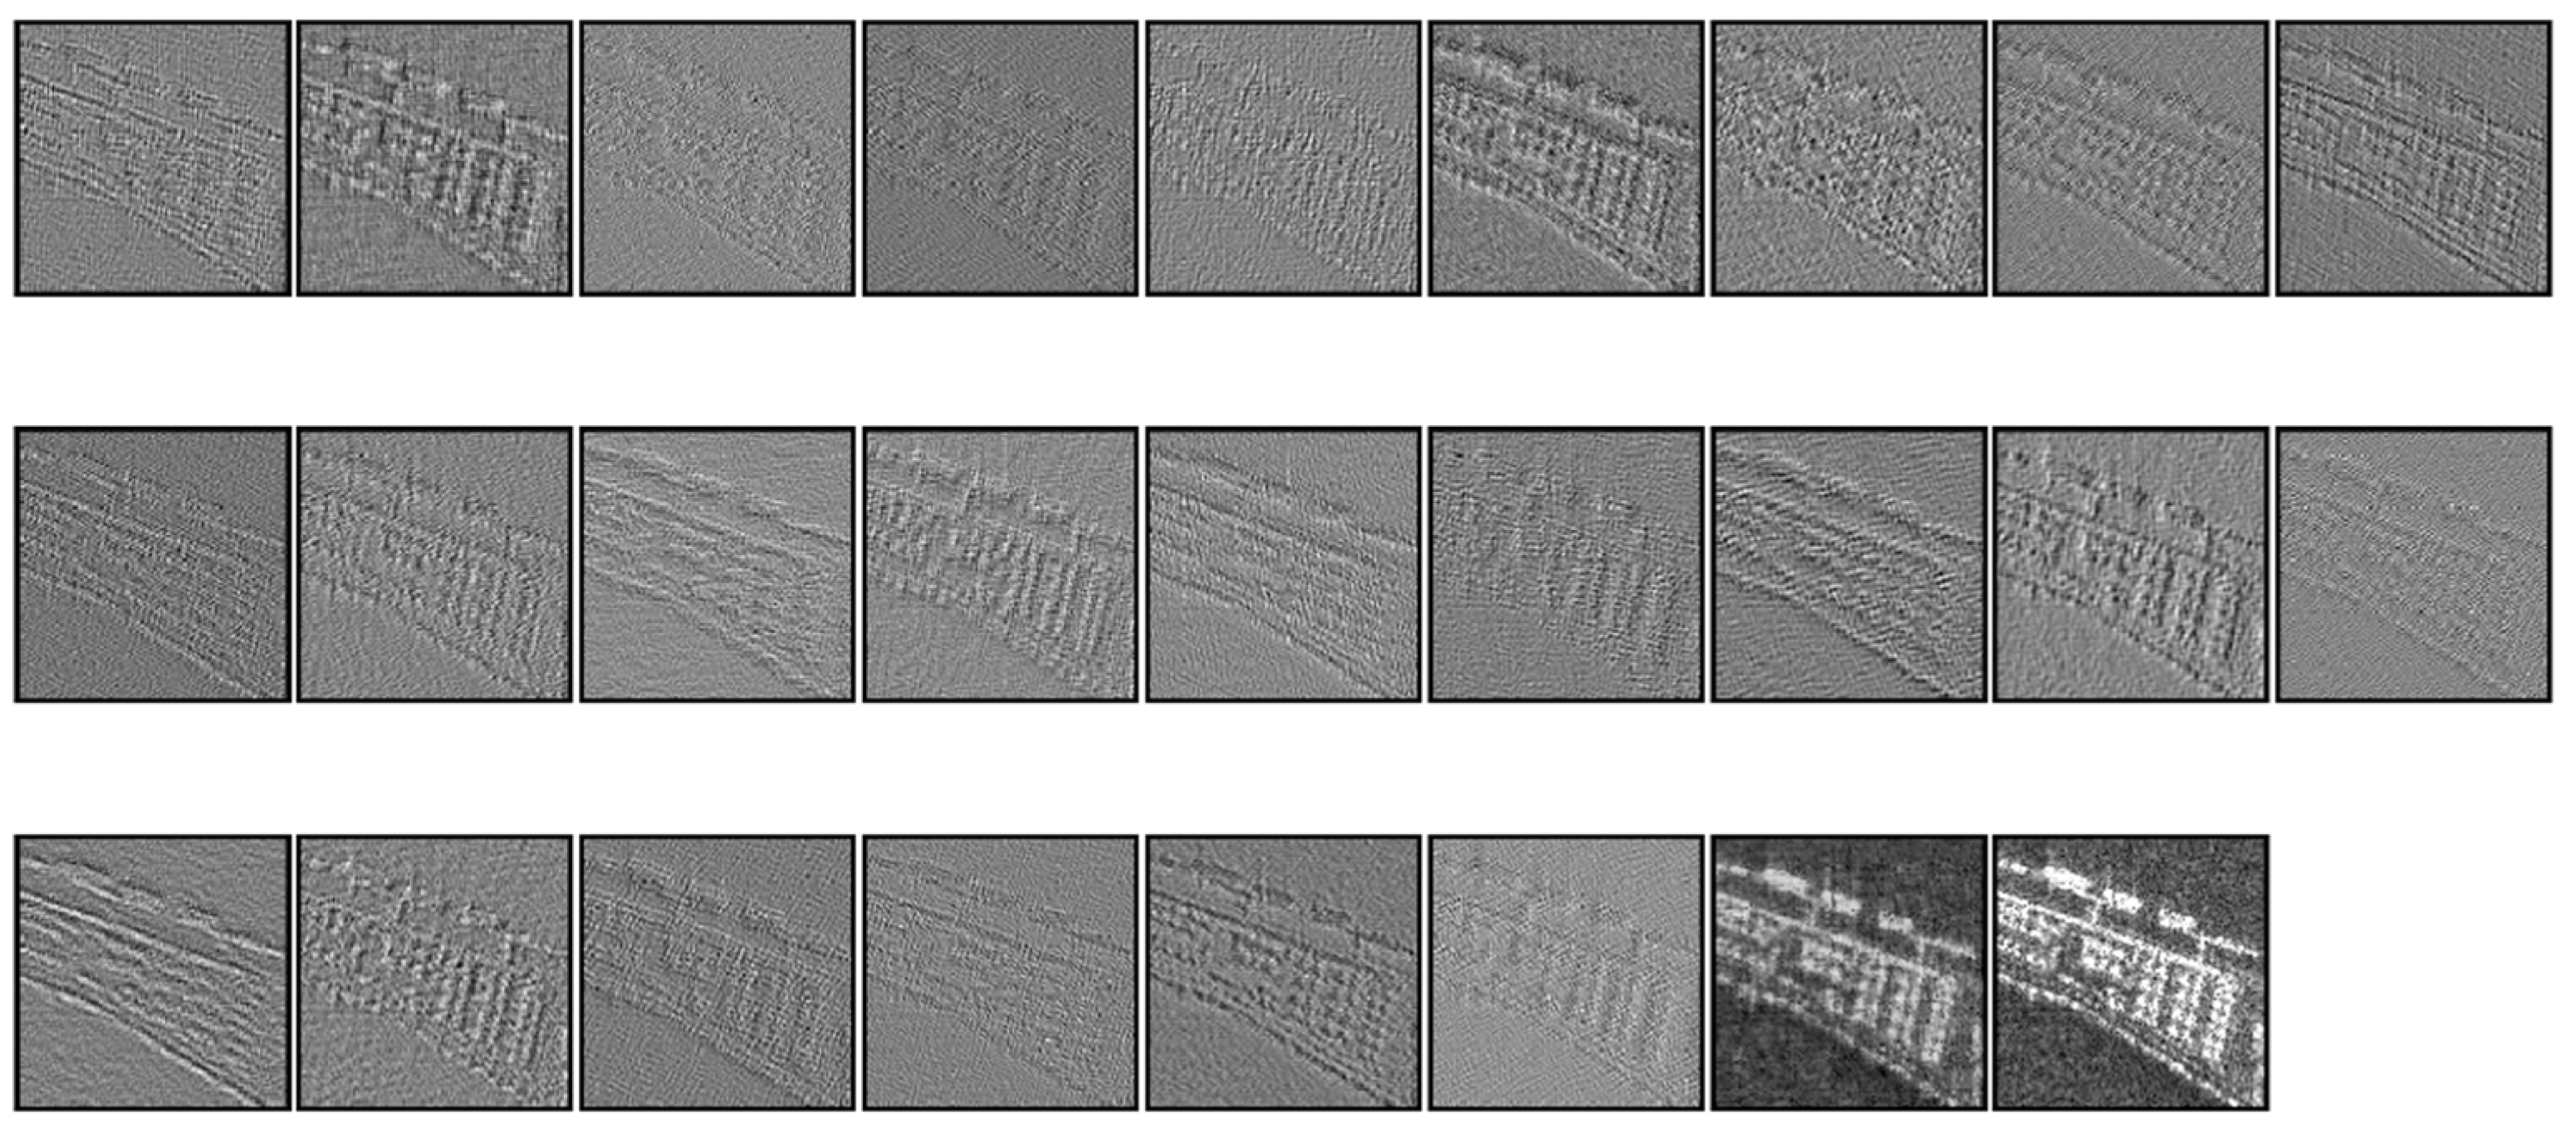
37] was utilized. A content-rich GF-3 port SAR image was selected and convolved with each filter, resulting in a series of convolutional feature maps, as shown in
Figure 3, where the first 24 images represented the multi-view feature maps obtained with Equation (6), and the 25th image corresponded to
. The original GF-3 port SAR image is positioned in the bottom-right corner of
Figure 3. It can be observed that these multi-view feature maps encompassed rich information, and the edges were more obvious than the background. These features were highlighted through enhancement processing in various directions. In addition, the enhanced image was smoother than the original SAR image. This indicated that not only were the wake features enhanced, but the speckle noise was also reduced due to the combination of the FOE model and low-rank matrix recovery.
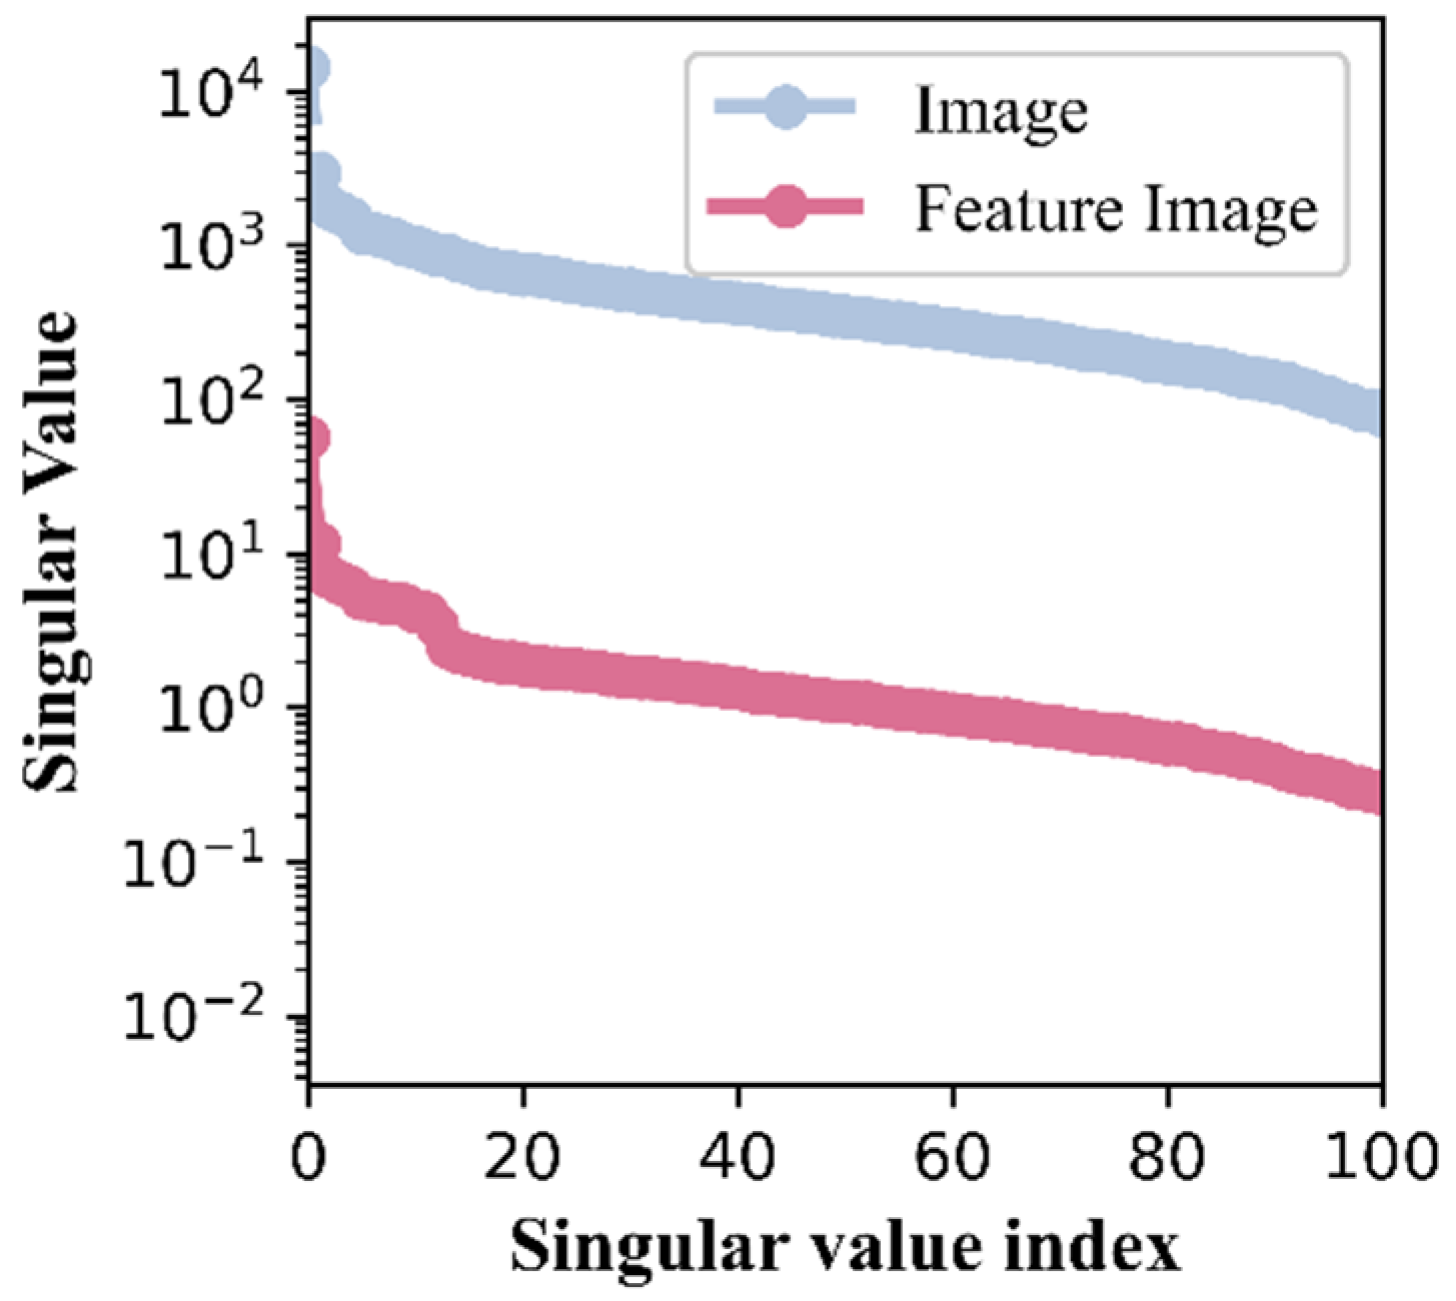
The low-rank properties were also compared between the enhanced feature map and the original SAR image. Singular value decomposition was executed on the enhanced feature map and the original image, and the results are given in
Figure 4. It can also be observed that the singular values of the feature map were smaller. As illustrated in
Figure 4, the enhanced feature map had more obvious low-rank properties than those of the original SAR image. This also supported the speckle noise reduction; as such, the enhanced feature map would be beneficial for subsequent wake detection. Thus, the feature map could help separate a sparse wake from the background.
3.3. Discrimination of Wake Peak Points
CRC and a logical operation are introduced to further improve the decision reliability of nonlocal LRSD in the Radon domain. Specifically, CRC is applied on both the Radon images of the sparse wake and the enhanced feature map. Based on the clustering results, a logical operation is conducted on the cluster center points.
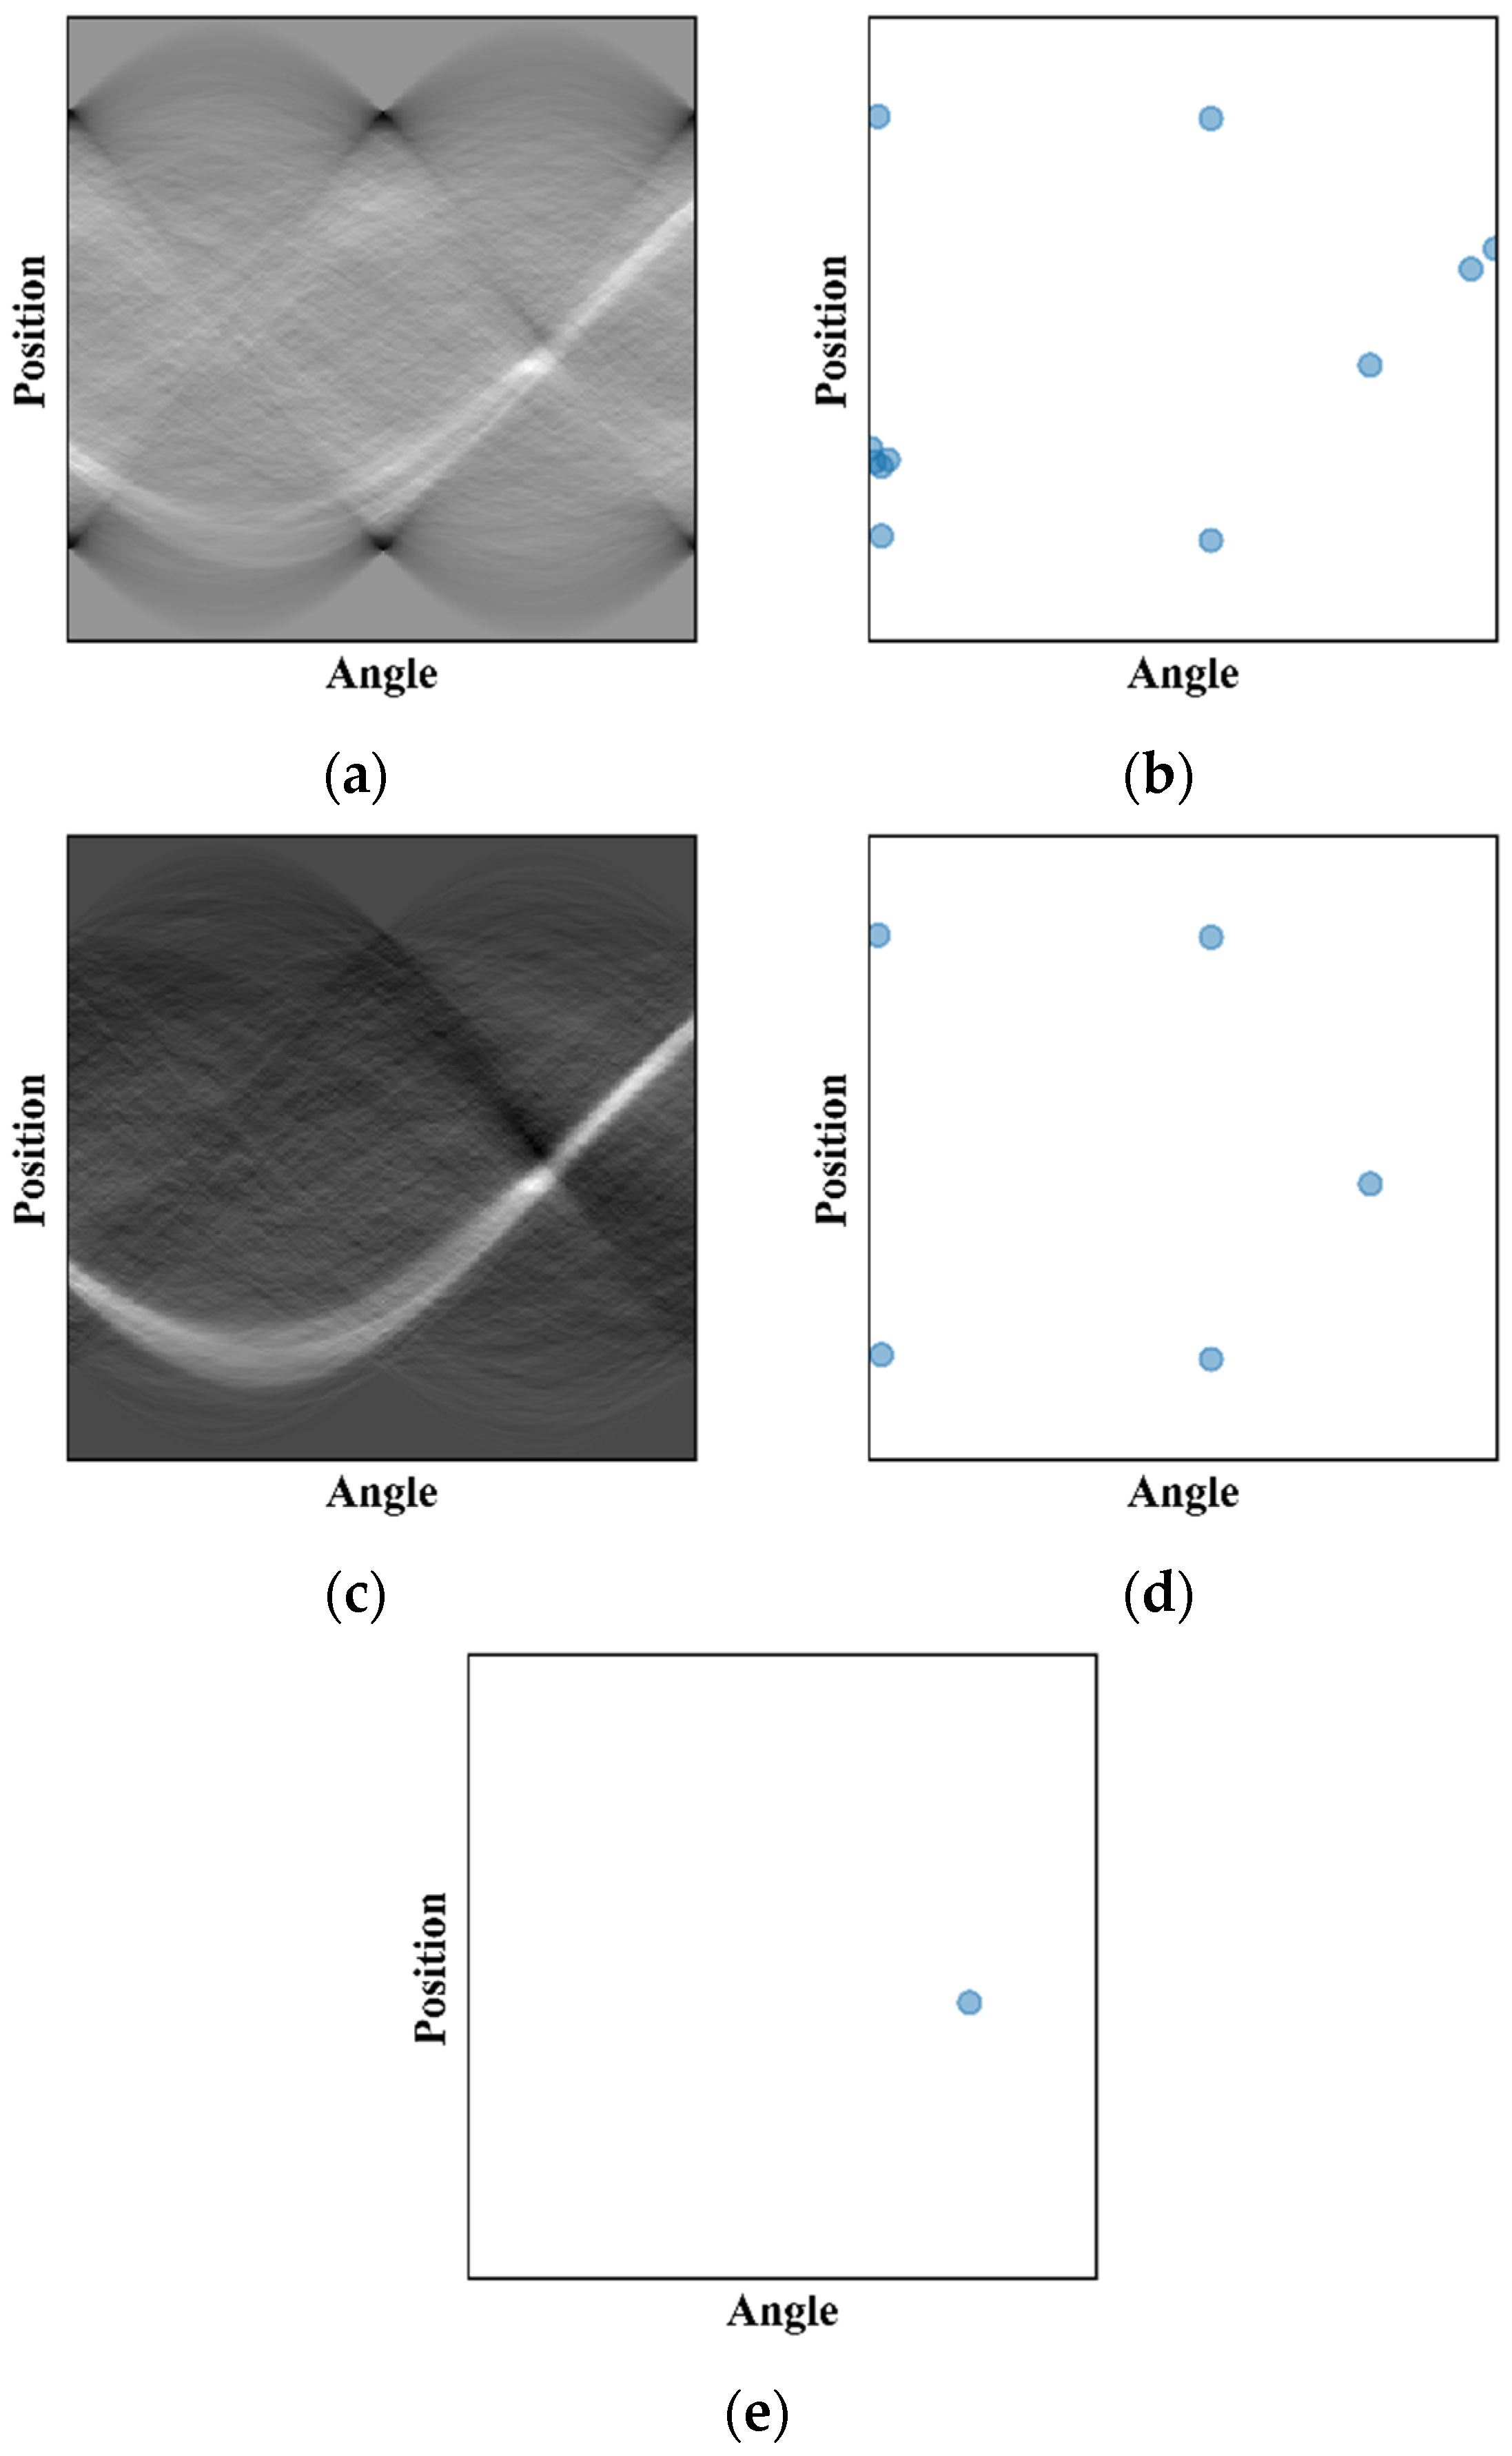
Linear sea waves are discrete and characterized by isolated points in the Radon domain, while wake components with breadth are characterized by a contiguous region. Therefore, CRC is employed on Radon images to remove these isolated sea wave points before the logical operation.
Based on the principle of Radon-based ship wake detection, a set of peak points are retained after the threshold decision and represented by
. One peak point
at the location
in set
is expressed as
, where
denotes the distance and
denotes the angle.
is the brightness value of this peak. Based on the brightness of
, if all peaks have a path connecting them, then any two peaks can be considered connected. The subset composed of all peaks connected to any peak is called the connected clustering region of set
. Set
is binarized as
, and an array
of the same size as
is initialized with 0. Then, the clustering regions are acquired through CRC using a structural element. The progress is expressed as follows:
where
is a neighborhood structural element. The iterative process stops when
. All of the components of the connected regions are covered by
, and each component of the connected regions represents a set of peak points. The center point of each component of the connected regions,
, is extracted gradually, where
is the total number of clustering regions.
By applying CRC to Radon images, the clustering center points are set for the sparse wake separated using nonlocal LRSD, and the enhanced feature map is obtained; these are expressed as
and
, respectively. Then, the potential wake peak points are extracted using a decision strategy based on a logical “and” operation, which is defined as follows:
The ship detection results based on these potential wake peak points are provided by the inverse RT.
5. Discussion and Conclusions
This study was motivated by the objective of increasing the accuracy of ship wake detection in SAR images and decreasing the rate of false alarms. Conventional LRSD-based studies have primarily focused on background removal, ignoring the nonlocal similarity priors and the reliability of wake decision making. This investigation indicated that wake separation can be improved by using modified nonlocal LRSD. Enhanced wake features can serve to distinguish between the true linear structure of a wake and the other false structures. An analysis of the results for the computational time in a comparison between NLSD and LRSD was also provided. There are two primary complex computations in the proposed method. The first involves the decomposition process of singular value decomposition (SVD), a fundamental component of LRSD-based methods. The computational complexity of constructing an NPM is
, according to the parameters set in the experiment. The SVD is executed
times in a loop, and the complexity is
. The other is the calculation of entropy, for which the computational complexity of one patch is calculated as
. As described in
Section 3.1, the computation of entropy necessitates repetitive evaluations for each image patch. Moreover, the calculation of entropy is iteratively executed within all candidate patches, thereby augmenting the computational burden. The improvement of the detection accuracy is at the cost of computational complexity, and future work will focus on reducing the runtime of the method while maintaining high detection accuracy.
A novel ship wake detection procedure based on a nonlocal low-rank constraint and an enhanced feature map was proposed in order to improve the reliability of wake decisions. The designed nonlocal similarity criterion was utilized to construct a matrix of nonlocally similar image patches with high correlation, which provided a better separation between sea clutter and wake patterns. An enhanced feature map was developed using the FOE model to capture more wake details, thereby improving the reliability of wake peak point decisions. Based on Radon images, clustering in connection regions was further employed to filter out other linear structures of sea waves and noise. Our method demonstrated remarkable detection accuracy when applied to real SAR images. However, it is worth noting that the proposed method incurs higher computational costs due to the construction of a nonlocally similar patch matrix. The trade-off between accuracy and computational efficiency is a challenge that must be addressed in future research.
