Technical Note

Assessment of Multiple Planetary Boundary Layer Height Retrieval Methods and Their Impact on PM2.5 and Its Chemical Compositions throughout a Year in Nanjing

1
Key Laboratory for Aerosol–Cloud Precipitation of China Meteorological Administration/Special Test Field of National Integrated Meteorological Observation, Nanjing University of Information Science & Technology, Nanjing 210044, China
2
Earth System Science Interdisciplinary Center, Department of Atmospheric and Oceanic Science, University of Maryland, College Park, MD 20740, USA
3
School of Geographic Sciences, Nantong University, Nantong 226000, China
4
State Key Laboratory of Remote-Sensing Science, College of Global Change and Earth System Science, Beijing Normal University, Beijing 100875, China
*
Author to whom correspondence should be addressed.
Remote Sens. 2024, 16(18), 3464; https://doi.org/10.3390/rs16183464
Submission received: 19 July 2024 / Revised: 4 September 2024 / Accepted: 12 September 2024 / Published: 18 September 2024
(This article belongs to the Section Atmospheric Remote Sensing)

Abstract

:
In this study, we investigate the planetary boundary layer height (PBLH) using micro-pulse lidar (MPL) and microwave radiometer (MWR) methods, examining its relationship with the mass concentration of particles less than 2.5 µm in aerodynamic diameter (PM2.5) and its chemical compositions. Long-term PBLH retrieval results are presented derived from the MPL and the MWR, including its seasonal and diurnal variations, showing a superior performance regarding the MPL in terms of reliability and consistency with PM2.5. Also examined are the relationships between the two types of PBLHs and PM2.5. Unlike the PBLH derived from the MPL, the PBLH derived from the MWR does not have a negative correlation under severe pollution conditions. Furthermore, this study explores the effects of the PBLH on different aerosol chemical compositions, with the most pronounced impact observed on primary aerosols and relatively minimal influence on secondary aerosols, especially secondary organics during spring. This study underscores disparities in PBLH retrievals by different instruments during long-term observations and unveils distinct relationships between the PBLH and aerosol chemical compositions. Moreover, it highlights the greater influence of the PBLH on primary pollutants, laying the groundwork for future research in this field.

1. Introduction

The planetary boundary layer (PBL) constitutes a critical atmospheric layer extending from the Earth’s surface to the free troposphere, profoundly influencing environmental conditions and human health [1]. PBL height (PBLH), a key parameter within this layer, plays a pivotal role in governing the exchange of water vapor and aerosols between the Earth’s surface and the atmosphere. This exchange is influenced by various factors, including capping inversions, which can either impede or facilitate convective processes within the PBL. Stable stratification within the PBL can limit vertical turbulence, potentially trapping air pollutants, especially aerosols, emitted from ground-level sources [2,3]. This confinement exacerbates air quality issues by hindering their dispersion into the free troposphere [4,5].
China, with its rapid urbanization and industrialization, faces severe air pollution challenges [6,7]. Particulate matter (PM), a major pollutant, poses significant health risks upon inhalation, contributing to respiratory and cardiovascular diseases [7]. Furthermore, PM affects climate dynamics by altering solar radiation absorption and cloud properties, influencing global radiative forcing [8,9,10,11]. Aerosols such as sulfate and nitrate have been identified for their cooling effects on the Earth’s surface, impacting PBL dynamics and stability [12,13,14]. Observational studies often link severe pollution events with low PBLH levels, underscoring the critical need for accurate PBLH estimation in aerosol pollution research.
Various methods define PBLH, each emphasizing different physical characteristics of the PBL. The turbulent motion method identifies PBLH as where turbulent energy approaches zero, reflecting boundary layer stability [15,16]. Contrastingly, the dynamic effect method correlates PBLH with wind characteristics, highlighting wind speed and geostrophic wind patterns [17]. The thermodynamic method, commonly utilizing radiosonde and microwave radiometer (MWR) data, identifies PBLH through temperature gradient discontinuities [18]. MWRs offer advantages such as high temporal resolution, critical for monitoring temperature and humidity profiles within the PBL [19,20,21]. Similarly, the substance distribution method uses lidar signals to detect water vapor and aerosol gradients, crucial for estimating PBLH [22].
Research has increasingly focused on understanding the intricate relationship between PBLH and air pollutants worldwide, demonstrating a negative correlation between PBLH and ground-level pollutant concentrations [23,24,25,26]. As PBLH decreases, the vertical space for pollutant dispersion diminishes, exacerbating pollution levels. Concurrently, high aerosol concentrations contribute to negative radiative forcing, reducing surface solar absorption and further stabilizing the PBL [27]. Thus, investigating the interplay between PBLH and pollutants is crucial for elucidating pollution mechanisms.
Nanjing, a major city in eastern China traversed by the Yangtze River, experiences significant monsoonal influences with distinct seasonal wind patterns [28]. The region’s complex aerosol composition, influenced by agricultural, industrial, and vehicular emissions, underscores the need for comprehensive field studies. Long-term investigations in Nanjing have examined PBLH variability using diverse methodologies, shedding light on its interactions with PM chemical components and their implications.
This study aims to contribute new insights into the complex relationship between PBLH dynamics and aerosol pollution through a year-long comprehensive field experiment in Nanjing. Specifically, we compare PBLH observations derived from different methods and analyze their correlations with PM concentrations. By exploring these interactions, this research endeavors to enhance our understanding of regional air quality dynamics and inform effective pollution management strategies.

2. Experiment and Methods

2.1. Observation Site and Field Campaign

The data used in this study were obtained during a comprehensive field experiment carried out in Nanjing from September 2020 to August 2021. The observation site (32.18°N, 118.72°E) is on the campus of Nanjing University of Information Science & Technology (NUIST). All the instruments were at the same location on the surface. The ACSM sampling inlet is approximately 4 m above the ground level, housed within a white container. The physical and chemical properties of aerosols and the vertical distribution of temperature and humidity parameters were measured. More detailed information about the observation site is given by Song et al. [29].

2.2. Instrumentation

Details about instruments used in this study are as follows:
(a) The micro-pulse lidar (MPL; Sigma Space Corp., Meckenheim, Germany) has a wavelength of 532 nm and a pulse repetition rate (PRF) of 2500 Hz. This instrument can detect cloud signals and provide the normalized signal, backscatter profile, extinction coefficient profile, aerosol optical depth (AOD), and other products. Because of incomplete overlap of the laser beam and the telescope field of view, the lowest 270 m above the ground presents a blind zone for the MPL. The backscatter profile goes up to 6 km, with a vertical resolution of 30 m.
(b) The microwave radiometer (MWR; Radiometer Physics GmbH, Meckenheim, Germany) has seven water vapor absorption channels in the 22 to 30 GHz range (K-band) and seven oxygen absorption channels in the 51 to 59 GHz range (V-band). The instrument is also equipped with sensors to measure surface temperature and RH. This MWR can provide a variety of products, such as brightness temperature, RH, absolute humidity, and liquid water path. The maximum detection height can be up to 10 km, with the vertical resolution in the first 1 km layer varying between 10 and 40 m. From 1 to 2.5 km, the vertical resolution varies between 40 and 100 m, while, above 2.5 km, the vertical resolution varies between 100 and 1000 m.
(c) An aerosol chemical speciation monitor (ACSM, Aerodyne Research Inc., Billerica, MA, USA) equipped with the PM2.5 lens system is used to measure the mass concentrations of non-refractory aerosol chemical components. These components include organics ( O r g ), nitrate ( N O 3 ), sulfate ( S O 4 2 ), ammonium ( N H 4 + ), and chlorine ( C l ) [30,31,32,33]. Also, organic aerosols can be divided into primary organic aerosols (POAs) and secondary organic aerosols (SOAs) according to the positive matrix factorization analysis [34]. Meanwhile, a seven-wavelength aethalometer (AE-33, Magee Scientific Corporation, Berkrley, CA, USA) with a PM2.5 cyclone provides the mass concentration of black carbon (BC) aerosols. In this study, the PM2.5 mass concentration is the sum of aerosol mass concentrations measured by the ACSM and the AE-33.
For consistency, the data used in this study were uniformly averaged to a 15 min resolution. To ensure the quality of the data, observations taken during rainfall were excluded.

2.3. Retrieving the PBLH Using the MPL

According to the substance distribution method described in Section 1, PBLH is considered to be at the height where the smallest gradient in the backscattering coefficient profile appears (Min GRD) [35,36]. However, the method using the backscattering coefficient gradient requires high-quality backscattering coefficient profile data, which are greatly affected by the signal-to-noise ratio (SNR). To solve the problem of a low SNR, the wavelet covariance transform (WCT) method is also used to retrieve the PBLH [36]. Each profile is calculated using the wavelet covariance function:
W f ( a , b ) = 1 a z b z t f z h z b a d z ,
h z b a = + 1 ,   b a 2 z b 1 ,   b z b + a 2 0 ,   e l s e w h e r e
where f(z) is the range-corrected lidar backscatter signal at height z from the ground, zb is the lower limit of the signal profile, zt is the upper limit of the signal profile, a is the range (window) of the step function, and b is the position. The value of a is the key of the WCT method, and 300 m is used in this study according to Li et al. [37]. The greater the value of the WCT function, the higher the similarity between the signal and the wavelet function, indicating a more significant change or discontinuity in the signal. The maximum value of the WCT function corresponds to the PBLH [38].

2.4. Retrieving the PBLH Using the MWR

In this study, the method determining the PBLH from the MWR (PBLHMWR) combines two approaches, namely the parcel method [39] and the temperature gradient method [40]. The two approaches correspond to two situations, i.e., convective and stable situations, respectively. We first need to compare the surface potential temperature (θ(sfc)) obtained by the MWR to all θ(z) points below 3 km, where sfc and z represent surface (0 m above ground) and above-surface heights, respectively. If every θ(z) in the profile is greater than θ(z0), the situation is marked as stable and the temperature gradient method is used. Otherwise, the situation is considered unstable and the parcel method is applied. The potential temperature is calculated using the following formula, assuming that the surface pressure is 1000 mb and that the atmosphere follows standard atmospheric conditions [41]:
θ z = T z + 0.0098 z
Since there is no measured vertical profile of air pressure, the atmosphere is assumed to be standard here. T(z) is the temperature at height z from the ground, and 0.0098 K/m is the dry adiabatic temperature gradient of the standard atmosphere.
The parcel method determines the PBLHMWR at height z where θ(z) is closest to θ(sfc), because this is the maximum height that the air mass at temperature (T) on the ground can reach by convection [39]. The temperature gradient method provides PBLHMWR in two ways: the first height where the gradient of T is positive or the first height above where d θ d z = 0 (top of the stable boundary layer). As shown in Supplementary Figure S1, a continuous PBLH can be obtained by combining the two methods.

3. Results and Analysis

3.1. Comparison of PBLHs Retrieved by Different Instruments and Methods

To compare the PBLHs retrieved by MPL methods (Min GRD and WCT) and the MWR method, a representative example is shown in Figure 1. This example is from 8:00 to 18:00 local time on 12 July 2021, where the development of the PBL is obvious and typical. Figure 1a shows the normalized vertical backscattering coefficient (VBC) gradient profiles and the time series of PBLH retrieved by the Min GRD method. Figure 1b shows the WCT function profiles and the time series of PBLH retrieved by the WCT method. Figure 1c displays vertical backscattering coefficient (VBC) profiles and the time series of PBLH from different methods.
It is apparent that, for most of the day, the PBLH values derived from the MWR method are significantly higher compared to those obtained from the MPL methods. As shown in Figure 1c, the Min GRD method yields close but a little higher PBLHs than the WCT method. This phenomenon, where the PBLH retrieved by the WCT method is lower than that by the Min GRD method, is also observed in another study [42]. This may be because gradient-based methods identify the strongest gradient in the corresponding profile while the WCT method considers the average state of the signal within a certain height range to detect step changes [42]. Additionally, the PBLH values retrieved by the WCT method are more stable than those retrieved by the Min GRD method, with fewer abrupt changes detected.
As depicted in Figure 1c, at 8:30 a.m., the thermodynamic PBLH retrieved by the MWR is approximately 500 m higher than the two PBLHs retrieved by the MPL, representing a significant divergence. However, after 11:30, this discrepancy quickly diminishes. The fundamental cause for this variation lies in the distinct quantities retrieved by the MPL and MWR methods. Specifically, the MPL method emphasizes retrieving the PBLH of the substance layer whereas the MWR retrieves the thermodynamic PBLH, which signifies the highest altitude that aerosols can attain through convection [20,39]. During the time span from 8:00 to 10:00 in Figure 1c, the thermodynamic PBLH (PBLHMWR) gradually rises due to convection induced by solar radiation.
Specifically, in the morning and evening, especially during winter when the night is clear and cloudless or has few clouds, the ground rapidly radiates heat, leading to a cooling effect and the formation of an inversion layer at about 100–200 m above the ground. This inversion layer creates a thermodynamic PBLH that is notably lower than the PBLH obtained through other methods [43].
To conduct a thorough comparison of the PBLH measurements retrieved by two different instruments over an extended period, the MPL-derived PBLH is determined as follows: if the discrepancy between the Min GRD method and the WCT method exceeds 200 m, the WCT method’s measurement is adopted as the representative value. In other cases, the MPL-derived PBLH is calculated as the average of the two methods’ results. After this determination, the MPL-derived PBLH is subsequently compared with the PBLH retrieved by the MWR for a comprehensive analysis (Figure 2). Additionally, near-surface temperature inversions are commonly observed during autumn and winter nights, so the PBLH may be influenced by the residual boundary layer [44,45]. Therefore, only daytime (local time 8:00–18:00) data are used in the subsequent analysis.
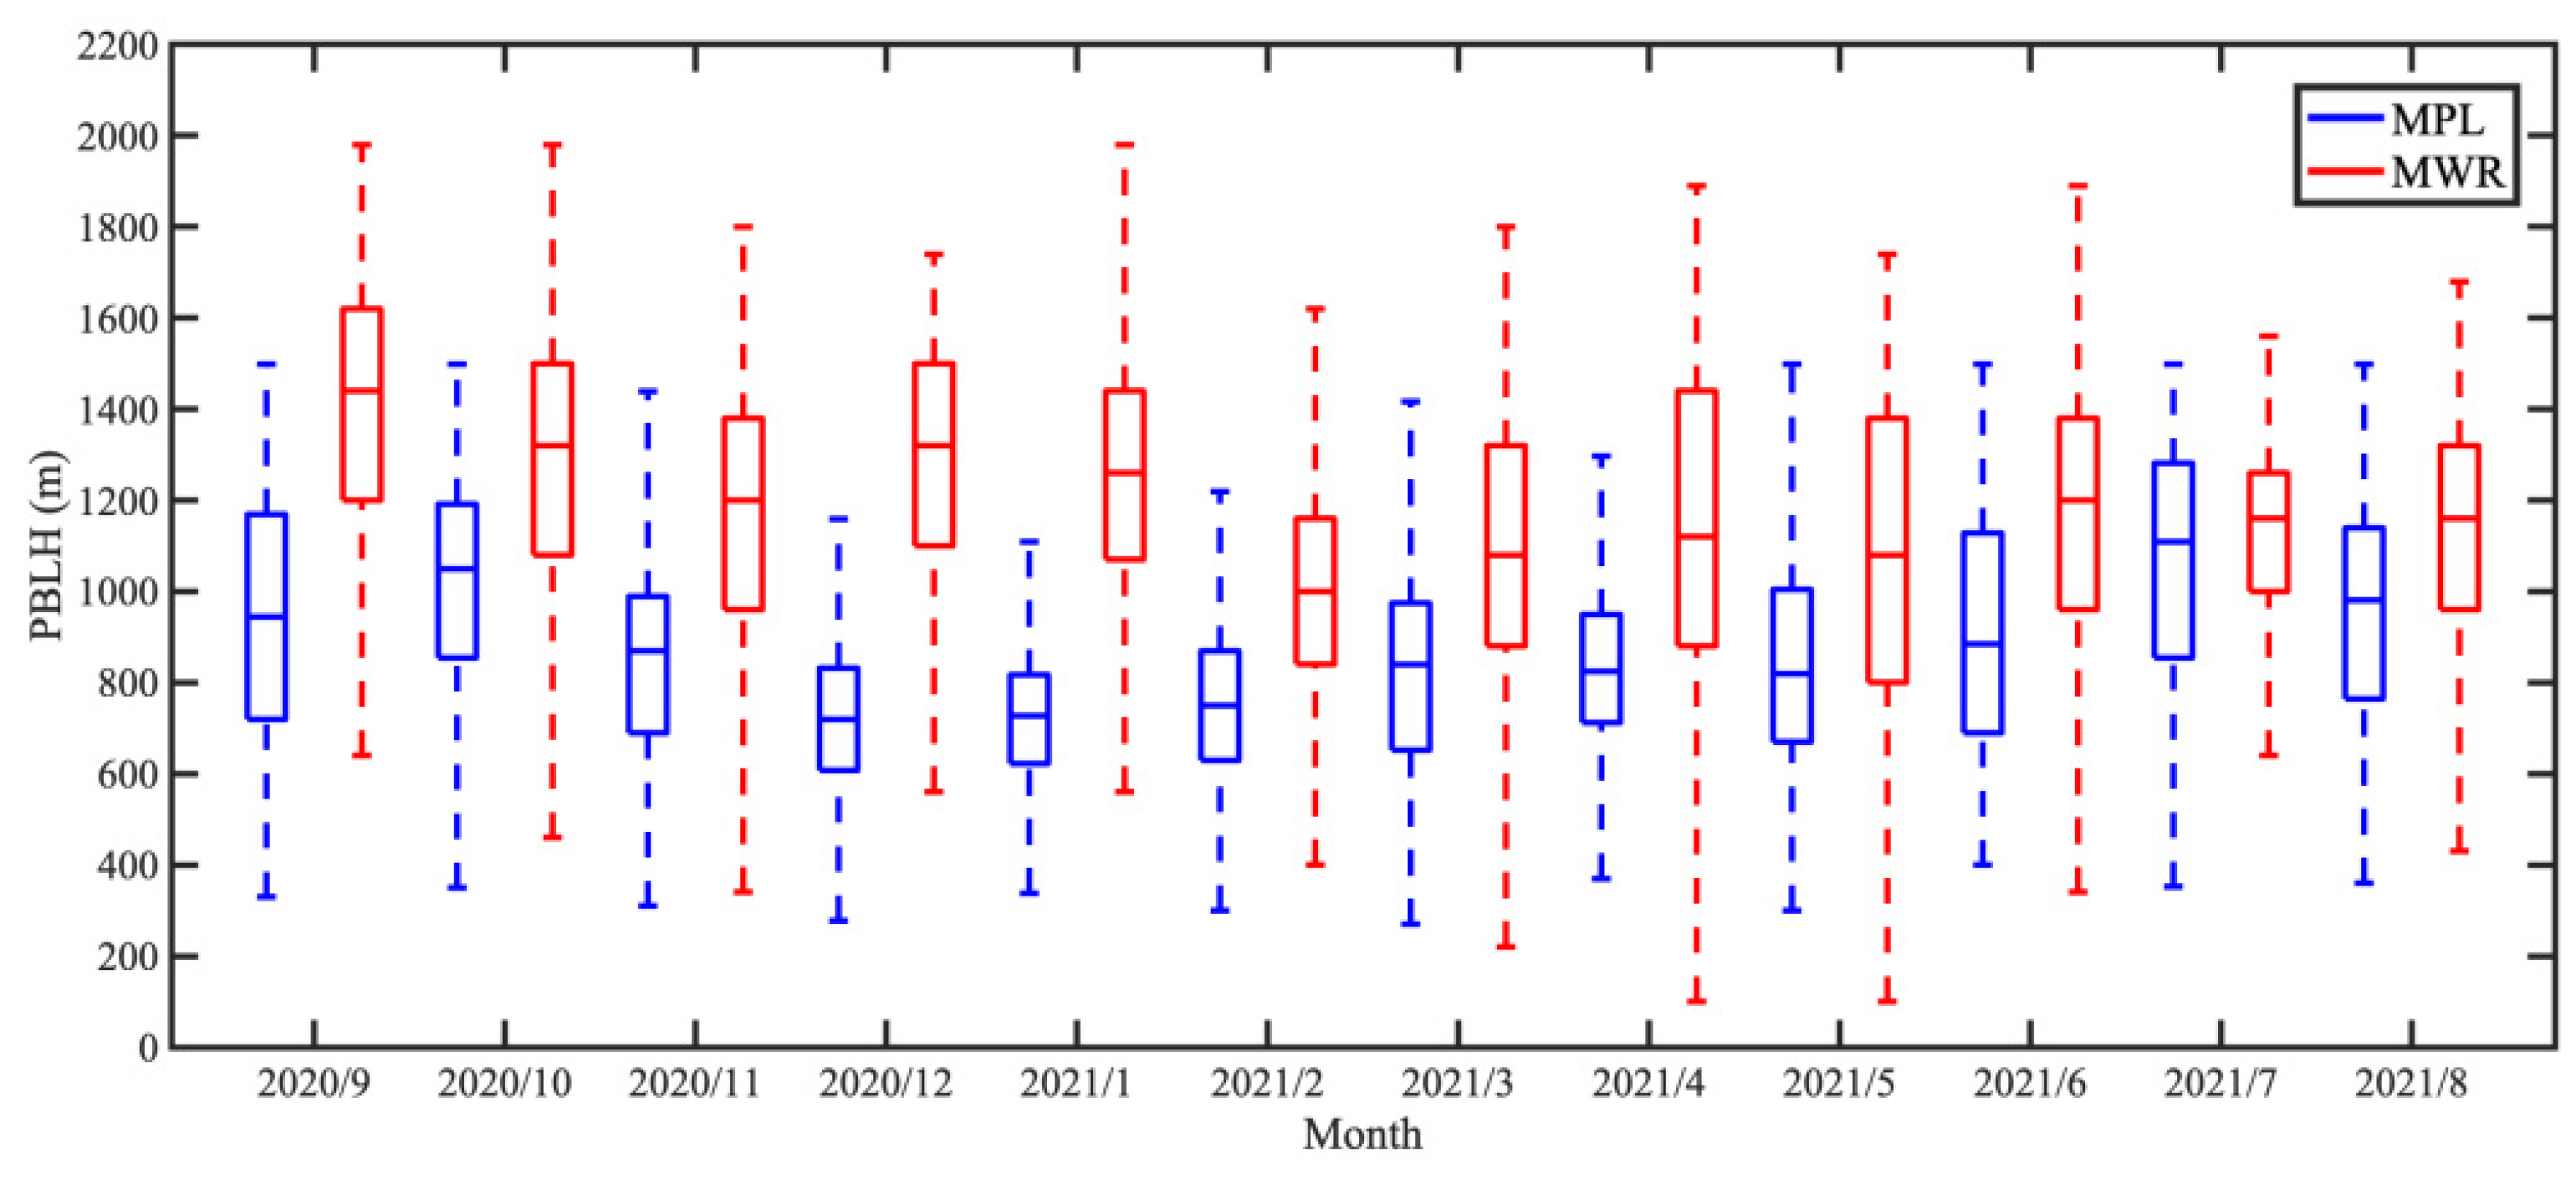
As depicted in Figure 2, during the summer months (June–August), the MPL-derived PBLHs are generally higher than those in other months. By contrast, the seasonal variation in the MWR-derived PBLH appears less pronounced. January, September, and December have relatively high PBLHMWR, which is unexpected given that the winter months, particularly January and December, are typically associated with lower PBLH levels. A case study that is representative for over 90% of samples (illustrated in Figure S2) reveals that the algorithm used to retrieve PBLH by the MWR only considers the effect of convection. Consequently, despite lower ground temperatures in winter, the vertical distribution of potential temperature in winter theoretically supports the convection of ground air parcels to higher altitudes, leading to a bias in MWR retrievals. Additionally, Figure 2 highlights that the monthly variation in MWR-derived PBLH has a broader range than that of MPL-derived PBLH, which is consistent with findings from other studies [20,43]. In particular, the smallest 5% of PBLHMWR values approach zero. This is due to the influence of nocturnal radiation cooling during the early morning and evening hours (local time 8:00 and 18:00), which results in statistically very low thermodynamic PBLHs [46].
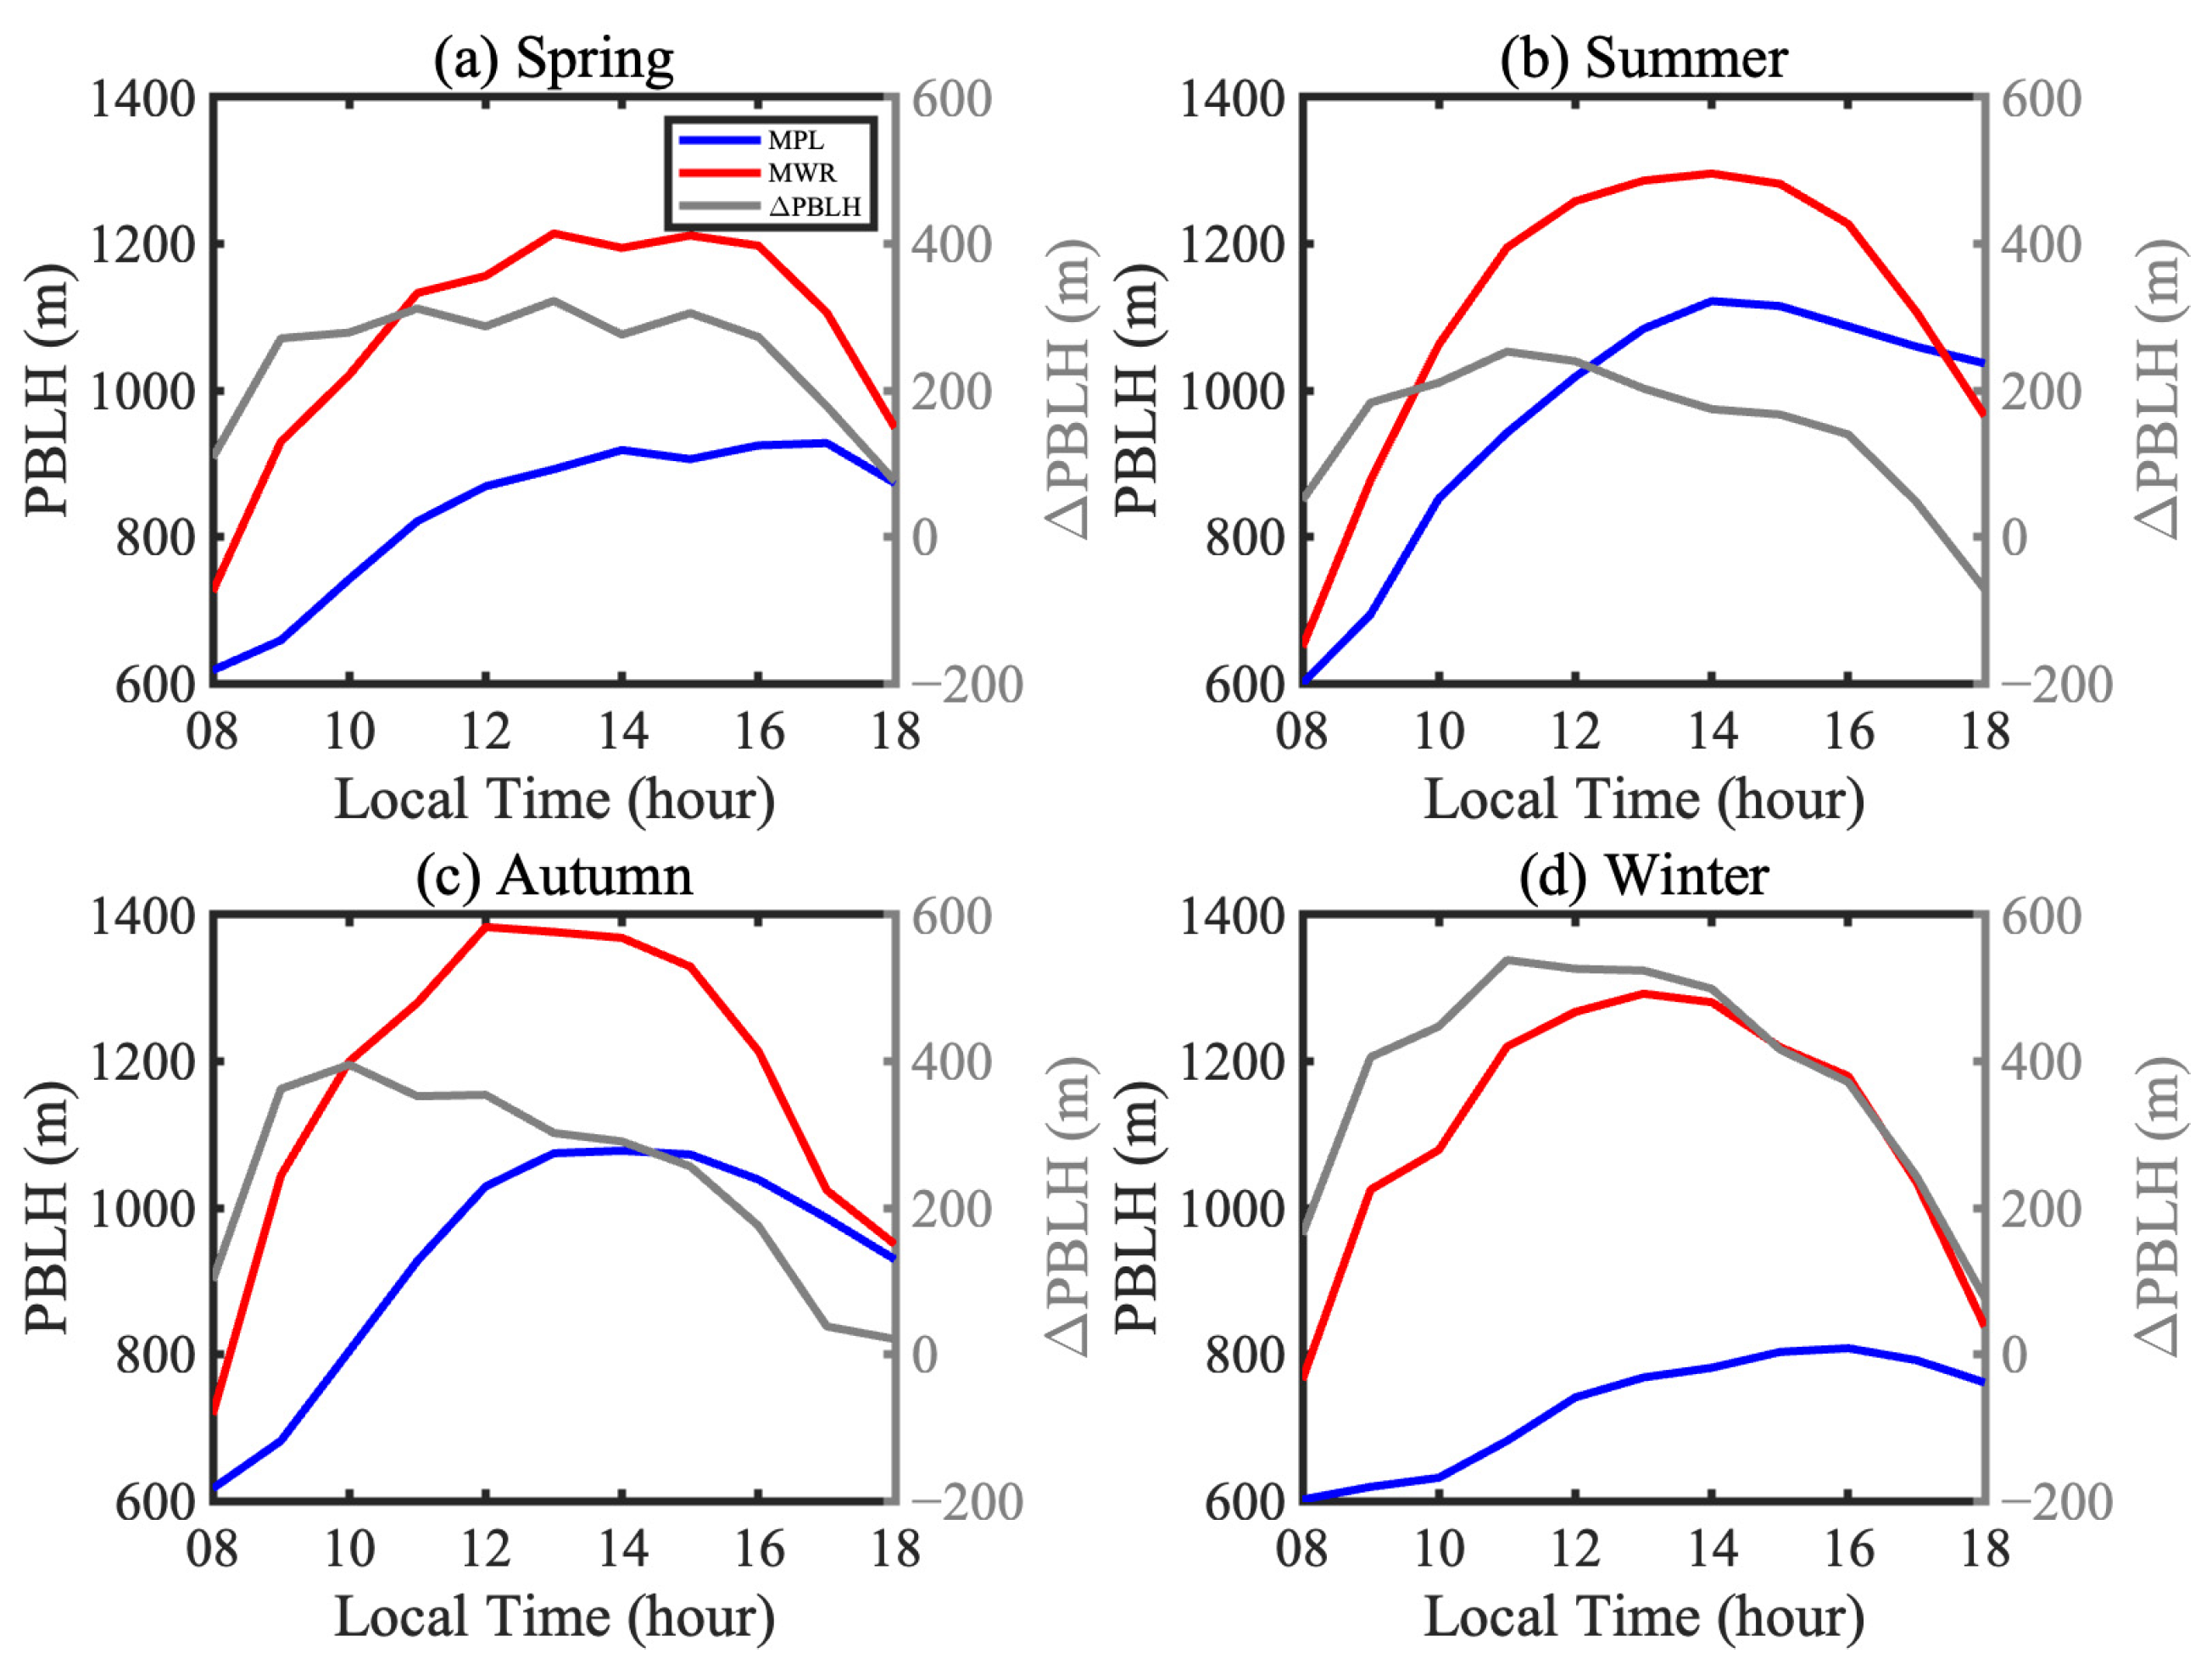
Figure 3 depicts hourly variations in MPL- and MWR-derived PBLHs for different seasons. Generally, the variations in the PBLH of the two instruments have the same trend. Notably, the PBLH difference (ΔPBLH) between the two approaches always increases in the early morning and rapidly decreases in the afternoon. The ΔPBLH exhibits a distinct seasonal pattern, with the smallest observed in summer and the largest occurring in winter. The peak values of ΔPBLH consistently manifest in the morning hours throughout the year, surpassing 200 m, even reaching as high as 500 m during the winter season. This phenomenon is like that reported by Quan et al. [43] in Tianjin, China. Note that, in that study, PBLH measurements in September tended to converge in the afternoon. By contrast, in Nanjing, the MWR-retrieved PBLH becomes lower than that retrieved by the MPL at 17:00 and 18:00 only in summer, likely due to the rapid cooling of the ground as the sun sets. In winter, ΔPBLH can reach up to 500 m, underscoring the substantial disparity in PBLH values retrieved by different methods during this season, which warrants close attention in future research.

3.2. Relationships between the PBLH and PM2.5

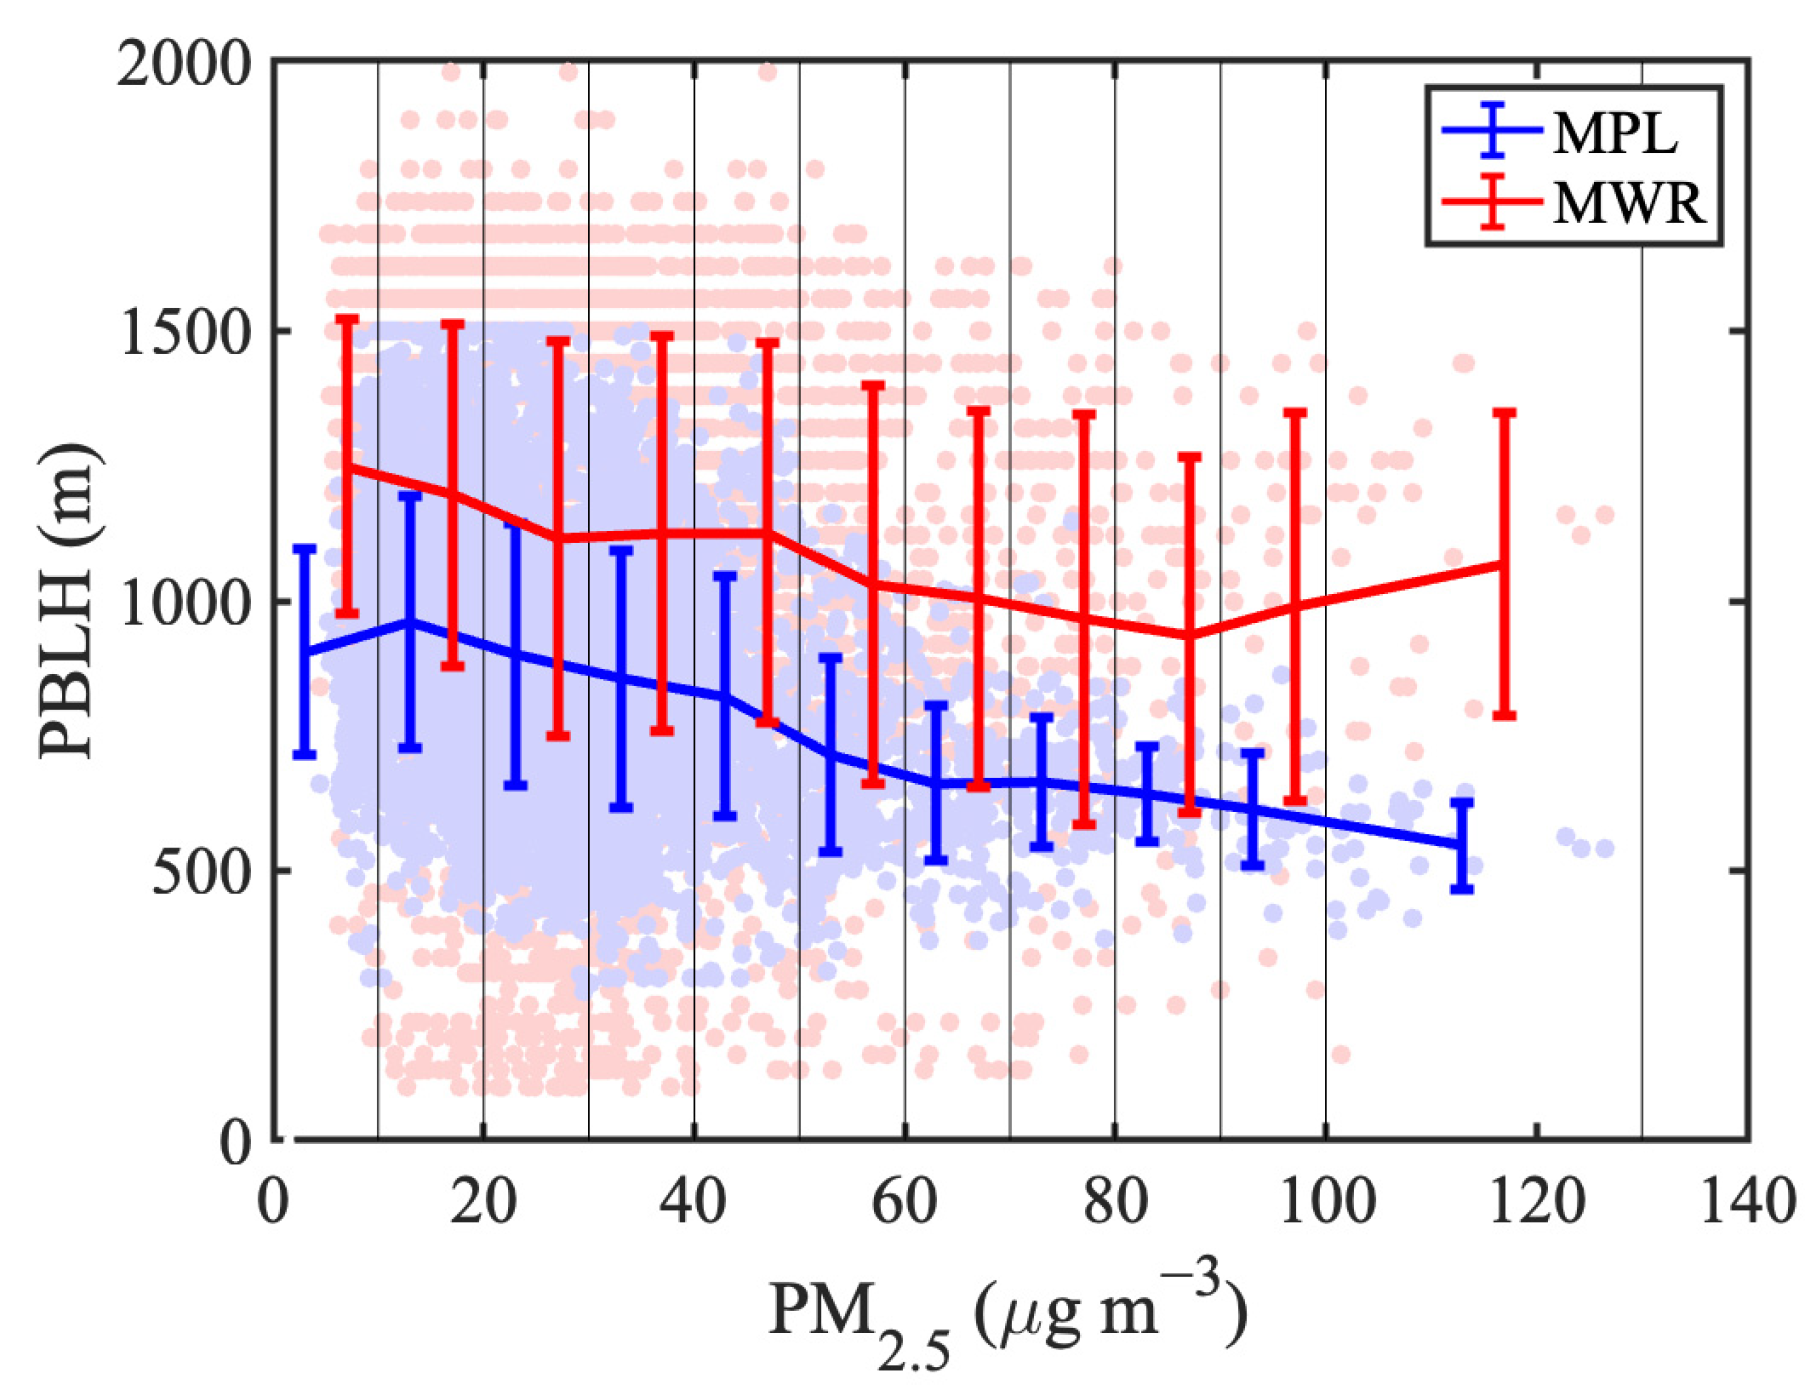
Figure 4 presents the relationships between PM2.5 and the PBLH as measured by both instruments. In general, there is a negative correlation between the PBLH obtained by the MPL and the PM2.5 mass concentration, consistent with findings from other studies conducted in Nanjing [46,47]. When analyzing the correlation between the PBLH and PM2.5, it is crucial to consider the potential influence of the diurnal PBLH cycle on the results. The diurnal cycle can affect the mixing and dispersion of pollutants, thereby impacting PM2.5 concentrations. However, in this study, the influence of the diurnal PBLH cycle on the correlation between PBLH and PM2.5 appears to be weak, as shown in Figure S3. Note that, regardless of the pollution level, MPL-retrieved PBLHs are consistently lower than MWR-retrieved PBLHs. The PBLH difference between the MPL and MWR retrievals is about 200 m, which is the same as shown in Figure 3. Furthermore, the range of PBLH values retrieved by the MWR is larger than that by the MPL. This suggests that the estimation of the PBLH by the MWR is more sensitive to environmental conditions, potentially leading to increased uncertainty in its measurements.
The relationship between the MWR-retrieved PBLH and PM2.5 is complex. At low pollution levels (PM2.5 < 90 μg m−3), the PBLH decreases with the increasing PM2.5. However, at high PM2.5 concentrations (>90 μg m−3), the PBLH increases with the increasing PM2.5. Cases of temperature and potential temperature profiles with high PM2.5 mass concentrations are analyzed (one of them is shown in Figure S4), and no special vertical temperature structure is found. Given that the thermodynamic factors are not the only contributors to vertical motion, the PBLH retrieved by the MWR measurements may not always accurately represent the vertical distribution of aerosols, especially during severe pollution events. It is crucial to also consider other factors, such as advection, turbulence, and weather conditions. These elements can significantly impact aerosol distribution and should be accounted for in such research [43,48]. In contrast, using techniques like an MPL to measure the vertical distribution of aerosols directly may provide a more accurate representation of the PBL’s effect on aerosols.
In conclusion, PBLH measurements obtained by the MPL are more consistent with PM2.5 mass concentration compared to those obtained by the MWR. These MPL-retrieved PBLH data will be further utilized to analyze the impact of the PBLH on PM2.5 chemical components next.

3.3. Impact of the PBLH on PM2.5 Chemical Components

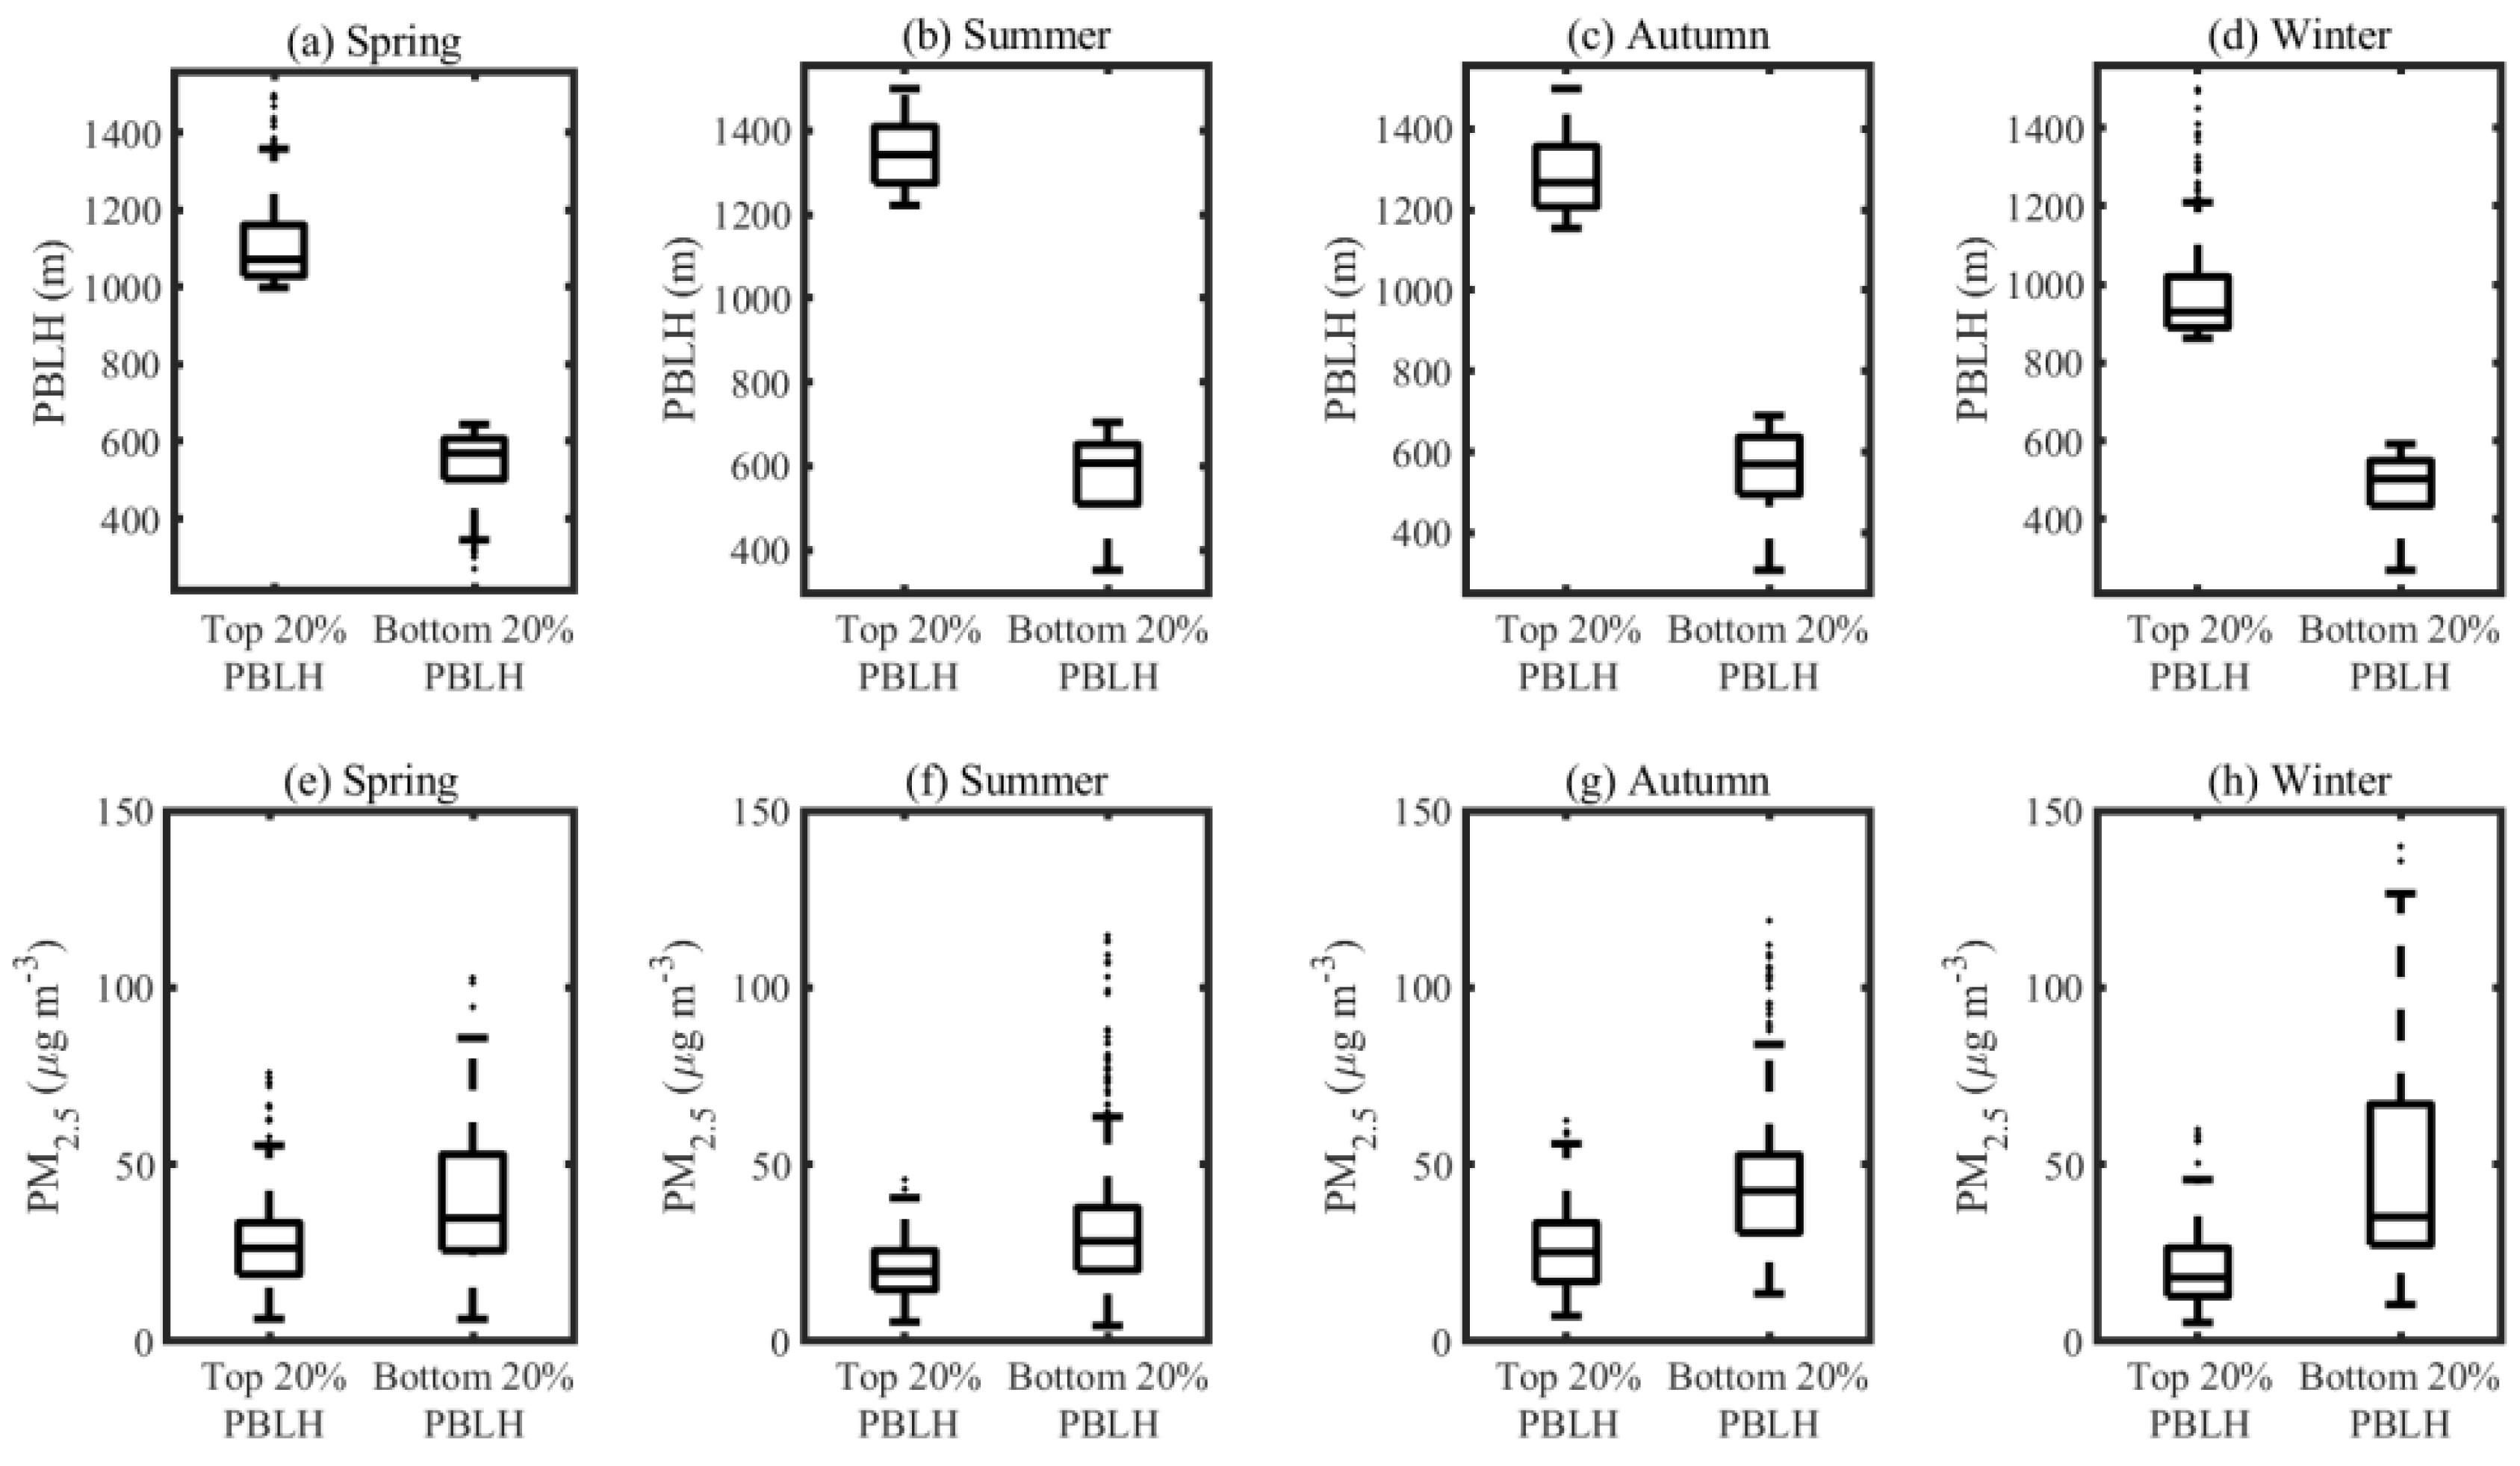
To more effectively illustrate the impact of the PBLH retrieved by the MPL on the PM2.5 mass concentration, PBLHs are first categorized into four groups based on the season. Within each season, PBLH values are ranked from highest to lowest, and the top 20% and bottom 20% samples are selected [48]. Subsequently, the corresponding PBLHs and PM2.5 mass concentrations are compared, as depicted in Figure 5. The PM2.5 mass concentration in the bottom 20% of PBLH values is significantly higher than that in the top 20% of values (passed the t-test, p < 0.05), confirming the substantial impact of the PBLH on PM2.5 mass concentration.
Figure 5 also reveals that, in the bottom 20% groups, the highest levels of PM2.5 mass concentration are recorded during winter, when the PBLH is at its lowest. However, in the case of the top 20% groups, the lowest levels of PM2.5 mass concentration are also observed in winter, even though PBLH levels are not at their highest during that season. This suggests that low PBLH levels lead to severe aerosol pollution in winter, but high PBLH levels are not the primary contributing factor to low aerosol pollution. Other factors, such as turbulent transport, temperature inversion layers, and synoptic factors, may play a more significant role in this context [44,49].
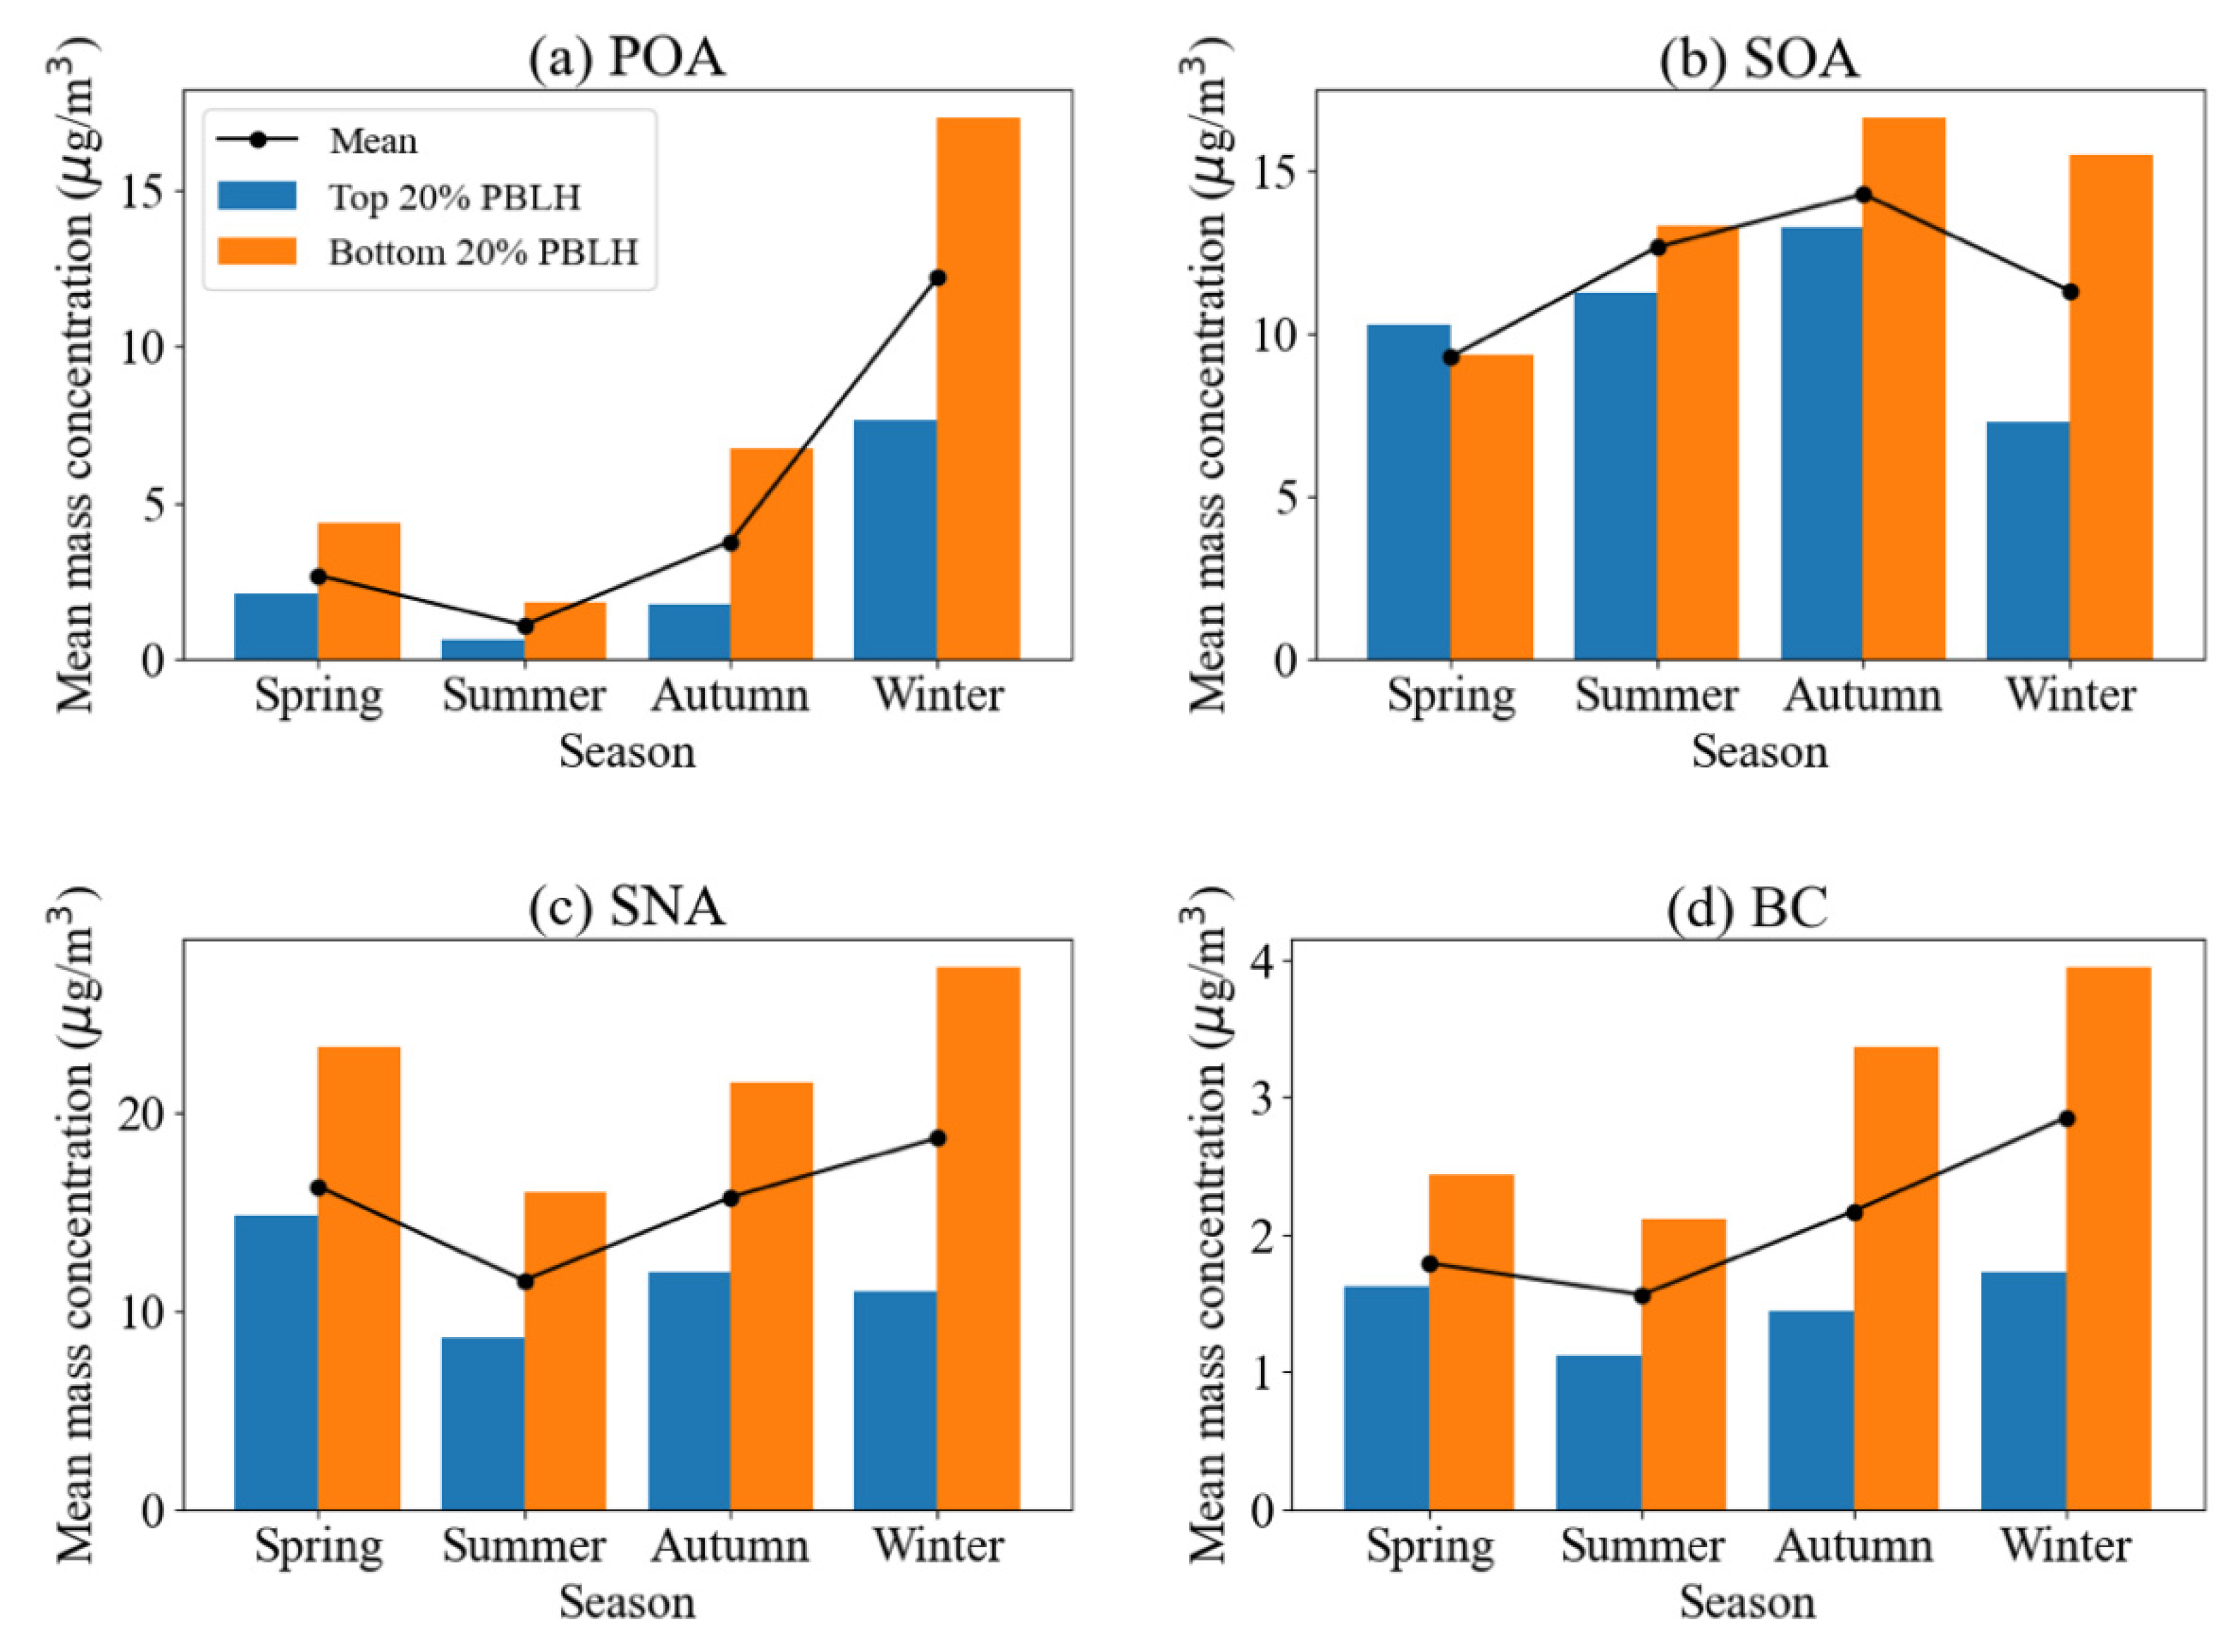
Additionally, in Figure 6, the impact of the PBLH on various PM2.5 chemical components, including black carbon (BC), primary organic aerosol (POA), secondary organic aerosol (SOA), and secondary inorganics like S O 4 2 , N O 3 , and N H 4 + (SNA) in PM2.5, is depicted. The results show that the influences of the PBLH on PM2.5 chemical components are different.
Figure 6a illustrates the difference in POA mass concentrations between the top 20% of PBLH and bottom 20% of PBLH groups. Across all seasons, the mean mass concentration of POA in each season is between the top 20% of PBLH and the bottom 20% of PBLH, and it is much higher in the bottom 20% of PBLH than that in the top 20% of PBLH. This underscores the significant impact of PBLH on POA. Notably, the largest disparity between the two groups is observed during winter, indicating a more substantial influence of the PBLH on POA concentrations during this season.
In spring, the mass concentration of SOA in the top 20% of PBLH surpasses that in the bottom 20% of PBLH (Figure 6b). This occurrence is unique across all seasons and components. This finding suggests that the PBLH may not be the primary influencing factor for the mass concentration of SOA in spring. Instead, it indicates that various other factors are likely influencing SOA during this season.
In winter, when the mean SNA mass concentration is largest in all seasons, the SNA in the top 20% of PBLH is lower than that in spring and autumn (Figure 6c). While both SOA and SNA are secondary pollutants formed through atmospheric reactions, the availability and sources of their precursors differ significantly across seasons.
The formation of SOA depends on the availability of volatile organic compounds (VOCs), which can be either biogenic (from vegetation) or anthropogenic (from industrial activities, vehicle emissions, etc.). During winter, the concentration of POAs, which are direct emissions from combustion sources, is significantly higher. Figure 6a shows that POA levels are elevated in winter, providing more organic material that can undergo oxidation to form SOA. However, the overall formation of SOA is also influenced by photochemical activity, which is lower in winter due to shorter daylight hours and reduced solar intensity [50,51].
SNA does not show the same seasonal variations as SOA. The concentration of SNA is higher in winter compared to summer and autumn. SNA is formed from precursor gases like sulfur dioxide (SO₂), nitrogen oxides (NOₓ), and ammonia (NH₃). In winter, emissions from heating sources, industrial activities, and reduced atmospheric dispersion due to lower PBLH contribute to higher concentrations of these precursor gases [52]. Additionally, lower temperatures and higher relative humidity in winter favor the formation of secondary inorganics [53].
Figure 6d reveals a distinct pattern, where BC stands out with a strong negative correlation to the variation in the PBLH among all the components under investigation, as expected [11]. Interestingly, both the top and bottom 20% groups exhibit the highest average mass concentrations during winter and the lowest during summer. This phenomenon can be explained by the primary nature of BC, which is a pollutant originating directly from primary emissions and typically does not undergo significant chemical reactions in the atmosphere. When emission and horizontal wind transport are relatively constant, variations in the PBLH become a crucial factor in determining BC concentrations.
In summary, when it comes to PM2.5 chemical compounds, the PBLH appears to have a more pronounced impact on primary pollutants (POA and BC) while exerting less influence on secondary pollutants (SOA and SNA). Considering seasonal variations, the influence of the PBLH on PM2.5 is most prominent during winter and relatively subdued in other seasons. This observation may be attributed to the significant influence of various external factors, like temperature, humidity, and photochemical conditions, on secondary pollutants. Notably, during spring, the PBLH’s impact on SOA seems to be less significant. Conversely, during winter, meteorological conditions often hinder the production of secondary pollutants, making the PBLH the primary factor influencing pollution levels.

4. Summary

The planetary boundary layer (PBL) is the layer of Earth’s atmosphere closest to its surface, where human life predominantly occurs. The PBL height (PBLH) serves as a crucial parameter for describing the PBL. Accurately determining the PBLH through different methods can help to enhance our comprehension of the PBL’s influence in various models. In this study, the focus is on retrieving the PBLH using different methods and investigating its relationship with PM2.5 and its chemical components.
(1)
This study compares the long-term PBLH retrieval results between a micro-pulse lidar (MPL) and a microwave radiometer (MWR), encompassing seasonal and daily variations, highlighting notable PBLH differences retrieved by these two instruments. The MPL consistently provides more consistent and reliable PBLH measurements compared to the MWR.
(2)
The relationships between the two different PBLH retrievals and PM2.5 are explored and compared. Surprisingly, the PBLH derived from the MWR does not exhibit the same negative correlation with PM2.5 as observed with the MPL, particularly in cases of severe pollution.
(3)
This research delves into the effects of the PBLH on different PM2.5 chemical components, observing substantial variations depending on the season and the specific component. Notably, the study finds that the PBLH has the most pronounced impact on primary aerosols, with its effect being most prominent during winter. Conversely, the PBLH appears to have a relatively minimal impact on secondary aerosols, especially secondary organic aerosols during spring.
Collectively, these findings underscore the pivotal role played by the PBL in influencing the variations in atmospheric particulate matter mass concentrations. The study not only highlights disparities in PBLH retrievals between two instruments during a long-term observational period but also reveals distinct relationships between the PBLH and aerosols. Moreover, it emphasizes the greater influence of the PBLH on primary pollutants. The innovative examination of how PBLH affects aerosol concentrations of various components in different seasons lays the foundation for further research in this area.

Supplementary Materials

The following supporting information can be downloaded at: https://www.mdpi.com/article/10.3390/rs16183464/s1, Figure S1: (a) Temperature profile provided by MWR on 12 July. The white line represents PBLH calculated by MWR (PBLHMWR). (b) Potential temperature profile calculated by temperature profile provided by MWR on 12 July. The white line represents PBLHMWR; Figure S2: Temperature profile, potential temperature profile, and PBLHMWR at 12:00 on 1 January 2021; Figure S3: Time–frequency distribution of the top 20% and bottom 20% PBLH values in summer; Figure S4: Temperature profile, potential temperature profile, and PBLHMWR at 12:00 on 13 December 2020. The PM2.5 mass concentration at this time is 126.5 micrograms per cubic meter.

Author Contributions

Conceptualization, Z.H. and Y.W.; methodology, Z.H., Y.W. and Y.Y.; software, Z.H.; formal analysis, Z.H. and Y.W.; investigation, Z.H., Y.W. and J.X.; data curation, J.X. and Y.S.; writing—original draft preparation, Z.H.; writing—review and editing, Y.W., C.L., P.Z., X.S., M.L. and Y.Y.; visualization, Z.H.; supervision, Y.W., Z.L. and C.L.; project administration, Y.W. and Z.L. All authors have read and agreed to the published version of the manuscript.

Funding

The authors gratefully acknowledge the financial support provided by the National Natural Science Foundation of China (NSFC) research project (Grant Nos. 42030606 and 42005067) and Provincial Students’ Platform for Innovation and Entrepreneurship Training Program (Grant No. 202410300102Y).

Data Availability Statement

The data presented in this study are available from the corresponding author upon request ([email protected]).

Acknowledgments

The authors thank all participants in the campaign for their tireless work and cooperation.

Conflicts of Interest

The authors declare no conflicts of interest.

References

  1. Guo, J.; Miao, Y.; Zhang, Y.; Liu, H.; Li, Z.; Zhang, W.; He, J.; Lou, M.; Yan, Y.; Bian, L.; et al. The climatology of planetary boundary layer height in China derived fromradiosonde and reanalysis data. Atmos. Chem. Phys. 2016, 16, 13309–13319. [Google Scholar] [CrossRef]
  2. Zhang, T.; Zhang, R.; Zhong, J.; Shen, X.; Wang, Y.; Guo, L. Classification and estimation of unfavourable boundary-layer meteorological conditions in Beijing for PM2.5 concentration changes using vertical meteorological profiles. Atmos. Res. 2023, 293, 106902. [Google Scholar] [CrossRef]
  3. Lin, C.; Chen, W.; Sheng, Y.; Chen, W.; Liu, C. Exploration of the downward transport mechanisms of biomass burning emissions from Indochina at the low boundary layer in East Asia. Atmos. Environ. 2023, 314, 120117. [Google Scholar] [CrossRef]
  4. Zilitinkevich, S.S.; Tyuryakov, S.A.; Troitskaya, Y.I.; Mareev, E.A. Theoretical models of the height of the atmospheric boundary layer and turbulent entrainment at its upper boundary. Izvestiya. Atmos. Ocean. Phys. 2012, 48, 133–142. [Google Scholar] [CrossRef]
  5. Singh, P.; Sarawade, P.; Adhikary, B. Transport of black carbon from planetary boundary layer to free troposphere during the summer monsoon over South Asia. Atmos. Res. 2020, 235, 104761. [Google Scholar] [CrossRef]
  6. Zhu, Z.; Yang, Z.; Yu, L.; Xu, L.; Wu, Y.; Zhang, X.; Shen, P.; Lin, H.; Shui, L.; Tang, M.; et al. Residential greenness, air pollution and incident neurodegenerative disease: A cohort study in China. Sci. Total Environ. 2023, 878, 163173. [Google Scholar] [CrossRef]
  7. Siming, Y.; Lingli, X.; Peng, D.; Zhaohui, Q.; Qianqian, Z.; Tuanjie, Z. The impact of air pollution on corporate environmental information disclosure–Evidence from heavy pollution industries in China. Financ. Res. Lett. 2024, 59, 104793. [Google Scholar] [CrossRef]
  8. Albrecht, B.A. Aerosols, Cloud Microphysics, and Fractional Cloudiness. Science 1989, 245, 1227–1230. [Google Scholar] [CrossRef]
  9. Twomey, S. Pollution and the Planetary Albedo. Atmos. Environ. 2007, 41, 120–125. [Google Scholar] [CrossRef]
  10. Park, S.S.; Jung, Y.; Lee, Y.G. Spectral dependence on the correction factor of erythemal UV for cloud, aerosol, total ozone, and surface properties: A modeling study. Adv. Atmos. Sci. 2016, 33, 865–874. [Google Scholar] [CrossRef]
  11. Li, Z.; Guo, J.; Ding, A.; Liao, H.; Liu, J.; Sun, Y.; Wang, T.; Xue, H.; Zhang, H.; Zhu, B. Aerosol and boundary-layer interactions and impact on air quality. Natl. Sci. Rev. 2017, 4, 810–833. [Google Scholar] [CrossRef]
  12. Ye, C.; Lu, K.; Song, H.; Mu, Y.; Chen, J.; Zhang, Y. A critical review of sulfate aerosol formation mechanisms during winter polluted periods. J. Environ. Sci. 2023, 123, 387–399. [Google Scholar] [CrossRef] [PubMed]
  13. Kwon, D.; Park, J.; Kim, H.; Choi, J.; Kim, S. Estimating the transboundary budget of sulfate aerosols in Northeast Asia with NASA MERRA aerosol reanalysis data. Atmos. Pollut. Res. 2024, 15, 101981. [Google Scholar] [CrossRef]
  14. Wang, T.; Li, S.; Shen, Y.; Deng, J.; Xie, M. Investigations on direct and indirect effect of nitrate on temperature and precipitation in China using a regional climate chemistry modeling system. J. Geophys. Res. Atmos. 2010, 115, D00K19. [Google Scholar] [CrossRef]
  15. Singh, M.K.; Natesan, S. Richardson extrapolation technique for singularly perturbed system of parabolic partial differential equations with exponential boundary layers. Appl. Math. Comput. 2018, 333, 254–275. [Google Scholar] [CrossRef]
  16. Kim, T. Experimental investigation of particle dynamics in particle-laden turbulent boundary layer. Int. J. Mech. Sci. 2023, 263, 108757. [Google Scholar] [CrossRef]
  17. Mahrt, L.; Heald, R.C.; Lenschow, D.H.; Stankov, B.B.; Troen, I.B. An observational study of the structure of the nocturnal boundary layer. Bound. -Layer Meteor. 1979, 17, 247–264. [Google Scholar] [CrossRef]
  18. Zhang, H.; Zhang, X.; Li, Q.; Cai, X.; Fan, S.; Song, Y.; Hu, F.; Che, H.; Quan, J.; Kang, L.; et al. Research Progress on Estimation of the Atmospheric Boundary Layer Height. J. Meteorol. Res. 2020, 34, 482–498. [Google Scholar] [CrossRef]
  19. Zhao, D.; Xin, J.; Gong, C.; Quan, J.; Liu, G.; Zhao, W.; Wang, Y.; Liu, Z.; Song, T. The formation mechanism of air pollution episodes in Beijing city: Insights into the measured feedback between aerosol radiative forcing and the atmospheric boundary layer stability. Sci. Total Environ. 2019, 692, 371–381. [Google Scholar] [CrossRef]
  20. Ratnam, M.V.; Santhi, Y.D.; Rajeevan, M.; Rao, S.V.B. Diurnal variability of stability indices observed using radiosonde observations over a tropical station: Comparison with microwave radiometer measurements. Atmos. Res. 2013, 124, 21–33. [Google Scholar] [CrossRef]
  21. Temimi, M.; Fonseca, R.M.; Nelli, N.R.; Valappil, V.K.; Weston, M.J.; Thota, M.S.; Wehbe, Y.; Yousef, L. On the analysis of ground-based microwave radiometer data during fog conditions. Atmos. Res. 2020, 231, 104652. [Google Scholar] [CrossRef]
  22. Jiang, Y.; Xin, J.; Zhao, D.; Jia, D.; Tang, G.; Quan, J.; Wang, M.; Dai, L. Analysis of differences between thermodynamic and material boundary layer structure: Comparison of detection by ceilometer and microwave radiometer. Atmos. Res. 2021, 248, 105179. [Google Scholar] [CrossRef]
  23. Moreira, G.D.A.; Oliveira, A.P.D.; Sánchez, M.P.; Codato, G.; Lopes, F.J.D.S.; Landulfo, E.; Filho, E.P.M. Performance assessment of aerosol-lidar remote sensing skills to retrieve the time evolution of the urban boundary layer height in the Metropolitan Region of São Paulo City, Brazil. Atmos. Res. 2022, 277, 106290. [Google Scholar] [CrossRef]
  24. Cruz, M.T.; Simpas, J.B.; Sorooshian, A.; Betito, G.; Cambaliza, M.O.L.; Collado, J.T.; Eloranta, E.W.; Holz, R.; Topacio, X.G.V.; Del Socorro, J.; et al. Impacts of regional wind circulations on aerosol pollution and planetary boundary layer structure in Metro Manila, Philippines. Atmos. Environ. 2023, 293, 119455. [Google Scholar] [CrossRef]
  25. Li, S.; Li, X.; Deng, Z.; Xia, X.; Ren, G.; An, D.; Ayikan, M.; Zhong, Y. Characteristics of atmospheric boundary layer and its relation with PM2.5 during winter in Shihezi, an Oasis city in Northwest China. Atmos. Pollut. Res. 2023, 14, 101902. [Google Scholar] [CrossRef]
  26. Lu, S.; Li, X.; Zhao, T.; Ma, Y.; Wang, Y.; Zhang, Y.; Luo, Y.; Xin, Y. Impact of thermal structure of planetary boundary layer on aerosol pollution over urban regions in Northeast China. Atmos. Pollut. Res. 2023, 14, 101665. [Google Scholar] [CrossRef]
  27. Lee, K.H.; Li, Z.; Wong, M.S.; Xin, J.; Wang, Y.; Hao, W.M.; Zhao, F. Aerosol single scattering albedo estimated across China from a combination of ground and satellite measurements. J. Geophys. Res. Atmos. 2007, 112, D22. [Google Scholar] [CrossRef]
  28. Dai, L.; Zhang, L.; Chen, D.; Zhao, Y. Assessment of carbonaceous aerosols in suburban Nanjing under air pollution control measures: Insights from long-term measurements. Environ. Res. 2022, 212, 113302. [Google Scholar] [CrossRef]
  29. Song, X.; Wang, Y.; Huang, X.; Wang, Y.; Li, Z.; Zhu, B.; Ren, R.; An, J.; Yan, J.; Zhang, R.; et al. The Impacts of Dust Storms with Different Transport Pathways on Aerosol Chemical Compositions and Optical Hygroscopicity of Fine Particles in the Yangtze River Delta. J. Geophys. Res. Atmos. 2023, 128, e2023JD039679. [Google Scholar] [CrossRef]
  30. Xu, W.; Croteau, P.; Williams, L.; Canagaratna, M.; Onasch, T.; Cross, E.; Zhang, X.; Robinson, W.; Worsnop, D.; Jayne, J. Laboratory characterization of an aerosol chemical speciation monitor with PM2.5 measurement capability. Aerosol Sci. Technol. 2017, 51, 69–83. [Google Scholar] [CrossRef]
  31. Wang, Y.; Li, Z.; Wang, Q.; Jin, X.; Yan, P.; Cribb, M.; Li, Y.; Yuan, C.; Wu, H.; Wu, T.; et al. Enhancement of secondary aerosol formation by reduced anthropogenic emissions during Spring Festival 2019 and enlightenment for regional PM2.5 control in Beijing. Atmos. Chem. Phys. 2021, 21, 915–926. [Google Scholar] [CrossRef]
  32. Sun, P.; Farley, R.N.; Li, L.; Srivastava, D.; Niedek, C.R.; Li, J.; Wang, N.; Cappa, C.D.; Pusede, S.E.; Yu, Z.; et al. PM2.5 composition and sources in the San Joaquin Valley of California: A long-term study using ToF-ACSM with the capture vaporizer. Environ. Pollut. 2022, 292, 118254. [Google Scholar] [CrossRef] [PubMed]
  33. Atabakhsh, S.; Poulain, L.; Chen, G.; Canonaco, F.; Prévôt, A.S.H.; Pöhlker, M.; Wiedensohler, A.; Herrmann, H. A 1-year aerosol chemical speciation monitor (ACSM) source analysis of organic aerosol particle contributions from anthropogenic sources after long-range transport at the TROPOS research station Melpitz. Atmos. Chem. Phys. 2023, 23, 6963–6988. [Google Scholar] [CrossRef]
  34. Zhang, Y.; Du, W.; Wang, Y.; Wang, Q.; Wang, H.; Zheng, H.; Zhang, F.; Shi, H.; Bian, Y.; Han, Y.; et al. Aerosol chemistry and particle growth events at an urban downwind site in North China Plain. Atmos. Chem. Phys. 2018, 18, 14637–14651. [Google Scholar] [CrossRef]
  35. Flamant, C.; Pelon, J.; Flamant, P.H.; Durand, P. Lidar determination of the entrainment zone thickness at the top of the unstable marine atmospheric boundary layer. Bound. Layer Meteor. 1997, 83, 247–284. [Google Scholar] [CrossRef]
  36. Hennemuth, B.; Lammert, A. Determination of the Atmospheric Boundary Layer Height from Radiosonde and Lidar Backscatter. Bound. Layer Meteorol. 2006, 120, 181–200. [Google Scholar] [CrossRef]
  37. Li, H.; Yang, Y.; Hu, X.M.; Huang, Z.; Wang, G.; Zhang, B.; Zhang, T. Evaluation of retrieval methods of daytime convective boundary layer height based on lidar data. J. Geophys. Res. Atmos. 2017, 122, 4578–4593. [Google Scholar] [CrossRef]
  38. Davis, K.J.; Gamage, N.; Hagelberg, C.R.; Kiemle, C.; Lenschow, D.H.; Sullivan, P.P. An Objective Method for Deriving Atmospheric Structure from Airborne Lidar Observations. J. Atmos. Ocean Technol. 2000, 17, 1455–1468. [Google Scholar] [CrossRef]
  39. Holzworth, C.G. Estimates of mean maximum mixing depths in the contiguous United States. Mon. Weather Rev. 1964, 92, 235–242. [Google Scholar] [CrossRef]
  40. Collaud Coen, M.; Praz, C.; Haefele, A.; Ruffieux, D.; Kaufmann, P.; Calpini, B. Determination and climatology of the planetary boundary layer height above the Swiss plateau by in situ and remote sensing measurements as well as by the COSMO-2 model. Atmos. Chem. Phys. 2014, 14, 13205–13221. [Google Scholar] [CrossRef]
  41. de Arruda Moreira, G.; Guerrero-Rascado, J.L.; Bravo-Aranda, J.A.; Benavent-Oltra, J.A.; Ortiz-Amezcua, P.; Róman, R.; Bedoya-Velásquez, A.E.; Landulfo, E.; Alados-Arboledas, L. Study of the planetary boundary layer by microwave radiometer, elastic lidar and Doppler lidar estimations in Southern Iberian Peninsula. Atmos. Res. 2018, 213, 185–195. [Google Scholar] [CrossRef]
  42. Wang, F.; Yang, T.; Wang, Z.; Chen, X.; Wang, H.; Guo, J. A comprehensive evaluation of planetary boundary layer height retrieval techniques using lidar data under different pollution scenarios. Atmos. Res. 2021, 253, 105483. [Google Scholar] [CrossRef]
  43. Quan, J.; Gao, Y.; Zhang, Q.; Tie, X.; Cao, J.; Han, S.; Meng, J.; Chen, P.; Zhao, D. Evolution of planetary boundary layer under different weather conditions, and its impact on aerosol concentrations. Particuology 2013, 11, 34–40. [Google Scholar] [CrossRef]
  44. Yang, Y.; Ni, C.; Jiang, M.; Chen, Q. Effects of aerosols on the atmospheric boundary layer temperature inversion over the Sichuan Basin, China. Atmos. Environ. 2021, 262, 118647. [Google Scholar] [CrossRef]
  45. Liu, B.; Ma, X.; Ma, Y.; Li, H.; Jin, S.; Fan, R.; Gong, W. The relationship between atmospheric boundary layer and temperature inversion layer and their aerosol capture capabilities. Atmos. Res. 2022, 271, 106121. [Google Scholar] [CrossRef]
  46. Qu, Y.; Han, Y.; Wu, Y.; Gao, P.; Wang, T. Study of PBLH and Its Correlation with Particulate Matter from One-Year Observation over Nanjing, Southeast China. Remote Sens. 2017, 9, 668. [Google Scholar] [CrossRef]
  47. Huang, X.; Wang, Y.; Shang, Y.; Song, X.; Zhang, R.; Wang, Y.; Li, Z.; Yang, Y. Contrasting the effect of aerosol properties on the planetary boundary layer height in Beijing and Nanjing. Atmos. Environ. 2023, 308, 119861. [Google Scholar] [CrossRef]
  48. Miao, Y.; Liu, S.; Guo, J.; Huang, S.; Yan, Y.; Lou, M. Unraveling the relationships between boundary layer height and PM2.5 pollution in China based on four-year radiosonde measurements. Environ. Pollut. 2018, 243, 1186–1195. [Google Scholar] [CrossRef]
  49. Blay-Carreras, E.; Pino, D.; Vilà-Guerau De Arellano, J.; van de Boer, A.; De Coster, O.; Darbieu, C.; Hartogensis, O.; Lohou, F.; Lothon, M.; Pietersen, H. Role of the residual layer and large-scale subsidence on the development and evolution of the convective boundary layer. Atmos. Chem. Phys. 2014, 14, 4515–4530. [Google Scholar] [CrossRef]
  50. Wang, Y.; Li, Z.; Zhang, Y.; Du, W.; Zhang, F.; Tan, H.; Xu, H.; Fan, T.; Jin, X.; Fan, X.; et al. Characterization of aerosol hygroscopicity, mixing state, and CCN activity at a suburban site in the central North China Plain. Atmos. Chem. Phys. 2018, 18, 11739–11752. [Google Scholar] [CrossRef]
  51. Wang, Y.; Wang, J.; Li, Z.; Jin, X.; Sun, Y.; Cribb, M.; Ren, R.; Lv, M.; Wang, Q.; Gao, Y.; et al. Contrasting aerosol growth potential in the northern and central-southern regions of the North China Plain: Implications for combating regional pollution. Atmos. Environ. 2021, 267, 118723. [Google Scholar] [CrossRef]
  52. Ma, S.; Shao, M.; Zhang, Y.; Dai, Q.; Xie, M. Sensitivity of PM2.5 and O3 pollution episodes to meteorological factors over the North China Plain. Sci. Total Environ. 2021, 792, 148474. [Google Scholar] [CrossRef] [PubMed]
  53. Cheng, Y.; Yu, Q.; Liu, J.; Du, Z.; Liang, L.; Geng, G.; Ma, W.; Qi, H.; Zhang, Q.; He, K. Secondary inorganic aerosol during heating season in a megacity in Northeast China: Evidence for heterogeneous chemistry in severe cold climate region. Chemosphere 2020, 261, 127769. [Google Scholar] [CrossRef] [PubMed]
Figure 1. (a) Vertical backscattering coefficient (VBC) gradient profile from 8:00 to 18:00 local time on 12 July 2021, along with the PBLH retrieved by Min GRD method. (b) WCT function profile from 8:00 to 18:00 local time on 12 July 2021, along with the PBLH retrieved by WCT method. (c) VBC profile from 8:00 to 18:00 local time on 12 July 2021 and PBLHs retrieved by two MPL methods (Min GRD and WCT) and the MWR method.
Remotesensing 16 03464 g001
Figure 2. Box plots showing the average PBLH in different months retrieved by the MPL and the MWR from September 2020 to August 2021. The boxes show the lower, median, and upper quartiles. The whiskers show the lowest and highest 5th percentiles.
Remotesensing 16 03464 g002
Figure 3. Hourly variations in MPL- and MWR-retrieved PBLHs during daytime for different seasons. The red lines represent MWR-retrieved PBLHs, the blue lines represent MPL-retrieved PBLHs, and the gray lines show the PBLH difference (ΔPBLH) between MWR and MPL retrievals.
Remotesensing 16 03464 g003
Figure 4. Light blue dots represent MPL-retrieved PBLHs and their corresponding PM2.5 mass concentrations, and light red dots represent MWR-retrieved PBLHs and their corresponding PM2.5 mass concentrations. The PM2.5 mass concentrations are categorized with a 10 μg m−3 difference between bins, except for the 100 to 130 μg m−3 bin. Mean PBLHs in each bin are then calculated. Error bars show the standard deviations in each bin.
Remotesensing 16 03464 g004
Figure 5. Box plots showing (ad) the MPL-retrieved PBLH and (eh) the PM2.5 mass concentrations corresponding to the top 20% and bottom 20% of MPL-retrieved PBLH values for different seasons. The boxes show the lower, median, and upper quartiles. The whiskers show the lowest and highest 5th percentiles. Outliers are represented by dots.
Remotesensing 16 03464 g005
Figure 6. Histograms showing the mean mass concentrations of (a) POA, (b) SOA, (c) SNA, and (d) BC corresponding to the top and bottom 20% of MPL-retrieved PBLH values for different seasons. The black dotted lines represent mean mass concentrations of different PM2.5 chemical components for different seasons.
Remotesensing 16 03464 g006
Disclaimer/Publisher’s Note: The statements, opinions and data contained in all publications are solely those of the individual author(s) and contributor(s) and not of MDPI and/or the editor(s). MDPI and/or the editor(s) disclaim responsibility for any injury to people or property resulting from any ideas, methods, instructions or products referred to in the content.