Abstract
Populus euphratica is a unique constructive tree species within riparian desert areas that is essential for maintaining oasis ecosystem stability. The Tarim River Basin contains the most densely distributed population of P. euphratica forests in the world, and obtaining accurate distribution data in the mainstream of the Tarim River would provide important support for its protection and restoration. We propose a new method for automatically extracting P. euphratica using Sentinel-1 and 2 and Landsat-8 images based on the Google Earth Engine cloud platform and the random forest algorithm. A mask of the potential distribution area of P. euphratica was created based on prior knowledge to save computational resources. The NDVI (Normalized Difference Vegetation Index) time series was then reconstructed using the preferred filtering method to obtain phenological parameter features, and the random forest model was input by combining the phenological parameter, spectral index, textural, and backscattering features. An active learning method was employed to optimize the model and obtain the best model for extracting P. euphratica. Finally, the map of natural P. euphratica forests with a resolution of 10 m in the mainstream of the Tarim River was obtained. The overall accuracy, producer’s accuracy, user’s accuracy, kappa coefficient, and F1-score of the map were 0.96, 0.98, 0.95, 0.93, and 0.96, respectively. The comparison experiments showed that simultaneously adding backscattering and textural features improved the P. euphratica extraction accuracy, while textural features alone resulted in a poor extraction effect. The method developed in this study fully considered the prior and posteriori information and determined the feature set suitable for the P. euphratica identification task, which can be used to quickly obtain accurate large-area distribution data of P. euphratica. The method can also provide a reference for identifying other typical desert vegetation.
1. Introduction
Populus euphratica is classified as a tertiary relict plant and is a unique constructive tree species exclusive to desert ecosystems [1,2]. It is the only tree species that can naturally form forests in desert areas [3], and it has an exceptional ability to withstand drought and is salt-tolerant. P. euphratica is listed as a second-class endangered species in China and has been identified as the most urgently protected forest genetic resource by the FAO [4]. Approximately 60% of all P. euphratica found worldwide grow in China, and approximately 90% of China’s P. euphratica are distributed in the Tarim River Basin in Xinjiang, which also has the densest distribution of P. euphratica in the world [5,6,7,8]. P. euphratica is of paramount importance to maintaining the stability of oasis ecosystems and is hailed as a natural barrier for the protection of oases [9]. Possessing remarkable resilience, P. euphratica offers a range of ecological services, including water conservation, windbreaks and sand fixation, soil and water retention, and microclimate regulation [10,11]. It plays irreplaceable roles in sustaining material and energy balances, inhibiting soil salinization, preventing and mitigating the expansion of deserts, curbing desertification processes, and ameliorating desert ecosystems [6,10,11]. The sustainable management of P. euphratica is therefore intrinsically related to regional ecological security.
Mapping the spatial distribution of P. euphratica is important to effectively protect natural P. euphratica forests, and accurate positioning information is required [12,13,14]. Vegetation maps are professional maps expressing vegetation types and their spatial distribution, and these can provide important references for scientific research and the sustainable management of plants [15]. However, P. euphratica are distributed within a poor environment that is not easily accessible. The species has a scattered spatial distribution with a high proportion of sparse forest areas with patches that often occupy a large spatial range. There are few pure P. euphratica forests, and it mostly exists with typical desert shrubs (such as Tamarix) to form mixed forests. In areas lacking surface water for many years, P. euphratica seedlings die quickly, and the succession from P. euphratica to Tamarix shrubs occurs. Using the sample survey method is not effective for determining the distribution boundaries [4,16]. Accurate mapping research is a prerequisite for restoring and tending declining P. euphratica forests, and the construction of spatial distribution datasets can directly provide data support for the dynamic and sustainable management of P. euphratica.
High-frequency and rapid mapping based on medium-resolution remote sensing images can provide adequate plant distribution information to enable P. euphratica conservation. The use of medium-resolution multispectral satellite images is beneficial for implementing large-area health management and monitoring of P. euphratica and for instigating scientific restoration programs. At present, commercial high-resolution satellite images are the mainstream data used to produce fine mapping of small-area tree species. High-resolution remote sensing images provide rich spatial and textural information, which is conducive to improving classification accuracy, and it is relatively easy to obtain a high tree species classification effect. Many tree species have been mapped based on high-resolution commercial satellites such as WorldView and QuickBird [17,18,19]. However, there are limitations associated with obtaining high-resolution images, such as the cost and limited coverage, which limit their practicability for large-area tree species mapping [12,20]. Few studies have used high-resolution images for mapping P. euphratica. In contrast, medium-resolution satellite images, such as Landsat and Sentinel, have wide coverage and a high update frequency [21,22], which also makes them the main data combined with machine learning methods for large-area and rapid distribution mapping of P. euphratica [4,8,23].
The spectral characteristics of vegetation such as P. euphratica, Tamarix, and artificial forests are highly similar, and there is a phenomenon of different spectra for the same object or the same spectrum for different objects, which is the main issue that limits the recognition accuracy of P. euphratica [4,23]. The fusion of multiple features is an effective way to improve the accuracy of P. euphratica mapping. Vegetation phenology reflects the cyclical pattern of vegetation growth and development [24,25], and certain spectrally similar vegetation can therefore be distinguishable due to their different growth rhythms [26]. Surface phenological information can be extracted from vegetation indices time series [27]. Extracting vegetation and phenological information can improve extraction accuracy, as confirmed in many studies [4,28,29,30,31]. For example, Peng et al. [23] found that using phenological information effectively improves the extraction accuracy of P. euphratica and reduces misclassification between P. euphratica and Tamarix, farmland, urban trees, and wetland vegetation compared to not using phenological information. Vegetation spectral indices based on medium-resolution, rich wavelength bands can enhance vegetation signals. Many vegetation indices have been used as input features to identify different vegetation species such as coniferous forests and P. euphratica [4,8,23,32,33,34,35], and they can highlight the spectral characteristics of P. euphratica and enhance its recognition effect. Li et al. [4] used Sentinel-2 image at the end of April to calculate the IRECI (Inverted Red-Edge Chlorophyll Index) and perform maximum entropy threshold segmentation, which realized the rapid extraction of P. euphratica from Daliyabuyi Oasis. In addition, textural features can highlight the spatial distribution pattern of vegetation and can be used to identify tree species [36]. Generally, textural information is extracted by calculating the ASM (angular second-order moment), CON (contrast), and CORR (correlation) using GLCM (Gray-Level Co-occurrence Matrix) [37]. It counts the grayscale correlation between adjacent pixels in the sliding window and can reflect information such as image grayscale direction, interval, and change amplitude [37], so it can be employed to highlight the spatial distribution characteristics of P. euphratica. Finally, SAR images effectively reflect the backscattering characteristics of different ground objects (owing to their all-day and all-weather imaging characteristics) and are useful for crop and forest identification and land cover classification [38,39,40,41]. The resolution of Sentinel-1 SAR GRD data is consistent with that of Sentinel-2, and both data could be combined to highlight the spectral characteristics of P. euphratica and reflect its backscattering characteristics, with the aim of achieving efficient extraction.
Google Earth Engine (GEE) is a powerful tool used in vegetation mapping [42,43]. It provides users with multi-source, massive remote sensing products and efficient computing power free of charge; thus, geoscience researchers can avoid high-intensity data downloads and preprocessing when conducting large region research, and the data enable the construction and processing of time-series data [42]. The GEE platform can be used to rapidly detect and identify a wide range of plant categories [31,44], and the applications of GEE in the fields of land cover dynamic monitoring and vegetation dynamic change research are becoming increasingly mature.
In this paper, we aimed to explore a novel machine learning method suitable for extracting natural P. euphratica forests in the mainstream of the Tarim River based on multi-source remote sensing data from the Google Earth Engine cloud platform, including the preparation of training sample datasets, the selection of appropriate methods to extract vegetation phenology parameters, the determination of a feature set suitable for extracting P. euphratica, and the drawing of an accurate distribution map of natural P. euphratica forests in the mainstream of the Tarim River, with the hope of eventually obtaining large-area P. euphratica distribution data in arid areas. The proposed method fully considered prior and posteriori information in the training process and can facilitate the large-area and accurate mapping of P. euphratica.
2. Study Area and Datasets
2.1. Study Area
The study area is located in the mainstream of the Tarim River in Xinjiang, China, spanning 80.75°–88.58°E and 38.99°–41.53°N at an altitude of 850 m to 1050 m, spanning a total area of 36,336 km2. The region is located in a temperate continental climate zone with low annual precipitation and high evaporation rates. The Tarim River is the longest inland river in China; it is surrounded by deserts and borders the largest desert in China, the Taklamakan Desert, to the south, and the famous Kumtag Desert to the east. Along the Tarim River, there are vast areas of P. euphratica, many farmlands, and scattered urban areas. The area includes the Tarim National Nature Reserve, where P. euphratica is the main tree species, and Tamarix and Phragmites reeds are the main associated plants [8], and this is a typical distribution area of natural P. euphratica forests. Based on high-resolution images from Google Earth of the study area and Sentinel-2 images, a training sample set of 3476 P. euphratica points and 3009 non–P. euphratica points (one point corresponds to one pixel) was produced. Figure 1b,c shows the distribution of P. euphratica and non–P. euphratica training samples across the study area. The spatial distribution of the training sample points was relatively balanced, and representative points were evident in the upper, middle, and lower reaches of the Tarim River.
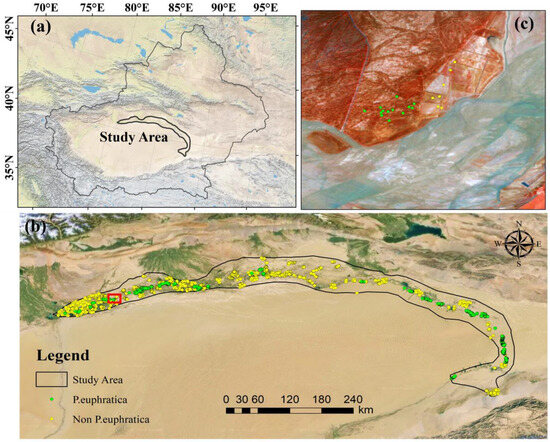
Figure 1.
Geographical location of the study area and the distribution of sample points. (a): location of the study area in Xinjiang province in China; (b): training dataset distribution; (c): detailed sample area showing P. euphratica and non–P. euphratica in a Sentinel-2 false-color image.
2.2. Datasets
2.2.1. Satellite Data
The satellite imagery data used in this study included Sentinel-2 MSI [45], Landsat-8 OLI/TIRS [46], and Sentinel-1 SAR GRD [45]. These data are publicly available and free of charge on Google Earth Engine. Table 1 lists the acquisition time, band, spatial resolution, and usage of the satellite data employed in this study.

Table 1.
Description of datasets used in the study.
2.2.2. Geo-Information Vector Data
To define the scope of the study area, vector data for the mainstream of the Tarim River were obtained free of charge from the National Tibetan Plateau Data Center [47].
2.2.3. Land Cover Data
The 30-m resolution global land cover public data (Globeland30 [48]) for 2020 includes 10 land cover types: arable land, forest, grassland, shrubland, wetland, water body, tundra, artificial surface, bare land, glacier, and permanent snow cover. The data were uploaded to the GEE cloud platform. Globeland30 data were employed to mask and remove built-up areas.
2.2.4. Validation Dataset
To verify the accuracy of the model recognition results proposed in this study, a validation sample dataset containing 906 P. euphratica sample points and 906 non–P. euphratica sample points were labeled by visual interpretation, referring to Gaofen-2 [4] (civil optical remote sensing satellite of China) images, UAV [18] (unmanned aerial vehicle, obtaining images from aerial photography in the wild) images, and Sentinel-2 images. The spatial distribution of the validation sample points is shown in Figure 2 and includes the upper, middle, and lower reaches of the Tarim River.
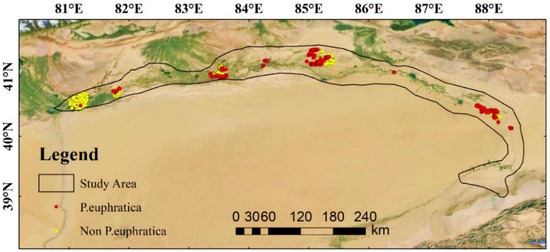
Figure 2.
Distribution of validation dataset. The black solid line represents the range of the study area; the red and yellow points represent P. euphratica and non–P. euphratica, respectively.
3. Methodology
In this study, Sentinel-1 GRD SAR, Sentinel-2 MSI SR, and Landsat-8 OLI/TIRS SR data were used as inputs, and prior and posterior knowledge were integrated into the machine-learning process to enhance the prediction ability of the model. Figure 3 illustrates the technical route followed in this study. It includes (1) obtaining the potential distribution area of P. euphratica; (2) reconstructing high-quality NDVI time series; (3) integrating phenology, spectral index, backscattering, and textural information to train a random forest (RF) model; (4) using an active learning method to optimize the model [21]; and (5) mapping the spatial distribution of P. euphratica in the study area.
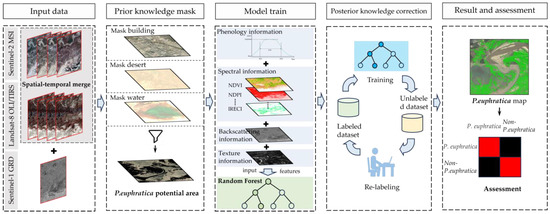
Figure 3.
Workflow of the research.
3.1. Background Splitting
It is easy for complex backgrounds to introduce unexpected noise into the extraction results of P. euphratica and reduce the accuracy; therefore, it was necessary to segment and remove background objects unrelated to P. euphratica. We first used the Globeland30 data to extract and remove the artificial surface and simultaneously partially removed the impact of green trees and gardens in the area. Since the accuracy of removing water bodies and deserts using Globeland30 data in the study area is limited, to accurately segment the background, we chose MNDWI (Modified Normalized Difference Water Index) [49] and NDVI derived from Sentinel-2 to remove water bodies and desert bare land. Based on this, the MNDWI, which enhances the characteristics of open water and suppresses background noise, such as soil, was used to segment and remove the water bodies. After repeated experiments, it was determined that −0.025 was the optimal threshold for dividing the water bodies in the mainstream of the Tarim River, as it could not only filter out a large area of water but also partially retain information about P. euphratica in the water. Finally, NDVI segmentation was performed to remove bare desert. The NDVI value is negative for water, positive for vegetation, and close to zero for deserts [50]. After repeated experiments, 0.07 was selected as the optimal threshold for dividing desert and vegetation.
Figure 4 shows the vegetation index value-frequency distribution map. When MNDWI = −0.025 and NDVI = 0.07 were taken as the thresholds, it was possible to accurately eliminate the water bodies and desert bare land to obtain a reliable potential distribution area of P. euphratica, and avoid unnecessary noise caused by these features entering the identification task.
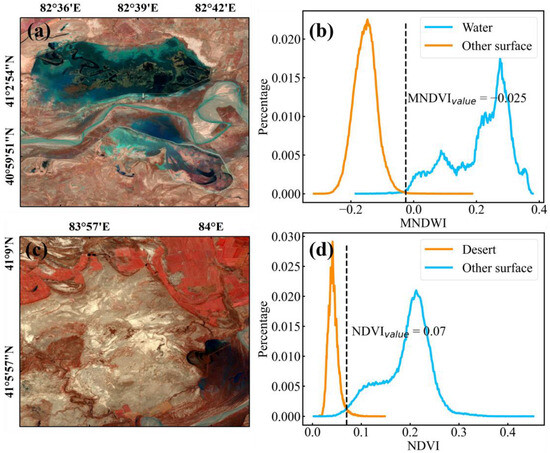
Figure 4.
Threshold segmentation effect of MNDWI and NDVI. (a): false color image of Jieran Lik Reservoir in Xinjiang Province; (b): statistical result of the corresponding frequency distribution of MNDWI values of water and other ground objects in area (a); (c): false color image of Pazili Tamu in Xinjiang; (d): statistical result for the corresponding frequency distribution of NDVI values of desert bare land and other ground objects in region (c).
3.2. Phenological Parameter Extraction
3.2.1. NDVI Data Fusion
The spatiotemporal fusion of multi-source remote sensing data is effective in solving the problem of cloud limitations and the contradiction between high temporal and high spatial resolution of optical remote sensing satellites [51]. Sentinel-2 and Landsat-8 have similar bands, which is convenient for data fusion [52]. When Sentinel-2 data in the study area are lacking owing to cloud cover, Landsat-8 and Sentinel-2 data can be used to obtain more continuous and stable Earth observations. The linear regression relationship between the data of different sensors has been used to fuse images with different resolutions, such as Landsat and Sentinel, and it is simple to use and efficient [51]. In this study, linear regression was conducted on the NDVI data derived from Landsat-8 and the NDVI data derived from Sentinel-2 to achieve the following: data fusion, supplement the areas with missing NDVI due to cloud cover, and obtain NDVI time series data with high spatiotemporal resolution. The following equation was employed for data fusion,
where and are the slope and intercept of the regression equation, respectively, which can be obtained using the least squares method. Figure 5 illustrates the effect of data fusion, where Figure 5a shows the Sentinel-2 NDVI data before fusion and Figure 5b shows the NDVI data after fusion. Compared to the Sentinel-2 NDVI data without fusion, the blank area of the fused NDVI data blocked by clouds is significantly reduced, which fully proves that the data fusion of Landsat-8 and Sentinel-2 can improve image coverage in the study area, reduce the impact of cloud cover, and help reconstruct the NDVI time series in the study area.
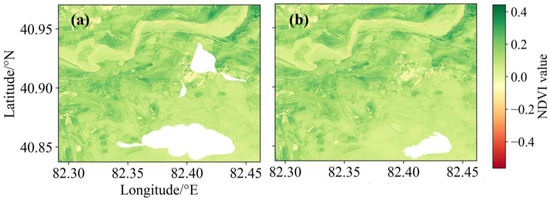
Figure 5.
Comparison of NDVI data before and after spatiotemporal fusion: (a) NDVI data derived from Sentinel-2 before fusion, (b) NDVI data after fusion.
3.2.2. Optimization of the Filter to Reconstruct the NDVI Time Series
Selecting the appropriate filter function to obtain a high-quality NDVI time series is essential for applications such as vegetation phenology monitoring [53]. As the quality of the vegetation index time series is easily affected by clouds and adverse meteorological conditions, several noise cancellation algorithms have been proposed to reconstruct vegetation index time series [54]. In this study, the effects of Savitzky-Golay (S-G) filtering [55], the Harmonic Analysis of Time Series (HANTS) [56], Whittaker smoothing [57], and self-weighting function fitting from curve features (SWCF) [54] in reconstructing the NDVI time series were compared to select the best method to reconstruct the NDVI time series, and these are presented as follows:
- (1)
- Savitzky-Golay filter (S-G)
S-G filtering is derived from a simplified least-squares fitting convolution proposed by Savitzky and Golay, and it is used to smooth and calculate the derivatives of sequence data or spectra [55]. S-G filtering can be considered a weighted moving average filter that performs polynomial least-squares fitting within a sliding window. The general equation for smoothing the vegetation index time series by S-G filtering is shown in Equation (2),
Where is the original value of the vegetation index time series, which is the result of in the reconstruction; is half the width of the window after the middle data points have been removed; is the coefficient of the ith data point in the window, determined by the fitted polynomial using the least-squares method; and is the ordinal number of the middle data point in the sliding window.
- (2)
- Harmonic Analysis of Time Series (HANTS)
HANTS is a reconstruction method based on Fourier series expansion [56,58] that uses a combination of sine and cosine functions to fit the original data. The formula is written in the form of Equations (3) and (4) [56],
where is the original time series; is the reconstructed time series; is the error series between and ; is the image acquisition time; ranges from 1 to N; N is the length of the time series, denotes the number of periodic terms that can be expanded in Equation (3), which is related to the frequency ; and are the sine and cosine coefficients in Equation (3); and is the average value of the entire time series, which can be obtained using the least-squares method [56].
- (3)
- Whittaker smoothing
Whittaker smoothing is a fast process for fitting discrete sequence data to discrete datasets [57]. For noisy time series () and target smoothing series () it is necessary to balance the fidelity and roughness of the data. Fidelity is the sum of the squares of the difference between raw and smoothed data, is the second-order difference, and the objective function is a combination of fidelity and roughness. The goal of Whittaker filtering is to minimize the objective function , and the least-squares method is used to find the smoothed sequence with the best fit [57],
where the parameter in Equation (5) describes the degree of smoothing of the smoothing sequence: the larger the degree, the smoother the smoothed sequence .
- (4)
- Self-weighting function fitting from curve features (SWCF)
SWCF is a weighted double logistic smoother [54]. The basic process reconstructs the original NDVI data according to the weight definition formula shown in Equation (8) and then uses the double logistic function to smooth the NDVI time series,
where is the weight of gradient points in the time series, with a default value of 1; is the weight of mutation points in the time series; is defined as the vertical distance between the mutation point and the straight line formed by two adjacent gradient points after linear stretching; and describes the temporal proximity of the mutation point to the peak of the NDVI sequence after linear stretching.
3.2.3. Threshold Method for Extracting Phenological Parameters
Accurate phenological parameters are required to combine phenological information when extracting specific vegetation types. Specific phenological events cannot be obtained directly from satellite images; however, the phenological dynamics of vegetation are derived from surface phenological parameters [24]. Typical phenological parameters include the start of season (SoS), end of season (EoS), length of season (LoS), amplitude of season (AoS), maximum value of the annual NDVI time series (Max Value), and date of maximum value (DoM). The SoS and EoS are usually extracted using the threshold method [59,60]. The threshold division formula is given by Equation (9),
where takes the maximum value of the NDVI time series, and takes the minimum value of the NDVI time series, respectively; SoS corresponds to the date when the NDVI value is first greater than , while EoS corresponds to the date when the NDVI value was last greater than in the NDVI time series. In Equations (10) and (11) below, LoS is the data difference between EoS and SoS (Equation (10)), and AoS is the difference between and in the NDVI time series (Equation (11)). The Max Value corresponds to , and the DoM is the date on which is located.
3.3. Construction of Classification Model
The RF classifier is a bagging-based ensemble learning classifier consisting of many single decision trees that can be called directly on the GEE cloud platform. The RF model has strong robustness to noise, is not easily overfitted, and has strong transferability [31,61,62]. The RF classifier requires two parameters: the number of trees in the decision tree (n-tree) and the number of features used by each binary tree node (m-try). Some studies have shown that when the n-tree exceeds 100, the prediction effect of the model tends to be stable [63]. In this study, the n-tree in the choice tree was 100 and m-try was the platform default, which was the square root of all input features.
Based on previous studies on the extraction of vegetation from P. euphratica and other forests, the features of the RF model included six phenological parameter features, eight spectral index features, two backscattering features, and three textural features, as shown in Table 2.

Table 2.
Features used in the RF model.
Phenological parameter characteristics included SoS, EoS, LoS, AoS, Max Value, and DoM. Spectral index features included Band 2, Band 3, Band 4 of Sentinel-2, the Normalized Difference Phenology Index (NDPI), the Inverted Red-Edge Chlorophyll Index (IRECI), the Green Chlorophyll Vegetation Index (GCVI), the Plant Senescence Reflectance Index (PSRI), and the Enhanced Vegetation Index (EVI). The backscattering features included the VV and VH polarization bands in the IW mode of Sentinel-1. Textural features included angular second moment (ASM), correlation (CORR), and contrast (CON) computed from the gray-level co-occurrence matrix. The formulas used to calculate the vegetation indices are listed in Table 3.

Table 3.
Vegetation index formulas used in this study.
3.4. Active Learning Optimization
Obtaining sufficiently accurate classification results using only one training model is difficult, particularly when the number of training samples is limited. Therefore, active learning should be introduced to iteratively update the model parameters stepwise [21], thereby optimizing the classification results of machine learning. The core of active learning is to find unlabeled data with obvious misclassification errors in the prediction results after initial machine learning has been performed on the initial training dataset. These data are then analyzed, labeled with the correct category, and added to the training dataset to retrain the model [21]. In this study, an RF model was first trained based on a training dataset consisting of 3476 P. euphratica points and 3009 non–P. euphratica points. Misclassified or missing points were then found in the results, and the correct annotations were conducted. Finally, after correction and updating of expert knowledge, 56 unreasonable P. euphratica points and 22 non–P. euphratica points in the initial training set were removed, while another 58 P. euphratica points and 25 non–P. euphratica points were added to the training set to optimize the training model.
3.5. Accuracy Assessment
The confusion matrix has been widely used to evaluate the classification results of a model, and it can objectively reflect the model’s accuracy [71,72]. In this study, overall accuracy (OA), user accuracy (UA), and producer accuracy (PA) were calculated using the confusion matrix. The F1-score is a blended average of PA and UA and is also a commonly used precision metric [4,73] that comprehensively reflects PA and UA. Based on the confusion matrix, the kappa coefficient was further calculated, as this represents the consistency between the classification result predicted by the model and the real classification result (the closer the result is to 1, the better the classification effect). In our study, 906 P. euphratica verification points and 906 non–P. euphratica verification points were obtained by referring to Gaofen-2 and UAV data in the upstream, midstream, and downstream regions of the study area. The accuracy of the identification results for P. euphratica was evaluated by calculating the indices of OA, UA, PA, F1-score, and the kappa coefficient.
4. Results
4.1. Performance of Reconstructing NDVI Time Series Using Different Methods
Six typical vegetation points types were selected in the study area (P. euphratica, Tamarix, allee tree, farmland, wetland, and urban tree), and the original NDVI data of these points were reconstructed using the S-G filtering, HANTS, Whittaker, and SWCF methods. The results are shown in Figure 6.
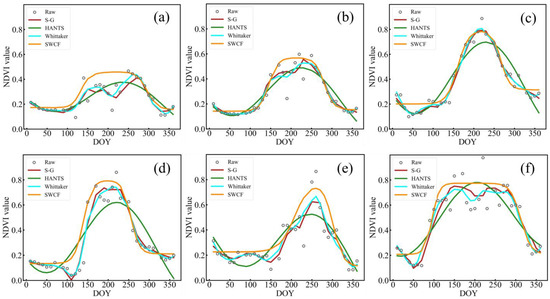
Figure 6.
Comparison of the effects of different filter functions for: (a) P. euphratica; (b) Tamarix; (c) allee tree; (d) farmland; (e) wetland; (f) urban tree.
S-G filtering and Whittaker smoothing provided a good fit and high data fidelity with the NDVI time series; however, the influence of noise or outliers in the original NDVI data could not be completely shielded in the curve, and a doublet phenomenon remained (such as in the fitting curve of P. euphratica, Tamarix, and urban trees). However, compared with the S-G filter, the smoothness of the NDVI time series curve using Whittaker smoothing was improved, and sudden rises or drops in the curve were reduced. HANTS removed the high-frequency noise of the original data, and the curve was very smooth, which well reflected the unimodal characteristics of vegetation NDVI in one year. However, the fitting degree between the fitting curve and the original NDVI data was not ideal, and fidelity was not sufficient. SWCF smoothed the influence of noise and outliers, reflected the unimodal characteristics of vegetation NDVI in a one-year cycle, and provided a good fit with the NDVI time series throughout the year to reconstruct a high-quality NDVI time series.
4.2. Results of Phenological Parameter Extraction
After comparing the performance of different filter functions, the SWCF was found to have the best effect in reconstructing the NDVI time series. Based on this, the phenological parameters of typical vegetation (P. euphratica, Tamarix, allee tree, farmland, wetland vegetation, and urban tree) were extracted using a threshold method that included SoS, EoS, LoS, AoS, Max Value, and DoM. The phenological curves and parameters of P. euphratica, Tamarix, allee tree, farmland, wetland, and urban tree are shown in Figure 7a–e, respectively, where DOY represents the number of days relative to the start date (1 January 2022). The characteristics of different vegetation can be reflected by phenological parameters such as SoS and EoS on the phenological curve. There were clear differences between the phenological characteristics of P. euphratica and the other five vegetation cover types. The Max Value of P. euphratica was the lowest among the six vegetation cover types, and its AoS was also the lowest. The SoS of P. euphratica was earlier than that of Tamarix, allee tree, and wetland, but later than that of urban tree, which was close to that of farmland; the EoS of P. euphratica was earlier than that of wetland and urban tree but later than that of Tamarix, allee tree, and farmland; and the LoS of P. euphratica was relatively long at 150 d, which was longer than that of Tamarix, allee tree, farmland, and wetland vegetation but shorter than that of urban tree (190 d). These significant phenological differences provide a theoretical basis for identifying P. euphratica based on phenology.
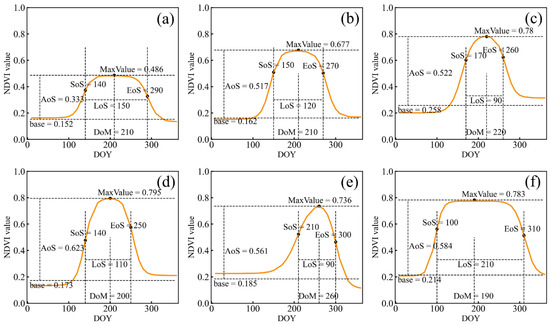
Figure 7.
Comparison between phenological curves of six typical vegetation species. Phenology parameters of (a) P. euphratica, (b) Tamarix, (c) allee tree, (d) farmland, (e) wetland, and (f) urban tree.
4.3. Importance of Different Input Features
Phenological parameter (P), spectral index (S), backscattering (B), and textural (T) features were input into the RF algorithm on the GEE cloud platform to classify P. euphratica. The RF algorithm on the GEE cloud platform can evaluate the importance of each feature in the identification of P. euphratica, and its output is shown in Figure 8. The results showed that the top three features in terms of feature importance were VH, CON, and B4, and the lowest three features were SoS, DoM, and EoS. The features with the highest importance were mainly backscattering, whereas textural features, spectral index features, and phenological parameters were ranked lower in importance. The importance of phenological and spectral index features was low; however, they were important features for distinguishing vegetation at the species level. Among the phenological features, AoS was the most important because the AoS of P. euphratica was significantly lower than that of other vegetation types, and this is an important feature for distinguishing P. euphratica. The most important feature of the spectral index was B4, as different vegetation types are more sensitive to the red and near-infrared bands. The most important backscattering feature was VH, because the polarization band of VH highlighted the strong volume scattering characteristics of P. euphratica. CON was the most important textural feature because it described the contrast of texture in Sentinel-2 B8 images and highlighted the relatively sparse and slender distribution of natural P. euphratica. The results of feature importance showed that it is very important to add backscattering and textural features to assist in the effective identification of P. euphratica, as this can improve the success rate of P. euphratica recognition.
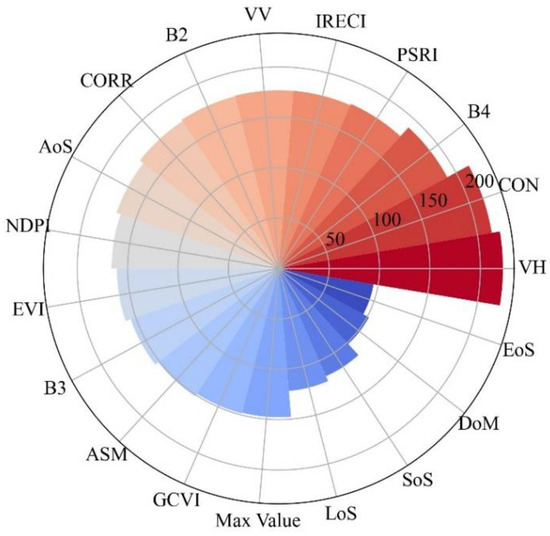
Figure 8.
Importance of different features in the RF classification.
4.4. Comparative Study Using Different Combinations of Input Features
Phenological features (P) and spectral index features (S) are widely used in vegetation type identification and mapping [23], as demonstrated by the results of our study. We used phenological features (P) and spectral index features (S) as the initial features and established four feature combinations (PS, PSB, PST, and PSBT) to explore the best combination suitable for extracting P. euphratica. Table 4 lists the details of the different feature combinations.

Table 4.
Abbreviations for different feature combinations and associated details.
The spatial distribution maps of natural P. euphratica forests in the mainstream of the Tarim River are shown in Figure 9, and this was extracted through the use of PS, PSB, PST, and PSBT after input into the RF model. The areas of P. euphratica extracted by the PS and PST feature combinations were the largest and smallest, respectively. The areas extracted using the PSB and PSBT feature combinations provided similar results but the area extracted by the PSB feature combination was slightly larger than that extracted by PSBT. Based on the actual distribution of P. euphratica on Google and Sentinel-2 images, the extraction result of the PS feature combination overestimated the area of P. euphratica, while the PST feature combination underestimated the area. The extraction result of the PSB feature combination slightly overestimated the area of P. euphratica, while that of the PSBT feature combination was the most consistent with the actual situation.
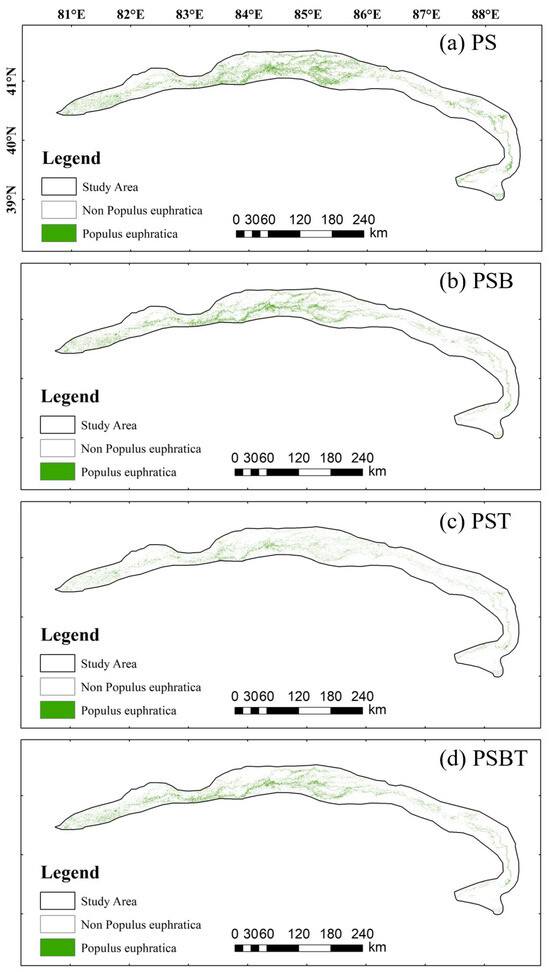
Figure 9.
Natural P. euphratica forest maps extracted using four feature combinations: (a) PS, (b) PSB, (c) PST, and (d) PSBT.
Rows 1–4 in Figure 10 show the GF-2 images of the desert area, P. euphratica dense area, farming area, and large river area, along with the corresponding results of P. euphratica extracted from the combination of four features: PS, PSB, PST, and PSBT.
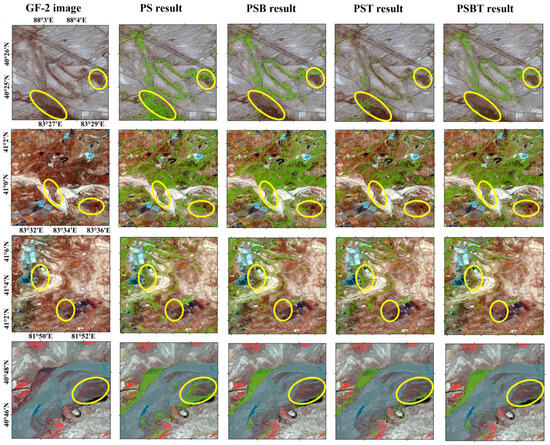
Figure 10.
Comparison of P. euphratica extraction results using different feature combinations on Sentinel-2 standard false color images. Rows 1 to 4 show the identification of P. euphratica in desert areas, P. euphratica-dense areas, agricultural areas, and large river areas, respectively. The green area represents the classification result of P. euphratica. The yellow circle corresponding to each row is the area where the extraction results of different feature combinations are quite different.
For the desert area, the PS feature combination misidentified vegetation (such as Tamarix), which has highly similar characteristics to P. euphratica in the desert (the area marked by the yellow circle in Figure 10). The misclassification was significantly reduced after the addition of backscattering features (PSB). A small number of Tamarix were still misidentified as P. euphratica after the addition of textural features (PST), while a large number of sparsely distributed P. euphratica were missed. Furthermore, after adding both the backscattering and textural features (PSBT), the misclassification and omission were significantly reduced.
For the P. euphratica dense area, the feature combinations of PS, PSB, and PSBT used to extract P. euphratica produced similar results. The results of the feature combination PS showed that a large area of Tamarix around P. euphratica was classified as P. euphratica; the feature combination PSB avoided the misclassification of Tamarix in a large area but misclassified Tamarix when P. euphratica was sparsely distributed. Although relatively few Tamarix were misclassified as P. euphratica with the feature combination PST, a large area of P. euphratica was omitted. PSBT provided the advantages of both feature combinations (PSB and PST) and reduced the misclassification of Tamarix in large areas or around sparse areas of P. euphratica.
According to the results for the farming area, the PS feature combination misclassified allee trees on some ridges and Tamarix around cultivated land as P. euphratica. PSB reduced the misclassification of Tamarix and ridge vegetation, and PST minimized ridge misclassification but increased the misclassification of Tamarix. Finally, PSBT minimized the misclassification of cultivated land and the surrounding Tamarix.
According to the results of the large river area, large amounts of Tamarix in the floodplain were misclassified as P. euphratica in the results of the feature combination PS. The feature combination PST reduced the misclassification of Tamarix in the floodplain but omitted the sparsely distributed P. euphratica. However, PSB and PSBT effectively classified the sparsely distributed P. euphratica on the floodplain and reduced the misclassification of Tamarix.
The distribution of P. euphratica was preliminarily overestimated when using only phenological and spectral index features, and there were a large number of areas in which non–P. euphratica features (such as Tamarix and wetland vegetation) were misclassified as P. euphratica. After adding backscattering features, a large number of Tamarix misclassifications were reduced, but the allee trees on some cultivated lands were still misclassified as P. euphratica. After adding textural features, many P. euphratica trees were still missed. The addition of both backscattering and textural features improves the advantages of both and effectively obtains an accurate distribution of P. euphratica.
According to the results of the confusion matrix, the OA, PA, UA, kappa coefficient, and F1-score were calculated to evaluate the accuracy of the four input feature combinations in extracting P. euphratica, and the results are shown in Table 5. The OA, UA, PA, kappa, and F1-score of the feature combination PSBT are the highest among the four combinations, which are 0.96, 0.98, 0.95, 0.93, and 0.96, respectively. The feature combination PST has the lowest OA, UA, kappa coefficient, and F1-score. The feature combination PS has the lowest PA. The OA, PA, UA, kappa coefficient, and F1-score of PSB were all higher than those of PS. The results show that, based on the input feature combination PS, adding only textural features may deteriorate the P. euphratica recognition effect, while adding only backscattering features can improve the recognition effect of P. euphratica. Simultaneously adding both backscattering and textural features can further improve the P. euphratica recognition accuracy.

Table 5.
Accuracy assessment of feature combinations PS, PSB, PST, and PSBT.
4.5. Distribution Map of Natural P. euphratica Forests in the Mainstream of the Tarim River
Based on the above comparative study, the feature combination PSBT was used as the final input feature of the RF model. The model parameters were continuously optimized through active learning, and the distribution data of P. euphratica with a resolution of 10 m in the mainstream of the Tarim River were obtained. The overall distribution of P. euphratica in the mainstream of the Tarim River, which covers an area of approximately 1181.84 km2, is shown in Figure 11a, where P. euphratica is distributed over a long and slender area, mainly growing in the middle and upper reaches of the Tarim River and forming many branches along the river network. The UAV images of the distribution area of healthy P. euphratica and unhealthy P. euphratica, and the corresponding classification results of P. euphratica are shown in Figure 11b–e, and the UAV image of the dense and sparsely distributed areas of P. euphratica and the corresponding identification results are shown in Figure 11f–i. In detail, Figure 11b,d show that P. euphratica with different levels of health were accurately identified, and many less healthy P. euphratica with smaller crowns were not missed. As shown in Figure 11f, P. euphratica was densely distributed along the river, and although it was associated with other plants and growing in complex conditions, it was accurately classified. Figure 11h shows that sparsely distributed P. euphratica in the desert, with small crown widths, were also classified well. In general, the identification effect of P. euphratica was accurate and was in line with its actual growth and distribution characteristics.
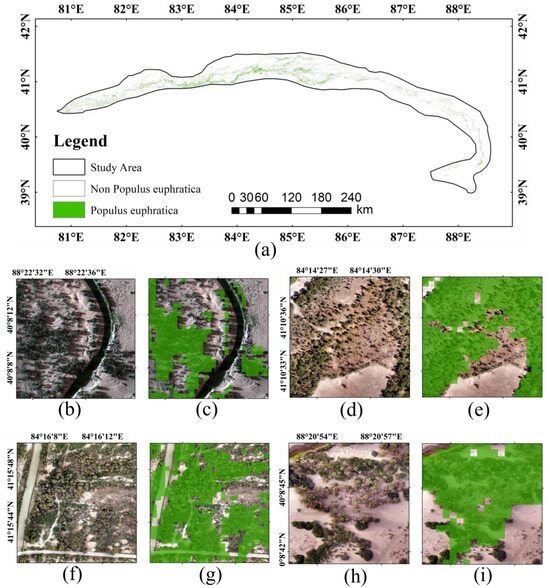
Figure 11.
(a) Distribution of natural P. euphratica forest in the mainstream of the Tarim River. (b): UAV image of healthy P. euphratica, (c): classification result of healthy P. euphratica, (d): UAV image of unhealthy P. euphratica, (e): classification result of unhealthy P. euphratica, (f): UAV image of dense P. euphratica, (g): classification result of dense P. euphratica, (h): UAV image of sparse P. euphratica, (i): classification result of sparse P. euphratica. The green area represents the classification results of P. euphratica.
5. Discussion
5.1. Analysis of the Importance of Different Input Features
Among the feature importance results from the RF model, backscattering features (such as VH), textural features (such as CON), and spectral index features (such as Sentinel-2 Band 4) showed high importance, whereas the importance of phenological features was low. Compared with many other features, the VH polarization feature highlighted the volume scattering characteristics of P. euphratica, CON highlighted the spatial characteristics of the elongated distribution of P. euphratica along the river by calculating the texture contrast of Sentinel-2 B8 images, and Sentinel-2 B4 reflected the spectral characteristics of P. euphratica. These features had a greater gain in distinguishing P. euphratica. However, a good P. euphratica extraction effect was preliminarily realized through the input of phenological and spectral index features. After introducing only the backscattering feature (B), the OA improved by more than 4%, PA increased by approximately 5.5%, UA increased by approximately 2.9%, the kappa coefficient improved the most by approximately 9.8%, and the F1-score increased by approximately 7%. This is because P. euphratica is taller than the surrounding vegetation (such as Tamarix and reeds), its canopy is wider, and volume scattering is more intense, enhancing its characteristics through backscattering, although it is also easier to confuse with allee trees. However, after introducing only textural features when inputting phenological and spectral index features, compared with the accuracy result of PS, OA decreased by 18.3%, PA decreased by 0.6%, UA decreased by 48.9%, the kappa coefficient decreased by 48%, and the F1-score decreased by 18.6%. Many P. euphratica trees were missed, and a large number of non–P. euphratica were incorrectly identified as P. euphratica, and this was mainly because the textural features of P. euphratica on Sentinel-2 images were not particularly prominent, the distribution spacing was random, and the textural similarity with other vegetation (such as garden trees and Tamarix in the desert) was high, easily leading to misclassification. After simultaneously adding backscattering and textural features, compared with the accuracy result of PS, the OA of P. euphratica increased by 10.8%, PA by 12.89%, UA by 9.86%, the kappa coefficient greatly increased by 27%, and the F1-score by 11.63%. The probability of P. euphratica verification points being correctly classified as P. euphratica was greatly improved, and the probability of non–P. euphratica objects being misclassified was reduced. The experimental results showed that the vegetation phenological features and spectral index features were very effective in identifying P. euphratica, and the addition of backscattering features improved the recognition accuracy of P. euphratica forests. Furthermore, the use of textural features enabled more accurate P. euphratica classification.
5.2. Mixed Pixel Impact Analysis
Sentinel-2 data with a resolution of 10 m provides rich spectral information. With Sentinel-2 data, the NDVI can be constructed according to the B8 and B4 bands, and a complete NDVI time series over one year can be achieved. In addition, more accurate key phenological parameters can be obtained, and rich vegetation indices can be constructed according to the B2, B3, B4, B5, B6, B11, and other bands provided by Sentinel-2 (such as the EVI, NDPI, and IRECI). In this study, these features contributed to the rapid and accurate mapping of large areas of P. euphratica. However, the characteristics of P. euphratica, such as random distribution spacing [74], make it difficult to identify. Furthermore, unhealthy and sparse P. euphratica grow in areas with poor water conditions, as shown in Figure 12, where their distribution is often isolated, they have small crown [23], and they occupy less than one pixel (Figure 12a). In addition, the sandy soil around isolated P. euphratica interferes with its reflected signal (Figure 12b), and there is a serious problem associated with mixed pixels in desert areas, which can easily lead to confusion between the spectrum of P. euphratica and non–P. euphratica. Such issues make the feature dataset less sensitive to the P. euphratica classification task, easily leading to the misclassification of allee trees planted on ridges and Tamarix near P. euphratica.
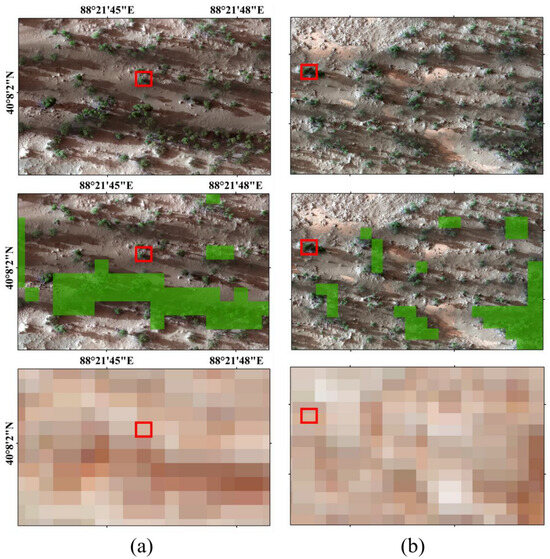
Figure 12.
Mixed pixel problems associated with P. euphratica: (a) P. euphratica occupying less than one pixel; (b) sandy soil interfering with the reflected signal of P. euphratica. The red box represents a pixel on the images for clearer observation. Basemaps of row 1-2 are UAV images while row 3 are Sentinel-2 standard false color images.
5.3. Comparison with Previous Studies
Currently, there are few studies on large-area mapping of P. euphratica using remote sensing images [4,23], and no public P. euphratica data has been published. Our work has a certain degree of exploratory significance for the automatic extraction of P. euphratica. Compared with the mapping of Populus euphratica in the Tarim River Basin by Peng Yan et al. [23], we used a new P. euphratica mapping technology process, optimized the input feature set, and improved the accuracy of the P. euphratica distribution map. The method we proposed is conducive to the rapid and accurate mapping of large-area natural P. euphratica forests and facilitates the dynamic monitoring and protection of P. euphratica. However, this method still needs to be verified or optimized in experiments conducted over larger areas.
6. Conclusions
Based on the GEE platform, we employed multi-source satellite images and fused sensitive features (such as phenology, spectrum, and texture) to construct an input feature set, and we then employed a random forest classifier to realize the large area high-precision mapping of P. euphratica for protecting and restoring P. euphratica. In this respect, we employed Globeland-30 to mask out non-vegetation areas. Subsequently, a dense NDVI time-series dataset was constructed by fusing Landsat-8 and Sentinel-2 data for 2022, and suitable filter functions were screened to reconstruct the NDVI time-series data, extract key phenological parameters, and integrate the spectral index, backscattering, and textural features, with the aim of constructing a suitable input feature set. Finally, a random forest model was employed to modify the training sample set using the active learning method, and the model was optimized iteratively. Ultimately, the distribution range of P. euphratica was extracted and the accuracy of the mapping results was evaluated.
Comparing various smoothing methods such as S-G, HANTS, Whittaker, and SWCF, SWCF was determined to be the best filtering method. The reconstructed NDVI time series was used to obtain phenological parameter features, such as SoS, EoS, LoS, Max value, DoM, and AoS. Based on the abundant band data of Sentinel-2, data for Band 2, Band 3, and Band 4 were obtained, and vegetation indices such as EVI, NDPI, IRECI, GCVI, and PSRI were constructed. The B8 band of Sentinel-2 was employed to obtain textural features, including CON, ASM, and CORR, and the VV and VH bands of Sentinel-1 were introduced to reflect the backscattering features. A feature dataset was formed that fully reflected the features of P. euphratica, and VH, CON, and B4 features were of high importance in identifying P. euphratica.
The feature dataset, containing phenological, spectral index, backscattering, and textural information, was input into the RF model, and the active learning method was used to optimize the model. The distribution data of the natural P. euphratica forest with a resolution of 10 m in the mainstream of the Tarim River were obtained, with an overall accuracy of 0.96, a producer’s accuracy of 0.98, a user’s accuracy of 0.95, a kappa coefficient of 0.93, and an F1-score of 0.96. The comparison experiments between the feature combinations PS, PSB, PST, and PSBT showed that simultaneously adding backscattering and textural features improved the P. euphratica extraction accuracy.
Generally, our study proposed a new large-area automated mapping method for natural P. euphratica forests, considered prior and posteriori information during the training process, identified a set of features that reflect the characteristics of P. euphratica, effectively improved the accuracy of P. euphratica extraction, and enriched research in this field. In the future, we will explore essential features that can reflect the characteristics of P. euphratica, combine more advanced technologies to improve the extraction method, and use available higher-resolution images to achieve efficient, large area, and rapid extraction of P. euphratica in arid areas.
Author Contributions
Conceptualization, H.L., S.L. and Q.S.; methodology, J.Z., H.L. and C.D.; software, J.Z.; validation, J.Z., H.L. and S.L.; formal analysis, J.Z. and H.L.; investigation, J.Z. and H.L.; resources, H.L., S.L., C.D. and Q.S.; data curation, J.Z.; writing—original draft preparation, J.Z. and H.L.; writing—review and editing, J.Z. and H.L.; visualization, J.Z. and H.L.; supervision, H.L., C.D. and Q.S.; project administration, H.L. and Q.S.; funding acquisition, H.L. All authors have read and agreed to the published version of the manuscript.
Funding
This research was funded by the National Natural Science Foundation of China (NSFC, grant number 32201349).
Data Availability Statement
The original contributions presented in the study are included in the article, further inquiries can be directed to the corresponding author.
Conflicts of Interest
The authors declare no conflicts of interest.
References
- Huang, P. Study on the dynamic adaptation of the life cycle of Populus euphratica forests on desert river banks to the water conditions of the habitat. Xinjiang Environ. Prot. 1991, 13, 5–10. [Google Scholar]
- Rajput, V.D.; Minkina, T.; Yaning, C.; Sushkova, S.; Chapligin, V.A.; Mandzhieva, S. A Review on Salinity Adaptation Mechanism and Characteristics of Populus Euphratica, a Boon for Arid Ecosystems. Acta Ecol. Sin. 2016, 36, 497–503. [Google Scholar] [CrossRef]
- Wu, J.; Zhang, X.; Li, L.; Deng, C. Liu Guojun Population ecology analysis of natural regeneration of Populus euphratica population in the Tarim River Basin. Chin. J. Desert Res. 2010, 30, 582–588. [Google Scholar]
- Li, H.; Shi, Q.; Wan, Y.; Shi, H.; Imin, B. Using Sentinel-2 Images to Map the Populus Euphratica Distribution Based on the Spectral Difference Acquired at the Key Phenological Stage. Forests 2021, 12, 147. [Google Scholar] [CrossRef]
- Wang, S. The current status of Populus euphratica forests around the world and strategies for their protection and restoration. World For. Res. 1996, 9, 37–44. [Google Scholar]
- Chen, Y.; Chen, Y.; Li, W.; Zhang, H. Response of the Accumulation of Proline in the Bodies of Populus Euphratica to the Change of Groundwater Level at the Lower Reaches of Tarim River. Chin. Sci. Bull. 2003, 48, 1995–1999. [Google Scholar] [CrossRef]
- Ling, H.; Zhang, P.; Xu, H.; Zhao, X. How to Regenerate and Protect Desert Riparian Populus Euphratica Forest in Arid Areas. Sci. Rep. 2015, 5, 15418. [Google Scholar] [CrossRef]
- Peng, Y.; He, G.; Wang, G. Spatial-Temporal Analysis of the Changes in Populus Euphratica Distribution in the Tarim National Nature Reserve over the Past 60 Years. Int. J. Appl. Earth Obs. Geoinf. 2022, 113, 103000. [Google Scholar] [CrossRef]
- Guo, Y.; Li, X.; Zhao, Z.; Wei, H. Modeling the Distribution of Populus Euphratica in the Heihe River Basin, an Inland River Basin in an Arid Region of China. Sci. China Earth Sci. 2018, 61, 1669–1684. [Google Scholar] [CrossRef]
- Aishan, T.; Halik, Ü.; Betz, F.; Gärtner, P.; Cyffka, B. Modeling Height–Diameter Relationship for Populus Euphratica in the Tarim Riparian Forest Ecosystem, Northwest China. J. For. Res. 2016, 27, 889–900. [Google Scholar] [CrossRef]
- Lang, P.; Jeschke, M.; Wommelsdorf, T.; Backes, T.; Lv, C.; Zhang, X.; Thomas, F.M. Wood Harvest by Pollarding Exerts Long-Term Effects on Populus Euphratica Stands in Riparian Forests at the Tarim River, NW China. For. Ecol. Manag. 2015, 353, 87–96. [Google Scholar] [CrossRef]
- Zhu, X.; Liu, D. Accurate Mapping of Forest Types Using Dense Seasonal Landsat Time-Series. ISPRS J. Photogramm. Remote Sens. 2014, 96, 1–11. [Google Scholar] [CrossRef]
- Immitzer, M.; Böck, S.; Einzmann, K.; Vuolo, F.; Pinnel, N.; Wallner, A.; Atzberger, C. Fractional Cover Mapping of Spruce and Pine at 1 Ha Resolution Combining Very High and Medium Spatial Resolution Satellite Imagery. Remote Sens. Environ. 2018, 204, 690–703. [Google Scholar] [CrossRef]
- Persson, M.; Lindberg, E.; Reese, H. Tree Species Classification with Multi-Temporal Sentinel-2 Data. Remote Sens. 2018, 10, 1794. [Google Scholar] [CrossRef]
- Wang, L.; Dong, L.; Hu, T.; Guo, K. History and prospects of China’s vegetation map compilation. Sci. China Life Sci. 2021, 51, 219–228. [Google Scholar]
- Xie, Y.; Sha, Z.; Yu, M. Remote Sensing Imagery in Vegetation Mapping: A Review. J. Plant Ecol. 2008, 1, 9–23. [Google Scholar] [CrossRef]
- Immitzer, M.; Atzberger, C.; Koukal, T. Tree Species Classification with Random Forest Using Very High Spatial Resolution 8-Band WorldView-2 Satellite Data. Remote Sens. 2012, 4, 2661–2693. [Google Scholar] [CrossRef]
- Daryaei, A.; Sohrabi, H.; Atzberger, C.; Immitzer, M. Fine-Scale Detection of Vegetation in Semi-Arid Mountainous Areas with Focus on Riparian Landscapes Using Sentinel-2 and UAV Data. Comput. Electron. Agric. 2020, 177, 105686. [Google Scholar] [CrossRef]
- Ji, W.; Wang, L. Discriminating Saltcedar (Tamarix Ramosissima) from Sparsely Distributed Cottonwood (Populus Euphratica) Using a Summer Season Satellite Image. Photogramm. Eng. Remote Sens. 2015, 81, 795–806. [Google Scholar] [CrossRef]
- Immitzer, M.; Neuwirth, M.; Böck, S.; Brenner, H.; Vuolo, F.; Atzberger, C. Optimal Input Features for Tree Species Classification in Central Europe Based on Multi-Temporal Sentinel-2 Data. Remote Sens. 2019, 11, 2599. [Google Scholar] [CrossRef]
- Feng, Q.; Niu, B.; Ren, Y.; Su, S.; Wang, J.; Shi, H.; Yang, J.; Han, M. A 10-m National-Scale Map of Ground-Mounted Photovoltaic Power Stations in China of 2020. Sci. Data 2024, 11, 198. [Google Scholar] [CrossRef] [PubMed]
- Cao, B.; Yu, L.; Naipal, V.; Ciais, P.; Li, W.; Zhao, Y.; Wei, W.; Chen, D.; Liu, Z.; Gong, P. A 30 m Terrace Mapping in China Using Landsat 8 Imagery and Digital Elevation Model Based on the Google Earth Engine. Earth Syst. Sci. Data 2021, 13, 2437–2456. [Google Scholar] [CrossRef]
- Peng, Y.; He, G.; Wang, G.; Zhang, Z. Large-Scale Populus Euphratica Distribution Mapping Using Time-Series Sentinel-1/2 Data in Google Earth Engine. Remote Sens. 2023, 15, 1585. [Google Scholar] [CrossRef]
- Zeng, L.; Wardlow, B.D.; Xiang, D.; Hu, S.; Li, D. A Review of Vegetation Phenological Metrics Extraction Using Time-Series, Multispectral Satellite Data. Remote Sens. Environ. 2020, 237, 111511. [Google Scholar] [CrossRef]
- De Beurs, K.M.; Henebry, G.M. Land Surface Phenology and Temperature Variation in the International Geosphere–Biosphere Program High-latitude Transects. Glob. Chang. Biol. 2005, 11, 779–790. [Google Scholar] [CrossRef]
- Weisberg, P.J.; Dilts, T.E.; Greenberg, J.A.; Johnson, K.N.; Pai, H.; Sladek, C.; Kratt, C.; Tyler, S.W.; Ready, A. Phenology-Based Classification of Invasive Annual Grasses to the Species Level. Remote Sens. Environ. 2021, 263, 112568. [Google Scholar] [CrossRef]
- Lee, B.; Kim, E.; Lim, J.-H.; Seo, B.; Chung, J.-M. Detecting Vegetation Phenology in Various Forest Types Using Long-Term MODIS Vegetation Indices. In Proceedings of the IGARSS 2018—2018 IEEE International Geoscience and Remote Sensing Symposium, Valencia, Spain, 22–27 July 2018; pp. 5243–5246. [Google Scholar]
- Hu, Q.; Sulla-Menashe, D.; Xu, B.; Yin, H.; Tang, H.; Yang, P.; Wu, W. A Phenology-Based Spectral and Temporal Feature Selection Method for Crop Mapping from Satellite Time Series. Int. J. Appl. Earth Obs. Geoinf. 2019, 80, 218–229. [Google Scholar] [CrossRef]
- Bargiel, D. A New Method for Crop Classification Combining Time Series of Radar Images and Crop Phenology Information. Remote Sens. Environ. 2017, 198, 369–383. [Google Scholar] [CrossRef]
- Al-Shammari, D.; Fuentes, I.M.; Whelan, B.; Filippi, P.F.A.; Bishop, T. Mapping of Cotton Fields Within-Season Using Phenology-Based Metrics Derived from a Time Series of Landsat Imagery. Remote Sens. 2020, 12, 3038. [Google Scholar] [CrossRef]
- Zhang, C.; Zhang, H.; Tian, S. Phenology-Assisted Supervised Paddy Rice Mapping with the Landsat Imagery on Google Earth Engine: Experiments in Heilongjiang Province of China from 1990 to 2020. Comput. Electron. Agric. 2023, 212, 108105. [Google Scholar] [CrossRef]
- Zhang, C.; Dong, J.; Xie, Y.; Zhang, X.; Ge, Q. Mapping Irrigated Croplands in China Using a Synergetic Training Sample Generating Method, Machine Learning Classifier, and Google Earth Engine. Int. J. Appl. Earth Obs. Geoinf. 2022, 112, 102888. [Google Scholar] [CrossRef]
- Gaertner, P.; Foerster, M.; Kleinschmit, B. The Benefit of Synthetically Generated RapidEye and Landsat 8 Data Fusion Time Series for Riparian Forest Disturbance Monitoring. Remote Sens. Environ. 2016, 177, 237–247. [Google Scholar] [CrossRef]
- Zhen, Z.; Chen, S.; Yin, T.; Gastellu-Etchegorry, J.-P. Globally Quantitative Analysis of the Impact of Atmosphere and Spectral Response Function on 2-Band Enhanced Vegetation Index (EVI2) over Sentinel-2 and Landsat-8. ISPRS J. Photogramm. Remote Sens. 2023, 205, 206–226. [Google Scholar] [CrossRef]
- Arvor, D.; Jonathan, M.; Meirelles, M.S.P.; Dubreuil, V.; Durieux, L. Classification of MODIS EVI Time Series for Crop Mapping in the State of Mato Grosso, Brazil. Int. J. Remote Sens. 2011, 32, 7847–7871. [Google Scholar] [CrossRef]
- Kushwaha, S.P.S.; Kuntz, S.; Oesten, G. Applications of Image Texture in Forest Classification. Int. J. Remote Sens. 1994, 15, 2273–2284. [Google Scholar] [CrossRef]
- Mohanaiah, P.; Sathyanarayana, P.; GuruKumar, L. Image Texture Feature Extraction Using GLCM Approach. Int. J. Sci. Res. Publ. 2013, 3, 290–294. [Google Scholar]
- Abdikan, S.; Sanli, F.B.; Ustuner, M.; Calò, F. Land cover mapping using sentinel-1 SAR data. Int. Arch. Photogramm. Remote Sens. Spat. Inf. Sci. 2016, XLI-B7, 757–761. [Google Scholar] [CrossRef]
- Kuenzer, C.; Bluemel, A.; Gebhardt, S.; Quoc, T.V.; Dech, S. Remote Sensing of Mangrove Ecosystems: A Review. Remote Sens. 2011, 3, 878–928. [Google Scholar] [CrossRef]
- Skriver, H.; Mattia, F.; Satalino, G.; Balenzano, A.; Pauwels, V.R.N.; Verhoest, N.E.C.; Davidson, M. Crop Classification Using Short-Revisit Multitemporal SAR Data. IEEE J. Sel. Top. Appl. Earth Obs. Remote Sens. 2011, 4, 423–431. [Google Scholar] [CrossRef]
- Mercier, A.; Betbeder, J.; Rumiano, F.; Baudry, J.; Gond, V.; Blanc, L.; Bourgoin, C.; Cornu, G.; Ciudad, C.; Marchamalo, M. Evaluation of Sentinel-1 and 2 Time Series for Land Cover Classification of Forest–Agriculture Mosaics in Temperate and Tropical Landscapes. Remote Sens. 2019, 11, 979. [Google Scholar] [CrossRef]
- Amani, M.; Ghorbanian, A.; Ahmadi, S.A.; Kakooei, M.; Moghimi, A.; Mirmazloumi, S.M.; Moghaddam, S.H.A.; Mahdavi, S.; Ghahremanloo, M.; Parsian, S.; et al. Google Earth Engine Cloud Computing Platform for Remote Sensing Big Data Applications: A Comprehensive Review. IEEE J. Sel. Top. Appl. Earth Obs. Remote Sens. 2020, 13, 5326–5350. [Google Scholar] [CrossRef]
- Gorelick, N.; Hancher, M.; Dixon, M.; Ilyushchenko, S.; Thau, D.; Moore, R. Google Earth Engine: Planetary-Scale Geospatial Analysis for Everyone. Remote Sens. Environ. 2017, 202, 18–27. [Google Scholar] [CrossRef]
- Liu, X.; Zhai, H.; Shen, Y.; Lou, B.; Jiang, C.; Li, T.; Hussain, S.B.; Shen, G. Large-Scale Crop Mapping from Multisource Remote Sensing Images in Google Earth Engine. IEEE J. Sel. Top. Appl. Earth Obs. Remote Sens. 2020, 13, 414–427. [Google Scholar] [CrossRef]
- European Union, ESA, Copernicus. Available online: https://sentinel.esa.int/web/sentinel/copernicus (accessed on 21 October 2023).
- NASA, Landsat 8. Available online: https://landsat.gsfc.nasa.gov/satellites/landsat-8/ (accessed on 21 October 2023).
- Wu, L. Tarim River Basin Boundary Dataset (2000); National Tibetan Plateau/Third Pole Environment Data Center: Beijing, China, 2014. [Google Scholar]
- Liu, L.; Zhang, X. 2020 Global 30-Meter Land Cover Fine Classification Product V1.0; Aerospace Information Research Institute, Chinese Academy of Sciences: Beijing, China, 2021. [Google Scholar] [CrossRef]
- Xu, H. Modification of Normalised Difference Water Index (NDWI) to Enhance Open Water Features in Remotely Sensed Imagery. Int. J. Remote Sens. 2006, 27, 3025–3033. [Google Scholar] [CrossRef]
- Jones, H.G.; Vaughan, R.A. Remote Sensing of Vegetation: Principles, Techniques, and Applications; Oxford University Press: Oxford, UK, 2010. [Google Scholar]
- Bai, B.; Tan, Y.; Donchyts, G.; Haag, A.; Weerts, A. A Simple Spatio–Temporal Data Fusion Method Based on Linear Regression Coefficient Compensation. Remote Sens. 2020, 12, 3900. [Google Scholar] [CrossRef]
- Wang, Q.; Blackburn, G.A.; Onojeghuo, A.O.; Dash, J.; Zhou, L.; Zhang, Y.; Atkinson, P.M. Fusion of Landsat 8 OLI and Sentinel-2 MSI Data. IEEE Trans. Geosci. Remote Sens. 2017, 55, 3885–3899. [Google Scholar] [CrossRef]
- Cao, R.; Chen, Y.; Shen, M.; Chen, J.; Zhou, J.; Wang, C.; Yang, W. A Simple Method to Improve the Quality of NDVI Time-Series Data by Integrating Spatiotemporal Information with the Savitzky-Golay Filter. Remote Sens. Environ. 2018, 217, 244–257. [Google Scholar] [CrossRef]
- Zhu, W.; He, B.; Xie, Z.; Zhao, C.; Zhuang, H.; Li, P. Reconstruction of Vegetation Index Time Series Based on Self-Weighting Function Fitting from Curve Features. Remote Sens. 2022, 14, 2247. [Google Scholar] [CrossRef]
- Savitzky, A.; Golay, M.J.E. Smoothing and Differentiation of Data by Simplified Least Squares Procedures. Anal. Chem. 1964, 36, 1627–1639. [Google Scholar] [CrossRef]
- Zhou, J.; Jia, L.; Menenti, M. Reconstruction of Global MODIS NDVI Time Series: Performance of Harmonic ANalysis of Time Series (HANTS). Remote Sens. Environ. 2015, 163, 217–228. [Google Scholar] [CrossRef]
- Atzberger, C.; Eilers, P.H.C. Evaluating the Effectiveness of Smoothing Algorithms in the Absence of Ground Reference Measurements. Int. J. Remote Sens. 2011, 32, 3689–3709. [Google Scholar] [CrossRef]
- Menenti, M.; Azzali, S.; Verhoef, W.; van Swol, R. Mapping Agroecological Zones and Time Lag in Vegetation Growth by Means of Fourier Analysis of Time Series of NDVI Images. Adv. Space Res. 1993, 13, 233–237. [Google Scholar] [CrossRef]
- Descals, A.; Verger, A.; Yin, G.; Peñuelas, J. Improved Estimates of Arctic Land Surface Phenology Using Sentinel-2 Time Series. Remote Sens. 2020, 12, 3738. [Google Scholar] [CrossRef]
- Bolton, D.K.; Gray, J.M.; Melaas, E.K.; Moon, M.; Eklundh, L.; Friedl, M.A. Continental-Scale Land Surface Phenology from Harmonized Landsat 8 and Sentinel-2 Imagery. Remote Sens. Environ. 2020, 240, 111685. [Google Scholar] [CrossRef]
- Breiman, L. Random Forests. Mach. Learn. 2001, 45, 5–32. [Google Scholar] [CrossRef]
- Pal, M. Random Forest Classifier for Remote Sensing Classification. Int. J. Remote Sens. 2005, 26, 217–222. [Google Scholar] [CrossRef]
- Tatsumi, K.; Yamashiki, Y.; Canales Torres, M.A.; Taipe, C.L.R. Crop Classification of Upland Fields Using Random Forest of Time-Series Landsat 7 ETM+ Data. Comput. Electron. Agric. 2015, 115, 171–179. [Google Scholar] [CrossRef]
- Xu, H. A Study on Information Extraction of Water Body with the Modified Normalized Difference Water Index (MNDWI). Natl. Remote Sens. Bull. 2005, 5, 589–595. [Google Scholar] [CrossRef]
- Tucker, C.J. Red and Photographic Infrared Linear Combinations for Monitoring Vegetation. Remote Sens. Environ. 1979, 8, 127–150. [Google Scholar] [CrossRef]
- Wang, C.; Chen, J.; Wu, J.; Tang, Y.; Shi, P.; Black, T.A.; Zhu, K. A Snow-Free Vegetation Index for Improved Monitoring of Vegetation Spring Green-up Date in Deciduous Ecosystems. Remote Sens. Environ. 2017, 196, 1–12. [Google Scholar] [CrossRef]
- Frampton, W.J.; Dash, J.; Watmough, G.; Milton, E.J. Evaluating the Capabilities of Sentinel-2 for Quantitative Estimation of Biophysical Variables in Vegetation. ISPRS J. Photogramm. Remote Sens. 2013, 82, 83–92. [Google Scholar] [CrossRef]
- Gitelson, A.A.; Gritz, Y.; Merzlyak, M.N. Relationships between Leaf Chlorophyll Content and Spectral Reflectance and Algorithms for Non-Destructive Chlorophyll Assessment in Higher Plant Leaves. J. Plant Physiol. 2003, 160, 271–282. [Google Scholar] [CrossRef] [PubMed]
- Merzlyak, M.N.; Gitelson, A.A.; Chivkunova, O.B.; Rakitin, V.Y. Non-destructive Optical Detection of Pigment Changes during Leaf Senescence and Fruit Ripening. Physiol. Plant. 1999, 106, 135–141. [Google Scholar] [CrossRef]
- Huete, A.; Didan, K.; Miura, T.; Rodriguez, E.P.; Gao, X.; Ferreira, L.G. Overview of the Radiometric and Biophysical Performance of the MODIS Vegetation Indices. Remote Sens. Environ. 2002, 83, 195–213. [Google Scholar] [CrossRef]
- Liu, C.; Frazier, P.; Kumar, L. Comparative Assessment of the Measures of Thematic Classification Accuracy. Remote Sens. Environ. 2007, 107, 606–616. [Google Scholar] [CrossRef]
- Olofsson, P.; Foody, G.M.; Stehman, S.V.; Woodcock, C.E. Making Better Use of Accuracy Data in Land Change Studies: Estimating Accuracy and Area and Quantifying Uncertainty Using Stratified Estimation. Remote Sens. Environ. 2013, 129, 122–131. [Google Scholar] [CrossRef]
- Masemola, C.; Cho, M.A.; Ramoelo, A. Sentinel-2 Time Series Based Optimal Features and Time Window for Mapping Invasive Australian Native Acacia Species in KwaZulu Natal, South Africa. Int. J. Appl. Earth Obs. Geoinf. 2020, 93, 102207. [Google Scholar] [CrossRef]
- Han, L.; Wang, H.; Zhou, Z.; Li, Z. Spatial Distribution Pattern and Dynamics of the Primary Population in a Natural Populus Euphratica Forest in Tarim Basin, Xinjiang, China. Front. For. China 2008, 3, 456–461. [Google Scholar] [CrossRef]
Disclaimer/Publisher’s Note: The statements, opinions and data contained in all publications are solely those of the individual author(s) and contributor(s) and not of MDPI and/or the editor(s). MDPI and/or the editor(s) disclaim responsibility for any injury to people or property resulting from any ideas, methods, instructions or products referred to in the content. |
© 2024 by the authors. Licensee MDPI, Basel, Switzerland. This article is an open access article distributed under the terms and conditions of the Creative Commons Attribution (CC BY) license (https://creativecommons.org/licenses/by/4.0/).