Abstract
The accuracy and reliability of soil moisture retrieval based on Global Positioning System (GPS) single-star Signal-to-Noise Ratio (SNR) data is low due to the influence of spatial and temporal differences of different satellites. Therefore, this paper proposes a Random Forest (RF)-based multi-satellite data fusion Global Navigation Satellite System Interferometric Reflectometry (GNSS-IR) soil moisture retrieval method, which utilizes the RF Model’s Mean Decrease Impurity (MDI) algorithm to adaptively assign arc weights to fuse all available satellite data to obtain accurate retrieval results. Subsequently, the effectiveness of the proposed method was validated using GPS data from the Plate Boundary Observatory (PBO) network sites P041 and P037, as well as data collected in Lamasquere, France. A Support Vector Machine model (SVM), Radial Basis Function (RBF) neural network model, and Convolutional Neural Network model (CNN) are introduced for the comparison of accuracy. The results indicated that the proposed method had the best retrieval performance, with Root Mean Square Error (RMSE) values of 0.032, 0.028, and 0.003 cm3/cm3, Mean Absolute Error (MAE) values of 0.025, 0.022, and 0.002 cm3/cm3, and correlation coefficients (R) of 0.94, 0.95, and 0.98, respectively, at the three sites. Therefore, the proposed soil moisture retrieval model demonstrates strong robustness and generalization capabilities, providing a reference for achieving high-precision, real-time monitoring of soil moisture.
1. Introduction
Near-surface Soil Moisture Content (SMC) has long been a focal point in climate and land-atmosphere studies, playing a significant role in climate meteorology forecasting, flood disaster prediction, and water resource cycling research [1,2]. Consequently, the development of accurate and efficient soil moisture retrieval methods has emerged as a critical area of research. In recent years, as studies and applications of the Global Navigation Satellite System (GNSS) have advanced, the advent of GNSS Interferometric Reflectometry (GNSS-IR) technology has provided a novel approach to obtaining soil moisture data [3,4,5].
The GNSS-IR technique enables the measurement of station environmental parameters and their variations by utilizing the interference that occurs when satellites’ direct and reflected signals are superimposed on a single antenna. Since Larson and colleagues first demonstrated a strong correlation between soil moisture and the amplitude and phase characteristics in the SNR data of GPS-reflected signals [4], numerous researchers have extensively explored the utilization of GNSS-IR technology for the retrieval of soil moisture. Zavorotny and colleagues estimated soil moisture using phase delay, and their experimental results indicated that its correlation was more stable than that of amplitude [6]. Subsequently, Chew et al. conducted further experiments and discovered a clear linear relationship between the initial phase of the reflected signal and surface soil moisture under bare soil conditions [7]. In recent years, the application of machine learning models for soil moisture monitoring has prompted many scholars to enhance the accuracy of soil moisture retrieval models using machine learning algorithms. Li et al. utilized the Helmert variance component estimation (HVCE) method to integrate weights of dual-frequency carrier phases, and they established soil moisture retrieval models using both linear and machine learning approaches. The results indicated that the integration of dual-frequency data through the HVCE method significantly improves the retrieval accuracy for single satellite data, and the machine learning model demonstrated superior performance compared to the linear model [8]. Subsequently, to validate the performance of other machine learning models in soil moisture retrieval, Sun et al. developed a soil moisture retrieval model based on a Support Vector Machine (SVM) and employed a genetic algorithm to automatically determine the optimal model parameters, thereby maximizing model performance [9]. Liang et al. constructed a phase correction model to mitigate environmental effects and used a BP neural network model for soil moisture retrieval, which enhanced the accuracy of single satellite data [10]. All of the above studies are based on machine learning models combined with single-star data to retrieve soil moisture, however, during the observation process, there are spatial and temporal differences between different satellites, which leads to low robustness of the single-star-based retrieval results. For this reason, many scholars have carried out research on the method of soil moisture retrieval using multi-satellite fusion data. Ren et al. established a soil moisture retrieval model based on a multi-satellite fusion least squares support vector machine, and compared and analyzed the accuracy of soil moisture retrieval using single and multiple GNSS satellites, and the results showed that the multi-satellite fusion model performed better than the single-satellite model [11]. Subsequently, due to the influence of environmental and other factors, the effectiveness of the bare soil-based retrieval algorithm will be reduced, and Xian et al. proposed a multi-feature soil moisture retrieval method based on multilayer perceptron (MLP), which synthesized a variety of factors and excluded part of the anomalous satellite data by setting a threshold to control the quality of the data, and then the MLP was used to establish a multi-satellite fusion retrieval model, and the results showed that the accuracy of the proposed model was better than the linear model [12]. In summary, the existing studies have achieved good results in satellite selection and soil moisture retrieval model construction, however, these results have a common problem, that is, a large number of manual interventions are needed in the experimental process to attenuate the instability of the retrieval accuracy caused by different satellite data.
Aimed at the above problems, this study proposes a new method for retrieval of soil moisture based on the fusion of multi-satellite data with Random Forest. Based on the conventional GNSS-IR soil moisture retrieval algorithm, the MDI algorithm is introduced to adaptively assign the weights of different satellite data to establish a soil moisture retrieval model with better data utilization and robustness. Subsequently, the 2012 and 2017 datasets of the U.S. Plate Boundary Observatory (PBO) network site P041 and P037 were used to validate the effectiveness of the proposed model for soil moisture retrieval, and the accuracy of the proposed model was verified by comparing and analyzing the Support Vector Machines (SVM), Radial Basis Function (RBF) Neural Networks, and Convolutional Neural Network (CNN) models.
2. Methodology
2.1. GNSS-IR Soil Moisture-Detection Principle
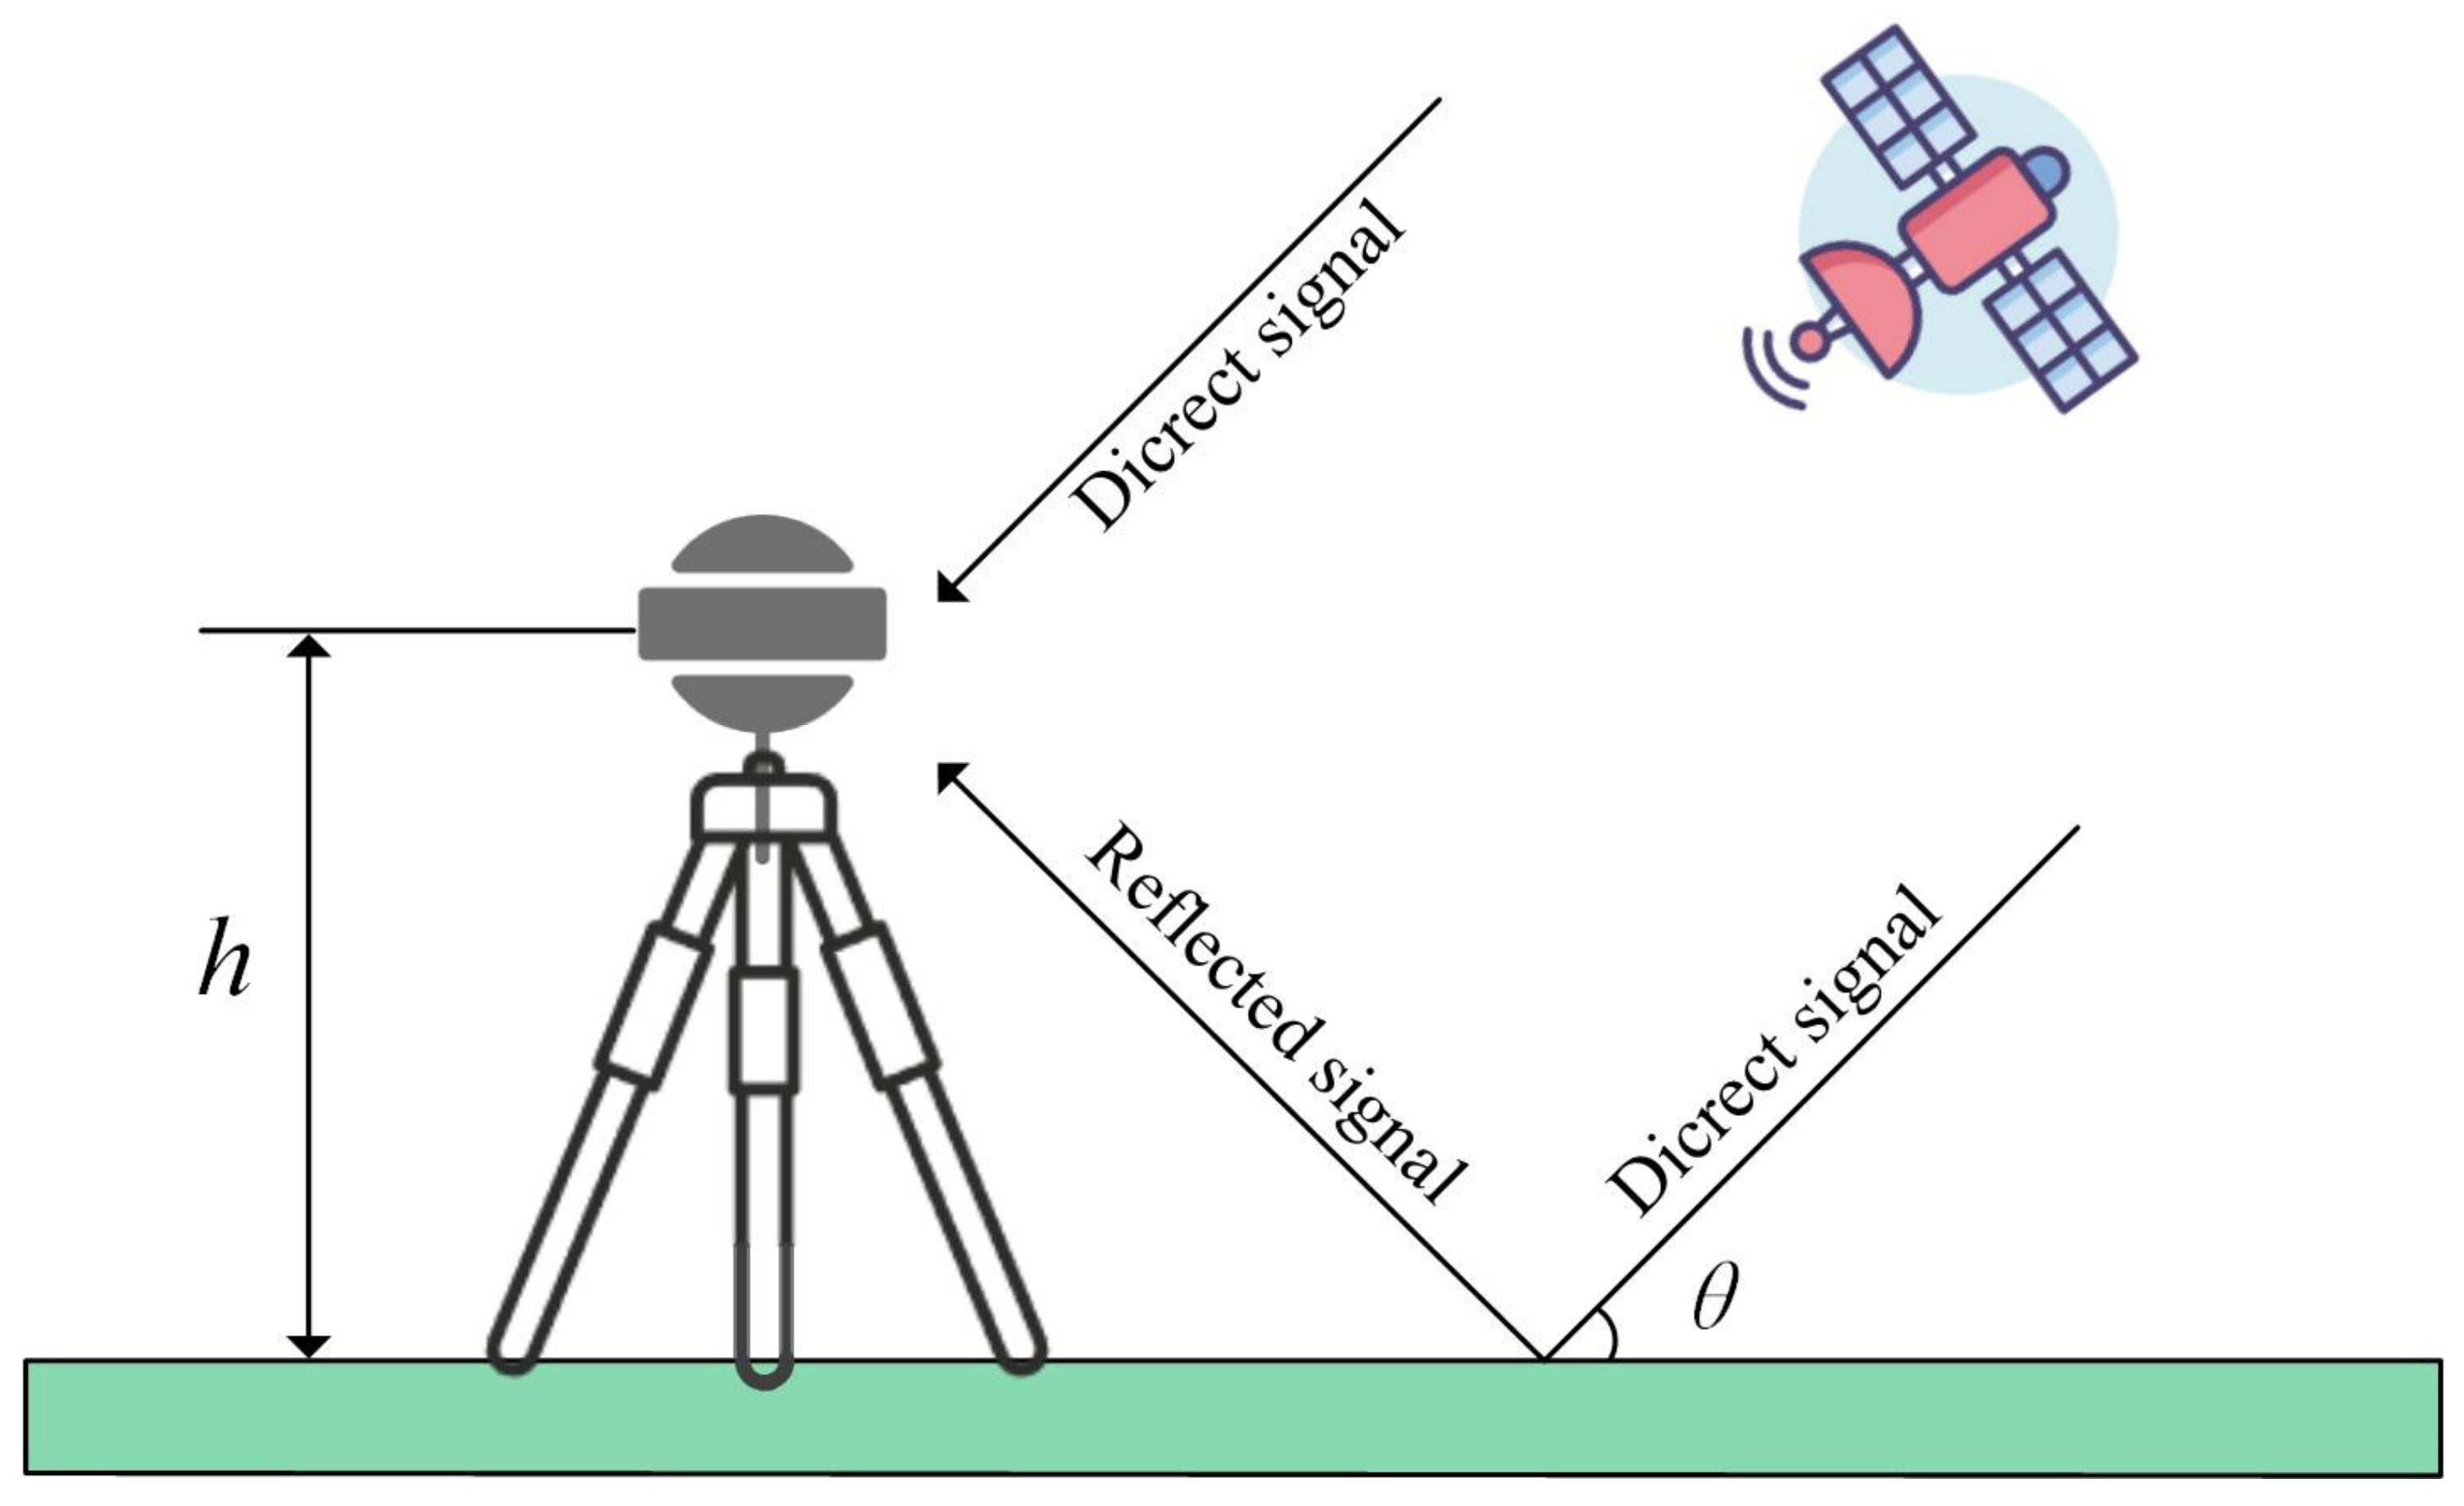
Due to the multipath effect, the receiver antenna will simultaneously receive the direct signal and the reflected signal, and produce a certain phase difference between the two—the geometric relationship is shown in Figure 1. In the Figure, h represents the height of the phase center of the GNSS receiving antenna relative to the reflective surface, and θ represents the satellite altitude angle.
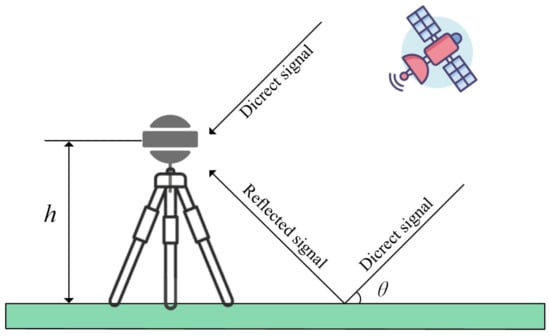
Figure 1.
Schematic diagram of GNSS-IR interference. h is the distance of the phase center of the GNSS receiving antenna from the ground and θ is the satellite altitude angle.
The direct and reflected signal components are superimposed and interfered with to form a composite signal. In a simplified model, the composite SNR generated by the direct signal plus multipath reflection can be represented by the following equation [4,13]:
in the equation above, Ad and Am represent the amplitudes of the direct and reflected signals from the satellite, respectively, while φ represents the phase difference between the direct and reflected signals. Before extracting characteristic parameters, the direct signal component in the original SNR data is removed by performing a low-order polynomial fit to the composite SNR data. The multipath reflected signal dSNR after removing the direct signal component can be expressed as [14]:
in the equation, h represents the height of the phase center of the GNSS receiving antenna relative to the reflective surface, θ is the satellite elevation angle, and λ is the wavelength of the GNSS signal. Am denotes the amplitude characteristic parameter, and φm is the phase characteristic parameter. Setting t = sinθ and f = 2h/λ, Equation (2) can be further simplified to:
Subsequently, Lomb-Scargle spectral analysis (LSP) was utilized to extract the frequency value f of individual SNR sequences, and the dSNR data were non-linearly least-squares fitted according to the cosine function relationship given in Equation (3) to obtain the characteristic parameters such as frequency, amplitude, and phase [15]. It has been shown that there is a strong correlation between phase and soil moisture, and this study focuses on the phase characteristic parameter data for soil moisture retrieval [7].
2.2. Principles of MDI-Based Random Forest Retrieval
The Random Forest (RF) model is a potent machine learning method [16], extensively utilized for classification and regression tasks. It represents a form of ensemble learning that improves the accuracy and stability of predictions by combining multiple decision trees. During the modeling process, the bootstrap sampling method is employed to select multiple satellites from all available satellite data to construct several sample sets, thereby reducing the risk of data overfitting. Subsequently, a specified number of decision trees are generated, and the results predicted by these trees are integrated to form a more robust prediction outcome [17,18].
The decision tree is a supervised learning algorithm, the sample set of the decision tree is randomly selected from all visible satellite arcs with the put-back by bootstrap sampling method as the sample set so that all satellite arcs have the chance to appear multiple times in the training set of the same tree. The satellite data that are not selected as the training set are called “out-of-bag” (OOB) data, and the prediction of each tree on its OOB samples can be used to evaluate the error of this tree, which is equivalent to a built-in cross-validation process. During the training process of the decision tree, the sample set is divided into subsets by selecting the satellite arc segments that maximize the reduction of impurity as the optimal segmentation points until the stopping condition is satisfied. Finally, the decision tree makes predictions based on the tree structure constructed during the training process.
The Mean Decrease in Impurity (MDI) algorithm is a feature selection method used to identify the optimal splitting feature during the node splitting process in decision trees. In regression problems, the Mean Squared Error (MSE) is commonly employed as a measure of impurity. MSE reflects the dispersion of samples within a node, i.e., the average difference between predicted values and actual values. For a node containing N samples, where the target variable is denoted as yi (i = 1, 2, …, N), the mean squared error of the node is defined as follows:
herein, represents the mean value of the target variable for all samples within the node. During the model training process, the model randomly selects a subset of features from the sample set as candidate splitting features, enhancing the model’s diversity and generalization capability. For each candidate splitting feature, the model explores various split points within its range of values. For each potential split point, the original node is divided into a left node and a right node, with the MSE for the left and right nodes represented as MSEl and MSEr, respectively. The overall MSE after splitting, denoted as MSEs, is subsequently calculated as a weighted sum of MSEl and MSEr.
wherein, Nl denotes the number of samples in the left node, and Nr represents the number of samples in the right node. Subsequently, the decrease in impurity before and after the split, ΔMSE, also known as the mean decrease in impurity, is calculated as follows:
In the final step, from all the candidate segments and corresponding partition points, select the feature and partition point that maximizes the reduction in ΔMSE as the definitive partition choice for that node. This principle is used to split the nodes and construct the decision tree until the stopping conditions are met. Finally, the reductions in ΔMSE for each segment across all node splits are cumulatively added to determine the importance of each segment.
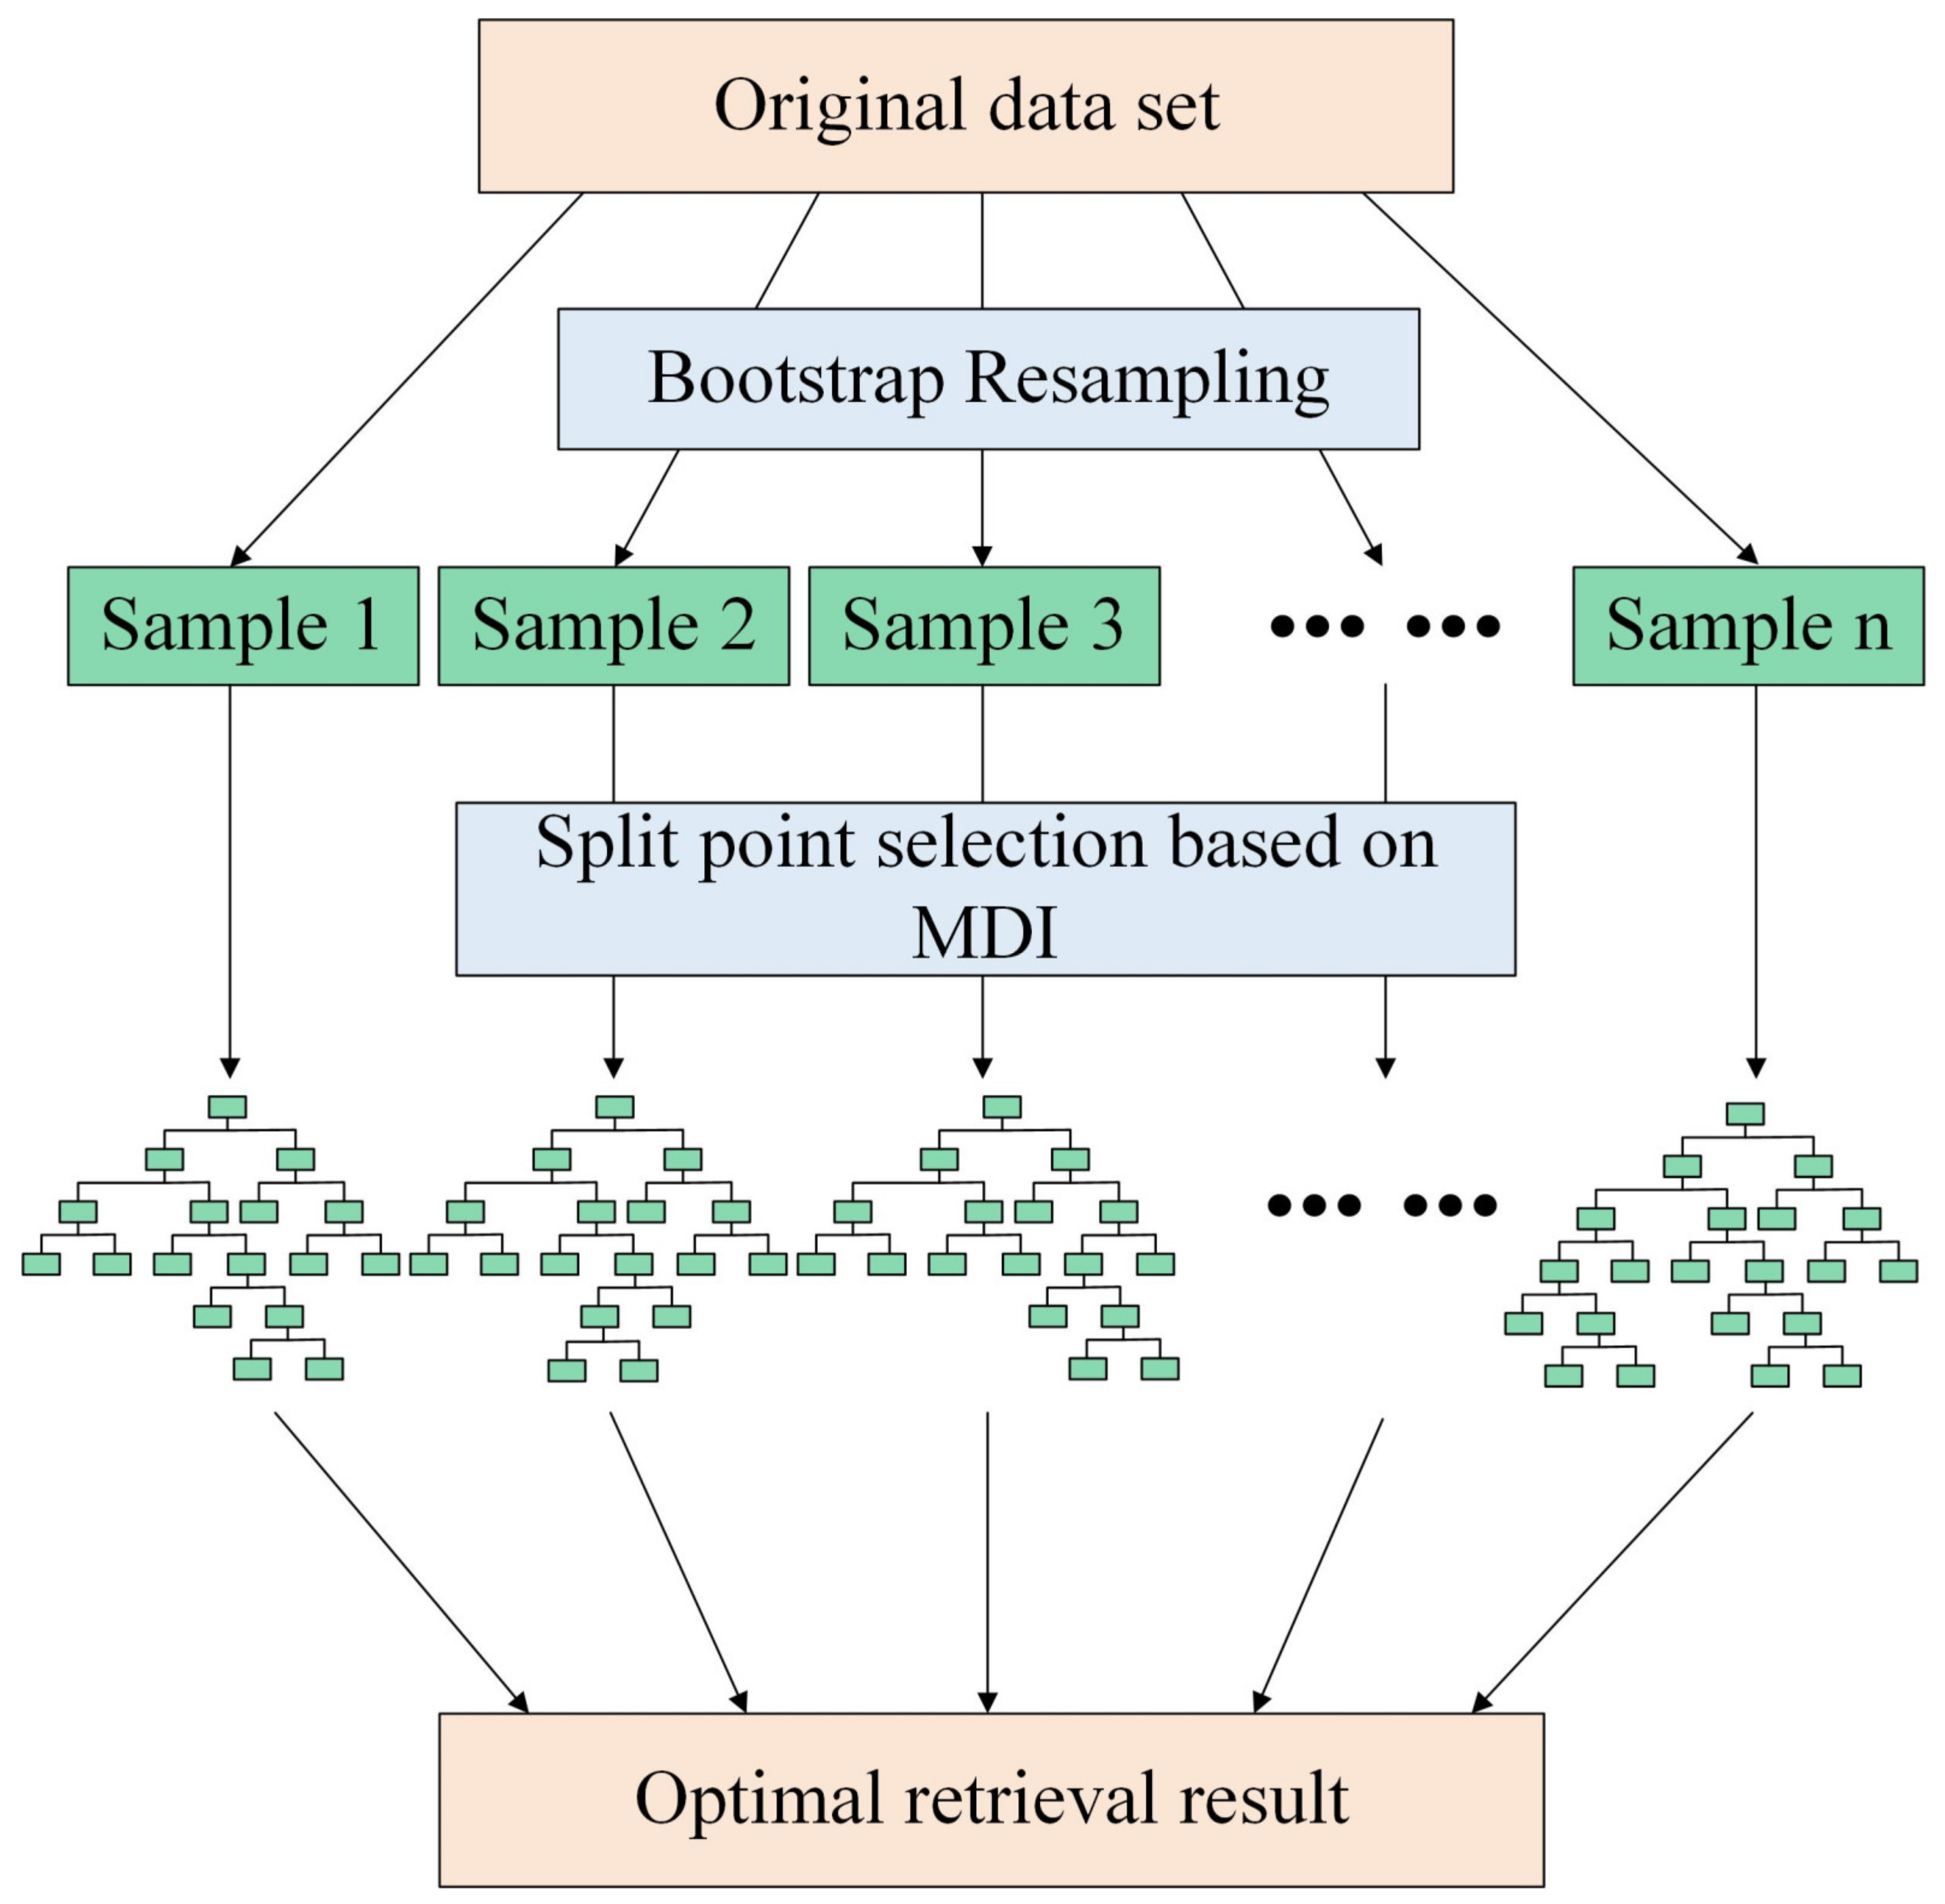
In summary, the Random Forest model is very suitable for soil moisture datasets with a large number of features, and because soil moisture yields a large number of real data, the Random Forest regression model was used in this experiment. The implementation process of the Random Forest regression model is shown in Figure 2.
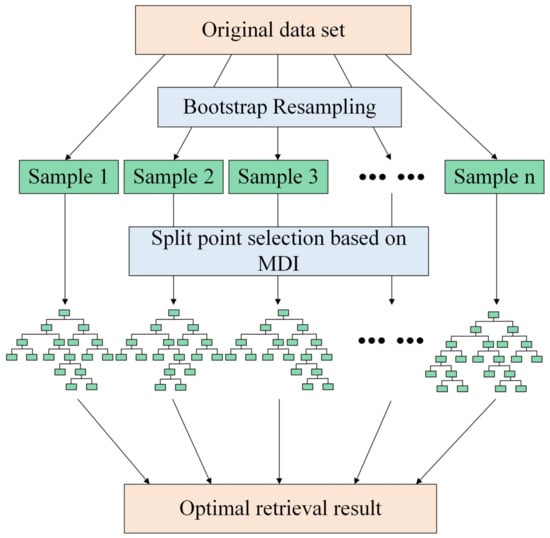
Figure 2.
Schematic diagram of the principle of Random Forest model.
Random Forest is an ensemble comprising multiple decision trees, denoted as {h(X;θm)}, where m = 1, 2, …, M, and θ represent independent and identically distributed random vectors, with X being the input variables. Y represents the output variable, forming an original dataset with X. The basic principle is as follows: Firstly, M sample subsets are extracted from the original dataset, where each subset’s data are randomly selected from the original dataset using bootstrap sampling methods. Secondly, for the sample subset, M decision tree regression models are constructed, yielding M regression prediction results. Finally, the average of these M prediction results is used as the final prediction outcome. The use of bootstrap sampling ensures that each sample subset within the Random Forest has some degree of variability, thereby enhancing the robustness and generalization capability of the entire regression model. After M rounds of model training, a sequence of regression prediction models {h(X;θ1), h(X;θ2), …, h(X;θM)} can be obtained, and then the final prediction results are as follows [16]:
The process of using the Random Forest regression algorithm for soil moisture retrieval is detailed next: If the satellite dataset comprises N samples, N samples are randomly selected using the bootstrap method, and M decision trees are grown. OOB data from each sample construction are used as the test sample for that decision tree. Suppose the original data contain p variables, several mtry variables (mtry << p) are specified at each node of the regression tree as candidate branching variables. The optimal branch is then selected according to the MDI algorithm. In Random Forest regression, mtry = P/3, each tree recursively branches from top to bottom, with the smallest scale node set as the condition to stop tree growth. A Random Forest model is established using M decision trees, and the average of the predictions from each tree provides the final prediction result.
2.3. Experimental Technical Scheme
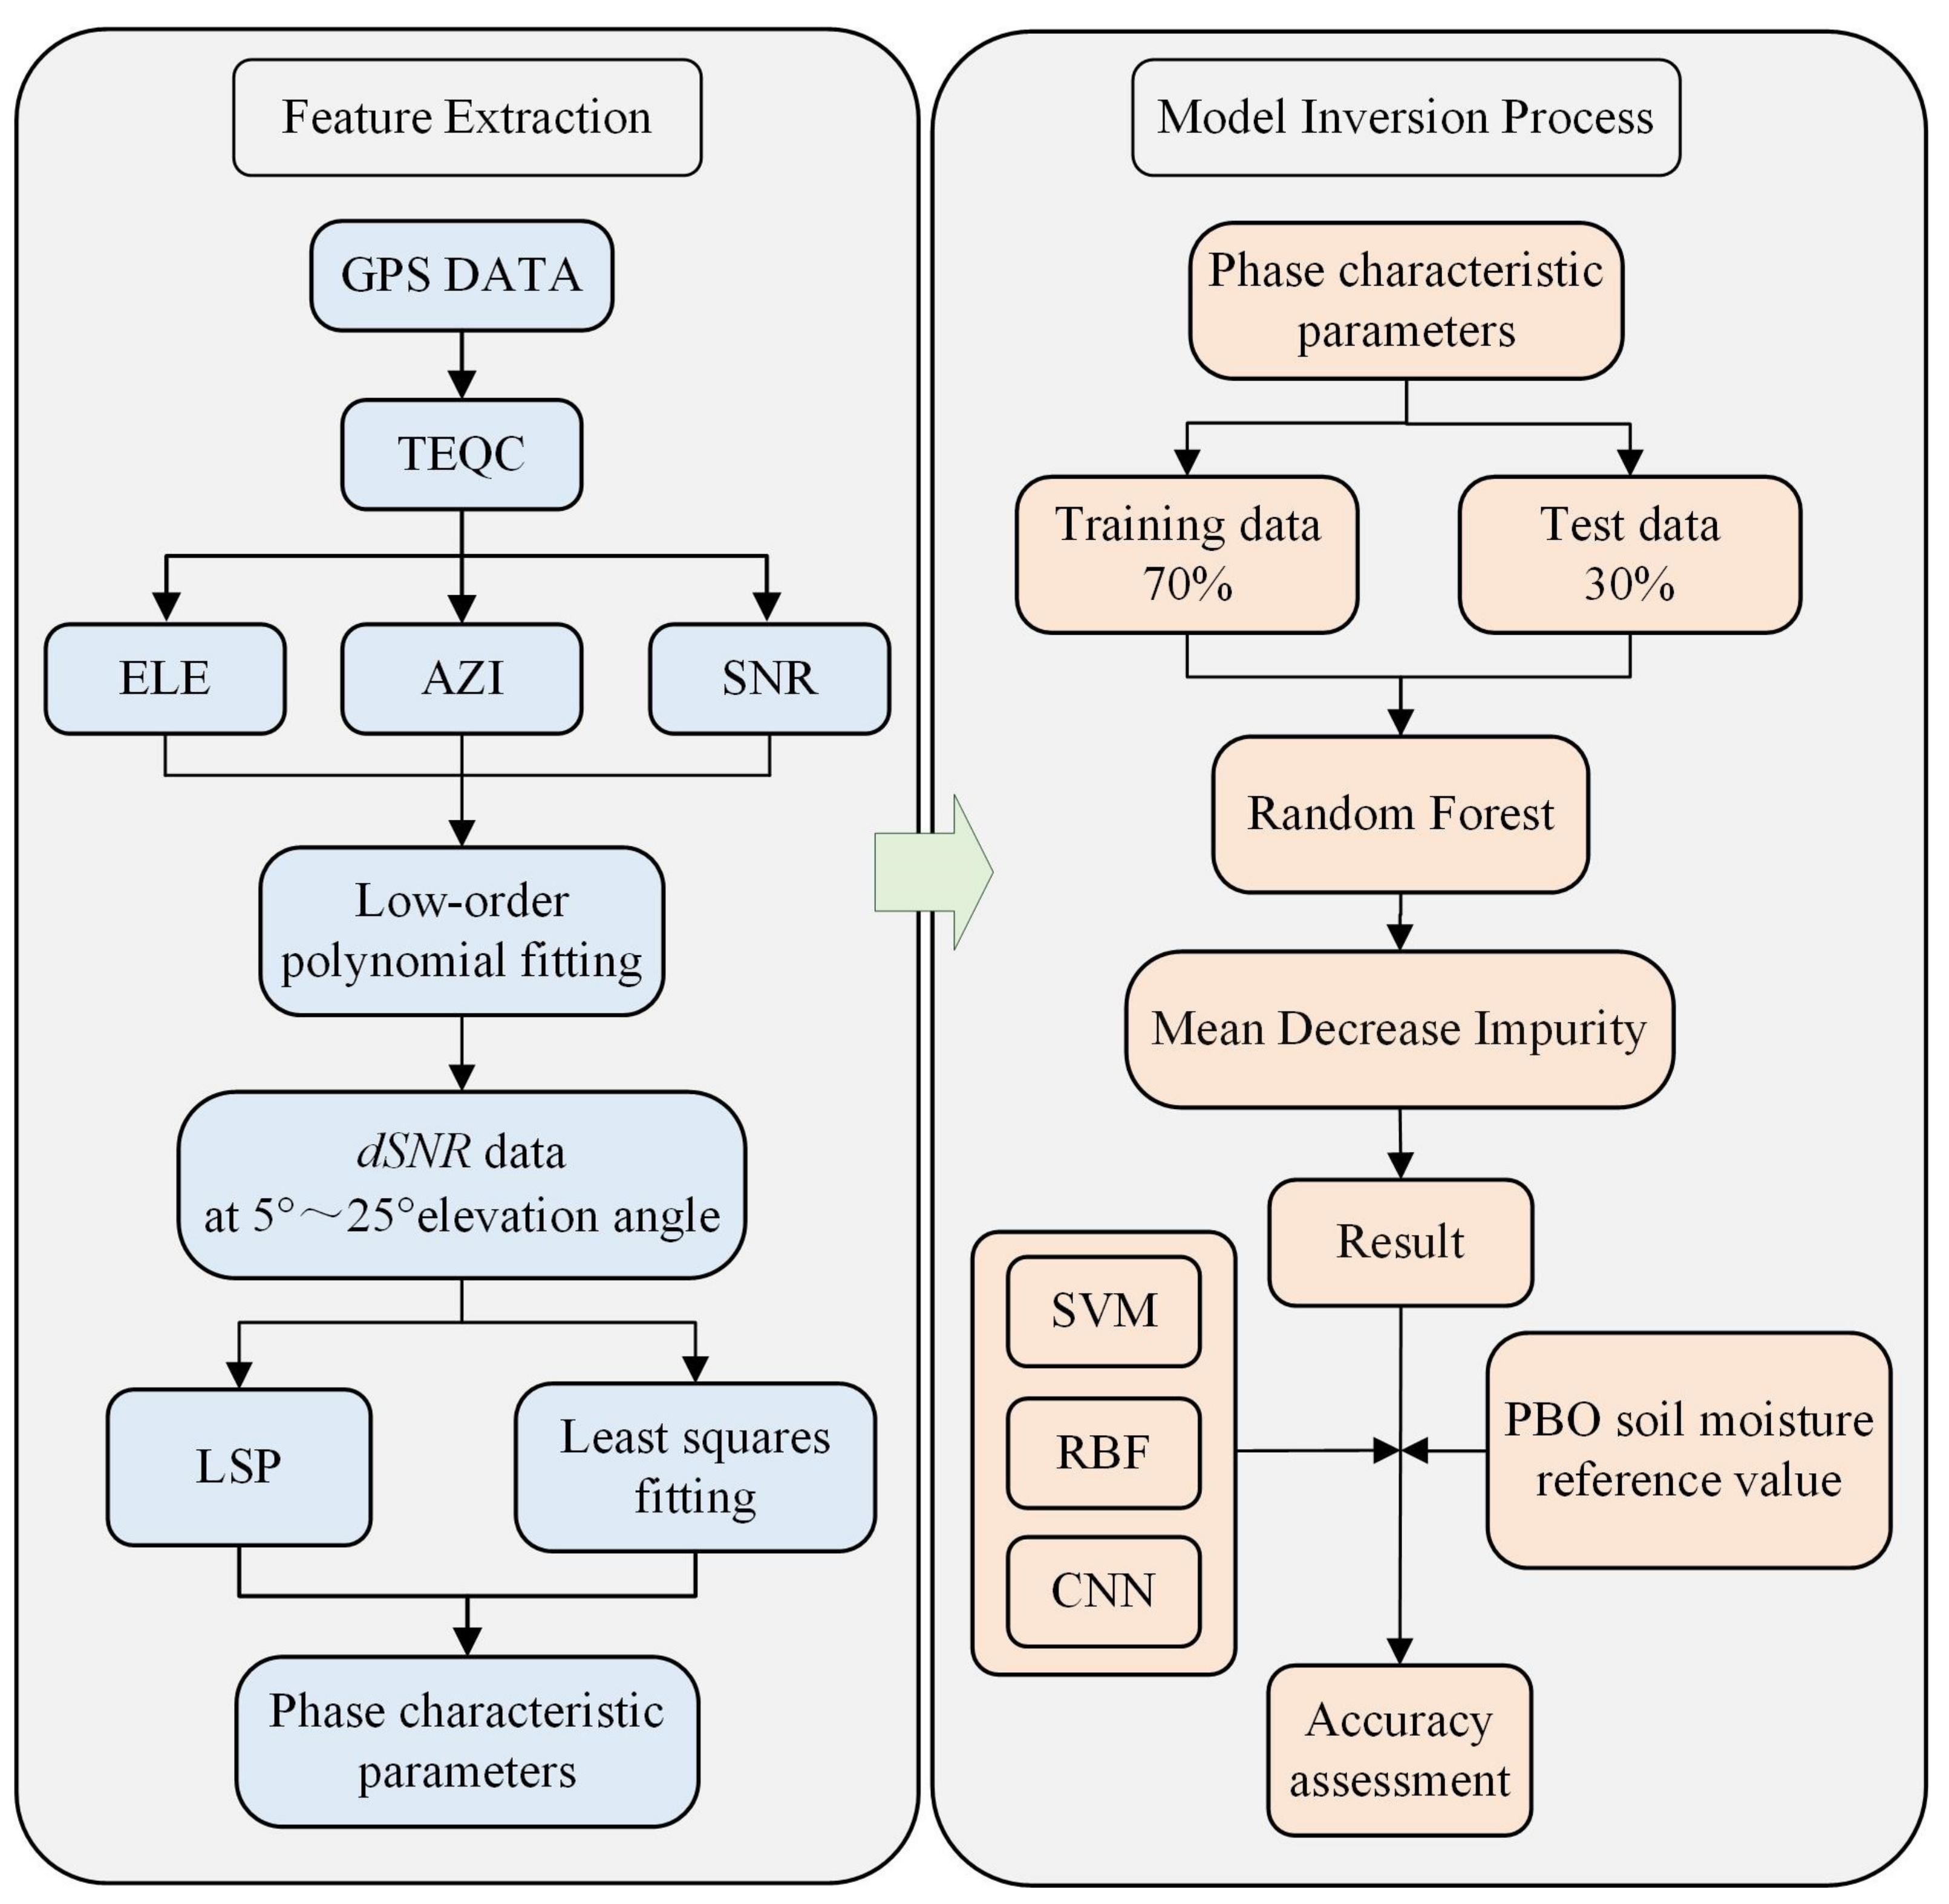
This study used the GNSS data preprocessing software TEQC (2019.5) to process the received satellite observation and navigation files to extract signal-to-noise ratio, elevation, and azimuth data. Specifically, daily SNR data for each satellite were segmented into individual ascending or descending arcs based on changes in elevation angle. Following the steps outlined in Section 2.1, data were preprocessed to obtain phase characteristic parameters for different arcs of each satellite. Ultimately, a soil moisture retrieval model based on Random Forest was established and validated against Support Vector Machine, RBF neural network, and Convolutional Neural Network models through comparative analysis. The specific experimental workflow is depicted in Figure 3.
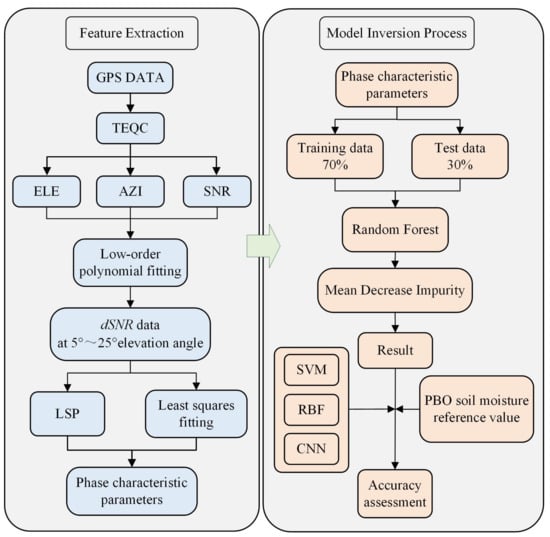
Figure 3.
Flow of Random Forest-based multi-satellite data fusion GNSS-IR soil moisture retrieval approach.
3. Overview of the Study Area
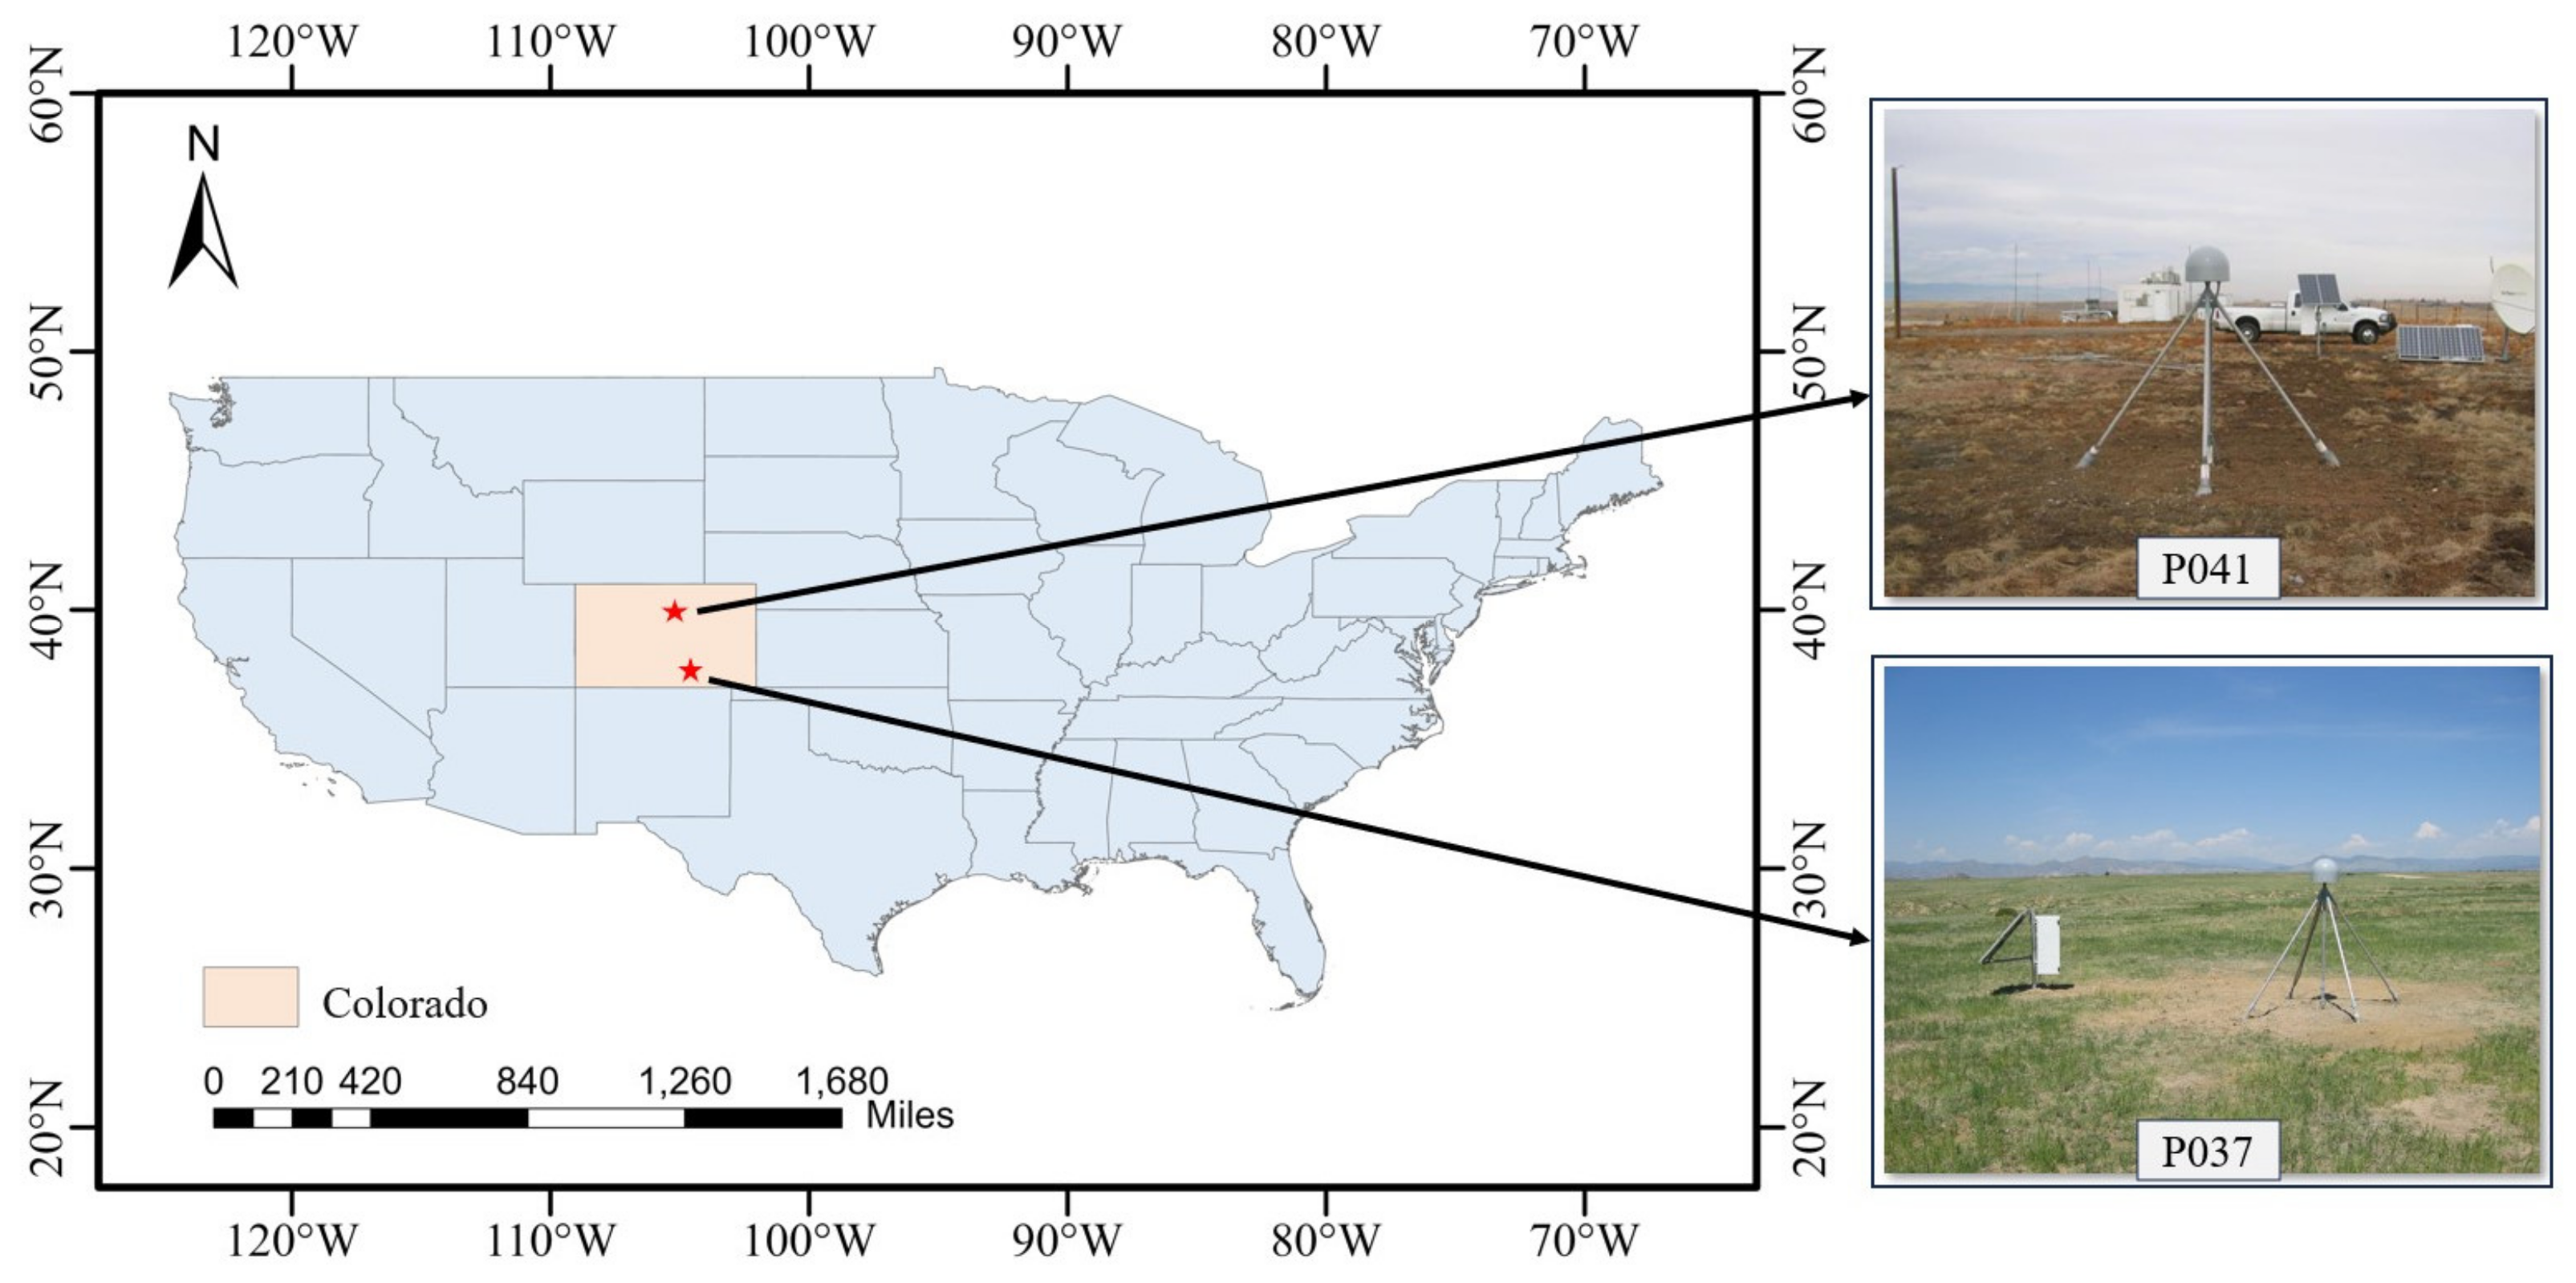
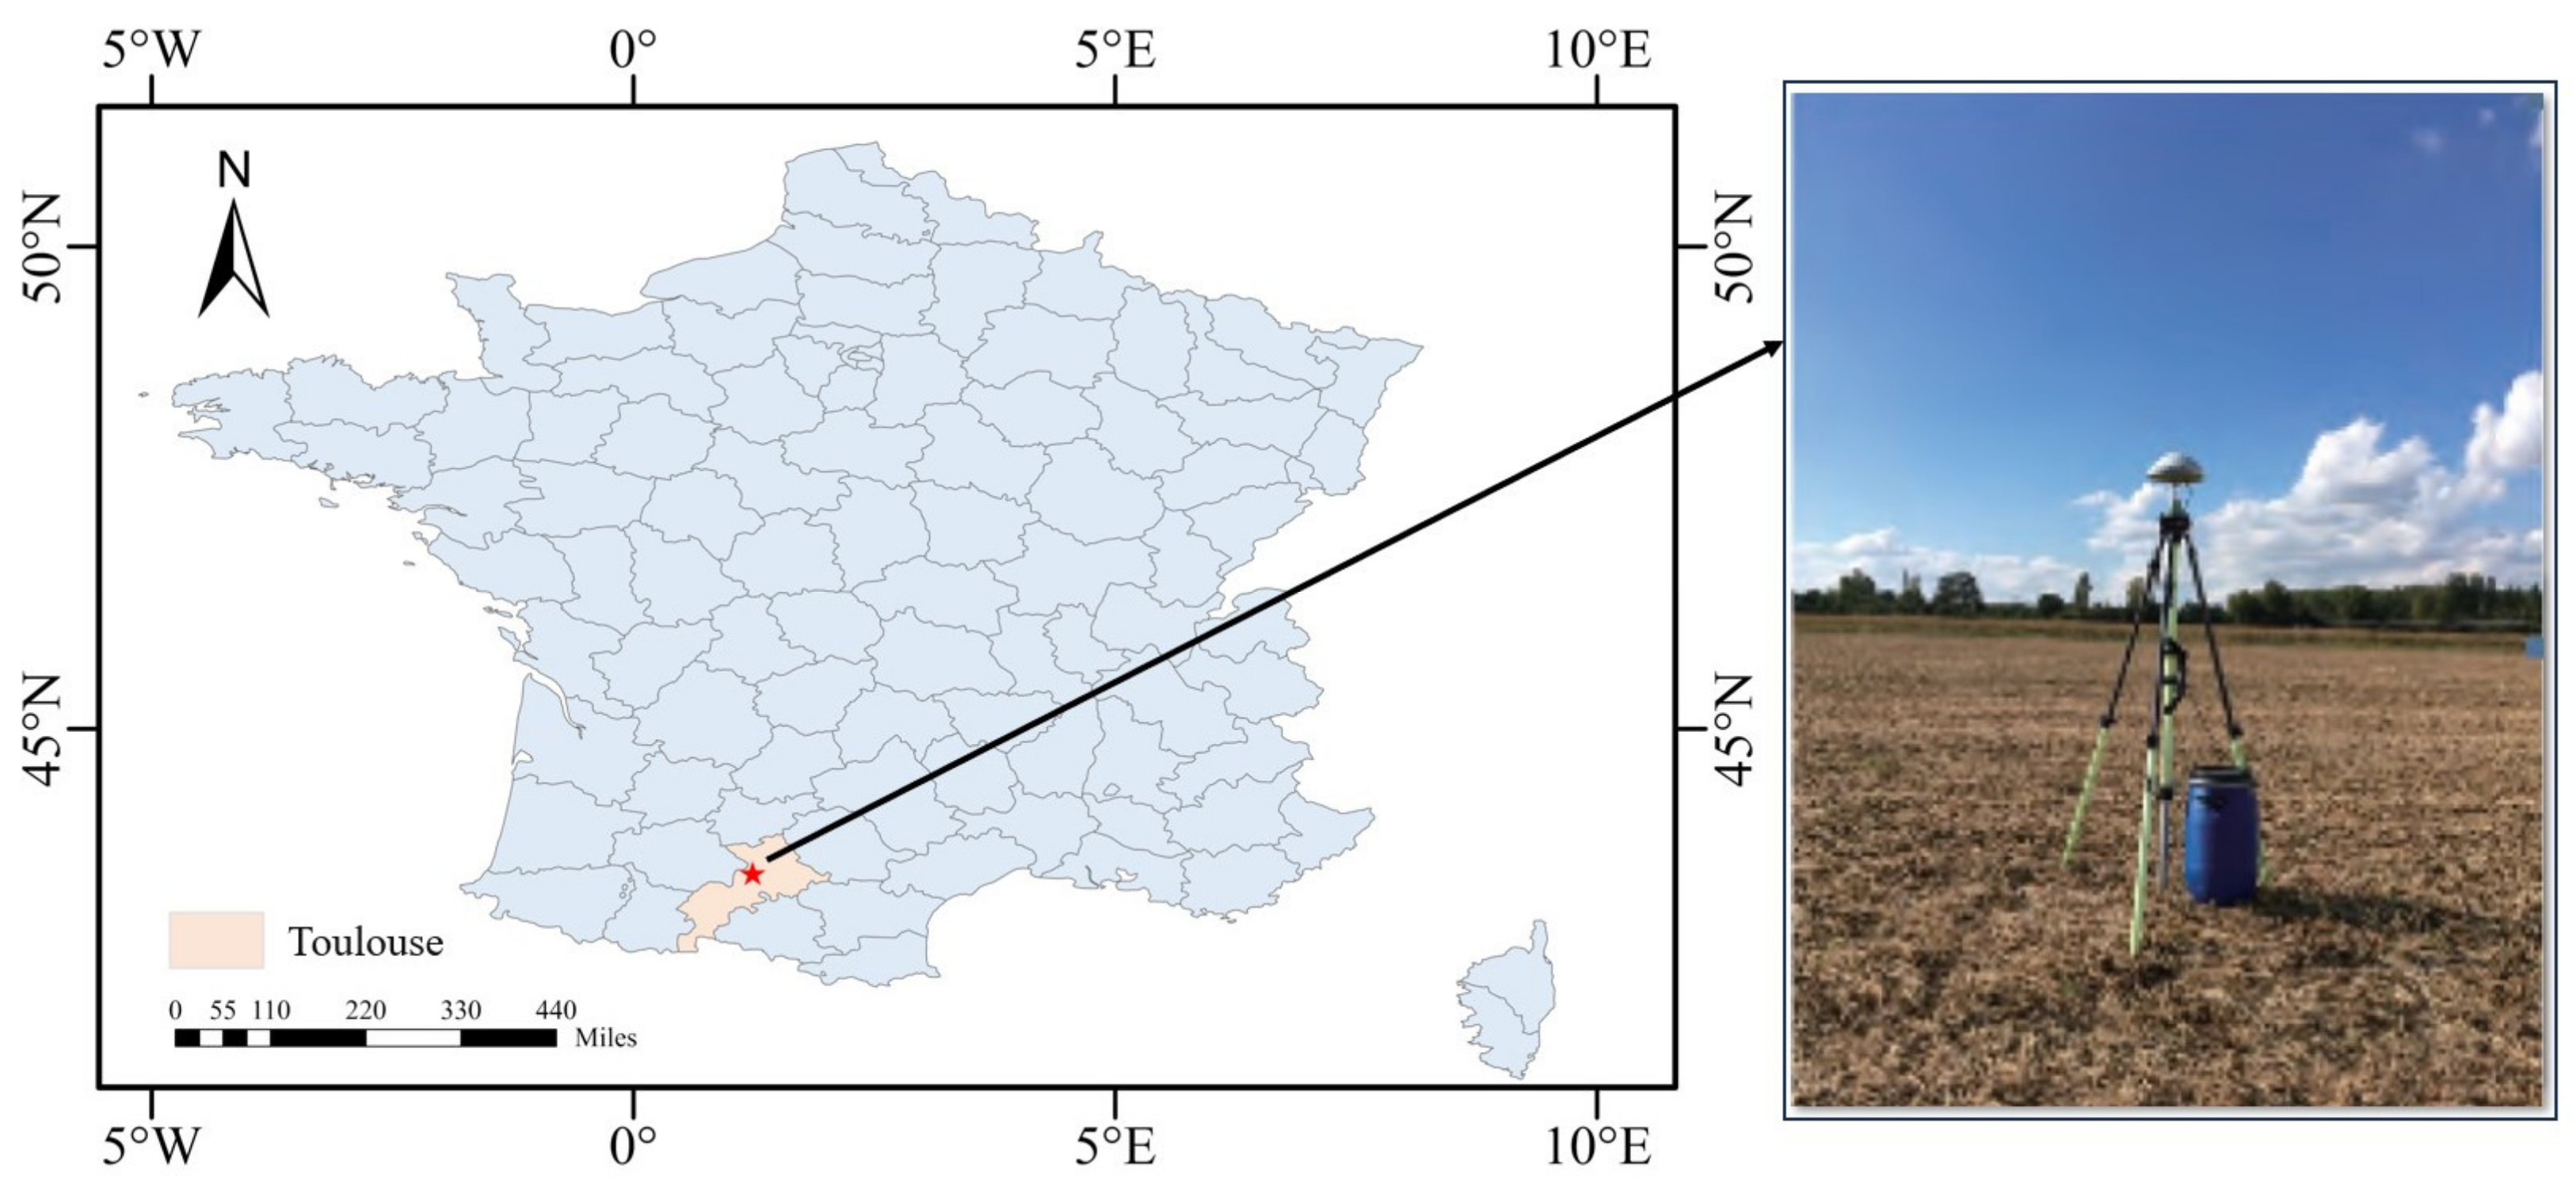
This research utilizes GNSS station data and soil moisture reference data provided by the Plate Boundary Observatory (PBO) for experimental analysis. These include data from station P041 (105.1943°W, 39.9495°N) for 2012 from day of year (DOY) 57 to 359, and from station P037 (105.10468°W, 38.42175°N) for 2017 from DOY 29 to 302. Additionally, the study also analyzes GPS data and in situ soil moisture data collected from Lamasquere (1.22891°E, 43.48734°N) in Toulouse, France, during DOY 35 to 80 in 2014. Data collected at Lamasquere, France, are hereafter referred to by proxy with the LM site. For the LM site, the reference data were collected from two ML3 Theta Probe soil moisture sensors placed approximately 2 m from the ground projection of the antenna phase center, with an accuracy of ±1%, at a depth of 5 cm, and a sampling interval of 10 min. The terrain around the experimental sites is flat and open, covered by low shrubs, with no significant obstacles, facilitating soil moisture retrieval experiments. Figure 4 is a schematic diagram of the surrounding environment of the research areas for the P041 and P037 stations. Figure 5 is a schematic diagram of the surrounding environment of the research area for the LM station.
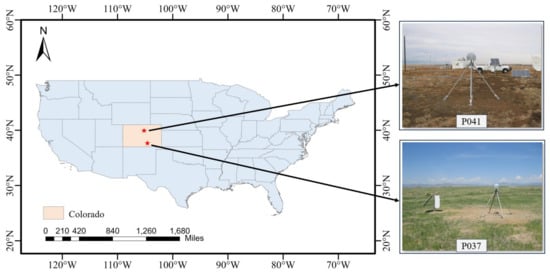
Figure 4.
Schematic of the location and surroundings of sites P041 and P037.
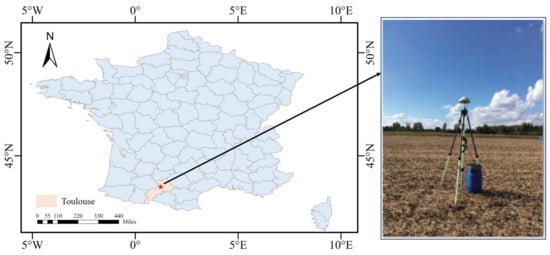
Figure 5.
Schematic of the location and surroundings of sites LM.
The sampling interval of the SNR data used in this study is 15 s. Since the multipath effect is more significant at lower satellite altitude angles, it produces a stronger interference effect at the receiver antenna [19,20,21]. For a single site, the first Fresnel zone (FFZ) can be used to determine the effective sensing area of the site [4]. Therefore, the L2-band SNR data in the range of 5°–25° elevation angle are used in this study.
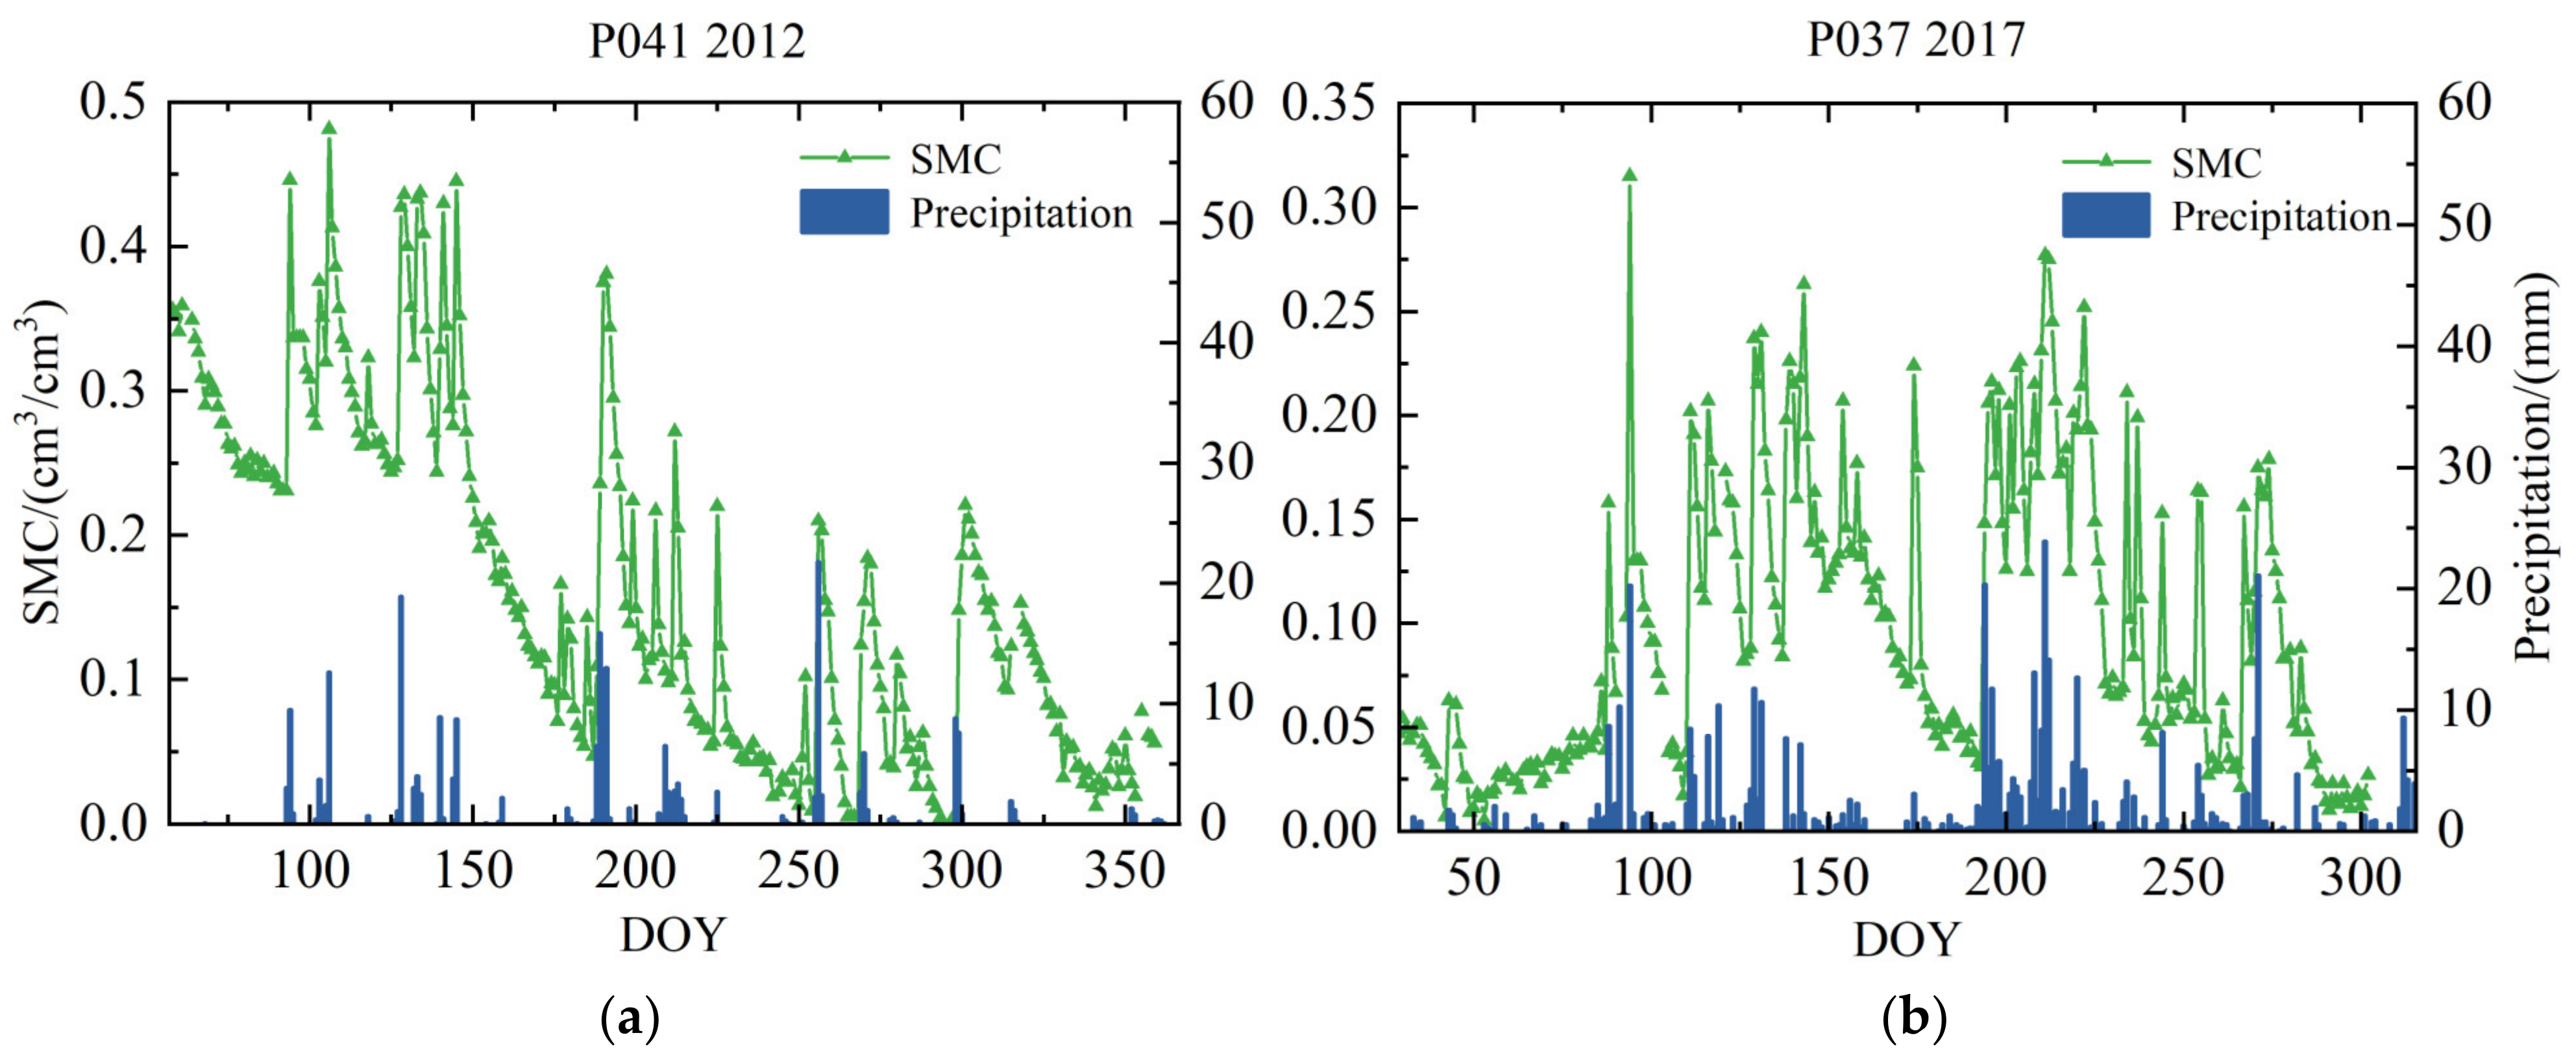
Figure 6 shows the observed SMC and precipitation data series for station P041 with a DOY of 57–359 in 2012 and station P037 with a DOY of 29–302 in 2017, which are presented in the form of line and bar charts, respectively. As shown in Figure 6, about 10 significant precipitation events occurred at station P041, and about 17 significant precipitation events occurred at station P037 during the test period. During precipitation events, SMC increased significantly, and continuous precipitation resulted in a significant non-linear increase in SMC, which tended to decrease as precipitation decreased or ceased. It can be seen that precipitation is the primary factor causing sudden changes in SMC. The data selection intervals of the two sites contain rich information on rainfall and soil moisture changes, which is suitable for soil moisture research and analysis.
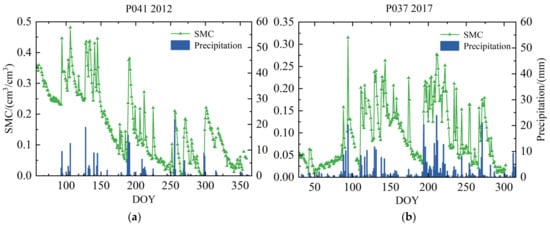
Figure 6.
(a) Variation curve of DOY 57–59 soil moisture with rainfall histogram in 2012 at P041; (b) variation curve of soil moisture with rainfall histogram for DOY 29–302 in 2017 at station P037.
4. Results
4.1. Experimental Methods and Results
To verify the feasibility and effectiveness of the soil moisture retrieval method based on Random Forest and multi-satellite data fusion GNSS-IR, this study used phase datasets extracted from all available satellite arcs at the P041, P037, and LM stations to establish soil moisture retrieval models based on Random Forest.
The Random Forest model is capable of handling high-dimensional data and large datasets. It constructs multiple decision trees by randomly sampling subsets of the phase dataset and uses the MDI algorithm to assess the importance of each arc, demonstrating strong generalization performance. Additionally, it offers robust handling of missing and anomalous values, and its performance is not compromised by local node failures, making it highly suitable for soil moisture retrieval based on multi-satellite data.
- Construction of the Random Forest Regression Model
The TreeBagger class is utilized to build a Random Forest regression model, comprising datasets with input and output variables. The input variables consist of phase data from all satellite arcs at each site, while the output variables are soil moisture reference data from the P041 station in 2012, the P037 station in 2017, and the LM station in 2014. During model construction, the number of decision trees and the minimum number of leaves are crucial parameters affecting the MDI calculation. The quantity of trees influences the robustness of MDI calculations, with more counts providing more opportunities for segmentation, and thus a more accurate reflection of the importance of each arc segment. However, too many trees can cause diminishing marginal effects. The minimum number of leaves affects the complexity of the decision trees; reducing the minimum number of leaves increases the depth of the trees, which helps capture features of the arcs beneficial for retrieval, but too few leaves can increase the risk of overfitting, thus reducing the model’s generalization ability. Therefore, selecting the appropriate parameters is particularly crucial. In this study, grid search is employed for parameter tuning to minimize training errors and avoid overfitting on the test set. Specific parameter settings are provided in Table 1.

Table 1.
The parameter settings for the RF model experiments conducted at the P041 station, P037 station, and LM station.
- 2.
- Model Training
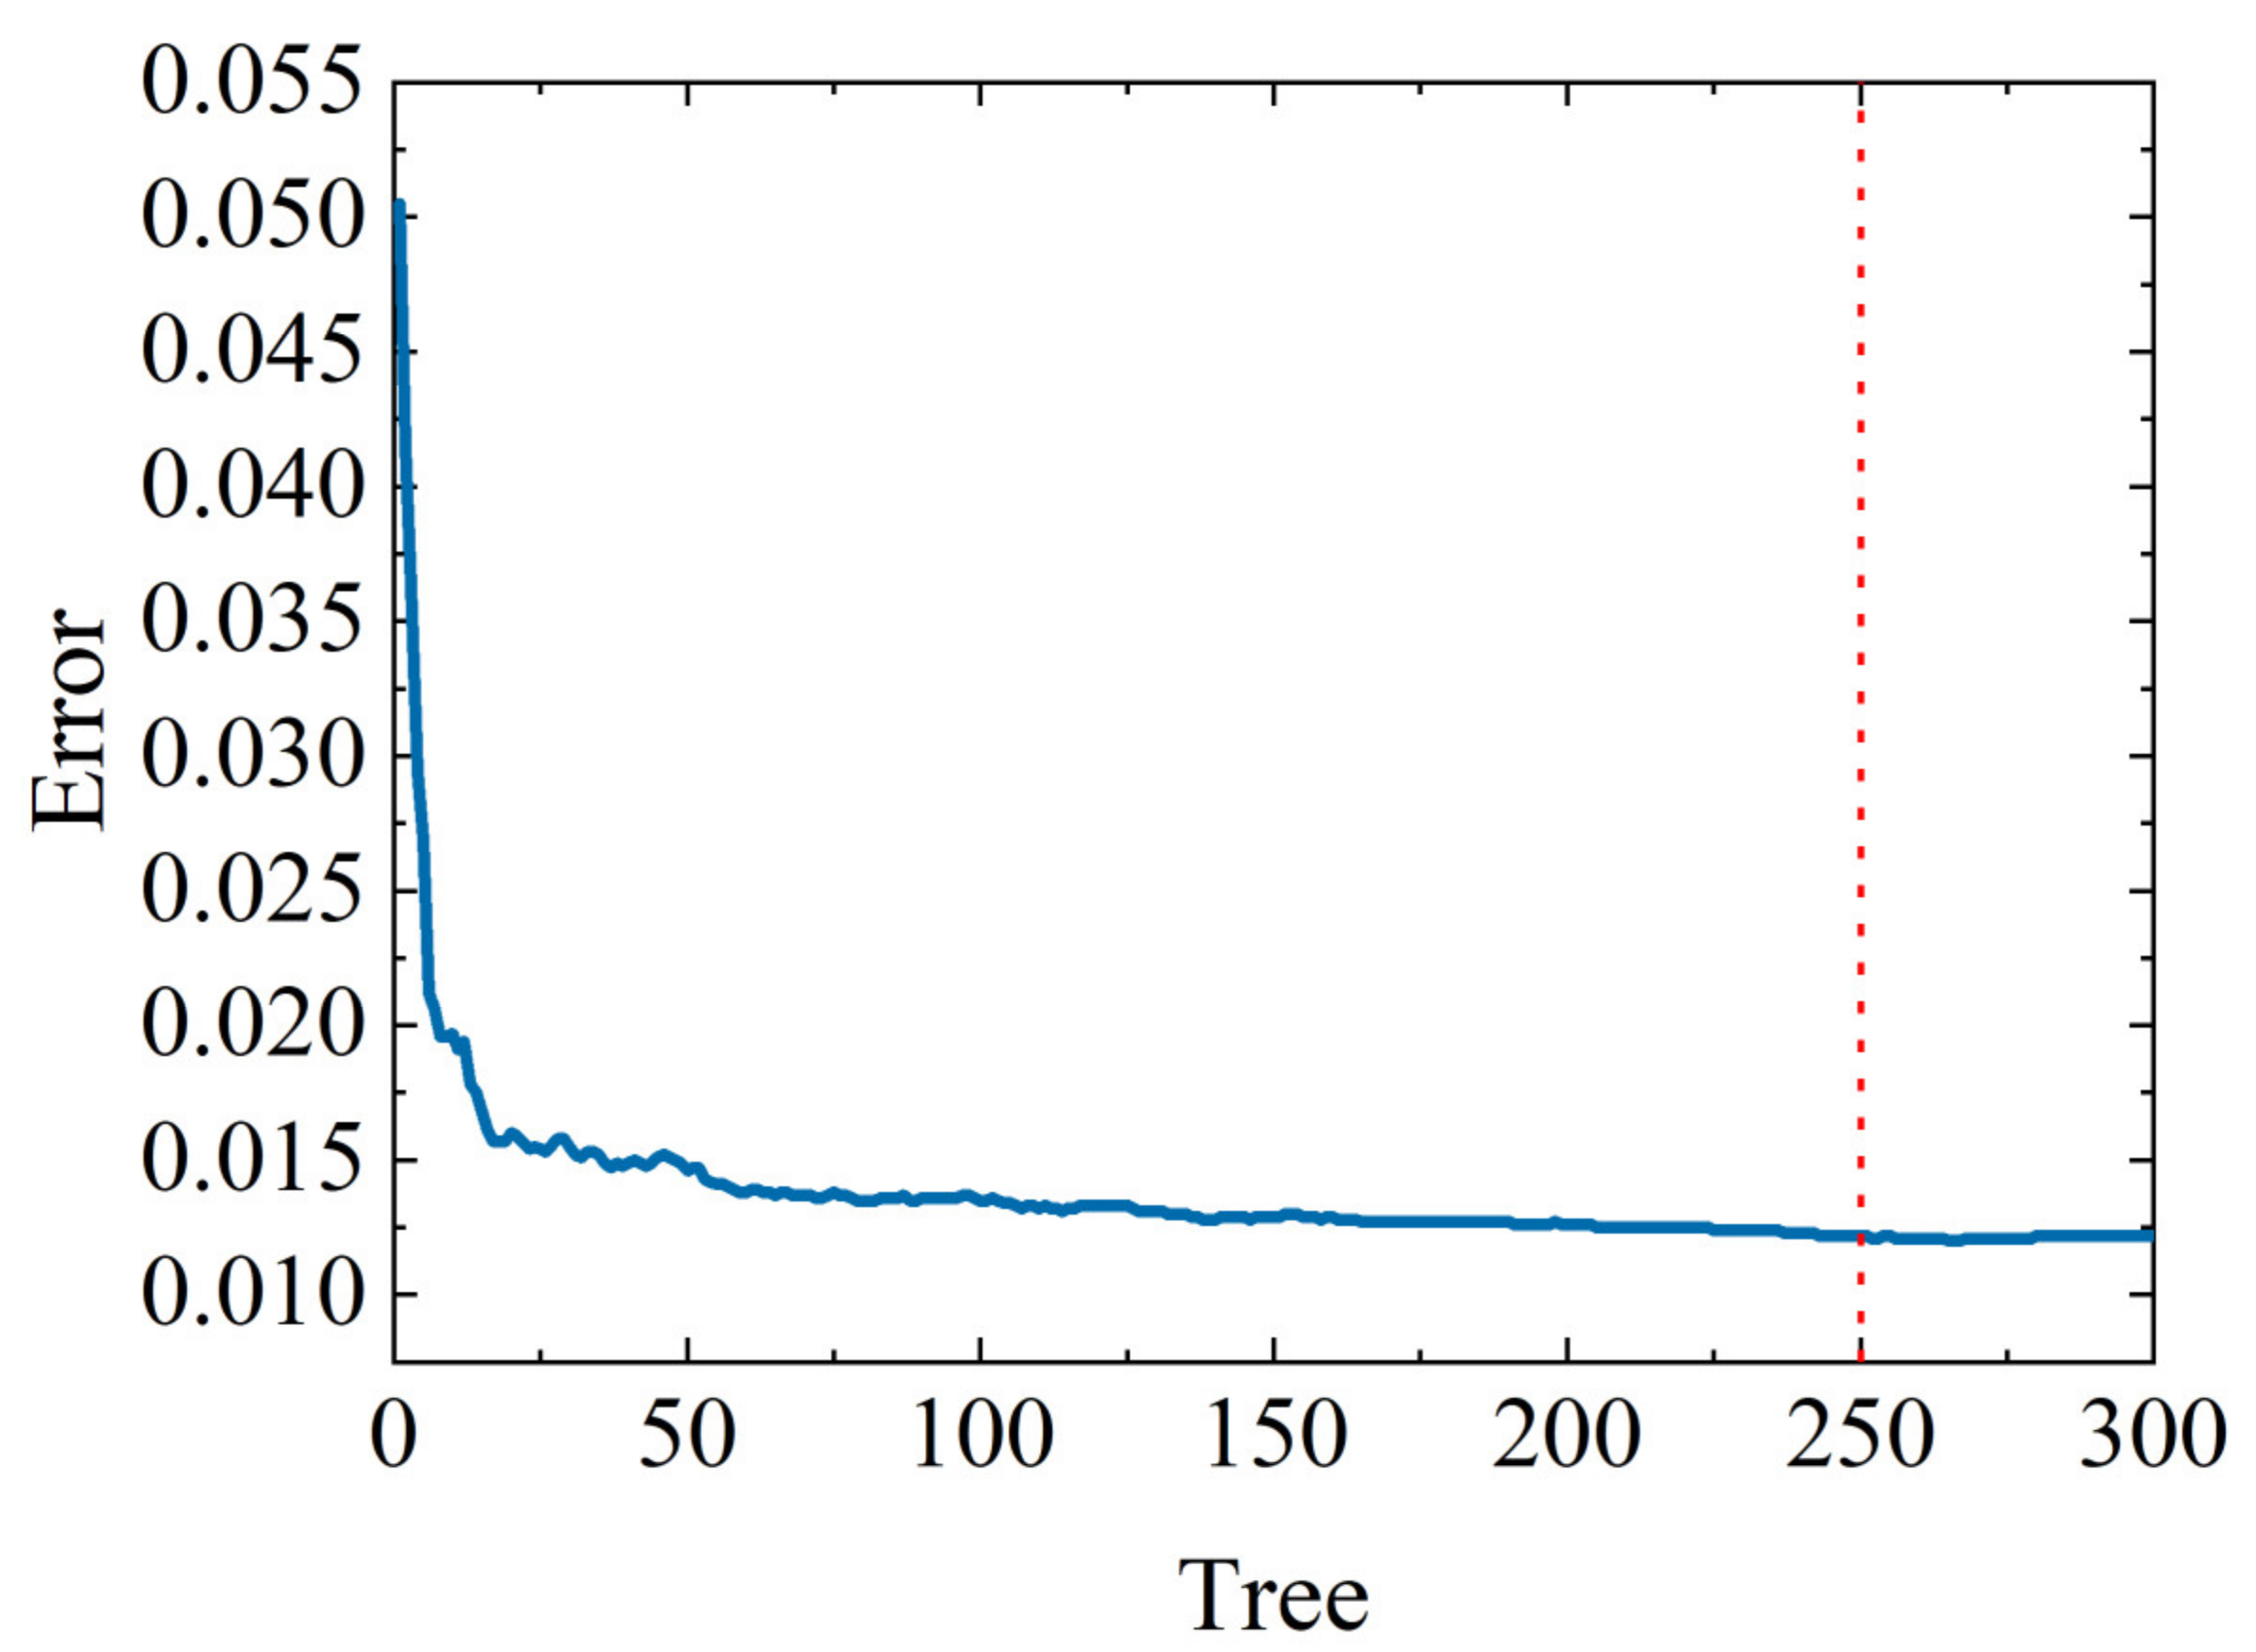
To train the model for optimal performance, the dataset is divided into two parts, with the first 70% of the data and the soil moisture reference values simultaneously input into the model. Figure 7 shows the error variation of the trained Random Forest model. From the graph, it is evident that the model’s error tends to stabilize when the number of decision trees reaches about 250. The error is minimized, and the performance is optimized when the number reaches 300 trees.
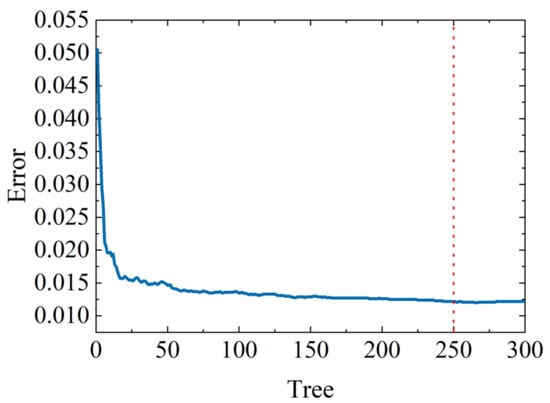
Figure 7.
Random Forest model training error. The blue line shows the trend of the model training error with the number of decision trees, and red line is the number of decision trees when the model training error stabilizes.
- 3.
- Model Validation
The remaining 30% of the phase data from the dataset were input into the trained Random Forest model to retrieve soil moisture values using multi-satellite data fusion. The study also incorporated an RBF, SVM, and CNN model for precision comparative analysis to demonstrate the feasibility and accuracy of the proposed model.
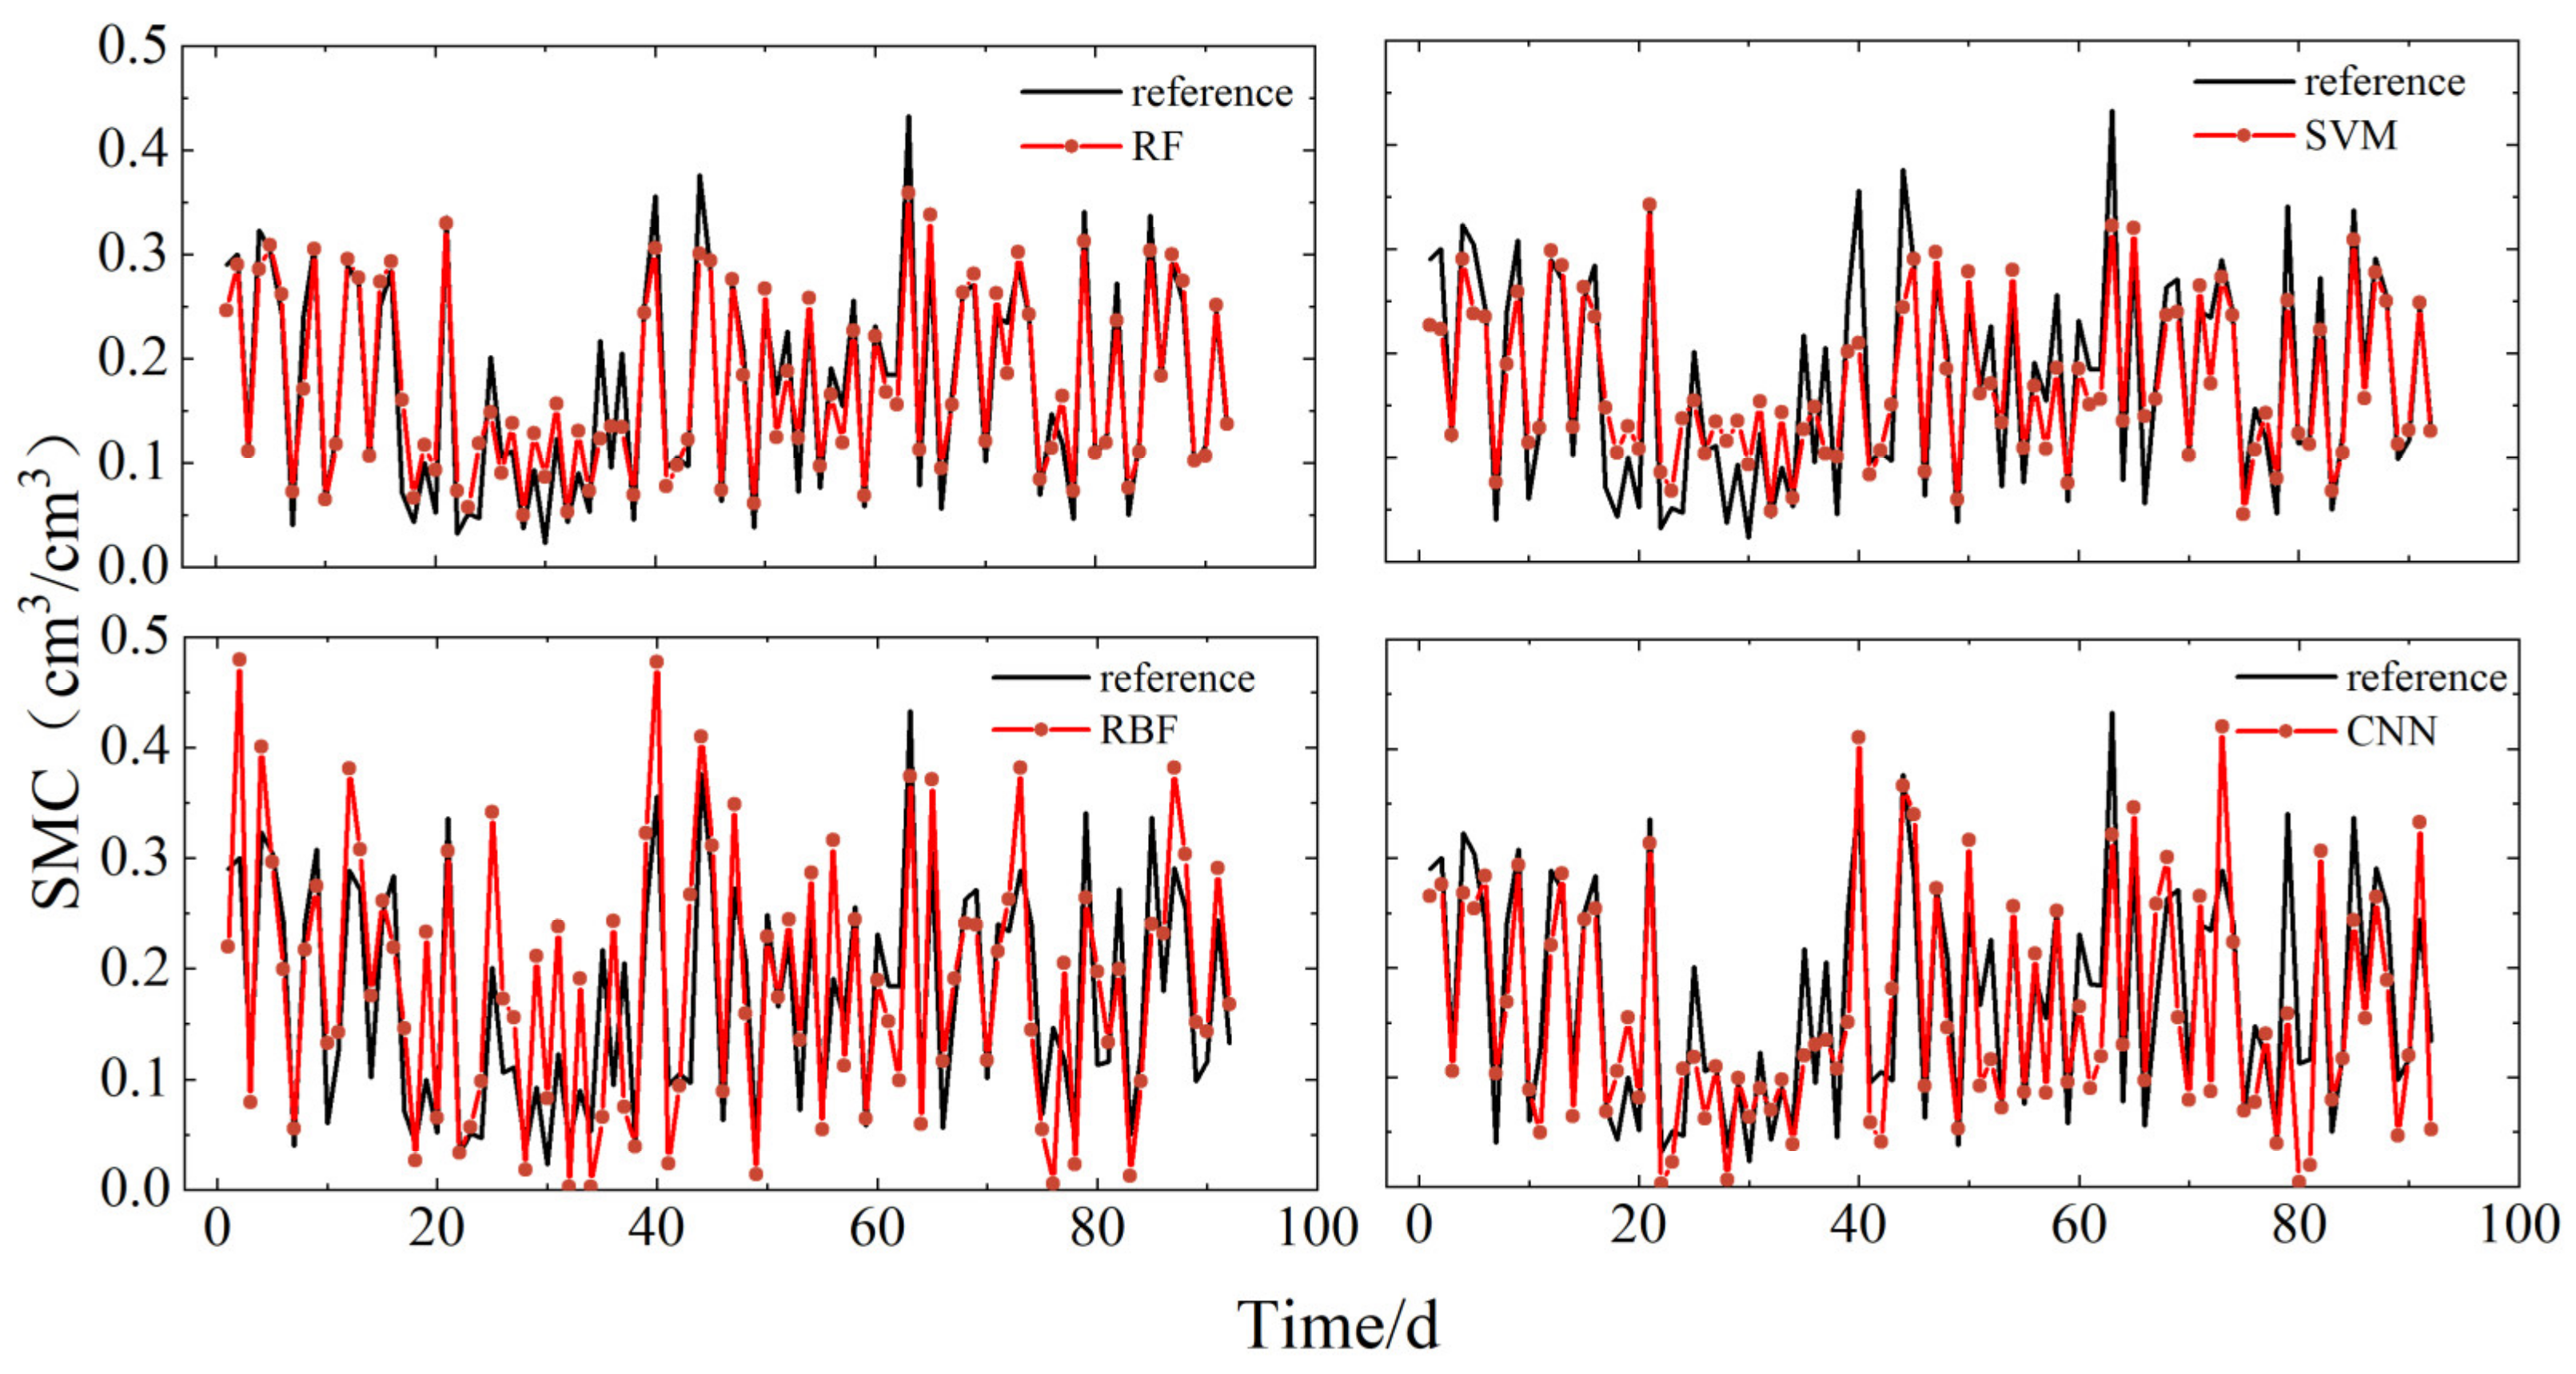
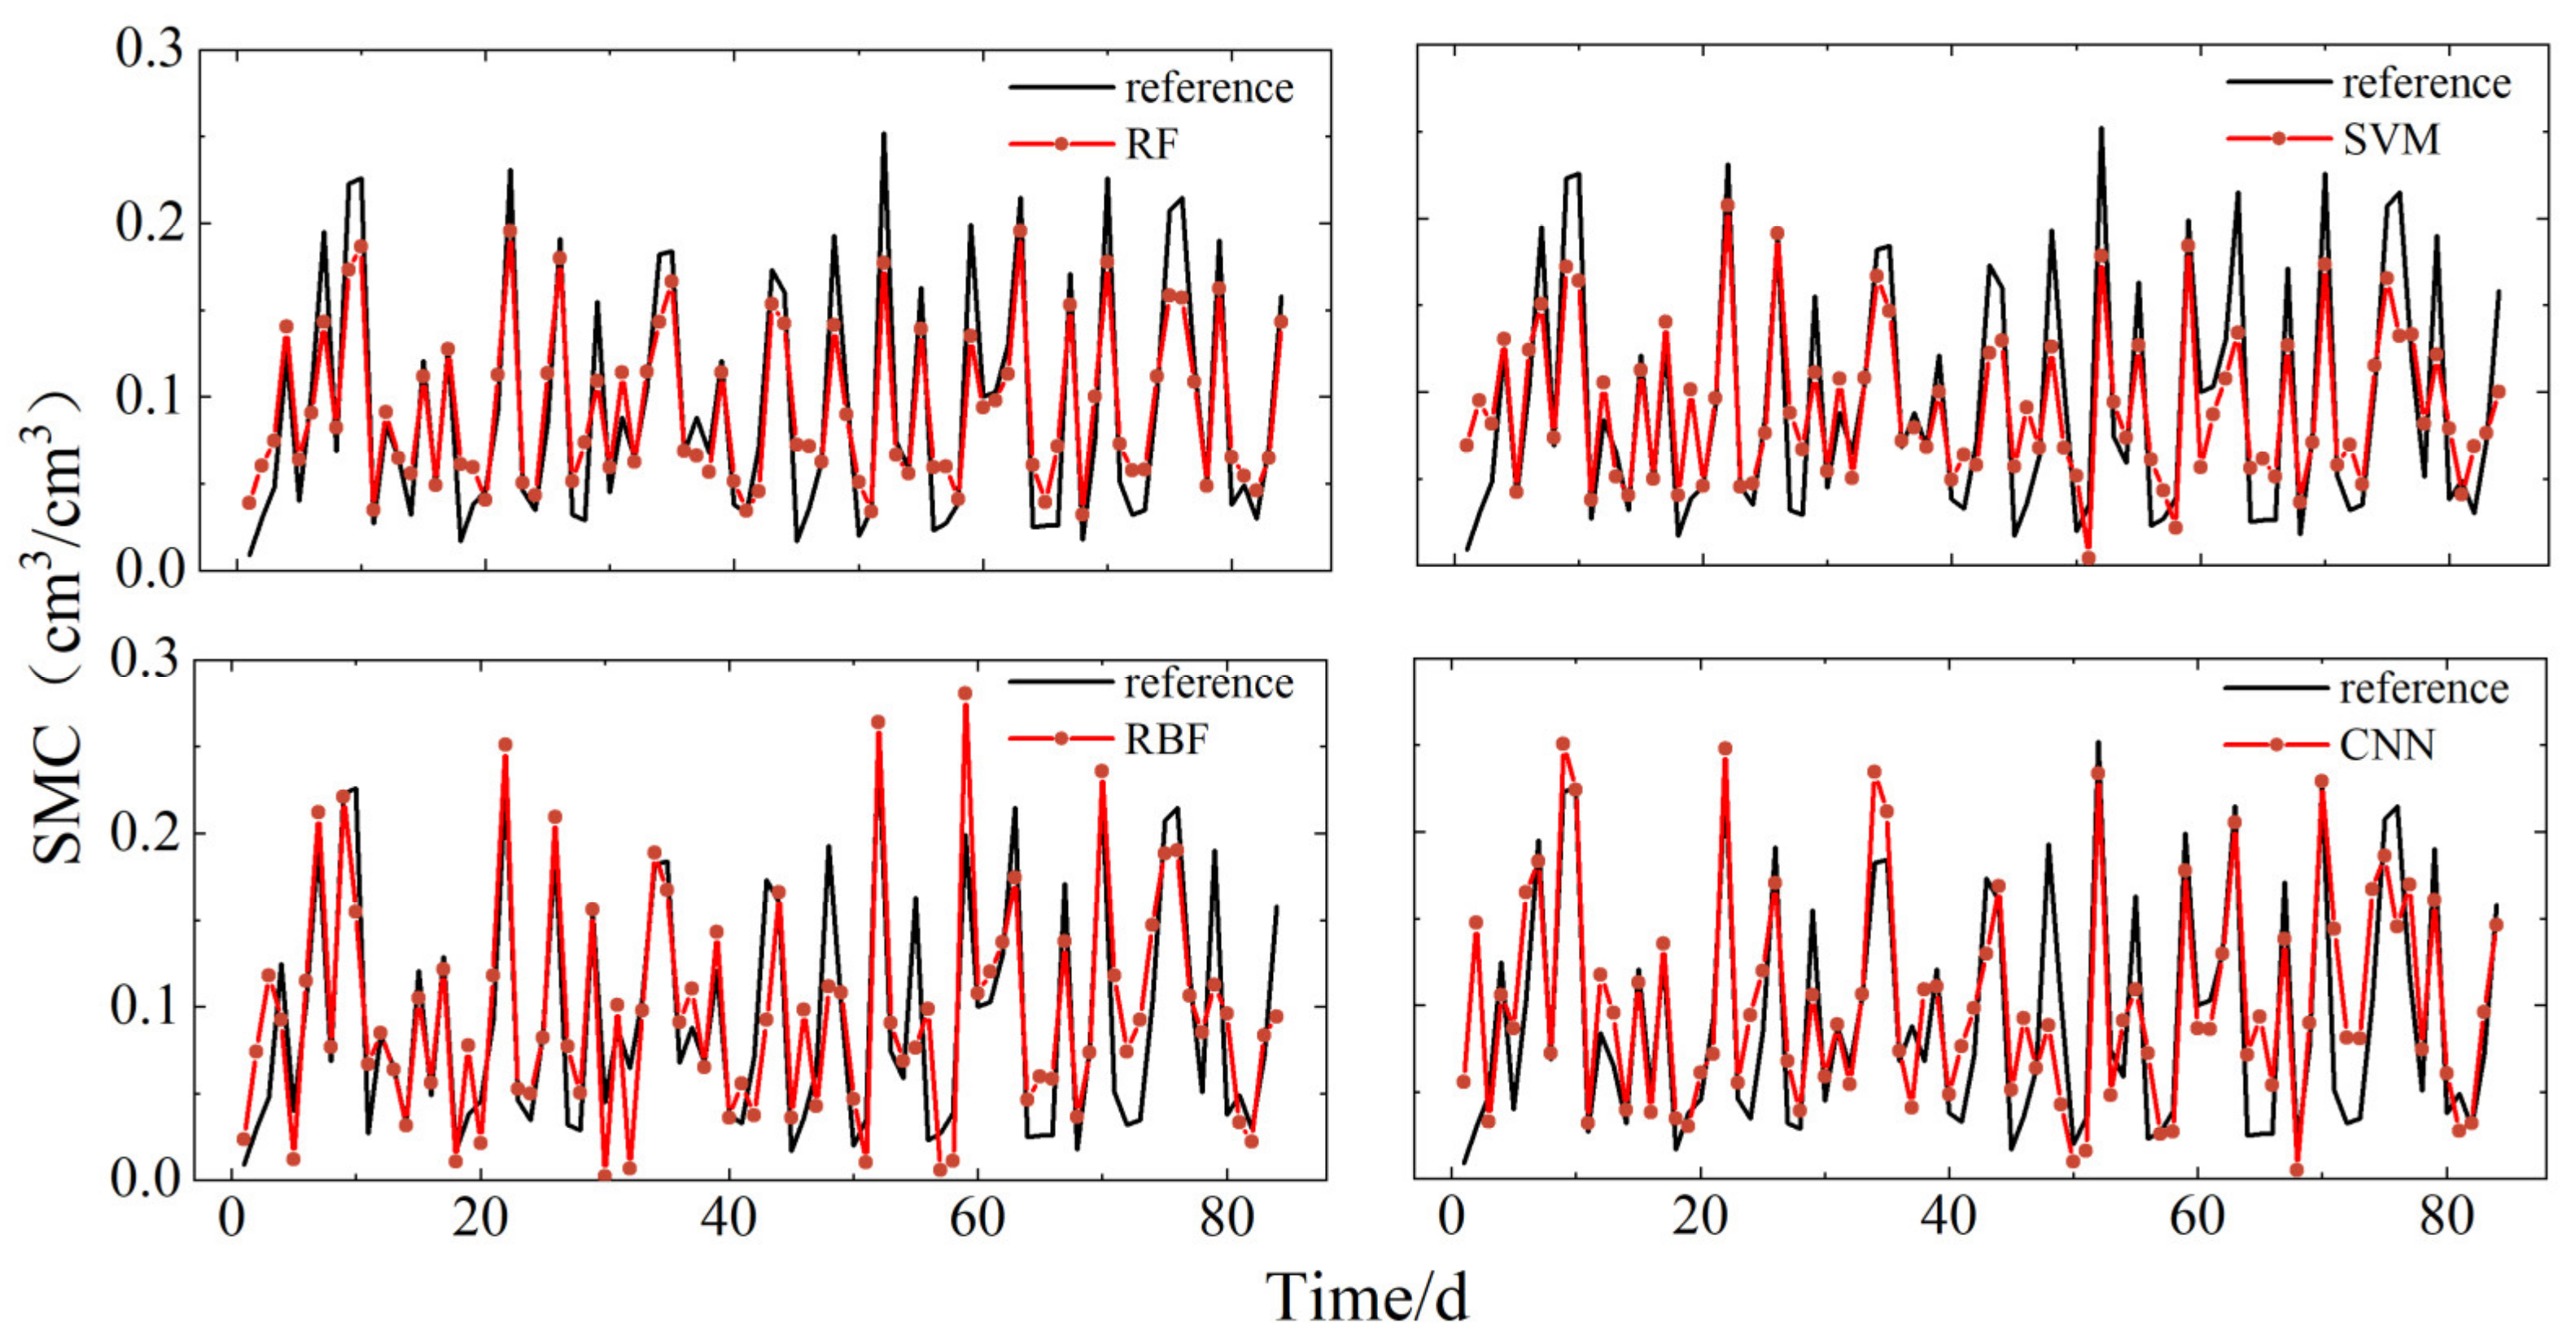
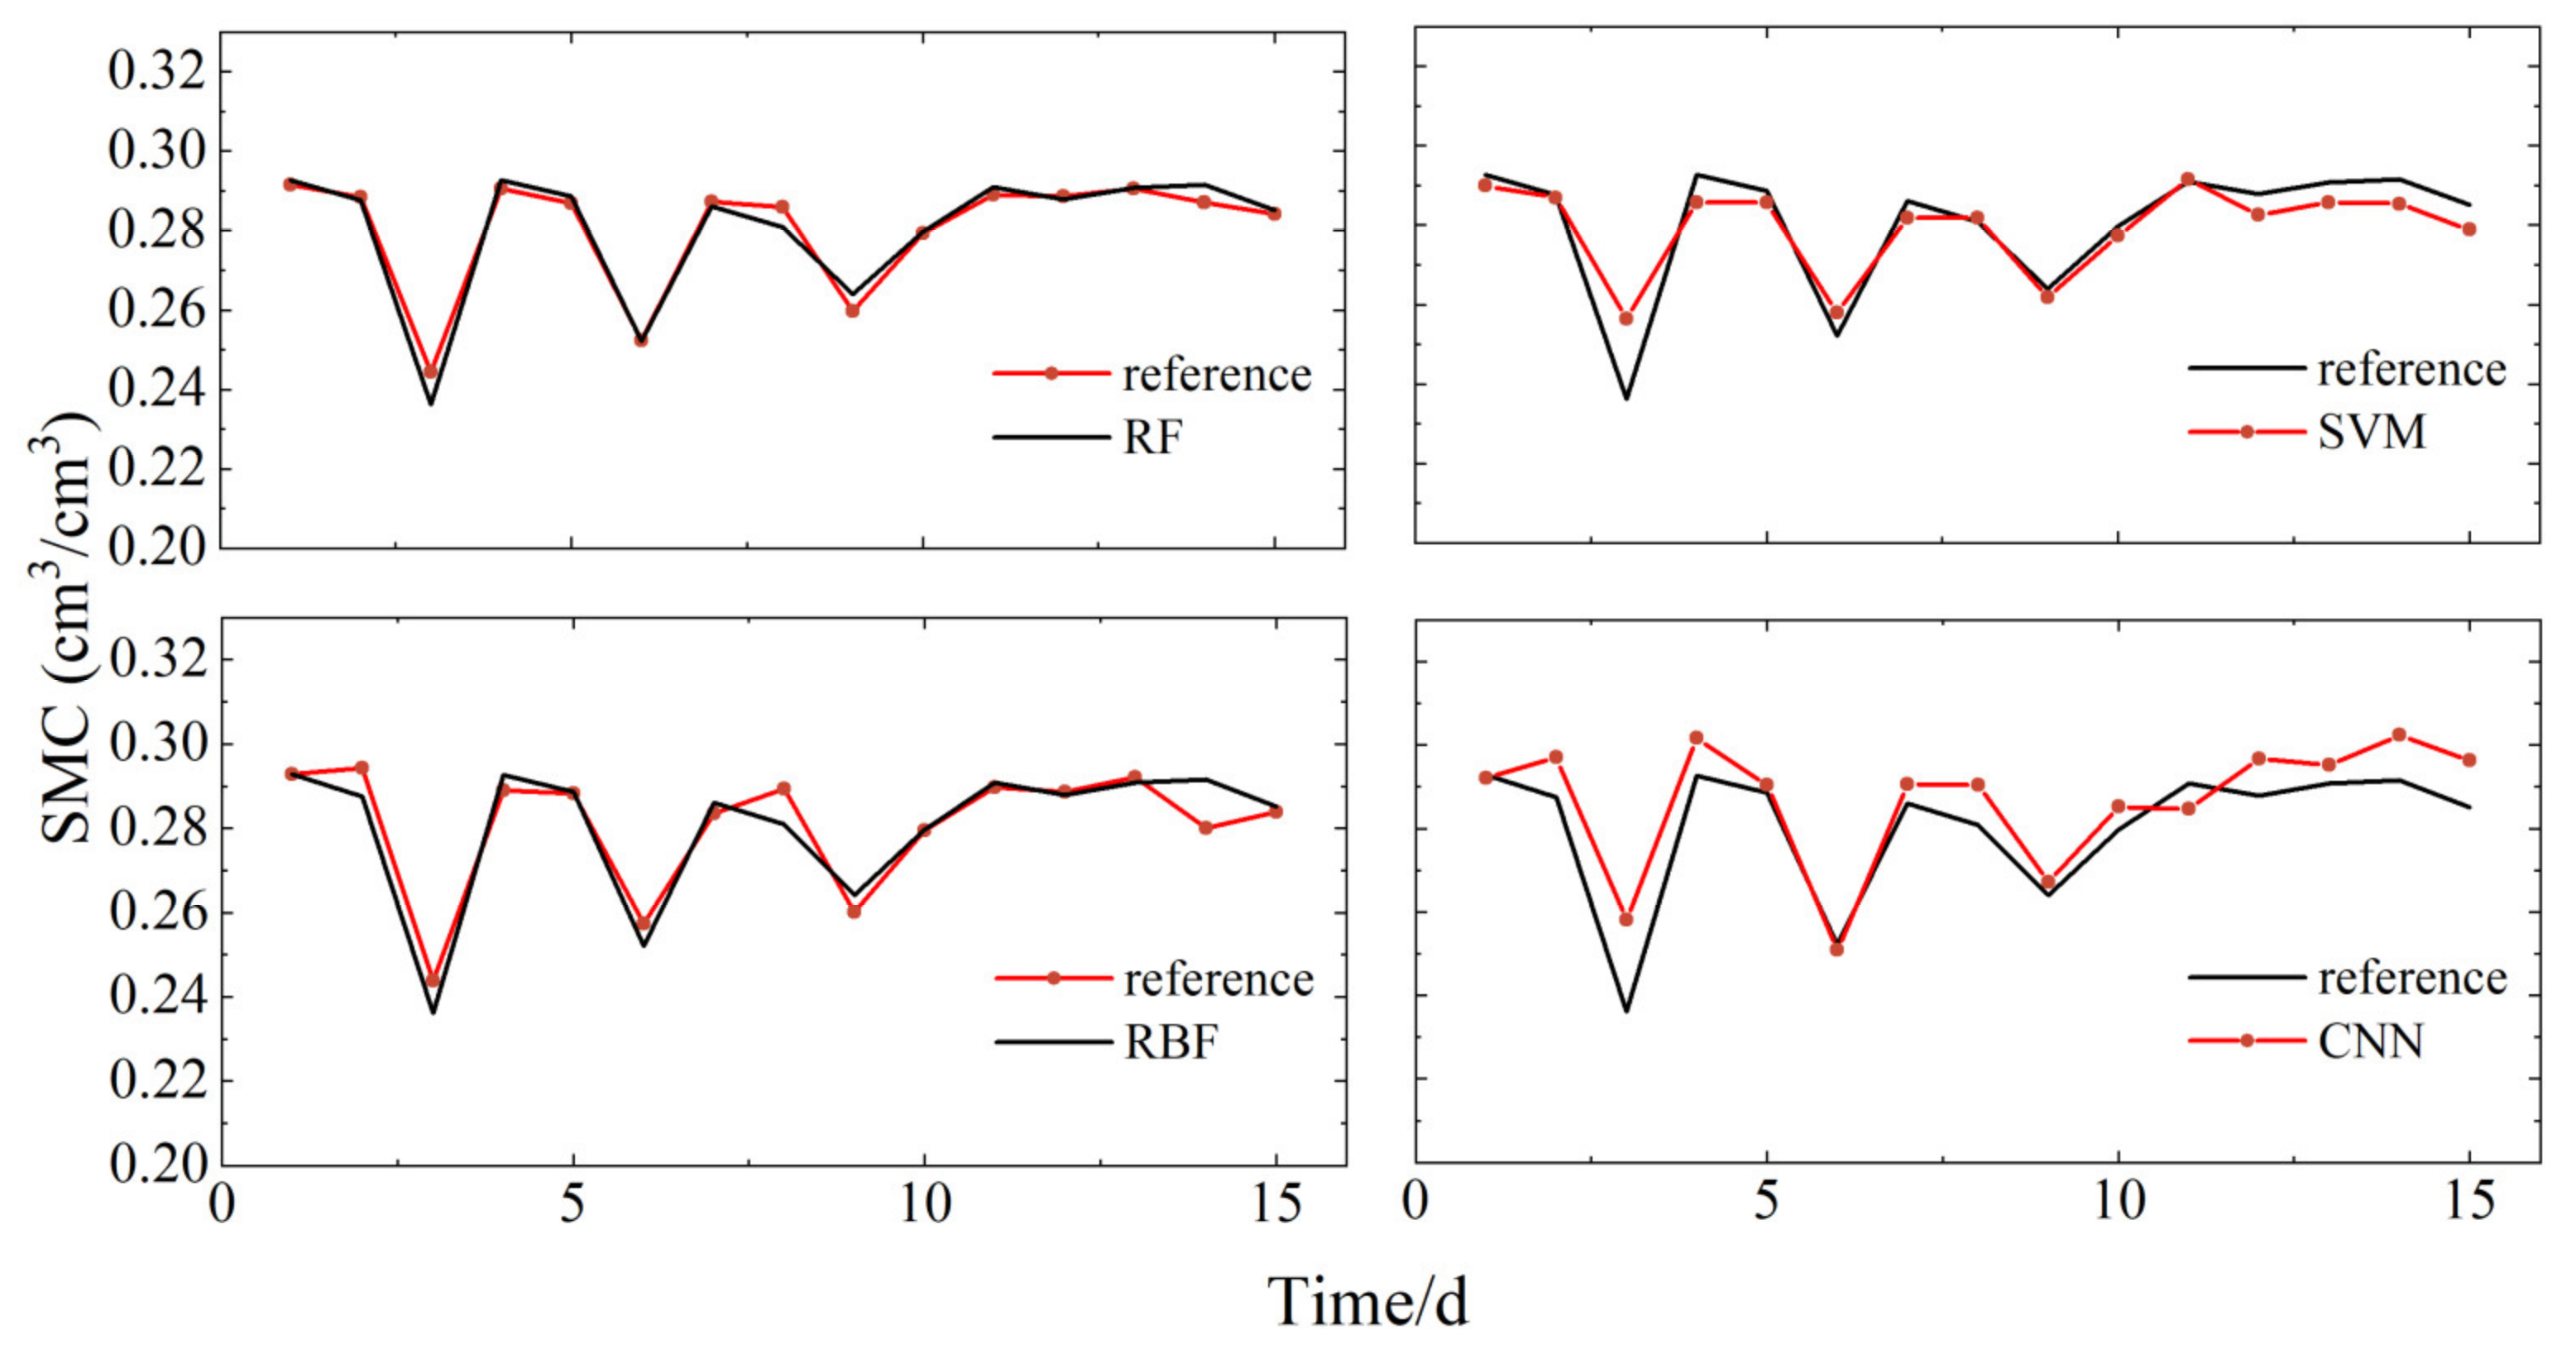
Based on the principles and methods discussed, soil moisture retrieval models were constructed using four algorithms: RF, SVM, RB, and CNN. Figure 8 and Figure 9 display the correlations between the retrieval results of these models using the datasets from P041 and P037 stations, respectively, and the soil moisture reference values provided by the PBO. Figure 10 shows the correlation for the models built using the LM station dataset with the in situ soil moisture reference values. The observations from the graphs indicate that, at the P041 station, the RBF neural network and CNN models showed significant deviations from the reference values. In contrast, the RF and SVM models more accurately reflected the peak changes in soil moisture. Specifically, compared to the soil moisture reference values, the RBF neural network exhibited significant differences and random trends during abrupt changes in soil moisture, while the CNN model performed well in the early stages but deteriorated in later stages. The RF and SVM models demonstrated better overall replication capabilities of the soil moisture reference values. At the P037 station, the RBF model showed significantly better fitting results compared to the P041 station, with stable retrieval results from the RF, SVM, and CNN models. In the smaller dataset of the LM station, the RBF model significantly outperformed the previous two stations, suggesting that the RBF model may be more suitable for handling smaller datasets. Additionally, the CNN model showed noticeable deviations from the reference values, with retrieval results increasingly diverging from the reference values in the last few days. The SVM model performed well initially, but also diverged in the final days. The RF model accurately reflected the changes in soil moisture reference values. Notably, across all three sites, the RF model consistently showed the best retrieval performance.
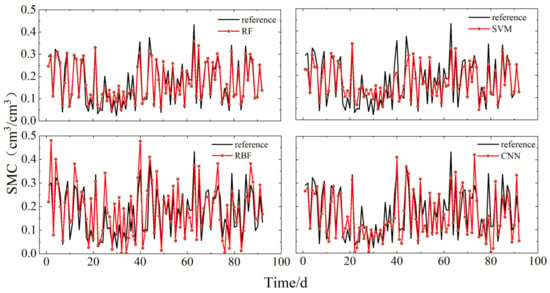
Figure 8.
Comparison of soil moisture for each model retrieval at site P041, with reference data provided by PBO.
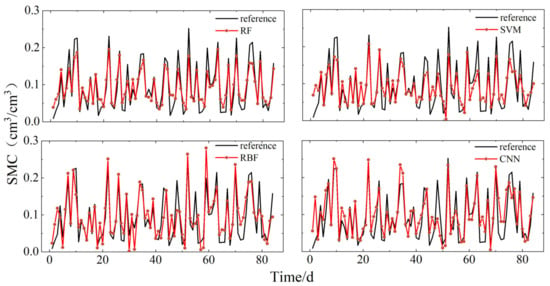
Figure 9.
Comparison of soil moisture for each model retrieval at site P037, with reference data provided by PBO.
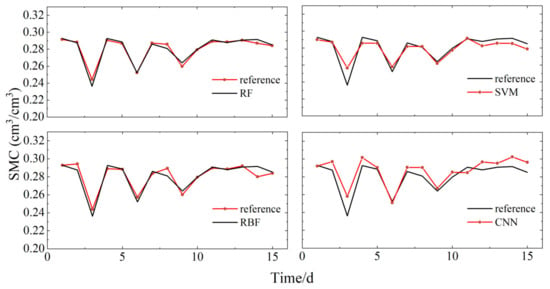
Figure 10.
Comparison of soil moisture for each model retrieval at site LM, with reference data.
4.2. Accuracy Analysis of Different Model Retrieval Results
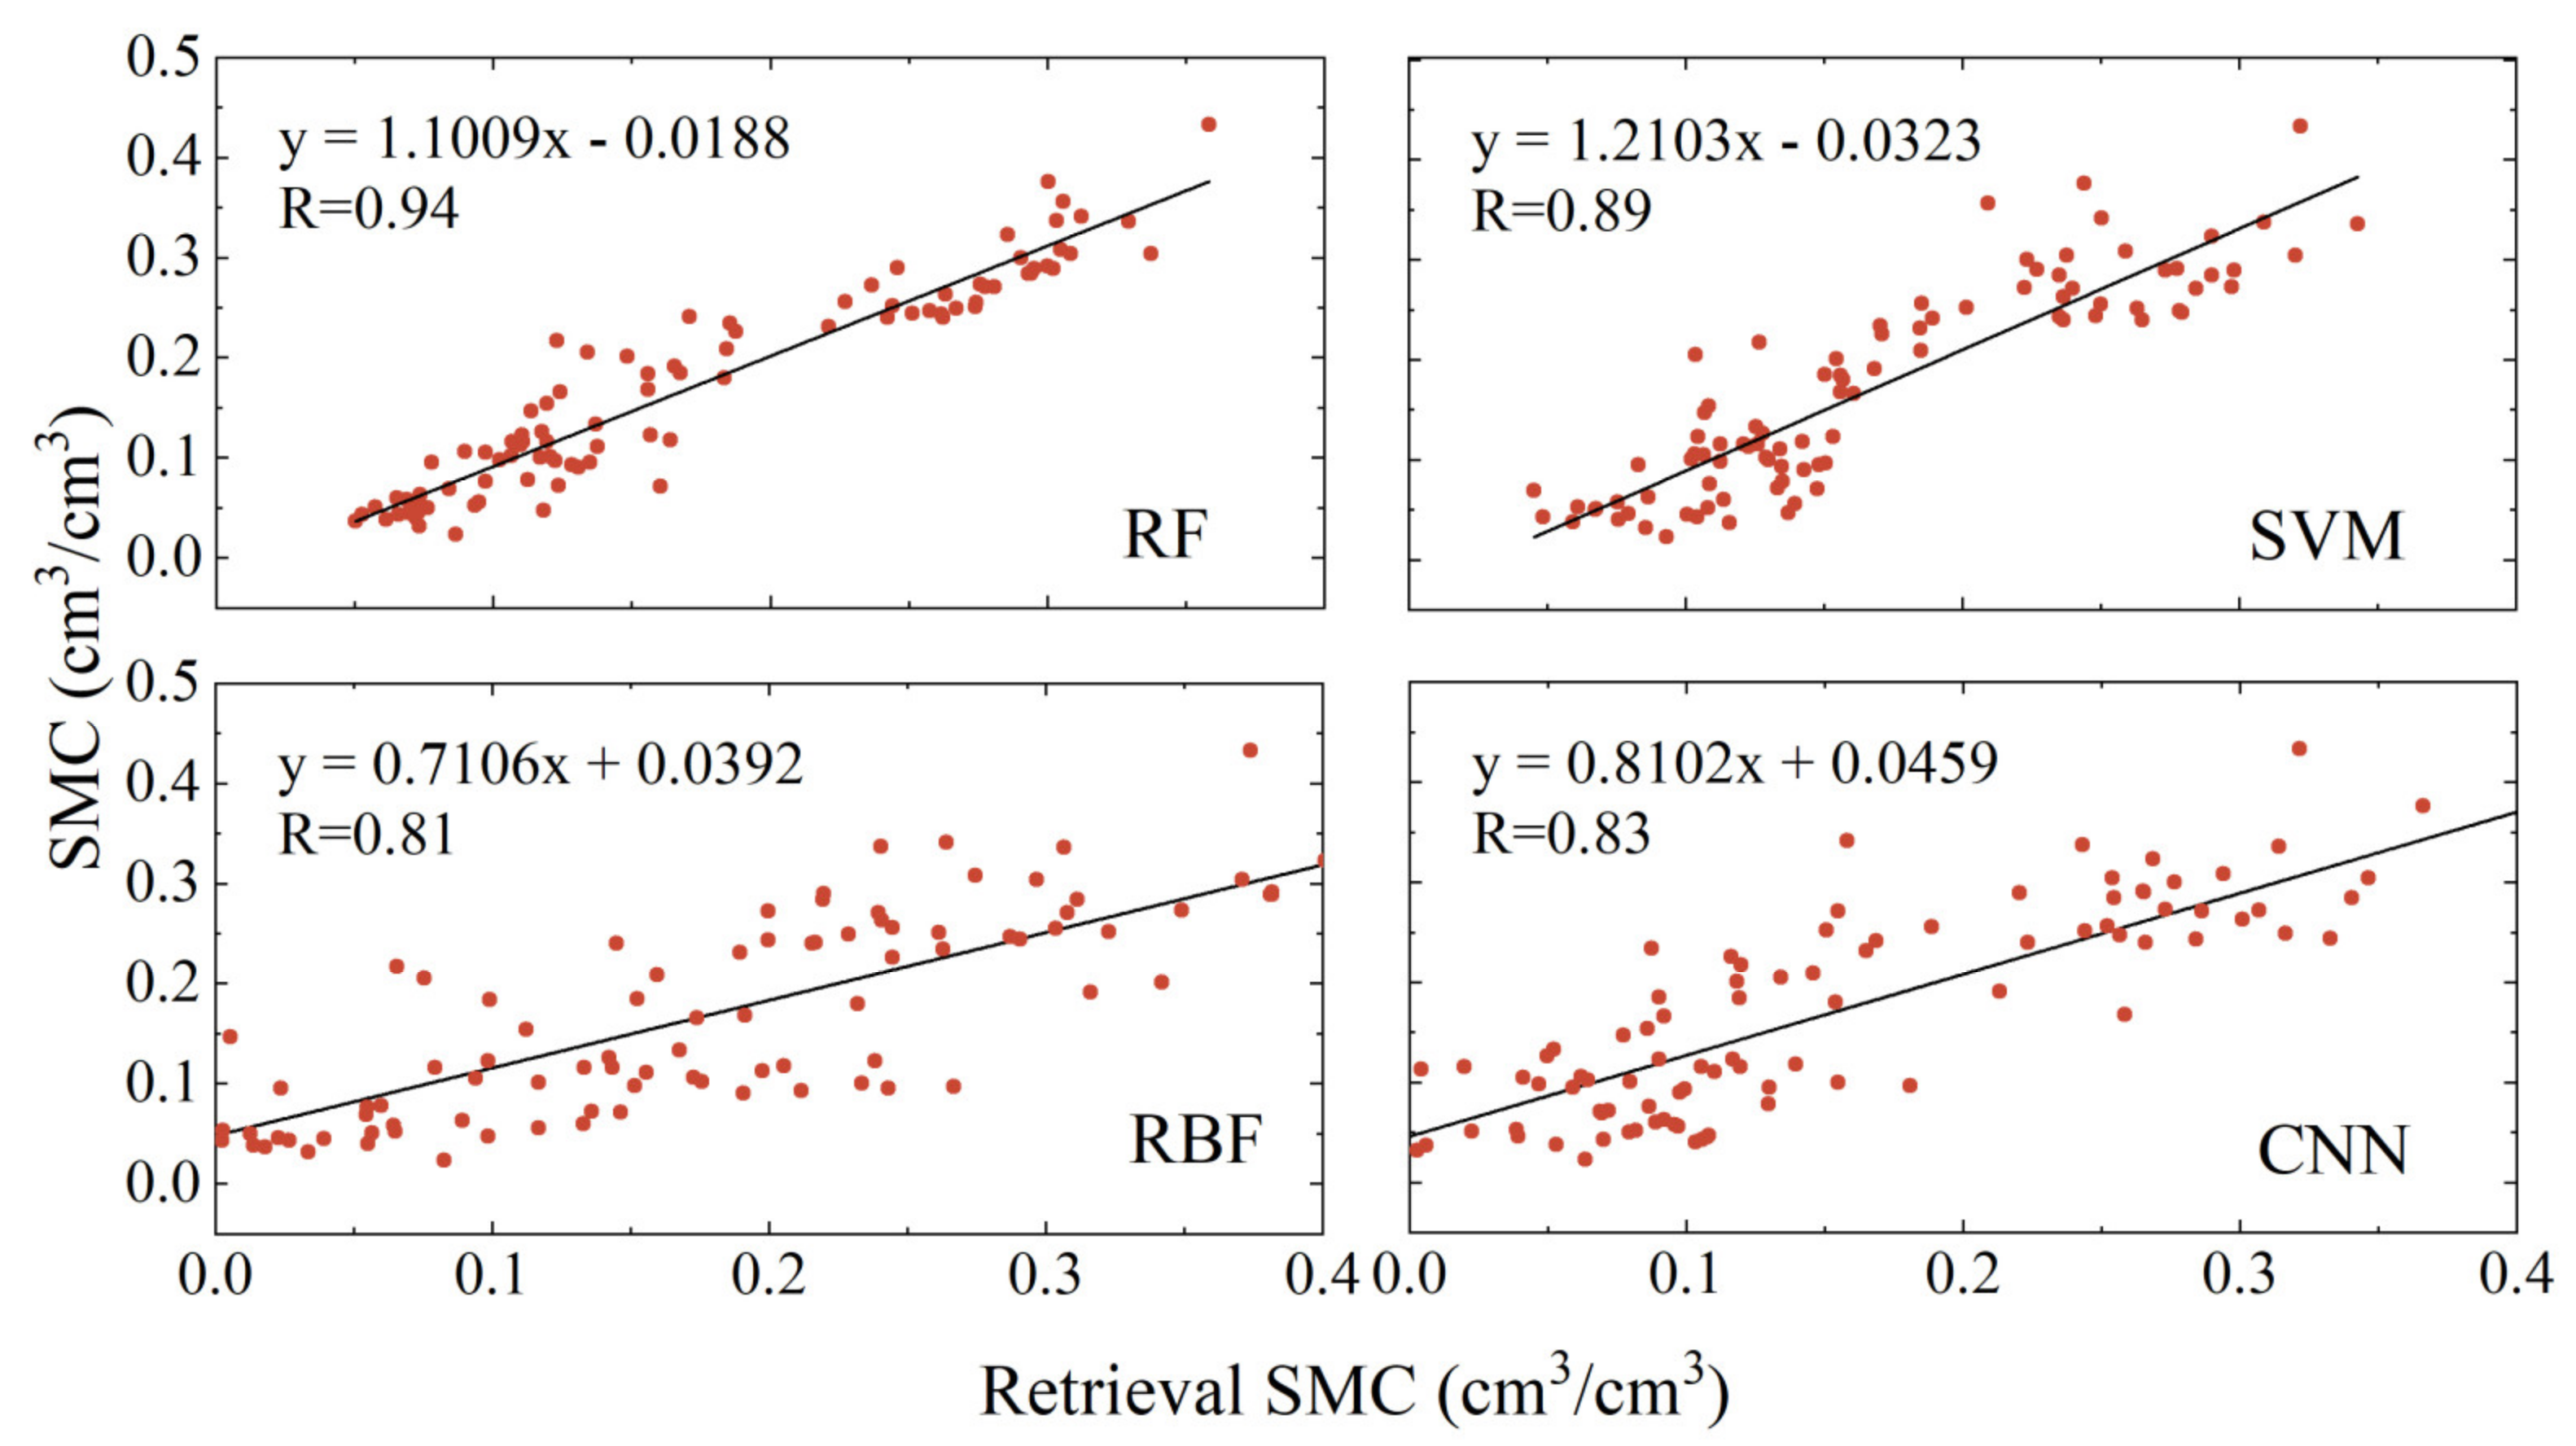
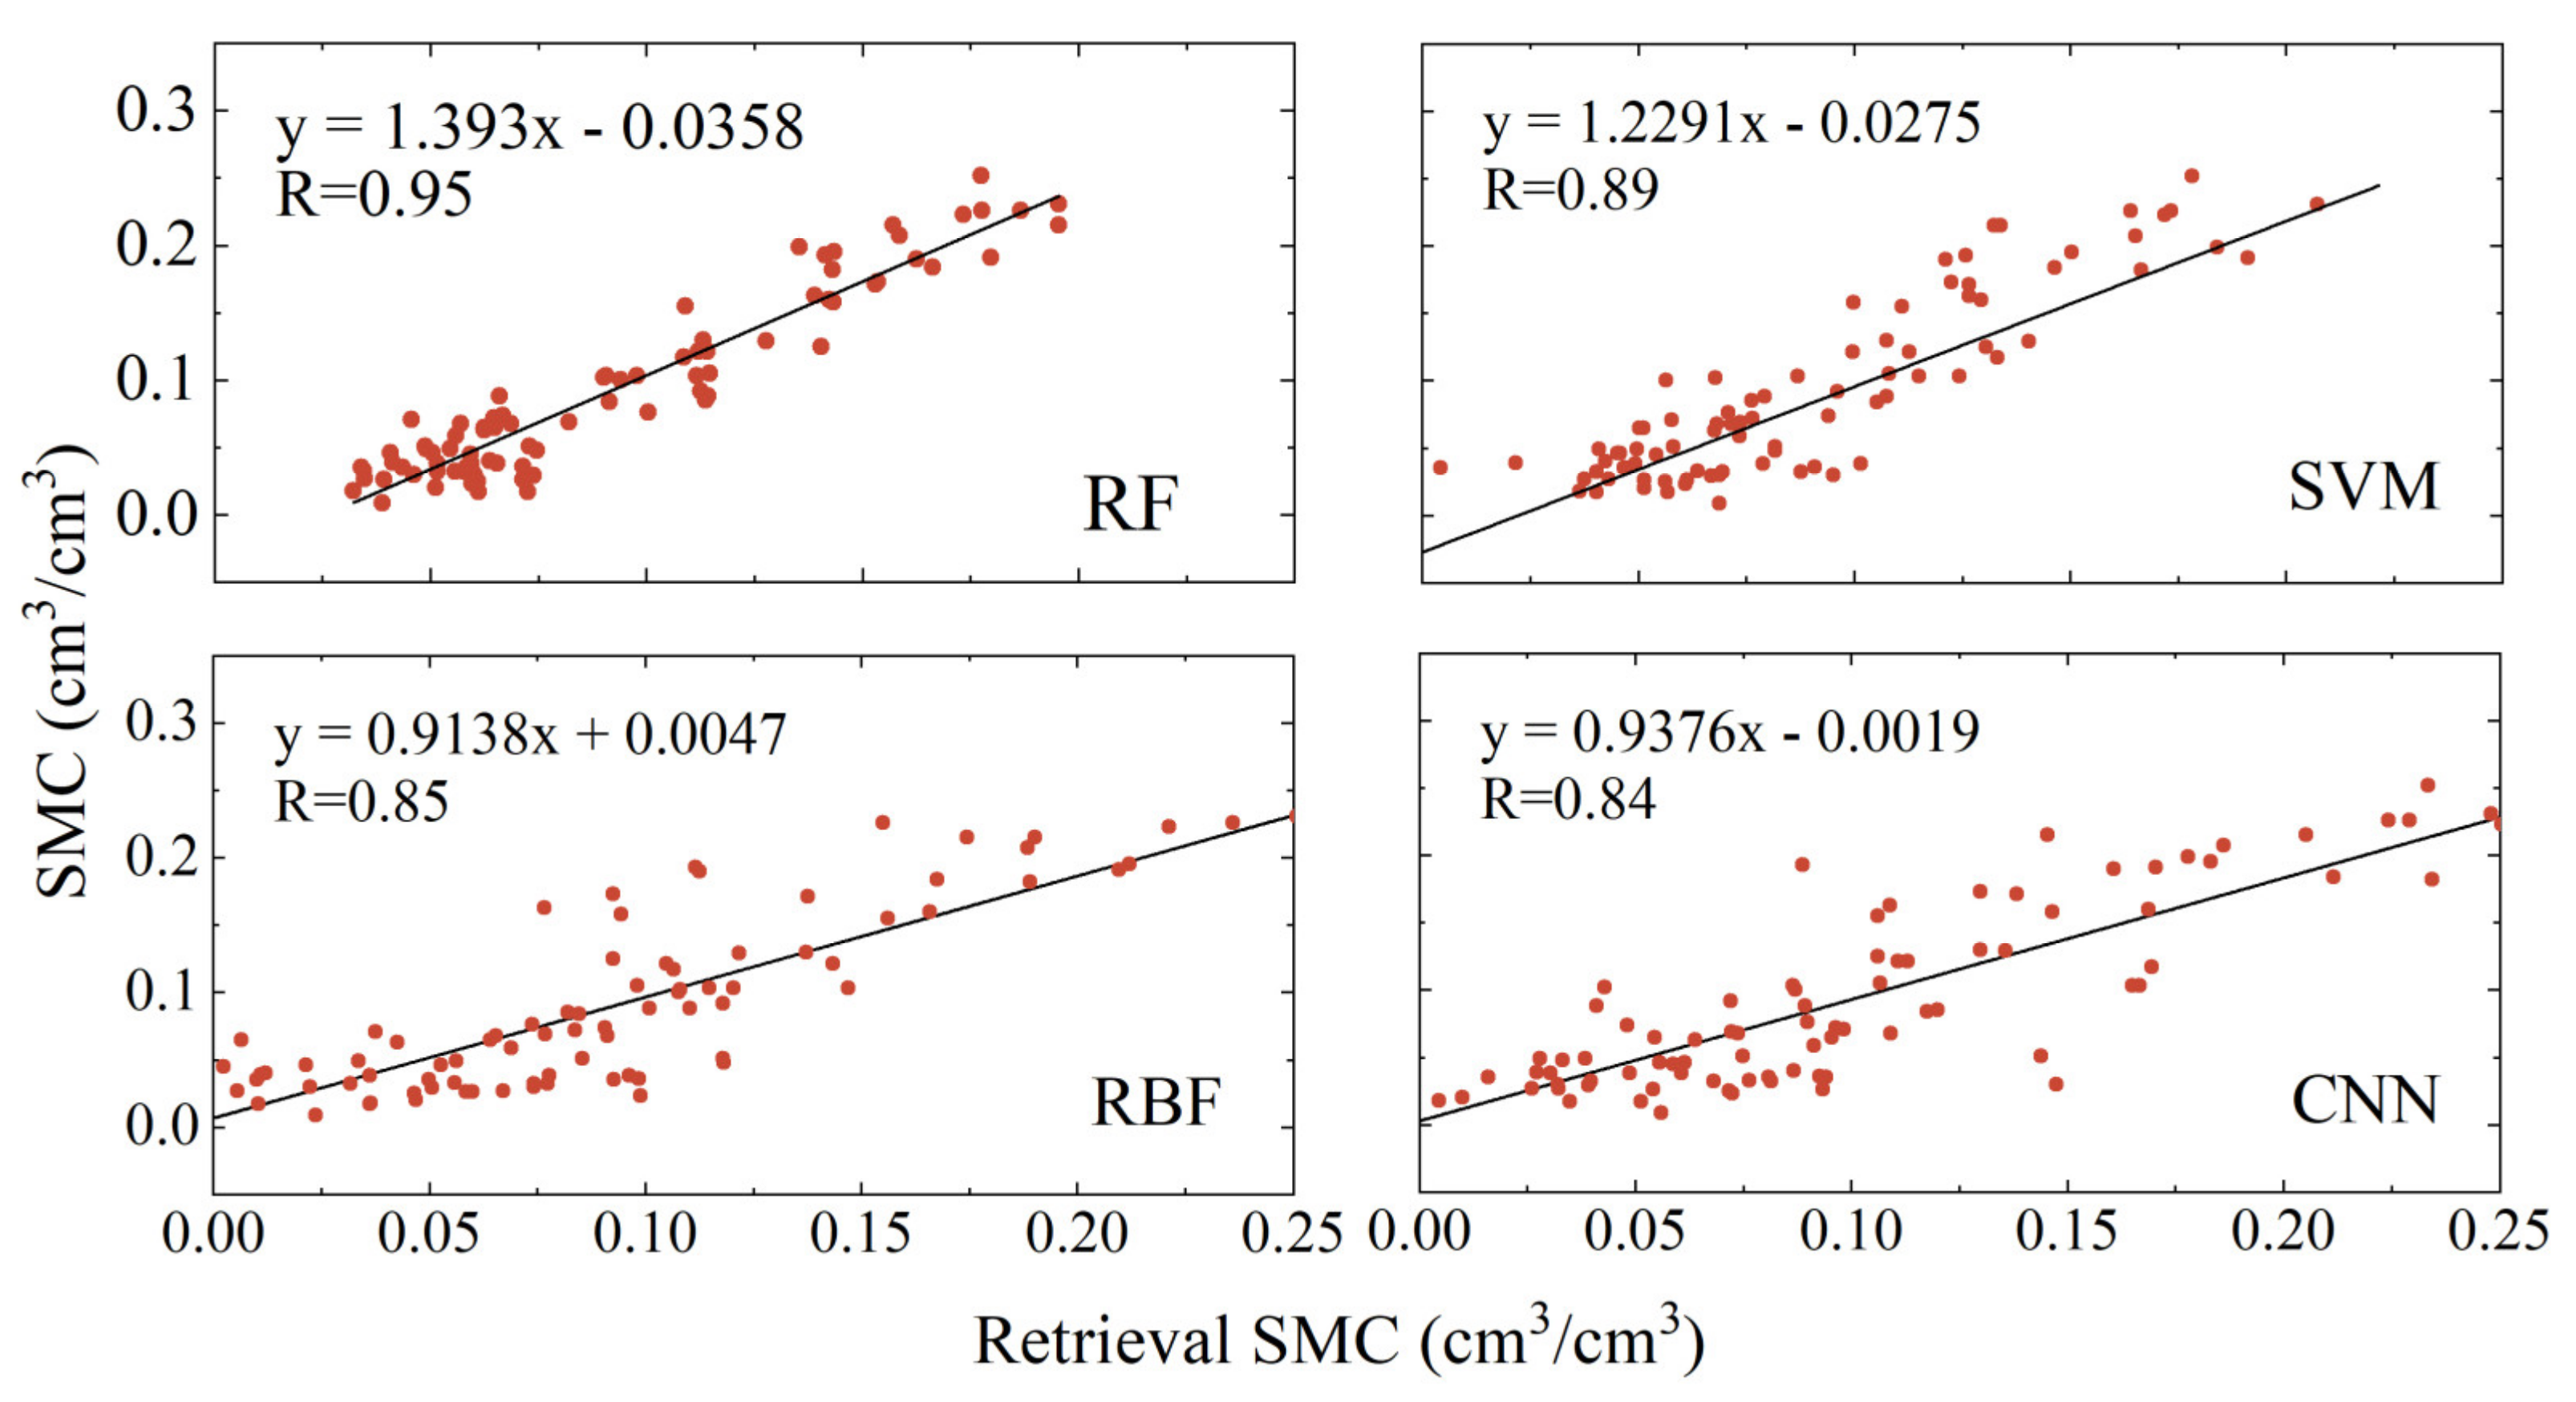
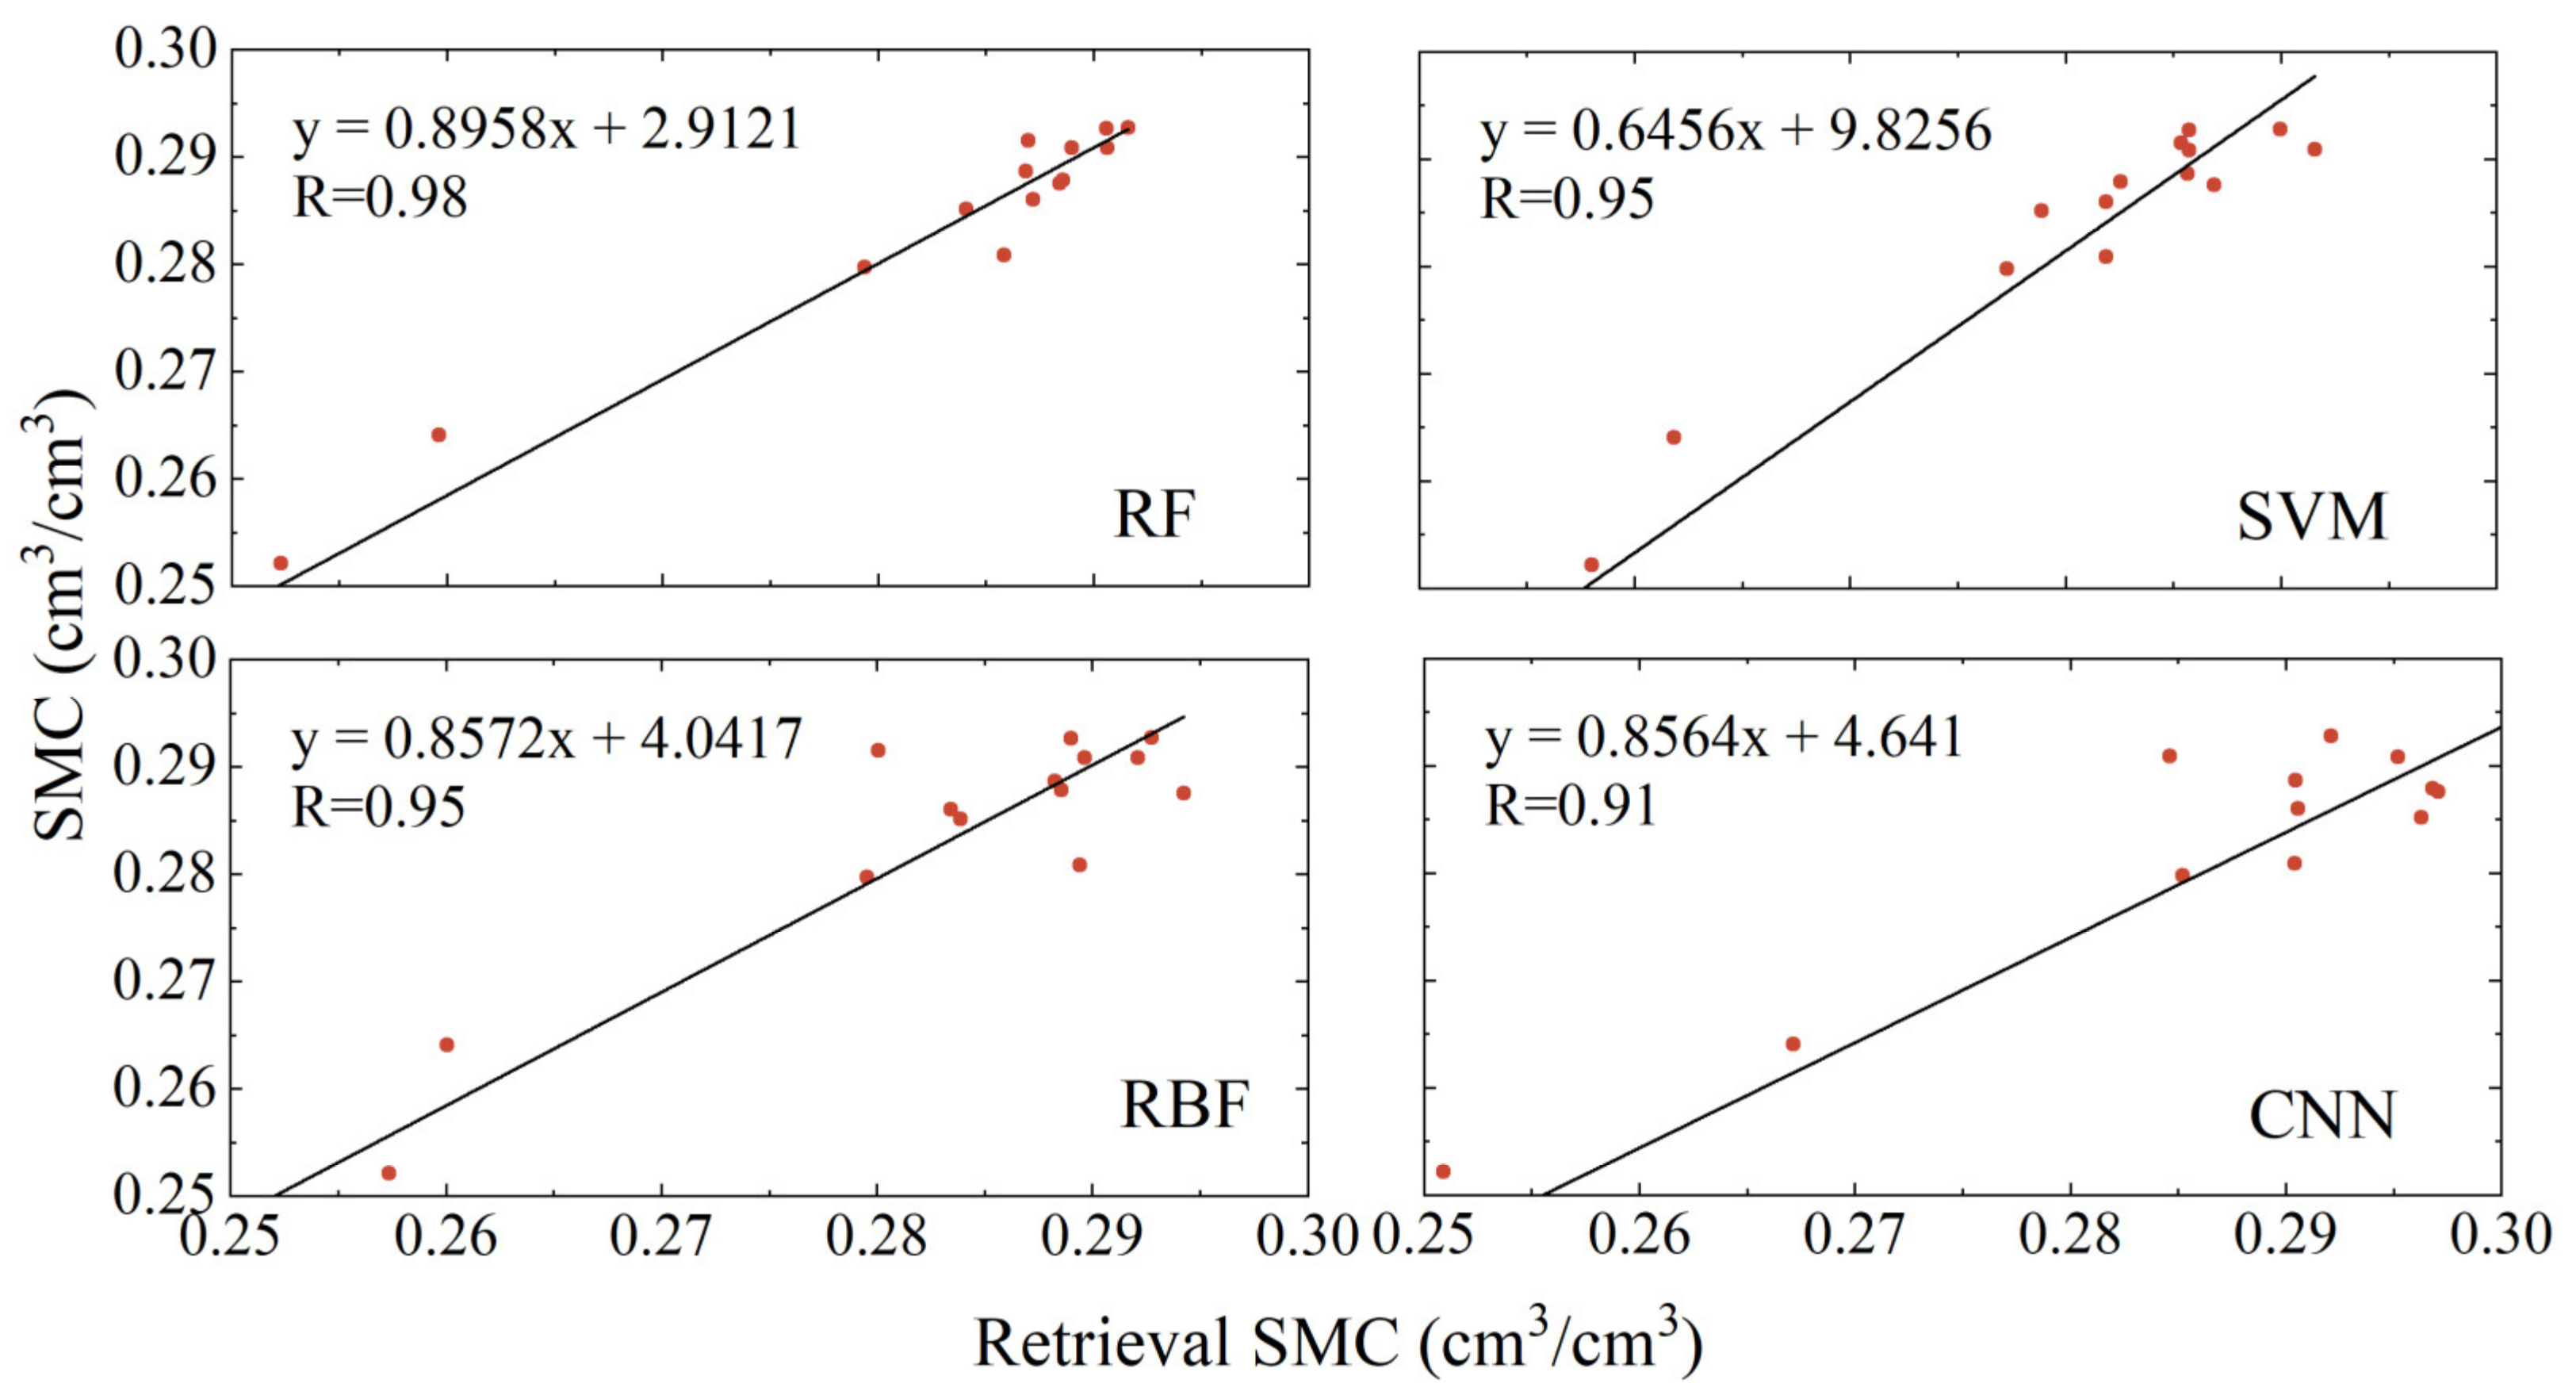
To further assess the performance of different methods in soil moisture retrieval from multi-satellite fusion phases, this study incorporated three accuracy metrics: the correlation coefficient (R), root mean square error (RMSE), and mean absolute error (MAE). Figure 11, Figure 12, and Figure 13, respectively, display the linear correlations between the retrieval results of the four models and the soil moisture reference data for the P041, P037, and LM sites. Table 2 provides the specific values of these accuracy metrics for the different models at the three sites.
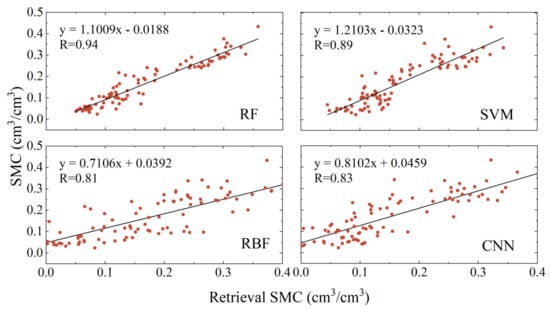
Figure 11.
Linear regression analysis of soil moisture versus reference values for each model retrieval at site P041.
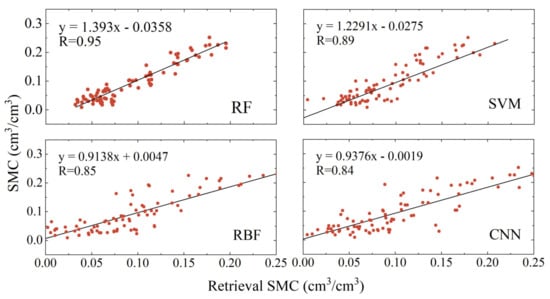
Figure 12.
Linear regression analysis of soil moisture versus reference values for each model retrieval at site P037.
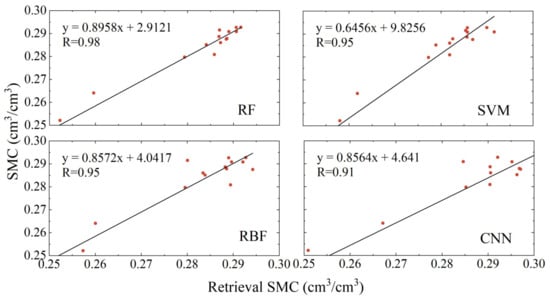
Figure 13.
Linear regression analysis of soil moisture versus reference values for each model retrieval at site LM.

Table 2.
R, RMSE, and MAE between inverted soil moisture and reference values for each model at sites P041, P037, and LM.
As illustrated in Figure 11, Figure 12, and Figure 13, and Table 2, the soil moisture retrieval results from the RF, SVM, RBF, and CNN models, developed using data from the P041, P037, and LM sites, all show strong correlations with the soil moisture reference values. Among these, the RF model yielded the best and most stable results, with correlation coefficients of 0.94, 0.95, and 0.98, respectively. The results from the SVM, RBF, and CNN models were slightly inferior, with correlation coefficients at the P041 site being 0.89, 0.81, and 0.83, respectively; at the P037 site they were 0.89, 0.85, and 0.84, respectively; and at the LM site they were 0.95, 0.95, and 0.91, respectively. Notably, compared to the P041 and P037 sites, the RBF model showed significant improvement in retrieval accuracy at the LM site. At the P041 site, the RMSE for the four models ranged from 0.03 to 0.075 cm3/cm3, and the MAE ranged from 0.02 to 0.06 cm3/cm3. At the P037 site, the corresponding RMSE ranged from 0.025 to 0.04 cm3/cm3, and the MAE ranged from 0.02 to 0.03 cm3/cm3. At the LM site, the corresponding RMSE ranged from 0.003 to 0.009 cm3/cm3, and the MAE ranged from 0.002 to 0.007 cm3/cm3. Among these, the Random Forest model performed the best, achieving the lowest RMSE and MAE across all models. Compared to the other three models, at all three sites, the RMSE was reduced by at least 50%, 17.9%, and 58.9%, and the MAE was reduced by at least 48%, 18.2%, and 62.5%, respectively.
The comparative analysis of retrieval accuracies across the SVM, RBF, and CNN soil moisture retrieval models at the three sites showed that none of these models achieved better R values than the RF soil moisture retrieval model. This underscores the efficacy of the multi-satellite data fusion RF retrieval model proposed in this study. The RF model quantifies each segment’s contribution to the model by calculating reductions in impurity during the retrieval process. It effectively utilizes segments with the highest contributions, which allows it to suppress gross errors caused by single satellites and fully leverage segments strongly correlated with soil moisture. This approach enhances the reliability and robustness of the model compared to traditional methods.
5. Discussion
5.1. Reliability Analysis of MDI Algorithms
In the training process, the RF model utilizes a method based on MDI to measure the contribution of each arc, and quantifies this as arc importance. Specifically, the Random Forest model consists of multiple decision trees. In each tree, the decision tree is constructed by recursively splitting nodes. At each node split, the MDI algorithm calculates the reduction in impurity for each segment involved in the split. The segment that maximizes the reduction in impurity is selected as the partition point. After building the tree, the reduction in impurity for each segment at every split is accumulated, and then the reductions across all trees are averaged to obtain the average decrease in impurity for each segment. For ease of comparative analysis, the importance of segments is normalized using min–max normalization, which allows for the adaptive allocation of segment weights.
In the MDI algorithm, MSE serves as the criterion for measuring impurity, reflecting the average of the squared differences between model predictions and actual values. MSE directly assesses the predictive error at a node. A feature that consistently reduces MSE across multiple nodes in several trees is frequently selected as the splitting feature, thereby increasing its weight. The use of MSE in regression problems provides a standardized measurement for segment weights, enabling comparability among different segments.
Phase feature parameters can indicate changes in soil moisture, and the stronger their correlation, the more accurate the soil moisture retrieval. However, the correlation between phase data from different satellite segments and soil moisture varies significantly. Identifying and utilizing segments with strong correlations is key to enhancing the accuracy of soil moisture retrievals. The Random Forest’s MDI algorithm adaptively identifies high-correlation satellite segments by calculating the decrease in impurity at splitting nodes, thereby assigning weights and establishing a reliable retrieval model.
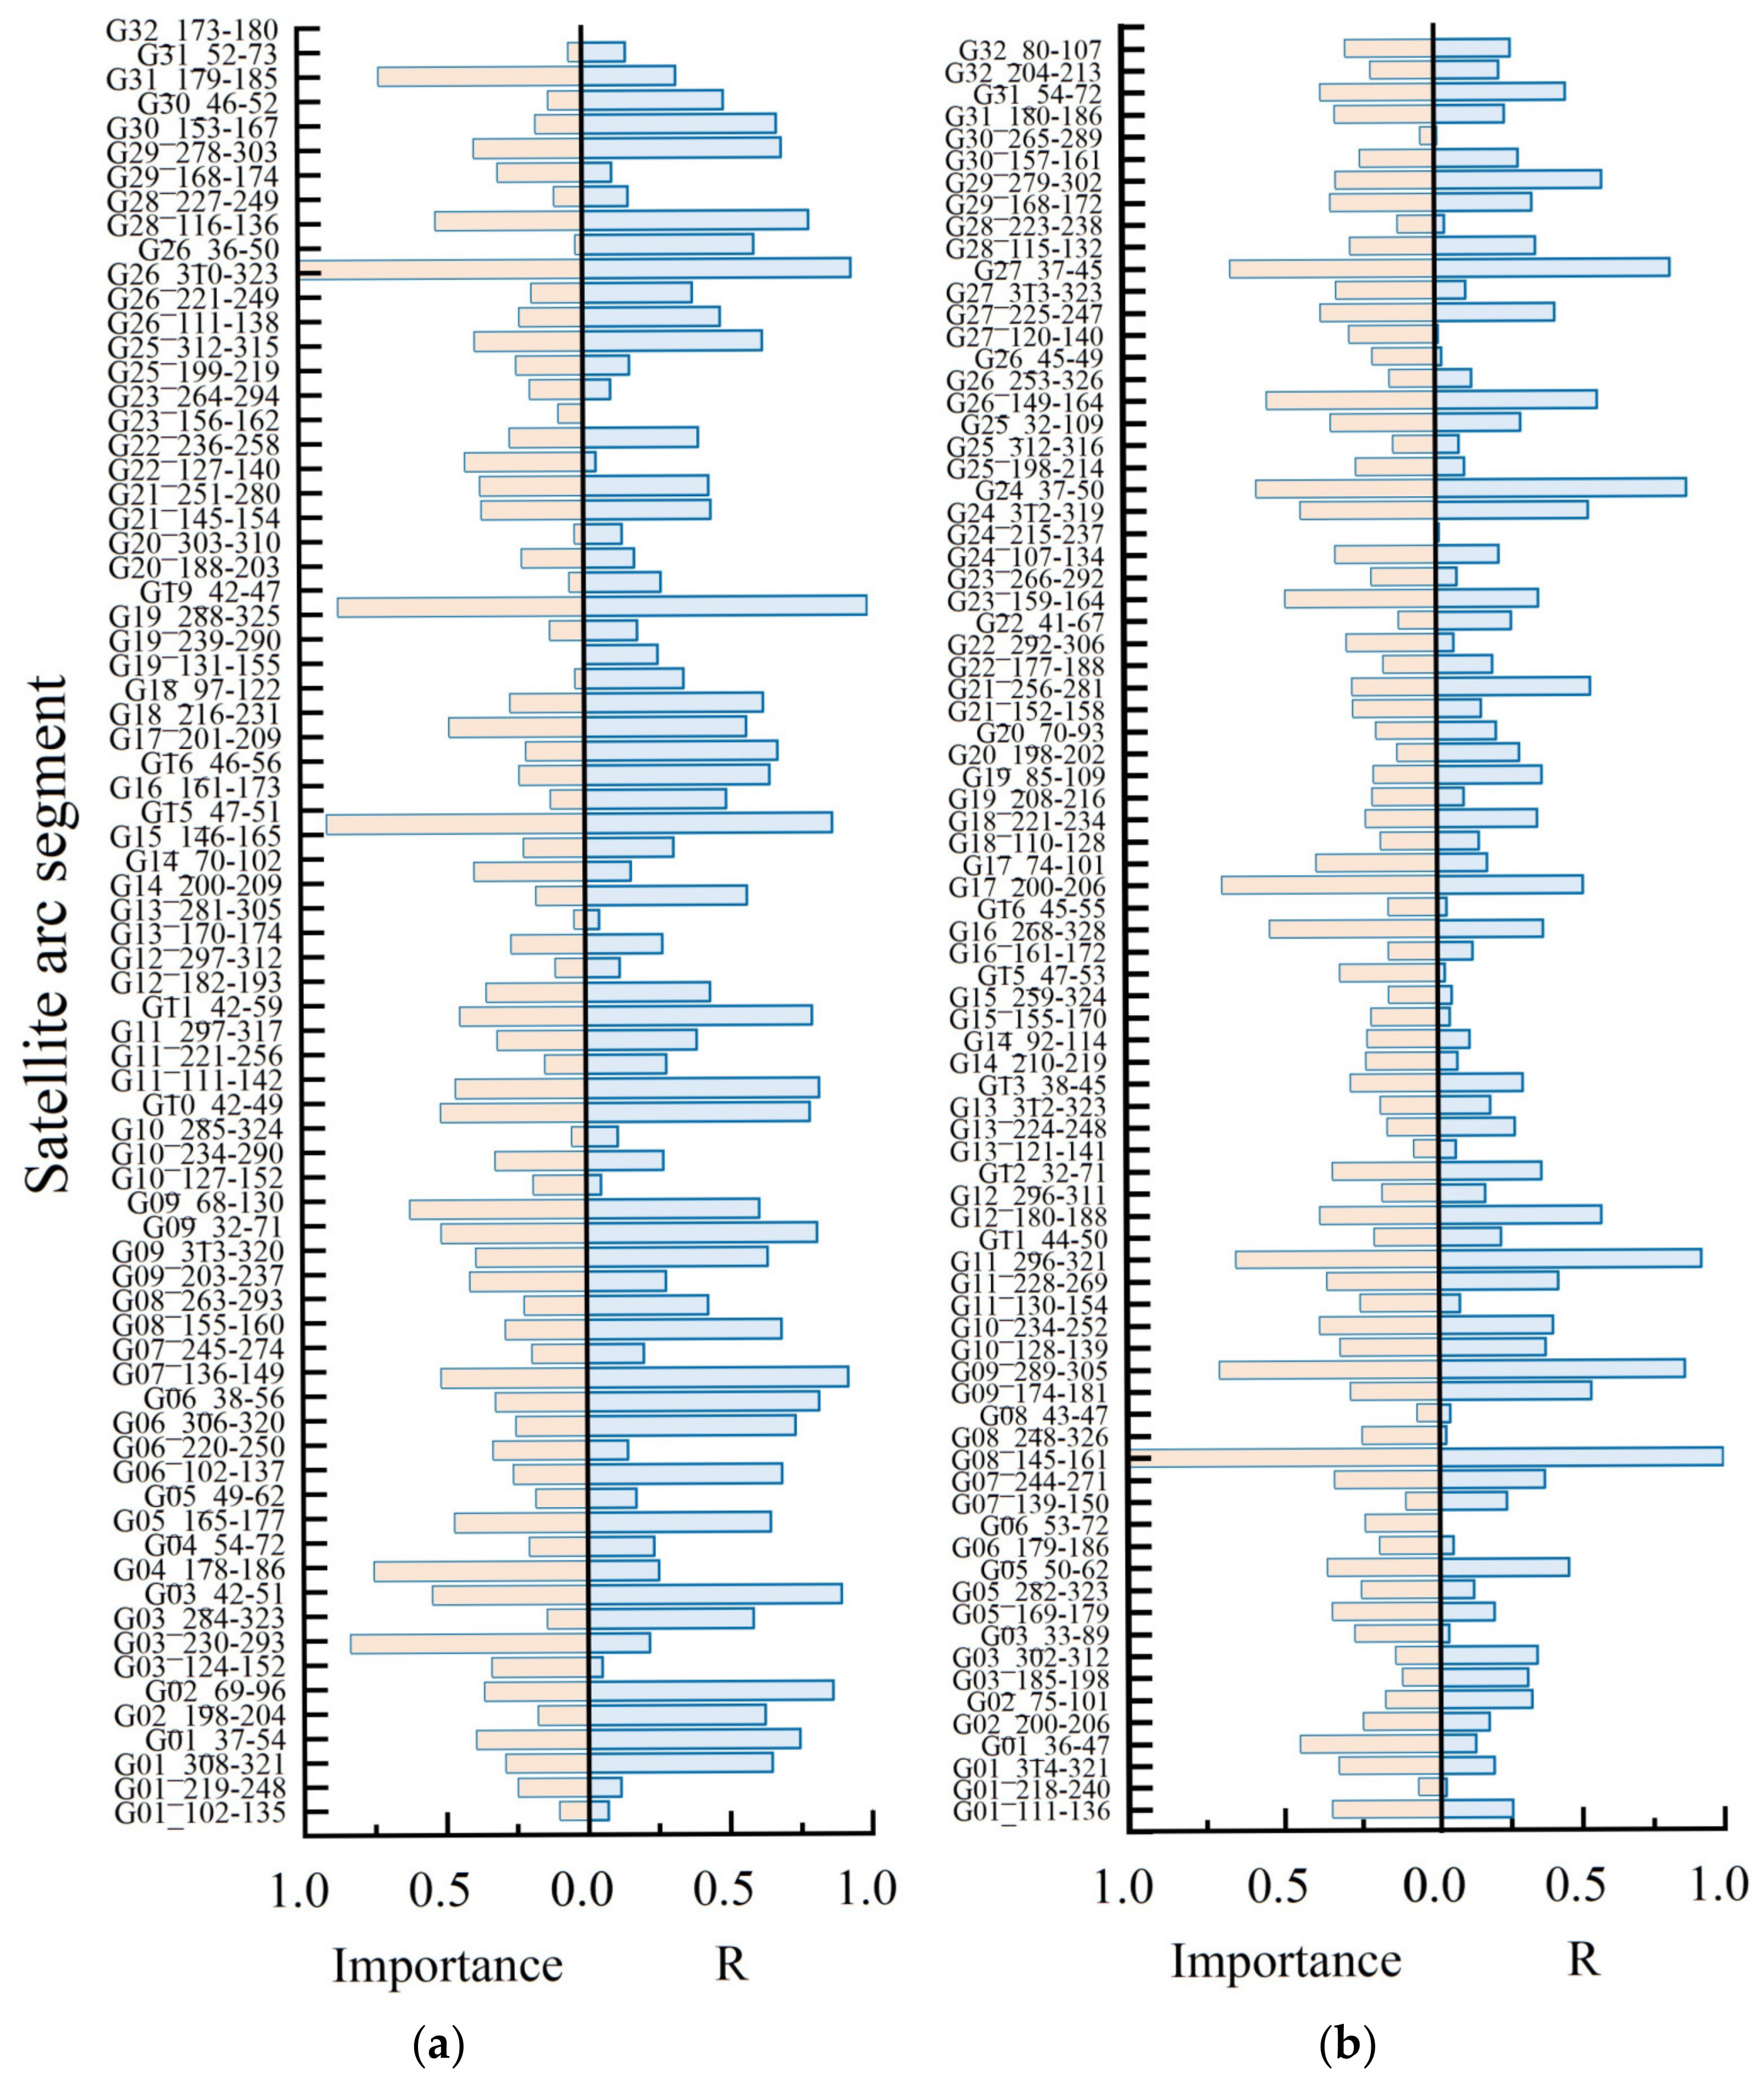
To validate the appropriateness of segment weight assignment based on MDI in the RF model, this study compared the importance of various segments, as output by the RF model, with the correlation coefficients between phase and reference soil moisture values. Figure 14 illustrates the relationship between segment importance and correlation coefficients at stations P041 and P037.
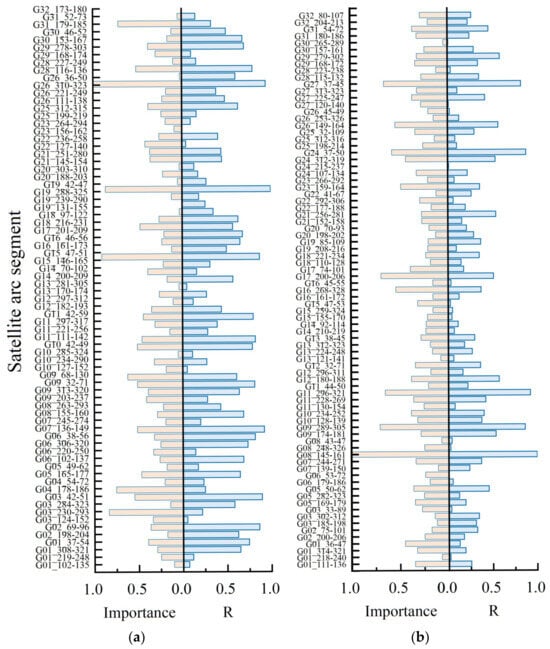
Figure 14.
(a) Plot of the importance of each arc segment versus the correlation coefficients of the phase and soil moisture reference values at station P041; (b) comparison plot between the importance of each arc segment and the correlation coefficients of phase and soil moisture reference values at station P037.
As shown in Figure 14, for ease of comparative analysis, the importance of segments and their correlation coefficients were normalized using min–max normalization. There is a significant positive correlation between the segment importance calculated by the RF model and their correlation coefficients. Segments with lower correlation coefficients at the two sites also demonstrated lower segment importance, displaying consistent trends overall. This indicates that the RF model, utilizing the MDI algorithm, can accurately capture segments beneficial for soil moisture retrieval from large multi-feature datasets. It effectively leverages segments with high correlations while diminishing the impact of segments with low correlations on the model, making it more suitable for soil moisture retrieval based on multi-satellite fusion data compared to other machine learning models. The aforementioned results demonstrate that the soil moisture retrieval model proposed in this study, based on a Random Forest model and multi-satellite data fusion, possesses strong reliability and generalization capabilities.
5.2. Performance Analysis of the RF Model Based on the MDI Algorithm
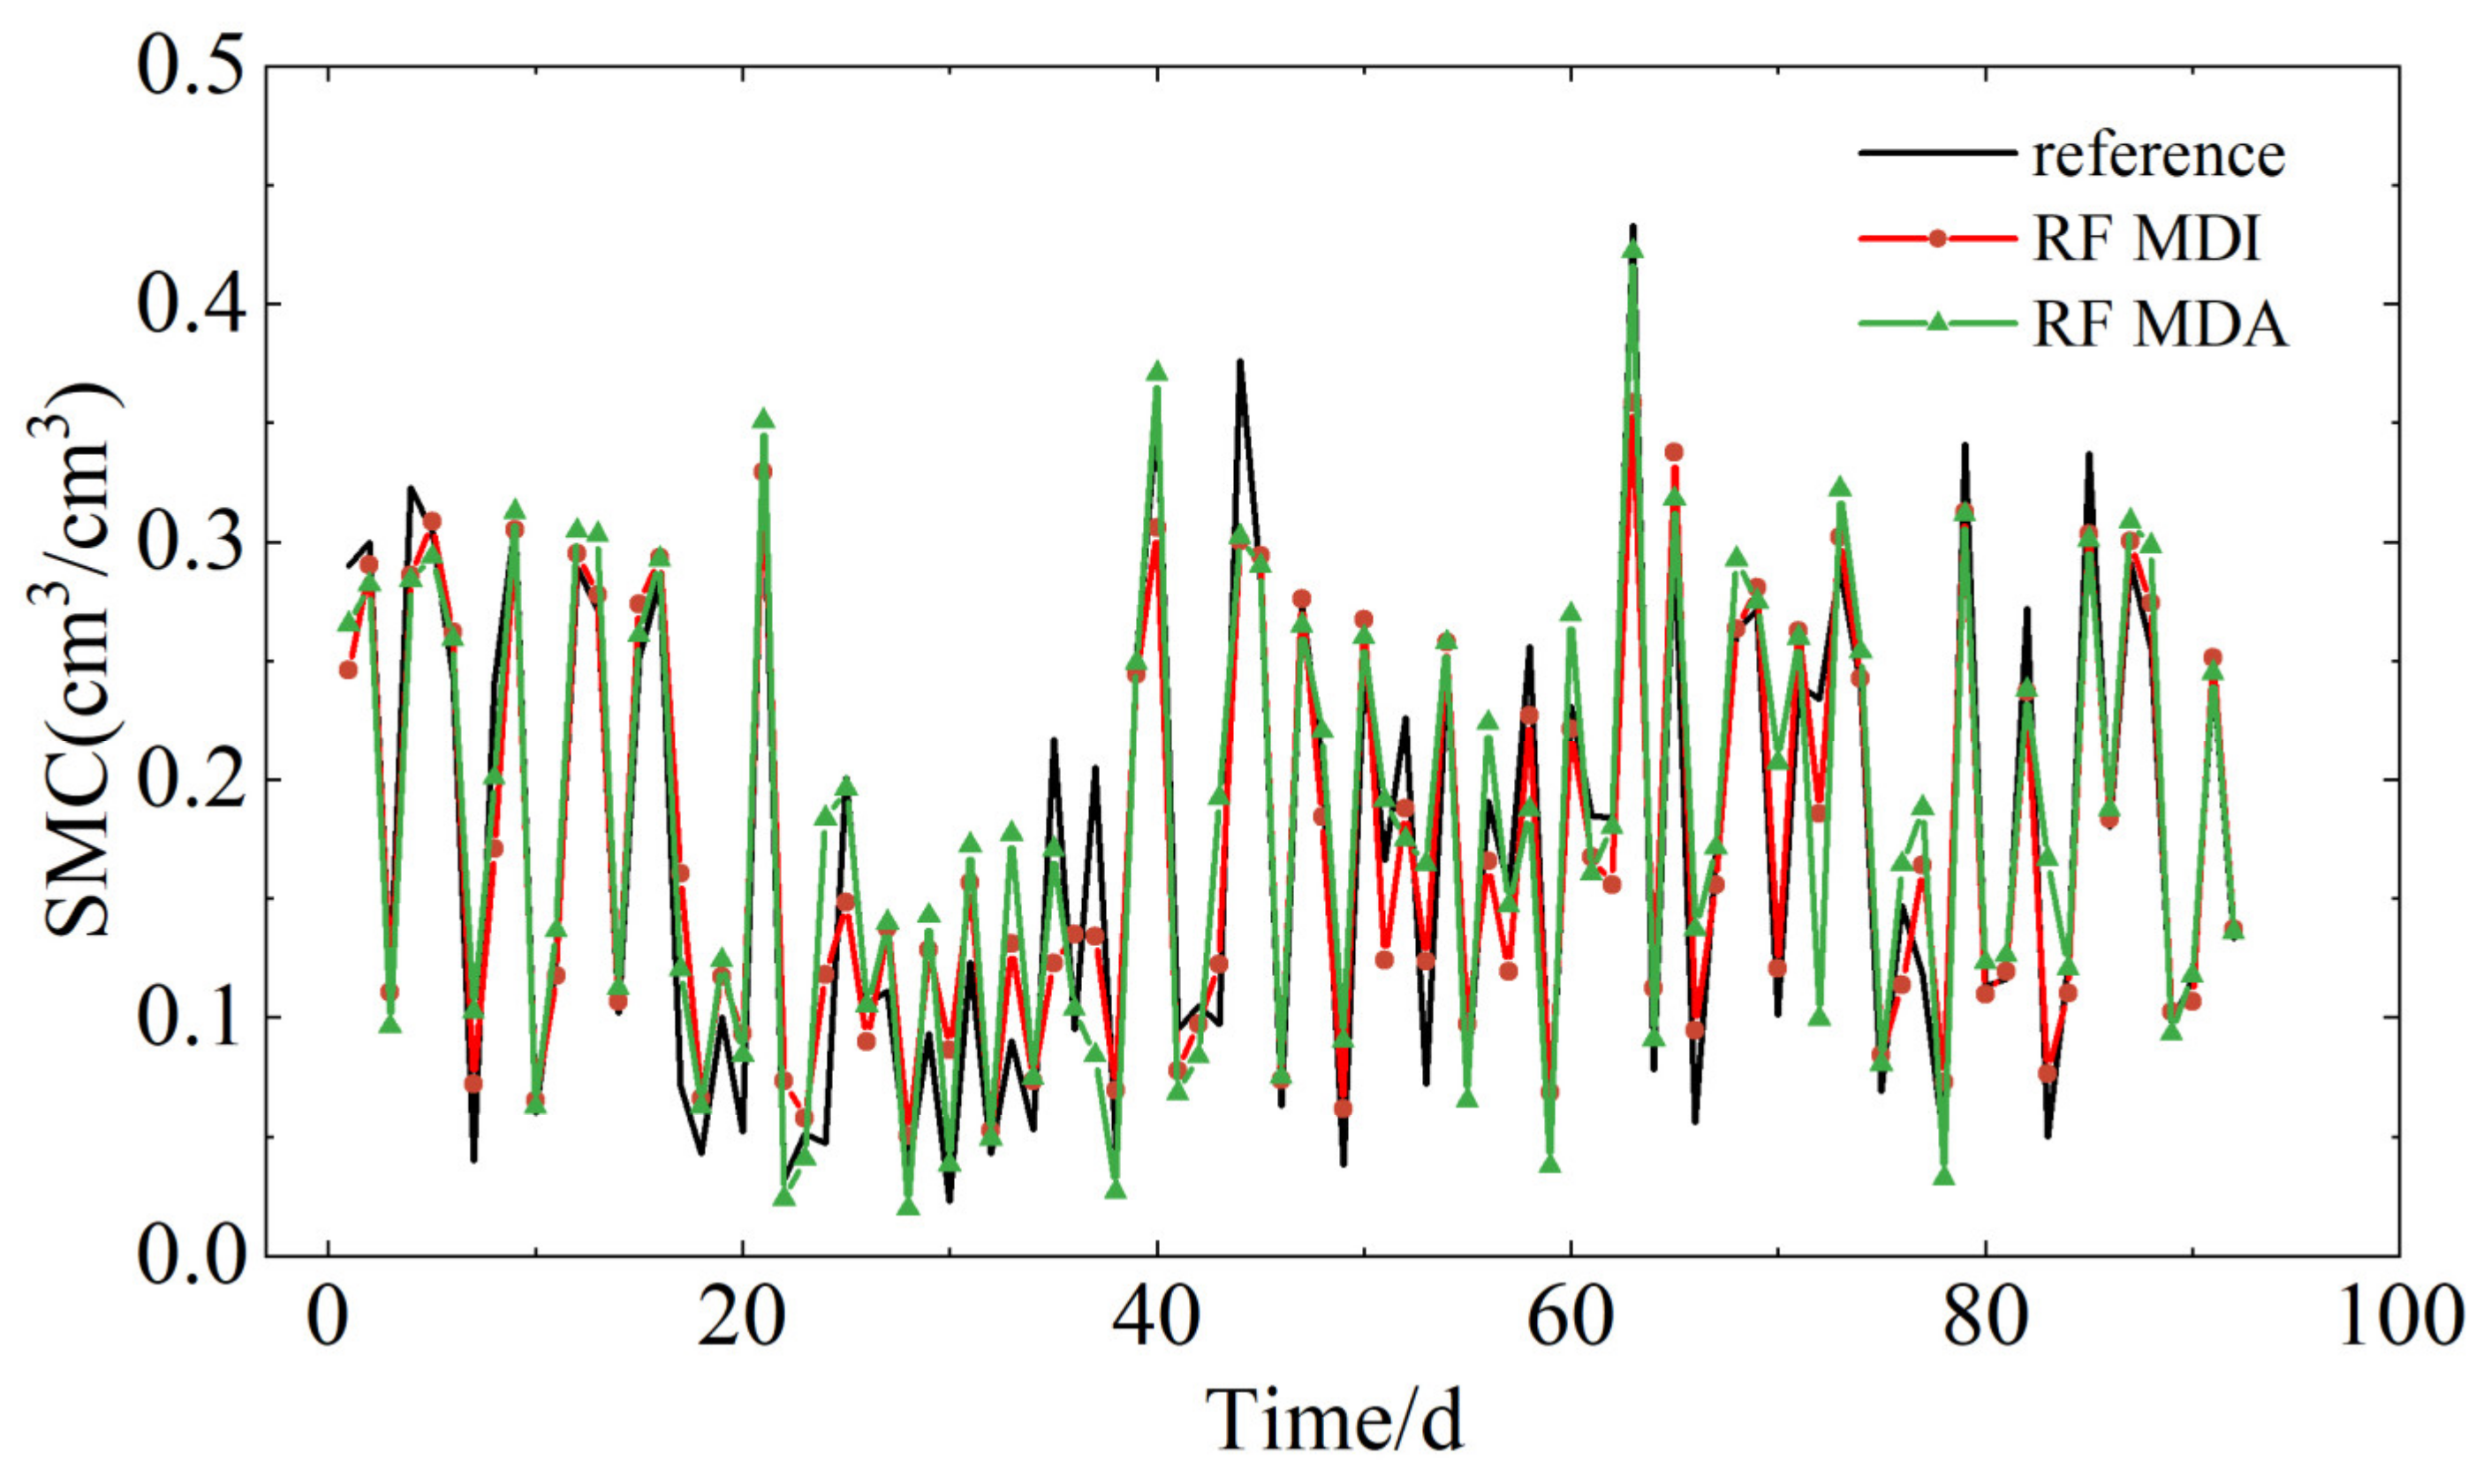
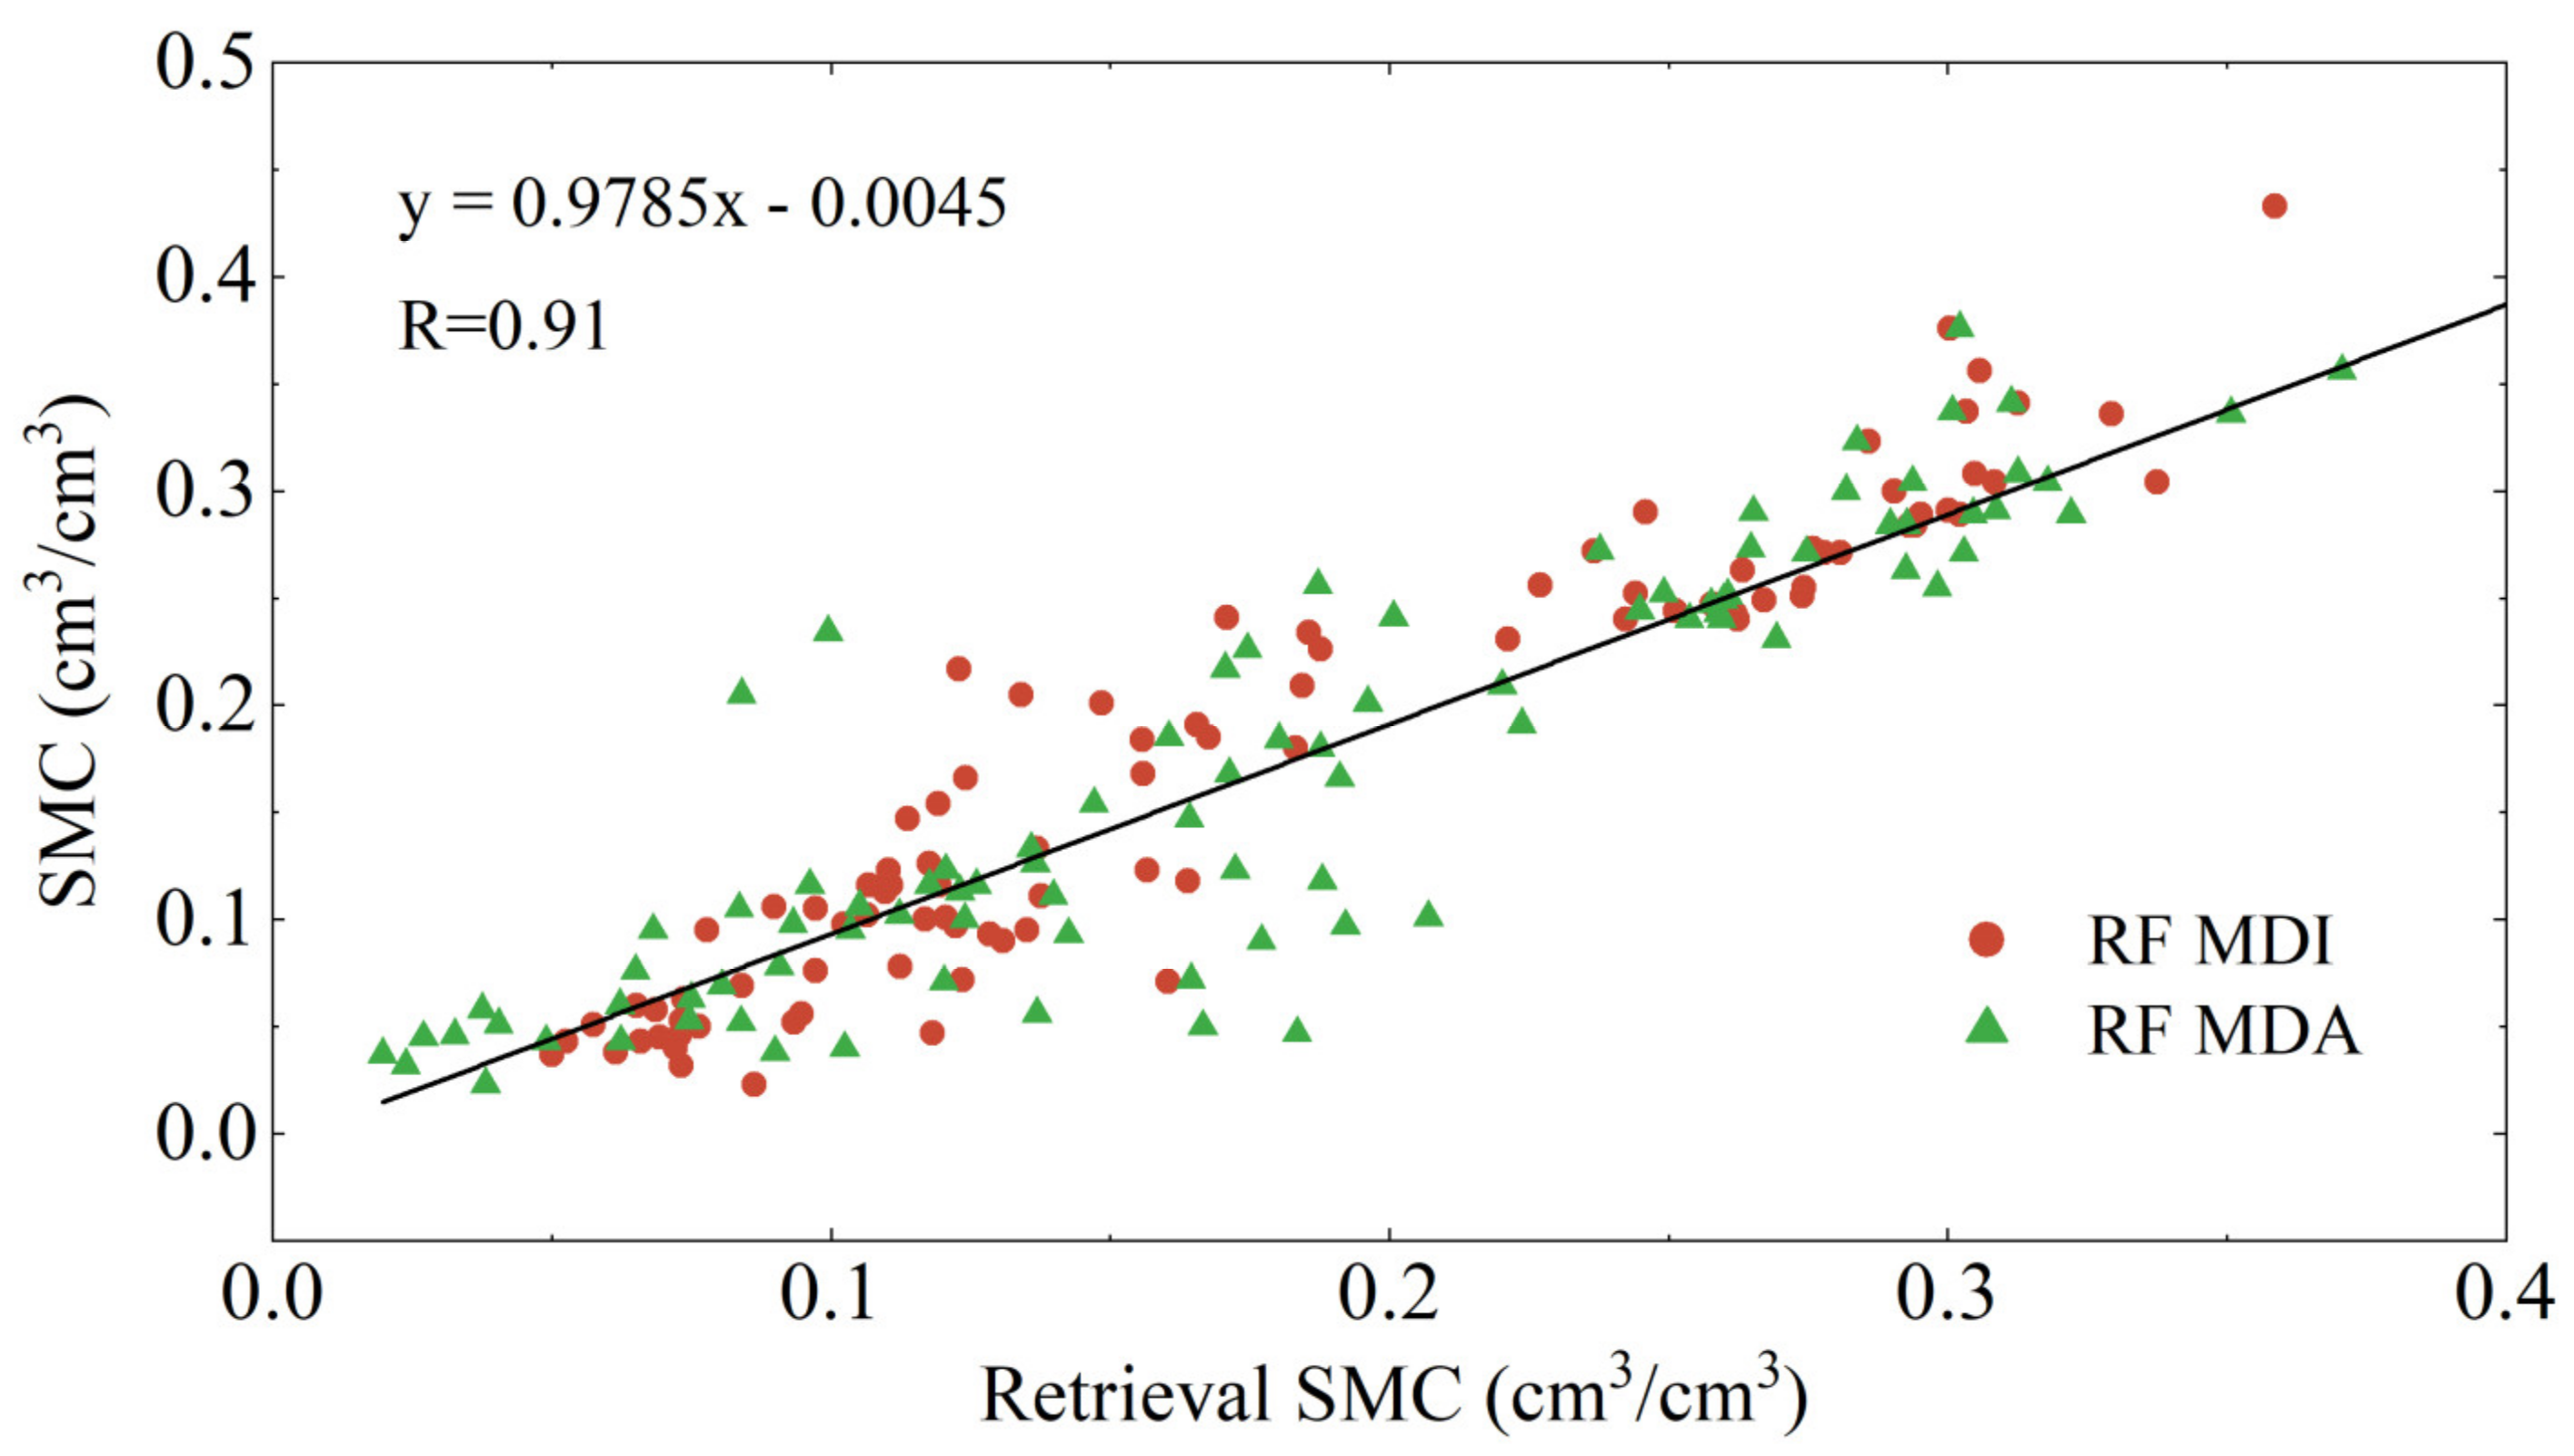
To further investigate the impact of MDI on the performance of the RF model, this study replaced the MDI algorithm based on Mean Squared Error (MSE) with a Mean Decrease Accuracy (MDA) algorithm based on Mean Absolute Error (MAE). Like MDI, the MDA algorithm uses the reduction in MAE before and after node splits to select the optimal splitting node. It measures the importance of features by observing changes in model accuracy when a specific feature is shuffled, using MAE as the accuracy metric. Figure 15 displays the soil moisture retrieval results at the P041 site using the two different algorithms, Figure 16 shows their linear regression analysis, and Table 3 lists the specific values of the accuracy metrics for the retrieval values produced by the two algorithms.
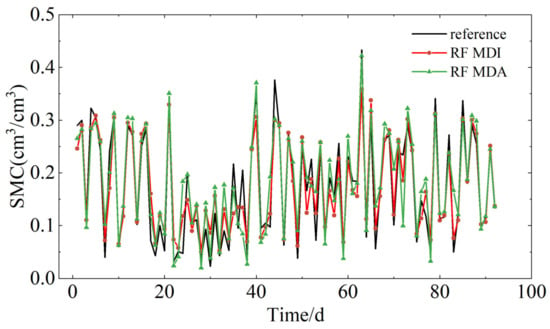
Figure 15.
A comparison of the soil moisture retrieval results from the RF models based on MDI and MDA at the P041 site against the reference values.
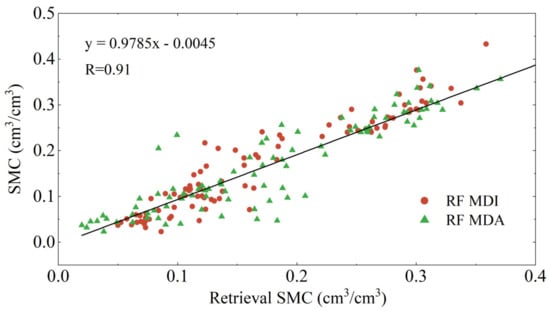
Figure 16.
A linear regression analysis of the soil moisture retrieval results from different RF models at the P041 site compared to the reference values. Red dots represent the MDI algorithm, and green triangles represent the MDA algorithm.

Table 3.
R, RMSE, and MAE between retrieved soil moisture and reference values for both algorithms at site P041.
From Figure 15 and Figure 16, it can be seen that the soil moisture retrieval results based on the MDA algorithm align with the trend of the reference values, but compared to the MDI algorithm the results are more dispersed relative to the reference values. The R between the MDA-based retrieval results and the soil moisture reference values is 0.91, with an RMSE of 0.042, and the overall MAE is 0.029. Compared to MDA, the MDI retrieval results show a 31.2% reduction in RMSE and a 16% reduction in overall MAE. The experimental results indicate that the performance of the RF model based on MDI is superior to that based on MDA. This is because the MDA algorithm uses the reduction in MAE before and after node splits to select the optimal splitting nodes, and MAE, having linear characteristics, is not sensitive enough to larger errors. In contrast, the non-linear characteristics of MSE can capture more complex data structures and more accurately select the optimal splitting nodes, thus the RF model based on MDI exhibits stronger retrieval performance.
5.3. Analysis of the Impact of Terrain on Soil Moisture Retrieval
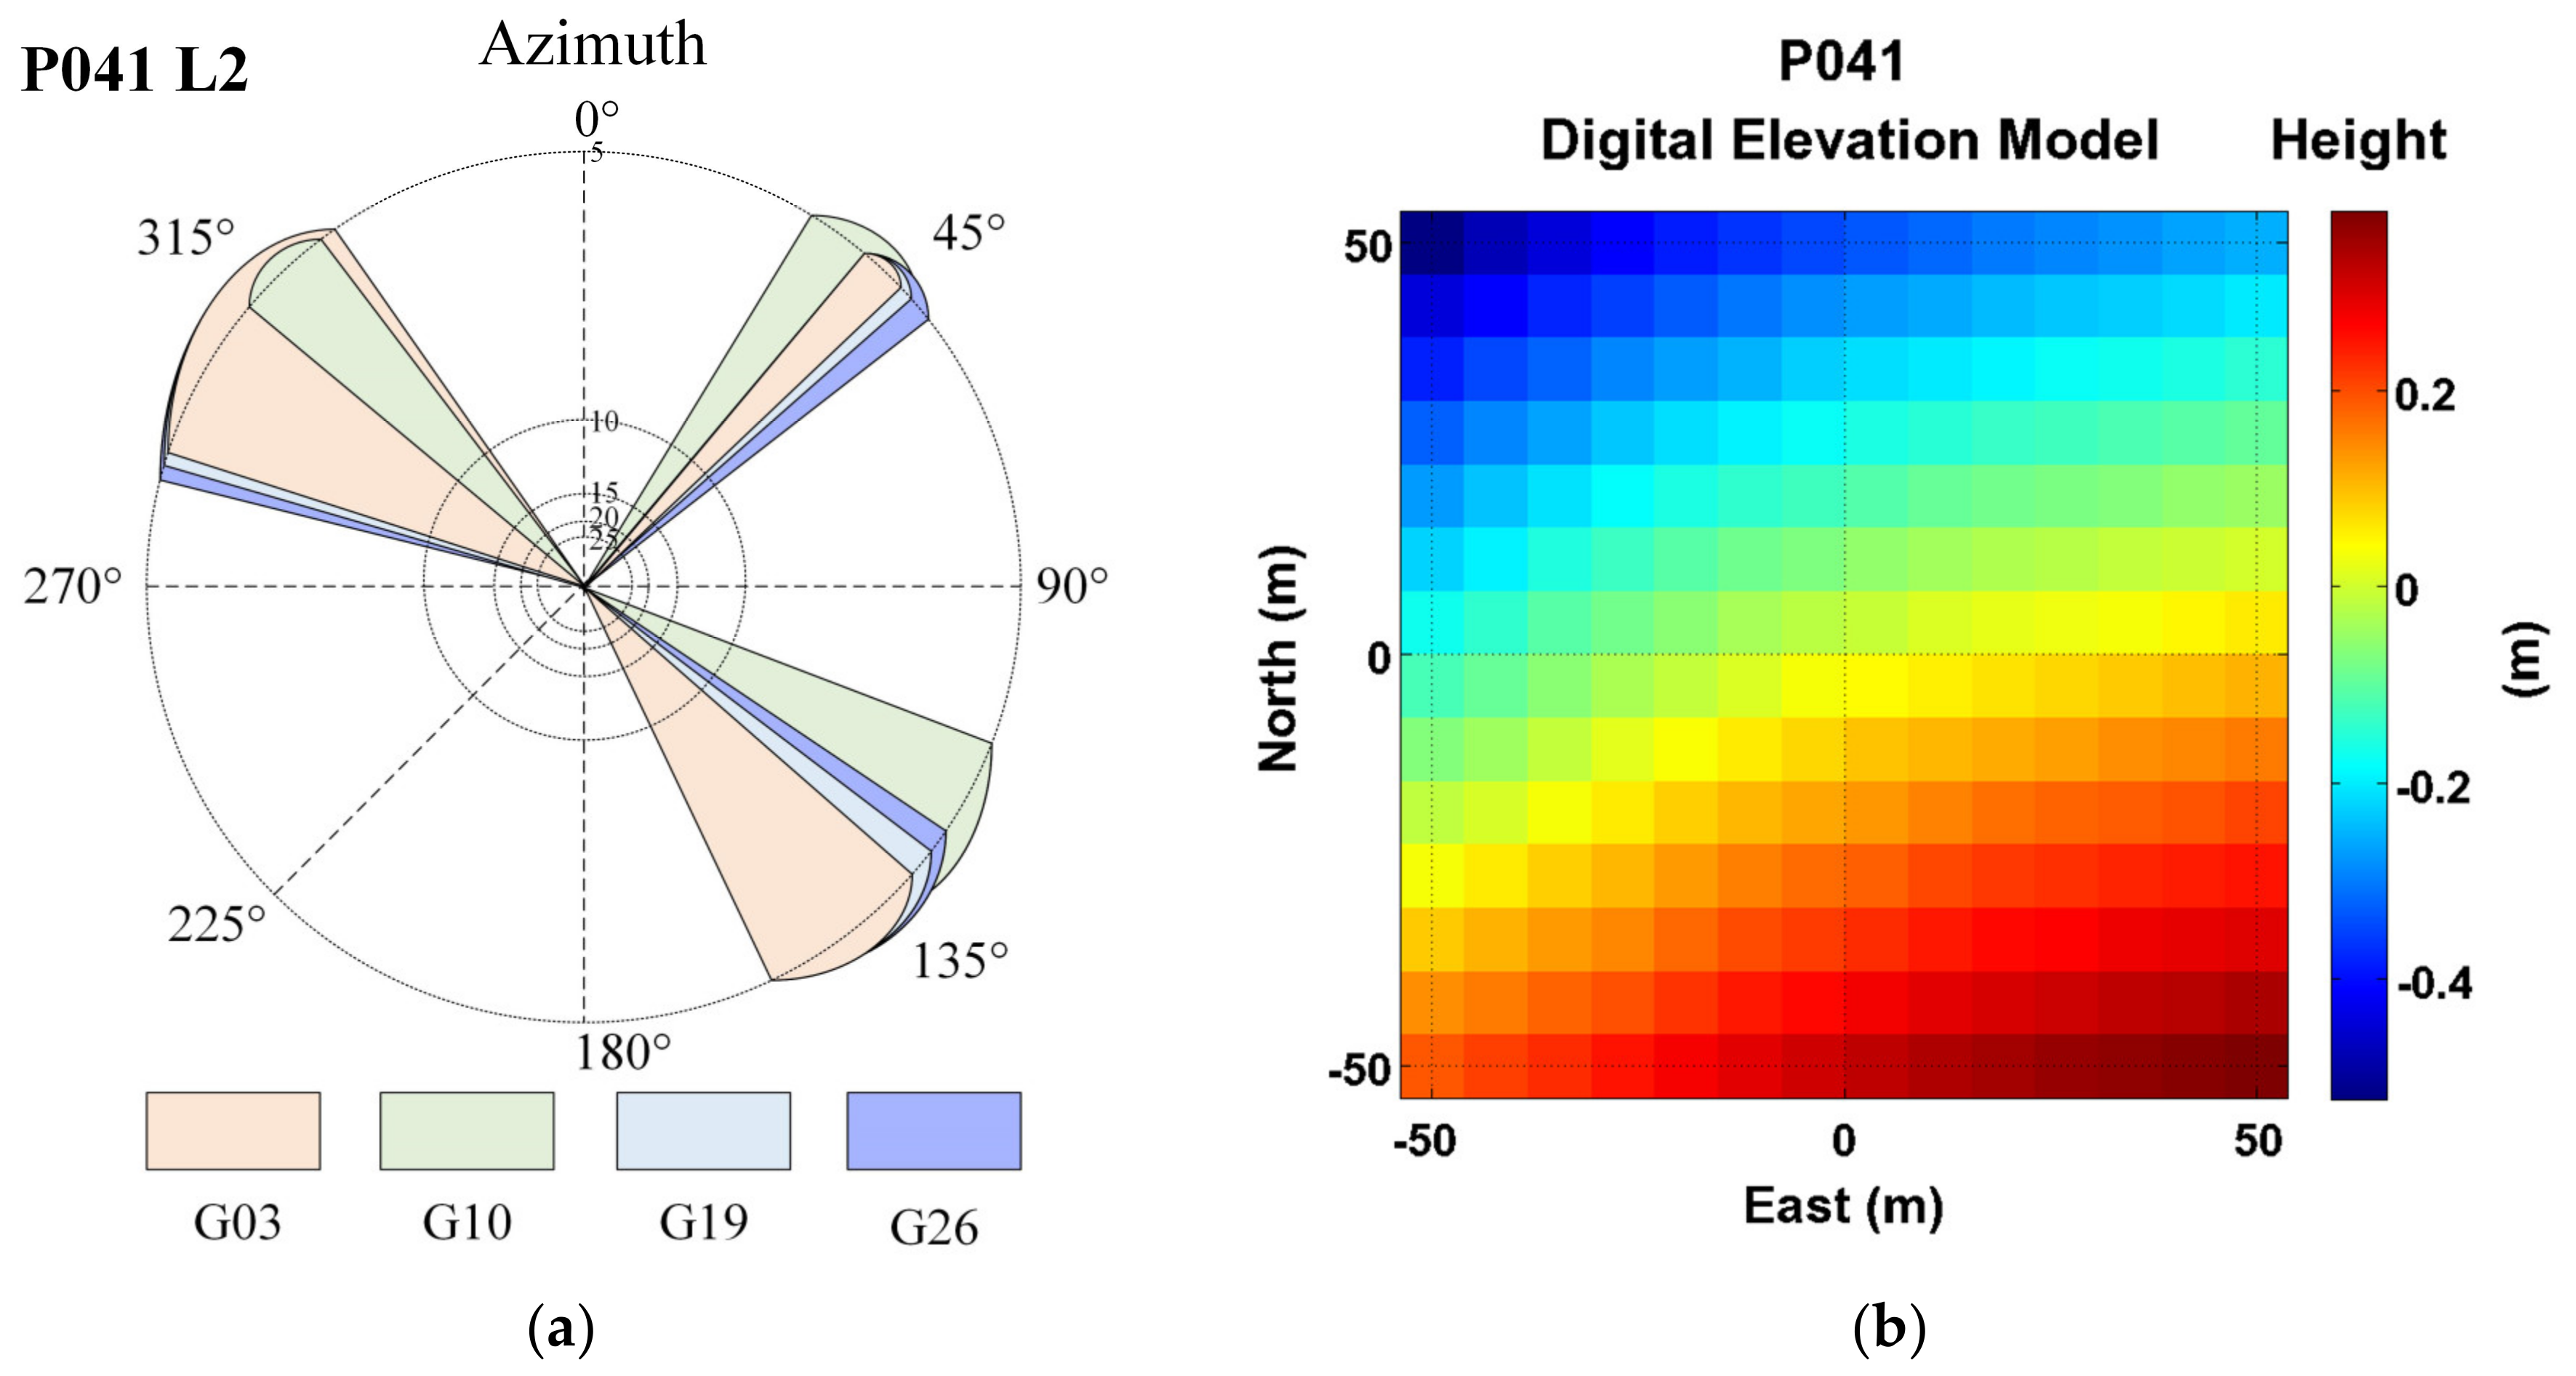
Due to the daily revisit cycle of GPS satellites and the relatively fixed trajectory of each satellite, the entire satellite network’s arc segments almost completely cover all areas surrounding the receiver, adequately reflecting the impact of different terrains on the reflected signals. Existing research shows that there is a linear relationship between the phase of the reflected signal and soil moisture [7]. Therefore, a stronger correlation between phase and soil moisture is more conducive to soil moisture retrieval. To explore the impact of terrain changes on soil moisture retrieval, this paper analyzed the DEM map near the P041 site, as shown in Figure 17b. It was found that the terrain gradually rose to the southeast of the P041 site, gradually decreased to the northwest, and was relatively flat to the west and northeast. Four satellites, whose arc segments spanned rising, lowering and flat terrains, were selected to compare the impact of different terrains on soil moisture retrieval. Figure 17a displays the azimuth range maps for three types of arc segments from four satellites. Figure 17b displays the DEM map near the P041 site.
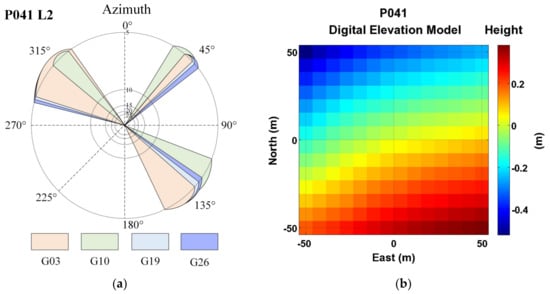
Figure 17.
(a) Distribution of arc segments for satellites G03, G10, G19, and G26; (b) the DEM near the P041 station.
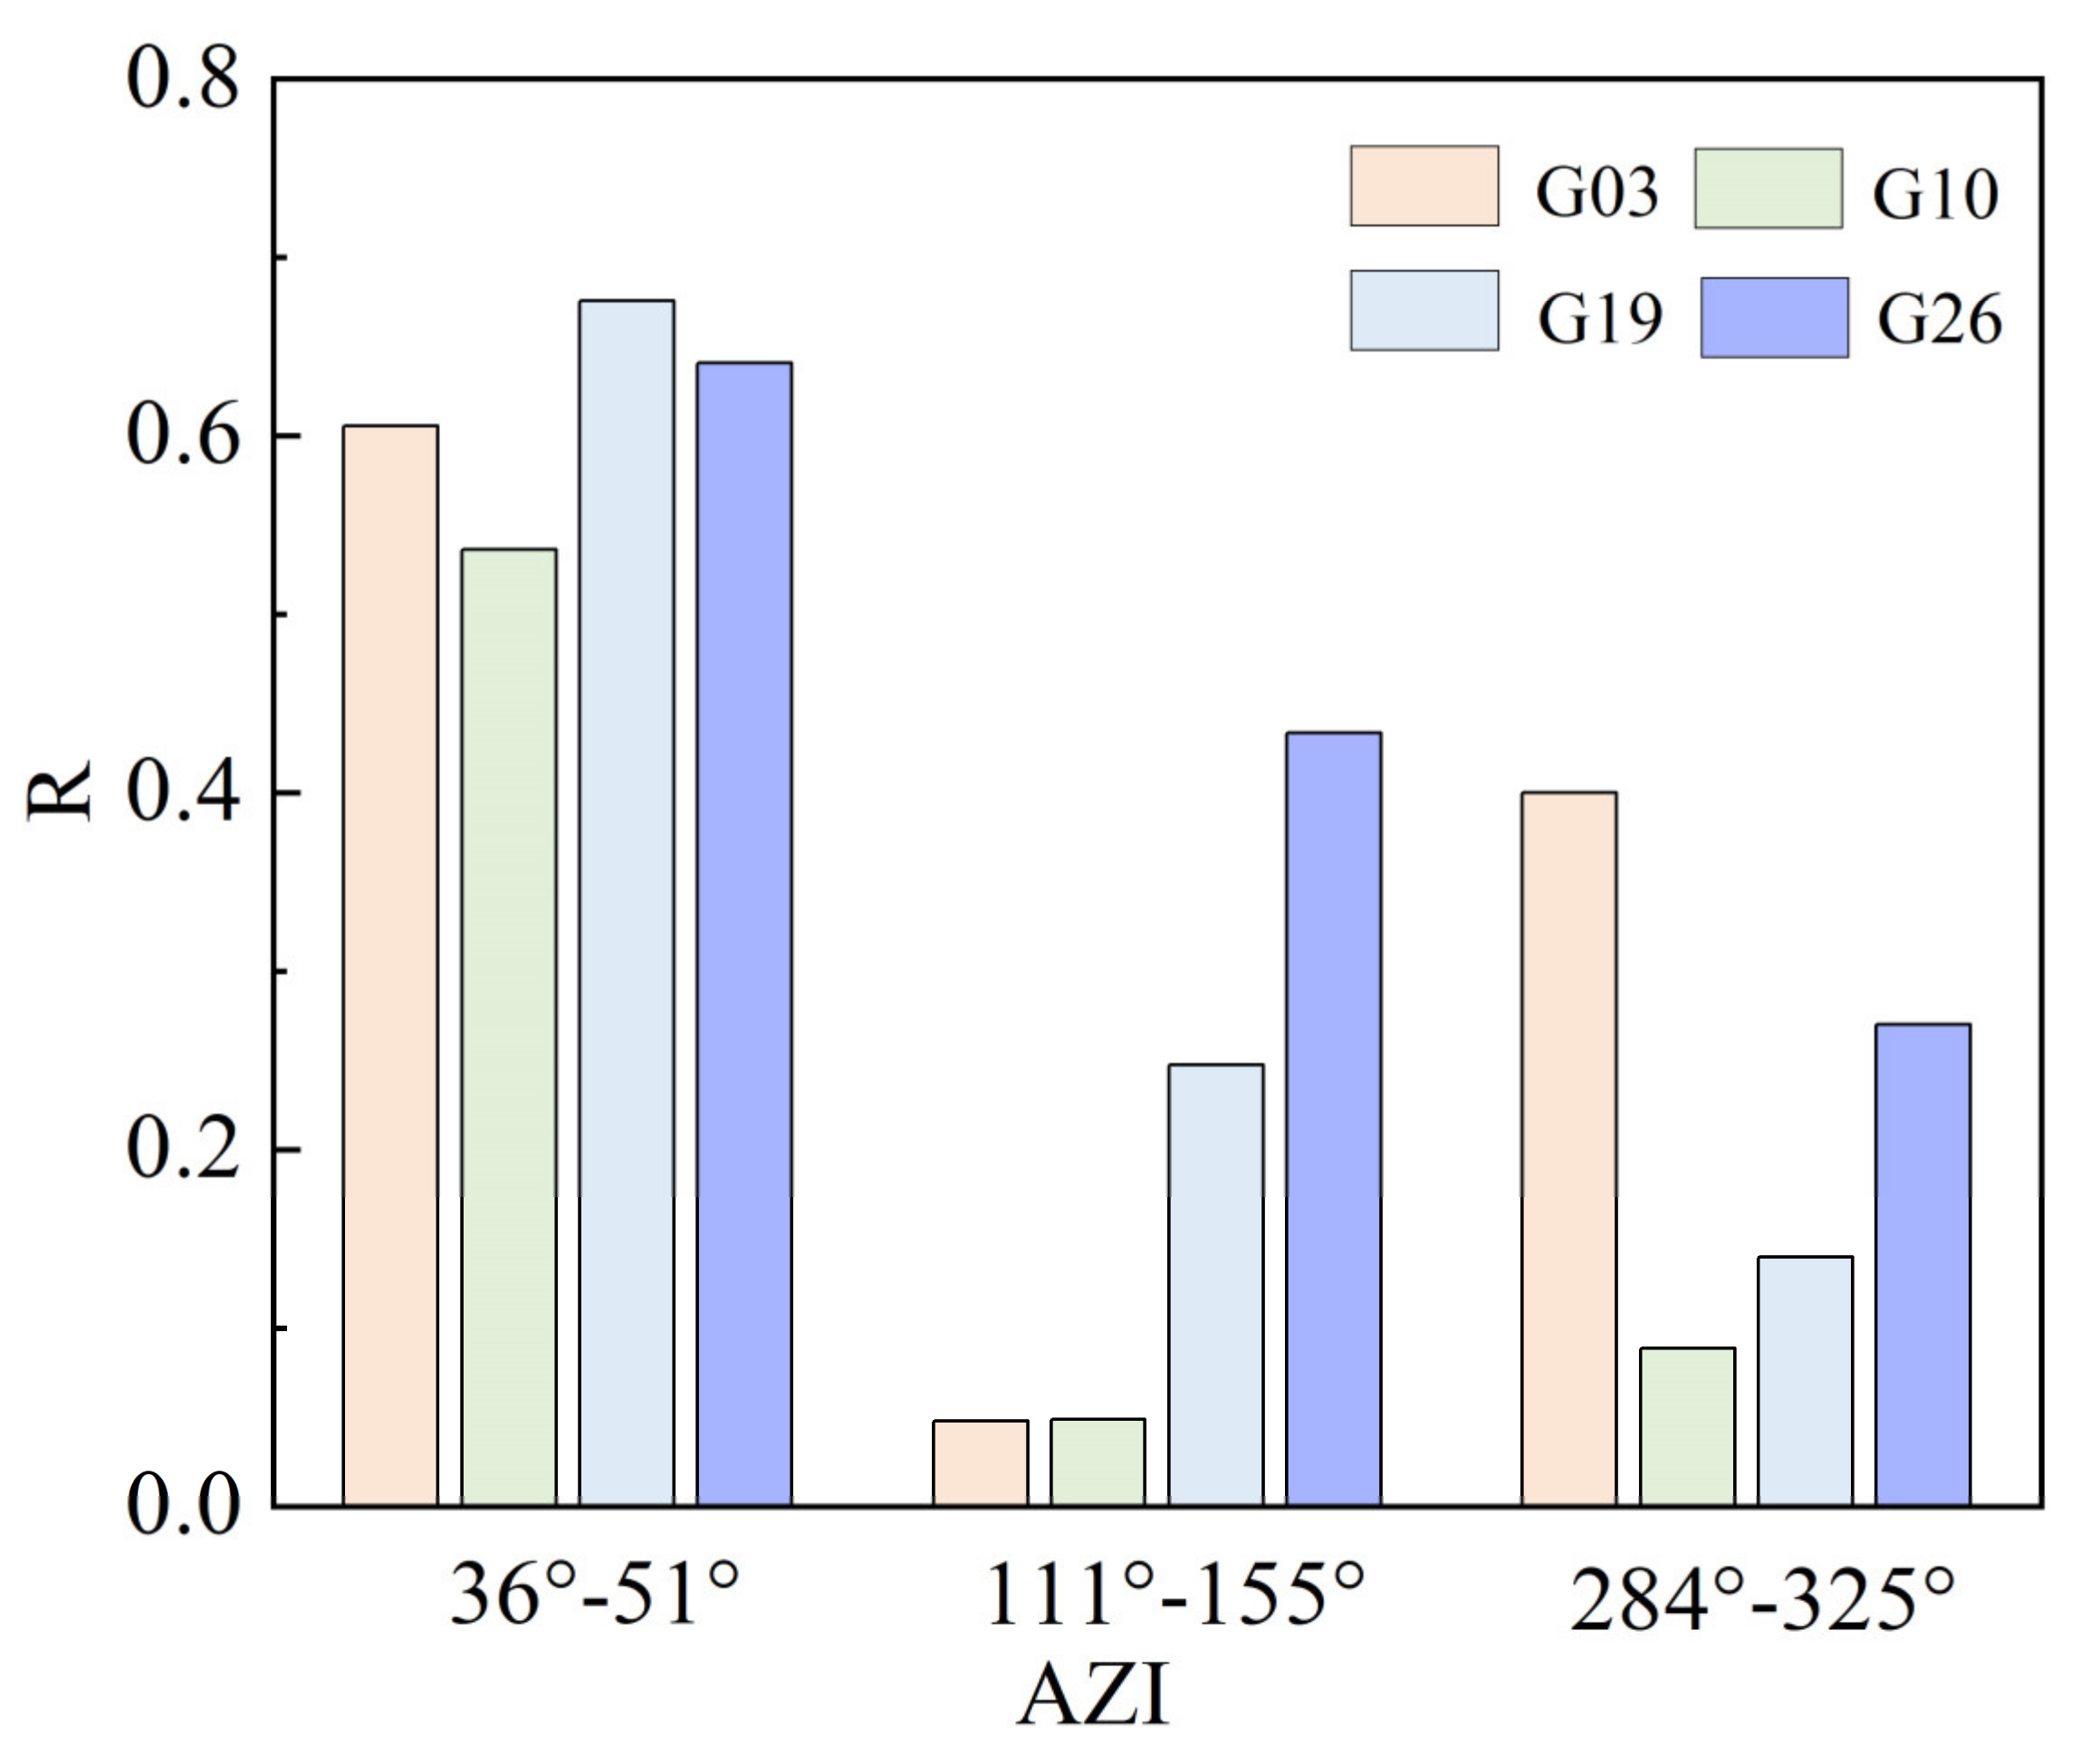
In Figure 17a, the total azimuth range for the four satellites was, respectively, 36°–51°, 111°–155°, and 284°–325°. Subsequently, the phases derived from the different arc segments of these four satellites were correlated with the soil moisture reference values. This analysis was combined with DEM to study the impact of terrain on soil moisture retrieval. Figure 18 shows the correlation between the phases from different arc segments of the four satellites, and the soil moisture reference values. Table 4 displays the R between the phases of different satellites at various azimuth angles, and the soil moisture reference values.
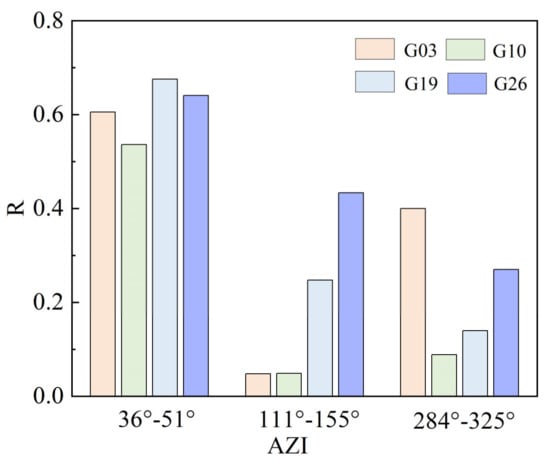
Figure 18.
The correlation coefficients between the phase of different satellites at various azimuth angles and the soil moisture reference values.

Table 4.
The R between the phase of different satellites at various azimuth angles, and the soil moisture reference values.
In this study, satellites G03, G10, G19, and G26 were selected based on the DEM at the P041 site to analyze the impact of terrain on the results of soil moisture retrieval. From Figure 18 and Table 4, it is evident that, when the satellite trajectory azimuth angles were between 36° and 51°, the phases extracted from satellites G03, G10, G19, and G26 all had a high correlation with the soil moisture reference values, with an average correlation coefficient of 0.61. The correlation coefficients of the phases with reference values decreased when the azimuth angles ranged between 111° and 155°, and between 284° and 325°, with average correlation coefficients of 0.19 and 0.22, respectively. Among these, the correlation coefficients for G19 and G26 gradually decreased as the azimuth angle increased, while the coefficients for G03 and G10 showed fluctuations. Overall, when the satellite trajectory azimuth angle was between 36° and 51°, the correlation between the satellite phases and the reference values was the most stable, whereas the correlations at other azimuth angles exhibited instability.
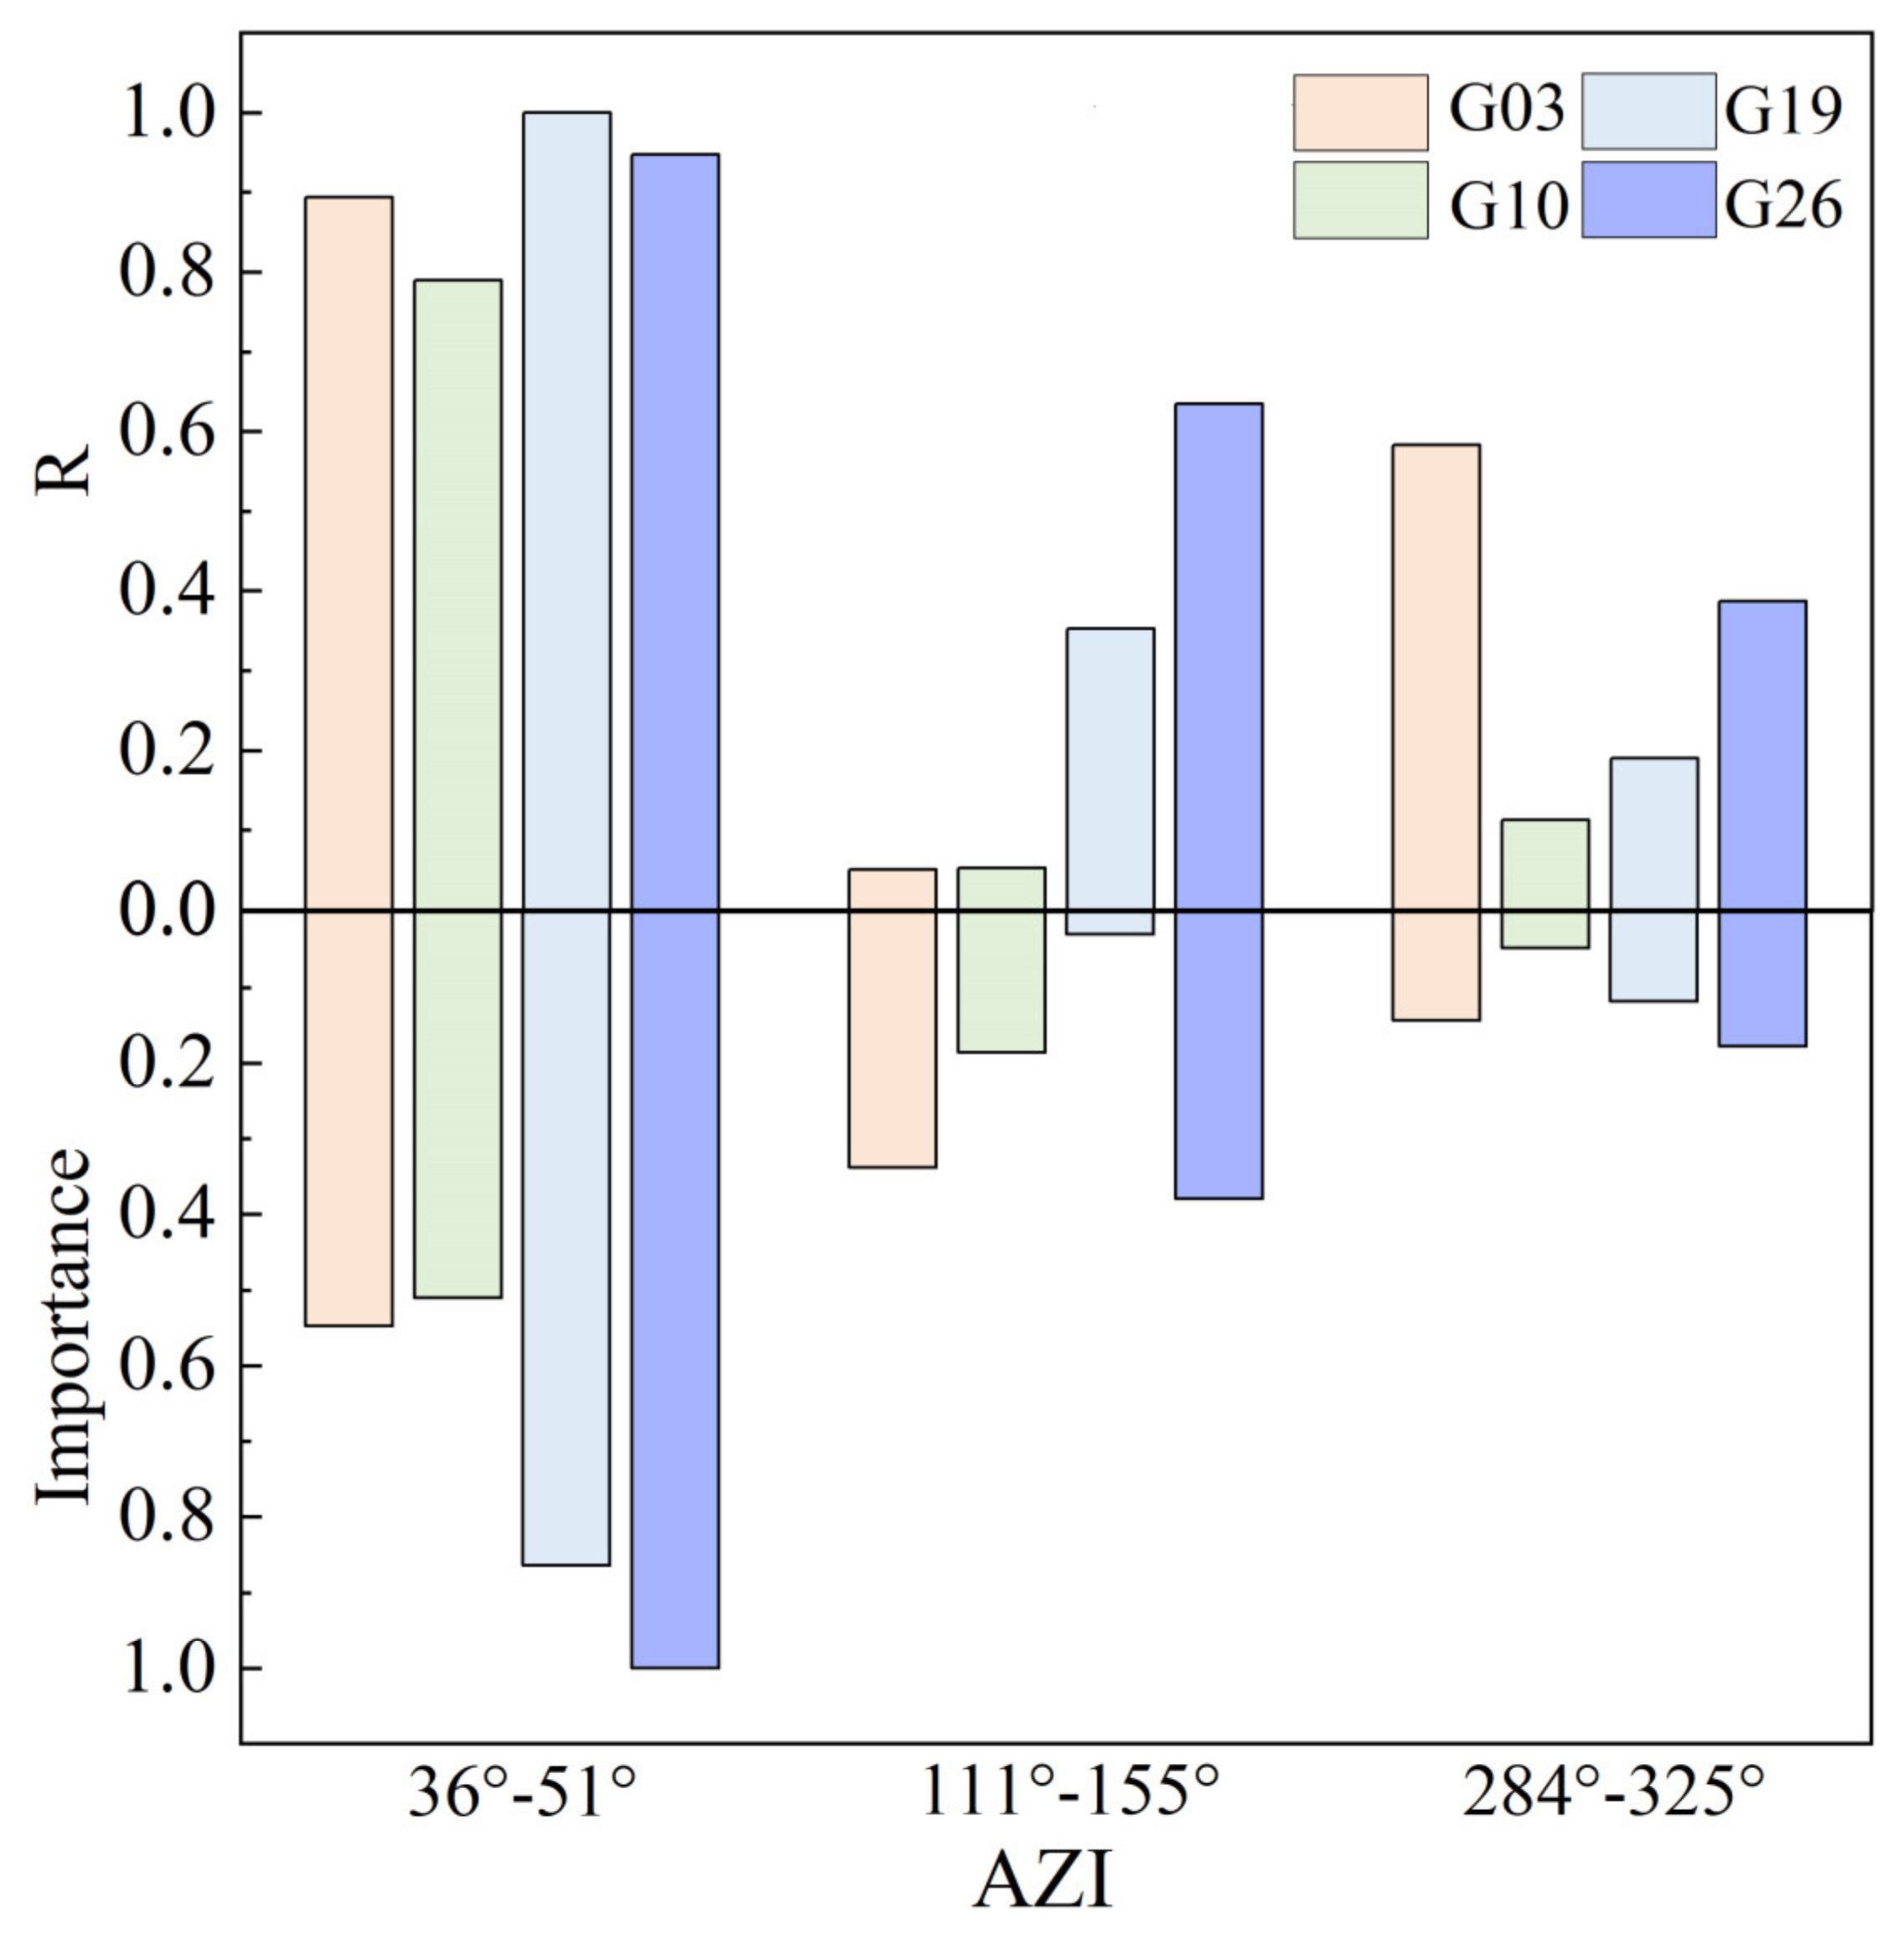
Figure 19 shows the mapping relationship between the correlation coefficients of different satellites at various azimuth angles and the corresponding normalized segment importance. The graph reveals that segments with higher correlation coefficients also had greater importance, indicating that the RF model based on MDI can recognize the quality of segment data during the retrieval process and assign appropriate weights. However, the graph also shows that some segments with high correlations are assigned lower weights than those with lower correlations, which could be a source of model error.
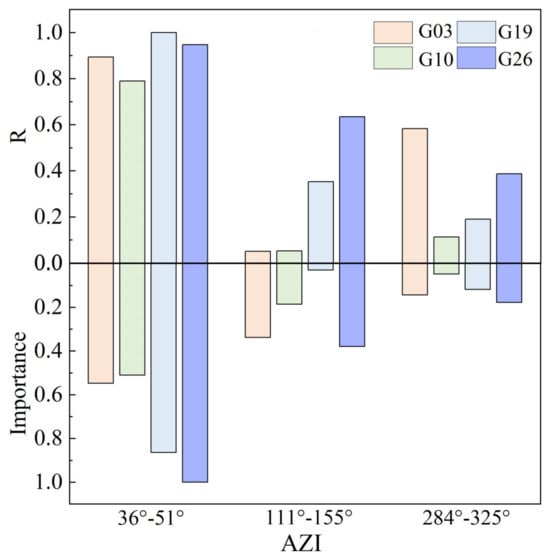
Figure 19.
The upper Y–axis represents the normalized correlation coefficients between the phase of different satellites at various azimuth angles and the soil moisture reference values, while the lower Y–axis shows the importance of arc segments corresponding to those azimuth angles.
Comparing the correlation between the phase data from different trajectory azimuth angles at the P041 station with soil moisture reference values against the DEM map reveals that, in areas with flatter terrain, the correlation between satellite phases and soil moisture reference values is higher and more stable. The MDI algorithm also shows high segment importance in these areas. However, in areas with significant terrain undulations, the correlation between phases and soil moisture reference values is lower, and while MDI may occasionally misjudge individual segments, the overall importance assigned is also low. Therefore, terrain factors indirectly affect the judgments made by the MDI algorithm. Fortunately, experimental results demonstrate that the MDI algorithm can effectively identify data with strong correlations, mitigating the impact of terrain on soil moisture retrieval and enhancing the reliability of the model’s retrieval outcomes.
6. Conclusions
To minimize the impact of human intervention on the reliability of soil moisture retrieval, this study proposed a soil moisture retrieval method based on Random Forest and multi-satellite data fusion GNSS-IR. Phase characteristic parameters were extracted using the SNR observation data from the L2 band at PBO sites P041 and P037, as well as SNR observation data from the L2 band collected in Lamasquere, France. These parameters from different satellite arcs were fused, and a Random Forest model was employed to establish the soil moisture retrieval model. Additionally, Support Vector Machine, Radial Basis Function neural network, and Convolutional Neural Network models were incorporated and compared against soil moisture reference values. The analysis led to the following conclusions:
- Using multi-satellite fusion data for soil moisture retrieval effectively enhances data utilization and retrieval accuracy. At station P041, the average R for the four models reached 0.87, with RMSE values ranging between 0.03 and 0.075 cm3/cm3, and MAE values between 0.02 and 0.06 cm3/cm3. At station P037, the average R for the four models was 0.88, with RMSE values between 0.025 and 0.04 cm3/cm3, and MAE values between 0.02 and 0.03 cm3/cm3. At the LM site, the average R for the four models reached 0.94, with RMSE ranging between 0.003 and 0.009 cm3/cm3, and the MAE between 0.002 and 0.007 cm3/cm3.
- The Random Forest model, which uses the MDI algorithm to measure the contribution of arcs, significantly improved the robustness of the retrieval results. Compared to the SVM, RBF neural network, and CNN models, the Random Forest model exhibited the best retrieval accuracy. Quantitative results indicate that, at station P041, the R with reference values reached 0.94, with RMSE and MAE around 0.032 cm3/cm3 and 0.025 cm3/cm3, respectively. At station P037, the R reached 0.95, with RMSE and MAE around 0.028 cm3/cm3 and 0.022 cm3/cm3, respectively. At the LM site, the R reached 0.98, with RMSE and MAE around 0.003 cm3/cm3 and 0.002 cm3/cm3, respectively.
- The Random Forest model, based on the MDI algorithm, demonstrated strong reliability in measuring the importance of arc segments. There was a significant positive correlation between arc segment importance and correlation coefficients. The RF model could adaptively identify arc segments favorable for soil moisture retrieval using the MDI algorithm, and allocated weights according to their importance, exhibiting robustness and generalization performance.
- The Random Forest model based on the MDI algorithm demonstrated strong retrieval performance. Comparative experimental results show that the retrieval results of the RF model using the MDI algorithm were superior to those of the RF model based on the MDA algorithm.
- The Random Forest model based on the MDI algorithm can effectively diminish the impact of terrain undulations on soil moisture retrieval. Experimental results indicate that, in areas with flatter terrain, the correlation between phase data and soil moisture is higher and more stable. Furthermore, the Random Forest model utilizing the MDI algorithm can proficiently identify these data, thereby reducing the influence of terrain factors on soil moisture retrieval.
The experimental results suggest that, compared to previous soil moisture retrieval methods, the proposed GNSS-IR soil moisture retrieval model can adaptively allocate arc weights using the MDI algorithm, significantly reducing the need for manual intervention and extensive data preprocessing. It also exhibits strong robustness.
Author Contributions
Conceptualization, Y.J.; formal analysis, Y.J. and T.W.; funding acquisition, R.Z. and B.S.; data curation, B.Z., S.N., H.J. and K.C.; writing—original draft preparation, Y.J.; writing—review and editing, R.Z., B.S. and J.T. All authors have read and agreed to the published version of the manuscript.
Funding
This research was jointly funded by the National Key Research and Development Program of China (Grant No. 2023YFB2604001), the National Natural Science Foundation of China (Grant Nos. 42371460, U22A20565, and 42171355), the Natural Science Foundation Project of Chongqing (Grant No. CSTB2022NSCQ-MSX1671), and the Natural Science Foundation Project of Shandong Province (Grant No. ZR2021MD082).
Data Availability Statement
The GPS data can be downloaded from https://gage-data.earthscope.org/archive/gnss/rinex (accessed on 11 April 2024), and the soil moisture reference data can be downloaded from https://www.unavco.org/data/gps-gnss/derived-products/pbo-h2o/pbo-h2o.html (accessed on 11 April 2024).
Acknowledgments
The authors thank the UNAVCO (https://www.unavco.org/, accessed on 11 April 2024) for providing the GNSS site (P037 and P041) data and soil moisture reference data. The authors would also like to thank José Darrozes professor from Laboratoire Géosciences Environnement Toulouse, Université Paul Sabatier, France for providing GNSS and soil moisture data collected in Lamasquere, France. The authors also thank the editors and all anonymous reviewers for their constructive and excellent reviews of our work.
Conflicts of Interest
The authors declare no conflicts of interest.
References
- Jackson, T.J.; Schmugge, J.; Engman, E.T. Remote Sensing Applications to Hydrology: Soil Moisture. Hydrol. Sci. J. 1996, 41, 517–530. [Google Scholar] [CrossRef]
- Lv, J.; Zhang, R.; Tu, J.; Liao, M.; Pang, J.; Yu, B.; Li, K.; Xiang, W.; Fu, Y.; Liu, G. A GNSS-IR Method for Retrieving Soil Moisture Content from Integrated Multi-Satellite Data That Accounts for the Impact of Vegetation Moisture Content. Remote Sens. 2021, 13, 2442. [Google Scholar] [CrossRef]
- Lv, J.; Zhang, R.; Yu, B.; Pang, J.; Liao, M.; Liu, G. A GPS-IR Method for Retrieving NDVI from Integrated Dual-Frequency Observations. IEEE Geosci. Remote Sens. Lett. 2022, 19, 1–5. [Google Scholar] [CrossRef]
- Larson, K.M.; Small, E.E.; Gutmann, E.; Bilich, A.; Axelrad, P.; Braun, J. Using GPS Multipath to Measure Soil Moisture Fluctuations: Initial Results. GPS Solut. 2008, 12, 173–177. [Google Scholar] [CrossRef]
- Wang, T.; Zhang, R.; Liu, A.; Yang, Y.; Lv, J.; Jiang, Y. A Novel Snow Depth Retrieving Approach Using Time-Series Clustering in GPS-IR Data. IEEE Geosci. Remote Sens. Lett. 2024, 21, 1–5. [Google Scholar] [CrossRef]
- Zavorotny, V.U.; Larson, K.M.; Braun, J.J.; Small, E.E.; Gutmann, E.D.; Bilich, A.L. A Physical Model for GPS Multipath Caused by Land Reflections: Toward Bare Soil Moisture Retrievals. IEEE J. Sel. Top. Appl. Earth Obs. Remote Sens. 2010, 3, 100–110. [Google Scholar] [CrossRef]
- Chew, C.C.; Small, E.E.; Larson, K.M.; Zavorotny, V.U. Effects of Near-Surface Soil Moisture on GPS SNR Data: Development of a Retrieval Algorithm for Soil Moisture. IEEE Trans. Geosci. Remote Sens. 2014, 52, 537–543. [Google Scholar] [CrossRef]
- Li, Y.; Zhu, M.; Luo, L.; Wang, S.; Chen, C.; Zhang, Z.; Yao, Y.; Hu, X. GNSS-IR Dual-Frequency Data Fusion for Soil Moisture Retrieval Based on Helmert Variance Component Estimation. J. Hydrol. 2024, 631, 130752. [Google Scholar] [CrossRef]
- Bo, S.; Yong, L.; Mutian, H.; Lei, Y.; Lili, J.; Yongqing, Y. GNSS-IR Soil Moisture Retrieval Method Based on GA-SVM. J. Beijing Univ. Aeronaut. Astronaut. 2019, 45, 486–492. [Google Scholar]
- Liang, Y.; Ren, C.; Wang, H.; Huang, Y.; Zheng, Z. Research on Soil Moisture Retrieval Method Based on GA-BP Neural Network Model. Int. J. Remote Sens. 2019, 40, 2087–2103. [Google Scholar] [CrossRef]
- Ren, C.; Liang, Y.-J.; Lu, X.-J.; Yan, H.-B. Research on the Soil Moisture Sliding Estimation Method Using the LS-SVM Based on Multi-Satellite Fusion. Int. J. Remote Sens. 2019, 40, 2104–2119. [Google Scholar] [CrossRef]
- Xian, H.; Shen, F.; Guan, Z.; Zhou, F.; Cao, X.; Ge, Y. A GNSS-IR Soil Moisture Retrieval Method via Multi-Layer Perceptron with Consideration of Precipitation and Environmental Factors. GPS Solut. 2024, 28, 122. [Google Scholar] [CrossRef]
- Larson, K.M.; Small, E.E.; Gutmann, E.D.; Bilich, A.L.; Braun, J.J.; Zavorotny, V.U. Use of GPS Receivers as a Soil Moisture Network for Water Cycle Studies. Geophys. Res. Lett. 2008, 35, 2008GL036013. [Google Scholar] [CrossRef]
- Wan, W.; Larson, K.M.; Small, E.E.; Chew, C.C.; Braun, J.J. Using Geodetic GPS Receivers to Measure Vegetation Water Content. GPS Solut. 2015, 19, 237–248. [Google Scholar] [CrossRef]
- Glynn, E.F.; Chen, J.; Mushegian, A.R. Detecting Periodic Patterns in Unevenly Spaced Gene Expression Time Series Using Lomb-Scargle Periodograms. Bioinformatics 2006, 22, 310–316. [Google Scholar] [CrossRef] [PubMed]
- Breiman, L. Random Forests. Mach. Learn. 2001, 45, 5–32. [Google Scholar] [CrossRef]
- Ashourloo, D.; Aghighi, H.; Matkan, A.A.; Mobasheri, M.R.; Rad, A.M. An Investigation into Machine Learning Regression Techniques for the Leaf Rust Disease Detection Using Hyperspectral Measurement. IEEE J. Sel. Top. Appl. Earth Obs. Remote Sens. 2016, 9, 4344–4351. [Google Scholar] [CrossRef]
- Yan, Q.; Huang, W. Detecting Sea Ice from TechDemoSat-1 Data Using Support Vector Machines with Feature Selection. IEEE J. Sel. Top. Appl. Earth Obs. Remote Sens. 2019, 12, 1409–1416. [Google Scholar] [CrossRef]
- Liang, Y.; Lai, J.; Ren, C.; Lu, X.; Zhang, Y.; Ding, Q.; Hu, X. GNSS-IR Multisatellite Combination for Soil Moisture Retrieval Based on Wavelet Analysis Considering Detection and Repair of Abnormal Phases. Measurement 2022, 203, 111881. [Google Scholar] [CrossRef]
- Larson, K.M.; Braun, J.J.; Small, E.E.; Zavorotny, V.U.; Gutmann, E.D.; Bilich, A.L. GPS Multipath and Its Relation to Near-Surface Soil Moisture Content. IEEE J. Sel. Top. Appl. Earth Obs. Remote Sens. 2010, 3, 91–99. [Google Scholar] [CrossRef]
- Chew, C.C. Soil Moisture Remote Sensing Using GPS-Interferometric Reflectometry. Ph.D. Thesis, University of Colorado, Boulder, CO, USA, 2015. [Google Scholar]
Disclaimer/Publisher’s Note: The statements, opinions and data contained in all publications are solely those of the individual author(s) and contributor(s) and not of MDPI and/or the editor(s). MDPI and/or the editor(s) disclaim responsibility for any injury to people or property resulting from any ideas, methods, instructions or products referred to in the content. |
© 2024 by the authors. Licensee MDPI, Basel, Switzerland. This article is an open access article distributed under the terms and conditions of the Creative Commons Attribution (CC BY) license (https://creativecommons.org/licenses/by/4.0/).

