Abstract
Between 14 March and 21 April 2022, an extensive investigation of an extraordinary Saharan dust intrusion over Europe was performed based on lidar measurements obtained by the European Aerosol Research Lidar Network (EARLINET). The dust episode was divided into two distinct periods, one in March and one in April, characterized by different dust transport paths. The dust aerosol layers were studied over 18 EARLINET stations, examining aerosol characteristics during March and April in four different regions (M-I, M-II, M-III, and M-IV and A-I, A-II, A-III, and A-IV, respectively), focusing on parameters such as aerosol layer thickness, center of mass (CoM), lidar ratio (LR), particle linear depolarization ratio (PLDR), and Ångström exponents (ÅE). In March, regions exhibited varying dust geometrical and optical properties, with mean CoM values ranging from approximately 3.5 to 4.8 km, and mean LR values typically between 36 and 54 sr. PLDR values indicated the presence of both pure and mixed dust aerosols, with values ranging from 0.20 to 0.32 at 355 nm and 0.24 to 0.31 at 532 nm. ÅE values suggested a range of particle sizes, with some regions showing a predominance of coarse particles. Aerosol Optical Depth (AOD) simulations from the NAAPS model indicated significant dust activity across Europe, with AOD values reaching up to 1.60. In April, dust aerosol layers were observed between 3.2 to 5.2 km. Mean LR values typically ranged from 35 to 51 sr at both 355 nm and 532 nm, while PLDR values confirmed the presence of dust aerosols, with mean values between 0.22 and 0.31 at 355 nm and 0.25 to 0.31 at 532 nm. The ÅE values suggested a mixture of particle sizes. The AOD values in April were generally lower, not exceeding 0.8, indicating a less intense dust presence compared to March. The findings highlight spatial and temporal variations in aerosol characteristics across the regions, during the distinctive periods. From 15 to 16 March 2022, Saharan dust significantly reduced UV-B radiation by approximately 14% over the ATZ station (Athens, GR). Backward air mass trajectories showed that the dust originated from the Western and Central Sahara when, during this specific case, the air mass trajectories passed over GRA (Granada, ES) and PAY (Payerne, CH) before reaching ATZ, maintaining high relative humidity and almost stable aerosol properties throughout its transport. Lidar data revealed elevated aerosol backscatter (baer) and PLDR values, combined with low LR and ÅE values, indicative of pure dust aerosols.
1. Introduction
The Sahara desert and its adjacent regions account for more than 50% of global dust emissions [1]. Emitted dust impacts the climate system by interacting with both longwave and shortwave radiation. Additionally, dust plays a crucial role acting as cloud condensation nuclei (CCN) and ice nucleating particles (INPs) [2]. This aerosol–cloud interaction refers to the aerosols altering the microphysical properties of clouds and modifying precipitation patterns [3]. This process ultimately influences the lifespan of clouds and modifies their water or ice content [4]. Moreover, dust aerosols exert a significant influence on the dynamics and thermodynamics of the atmosphere [5] and can pose substantial health risks to humans [6,7,8,9] when they exceed the particle concentration thresholds set by the World Health Organization (WHO) Air Quality Guidelines [10].
Numerous studies have investigated the geometrical and optical properties of Saharan dust layers, typically analyzed using lidar observations. Recent research, including studies conducted over several European cities, has contributed significantly to this field [11,12,13,14,15,16,17,18,19,20,21,22,23,24,25,26,27,28,29]. However, the total direct radiative effect of mineral dust (fine and coarse modes) was recently updated and estimated to be −0.11 ± 0.30 W/m2 [30], which remains plagued by considerable uncertainty. Consequently, comprehensive investigations into Saharan dust events are necessary in all aspects to reduce this uncertainty.
Throughout the years, numerous extreme dust events have been observed across different regions. The years from 2020 to 2022 have witnessed a notably elevated occurrence of intense and prolonged dust events across the Mediterranean, influencing the European area, even during winter and spring. These events were labeled as “unusual”, “historic”, or “exceptional”, as mentioned by Cuevas-Agulló et al. (2024) [31]. During the spring of 2022, Europe experienced one extraordinary and enduring Saharan dust intrusion of great magnitude. This vast dust plume made its way to Europe, prompting the European Aerosol Research Lidar Network (EARLINET; https://www.earlinet.org/, last access: 20 April 2024 [32]) stations to conduct extensive measurements focusing on the transport of Saharan dust aerosols across the continent.
The event commenced on 14 March and persisted for several days, continuing until the end of March for certain stations. Then, once again in April, most stations detected dust until as late as 21 April, but not with the same intensity. The measurements were conducted from 14 March to 21 April 2022, with a total of 18 ground-based lidar stations contributing data to this study. Additionally, data from the CALIPSO (Cloud–Aerosol Lidar and Infrared Pathfinder Satellite Observations [33,34,35,36,37]) satellite were independently utilized to complement the ground-based lidar measurements, providing additional insight into the geometrical and optical properties of the observed aerosols. Furthermore, the air mass back-trajectory model HYbrid Single Particle Lagrangian Integrated Trajectory (HYSPLIT; [38,39,40,41,42]) and the Navy Aerosol Analysis and Prediction System (NAAPS; [43]) were employed to delve into the origin of the detected aerosols, providing valuable insights into their atmospheric transport pathways and source regions.
This paper is organized as follows: Section 2 details the EARLINET stations used in this study, the derived lidar products, and the methodology used for monitoring the Saharan dust aerosol layers. Section 3 covers the identification of the origins, model simulations, and results of the geometrical and optical properties analysis of the dust aerosol layers. It also includes spaceborne lidar data (Cloud–Aerosol Lidar with Orthogonal Polarization; CALIOP) and a case study from 15–16 March 2022. Finally, Section 4 presents the main conclusions of this study.
2. Materials and Methods
2.1. EARLINET Stations
The EARLINET infrastructure established in 2000 [17] provides an excellent opportunity to gather a large collection of quality-assured ground-based data on the vertical distribution of aerosol optical properties over Europe. Currently, the network includes 33 active lidar stations distributed over Europe and Central Asia, providing information on aerosol vertical distributions on a continental scale. In our analysis, Level 1 EARLINET data (https://data.earlinet.org/, accessed on 2 April 2024) at 18 stations (Figure 1) were used in this study. The stations involved in this study were those capable of offering measurements during the study period and willing to contribute by providing their observations.
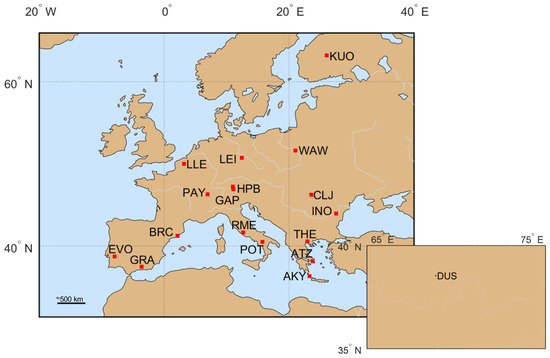
Figure 1.
The EARLINET stations that provided high-quality observations were used in this study. The 3-letter code identifies the station according to the conventions defined within the infrastructure.
The Garmisch–Partenkirchen–Zugspitze (GAP) is the only station whose profiles of aerosol backscatter coefficients (baer) retrieved from the lidar measurements have been archived in the NDACC database (current web address: https://www-air.larc.nasa.gov/missions/ndacc/data.html#, accessed on 2 July 2024) [44]. These data cannot be found in the EARLINET database like the rest of the stations used in this study.
Apart from the GAP, Payerne (PAY), and Roma-Tor Vergata (RME) stations, which exclusively offer data at a single wavelength, during the under-study period, the remaining stations are equipped with multiwavelength lidar systems capable of providing comprehensive aerosol properties across multiple wavelengths (Table 1). Specifically, these systems offer up to three baer profiles (at 355, 532, and 1064 nm) and up to two extinction coefficient (aaer at 355 and 532 nm) measurements, in addition to aerosol-intensive properties such as backscatter and extinction-related Ångström exponents (ÅEa355/532, ÅEb355/532, and ÅEb532/1064 nm), the lidar ratio (LR), and the particle linear depolarization ratio (PLDR) at 532 nm and/or 355 nm.

Table 1.
Aerosol lidar data used from selected EARLINET stations, along with the corresponding observing sites’ location, code, coordinates, and lidar setup during the analyzed events.
2.2. The Cloud–Aerosol Lidar and Infrared Pathfinder Satellite Observation (CALIPSO) Satellite
Operating onboard the CALIPSO polar-orbiting satellite at an altitude of approximately 705 km, the CALIOP elastic backscatter lidar system emits laser pulses that cover roughly 0.2% of the Earth’s surface per complete cycle. Since 2006, CALIOP has been concurrently emitting at wavelengths of 532 and 1064 nm, capturing vertically resolved aerosol and cloud properties on a global scale, thereby offering significant advantages for research in aerosol and cloud studies (https://www-calipso.larc.nasa.gov/, last accessed: 15 February 2024).
For this study, we used data from the L2 version 4.51 CALIPSO Aerosol Profile (APro), featuring a horizontal resolution of 5 km along with Vertical Feature Mask (VFM) data products. From the APro products, we derived various aerosol optical properties, including the baer and aaer coefficients, the PLDR at 532 nm, and the ÅEb associated with backscatter coefficients obtained from wavelengths of 532 and 1064 nm. The VFM products played a crucial role in separating aerosols from clouds and further classifying aerosols into various types. This classification retained aerosols associated with dust aerosols, specifically types 2 (Dust), 5 (Polluted dust), and 7 (Dusty marine), as classified by the CALIPSO algorithm [45]. Additionally, CALIOP’s aerosol lidar ratio for each aerosol subtype is determined based on measurements, modeling, and cluster analysis of a multiyear Aerosol Robotic Network (AERONET) dataset [33,34,35,36,37].
2.3. Selection of Dust Aerosol Layers
Ground-based lidar data were processed using the Single Calculus Chain [46,47,48], which is an automatic analysis tool for processing aerosol lidar measurements and retrieving their optical products. These products were then uploaded to the EARLINET database. For the whole period of this study, the data were utilized to determine the geometrical properties, i.e., the base, top, thickness, and center of mass (CoM) of the dust aerosol layers. The base and top of each aerosol layer were identified using the gradient method [30]. Then, the mean values of the aerosol’s optical properties (baer and aaer coefficients, PLDR, ÅEa355/532, ÅEb355/532, ÅEb532/1064, and LR) were calculated for each station. Only desert dust aerosol layers were examined in this study. These layers were identified as dust aerosol layers either by using the mean PLDR value within the aerosol layer (PLDR greater than 0.16 [19]) or, in cases where no depolarization measurement was available, by utilizing the HYSPLIT backward trajectories coming over the Saharan desert.
2.4. Navy Aerosol Analysis and Prediction System (NAAPS)
The Global Navy Aerosol Analysis and Prediction System (NAAPS; http://www.nrlmry.navy.mil/aerosol/, accessed on 28 June 2023) is a model developed by the Naval Research Laboratory (NRL). The NAAPS generates three-dimensional forecasts of mass concentration fields for dust, smoke, sea salt, and anthropogenic–biogenic fine aerosols. These forecasts include associated three-dimensional aerosol extinction coefficients and column-integrated AOD fields. The NAAPS is driven by meteorological fields from the Navy Global Environmental Model (NAVGEM), utilizing analysis fields every six hours and forecasts provided at three-hour intervals. Variables from the NAVGEM used by the NAAPS include topography, sea ice, snow cover, surface stress, surface heat/moisture fluxes, precipitation, lifting condensation level, cloud cover and height, three-dimensional winds, temperature, and humidity. For NAAPS analysis, aerosol sources, including sulfate/ABF (combined anthropogenic and biogenic fine species), dust and smoke, and deposition processes are regionally tuned to best match observations from AERONET and MODIS [43].
2.5. Definition of the Regions and HYSPLIT Model
The HYSPLIT model (https://www.ready.noaa.gov, last access: 5 April 2024) was used to investigate the atmospheric transport of dust particles during this exceptional dust event. For analyzing backward air mass trajectories, we used the “normal” method in conjunction with meteorological data from the GDAS1 (Global Data Analysis System). Moreover, the model vertical velocity option was used to calculate these backward air mass trajectories. The initial parameters for running the model included the coordinates of each EARLINET station and the altitude (above mean sea level) at which the dust aerosol layer was observed. The start time used as the input to the model was based on the time of the averaged profiles for each measurement. The duration of the backward air mass trajectories was set to 168 h (7 days).
To analyze previously identified dust intrusion periods, we categorized the lidar stations into regions based on their geographical locations and the mean backward air mass trajectory terminating over each station. The mean backward air mass trajectories were computed using all backward trajectories ending over each station during the specified time intervals of the study.
3. Results and Discussion
3.1. Description of the Event
During March 2022, a high-pressure system ejected Saharan dust particles over Europe, as indicated by Aerosol Optical Depth (AOD at 550 nm) simulations representing dust particles on the green color scale in Figure 2. The dust trajectory initiated from Spain and Portugal, gradually progressing towards France within the first three days. Subsequently, it redirected towards Italy and Greece, spreading across central Europe by 20 March and extending to Scandinavia by 28 March. By 30 March, much of Southern and Western Europe was enveloped in a pervasive greenish hue, with the Scandinavian region being relatively unaffected. AOD values during this period were found to reach up to 1.60, as depicted in Figure 2.
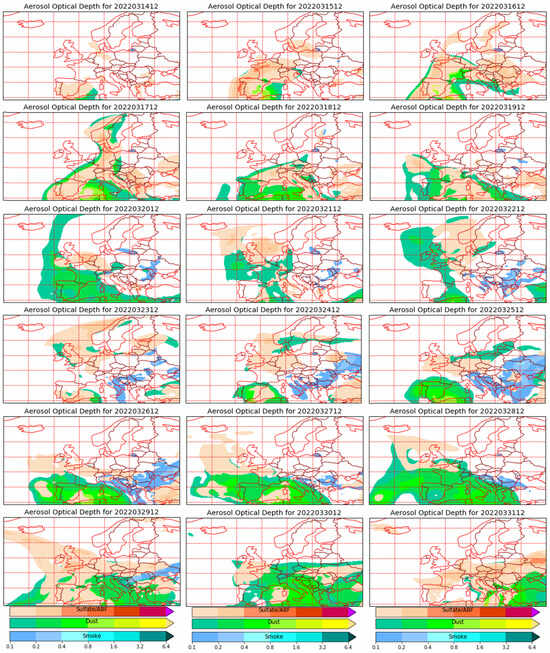
Figure 2.
Map of the AOD at 550 nm, calculated by the NAAPS model during March 2022 (period of this study) for three aerosol types: mineral dust (green/yellow), sulfates/ABF (orange/red), and smoke (blue).
Transitioning into early April, as depicted in Figure 3, the dust predominantly lingered over Eastern Europe on 1 April. However, from 2 to 4 April, minimal dust activity was observed. Coming after this period, a renewed intrusion occurred, following a distinct trajectory.
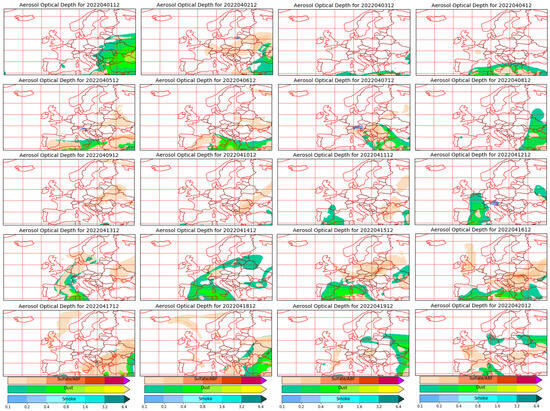
Figure 3.
Map of the AOD at 550 nm, calculated by the NAAPS model during April 2022, for three aerosol types: mineral dust (green/yellow), sulfates/ABF (orange/red), and smoke (blue).
Dust AOD levels began to rise again in Greece, gradually extending to Italy and parts of the Balkans, with values ranging from 0.4 to 1.6. By 11 April, Spain and France experienced another wave of dust (AOD~0.4), extending towards northern latitudes. Through 15 and 16 April, Southern European countries primarily bore the brunt of dust deposition, with scattered areas across the continent still experiencing residual effects before the episode subsided. During the April period, AOD was at lower levels, presenting values less than 0.8 according to Figure 3.
It is noteworthy to emphasize that while the March event was particularly extraordinary, the subsequent episode, closely following the first, prolonged the impact of the event.
During the March and April periods of dust intrusion, four regions affected by the Saharan dust were identified, and are described in Table 2.

Table 2.
Definition of regions made for this study, for both March and April periods.
The backward air mass trajectory analysis based on the HYSPLIT model for each station revealed the origin of the observed dust layers in March 2022 (Figure 4). Faint lines represent the various backward trajectories, while bold trajectories represent the mean air mass trajectory for each station.
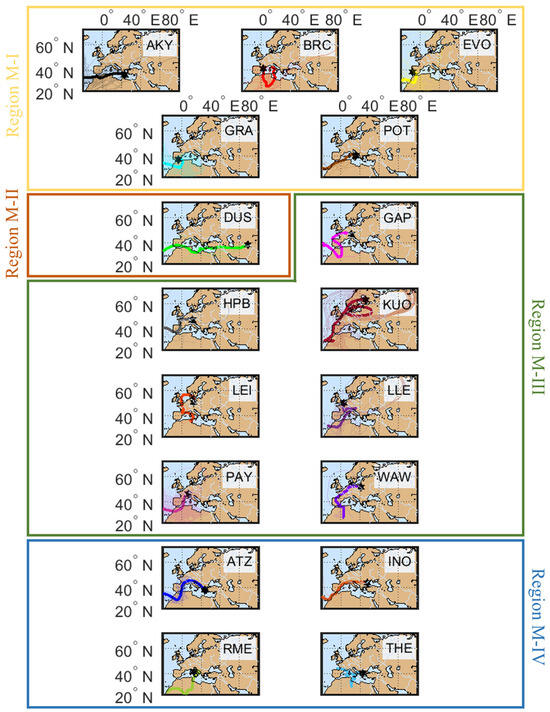
Figure 4.
The 168 h backward trajectories of air masses arriving over 4 regions, derived from data collected by 17 lidar stations during March 2022. These trajectories were calculated for air masses arriving at the center altitude of each observed dust layer. The faint colored lines represent the total backward air mass trajectories, while the bold trajectories represent the mean trajectory for each station during the period of March 2022.
In most of the cases, the air masses originated from western and northwestern Africa, particularly from regions encompassing Morocco, the western Sahara, and Algeria. These air masses crossed the Mediterranean region and reached the Iberian Peninsula. The dust plume spread across western and central Europe and then a part of it continued towards the Balkans and southern Europe, as can be seen by the relevant air mass trajectories. However, this is not the case for DUS, as the air masses originate in northwestern Africa and pass over Tunisia and Libya, crossing the Arabian desert, before finally reaching each observation station.
Likewise, during April (Figure 5), the sampled air masses originated from western and northwestern Africa, specifically from regions including Morocco, the western Sahara, and Algeria. However, this time, they did not initially reach the Iberian Peninsula. Instead, the dust intrusion is nearly direct for all stations situated in southern Europe. This direct trajectory applies to all stations within Region A-I. However, the scenario still differs for the CLJ and DUS stations (Region A-II). Although the air masses originate in northwestern Africa, they later pass over Tunisia and Libya and traverse the Arabian Desert, before ultimately arriving at the DUS observation station. Meanwhile, for the CLJ station, the mean air mass trajectory is common to the rest of the stations for the first 2 days and then follows an eastern direction, most similar to the DUS station.
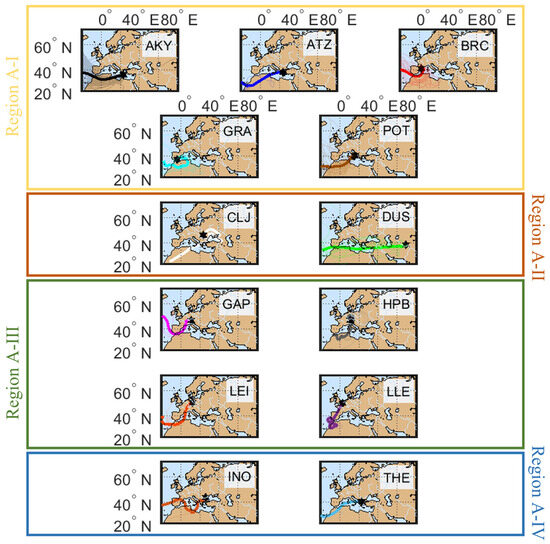
Figure 5.
The 168 h backward trajectories of air masses arriving over 4 regions, derived from data collected by the 13 different lidar stations that measured dust aerosol layers during April 2022. These trajectories were calculated for air masses arriving at the center altitude of each observed dust layer. The faint colored lines represent the total backward air mass trajectories, while the bold trajectories represent the mean trajectory for each station during the period of April 2022.
3.2. Aerosol Geometrical and Optical Properties Per Site and Region
Figure 6 displays the number of observation days for each participating station in this study, as well as the aerosol layers identified as desert dust at each station. In March 2022, during the peak of the dust transportation event, the average number of observation days per station was eight, with a maximum of 17 days recorded in PAY and a minimum of two observation days in ATZ and BRC. The Saharan dust aerosol layers varied between one for the RME station to 122 observed in the PAY station. The number of dust layers observed by the EVO (91), GRA (69), and LLE (42) stations was also sufficiently high. The rest of the stations measured from one to 27 dust layers during this period.
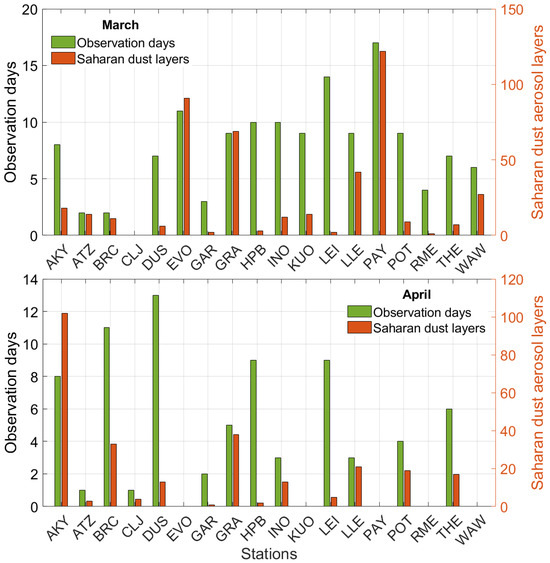
Figure 6.
Observation days and Saharan dust aerosol layers per station for the March (top) and April (bottom) periods, respectively.
Regarding the period of April, fewer observation days were noted, with fewer monitored intense dust events compared to March, which did not affect all lidar stations. Specifically, DUS uploaded 13 days, while ATZ and CLJ had only one day each. In the case of the Warsaw station, unfavorable weather conditions in April led to a lack of mineral dust observations. However, AKY recorded the event for eight days, with 102 Saharan dust aerosol layers (in more than 85 profiles during the April period) detected during this period.
It should be noted that some stations operate 24 h a day, processing and uploading the entire day’s measurements to the database, while others measure during specific hours and process only those profiles. Additionally, some stations upload data even if the optical properties are of lower quality (e.g., not continuous baer or PLDR profiles) or were taken under the presence of low clouds; these had to be removed. In contrast, other stations upload only cloud-screened profiles containing complete optical information. Overall, many days during these two dust periods experienced heavy rain and cloudy conditions. Consequently, several stations, particularly those in southern Europe closest to the Sahara Desert, were unable to provide the expected number of measurements for this study.
Figure 7 presents the geometrical (CoM and thickness) and optical properties (baer, aaer, LR, PLDR, and ÅE) for each lidar station, grouped into regions (Regions M-I, II, III, and IV) according to their geographical position and the mean backward air mass trajectory ending over each station, as previously mentioned.
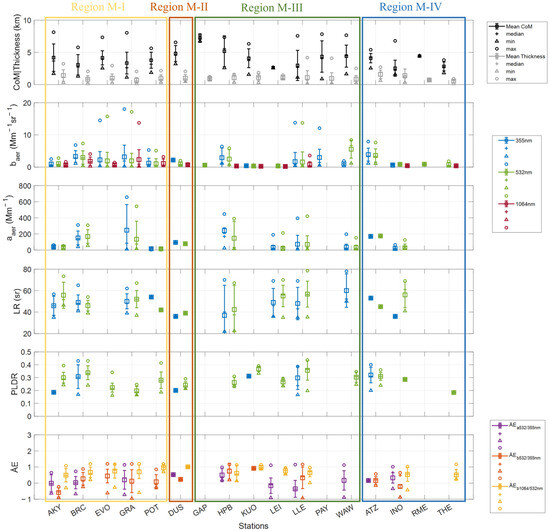
Figure 7.
Median, mean, standard deviation, and minimum and maximum values of geometrical and optical properties of the dust aerosol layers observed over each station with measurements during the March period of dust. Differently colored rectangles correspond to the different regions that originated during this period.
During the March dust period, in Region M-I, dust layers were observed from heights of 1.12 (BRC) to 8.13 (AKY) km (mean value 3.70 ± 1.55 km), while the mean thickness of the aerosol layers was equal to 0.96 ± 0.62 km. The LR at 355 nm varied from 35 (AKY) to 65 sr (BRC), presenting an average value equal to 50 ± 3 sr, which was the same as the median value. The LR at 532 nm presented an increased range from 37 (EVO) to 73 sr (AKY) and an average value of 49 ± 6 sr, which was again the same as the median value. The LR values indicate the significant presence of Saharan dust aerosols, with some potential variability due to the influence of other regional aerosol sources. Similar PLDR values at both 355 and 532 nm were observed in Region M-I, which ranged approximately from 0.16 to 0.43, with a mean value of 0.25 ± 0.09 at 355 nm and 0.27 ± 0.06 at 532 nm. These consistent mean PLDR values at 355 and 532 nm suggest that the dust is relatively pure, with limited contamination from other aerosol types. On the other hand, the ÅE presented a wide range of values. ÅEa532/355 values ranged from −0.72 to 1.14 (EVO), with an average value of 0.08 ± 0.50, while ÅEb532/355 varied from −0.95 (EVO) to 1.20 (GRA) and the mean value was equal to 0.07 ± 0.39. Finally, ÅEb1064/532 ranged from −0.59 to 1.20 (EVO), with a mean value of 0.72 ± 0.17.
In Region M-II, the observed layers were found to be at higher altitudes only at the DUS station. Specifically, the aerosol layers’ CoM was found to be between 3.2 and 6.5 km, with a mean value of 4.8 ± 1.2 km. These elevated layers could be related to the long-range transport of dust, from the Sahara towards Central Asia. The mean thickness was equal to 0.97 ± 0.59 km. Moreover, dust aerosol layers were characterized by LR values of 36 sr at 355 nm and 39 sr at 532 nm. In this instance, the observed values fall within the customary range associated with dust from the Middle East and Central Asia [29,49,50], suggesting a more complex dust plume with a blending of Saharan and Asian dust, with the latter possibly predominating. The mean PLDR values were found to be equal to 0.20 at 355 nm and 0.24 at 532 nm, which are lower than the ones measured in Region M-I. The ÅE values were found to be equal to 0.53 (ÅEa532/355), 0.23 (ÅEb532/355), and 1.01 (ÅEb1064/532).
Regarding Region M-III, dust aerosol layers were found between heights of 0.86 to 7.83 km (mean value 4.4 ± 1.59 km), suggesting a more complex dust transport process in this region, potentially influenced by varying meteorological conditions. Meanwhile, their thickness presented a mean value of 1.00 ± 0.63 km. Both minimum and maximum values of LR at 355 and 532 nm demonstrated increased variations ranging from 22 (HPB) to 78 sr (WAW and LLE, respectively), while the mean value was found to equal 45 ± 7 sr at 355 nm and 54 ± 8 sr at 532 nm. Regarding the PLDR values at 355 nm, they varied from 0.17 (LLE) to 0.39 (LLE), with a mean value of 0.27 ± 0.05, while the corresponding values for 532 nm ranged from 0.20 to 0.44 (LLE) and 0.31 ± 0.05, respectively. Concerning the ÅE values in Region-III, the values ranged between −1.13 to 1.15 (LLE) (ÅEa532/355), −0.93 (LLE) to 1.16 (HPB) (ÅEb532/355), and 0.01 (LLE) to 1.14 (HPB) (ÅEb1064/532), while the mean values were equal to 0.04 ± 0.38, 0.69 ± 0.25, and 0.75 ± 0.17, respectively. Finally, in Region M-IV, the CoM ranged between 1.60 km (INO) and 6.79 km (INO), while the mean and median values were equal to 3.47 ± 0.67 km and 3.41 km. The thickness of aerosol layers presented a mean value of 1.05 ± 0.49 km. The higher CoM values in this region reflect the presence of well-elevated dust layers, potentially due to strong vertical transport mechanisms. The LR at 355 nm ranged from 36 sr (INO) to 53 sr (ATZ) with a mean value of 45 ± 12 sr, while LR at 532 nm ranged from 41 sr (INO) to 69 sr (INO) with a mean value of 51 ± 8 sr and a median value equal to 53 sr. These LR values are consistent with the presence of mineral dust, particularly of Saharan origin. The PLDR values ranged between 0.20 (ATZ) to 0.40 (ATZ) with a mean value of 0.32 ± 0.06 and a median of 0.31 at 355 nm. In addition, at 532 nm, the PLDR value varied from 0.18 (THE) to 0.36 (ATZ), with a mean of 0.26 ± 0.07. These PLDR values further support the presence of dust particles, as they fall within the expected range for Saharan dust, particularly in areas close to the dust sources. The ÅE values ranged between −0.35 to 1.02 (INO) (ÅEa532/355), −0.87 to 0.64 (INO) (ÅEb532/355), and −0.43 (INO) to 1.17 (THE) (ÅEb1064/532), while the mean values were equal to 0.25 ± 0.12, −0.03 ± 0.26, and 0.83 ± 0.41, respectively. This wide range in ÅE values reflects the variability in particle size distribution, likely due to the mixing of dust with other aerosol types as it traveled from the source regions.
Figure 8 also presents the geometrical (CoM and thickness) and optical properties (baer, aaer, LR, PLDR, and AE) for each lidar station, grouped into regions (Regions A-I, II, III, and IV) according to their geographical position and the mean backward air mass trajectory ending over each station, as previously mentioned.
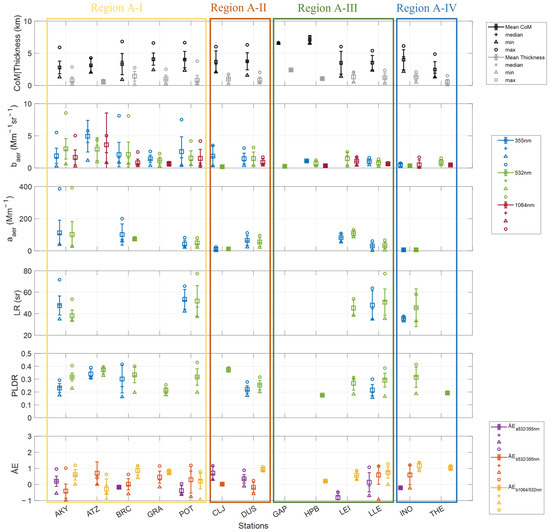
Figure 8.
Median, mean, standard deviation, and minimum and maximum values of geometrical and optical properties of the dust aerosol layers observed over each of the stations with measurements during the April period. Differently colored rectangles correspond to the different regions that originated during this period.
Regarding the April dust period, the dust layers in Region A-I ranged from 0.90 to 6.83 km, with a mean value of 3.47 ± 1.20 km, while the mean thickness of the layers was 0.92 ± 0.58 km. The observed LR at both 355 and 532 nm exhibited increased variation, with values varying from 35 to 72 sr (AKY), with an average of 51 ± 4 sr, and between 33 (AKY) to 77 sr (POT), with a mean value of 45 ± 10 sr, respectively. Moreover, similar PLDR values from both 355 and 532 nm were observed in Region A-I, which ranged approximately from 0.17 (AKY and GRA) to 0.42 (BRC and POT), with a mean value equal to 0.29 ± 0.06 at 355 nm and 0.31 ± 0.06 at 532 nm. These similarities in the PLDR values at both 355 and 532 nm confirm the non-spherical shape of the particles. The ÅEa532/355 values ranged between −0.60 (POT) to 0.96 (AKY) with an average value of −0.30 ± 0.46, while ÅEb532/355 varied from −0.99 (AKY) to 1.18 (POT) and the mean value was equal to 0.21 ± 0.43. Finally, ÅEb1064/532 accumulated from −0.94 (POT) to 1.19 (AKY) and had a mean value of 0.43 ± 0.48.
The aerosol layers in Region A-II were observed at an altitude (CoM) of 1.57 to 6.31 (DUS) km (mean value 3.72 ± 1.50 km) and thickness varied from 0.18 (CLJ) to 2.04 (DUS) km, with an average of 0.90 ± 0.56 km. The PLDR values accumulated between 0.17 to 0.28 (DUS) with a mean value of 0.22 ± 0.03 and a median of 0.21 at 355 nm. In addition, at 532 nm, the PLDR value varied from 0.20 (DUS) to 0.39 (CLJ) and had a mean of 0.31 ± 0.09. The ÅE values ranged between −0.58 to 0.24 (DUS) (ÅEb532/355) and 0.83 to 1.10 (DUS) (ÅEb1064/532), while the mean values were found to equal −0.09 ± 0.16 and 0.95 ± 0.10, respectively.
Regarding Region A-III, we observed dust layers at heights from 1.40 (LEI) to 7.56 (HPB) km (mean value 5.17 ± 0.90 km), and the layers’ thicknesses varied from 0.32 (LLE) to 2.41 (GAP) km, with a mean value of 1.50 ± 0.40 km. The LR values at 355 nm varied from 35 to 64 sr (LLE), while at 532 nm, the LR values presented an average value of 48 ± 4 sr. These LR values across the region are indicative of Saharan dust, with some potential influence from other aerosol sources. As for the PLDR, at 355 nm, the values accumulated from 0.16 to 0.30 (LLE) and had a mean value of 0.22 ± 0.04, while the corresponding values for 532 nm ranged from 0.16 to 0.38 (LLE) and 0.28 ± 0.04, respectively. Concerning the ÅE values, we observed a range between −1.00 (LEI) and 1.07 (LLE) (ÅEa532/355), −0.95 and 1.14 (LLE) (ÅEb532/355), and −0.01 and 1.28 (LLE) (ÅEb1064/532), while the mean values were found to equal 0.34 ± 0.50, 0.59 ± 0.61, and 0.51 ± 0.27, respectively. This broad range in ÅE values suggests that the dust particles vary in size, possibly due to different aging processes and/or mixing with other aerosols during transport.
Finally, the elevated dust layers in Region A-IV were observed to be between 1.30 (THE) and 6.14 (INO) km (mean value 3.23 ± 1.40 km), while the average thickness value was equal to 0.91 ± 0.49 km. The LR values at 355 nm varied from 33 to 37 sr (INO), with an average of 35 ± 3 sr, while the LR at 532 nm varied from 33 to 58 sr (INO) with an average value of 46 ± 18 sr. PLDR values at 532 nm ranged approximately from 0.18 to 0.41, with a mean value of 0.25 ± 0.09. The variability in PLDR values indicates a mix of dust particles with particles of other shapes and sizes, potentially due to the influence of atmospheric processes. The ÅEa532/355 value was equal to −0.21 (INO), while ÅEb532/355 varied from −0.23 to 1.20 (INO) with a mean value equal to 0.59 ± 0.61. Finally, ÅEb1064/532 accumulated from 0.85 to 1.36 (INO) and the mean value was equal to 1.10 ± 0.10. Mean aerosol optical properties per region of study and dust period are also shown extensively in Table 3.

Table 3.
Mean aerosol optical properties (PLDR, LR, and ÅE) per study region for both March and April periods.
The intensive optical properties values observed during both periods are within the given uncertainties and consistent with those reported for mineral dust over Europe in recent years [13,16,17,20,21,26,27,51,52,53,54,55,56]. The ÅEa532/355 and b532/355 values were close to 0 in all regions, indicating the presence of large particles, while the AEb1064/1064 values were slightly higher, occasionally exceeding 1. Although pure dust layers are typically rare over Mediterranean cities due to contamination from urban pollution or biomass-burning aerosols (BB) [19], in some cases, the values of optical properties in this study reached values very similar to those measured for pure dust during dedicated campaigns in Africa (SAMUM and SHADOW) [57,58,59,60], as well as for long-range transported pure dust over Barbados (SALTRACE) [61].
3.3. Aerosol Geometrical and Optical Properties as Obtained by CALIPSO
Apart from the ground-based EARLINET lidar data, CALIPSO data were independently used, when available, to also depict this event from the spaceborne side. CALIPSO overpasses for the specific period of March and April were retrieved and the geometrical and optical properties of the dust layers are shown in Figure 9 for the corresponding stations. Some stations are missing due to the lack of an overpass during that period, or because signals exhibited a low signal-to-noise ratio (usually daytime orbits that are affected by noise and/or no dust aerosol layers were identified).
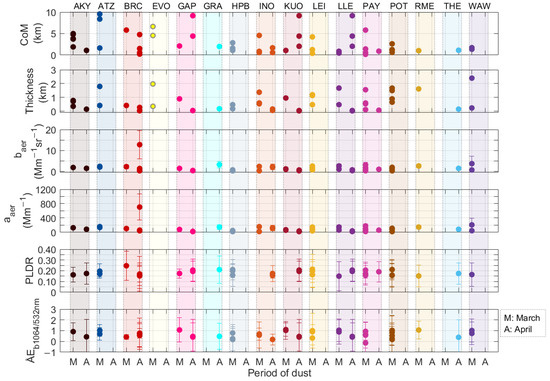
Figure 9.
Geometrical and optical properties, mean values, and std obtained per station using the CALIPSO satellite during the dust periods of March and April 2022. Different colored lines correspond to different stations. Missing stations did not provide any layers based on CALIPSO observations.
During the dust event in March, elevated aerosol layers were detected within an altitude range of 0.16 (PAY) to 9.56 km (ATZ) a.m.s.l., with thicknesses ranging from 0.12 (PAY) to 2.39 km (WAW) across all stations. The PLDR values observed ranged from 0.15 (LLE) to 0.25 (BRC), while the ÅE varied between −0.14 (PAY) and 1.09 (KUO). The baer values ranged from 0.31 (INO) to 3.72 Mm−1sr−1 (WAW), and the aaer values ranged from 16.93 (INO) to 204.67 Mm−1 (WAW).
At the AKY station, three aerosol layers were found between 1.89 and 4.81 km with thicknesses ranging from 0.36 to 0.78 km, with PLDR and ÅE values of 0.16 and 0.91, respectively. The ATZ station also presented three aerosol layers between 1.64 and 9.56 km, with thicknesses ranging from 0.42 to 1.80 km. The PLDR values ranged from 0.17 to 0.19, and ÅE values were between 0.70 and 1.02. The BRC station presented a single layer at an altitude of 5.82 km with a thickness of 0.42 km, where the PLDR was 0.25 and the ÅE was 0.41. At the EVO station, two aerosol layers were observed between 4.54 and 6.65 km with thicknesses from 0.36 to 1.98 km. The GAP station had one aerosol layer at 2.11 km with a thickness of 0.90 km, with PLDR and ÅE values of 0.17 and 1.07, respectively.
At the HPB station, three aerosol layers were detected between 1.09 and 2.85 km, with thicknesses ranging from 0.18 to 0.48 km. The PLDR values ranged from 0.16 to 0.21, and the ÅE values were between 0.18 and 0.79. The INO station had three layers between 0.58 and 4.57 km, with thicknesses from 0.54 to 1.39 km and a mean ÅE value of 0.64. At KUO, an aerosol layer at 1.07 km with a thickness of 0.96 km showed an ÅE value of 1.03. The LEI station observed three dust layers between 0.40 and 4.23 km, with thicknesses from 0.48 to 1.20 km. The PLDR ranged from 0.16 to 0.21, and the ÅE ranged from 0.31 to 1.00. The LLE station had two aerosol layers between 0.46 and 0.88 km, with thicknesses from 0.48 to 1.68 km, a PLDR of 0.15 for the first layer, and a mean ÅE of 0.96.
The PAY station presented four dust layers between 0.16 and 5.81 km, with thicknesses ranging from 0.12 to 1.56 km, a mean PLDR of 0.18, and ÅE values ranging from −0.14 to 0.94. The POT station observed four layers between 0.60 and 2.61 km, with thicknesses from 0.66 to 1.68 km, PLDR values from 0.16 to 0.21, and ÅE values from 0.10 to 1.1. At RME, the aerosol layer was 1.62 km thick at an altitude of 1.03 km, with PLDR and ÅE values of 0.15 and 1.06, respectively. Finally, at the WAW station, two aerosol layers were observed between 1.35 and 1.71 km, with thicknesses from 0.24 to 2.40 km, a PLDR of 0.16, and ÅE values from 0.74 to 1.01.
Regarding the dust event in April, CALIPSO found aerosol layers between 0.22 (BRC) and 9.17 (KUO) km with thicknesses that ranged from. 0.03 (LLE) to 0.28 (BRC) km. The mean PLDR values ranged from 0.15 (BRC) to 0.21 (GRA) and the mean value was 0.19. The ÅE was between 0.18 (INO) and 0.56 (BRC), with a mean of 0.42. Furthermore, the baer spanned from 0.36 (GAP) to 12.78 Mm−1sr−1 (BRC), while the aaer values accumulated between 15.85 (GAP) and 702.80 (BRC) Mm−1.
Concerning AKY, one aerosol layer was observed at 1.08 km with a thickness of 0.15 km, presenting a PLDR of 0.17 and an ÅE value of 0.43. Moreover, in BRC, four dust layers were observed between 0.22 and 4.77 km, while their thicknesses varied from 0.04 to 0.28 km. The mean PLDR and ÅE values were found to be 0.16 and 0.67, respectively. GAP presented two different aerosol layers at altitudes of 4.41 to 9.17 km, with a mean thickness of 0.05 km, as well as a mean PLDR equal to 0.20 and a mean ÅE value equal to 0.43. In addition, in GRA, the aerosol layer observed at 1.98 km with a thickness of 0.18 km presented a PLDR value of 0.21 and an ÅE value of 0.47. Two different aerosol layers were found in the INO station at altitudes from 0.58 to 1.68 km and thicknesses ranging from 0.06 to 0.16 km, while the mean PLDR was 0.16 and the mean ÅE was equal to 0.18. In KUO and LLE, three aerosol dust layers were observed in the range of ~2.04 to 9.16 km and had a mean thickness of 0.04 km, while the mean PLDR and ÅE for both stations were approximately equal to 0.20 and 0.43, respectively. In PAY, the thickness of the observed aerosol layer was 0.08 km at an altitude of 0.91 km and the PLDR value was equal to 0.19. Finally, in THE one dust layer was observed with a thickness of 0.16 km at a height of 1.11 km, and the PLDR and ÅE values were 0.17 and 0.38, respectively.
In general, CALIPSO observations showed good agreement with ground-based lidar observations, especially regarding the altitude at which dust aerosol layers were observed in the troposphere, their thickness, and ÅE values. The baer, aaer, and PLDR tended to be slightly underestimated compared to the corresponding values observed with the ground-based lidar systems. Notably, at the BRC, GRA, and LLE stations, CALIPSO measurements were somewhat closer to those obtained from ground-based observations. These variations could be due to the timing and spatial resolution of the satellite overpasses and may be attributed to CALIOP’s nadir-only lidar configuration, which collects data exclusively along the satellite’s orbit. Consequently, there is a possibility that the dust layers detected by ground-based systems were not present at the exact time and/or coordinates of the satellite’s overpass. This also highlights the need for complementary ground-based measurements to capture the full extent of dust events, especially for layers that are spatially or temporally variable.
3.4. Case Study (16 March 2022)
To enhance the understanding of this Saharan dust intrusion over Europe, this study includes a detailed case study focusing on three specific EARLINET stations that share a common backward air mass trajectory. This case study is crucial as it provides a focused examination of dust transport and its atmospheric impact, offering insights that complement the broader analysis. This allows us to explore the mechanisms driving the observed variations in aerosol optical properties. Additionally, through this focused analysis, we aim to provide a comprehensive picture of the dust intrusion’s impact on air quality and atmospheric conditions, thereby reinforcing the significance of our broader study.
Figure 10 presents the spatio-temporal evolution of the range-corrected lidar signal (in arbitrary units—AU), obtained by the ATZ depolarization lidar system (DEPOLE) at 532 nm on 16 March 2022 over the station. During that day, the main free tropospheric aerosol layer was detected within almost 4 to 6 km, following a descending motion during the day. During local noon and afternoon hours (11:00–15:00 UTC), the layer was very intense, while during the night hours (16:00–18:30 UTC), the dust covered almost everything from 2 to almost 6 km a.m.s.l. Several aerosol layers were observed within this altitude range.
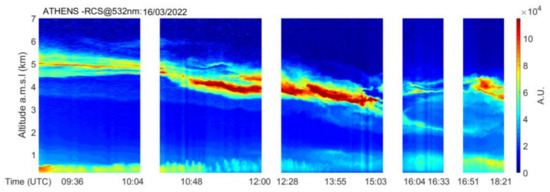
Figure 10.
The spatio-temporal evolution of the range-corrected lidar signal at 532 nm over Athens on 16 March 2022.
Figure 11 shows the daytime evolution of the ultraviolet solar radiation (UV-B: 280–320 nm) (W/m2) reaching the ground during the period of 15 to 17 of March 2022. The UV-B was measured by a Brewer MK IV spectrophotometer, installed at the Biomedical Research Foundation of the Academy of Athens (BRFAA), Greece (37.99°N, 23.78°E; 180 m a.m.s.l.). This spectrophotometer measured the direct, diffuse, and global spectral irradiances in the UV and visible regions (from 380 to 750 nm). The uncertainty in the Brewer measurements is estimated to be 5% for wavelengths above 305 nm and Solar Zenith Angles (SZAs) smaller than 70° [62]. The UV-B radiation, alongside the SZA (degrees) and the T (°C), depicts the size of this dust event in terms of solar radiation scattered by the dust aerosol load in the atmosphere over ATZ.
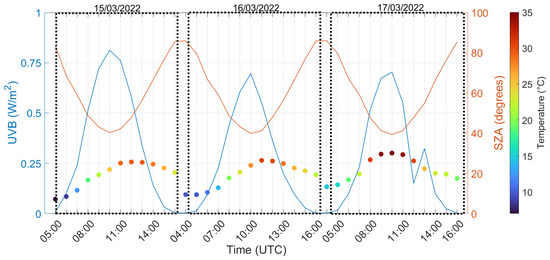
Figure 11.
Daytime evolution of the total UV-B radiation (W/m2), along with the SZA (degrees) and the Temperature (°C), reaching the ground, as measured by the Brewer spectrophotometer of BRFAA from 15 to 17 March 2022 over Athens.
The highest UV-B values (0.81 W/m2) occurred prior to the dust event, on March 15 during local noon hours (10:00 UTC), when no dust was still observed in the atmosphere. Comparing these values to the UV-B values (0.69 W/m2) measured the following day (March 16), especially from 10:00 to 12:00 UTC when this thick dust aerosol layer was formed, reveals a decrease of approximately 14% due to the presence of desert dust aerosols. This pattern also persisted on March 17 (0.70 W/m2), when dust was also observed until noon and UV-B values reached up to 0.70 W/m2.
Using the air mass backward trajectories analysis provided by the HYSPLIT model, we found that the air masses sampled over the ATZ station on 16 March 2022 (Figure 12) originated from the western and central Sahara before passing over GRA, overpassing PAY via France, and eventually reaching ATZ by crossing the continental region adjacent to the Adriatic Sea and the Balkans.
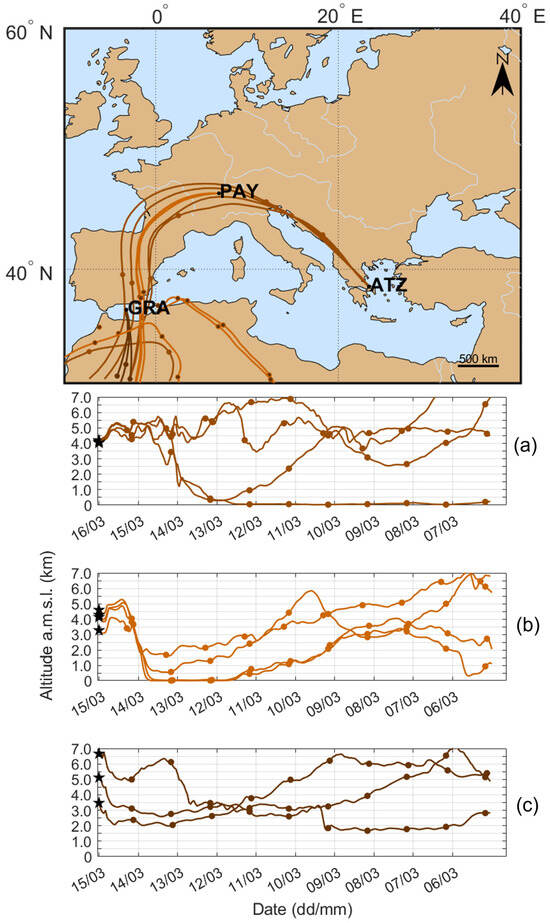
Figure 12.
HYSPLIT backward trajectories of the air mass during 15–16 March 2022, ending over (a) the ATZ, (b) PAY, and (c) GRA stations.
To find the aerosol layers that were possibly common within these three stations, the backward air mass trajectories were calculated with a starting point at ATZ at the altitude of the dust layer. Going back in time, we calculated the time when the distance of the trajectories and the coordinates of the stations, PAY and GRA, were minimized. The profiles of each station, obtained at times closest to when the backward air mass trajectory passed close by, were retained and used for this case study.
Starting with the GRA station (Figure 13a), the retrieved profiles of baer (at 355 and 532 nm) and PLDR at 532 nm on 15 March (06:00 UTC) showed the presence of three elevated layers, characterized by extremely high aerosol backscatter coefficients. However, for this case study, we are going to focus on the middle- and high-altitude aerosol layers that originated in the Saharan desert according to HYSPLIT and possibly transferred through PAY to ATZ. The baer in this case was 3.41 ± 1.77 Mm−1sr−1 at 355 nm and 4.42 ± 1.04 Mm−1sr−1 at 532 nm at 5.92 km, while the PLDR was found to be equal to 0.34 ± 0.04 and ÅEb532/355 was equal to −0.64 ± 0.60, indicating the contribution of pure dust in the atmosphere [13,52]. For the higher layer at 7.33 km, the mean baer was 10.93 ± 6.61 Mm−1sr−1 at 355 nm and 10.73 ± 4.96 at 532 nm Mm−1sr−1, while the PLDR was found to be equal to 0.27 ± 0.04 and ÅEb532/355 was equal to 0.13 ± 0.56. Later that day, at 08:00 UTC, we observed the middle-altitude aerosol layer at a lower altitude of 4.62 km, with a baer of 6.18± 3.26 at 355 nm and 4.18 ± 1.46 Mm−1sr−1 at 532 nm, while the PLDR decreased to 0.20 ± 0.01 and mean ÅEb532/355 was increased to 0.38 ± 0.27. Possibly, the middle-altitude layer was united with the lower non-Saharan aerosol layer; thus, the PLDR was decreased and the ÅE was slightly increased. We should also notice that at this altitude, the T obtained by the radiosonde was equal to −12.5 °C, and the value of RH was equal to 65%, indicating that the RH was increased inside the dust aerosol layer.
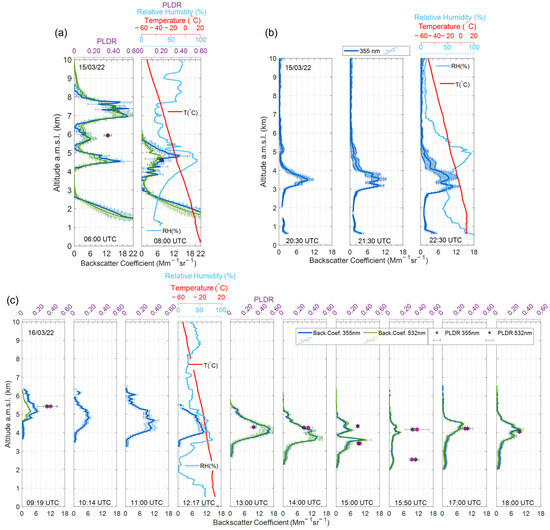
Figure 13.
Vertical distribution of the aerosol optical properties (baer at 355 and 532 nm) along with mean values of the PLDR at 355 and 532 nm (blue and green stars) as measured by the three lidar stations (a) GRA, (b) PAY, and (c) ATZ studied in this case study. Light blue and red lines correspond to relative humidity (RH) and temperature (T) obtained by radiosondes for the corresponding day and time of the lidar profiles, provided by the Department of Atmospheric Science, University of Wyoming.
Later, on 15 March, during night hours, the air masses passed over PAY. At 21:30 UTC, we observed two aerosol layers at 3.43 and 4.47 km characterized by baer (at 355 nm) values of 7.08 ± 2.22 and 1.99 ± 0.93 Mm−1sr−1, respectively (Figure 13b). Subsequently, by 22:30 UTC, this layer fragmented into thinner layers located at 3.04, 3.73, and 4.56 km with baer values equal to 8.54 ± 1.85, 8.05 ± 1.40, and 2.56 ± 0.75 Mm−1sr−1. Once again, it is noticed that the formation of dust aerosol layers coincided with a simultaneous increase in the RH values retrieved by the radiosonde, with a value equal to 83% and T equal to −7.77 °C within the aerosol layers. Moreover, on 15 March 2022, the PM10/PM2.5 ratio was increased, reaching even the value of 3.5 (Figure A1), further supporting the case for the presence of coarse Saharan dust aerosols observed over the PAY station. The PM data were provided by the National Air Pollution Monitoring Network (NABEL), which is a joint activity of the Swiss Federal Office for the Environment (http://www.bafu.admin.ch, last accessed: 13 April 2024) and Swiss Federal Laboratories for Materials Science and Technology (EMPA). Designed to gauge air quality across Switzerland, NABEL oversees measurements at 16 strategic locations, with varying pollution situations throughout the country. In situ data were only used in this case because the PAY station could provide only baer (at 355 nm), which does not give us any more information concerning the particles observed in the atmosphere, such as PLDR and ÅE, which were provided by the two other stations.
Finally, when the air masses reached ATZ, we observed that in the first morning hours and until noon (09:19–13:00 UTC), the aerosol layers gradually increased in terms of baer and decreased in altitude. Initially, the aerosol layer was observed at 5.40 km with a baer equal to 3.39 ± 1.62 Mm−1sr−1 at 355 nm and 1.67 ± 1.06 Mm−1 sr−1 at 532 nm, which, by 13:00 UTC, reached up to 7.94 ± 5.38 and 7.64 ± 5.19 Mm−1sr−1 at 355 and 532 nm, respectively. The PLDR values during this time period ranged between 0.35 ± 0.06 and 0.40 ± 0.10 at 355 nm and from 0.32 ± 0.04 to 0.35 ± 0.14 at 532 nm. After 14:00 UTC, the CoM along with the baer started decreasing. The layers were located from 2.54 to 4.26 km and the baer values remained high enough, ranging from 1.17 ± 0.42 to 6.59 ± 3.74 at 355 nm and from 1.10 ± 0.53 to 6.81 ± 3.67 Mm−1sr−1 at 532 nm. After 17:00 UTC, the layer was close to 4 km and the baer was still above 3 Mm−1sr−1 for both wavelengths. The PLDR values remained above 0.31 at 355 nm and ranged between 0.29 ± 0.02 and 0.36 ± 0.05 at 532 nm, until the end of the measurement. Finally, ÅEb532/355 was between −0.15 ± 0.89 and 0.57 ± 0.17 during the whole measurement. The T measured by radiosonde at this height was equal to −10.1 °C, and the value of RH was equal to 62%, indicating that the RH was increased inside the dust layer.
It seems that the aerosol layers in this case study traveled almost without altering their properties; thus, the aerosol layers observed over ATZ presented high baer values, even after several hours of traveling (travel time between GRA and ATZ is >26 h). The observed aerosol layers exhibited PLDR values at 532 nm ranging predominantly between 0.27 and 0.36, with only one value of 0.20 recorded over GRA at 08:00 UTC. These values did not demonstrate an observable pattern in relation to temporal changes. ÅEb532/355 values show a slight increase by the time layers were observed over ATZ, suggesting changes in particle size or composition during the transport.
Finally, it is also important to comment on the behavior of RH within the dust aerosol layers at each station. The RH values ranged from 62 to 65% for the ATZ and GRA stations and reached up to 83% for the PAY station. Despite the fact that RH values within this range have also been reported in other studies, such as the SAMUM campaign, RH usually decreases within the dust layers [57,60,63]. However, there are cases where this also occurs when there is a sudden influx of moisture into the dust layer from nearby sources, such as the oceans (for instance the Mediterranean Sea or the Atlantic Ocean), the dust layer encounters an atmospheric region of high moisture, or if there are atmospheric processes that transport moisture into the layer. In addition, Saharan dust layers may sometimes interact with air masses that are already relatively moist [64,65]. If these moist air masses mix with the dust layer, they increase the RH within the layer. Moreover, vertical atmospheric motion may also play a role in altering RH values within the dust layers. Air mass lifting associated with atmospheric convection or orographic lifting along mountains can lead to adiabatic cooling and to an increase in RH within the dust layer [66].
4. Conclusions
During March and April 2022, a high-pressure system advected Saharan dust aerosols over Europe. The air masses passed over Spain and Portugal, moved to France in the first three days, and then spread towards Italy and Greece, thus reaching central Europe and extending even up to Scandinavia. By the end of March, most of southern and western Europe, as well as a small part of Scandinavia, was affected, with AOD (550 nm) values of up to 1.60. At the beginning of April, the regions of Italy, Greece, and parts of the Balkans were initially affected, and then Spain and France experienced another wave of dust extending towards northern latitudes. Although AOD values in April were lower, peaking at 0.8, the southern European countries primarily bore the brunt of dust deposition, with residual effects across the continent before the episode subsided. The March period of intrusion was extraordinary in terms of both aerosol optical properties and duration, highlighting its potential to significantly influence regional climate and air quality. The subsequent episode of April, while less intense, demonstrated the persistent impact of dust aerosols across Europe, emphasizing the long-term consequences of such atmospheric phenomena.
The stations used in this study were categorized into regions based on their coordinates and their mean backward air mass trajectory. These regions experienced different levels of impact from Saharan dust during March and April. Backward air mass trajectory analysis revealed that, in most cases, the air masses originated from western and northwestern Africa (Morocco, the western Sahara, and Algeria), crossed the western Mediterranean, and reached the Iberian Peninsula. The dust plume then spread across western and central Europe, with the exception of the DUS station, where air masses originated in northwestern Africa, passed over Tunisia and Libya, and crossed the Arabian desert, leading to a possible predominance of Asian dust in the observed dust aerosol layers, as indicated by the aerosol’s optical properties. This regional variability in dust impact highlights the complex nature of dust transport and its interaction with different air masses. The presence of Saharan dust at the DUS station confirms that dust can have diverse sources and pathways, influencing its optical properties up to distances of the order of 6.000–8.000 km.
The differences in the dust aerosol load across the studied regions emphasize the importance of considering both source regions and transport pathways in understanding dust events.
We observed sufficiently high baer coefficients (up to 19 Mm−1 sr−1), indicative of the extremely high dust aerosol load in the troposphere over the EARLINET stations, particularly during the March period. In most of the stations, for both periods, the observed PLDR values (from 0.16 to 0.43 at 355 and 532 nm) within the dust aerosol layers were similar to those observed in studies of pure Saharan dust aerosols [67], staying almost unaltered through their travel. The remaining optical properties (LR and ÅE) observed across European stations fell within the typical ranges noted over the years across the different regions of the continent [21]. Mean LR values within the different regions ranged from 36 to 50 sr (355 nm) and 39 to 54 sr (532 nm), while in April, they varied from 35 to 51 sr (355 nm) and 45 to 48 sr at 532 nm. ÅEa532/355 ranged between 0.25 to 0.53 in March and −0.30 to 0.34 in April. ÅEb532/355 values ranged from −0.03 to 0.69 in March and from −0.09 to 0.59 in April, with ÅEb1064/532 varying from 0.83 to 1.01 in March and 0.43 to 1.10 in April. At the DUS station, LR values resembled those typical of Asian dust, measuring 36 and 39 sr at 355 and 532 nm, respectively. The variations of these aerosol optical properties usually correlate with station location, air mass trajectories prior to arrival, and the intensity of the Saharan dust event, along with other atmospheric parameters specific to each episode of dust transport.
Furthermore, a 14% decrease in UV-B radiation was observed at the ground from 15 to 17 March 2022 in ATZ due to the extinction of solar radiation by desert dust aerosols. Detailed aerosol profiles from stations in GRA, PAY, and ATZ revealed, once again, extremely high baer values, reaching up to 10.73 Mm−1sr−1 at 532 nm (GRA), and notable PLDR values, which were as high as 0.40 at 355 nm (ATZ). The consistency of aerosol properties over time and space underscores the transport of nearly unaltered dust layers over long distances for more than 26 h. Additionally, RH within the dust layers was relatively increased, suggesting interactions with moist air masses.
Overall, this research underscores the critical importance of monitoring and quantifying Saharan dust events due to their significant impact on solar irradiance, atmospheric composition, and climate implications. Our findings, considering both ground-based and satellite measurements and the relevant aerosol optical and geometrical properties, provide valuable insight into the three-dimensional dust transport mechanisms over the European continent, which can lead to further improvement of current general circulation and climate models as intense dust events may play a subsequent role in the Earth’s desertification [68]. Furthermore, continuous investigation of such intense and large-scale dust events is essential for advancing our knowledge of aerosol behavior and improving predictive capabilities for future dust events.
Author Contributions
Conceptualization, C.-A.P. and A.P.; methodology, C.-A.P.; data analysis, C.-A.P.; data pre-processing, all authors; model simulations (HYSPLIT), C.-A.P. and M.G.; investigation, C.-A.P.; visualization, C.-A.P.; writing—original draft preparation, C.-A.P., M.G. and A.P.; writing—review and editing, all authors. All authors have read and agreed to the published version of the manuscript.
Funding
This research received fund G.A. n. 1719/2020—CIR01_00015 by the Italian Ministry of University and Research (Strengthening human capital of ACTRIS Italy Research infrastructure—PER-ACTRIS-IT).
Data Availability Statement
The aerosol lidar profiles used in this study are available upon registration on the EARLINET web page (https://data.earlinet.org), apart from the lidar profiles that have been archived in the NDACC database (current web address: https://www-air.larc.nasa.gov/missions/ndacc/data.html#, accessed on 2 July 2024). They are also available under https://doi.org/10.60897/garmisch_v01_lidar [69] and https://doi.org/10.60897/zugspitze_v01_lidar [70], respectively. CALIPSO data can be found in Earthdata, which is the home for full and open access to NASA’s Earth science data collections (https://subset.larc.nasa.gov/calipso/, accessed on 15 February 2024). Backward air mass trajectory data can be found on the READY website (https://www.ready.noaa.gov) and NAAPS image data can be found on the corresponding site (http://www.nrlmry.navy.mil/aerosol/, accessed on 15 February 2024).
Acknowledgments
C.-A.P. acknowledges the support of the project on Strengthening human capital of ACTRIS Italy Research infrastructure-PER-ACTRIS-IT (project code no. CIR01_00015, no. 2595—CUP: B58I20000220001). M.G.’s work was supported by the Hellenic Foundation for Research and Innovation (HFRI) under the 4th Call for HFRI Ph.D. Fellowships (Fellowship number: 9293). H.B., R.E., S.F.A., J.H. and A.A.F. acknowledge the funding by the German Federal Ministry of Education and Research (BMBF) under the FONA Strategy “Research for Sustainability” for the installation of the Dushanbe lidar site under the grant agreement 01LK1603A, and for ACTRIS-D under the grant agreements 01LK2001A-K and 01LK2002A-G. J.A.B.A.’s and J.A.G.’s work was supported by the projects INTEGRATYON3 (PID2020-117825GB-C21 and PID2020-117825GB-C22) and ELPIS (PID2020-120015RB-I00), funded by MCIN/AEI/10.13039/501100011033 and ATMO-ACCESS (grant no.101008004). B.D.R.’s, G.G.’s, P.G.C.’s, and M.M.’s work was supported by IR0000032—ITINERIS, Italian Integrated Environmental Research Infrastructures System (D.D. no. 130/2022—CUP B53C22002150006) funded by the EU—Next Generation EU PNRR-Mission 4 “Education and Research”—Component 2: “From research to business”—Investment 3.1: “Fund for the realization of an integrated system of research and innovation infrastructures”. C.M.P. and A.R.G. were also supported by the Spanish Ministry of Science and Innovation (grant no. PID2023-149747NB-I00) and the Horizon Europe-REALISTIC project (grant no. 101086690). I.S.S. and D.M.S. acknowledge support of the National Information Processing Institute of Poland (OPI-BIP) within the Smart Growth Operational Programme grant ACTRIS-Poland no. POIR.04.02.00-00-D019/20; the National Science Centre of Poland (NCN) within the Preludium 19 grant preDUST no. 2020/37/N/ST10/02682; and the Polish Fund for Science and Technology (FNiTP) grant no. 519/FNITP/115/2010.K.A.V. acknowledges support by the PANGEA4CalVal (grant agreement no. 101079201) funded by the European Union. E.M. acknowledges support by the Hellenic Foundation for Research and Innovation (H.F.R.I.) under the “3rd [NT1] Call for H.F.R.I. Research Projects to support Post-Doctoral Researchers” (Project Acronym: REVEAL, Project Number: 07222). Moreover, the authors acknowledge support by the European Commission under the H2020—Research and Innovation Framework Programme, H2020-INFRAIA-2020-1, ATMO-ACCESS (grant no. 101008004). The authors also acknowledge the scientific projects ACTRIS-2 under the H2020, GRASP-ACE, and ACTRIS IMP (grant no. 654109, 778349 and 871115), the NOAA Air Resources Laboratory (ARL) for the provision of the HYSPLIT transport and dispersion model, and/or the READY website (http://www.ready.noaa.gov) used in this publication. The authors also acknowledge the EARLINET-ACTRIS community for providing the aerosol lidar profiles utilized in this study. We particularly acknowledge those members who conducted the measurements, evaluated the lidar data, and made the data available in the EARLINET database. The data set used in this study was obtained within the ACTRIS IMP H2020 GA 871115. The access to the ACTRIS infrastructure got support from ATMO-ACCESS H2020 GA 101008004. Authors gratefully acknowledge the CALIPSO satellite for the CALIOP data products obtained from the NASA Langley Research Center Atmospheric Science Data Center. The authors also acknowledge the AOD images provided by the U.S. Naval Research Laboratory and the developers of the NAAPS model.
Conflicts of Interest
The authors declare no conflicts of interest.
Appendix A
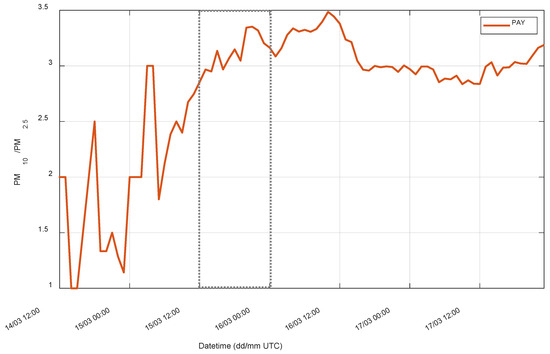
Figure A1.
PM10/PM2.5 ratio within the period of 15–18 March 2022 over the PAY station. The dotted box corresponds to the time period within which the lidar profile lies.
References
- Kok, J.F.; Adebiyi, A.A.; Albani, S.; Balkanski, Y.; Checa-Garcia, R.; Chin, M.; Colarco, P.R.; Hamilton, D.S.; Huang, Y.; Ito, A.; et al. Contribution of the World’s Main Dust Source Regions to the Global Cycle of Desert Dust. Atmos. Chem. Phys. 2021, 21, 8169–8193. [Google Scholar] [CrossRef]
- IPCC. Summary for Policymakers. In Climate Change 2023: Synthesis Report, Contribution of Working Groups I, II and III to the Sixth Assessment Report of the Intergovernmental Panel on Climate Change; Core Writing Team, Lee, H., Romero, J., Eds.; IPCC: Geneva, Switzerland, 2023; pp. 1–34. [Google Scholar] [CrossRef]
- Andreae, M.O.; Rosenfeld, D. Aerosol–cloud–precipitation Interactions. Part 1. The Nature and Sources of Cloud-Active Aerosols. Earth-Sci. Rev. 2008, 89, 13–41. [Google Scholar] [CrossRef]
- Seigel, R.B.; Van Den Heever, S.C.; Saleeby, S.M. Mineral Dust Indirect Effects and Cloud Radiative Feedbacks of a Simulated Idealized Nocturnal Squall Line. Atmos. Chem. Phys. 2013, 13, 4467–4485. [Google Scholar] [CrossRef]
- Rosenfeld, D. Suppression of Rain and Snow by Urban and Industrial Air Pollution. Science 2000, 287, 1793–1796. [Google Scholar] [CrossRef] [PubMed]
- Giannadaki, D.; Pozzer, A.; Lelieveld, J. Modeled Global Effects of Airborne Desert Dust on Air Quality and Premature Mortality. Atmos. Chem. Phys. 2014, 14, 957–968. [Google Scholar] [CrossRef]
- Mylonaki, M.; Gini, M.; Georgopoulou, M.; Pilou, M.; Chalvatzaki, E.; Solomos, S.; Diapouli, E.; Giannakaki, E.; Lazaridis, M.; Pandis, S.N.; et al. Wildfire and African Dust Aerosol Oxidative Potential, Exposure and Dose in the Human Respiratory Tract. Sci. Total Environ. 2024, 913, 169683. [Google Scholar] [CrossRef]
- Goudie, A.S. Desert Dust and Human Health Disorders. Environ. Int. 2014, 63, 101–113. [Google Scholar] [CrossRef]
- Zhang, X.; Zhao, L.; Tong, D.Q.; Wu, G.; Dan, M.; Teng, B. A Systematic Review of Global Desert Dust and Associated Human Health Effects. Atmosphere 2016, 7, 158. [Google Scholar] [CrossRef]
- World Health Organization. WHO Global Air Quality Guidelines. In Particulate Matter (PM2.5 and PM10), Ozone, Nitrogen Dioxide, Sulfur Dioxide and Carbon Monoxide; World Health Organization: Geneva, Switzerland, 2021; pp. 1–360. [Google Scholar]
- Mona, L.; Liu, Z.; Müller, D.; Omar, A.; Papayannis, A.; Pappalardo, G.; Sugimoto, N.; Vaughan, M. Lidar Measurements for Desert Dust Characterization: An Overview. Adv. Meteorol. 2012, 2012, 356265. [Google Scholar] [CrossRef]
- Giannakaki, E.; Balis, D.S.; Amiridis, V.; Zerefos, C. Optical Properties of Different Aerosol Types: Seven Years of Combined Raman-Elastic Backscatter Lidar Measurements in Thessaloniki, Greece. Atmos. Meas. Tech. 2010, 3, 569–578. [Google Scholar] [CrossRef]
- Fernández, A.J.; Sicard, M.; Costa, M.J.; Guerrero-Rascado, J.L.; Gómez-Amo, J.L.; Molero, F.; Barragán, R.; Basart, S.; Bortoli, D.; Bedoya-Velásquez, A.E.; et al. Extreme, Wintertime Saharan Dust Intrusion in the Iberian Peninsula: Lidar Monitoring and Evaluation of Dust Forecast Models during the February 2017 Event. Atmos. Res. 2019, 228, 223–241. [Google Scholar] [CrossRef]
- Mona, L.; Papagiannopoulos, N.; Basart, S.; Baldasano, J.; Binietoglou, I.; Cornacchia, C.; Pappalardo, G. EARLINET Dust Observations vs. BSC-DREAM8b Modeled Profiles: 12-Year-Long Systematic Comparison at Potenza, Italy. Atmos. Chem. Phys. 2014, 14, 8781–8793. [Google Scholar] [CrossRef]
- Cazorla, A.; Andrés Casquero-Vera, J.; Román, R.; Luis Guerrero-Rascado, J.; Toledano, C.; Cachorro, V.E.; Orza, J.A.G.; Cancillo, M.L.; Serrano, A.; Titos, G.; et al. Near-Real-Time Processing of a Ceilometer Network Assisted with Sun-Photometer Data: Monitoring a Dust Outbreak over the Iberian Peninsula. Atmos. Chem. Phys. 2017, 17, 11861–11876. [Google Scholar] [CrossRef]
- Mamouri, R.E.; Ansmann, A.; Nisantzi, A.; Solomos, S.; Kallos, G.; Hadjimitsis, D.G. Extreme Dust Storm over the Eastern Mediterranean in September 2015: Satellite, Lidar, and Surface Observations in the Cyprus Region. Atmos. Chem. Phys. 2016, 16, 13711–13724. [Google Scholar] [CrossRef]
- Nisantzi, A.; Mamouri, R.E.; Ansmann, A.; Hadjimitsis, D. Injection of Mineral Dust into the Free Troposphere during Fire Events Observed with Polarization Lidar at Limassol, Cyprus. Atmos. Chem. Phys. 2014, 14, 12155–12165. [Google Scholar] [CrossRef]
- Guerrero-Rascado, J.L.; Olmo, F.J.; Avilés-Rodríguez, I.; Navas-Guzmán, F.; Pérez-Ramírez, D.; Lyamani, H.; Arboledas, L.A. Extreme Saharan Dust Event over the Southern Iberian Peninsula in September 2007: Active and Passive Remote Sensing from Surface and Satellite. Atmos. Chem. Phys. 2009, 9, 8453–8469. [Google Scholar] [CrossRef]
- Soupiona, O.; Papayannis, A.; Kokkalis, P.; Foskinis, R.; Sánchez Hernández, G.; Ortiz-Amezcua, P.; Mylonaki, M.; Papanikolaou, C.A.; Papagiannopoulos, N.; Samaras, S.; et al. EARLINET Observations of Saharan Dust Intrusions over the Northern Mediterranean Region (2014–2017): Properties and Impact on Radiative Forcing. Atmos. Chem. Phys. 2020, 20, 15147–15166. [Google Scholar] [CrossRef]
- Mylonaki, M.; Papayannis, A.; Papanikolaou, C.-A.; Foskinis, R.; Soupiona, O.; Maroufidis, G.; Anagnou, D.; Kralli, E. Tropospheric Vertical Profiling of the Aerosol Backscatter Coefficient and the Particle Linear Depolarization Ratio for Different Aerosol Mixtures during the PANACEA Campaign in July 2019 at Volos, Greece. Atmos. Environ. 2021, 247, 118184. [Google Scholar] [CrossRef]
- Mylonaki, M.; Giannakaki, E.; Papayannis, A.; Papanikolaou, C.; Komppula, M. Aerosol Type Classification Analysis Using EARLINET Multiwavelength and Depolarization Lidar Observations. Atmos. Chem. Phys. 2021, 21, 2211–2227. [Google Scholar] [CrossRef]
- Papayannis, A.; Amiridis, V.; Mona, L.; Tsaknakis, G.; Balis, D.; Bösenberg, J.; Chaikovski, A.; De Tomasi, F.; Grigorov, I.; Mattis, I.; et al. Systematic Lidar Observations of Saharan Dust over Europe in the Frame of EARLINET (2000–2002). J. Geophys. Res. Atmos. 2008, 113, 148–227. [Google Scholar] [CrossRef]
- Soupiona, O.; Samaras, S.; Ortiz-Amezcua, P.; Böckmann, C.; Papayannis, A.; Moreira, G.A.; Benavent-Oltra, J.A.; Guerrero-Rascado, J.L.; Bedoya-Velásquez, A.E.; Olmo, F.J.; et al. Retrieval of Optical and Microphysical Properties of Transported Saharan Dust over Athens and Granada Based on Multi-Wavelength Raman Lidar Measurements: Study of the Mixing Processes. Atmos. Environ. 2019, 214, 116824. [Google Scholar] [CrossRef]
- Soupiona, O.; Papayannis, A.; Kokkalis, P.; Mylonaki, M.; Tsaknakis, G.; Argyrouli, A.; Vratolis, S. Long-Term Systematic Profiling of Dust Aerosol Optical Properties Using the EOLE NTUA Lidar System over Athens, Greece (2000–2016). Atmos. Environ. 2018, 183, 165–174. [Google Scholar] [CrossRef]
- Kokkalis, P.; Soupiona, O.; Papanikolaou, C.A.; Foskinis, R.; Mylonaki, M.; Solomos, S.; Vratolis, S.; Vasilatou, V.; Kralli, E.; Anagnou, D.; et al. Radiative Effect and Mixing Processes of a Long-Lasting Dust Event over Athens, Greece, during the COVID-19 Period. Atmosphere 2021, 12, 318. [Google Scholar] [CrossRef]
- Szczepanik, D.M.; Stachlewska, I.S.; Tetoni, E.; Althausen, D. Properties of Saharan Dust Versus Local Urban Dust—A Case Study. Earth Space Sci. 2021, 8, e2021EA001816. [Google Scholar] [CrossRef]
- López-Cayuela, M.Á.; Córdoba-Jabonero, C.; Bermejo-Pantaleón, D.; Sicard, M.; Salgueiro, V.; Molero, F.; Carvajal-Pérez, C.V.; Granados-Muñoz, M.J.; Comerón, A.; Couto, F.T.; et al. Vertical Characterization of Fine and Coarse Dust Particles during an Intense Saharan Dust Outbreak over the Iberian Peninsula in Springtime 2021. Atmos. Chem. Phys. 2023, 23, 143–161. [Google Scholar] [CrossRef]
- Müller, D.; Heinold, B.; Tesche, M.; Tegen, I.; Althausen, D.; Arboledas, L.A.; Amiridis, V.; Amodeo, A.; Ansmann, A.; Balis, D.; et al. EARLINET Observations of the 14-22-May Long-Range Dust Transport Event during SAMUM 2006: Validation of Results from Dust Transport Modelling. Tellus Ser. B Chem. Phys. Meteorol. 2009, 61, 325–339. [Google Scholar] [CrossRef]
- Hofer, J.; Althausen, D.; Abdullaev, S.F.; Makhmudov, A.N.; Nazarov, B.I.; Schettler, G.; Engelmann, R.; Baars, H.; Fomba, K.W.; Müller, K.; et al. Long-Term Profiling of Mineral Dust and Pollution Aerosol with Multiwavelength Polarization Raman Lidar at the Central Asian Site of Dushanbe, Tajikistan: Case Studies. Atmos. Chem. Phys. 2017, 17, 14559–14577. [Google Scholar] [CrossRef]
- Adebiyi, A.A.; Kok, J.F. Climate Models Miss Most of the Coarse Dust in the Atmosphere. Sci. Adv. 2020, 6, eaaz9507. [Google Scholar] [CrossRef]
- Cuevas-Agulló, E.; Barriopedro, D.; García, R.D.; Alonso-pérez, S. Sharp Increase in Saharan Dust Intrusions over the Western Euro-Mediterranean in February–March 2020–2022 and Associated Atmospheric Circulation. Atmos. Chem. Phys. 2024, 24, 4083–4104. [Google Scholar] [CrossRef]
- Pappalardo, G.; Amodeo, A.; Apituley, A.; Comeron, A.; Freudenthaler, V.; Linné, H.; Ansmann, A.; Bösenberg, J.; D’Amico, G.; Mattis, I.; et al. EARLINET: Towards an Advanced Sustainable European Aerosol Lidar Network. Atmos. Meas. Tech. 2014, 7, 2389–2409. [Google Scholar] [CrossRef]
- Winker, D.M.; Tackett, J.L.; Getzewich, B.J.; Liu, Z.; Vaughan, M.A.; Rogers, R.R. The Global 3-D Distribution of Tropospheric Aerosols as Characterized by CALIOP. Atmos. Chem. Phys. 2013, 13, 3345–3361. [Google Scholar] [CrossRef]
- Winker, D.M.; Vaughan, M.A.; Omar, A.; Hu, Y.; Powell, K.A.; Liu, Z.; Hunt, W.H.; Young, S.A. Overview of the CALIPSO Mission and CALIOP Data Processing Algorithms. J. Atmos. Ocean. Technol. 2009, 26, 2310–2323. [Google Scholar] [CrossRef]
- Kim, M.H.; Omar, A.H.; Tackett, J.L.; Vaughan, M.A.; Winker, D.M.; Trepte, C.R.; Hu, Y.; Liu, Z.; Poole, L.R.; Pitts, M.C.; et al. The CALIPSO Version 4 Automated Aerosol Classification and Lidar Ratio Selection Algorithm. Atmos. Meas. Tech. 2018, 11, 6107–6135. [Google Scholar] [CrossRef] [PubMed]
- Omar, A.H.; Winker, D.M.; Vaughan, M.A.; Hu, Y.; Trepte, C.R.; Ferrare, R.A.; Lee, K.-P.; Hostetler, C.A.; Kittaka, C.; Rogers, R.R.; et al. The CALIPSO Automated Aerosol Classification and Lidar Ratio Selection Algorithm. J. Atmos. Ocean. Technol. 2009, 26, 1994–2014. [Google Scholar] [CrossRef]
- Tackett, J.L.; Kar, J.; Vaughan, M.A.; Getzewich, B.J.; Kim, M.; Omar, A.H.; Magill, B.E.; Pitts, M.C.; Winker, D.M. The CALIPSO Version 4.5 Stratospheric Aerosol Subtyping Algorithm. Atmos. Meas. Tech. 2022, 16, 745–768. [Google Scholar] [CrossRef]
- Stein, A.F.; Draxler, R.R.; Rolph, G.D.; Stunder, B.J.B.; Cohen, M.D.; Ngan, F. NOAA’s Hysplit Atmospheric Transport and Dispersion Modeling System. Bull. Am. Meteorol. Soc. 2015, 96, 2059–2077. [Google Scholar] [CrossRef]
- Rolph, G.; Stein, A.; Stunder, B. Real-Time Environmental Applications and Display SYstem: READY. Environ. Model. Softw. 2017, 95, 210–228. [Google Scholar] [CrossRef]
- Draxler, R.R. 1999: HYSPLIT4 User’s Guide; NOAA Tech. Memo. ERL ARL-230; NOAA Air Resources Laboratory: Silver Spring, MD, USA, 2009. [Google Scholar]
- Draxler, R.R.; Hess, G.D. An Overview of the HYSPLIT_4 Modelling System for Trajectories, Dispersion and Deposition. Aust. Meteorol. Mag. 1998, 47, 295–308. [Google Scholar]
- Papayannis, A.; Mamouri, R.E.; Amiridis, V.; Giannakaki, E.; Veselovskii, I.; Kokkalis, P.; Tsaknakis, G.; Balis, D.; Kristiansen, N.I.; Stohl, A.; et al. Optical Properties and Vertical Extension of Aged Ash Layers over the Eastern Mediterranean as Observed by Raman Lidars during the Eyjafjallajökull Eruption in May 2010. Atmos. Environ. 2012, 48, 56–65. [Google Scholar] [CrossRef]
- Lynch, P.; Reid, J.S.; Westphal, D.L.; Zhang, J.; Hogan, T.F.; Hyer, E.J.; Curtis, C.A.; Hegg, D.A.; Shi, Y.; Campbell, J.R.; et al. An 11-Year Global Gridded Aerosol Optical Thickness Reanalysis (v1.0) for Atmospheric and Climate Sciences. Geosci. Model Dev. 2016, 9, 1489–1522. [Google Scholar] [CrossRef]
- Trickl, T.; Vogelmann, H.; Fromm, M.D.; Jäger, H.; Perfahl, M.; Steinbrecht, W. Measurement Report: Violent Biomass Burning and Volcanic Eruptions—A New Period of Elevated Stratospheric Aerosol over Central Europe (2017 to 2023) in a Long Series of Observations. Atmos. Chem. Phys. 2024, 24, 1997–2021. [Google Scholar] [CrossRef]
- Young, S.A.; Vaughan, M.A.; Garnier, A.; Tackett, J.L.; Lambeth, J.D.; Powell, K.A. Extinction and Optical Depth Retrievals for CALIPSO’s Version 4 Data Release. Atmos. Meas. Tech. 2018, 11, 5701–5727. [Google Scholar] [CrossRef]
- D’Amico, G.; Amodeo, A.; Baars, H.; Binietoglou, I.; Freudenthaler, V.; Mattis, I.; Wandinger, U.; Pappalardo, G. EARLINET Single Calculus Chain–Overview on Methodology and Strategy. Atmos. Meas. Tech. 2015, 8, 4891–4916. [Google Scholar] [CrossRef]
- Mattis, I.; D’Amico, G.; Baars, H.; Amodeo, A.; Madonna, F.; Iarlori, M. EARLINET Single Calculus Chain-Technical—Part 2: Calculation of Optical Products. Atmos. Meas. Tech. 2016, 9, 3009–3029. [Google Scholar] [CrossRef]
- D’Amico, G.; Amodeo, A.; Mattis, I.; Freudenthaler, V.; Pappalardo, G. EARLINET Single Calculus Chain-Technical Andndash; Part 1: Pre-Processing of Raw Lidar Data. Atmos. Meas. Tech. 2016, 9, 491–507. [Google Scholar] [CrossRef]
- Mamouri, R.E.; Ansmann, A.; Nisantzi, A.; Kokkalis, P.; Schwarz, A.; Hadjimitsis, D. Low Arabian Dust Extinction-to-Backscatter Ratio. Geophys. Res. Lett. 2013, 40, 4762–4766. [Google Scholar] [CrossRef]
- Nisantzi, A.; Mamouri, R.E.; Ansmann, A.; Schuster, G.L.; Hadjimitsis, D.G. Middle East versus Saharan Dust Extinction-to-Backscatter Ratios. Atmos. Chem. Phys. 2015, 15, 7071–7084. [Google Scholar] [CrossRef]
- Szczepanik, D.M.; Poczta, P.; Talianu, C.; Böckmann, C.; Ritter, C.; Stefanie, H.; Toanca, F.; Chojnicki, B.H.; Schüttemeyer, D.; Stachlewska, I.S. Spatio-Temporal Evolution of Long-Range Transported Mineral Desert Dust Properties over Rural and Urban Sites in Central Europe. Sci. Total Environ. 2023, 903, 166173. [Google Scholar] [CrossRef]
- Granados-Muñoz, M.J.; Navas-Guzmán, F.; Bravo-Aranda, J.A.; Guerrero-Rascado, J.L.; Lyamani, H.; Valenzuela, A.; Titos, G.; Fernández-Gálvez, J.; Alados-Arboledas, L. Hygroscopic Growth of Atmospheric Aerosol Particles Based on Active Remote Sensing and Radiosounding Measurements: Selected Cases in Southeastern Spain. Atmos. Meas. Tech. 2015, 8, 705–718. [Google Scholar] [CrossRef]
- Pereira, G.; Shimabukuro, Y.E.; Moraes, E.C.; Freitas, S.R.; Cardozo, F.S.; Longo, K.M. Monitoring the Transport of Biomass Burning Emission in South America. Atmos. Pollut. Res. 2011, 2, 247–254. [Google Scholar] [CrossRef]
- Janicka, L.; Stachlewska, I.S.; Veselovskii, I.; Baars, H. Temporal Variations in Optical and Microphysical Properties of Mineral Dust and Biomass Burning Aerosol Derived from Daytime Raman Lidar Observations over Warsaw, Poland. Atmos. Environ. 2017, 169, 162–174. [Google Scholar] [CrossRef]
- Sicard, M.; Barragan, R.; Sanchez, R.Z. Contribution of EARLINET/ACTRIS to the Summer 2013 Special Observing Period of the ChArMEx Project: Monitoring of a Saharan Dust Event over the Western and Central Mediterranean. Int. J. Remote Sens. 2016, 37, 4698–4711. [Google Scholar] [CrossRef]
- Granados-Muñoz, M.J.; Bravo-Aranda, J.A.; Baumgardner, D.; Guerrero-Rascado, J.L.; Pérez-Ramírez, D.; Navas-Guzmán, F.; Veselovskii, I.; Lyamani, H.; Valenzuela, A.; Olmo, F.J.; et al. A Comparative Study of Aerosol Microphysical Properties Retrieved from Ground-Based Remote Sensing and Aircraft in Situ Measurements during a Saharan Dust Event. Atmos. Meas. Tech. 2016, 9, 1113–1133. [Google Scholar] [CrossRef]
- Veselovskii, I.; Goloub, P.; Podvin, T.; Bovchaliuk, V.; Derimian, Y.; Augustin, P.; Fourmentin, M.; Tanre, D.; Korenskiy, M.; Whiteman, D.N.; et al. Retrieval of Optical and Physical Properties of African Dust from Multiwavelength Raman Lidar Measurements during the SHADOW Campaign in Senegal. Atmos. Chem. Phys. 2016, 16, 7013–7028. [Google Scholar] [CrossRef]
- Veselovskii, I.; Hu, Q.; Goloub, P.; Podvin, T.; Korenskiy, M.; Derimian, Y.; Legrand, M.; Castellanos, P. Variability in Lidar-Derived Particle Properties over West Africa Due to Changes in Absorption: Towards an Understanding. Atmos. Chem. Phys. 2020, 20, 6563–6581. [Google Scholar] [CrossRef]
- Tesche, M.; Ansmann, A.; Müller, D.; Althausen, D.; Engelmann, R.; Freudenthaler, V.; Groß, S. Vertically Resolved Separation of Dust and Smoke over Cape Verde Using Multiwavelength Raman and Polarization Lidars during Saharan Mineral Dust Experiment 2008. J. Geophys. Res. Atmos. 2009, 114, 1–14. [Google Scholar] [CrossRef]
- Freudenthaler, V.; Esselborn, M.; Wiegner, M.; Heese, B.; Tesche, M.; Ansmann, A.; Müller, D.; Althausen, D.; Wirth, M.; Fix, A.; et al. Depolarization Ratio Profiling at Several Wavelengths in Pure Saharan Dust during SAMUM 2006. Tellus Ser. B Chem. Phys. Meteorol. 2009, 61, 165–179. [Google Scholar] [CrossRef]
- Groß, S.; Gasteiger, J.; Freudenthaler, V.; Müller, T.; Sauer, D.; Toledano, C.; Ansmann, A. Saharan Dust Contribution to the Caribbean Summertime Boundary Layer—A Lidar Study during SALTRACE. Atmos. Chem. Phys. 2016, 16, 11535–11546. [Google Scholar] [CrossRef]
- Eleftheratos, K.; Kouklaki, D.; Zerefos, C. Sixteen Years of Measurements of Ozone over Athens, Greece with a Brewer Spectrophotometer. Oxygen 2021, 1, 32–45. [Google Scholar] [CrossRef]
- Bauer, S.; Bierwirth, E.; Esselborn, M.; Petzold, A.; Macke, A.; Trautmann, T.; Wendisch, M. Airborne Spectral Radiation Measurements to Derive Solar Radiative Forcing of Saharan Dust Mixed with Biomass Burning Smoke Particles. Tellus Ser. B Chem. Phys. Meteorol. 2011, 63, 742–750. [Google Scholar] [CrossRef][Green Version]
- Ryder, C.L.; McQuaid, J.B.; Flamant, C.; Rosenberg, P.D.; Washington, R.; Brindley, H.E.; Highwood, E.J.; Marsham, J.H.; Parker, D.J.; Todd, M.C.; et al. Advances in Understanding Mineral Dust and Boundary Layer Processes over the Sahara from Fennec Aircraft Observations. Atmos. Chem. Phys. 2015, 15, 8479–8520. [Google Scholar] [CrossRef]
- Maring, H.; Savoie, D.L.; Izaguirre, M.A.; Custals, L.; Reid, J.S. Mineral Dust Aerosol Size Distribution Change during Atmospheric Transport. J. Geophys. Res. Atmos. 2003, 108, 8592. [Google Scholar] [CrossRef]
- Knippertz, P.; Todd, M.C. Mineral Dust Aerosols over the Sahara: Meteorological Controls on Emission and Transport and Implications for Modeling. Rev. Geophys. 2012, 50. [Google Scholar] [CrossRef]
- Haarig, M.; Ansmann, A.; Engelmann, R.; Baars, H.; Toledano, C.; Torres, B.; Althausen, D.; Radenz, M.; Wandinger, U. First Triple-Wavelength Lidar Observations of Depolarization and Extinction-to-Backscatter Ratios of Saharan Dust. Atmos. Chem. Phys. 2022, 22, 355–369. [Google Scholar] [CrossRef]
- Mirzabaev, A.; Wu, J.; Evans, J.; García-Oliva, F.; Hussein, I.A.G.; Iqbal, M.M.; Kimutai, J.; Knowles, T.; Meza, F.; Nedjraoui, D.; et al. Desertification; Cambridge University Press: Cambridge, UK, 2022; ISBN 9781009157988. [Google Scholar]
- Trickl, T.; Jaeger, H. NDACC stratospheric aerosol LIDAR data from the station Garmisch-Partenkirchen. ESA Atmos. Valid. Data Cent. 2023. [Google Scholar] [CrossRef]
- Vogelmann, H.; Trickl, T.; Speidel, J. NDACC stratospheric aerosol LIDAR data from the station Schneefernerhaus on Mt. Zugspitze. ESA Atmos. Valid. Data Cent. 2023. [Google Scholar] [CrossRef]
Disclaimer/Publisher’s Note: The statements, opinions and data contained in all publications are solely those of the individual author(s) and contributor(s) and not of MDPI and/or the editor(s). MDPI and/or the editor(s) disclaim responsibility for any injury to people or property resulting from any ideas, methods, instructions or products referred to in the content. |
© 2024 by the authors. Licensee MDPI, Basel, Switzerland. This article is an open access article distributed under the terms and conditions of the Creative Commons Attribution (CC BY) license (https://creativecommons.org/licenses/by/4.0/).