Abstract
Strong earthquakes often bring amounts of loose material, disrupting the balance of material transportation within a watershed and severely impacting the restoration of the ecological environment and human safety downstream. Therefore, it is crucial to identify the frequency and scale of these debris flow events, as well as to explore their long-term development and impact on internal and external channels. Using multi-source remote sensing images from four perspectives, hillslope, channel, accumulation fan, and their relationship with the mainstream, we reconstructed a debris flow event dataset from 2008 to 2020, explored a method for identifying these events, and analyzed their impacts on channels and accumulation fans in Mozi Gully affected by the Wenchuan earthquake. Loose matter was predominantly found in areas proximate to the channel and at lower elevations during debris flow events. Alterations in channel width, accumulation fans downstream, and their potential to obstruct rivers proved to be vital for identifying the large scale of debris flow event. Finally, we encapsulated the evolution patterns and constraints of post-earthquake debris flows. Determination in frequency and scale could offer valuable supplementary data for scenario hypothesis parameters in post-earthquake disaster engineering prevention and control.
1. Introduction
Earthquake, as an important sudden factor in surface shaping, raises erosion rates, sediment transport, and deposition rates, which have a long-term impact on the evolution of the surface topography [1,2]. The distribution and quality of loose materials after earthquakes are the main controlling factors for the long-term evolution of post-earthquake effects [3,4,5]. The amount of co-seismic landslides disrupted the balance of solid material supply in the basin, strengthening mass transportation [6,7]. Taking the Wenchuan earthquake as an example, the drilling data of the Zipingpu Reservoir [8] and the monitoring data of hydrological stations in the Min River, Fu River, and Mianyuan River [9] proved it. The frequent post-earthquake debris flows have brought huge property losses and casualties in the earthquake area [10,11]. Exploring the long-term evolution of post-earthquake debris flows has certain scientific guiding significance for reducing disaster losses, and the risk of debris flows in earthquake-affected areas.
Current research on post-earthquake debris flows is relatively concentrated on two aspects. One is to explore the hydrological and dynamic debris flow formation in earthquake-affected areas. It mainly focuses on a single debris flow event as the main research object and carries out post-earthquake debris flow initiation conditions by building a hydrological dynamic model [12,13]. The other is to study the temporal differentiation of triggered rainfall for debris flows during different post-earthquake periods and mainly aimed at watersheds with good hydrological monitoring backgrounds [14,15,16,17,18,19,20]. Due to the limitations of the available data, the current research on post-earthquake debris flows has mainly focused on the hydrological and hydrodynamic processes of typical debris events in typical watersheds. In addition, the research on the long-term evolution of post-earthquake debris flows mainly relies on analyzing the evolution of single gully debris flows through several specific cluster debris flow events [21,22], resulting in relatively insufficient investigation efforts for single gully debris flow events. Under the nonuniform spatial and temporal development of post-earthquake debris flows [23,24], it is very important to use publicly available data to research the development patterns of different-scale debris flows after earthquakes.
Debris flow is the external force with a strong impact force that mainly adjusts the channel morphology after the earthquake [25]. According to the study of the balance state, with the change in sediment inflow conditions in the watershed, the channel will consume the impact of changes in external conditions through a series of channel shape adjustments. Channel shape adjustments mainly include the widening and uplift of the channel in the transverse aspect, the occurrence of knick points in the longitudinal aspect, and the change in curvature in the plane [26,27]. Debris flow will inevitably lead to dramatic changes in the channel, such as forming a steep-pool riverbed structure [28,29] and a significantly widened channel and accumulation fan [30]. Therefore, the widening of the channel and growth of accumulation fans can be selected to identify debris flow events and help establish the long-term evolution sequence of post-earthquake debris flow.
This study focused on a representative watershed that experienced long-term debris flow development following the Wenchuan earthquake. Multi-source remote sensing images, including satellite images and drone images in different post-earthquake periods, were collected to identify debris flow events, and the development patterns of post-earthquake debris flow are conclusively derived. The objectives of this study were as follows: (1) to propose a framework and methodology for identifying post-earthquake debris flow events using publicly accessible remote sensing data as the primary source; (2) to establish a database of long-term post-earthquake debris flow, using Mozi Gully as a case study, and to identify the characteristics of post-earthquake debris flow, including its evolution, positional characteristics, and impact on the channel; and (3) to provide an evolution pattern in post-earthquake debris flows associated with channel characteristics.
2. Materials and Methods
2.1. Study Area
The Mozi Gully is located in Wenchuan County, Sichuan Province, China, with a total area of approximately 7.19 km2 (103°29′02.40″E, 31°9′09.72″N). It belongs to the right bank of the upper reaches of Min River with an approximately west–east orientation (Figure 1a,b). Moreover, the longest flow length is about 5.5 km, and the relative height difference is 2550 m with an average longitudinal gradient of approximately 372‰ (Figure 1c). The lithology mainly comprises Proterozoic medium-grained granite intrusive rocks with strong weathering resistance. Mozi Gully is between the Beichuan–Yingxiu Fault and the Maoxian–Wenchuan Fault.
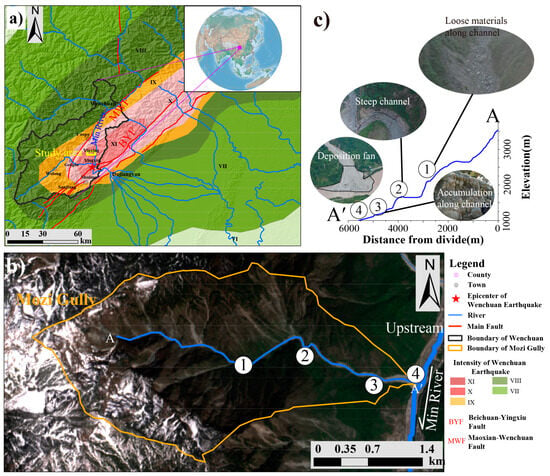
Figure 1.
Location of Mozi Gully, where (a) shows the location of Mozi Gully in Wenchuan, Sichuan, China as the yellow rectangle; (b) shows the detailed information of Mozi Gully and the relationship between Mozi Gully and Min River; (c) shows the topographic relief, channel profile, and the detailed display of local characteristics in Mozi Gully.
The study area is in the mountainous subtropical humid monsoon climate zone, controlled by the Pacific warm high in summer and the prevailing northwest plateau dry air in winter [31,32]. The climate of the study area is generally hot and humid rain in summer with serious continuous rain in autumn, and the annual difference in temperature is small. According to the data from the Yingxiu precipitation station, the average precipitation in Mozi Gully can reach 1253 mm per year, and the rainfall from July to September accounts for 57.9% of the annual rainfall [31,32].
The distance from the study area to the epicenter of the 2008 Mw 7.9 Wenchuan earthquake is about 9 km (Figure 1). And according to the Wenchuan 8.0 Earthquake Intensity Distribution Map generated by the China Seismological Bureau (https://www.cea.gov.cn/cea/xwzx/xydt/5219388/index.html, accessed on 9 February 2023), Mozi Gully is located in the XI intensity zone of the Wenchuan earthquake (Figure 1a). Mozi Gully was more seriously affected by the earthquake, with about 3.66 km2 of co-seismic loose material occupying about 50.96% of the watershed area [33,34]. Since the 2008 Wenchuan earthquake, strong material transport events such as debris flow and flash floods in the study area have been frequent [4,11], and there is a gradual activation of loose material recharge within the watershed under strong rainfall conditions after the earthquake [1,23,24,34]. This situation led to relatively high debris flow activity in Mozi Gully for a long time after the earthquake. On 20 August 2019, under the action of 24.2 mm/h triggered rainfall, a debris flow broke out in Mozi Gully, bringing about drastic changes in the channel and accumulation fan.
2.2. Data Sources
2.2.1. Satellite Remote Sensing Images
Due to the lack of information on the detailed description of the disaster events in Mozi Gully, long-term and continuous satellite remote sensing data with different resolutions from 2 m to 30 m were used to analyze the post-earthquake material transport events from 2008 to 2019, including Landsat series images, Sentinel 2, and GF 1. Landsat series images were used to analyze changes in the loose materials, and Sentinel 2 and GF 1 were used to verify the results (Table 1). The acquisition of these several satellite remote sensing images included two main data sources. Among them, Sentinel 2 data from 2017 to 2020 were obtained from the Copernicus Open Access Hub by European Space Agency (ESA) (https://browser.dataspace.copernicus.eu, accessed on 7 August 2024), and Landsat series data from 2007 to 2020 (including Landsat 5, 7, 8) were obtained from the open-source Earth observation dataset (Earthdata) by National Aeronautics and Space Administration (NASA) (https://search.earthdata.nasa.gov, accessed on 7 August 2024). And the GF 1 from 2013 to 2016 applied from the Sichuan Province National Defense Science and Technology Industry Office. In addition, two commercial satellite images purchased by the Institute of Mountain Hazards and Environment (IMHE), CAS, were also used in this research.

Table 1.
Information of the remote sensing images used for Mozi Gully.
2.2.2. High-Precision Images Obtained by Unmanned Aerial Vehicle (UAV)
The high-precision images obtained by DJI UAV are mainly used to monitor the changes in loose materials in channels and hillslopes before and after the flood season in 2019 and 2020. Influenced by local rainfall and other factors, UAV images taken on 7 June 2019, 23 August 2019, 9 May 2020, and 6 September 2020, were collected.
2.3. Methods
In this study, the aim was to construct a database of post-earthquake debris flow events and analyze the evolution patterns from the perspectives of hillslope, channel, and accumulation fans, using remote sensing images of different resolutions and previous studies (Figure 2).
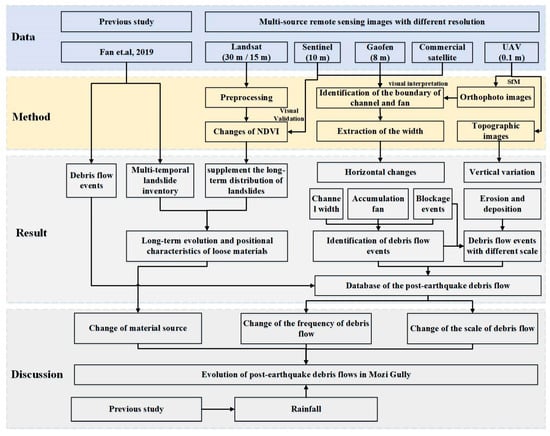
Figure 2.
Flowchart for building a debris flow event database using multi-source remote sensing data.
2.3.1. Multi-Temporal Inventory of Landslides
In this study, the landslide database mainly included slides, slope debris flow and channel deposits, which were mainly used to analyze the changes in the sources of loose materials for the formation of debris flows. Loose material provided by landslides is one of the important controlling factors for the development of debris flows. The construction of the landslide database in this study is mainly based on existing landslide databases to supplement the long-term distribution of landslides. The database is mainly based on the landslide distribution data of 2007, 2008, 2011, 2013, 2015, 2017, and 2018 interpreted by Fan et al. [34] using high-resolution aerial and satellite images. For the continuity of the landslide dataset, Landsat images were used to supplement the missing landslide distribution in Fan’s dataset [34] from 2007 to 2020.
The normalized difference vegetation index (NDVI) is one of the most popular methods for indicating the patio-temporal evolution of post-seismic landslides [35,36,37,38,39]. In this study, the values of NDVI for 14 Landsat images were calculated first. Then, the image differencing method was adopted to extract the general boundary of landslides in different periods [36,37]. In addition, the extracted landslides were verified with the ancillary data, such as the field surveys, aerial photos, and previous database of post-earthquake land-slides [33,34]. NDVI can be obtained using the following formula.
NIR is the reflectance radiated in the near-infrared wave band, and RED is the reflectance radiated in the visible red waveband of the satellite radiometer. To eliminate the influence of clouds, atmosphere, and mountain shadows, preprocessing procedures for Landsat series images, such as radiometric calibration, atmospheric correction, and so on, were performed by ENVI.
2.3.2. Inventory of Post-Earthquake Debris Flow in Mozi Gully
Since the balance of loose materials in Mozi Gully was disrupted after the 2008 Wenchuan earthquake, this watershed has suffered from the strong transportation process of loose material for a long time. Some debris flow events were collected from the previous study [23,24,34]. Due to the lack of information on the detailed description of the disaster events in Mozi Gully, satellite remote sensing images taken by Sentinel 2 and GF 1 were used to identify the post-earthquake debris flows and their effects on the channel from 2008 to 2019 in this study. The identification is based on obtaining the change in width along the channel and the deformation of the accumulation fan.
The extraction of channel width is mainly performed automatically based on the bank boundaries of different periods. First, determine the boundaries of the banks and streamlines by visual interpretation of the remote sensing data (Figures S1 and S2). Then, the method of extracting the cross-section along the streamline mainly refers to extracting the vertical line in the line segment. The interception of streamlined segments is mainly based on the needs of the research and is cut continuously from upstream to downstream at fixed intervals, which are set as 10 m in this study. Furthermore, the vertical line length was set as the maximum channel width in Mozi Gully, including the accumulation fan, which was set as 300 m in this study. Finally, the length of the vertical line of the streamline was limited by the bank boundary (Figures S1 and S3) and was clipped by the boundary. All the above operations on the extraction of channel width were mainly implemented in batches through two Python toolkits, ArcPy, and OSGeo. In addition, the shape changes in the accumulation fan were also mainly extracted through visual interpretation. At the same time, the river width extraction algorithm was used to obtain the change in the width and length of the accumulation fan.
2.3.3. High-Precision UAV Images Acquiring and Processing
Orthophoto images and topographic images by unmanned aerial vehicle (UAV) were conducted across the study region on 7 June 2019, 24 August 2019, 9 May 2020, and 6 September 2020, for a detailed analysis of the channel and accumulation fan changes. A UAV (DJI quadcopter) was used to obtain multiple aerial photographs of the study reach at 5 s intervals to ensure sufficient spatial coverage and a minimum 80% image overlap [40,41,42,43]. Flights were at a low uniform height (~300 m above the surface) to generate high-resolution (about 0.1 m) imagery. Overlapping images were mosaicked together using Agisoft Metashape Version 1.5.2 with Structure from Motion (SfM) photogrammetry, where rasterized three-dimensional representations are constructed from two-dimensional images [44,45].
3. Results
3.1. Long-Term Evolution and Positional Characteristics of Loose Materials after the Earthquake
The spatial distribution of loose materials at various post-earthquake periods (Figure 3) reveals that the earthquake generated a significant amount of these materials, which remained in a relatively high state for an extended period, constituting over 39.2%. To examine the distribution characteristics of these materials across different periods, we obtained data on the elevation (E), slope (S), and distance from the channel (DC) of the landslides. Our findings indicate a clear consistency in the functional relationship between location characteristics and the cumulative percentage of loose material (CPLM) at different intervals following the earthquake (Figure 4).
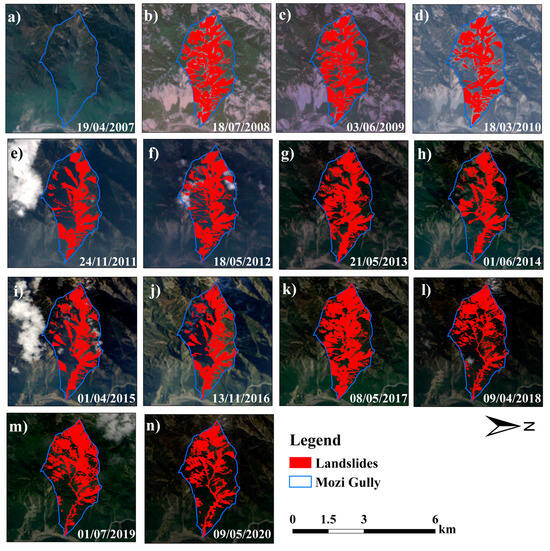
Figure 3.
Distribution of the landslide of different post-earthquake periods in Mozi Gully. (a–n) shows the distribution of landslides from 2007 to 2020 in Mozi Gully.
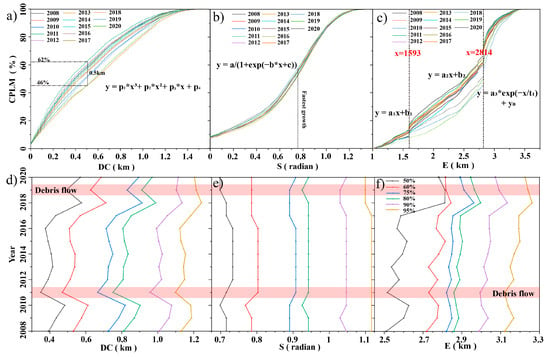
Figure 4.
Distribution and development of the loose materials located in hillslopes of different post-earthquake periods in Mozi Gully. There is the relationship between the CPLM and the distribution of loose materials, including the distance from channel (DC, (a)), slope (S, (b)), and elevation (E, (c)). Some typical cumulative ratios were selected to analyze the annual changes in landslide locations, which are shown in (d–f).
The relationship between DC and CPLM for the distance from the channel was characterized by a convex shape, which can be represented as a third-order polynomial function (Figure 4a, Table S1). The growth rate of this relationship remained relatively stable with increasing DC. The maximum slope of CPLM in relation to DC variation across different years was observed at a DC value of zero. This maximum slope exhibited a fluctuating pattern, ranging from 0.5916 to 1.4270 (Table S1). Notably, the maximum slope was recorded in 2011, coinciding with a significant debris flow event. This suggests that the debris flow from 2011 transported a substantial loose material into the channel, leading to the highest recorded value of CPLM in relation to DC for that year. Additionally, the proportion of loose material located within a distance of less than 0.5 km from the channel increased from 46% to 62%, representing the most significant change across different DC values (Figure 4a). The maximum value was observed in 2011, while the minimum was noted in 2008. This pattern indicates that during the initial phases of the earthquake, landslides were predominantly located further away from the channel. However, as the event progressed, debris flows prompted these landslides to descend closer to the channel.
The relationship between the S and CPLM primarily adheres to a logistic function, exhibiting a distinct S-shape (Figure 4b, Table S1). This indicated that the growth rate of CPLM is the most rapid at the gentle and middle slope position, with a radian approximately equal to 0.76. Conversely, the growth rate is comparatively slower on steeper slopes. The variations in this relationship across different years are not significant, with the maximum growth rate predominantly around 4.02.
The functional relationship between the elevation (E) and CPLM exhibited a distinct pattern from the other two features. These relationships can be characterized by two breakpoints, forming a three-segment functional relationship (Figure 4c, Table S1). A linear function can fit the segments 0–1593 m and 1594–2814 m, but the slope of these two functions varies significantly. The slope from 1594 m to 2814 m is larger than that from 0 m to 1593 m, indicating a more rapid increase in landslide area within this elevation range. In addition, when the elevation exceeds 2815 m, the growth of CPLM primarily follows a logarithmic function. After reaching its maximum height, the growth rate of CPLM gradually decreases. In the elevation ranges of 0 m to 1513 m and above 2815 m, the maximum slope of CPLM with elevation in different years occurred in 2011 (Table S1). This indicates that the distribution of loose materials was relatively high in this interval in 2011, aligning with the results of the relationship between CPLM and DC. The variation in CPLM across different years is more significant in the range of 1514 m to 2813 m, indicating that the distribution of loose materials at this height is complex and subject to migration in different years.
The positional characteristic values associated with several key proportions of the CPLM were analyzed to examine annual changes in landslide positions. These proportions primarily included 50%, 60%, 75%, 80%, 90%, and 95% (Figure 4d–f). The DC and E corresponding to these selected key proportions exhibited significant variations across different years, while S remained relatively stable. Notably, the distribution of landslides underwent substantial alterations due to two large-scale debris flows in 2011 and 2019, with a closer proximity to the channel and the lower elevation. Specifically, in 2011, 95% of the loose material was located within a 1 km radius from the channel and at an elevation below 3120 m.
3.2. Channel Evolution Affected by Post-Earthquake Debris Flow Events Based on Medium-Resolution Images
The Mozi Gully precipitated numerous debris flow events that significantly altered the post-earthquake channel. Prior to the Wenchuan earthquake, the channel of Mozi Gully basin was characterized by its narrow and steep nature, with a width of less than 30 m (Figure S4). However, the prolonged post-earthquake debris flows induced drastic evolution in the channel, resulting in a widened channel and variable flow path. The changes in channel width were obtained from different periods using available Sentinel 2 and GF 1 data (Figure 5a). The analysis of the channel width changes across different post-earthquake periods revealed that the Mozi Gully’s channel remained consistent, and the accumulation fan was not prominent before the Wenchuan earthquake (Figures S2 and S4). However, following heavy rainfall after the earthquake, numerous debris flow events gradually transported loose materials from the upstream hillslope upstream to the downstream. This resulted in a widening of the channel and a significant growth of the accumulation fan. The changes in the width of the channel and the maximum width of the accumulation fan have clearly preserved some traces of debris flow.
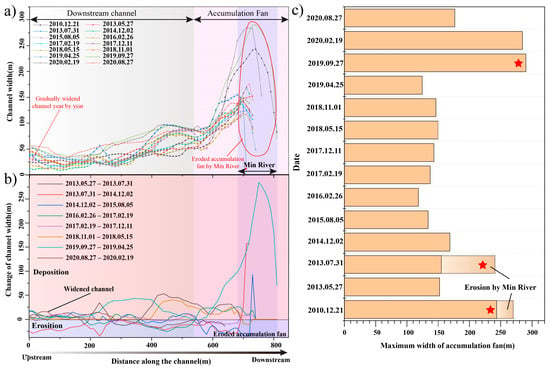
Figure 5.
Change in the channel width downstream of Mozi Gully. (a) Changes in channel width in different periods; (b) change in channel width in different periods; (c) maximum width of accumulation fan in different periods.
Utilizing 14 medium–high resolution satellite remote sensing images, we determined the width of the channel and accumulation fan at the corresponding times. These data allowed us to identify the time periods for the development of eight debris flows, as evidenced by the widening of the channel (Figure 5b). For instance, the widening of channel by the debris flow event on 20 August 2019 resulted in a maximum channel widening of approximately 50 m, a significant increase from four months prior. Furthermore, three large-scale debris flows were identified through notable widening and extension of the accumulation fan, specifically from 31 July 2013 to 2 December 2014, 2 December 2014 to 5 August 2015, and 25 April 2019 to 27 September 2019 (Figure 5b). Notably, the debris flow on 20 August 2019 expanded the width of the accumulation fan by approximately 250 m and pushed it approximately 60 m towards the opposite bank of the river, leading to the complete blockage of the Min River.
Moreover, the Min River’s pronounced scouring effect on the accumulation fan renders it challenging to ascertain the scale of debris flows through these fans for five recorded events. This difficulty extended to identifying small-scale debris flows. Notably, an examination of the maximum width of the accumulation fan reveals that a significant debris flow occurred in 2013 (Figure 5c). Nonetheless, due to the Min River’s erosion, this particular debris flow event remains undetectable based on alterations in the accumulation fan’s width.
3.3. Identifying Debris Flow Events of Different Scales Based on High-Precision Images
Small-scale debris flow might not bring significant changes in channel width and the growth of accumulation fans, high-precision images taken by UAV with elevation could quantitatively analyze the impact of debris flows on channel erosion and accumulation from the aspect of cross-section and longitudinal profile. This study focused on debris flow events that occurred on 20 August 2019 and 2020, with UAV images captured on 7 June 2019, 24 August 2019, 9 May 2020, and 6 September 2020. These two debris flow events were at different scales. The debris flow that occurred on 20 August 2019, was large in scale, with its impacts primarily manifested in the expansion of the channel, migration of the flow path, growth of the accumulation fan, and complete river blockage (Figure 6). In contrast, the debris flow during the flood season of 2020 was relatively small in scale, with its impact mainly reflected in the expansion of the channel and incomplete river blockage event. Under the influence of the debris flow accumulation fan in 2020, the flow velocity of the Min River decreased, and a noticeable river center beach was formed (Figure 7).
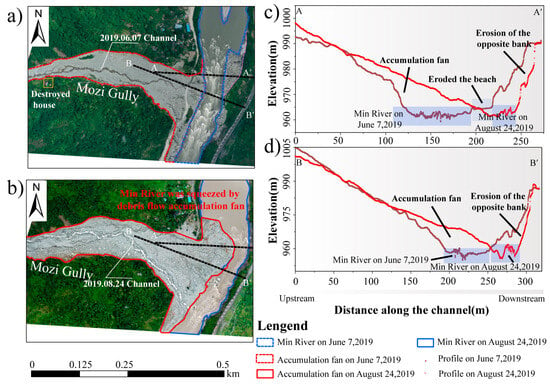
Figure 6.
Characteristics of the channel before and after debris flow occurred on 20 August 2019. (a) This image was taken on 7 June 2019, by UAV; (b) this image was taken on 24 August 2019; (c) and (d) were the profile of A-A’ and B-B’ in a, respectively.
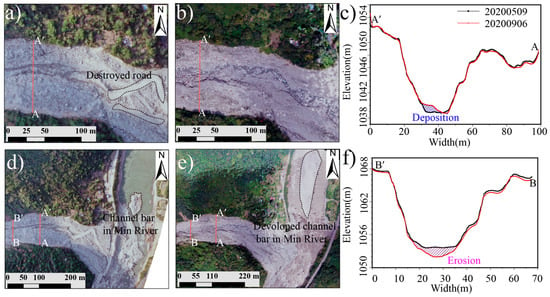
Figure 7.
Characteristics of the channel before and after debris flow occurred on 2020. The images used in (a,d) were taken by UAV on 9 May 2020 and the images used in (b,e) were taken on 6 September 2020. (c,f) are the profile of A-A’ and B-B’, respectively.
Since the debris flow incident on 20 August 2019, significant alterations were observed in the downstream channel of Mozi Gully. Firstly, there has been a notable shift in the flow path on the accumulation fan and the angle at which it enters the Min River (Figure 6a,b). Prior to the debris flow event, the upper channel of the accumulation fan exhibited characteristics of a braided channel. However, the channel predominantly followed a mainstream line without any discernible migration patterns and vertically entered the Min River. Analysis of UAV images taken on 24 August 2019 reveals multiple distinct flow paths on the accumulation fan. One such path emerged as the primary flood discharge channel following the debris flow. The diverted river then enters the Min River at a specific angle at the origin of the accumulation fan. Secondly, there has been a marked widening of the channel, leading to substantial damage to both vegetation and rudimentary structures flanking it (Figure 6a,b). Thirdly, longitudinal section analysis indicates that this debris flow extended the accumulation fan by 50 m to 100 m towards the Min River, with its maximum thickness reaching approximately 15 m (Figure 6c,d). This expansion of the accumulation fan notably constricted the main channel of the Min River, resulting in beach erosion along its course (Figure 6c, A-A′). Additionally, it is evident that the growth in the accumulation fan has altered the curvature of the Min River at its mouth in Mozi Gully. Consequently, the riverbank adjacent to the gully’s opening has transitioned into a concave bank of the Min River. This transformation exacerbates bank erosion due to hydrodynamic effects (Figure 6c, B-B′).
The debris flow in 2020 was relatively minor, making its impact on channel width difficult to discern (Figure 7a,b). However, there was a significant alteration in the shape of the accumulation fan (Figure 7d,e). Upon extracting cross-sections, it was observed that erosion and deposition had occurred at varying locations along the channel (Figure 7c,f). Overall, the debris flow’s impact in 2020 was primarily characterized by erosion. Concurrently, refined UAV images revealed a pronounced river center beach in the location towards the upstream of the Min River from the gully mouth of Mozi Gully. This suggests that an accumulation fan had formed in this area due to the debris flow’s influence. This accumulation fan subsequently slowed the flow velocity of the Min River, ultimately leading to the formation of the river center beach. This finding could provide a novel approach for identifying future debris flow events.
3.4. Catalogues of Debris Flow Events in Mozi Gully Associated with Min River
Post-earthquake debris flow events in Mozi Gully were systematically categorized based on field surveys, the existing literature, and the analysis of width changes across various periods. Given the data’s comprehensiveness and the distinct characteristics of these debris flow, over ten events post-Wenchuan were classified into three categories (Table 2). The first category comprises large-scale debris flow that significantly obstructed the Min River. Due to their considerable impact and ease of data collection, several studies have extensively examined these events, including those on 14 July 2008 [31], 14 August 2010 [46], 10 July 2013 [47], and 20 August 2019 [48]. The second category consists of medium-scale debris flows that compressed the Min River channel but did not block it entirely. These accumulation fans are challenging to preserve due to the river’s scouring action, resulting in an incomplete accumulation fan and a widened channel as discernible through remote sensing interpretation. The third category encompasses small-scale debris flows obtained from the villagers. It is worth mentioning that there were no recorded watershed debris flow events in Mozi Gully from 2021 to 2023 (Table S2, Figure S4).

Table 2.
History of the debris flow in the Mozi Gully.
Moreover, the explicit expansion of the accumulation fan is challenging to discern through remote sensing interpretation. However, a notable alteration in the channel width can be observed. This indicated that the magnitude of the debris flow process was not substantial enough to transport the material from the upstream slope to the gully mouth but only as far as the downstream channel. Furthermore, this particular debris flow impedes the formation of a distinct accumulation fan. In addition, due to the constraints on the data acquisition, such as literacy and remote sensing image collection, some debris flow events are only documented through villagers’ narratives without comprehensive analysis. This could potentially hinder a thorough understanding of the long-term debris flow development in Mozi Gully.
4. Discussion
4.1. Recognition Frameworks of Debris Flows Based on Multi-Source Remote Sensing Data
This study utilizes multi-source remote sensing images to examine the evolution of debris flows in a watershed from the following four perspectives: slope, channel, accumulation fan, and the relationship between the watershed and the main river (Figure 8). The distribution changes in the distribution of loose materials on the slope were obtained through medium resolution Landsat satellite images, and a qualitative analysis was conducted to understand the relationship between loose materials on the slope and debris flow development over different years. The findings suggest that the progression of debris flow events is associated with the migration of loose materials to the river channel (Figure 4). The distribution of loose materials on the hillslope is concentrated near the channel and at low elevations, where the rate of change is the highest. The changes in channel and accumulation fan width were primarily derived from medium resolution Sentinel and GF satellite images. The width change in the channel is the key to reconstructing debris flow events. After the occurrence of debris flows of varying scales, they all significantly widen the channel. Based on this, at least eight debris flow events have been identified using the available remote sensing images (Figure 5b). The width variation in the accumulation fan can reflect the scale of the debris flow, among which three large-scale debris flows that caused the blockage event of Min River were identified. However, due to the erosion, at least one blockage event by debris flow in 2013 could not be identified through the accumulation fan. In addition, more detailed UAV images including the change in elevation were used to identify the impact of debris flow events on the main river channel by the blockage events with different scale (Figure 6 and Figure 7).
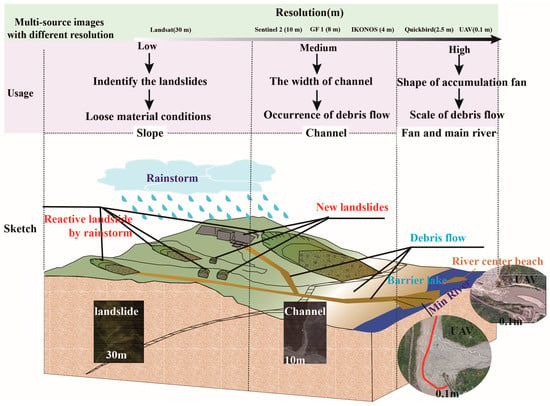
Figure 8.
Sketch for reconstruction of debris flow events using multi-source remote sensing data.
4.2. Evolution Patterns in Post-Earthquake Debris Flows and Channel Characteristics
The evolution of post-earthquake debris flow in Mozi Gully can be characterized by its sustained high activity over an extended period. This contrasts with the Longxi River, which boasts the shortest straight distance of merely 10 km. Following the Wenchuan earthquake, the Longxi River transitioned from debris flows to flash floods and is now predominantly controlled by flash floods [49,50,51,52]. An analysis of the channel width reveals that the development of post-earthquake debris flow in Mozi Gully can be divided into three stages. Prior to the Wenchuan earthquake, the distribution of loose materials in Mozi Gully was extremely scattered, and the channel was very narrow and steep, devoid of any debris flow traces (Figure 9a and Figure S4). The development of debris flow in Mozi Gully mainly followed a transition from low-frequency and small-scale occurrences before the earthquake to high-frequency and large-scale events afterward. Then, as loose materials were progressively transported to the gully outlet by frequent debris flows, the development of debris flows shifted to high-frequency and low-scale. However, heavy rainstorms could activate old landslides or generate new ones within the watershed, bringing new material sources and leading to the occurrence of large-scale debris flows, such as the debris flow that occurred on 20 August 2019 (Table 2). Consequently, based on the analysis of spatial distribution of loose materials, channel alterations, accumulation fan expansion and river blockage, the development of post-earthquake debris flows in Mozi Gully can be categorized into three stages (Figure 9b–d).
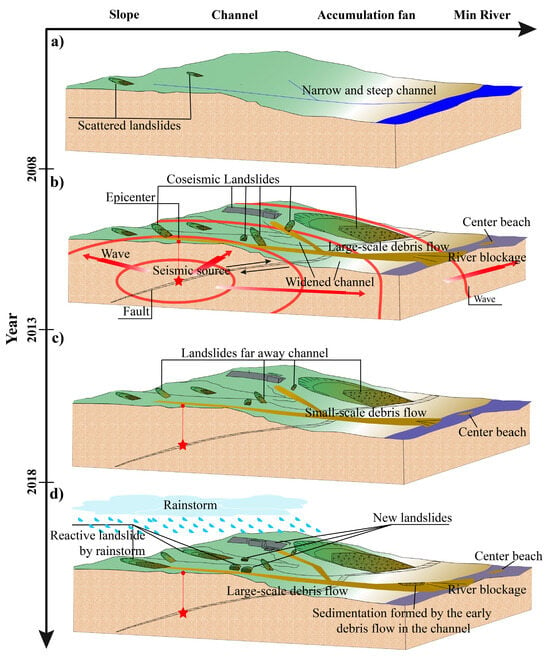
Figure 9.
Evolution patterns of post-earthquake debris flow in Mozi Gully. (a) Schematic diagram of the Mozi Gully before the Wenchuan earthquake. (b) Development of debris flows and distribution of loose materials after earthquakes in Mozi Gully from 2008 to 2013. (c) Development of debris flows and distribution of loose materials after earthquakes in Mozi Gully from 2014 to 2018. (d) Development of debris flows and distribution of loose materials after earthquakes in Mozi Gully after 2019.
During the first stage (2008–2013), a significant amount of loose material, primarily resulting from earthquakes, was predominantly located on hillslopes [53] (Figure 9b). This led to the frequent development of debris flows within the watershed as an attempt to establish a new material balance. Additionally, there was a noted decrease in the triggering rainfall for these debris flows. The influx of this large volume of loose material into the formation process of the debris flow resulted in a generally larger scale of these events [15,16]. During this period, debris flow would transport lots of co-seismic landslides into the channel and change the transverse and longitudinal profiles of the channel under strong rainfall. At this time, there was a decrease in the downstream channel gradient and an increase in width. Simultaneously, the strength of the debris flow was considerable, leading to multiple instances of river blockage. The most notable changes were observed in the uplift and widening of the channel.
During the second stage (2014–2018), a significant volume of coseismic loose material was either introduced to the gully or had already been transported to the Min River (Figure 9c). At that time, the amount of loose material diminished, and its distribution progressively shifted away from the channel. Meanwhile, the coarsening of particles and the recovery of vegetation is obvious, leading to the increasing triggered rainfall of the debris flow (Figure 10a) [19,54]. This phenomenon led to a reduction in the scale of debris flow development during this stage, making many small-scale debris flow events difficult to identify and record using remote sensing imagery.
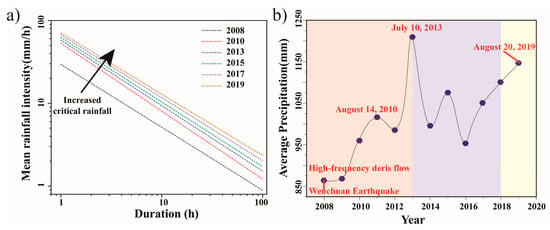
Figure 10.
Changes in critical rainfall for triggering debris flows and regional annual precipitation: (a) shows the increased critical rainfall for triggering debris flows in Er Gully, which is only separated by a mountain with Mozi Gully. The data used in (a) were obtained from Guo, et al. [19]; (b) shows the change in annual precipitation in affected area of Wenchuan earthquake. The precipitation was obtained from Intensification Innovation Lab (https://www.worldclim.org/data/worldclim21.html, accessed on 24 August 2024) [55].
During the third stage, the material sources become more diverse (Figure 9d). Drawing from the existing research [4,36] and the aforementioned analysis of landslide locations, it could be found that the sedimentation formed by the early debris flow in the channel [43], the expansion and excitation of the landslide by heavy rainfall were the main material sources of debris flow a decade after the earthquake. And rainstorm-induced landslides are more frequent in the valley or near streams [53]. This leads to the development scale of debris flows during this period being mainly controlled by rainfall intensity [56], and the absolute control effect of earthquakes on debris flow development was reduced. This is consistent with the conclusion by Yang et al. [9] regarding the entire affected area of Wenchuan earthquake. Due to the abundant supply of loose materials, the evolution of the Mozi Gully still requires a relatively long time for material transportation with the alternating oscillation decay influenced by rainfall cycles. For example, the debris flow that occurred on 20 August 2019 was during the relatively active period of the rainfall cycle (Figure 10b). Furthermore, due to the preservation of the accumulation fan caused by the early debris flow, and the expansion of the accumulation fan in the later stage, it provides space for the migration of the river channel, leading to the development of braided river channels in the accumulation fan (Figure 6 and Figure 7).
4.3. Limitations and Perspectives in Identification of Debris Flows Events Using Remote Sensing Technology
The prevailing method for identifying post-earthquake debris flows primarily hinges on the detection of accumulation fans and channel widening. A comparative analysis with the existing literature [5,34,54] and field investigations reveals a strong correlation between the identified debris flows and those documented in scholarly works, suggesting a viable approach for debris flow identification. Furthermore, the influence of debris flow accumulation fans on the Min River offers valuable insights for this purpose. The compression and potential blockage caused by these fans significantly alter the river’s upstream dynamics. For instance, if an accumulation fan temporarily compresses the Min River, it leads to a reduction in flow velocity, culminating in the formation of a channel bar upstream of the intersection (Figure 6b and Figure 7e). In cases where an accumulation fan obstructs the river channel resulting in a barrier lake, a distinct lake surface emerges upstream during the initial phase. Nevertheless, this recognition technique is optimal for debris flows characterized by channel expansion, pronounced accumulation fan formation, or the creation of lakes in the upper reaches of the Min River. Nonetheless, this method struggles to detect minute debris flows and lacks the capability to establish a comprehensive sequence of debris flow development stages, marking a notable limitation of this study.
Obtaining accurate remote sensing images before and after debris flows is challenging due to the impact of the satellite revisit and clouds cover on the quality of remote sensing images. This issue has hindered the identification and estimation of the scale of post-earthquake debris flows. However, with advances in satellite remote sensing sensor cloud penetration levels, reductions in revisit periods, and usage of SAR data for detecting the deformation [57], the identification method of debris flow proposed in this study, based on multi-source data, will be more effective for constructing debris flow event libraries. Concurrently, it will enable a more comprehensive and quantitative analysis of changes in debris flow scale and frequency across different periods.
5. Conclusions
The research employs three different resolutions and availability levels of remote sensing images, namely Landsat, Sentinel, and UAV, to establish an identification framework and method for reconstructing post-earthquake debris flow events and analyzing their impacts on channels and accumulation fans. The Mozi Gully, situated in the XI intensity zone of the Wenchuan earthquake, was selected as an example to reconstruct a database of post-earthquake debris flow events and examine their long-term evolution patterns and their impacts. The long-term evolution of debris flow in Mozi Gully was analyzed from the perspectives of slope, channel, accumulation fan, and their relationship with the main stream of the Min River. Concurrently, the database of debris flow events in Mozi Gully from 2008 to 2020 was reconstructed, and the impact of long-term debris flow on channel width and accumulation fan was assessed.
The long-term spatial distribution characteristics of loose material at hillslope and channel scales following an earthquake were examined using Landsat data. The most rapid change in cumulative distribution of loose materials was observed at the channel intersection, with the peak annual value occurring in 2011. This period also saw the strongest debris flow effects, suggesting a significant coupling between debris flow and loose material distribution. And at the aspect of elevation, the annual variability in the cumulative ratio of loose material between 1514 m and 2813 m is notable, indicating that the migration of loose materials within this range varies significantly across different years.
More than eight events for debris flow were identified in the Mozi Gully, including three large-scale debris flow events that caused blockages in the Min River. This bridges the data gap for existing research and field investigations. Meanwhile, high-precision UAV images revealed the differences in erosion and accumulation of channels caused by debris flows of different scales.
The post-earthquake evolution of debris flows in the Mozi Gully could be categorized into the following three distinct stages: the first stage of high-frequency large-scale debris flows (2008–2013), the second stage of high-frequency small-scale debris flows (2014–2018), and the third stage of low-frequency small-scale debris flows (2019~).
Multi-source remote sensing imagery offers a robust technical approach to understanding the evolution of post-earthquake debris flows. However, the extended revisit intervals and the pronounced impact of clouds on sensors constrain the creation of a comprehensive database for these events. As remote sensing technology advances, our comprehension of the identification and progression of post-earthquake debris flows will deepen. Such advancements will be instrumental in mitigating the adverse effects of these flows on the ecological and residential environments within watersheds.
Supplementary Materials
The following supporting information can be downloaded at: https://www.mdpi.com/article/10.3390/rs16173336/s1, Figure S1: extraction of channel width; Figure S2: boundaries of channel bank in Mozi Gully from 2008 to 2020; Figure S3: cross sections along the channel in Mozi Gully from 2008 to 2020; Figure S4: distribution of channels without significant changes in Mozi Gully from 2021 to 2024; Table S1: fitting parameters of different characteristics in different year; Table S2: sentinel images analyzed in this paper from 2021 to 2024.
Author Contributions
Conceptualization, W.J. and G.Z.; methodology, W.J.; software, W.J.; validation, W.J., Y.D., N.L. and X.H.; formal analysis, W.J. and G.Z.; investigation, W.J. and G.Z.; resources, W.J., G.Z., Y.D. and N.L.; writing—original draft preparation, W.J.; writing—review and editing, W.J., G.Z., Y.D. and N.L.; funding acquisition, W.J. and G.Z. All authors have read and agreed to the published version of the manuscript.
Funding
This research was funded by the National Natural Science Foundation of China, grant number 42201088 and U21A2008, the National Key R&D Program of China, grant number 2022YFC3002902, and the National Natural Science Foundation of China, grant number 42201086.
Data Availability Statement
Data are contained within the article and Supplementary Materials.
Acknowledgments
We thank the U.S. GEOLOGICAL Service (USGS) for providing the Landsat data and the European Space Agency (ESA) for providing the Sentinel 2 data. In addition, we thank Fenghuan Su and Chunhao Wu from IMHE who provided the commercial images and the distribution of faults in China.
Conflicts of Interest
Author Xiaowei Huo was employed by the company Xi’an Zhongdi Environmental Science and Technology Co., Ltd. The remaining authors declare that the research was conducted in the absence of any commercial or financial relationships that could be construed as a potential conflict of interest.
References
- Fan, X.; Scaringi, G.; Korup, O.; West, A.J.; Westen, C.J.; Tanyas, H.; Hovius, N.; Hales, T.C.; Jibson, R.W.; Allstadt, K.E.; et al. Earthquake-Induced Chains of Geologic Hazards: Patterns, Mechanisms, and Impacts. Rev. Geophys. 2019, 57, 421–503. [Google Scholar] [CrossRef]
- Koi, T.; Hotta, N.; Ishigaki, I.; Matuzaki, N.; Uchiyama, Y.; Suzuki, M. Prolonged impact of earthquake-induced landslides on sediment yield in a mountain watershed: The Tanzawa region, Japan. Geomorphology 2008, 101, 692–702. [Google Scholar] [CrossRef]
- Dong, J.-J.; Lee, C.-T.; Tung, Y.-H.; Liu, C.-N.; Lin, K.-P.; Lee, J.-F. The role of the sediment budget in understanding debris flow susceptibility. Earth Surf. Process. Landf. 2009, 34, 1612–1624. [Google Scholar] [CrossRef]
- Francis, O.; Fan, X.; Hales, T.; Hobley, D.; Xu, Q.; Huang, R. The Fate of Sediment After a Large Earthquake. J. Geo-Phys. Res. Earth Surf. 2022, 127, e2021JF006352. [Google Scholar] [CrossRef]
- Jin, W.; Cui, P.; Zhang, G.; Wang, J.; Zhang, Y.; Zhang, P. Evaluating the post-earthquake landslides sediment supply capacity for debris flows. Catena 2023, 220, 106649. [Google Scholar] [CrossRef]
- Dadson, S.J.; Hovius, N.; Chen, H.; Dade, W.B.; Lin, J.-C.; Hsu, M.-L.; Lin, C.-W.; Horng, M.-J.; Chen, T.-C.; Milliman, J.; et al. Earthquake-triggered increase in sediment delivery from an active mountain belt. Geology 2004, 32, 733. [Google Scholar] [CrossRef]
- Dai, L.; Scaringi, G.; Fan, X.; Yunus, A.P.; Liu-Zeng, J.; Xu, Q.; Huang, R. Coseismic Debris Remains in the Orogen Despite a Decade of Enhanced Landsliding. Geophys. Res. Lett. 2021, 48, e2021GL095850. [Google Scholar] [CrossRef]
- Zhang, F.; Jin, Z.; West, A.J.; An, Z.; Hilton, R.G.; Wang, J.; Li, G.; Densmore, A.L.; Yu, J.; Qiang, X.; et al. Monsoonal control on a delayed response of sedimentation to the 2008 Wenchuan earthquake. Sci. Adv. 2019, 5, eaav7110. [Google Scholar] [CrossRef] [PubMed]
- Wang, W.; Godard, V.; Liu-Zeng, J.; Scherler, D.; Xu, C.; Zhang, J.; Xie, K.; Bellier, O.; Ansberque, C.; de Sigoyer, J. Pertur-bation of fluvial sediment fluxes following the 2008 Wenchuan earthquake. Earth Surf. Process. Landf. 2017, 42, 2611–2622. [Google Scholar] [CrossRef]
- Chen, X.; Cui, P.; You, Y.; Chen, J.; Li, D. Engineering measures for debris flow hazard mitigation in the Wenchuan earthquake area. Eng. Geol. 2015, 194, 73–85. [Google Scholar] [CrossRef]
- Cui, P.; Lin, Y.-m.; Chen, C. Destruction of vegetation due to geo-hazards and its environmental impacts in the Wenchuan earthquake areas. Ecol. Eng. 2012, 44, 61–69. [Google Scholar] [CrossRef]
- Horton, A.J.; Hales, T.C.; Ouyang, C.; Fan, X. Identifying post-earthquake debris flow hazard using Massflow. Eng. Geol. 2019, 258, 105134. [Google Scholar] [CrossRef]
- Hu, G.; Chen, N.; Tanoli, J.I.; You, Y.; Li, J. Case Study of the Characteristics and Dynamic Process of July 10, 2013, Cata-strophic Debris Flows in Wenchuan County, China. Earth Sci. Res. J. 2016, 20, 1. [Google Scholar] [CrossRef]
- Cui, P.; Guo, X.; Yan, Y.; Li, Y.; Ge, Y. Real-time observation of an active debris flow watershed in the Wenchuan Earthquake area. Geomorphology 2018, 321, 153–166. [Google Scholar] [CrossRef]
- Guo, X.; Cui, P.; Li, Y.; Fan, J.; Yan, Y.; Ge, Y. Temporal differentiation of rainfall thresholds for debris flows in Wenchuan earthquake-affected areas. Environ. Earth Sci. 2016, 75, 109. [Google Scholar] [CrossRef]
- Guo, X.; Cui, P.; Li, Y.; Ma, L.; Ge, Y.; Mahoney, W.B. Intensity–duration threshold of rainfall-triggered debris flows in the Wenchuan Earthquake affected area, China. Geomorphology 2016, 253, 208–216. [Google Scholar] [CrossRef]
- Guo, X.; Cui, P.; Li, Y.; Zou, Q.; Kong, Y. The formation and development of debris flows in large watersheds after the 2008 Wenchuan Earthquake. Landslides 2014, 13, 25–37. [Google Scholar] [CrossRef]
- Guo, X.; Cui, P.; Marchi, L.; Ge, Y. Characteristics of rainfall responsible for debris flows in Wenchuan Earthquake area. Environ. Earth Sci. 2017, 76, 596. [Google Scholar] [CrossRef]
- Guo, X.; Li, Y.; Chen, X.; Zhang, J.; Sun, Y. Variation of debris flow/flood formation conditions at the watershed scale in the Wenchuan Earthquake area. Landslides 2021, 18, 2427–2443. [Google Scholar] [CrossRef]
- Zhang, S.J.; Xu, C.X.; Wei, F.Q.; Hu, K.H.; Xu, H.; Zhao, L.Q.; Zhang, G.P. A physics-based model to derive rainfall in-tensity-duration threshold for debris flow. Geomorphology 2020, 351, 106930. [Google Scholar] [CrossRef]
- Zhang, S.; Zhang, L.M. Impact of the 2008 Wenchuan earthquake in China on subsequent long-term debris flow activities in the epicentral area. Geomorphology 2017, 276, 86–103. [Google Scholar] [CrossRef]
- Zhang, S.; Zhang, L.; Lacasse, S.; Nadim, F. Evolution of Mass Movements near Epicentre of Wenchuan Earthquake, the First Eight Years. Sci. Rep. 2016, 6, 36154. [Google Scholar] [CrossRef]
- Yang, F.; Fan, X.; Siva Subramanian, S.; Dou, X.; Xiong, J.; Xia, B.; Yu, Z.; Xu, Q. Catastrophic debris flows triggered by the 20 August 2019 rainfall, a decade since the Wenchuan earthquake, China. Landslides 2021, 18, 3197–3212. [Google Scholar] [CrossRef]
- Zhang, X.; Tang, C.; Li, N.; Xiong, J.; Chen, M.; Li, M.; Tang, C. Investigation of the 2019 Wenchuan County debris flow disaster suggests nonuniform spatial and temporal post-seismic debris flow evolution patterns. Landslides 2022, 19, 1935–1956. [Google Scholar] [CrossRef]
- Yan, Y.; Tang, H.; Hu, K.; Turowski, J.M.; Wei, F. Deriving Debris-Flow Dynamics From Real-Time Impact-Force Measurements. J. Geophys. Res. Earth Surf. 2023, 128, e2022JF006715. [Google Scholar] [CrossRef]
- Knighton, D.A. Fluvial Forms and Processes: A New Perspective; Routledge: London, UK, 1998. [Google Scholar]
- Lane, E.W. The importance of fluvial morphology in hydraulic engineering. Am. Soc. Civ. Eng. 1955, 81, 1–17. [Google Scholar] [CrossRef]
- An, C.; Cui, Y.; Fu, X.; Parker, G. Gravel-bed River evolution in earthquake-prone regions subject to cycled hydrographs and repeated sediment pulses. Earth Surf. Process. Landf. 2017, 42, 2426–2438. [Google Scholar] [CrossRef]
- An, C.; Parker, G.; Hassan, M.A.; Fu, X. Can magic sand cause massive degradation of a gravel-bed river at the decadal scale? Shi-ting River, China. Geomorphology 2019, 327, 147–158. [Google Scholar] [CrossRef]
- de Haas, T.; Braat, L.; Leuven, J.R.F.W.; Lokhorst, I.R.; Kleinhans, M.G. Effects of debris flow composition on runout, depositional mechanisms, and deposit morphology in laboratory experiments. J. Geophys. Res. Earth Surf. 2015, 120, 1949–1972. [Google Scholar] [CrossRef]
- Liu, J.; Sun, Z.; Cheng, Z.L. Assessment of influence area and emergency plan for debris-flow dammed lake-A case study in Mozi Gully of Wenchuan, Sichuan. South-North Water Transf. Water Sci. Technol. 2015, 13, 935–940+952. (In Chinese) [Google Scholar]
- Su, P.C.; Wei, F.Q.; Cheng, Z.L. Debris Flow Activity of Mozi Gully after Wenchuan Earthquake on May 12. J. Yangtze River Sci. Res. Inst. 2012, 29, 16–23. (In Chinese) [Google Scholar]
- Fan, X.; Domènech, G.; Scaringi, G.; Huang, R.; Xu, Q.; Hales, T.C.; Dai, L.; Yang, Q.; Francis, O. Spatio-temporal evolution of mass wasting after the 2008 Mw 7.9 Wenchuan earthquake revealed by a detailed multi-temporal inventory. Landslides 2018, 15, 2325–2341. [Google Scholar] [CrossRef]
- Fan, X.; Scaringi, G.; Domènech, G.; Yang, F.; Guo, X.; Dai, L.; He, C.; Xu, Q.; Huang, R. Two multi-temporal datasets that track the enhanced landsliding after the 2008 Wenchuan earthquake. Earth Syst. Sci. Data 2019, 11, 35–55. [Google Scholar] [CrossRef]
- Cheng, Y.; Vrieling, A.; Fava, F.; Meroni, M.; Marshall, M.; Gachoki, S. Phenology of short vegetation cycles in a Kenyan rangeland from PlanetScope and Sentinel-2. Remote Sens. Environ. 2020, 248, 112004. [Google Scholar] [CrossRef]
- Lin, W.-T.; Lin, C.-Y.; Chou, W.-C. Assessment of vegetation recovery and soil erosion at landslides caused by a catastrophic earthquake: A case study in Central Taiwan. Ecol. Eng. 2006, 28, 79–89. [Google Scholar] [CrossRef]
- Yang, W.; Wang, M.; Shi, P. Using MODIS NDVI Time Series to Identify Geographic Patterns of Landslides in Vegetated Regions. IEEE Geosci. Remote Sens. Lett. 2013, 10, 707–710. [Google Scholar] [CrossRef]
- Yunus, A.P.; Fan, X.; Tang, X.; Jie, D.; Xu, Q.; Huang, R. Decadal vegetation succession from MODIS reveals the spa-tio-temporal evolution of post-seismic landsliding after the 2008 Wenchuan earthquake. Remote Sens. Environ. 2020, 236, 111476. [Google Scholar] [CrossRef]
- Chen, M.; Tang, C.; Wang, X.; Xiong, J.; Shi, Q.; Zhang, X.; Li, M.; Luo, Y.; Tie, Y.; Feng, Q. Temporal and spatial differentiation in the surface recovery of post-seismic landslides in Wenchuan earthquake-affected areas. Ecol. Inform. 2021, 64, 101356. [Google Scholar] [CrossRef]
- Entwistle, N.S.; Heritage, G.L. An evaluation DEM accuracy acquired using a small unmanned aerial vehicle across a riverine environment. Int. J. New Technol. Res. 2017, 3, 43–48. [Google Scholar]
- Entwistle, N.S.; Heritage, G.L. Small unmanned aerial model accuracy for photogrammetrical fluvial bathymetric survey. J. Appl. Remote Sens. 2019, 13, 1. [Google Scholar] [CrossRef]
- Tonkin, T.; Midgley, N. Ground-Control Networks for Image Based Surface Reconstruction: An Investigation of Optimum Survey Designs Using UAV Derived Imagery and Structure-from-Motion Photogrammetry. Remote Sens. 2016, 8, 786. [Google Scholar] [CrossRef]
- de Haas, T.; Nijland, W.; de Jong, S.M.; McArdell, B.W. How memory effects, check dams, and channel geometry control erosion and deposition by debris flows. Sci. Rep. 2020, 10, 14024. [Google Scholar] [CrossRef] [PubMed]
- James, M.R.; Robson, S. Straightforward reconstruction of 3D surfaces and topography with a camera: Accuracy and geo-science application. J. Geophys. Res. Earth Surf. 2012, 117, F03017. [Google Scholar] [CrossRef]
- Scaramuzza, D.; Martinelli, A.; Siegwart, R. In A Flexible Technique for Accurate Omnidirectional Camera Calibration and Structure from Motion. In Proceedings of the Fourth IEEE International Conference on Computer Vision Systems (ICVS’06), New York, NY, USA, 4–7 January 2006; p. 45. [Google Scholar]
- Tang, C.; Zhu, J.; Ding, J.; Cui, X.F.; Chen, L.; Zhang, J.S. Catastrophic debris flows triggered by a 14 August 2010 rainfall at the epicenter of the Wenchuan earthquake. Landslides 2011, 8, 485–497. [Google Scholar] [CrossRef]
- Han, M.; Hu, T.; Wang, Y.; Hong, M. Dynamics character and river-blocking analysis of narrow-steep channels debris flow in Wenchuan Earthquake region—Illustrated with case of Mozi gully along Duwen Freeway. J. Eng. Geol. 2016, 24, 559. (In Chinese) [Google Scholar]
- Jin, W.; Zhang, G.; Zou, Q.; Cui, P.; Wang, H. A new understanding of the activity behavior of post-earthquake debris flow-taking the 8.20 event in Wenchuan, Sichuan, China as an example. Mt. Res. 2019, 37, 787–796. (In Chinese) [Google Scholar]
- Jin, W.; Wang, H.; Zhang, G.; Liu, D.; Wang, J. Channel Evolution Triggered by Large Flash Flood at an Earthquake-Affected Catchment. Remote Sens. 2022, 14, 6060. [Google Scholar] [CrossRef]
- Zhang, G.; Cui, P.; Jin, W.; Zhang, Z.; Wang, H.; Bazai, N.A.; Li, Y.; Liu, D.; Pasuto, A. Changes in hydrological behaviours triggered by earthquake disturbance in a mountainous watershed. Sci. Total Environ. 2021, 760, 143349. [Google Scholar] [CrossRef]
- Zhang, G.; Cui, P.; Yin, Y.; Liu, D.; Jin, W.; Wang, H.; Yan, Y.; Ahmed, B.N.; Wang, J. Real-time monitoring and estimation of the discharge of flash floods in a steep mountain catchment. Hydrol. Process. 2019, 33, 3195–3212. [Google Scholar] [CrossRef]
- Zhang, G.; Cui, P.; Gualtieri, C.; Bazai, N.A.; Zhang, X.; Zhang, Z. Increased nonstationarity of stormflow threshold be-haviors in a forested watershed due to abrupt earthquake disturbance. Hydrol. Earth Syst. Sci. 2023, 27, 3005–3020. [Google Scholar] [CrossRef]
- Qiu, H.; Su, L.; Tang, B.; Yang, D.; Ullah, M.; Zhu, Y.; Kamp, U. The effect of location and geometric properties of landslides caused by rainstorms and earthquakes. Earth Surf. Process. Landf. 2024, 49, 2067–2079. [Google Scholar] [CrossRef]
- Domènech, G.; Fan, X.; Scaringi, G.; van Asch, T.W.J.; Xu, Q.; Huang, R.; Hales, T.C. Modelling the role of material depletion, grain coarsening and revegetation in debris flow occurrences after the 2008 Wenchuan earthquake. Eng. Geol. 2019, 250, 34–44. [Google Scholar] [CrossRef]
- Fick, S.E.; Hijmans, R.J. WorldClim 2: New 1-km spatial resolution climate surfaces for global land areas. Int. J. Climatol. 2017, 37, 4302–4315. [Google Scholar] [CrossRef]
- Yang, Y.; Tang, C.; Tang, C.; Chen, M.; Cai, Y.; Bu, X.; Liu, C. Spatial and temporal evolution of long-term debris flow activity and the dynamic influence of condition factors in the Wenchuan earthquake-affected area, Sichuan, China. Geomorphology 2023, 435, 108755. [Google Scholar] [CrossRef]
- Wei, Y.; Qiu, H.; Liu, Z.; Huangfu, W.; Zhu, Y.; Liu, Y.; Yang, D.; Kamp, U. Refined and dynamic susceptibility assessment of landslides using InSAR and machine learning models. Geosci. Front. 2024, 15, 101890. [Google Scholar] [CrossRef]
Disclaimer/Publisher’s Note: The statements, opinions and data contained in all publications are solely those of the individual author(s) and contributor(s) and not of MDPI and/or the editor(s). MDPI and/or the editor(s) disclaim responsibility for any injury to people or property resulting from any ideas, methods, instructions or products referred to in the content. |
© 2024 by the authors. Licensee MDPI, Basel, Switzerland. This article is an open access article distributed under the terms and conditions of the Creative Commons Attribution (CC BY) license (https://creativecommons.org/licenses/by/4.0/).