1. Introduction
Sustainable Development Goal 11 (SDG11) proposes ideas to make cities inclusive, safe, resilient, and sustainable [
1]. Transportation resilience is a pivotal component of urban sustainability. Addressing SDG11, coastal cities must accurately assess the resilience of urban road traffic under natural disasters, which is an important basis for building a disaster-resistant transportation system, thus supporting the practical needs of refined urban management.
Global climate change increases the frequency and intensity of extreme weather events. In China, heavy rainfall stands out as one of the most severe disasters. Especially in coastal areas, the influence of the southeast monsoon leads to frequent summer rainfall and the frequent occurrence of typhoon disasters accompanied by violent storms [
2,
3]. As transportation infrastructure continues to expand rapidly, China faces increasing risks posed by these extreme weather events. While extensive studies have been conducted on the disaster risk of physical and economic losses, questions related to how urban road traffic responds to extreme weather remain insufficiently addressed [
4]. The precipitation and wind generate traffic risks, such as poor road conditions and lower traffic capacity. On the one hand, light rainfall (generally below the rainstorm level) makes the road surface wet and slippery, with reduced friction coefficients, increasing the vehicle’s safe braking distance. Drivers will choose to slow down to avoid accidents. Heavy rainfall reduces drivers’ visibility, slowing down traffic and raising accident risks. Extreme wind crosswinds pose a severe threat to vehicles. On the other hand, precipitation and wind extremes could knock down street trees or result in flooded streets, leading to road damage or congestion. The navigation software may recommend alternative routes, resulting in heavier traffic congestion and lower efficiency on undamaged roads during rush hours and functional damage to the local or entire road traffic network. The influence of disaster-related factors on road traffic is complex and under-explored, and data-driven assessment has become a new trend.
The resilience assessment of a transportation system typically begins with the definition of resilience, followed by the customization and calculation of resilience metrics. The concept of resilience originated in the field of materials science, which refers to the ability of a material to recover after deformation. Later, it was extended to other areas. In 2006, Murray–Tuite first defined resilience in the context of transportation systems from ten dimensions, including redundancy, diversity, efficiency, autonomous components, strength, collaboration, adaptability, mobility, safety, and the ability to recover quickly [
5]. In view of their intricate interrelations, it is hard to comprehensively measure these dimensions in practical research. Later, researchers basically adhered to similar general concepts and made minor adjustments to the specific characteristics of different transportation modes [
6,
7]. Bhavathrathan and Patil thought that the resilience of transportation networks is a measure of the maximum agitation a road system can take in before being displaced from one state to another [
8]. Mudigonda et al. studied the measurement of general transportation networks from four dimensions: technical, organizational, social, and economic [
9]. Chen et al. measured the resilience of a port-hinterland container transportation network as the ability of the system, with the help of immediate recovery activities, to meet the transport demand, as well as to recover and ensure the persistence of the performance level at a rational cost within a limited period, when faced with disruptions to the network caused by unconventional emergency events [
10]. Despite the absence of a unified standard for defining transportation system resilience, the core principles focus primarily on one or both perspectives: (1) the ability to resist or absorb external disruptions; (2) the time and resources required to restore performance level after interruptions [
11,
12,
13,
14].
Regarding the quantitative metrics of transportation resilience assessment metrics, research can be roughly divided into three types: topology-based metrics, feature-based metrics, and performance-based metrics. The topology-based method evaluates the overall resilience of the transportation network system, such as aggregation coefficient, friability [
15], redundancy [
16], topology grid efficiency [
17], reserve capacity [
18], average node degree, periodic cyclicity [
19], global efficiency and the relative size of the giant component [
20]. The topology-based metrics focus on the geometric properties of the transportation systems while ignoring the dynamic features. The feature-based metrics focus on one or several of the four attributes that resilience is considered to have, namely, robustness [
21], redundancy [
22], resource, and rapidity [
23]. Different from feature-based metrics, performance-based metrics are designed to measure systems’ resilience based on their performance over the whole period affected by disasters. Studies on performance-based traffic resilience are mostly based on Bruneau’s “Resilience Triangle” theory [
24]. Three of the most widely used performance-based metrics are the degradation of system quality over time [
25], the time-dependent ratio of recovery to loss [
26], and the expected fraction of demand satisfied in post-disaster networks using specific recovery costs [
27]. In general, performance-based metrics are more appropriate than attributes-based metrics to measure the resilience of transportation systems, and both of them are better than topological metrics as the latter does not consider the flows in the network.
Considering the gradual onset of rainfall and the dynamic non-stationary characteristics of road traffic, we customize a set of Resilience Triangle-based transportation resilience metrics in this paper. Using real-world traffic and meteorological data, we analyze the response and recovery time of the transportation system and the severity of performance loss under rainfall scenarios. The purpose is to quantitatively assess the traffic resilience of urban roads under the influence of rainfall and capture its spatiotemporal distribution characteristics. Our work will contribute to traffic planning and emergency response in a more targeted and effective way.
2. Method
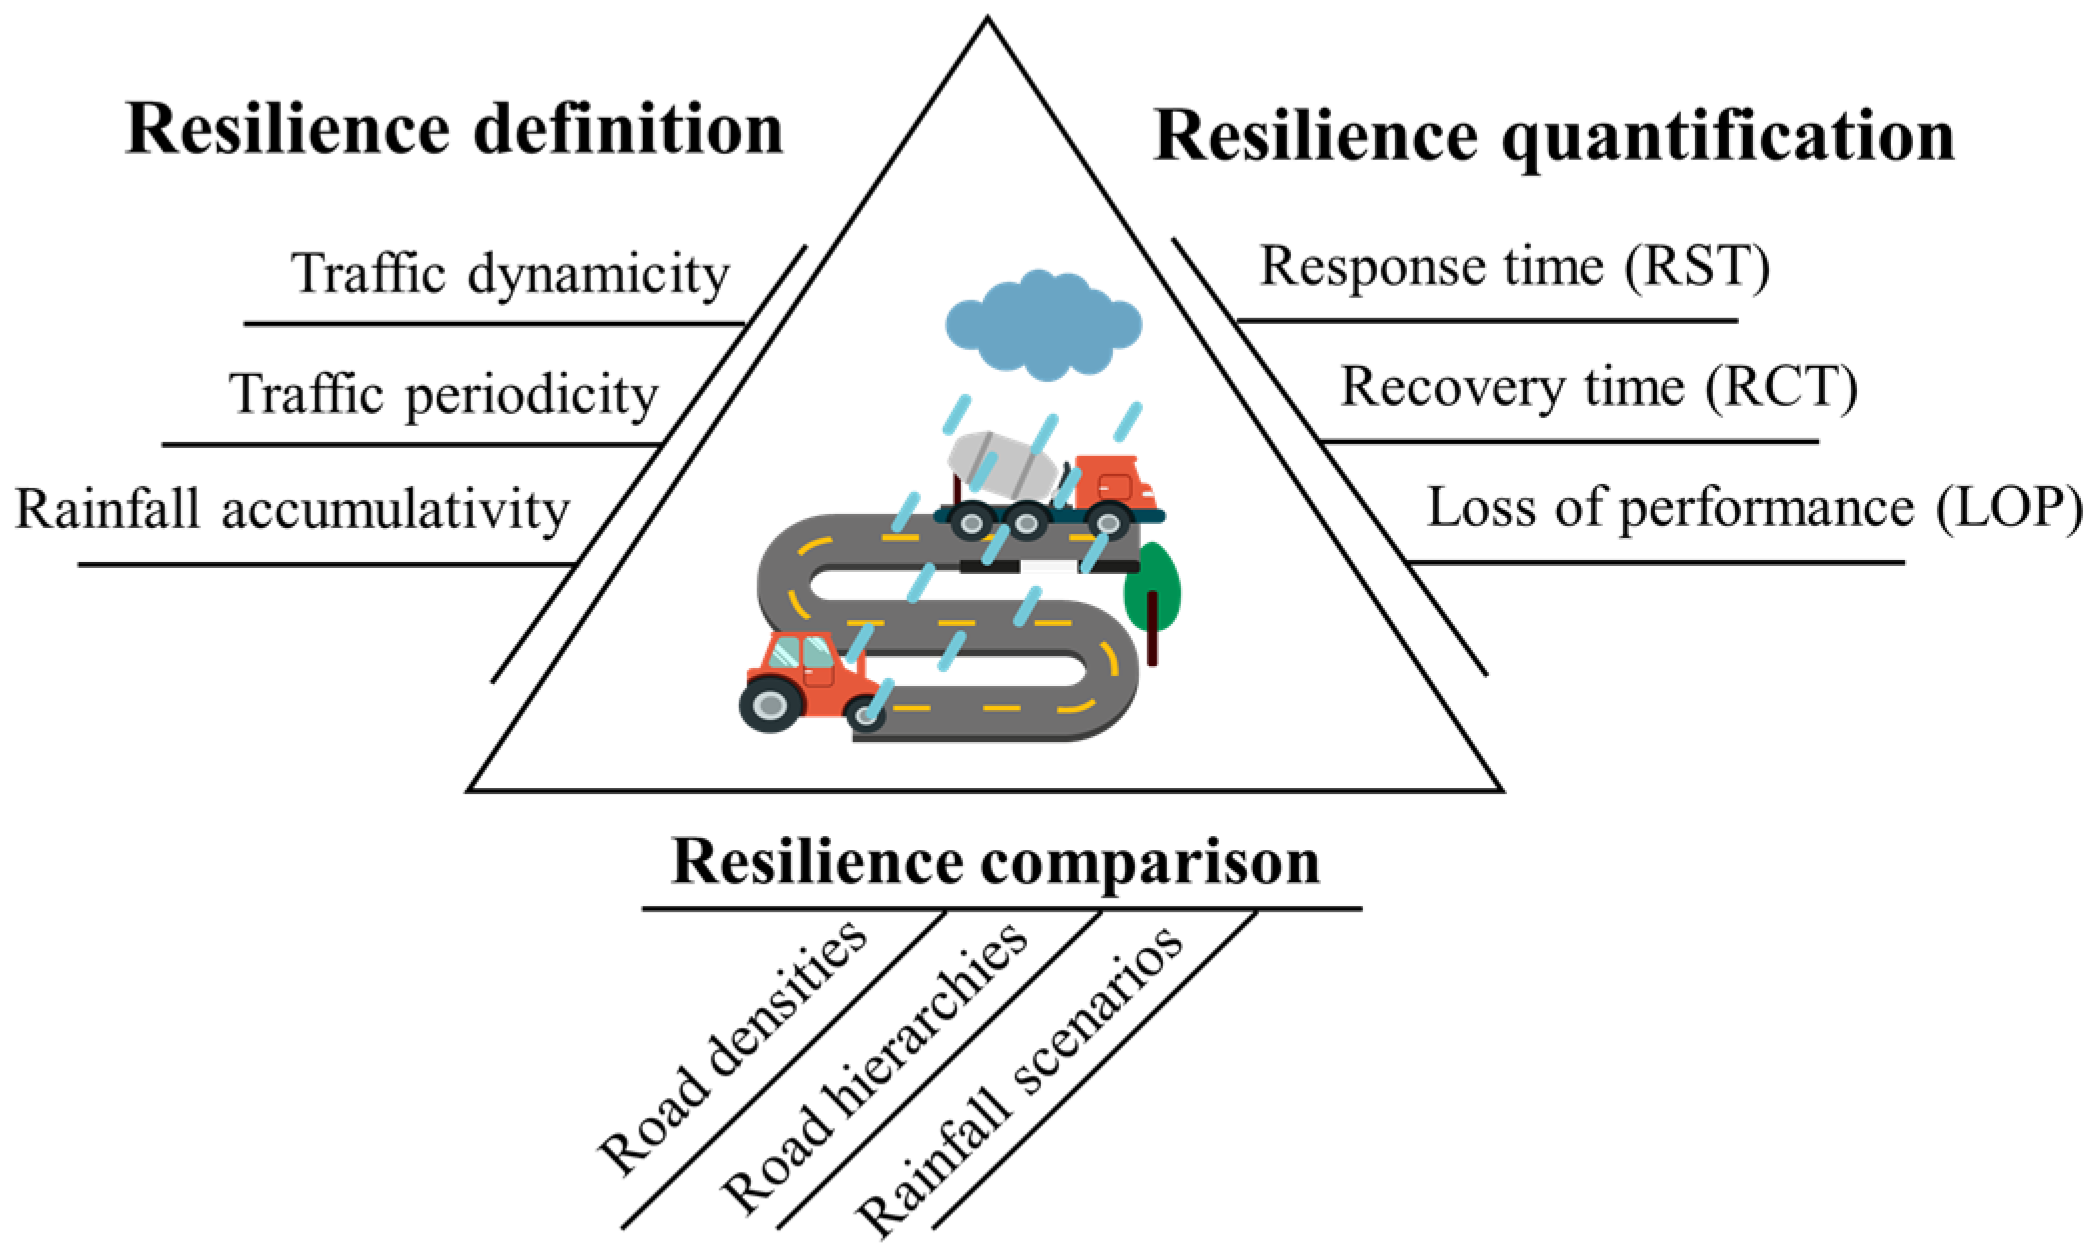
The resilience assessment method of urban road transportation in rainfall is shown in
Figure 1, which mainly includes resilience definition, resilience quantification, and resilience comparison.
2.1. Parameter Definition
Before proposing the custom traffic resilience metrics, we first define several key parameters as the calculation units for the metrics. The road traffic status is often described by traffic speed, vehicle density, or traffic flow. Here, we take the average hourly road speed as the performance of the road traffic system.
Definition 1. Baseline speed on urban roads. For the n roads in the road network, the average speed of each road in the same week and same hour is used as the baseline speed on urban roads when there is no rainfall or rainfall has no impact on traffic.
Definition 2. Key nodes during rainfall. The impact of typhoon-induced rainfall is obviously higher than that of rainstorms, which is related to the more comprehensive destructiveness of storms [28]. Therefore, two scenarios are considered: typhoon rainfall and general rainfall (rainfall not caused by typhoons). Set the number of rainfall days as , where, is the number of typhoon rainfall days; represents the number of general rainfall days. Then, for all roads in the road network , the set of hourly precipitation on rainfall days can be recorded as . Here, and record the starting and ending time of a rainfall process in respectively, and .
Definition 3. Key nodes of road speeds. The average hourly speed of all n roads in during rainfall days is . For , (1) is the starting time of the road speed response to the rainfall process, and ; (2) is the road speed corresponding to the time ; (3) is the ending time of urban road speed response to the rainfall process; (4) is the road speed corresponding to the time , which indicates that the response period ends and the speed gradually returns to normal; (5) is the speed that is the largest decrease compared with the baseline speed in the response process []; (6) is the time corresponding to , which indicates the time when the rainfall event has the greatest impact on urban road traffic. Here, .
2.2. Resilience Definition
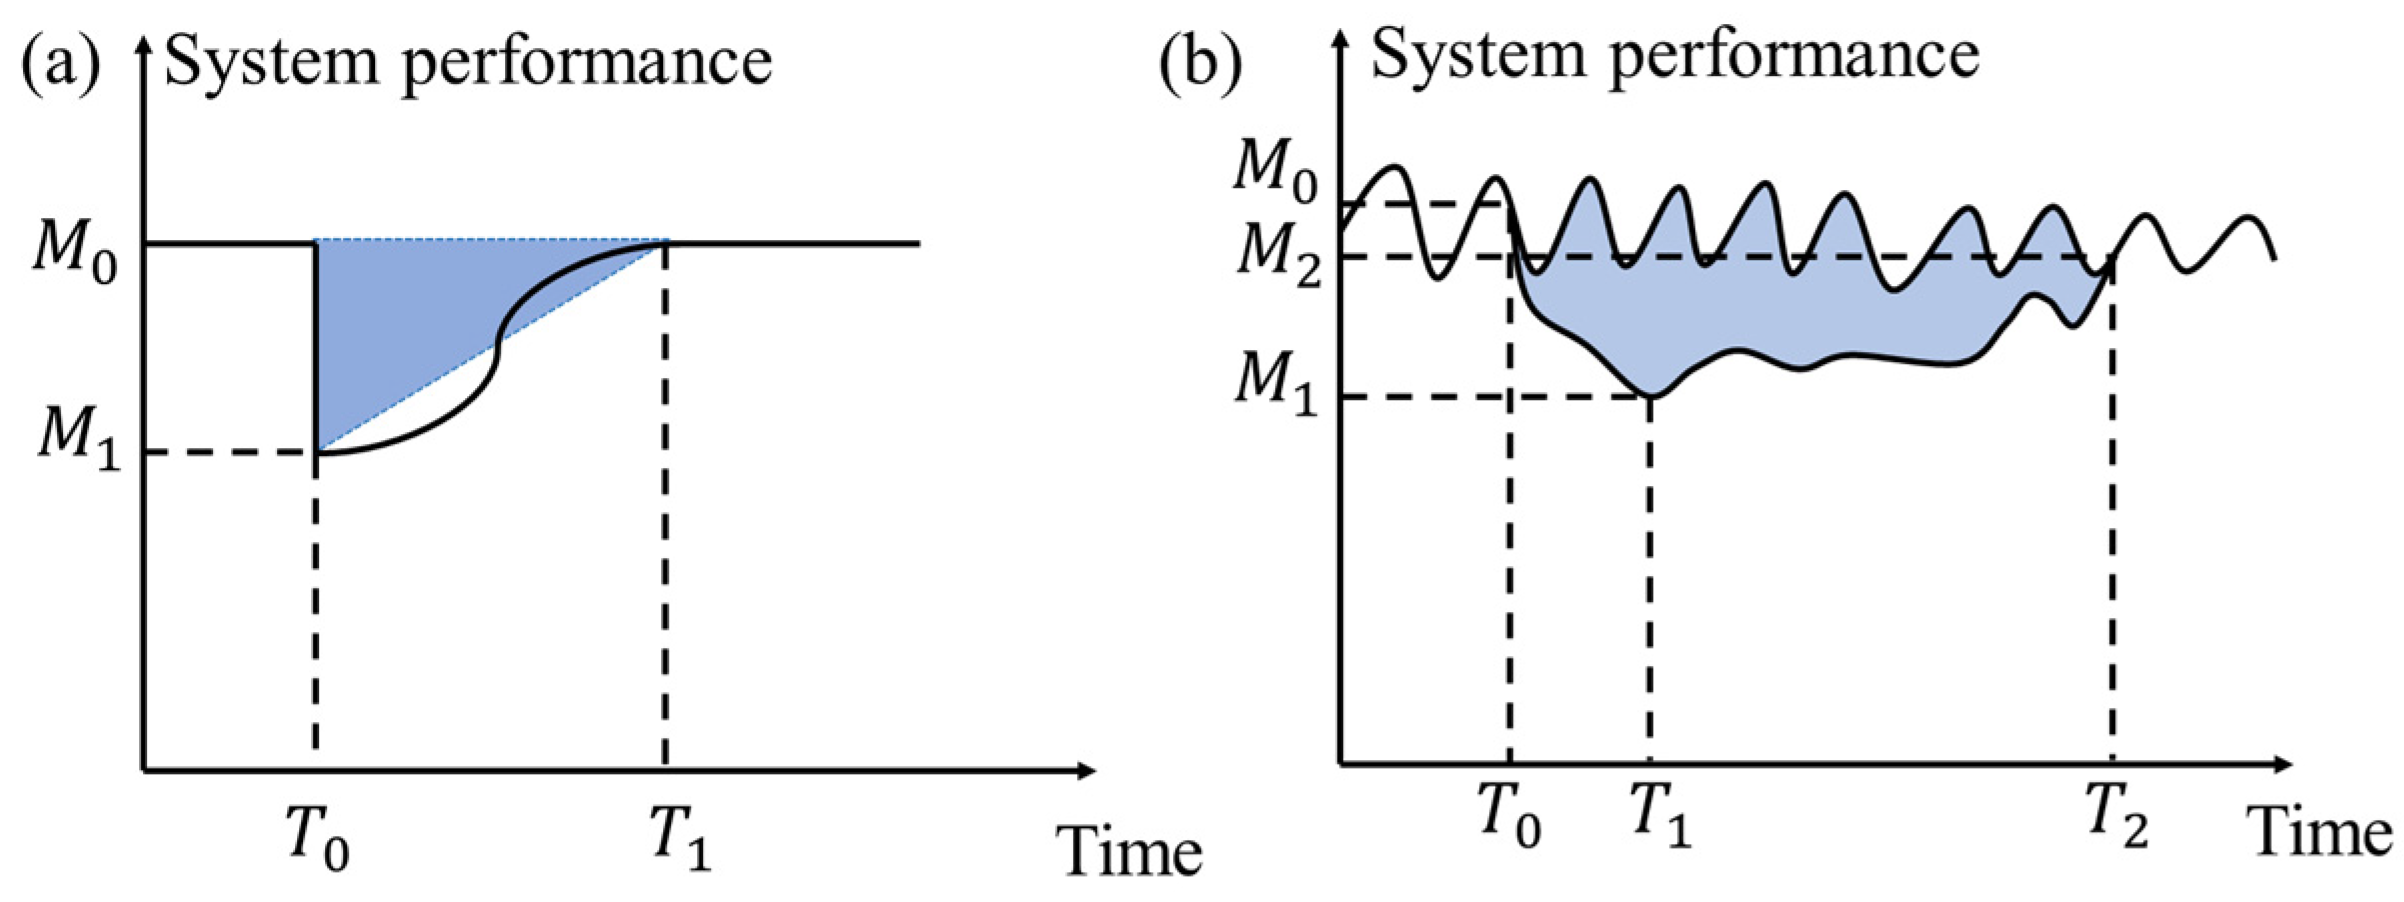
The Resilience Triangle represents a measure of both the loss of functionality of a system after a disruption and the time it takes for the system to return to normal performance levels [
24]. As shown in
Figure 2a, the horizontal axis is time, the vertical axis is system performance, and the area of the triangle surrounded by the decline in performance over time (the blue area) represents the loss of system performance. Here,
represents the time when the system drops to the lowest level due to external disruption and
is the time when the system returns to its original level.
represents the normal system performance before the disruption and
is the worst system performance after the disruption.
The application of the Resilience Triangle to real-world urban road traffic scenarios would bring considerable deviation. Assumptions supporting the Resilience Triangle include: (1) The system performance would drop to the lowest level immediately after being impacted. However, this assumption is not suitable for urban road traffic systems since the impact of rainfall usually does not appear immediately. The transportation system itself has a certain anti-interference ability. When the resistance of the transportation system is not enough to offset the negative impact caused by external disruptions, it will show dynamic changes in the forms of speed, travel time, and vehicle density. Furthermore, the worst traffic state does not necessarily occur in the early response stage. (2) Under normal conditions, system performance is assumed to be static and stable. However, road traffic states usually show nonlinear and periodic fluctuations, such as daily changes in a week and hourly changes within a day. During the system response and recovery, only relying on the time difference and the corresponding performance level can lead to significant calculation deviation. Therefore, it is necessary to consider the dynamic nature and relative change of traffic state in the analysis.
Based on the response characteristics of urban road traffic to rainfall events, we put forward the Resilience Triangle of road traffic systems, as shown in
Figure 2b. Here,
,
and
represent the time when the rainfall starts, when the system performance drops to the lowest level, and when the system recovers, respectively.
,
and
represent the normal system performance before rainfall, the worst system performance during rainfall, and the system performance after recovery, respectively.
The innovations are:
Emphasizing the dynamic process of road traffic. The loss of transportation system performance is represented by the polygon area defined by performance degradation with time rather than by a simple triangle (the blue area in
Figure 2b). The shoelace theorem [
29] is introduced to optimize the calculation of the polygon area surrounded by the road speed and the corresponding baseline speed in response to the recovery period.
Eliminating the periodicity of road traffic. In order to reflect as much as possible that the fluctuations are caused by external weather factors rather than the periodicity of road speed itself, the speed during the rainfall period is compared with the baseline speed during the same hour of the same day in a week, rather than with the previous hour. This means that the peak speed response is not necessarily the lowest speed during [], but compared with the baseline speed, it has the largest decrease. The speed before the rainfall is not necessarily the same as the recovery speed .
Considering the cumulative effect of rainfall on traffic. Set the candidate interval for the end time of response as from the beginning of rainfall to k hours after the end of rainfall. The road speed in [,] is compared with the corresponding baseline speed, and is determined by reverse sequence comparison.
2.3. Resilience Quantification
Based on the parameters defined above, three quantitative metrics of transportation resilience are proposed: ➀ Response time (RST) is the time from the beginning of the rainfall event to the worst system performance, representing the resistance ability of the urban traffic system; ➁ Recovery time (RCT) refers to the time for the system recovers from the worst state to normal levels, representing the recovery ability of the urban traffic system; ➂ Loss of performance (LOP) represents the degradation of system performance, indicating the survivability of the urban road traffic system. The calculation method is the area surrounded by the difference between the system performance from disaster response to recovery and the corresponding baseline performance. Their calculations are shown in Equations (1)–(3):
For urban traffic, a slower response process means higher resilience, which represents that even when disturbed by disasters, the urban road system can still maintain stable adaptation states. A faster recovery process means a higher resilience, which means that service functions can be quickly restored to normal after a disaster interruption. LOP is mainly affected by two factors, namely, the period length [] (that is, the sum of response time and recovery time) and depth ( or ), that is, the degree of performance degradation). Among them, the recovery period is an important resilience measure in the field of traffic engineering. When external disruptions such as an extreme rainfall event occur, resilient transportation usually does not simply pursue a small extreme value of performance degradation but also expects to recover quickly after performance degradation. The proposed resilience metrics aim to pay attention to the whole response and recovery process of the urban road traffic system when external disturbances occur.
2.4. Resilience Comparison
To compare the resilience of the urban road traffic system, the hourly speed and precipitation of each road are aggregated from various perspectives, including rainfall type, road hierarchies, and rainfall scenarios. Here, the data are calculated for the two scenarios of typhoon rainfall and general rainfall. Firstly, to analyze the resilience difference of road densities, we calculated the average cumulative precipitation and resilience metrics of each road and observed the spatial distribution of urban road traffic resilience. Secondly, to analyze the resilience difference of road hierarchies, we summarized the average resilience metrics of roads matching with OSM road hierarchies. Thirdly, the data are classified based on the cumulative precipitation, and the resilience differences under different rainfall intensities and types are analyzed.
4. Discussion
4.1. Resilience Differences Analysis
4.1.1. Road Densities
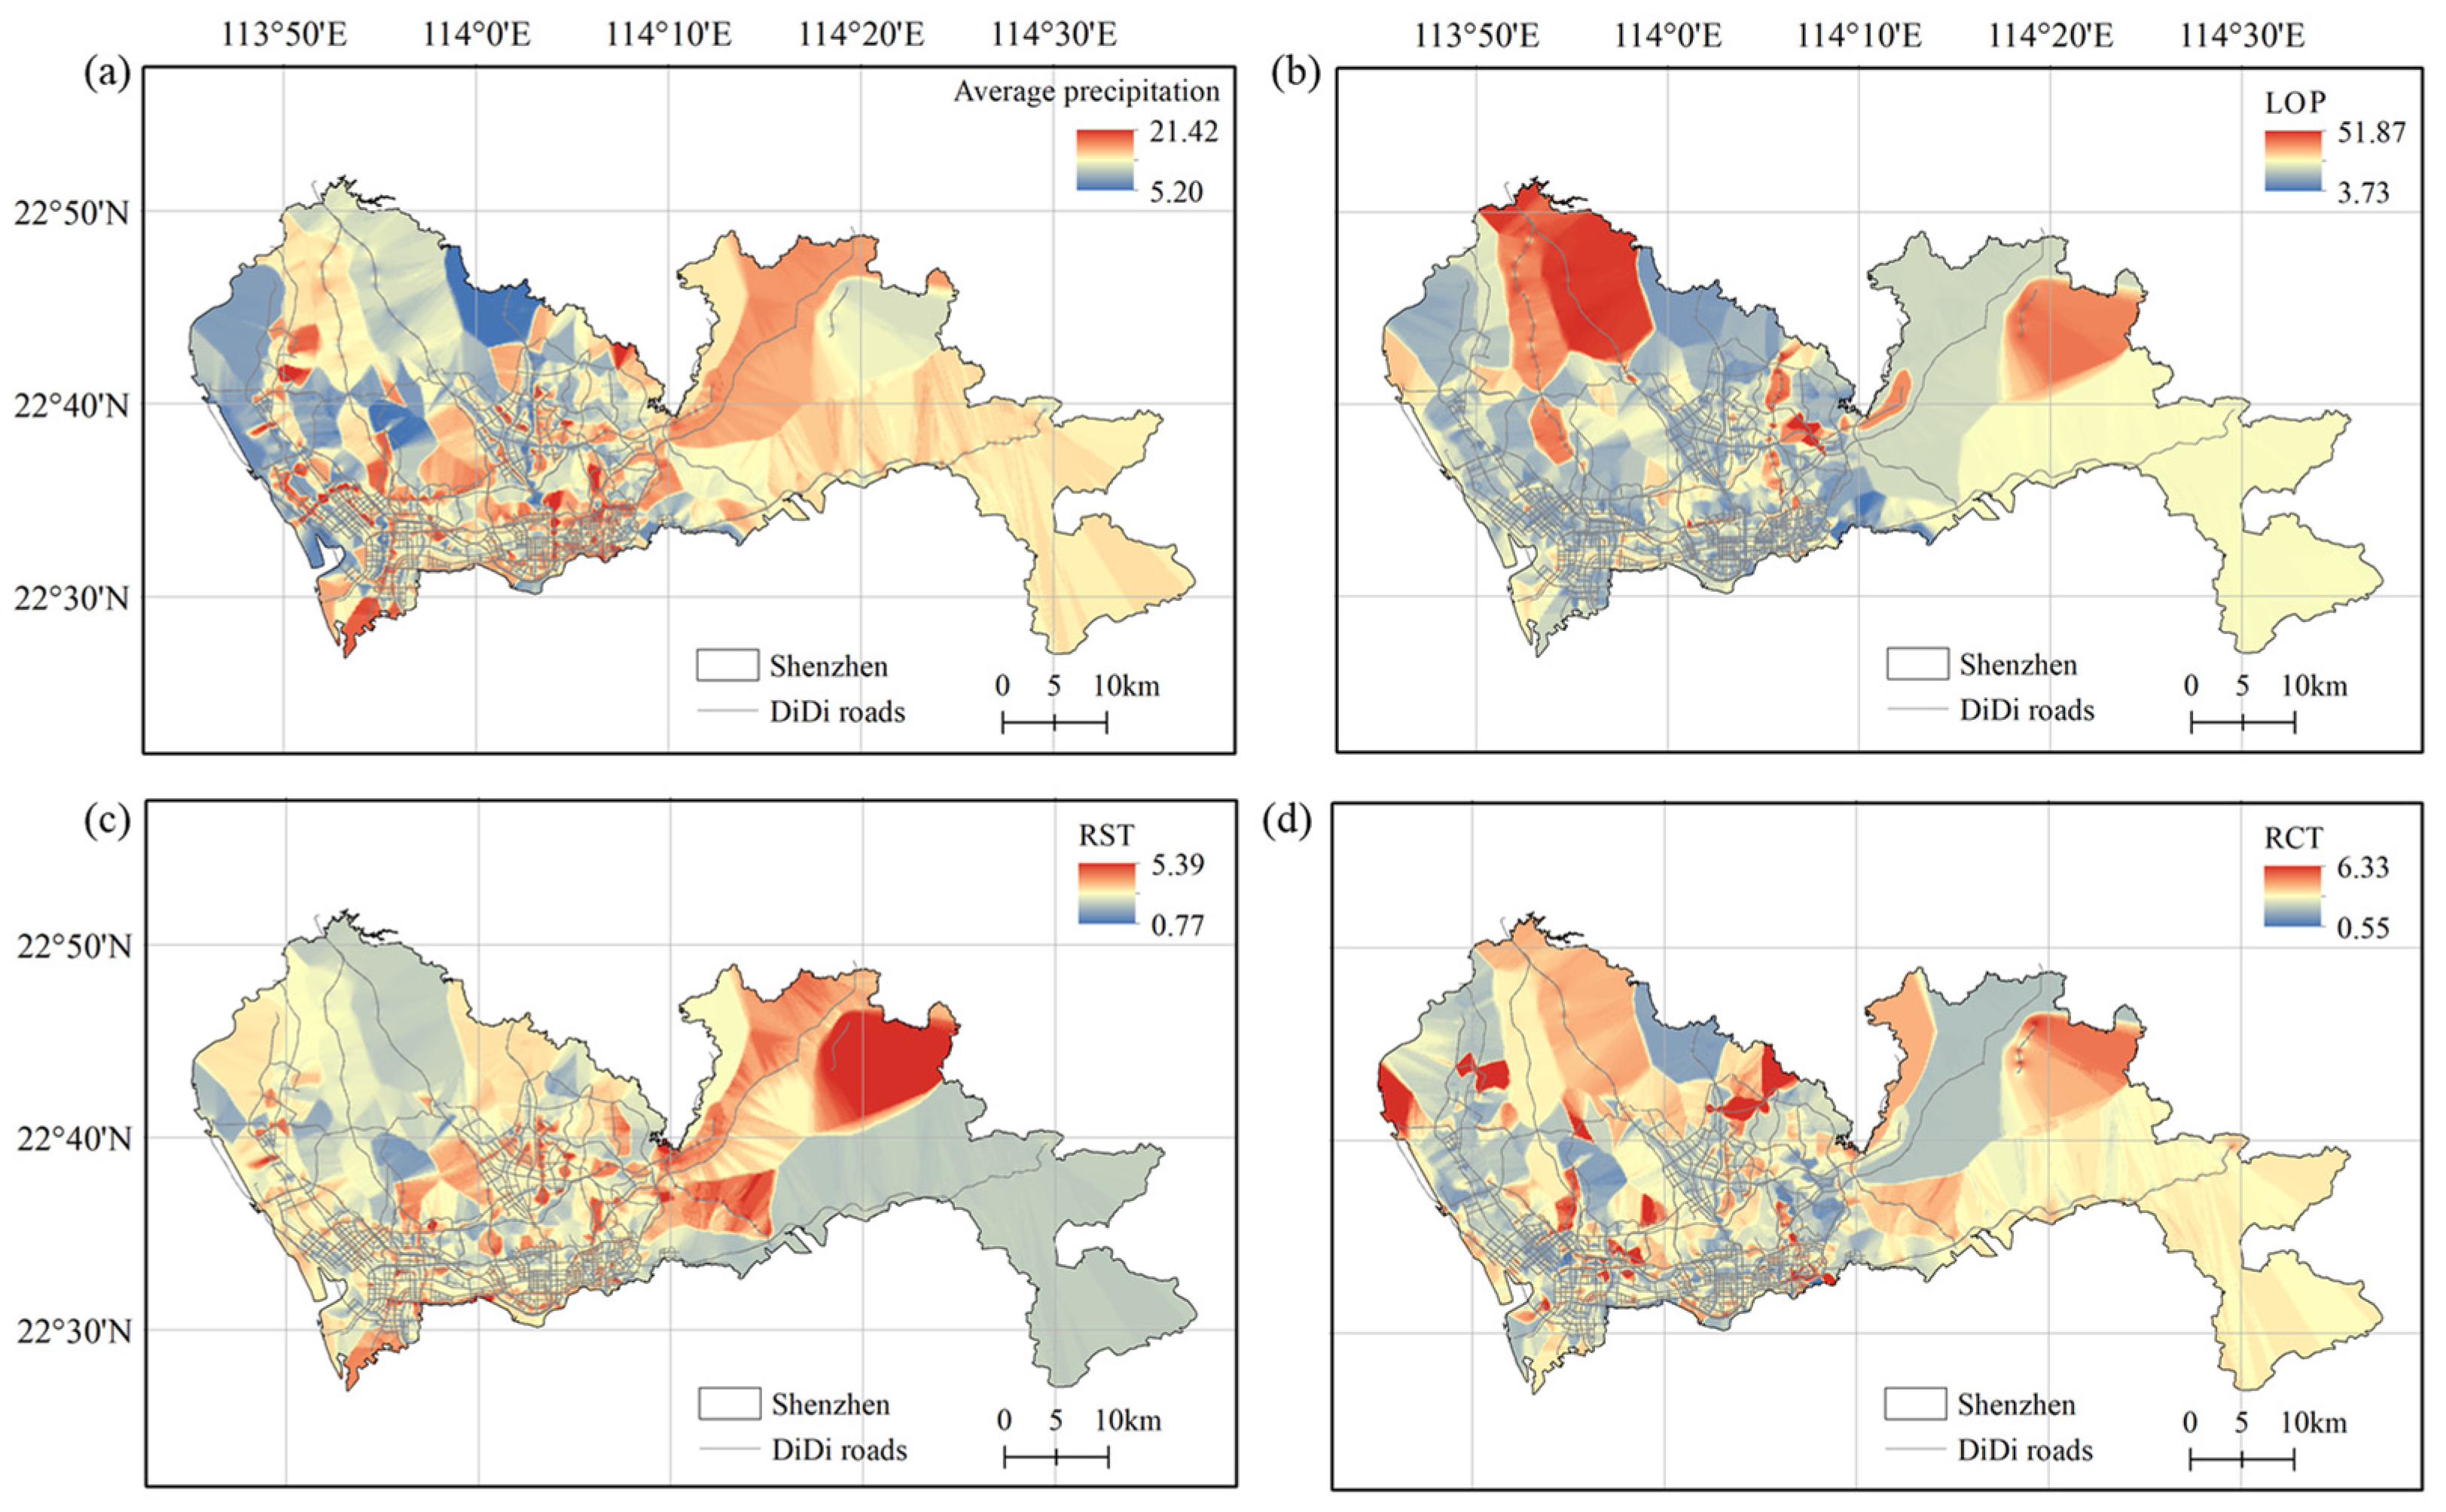
Figure 4 shows the spatial interpolation differences of the average cumulative precipitations and average resilience metrics for different roads. The interpolation here is only applicable to the areas with DiDi data, excluding several independent islands in the southwest corner and southeast corners of Shenzhen.
The comparison shows that dense road networks are more resilient than sparse road networks. The spatial patterns in
Figure 4a,c are similar because the average precipitation is related to the rainfall time. The longer it rains, the longer the response time of road traffic. As can be seen from
Figure 4b,d, the roads in the northwest and east of Shenzhen are sparse, RCT is long, and LOP is obviously large; the road network in the west and south of Shenzhen is dense, with a small LOP and a short RCT. The previous research noted that the typhoon hazard within Shenzhen City has spatial heterogeneity, i.e., large in the east but small in the west, large in the south but small in the north [
36]. Moreover, Shenzhen’s topography is high in the southeast and low in the northwest [
37]. Neither meteorological nor topographic factors can directly explain the spatial resilience differences. The possible reason is that the optional paths between two locations on the sparse road network are limited, which leads to the rapid gathering of traffic flow on a few main roads and even partial paralysis of the road network. The dense urban road network makes traffic flow more evenly distributed throughout the whole road network, which is beneficial for improving road utilization. Therefore, the high redundancy of the fine road network provides more mobility and evacuation opportunities for traffic flow and can provide detour routes when some roads are attacked or damaged, thus improving the anti-interference ability of the whole road network.
4.1.2. Road Hierarchies
Table 3 shows the average resilience metrics of roads of different hierarchies.
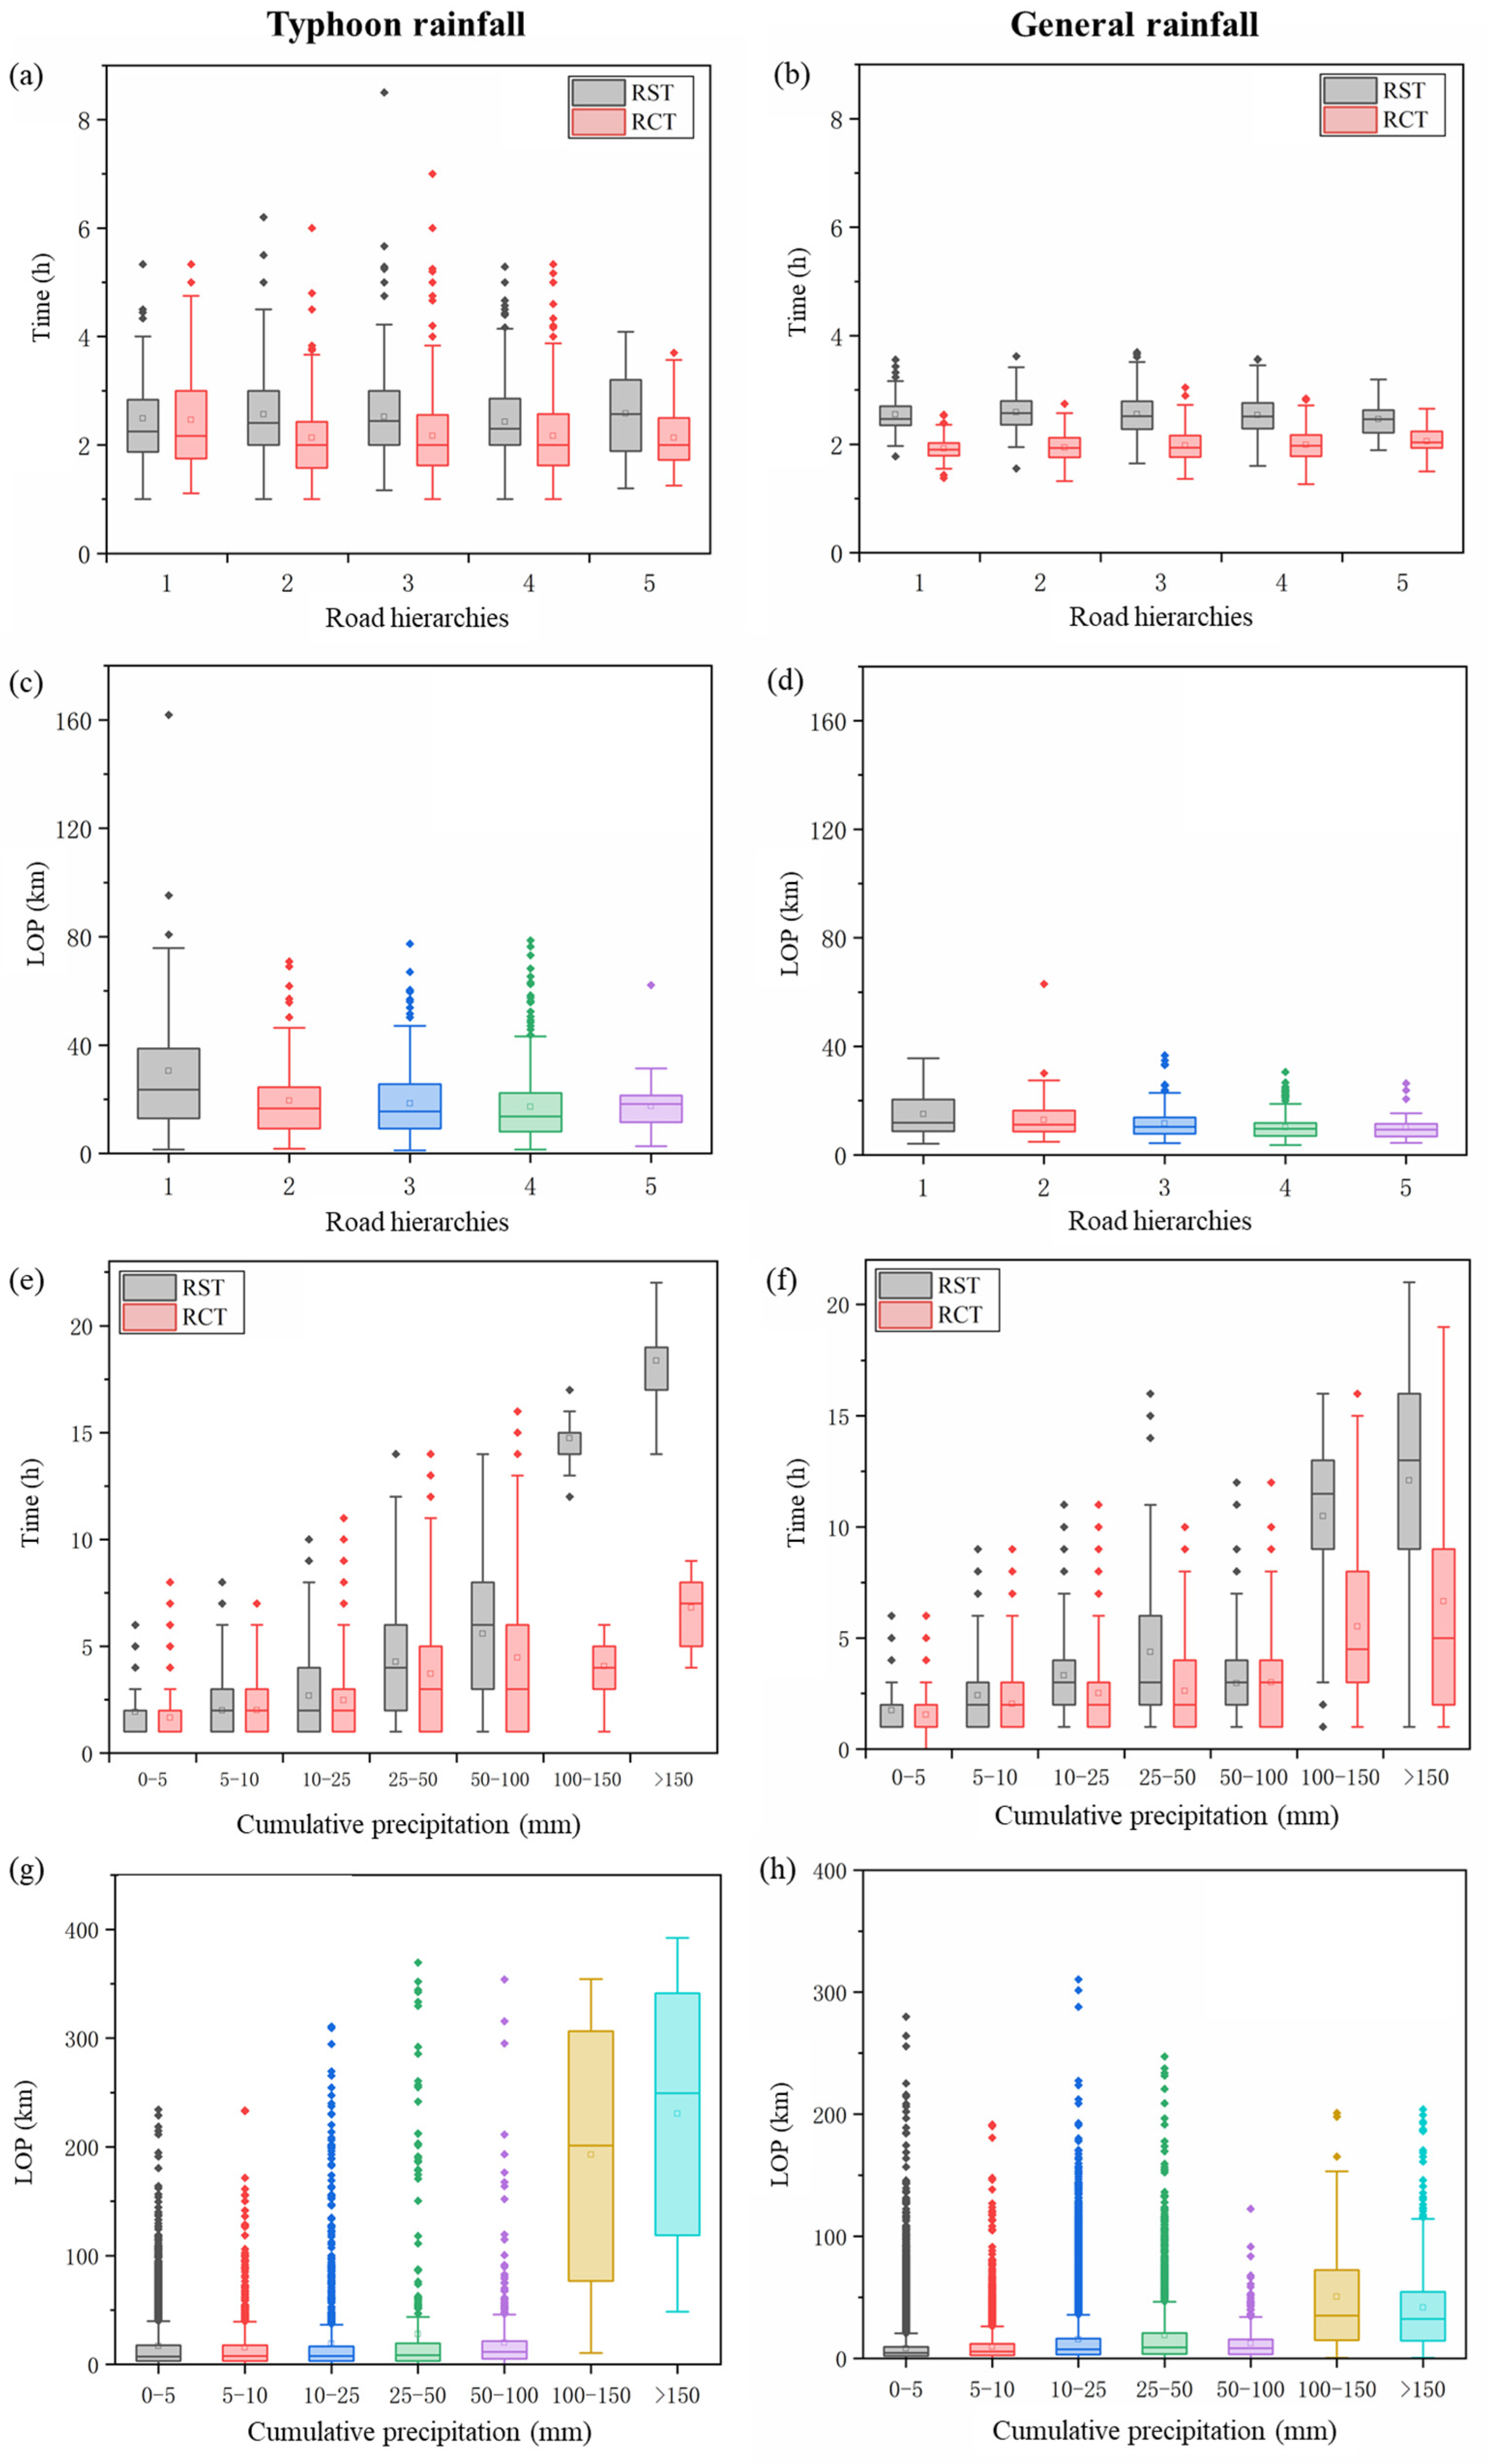
Figure 5a–d are box plots for roads with five hierarchies under typhoon rainfall (
Figure 5a,c) and normal rainfall (
Figure 5b,d) scenarios. Under the two rainfall scenarios, there is a significant difference in LOP (
p-value < 0.05), while RST and RCT are not statistically significant. The LOP of higher-level roads (Hierarchy 1) is greater. That is because, in normal scenarios, the free-flow speed of trunks and motorways is very large, and the gap between the baseline speed and the speed in rainfall of roads with Hierarchy 2–5 is not as big as that for roads with Hierarchy 1. For RST and RCT, the response and recovery period of roads with different hierarchies are stable because the overall level of urban road infrastructure in Shenzhen is relatively high.
4.1.3. Rainfall Scenarios
Table 4 shows the average resilience metrics under different rainfall intensities. Here, all metrics passed the significance test at a 1% level.
Figure 5e–h show the box plots of three resilience metrics under different intensities in typhoon rainfall (
Figure 5e,g) and general rainfall (
Figure 5f,h) scenarios. We found that the failure of urban roads is related to rainfall intensity, and there may be a self-regulating threshold. When the rainfall is less than level 6 (the cumulative precipitation in the rainfall process is less than 100 mm), the three metrics will fluctuate and increase with the increase in rainfall intensity. When the cumulative precipitation exceeds 100 mm, all three metrics suddenly rise. RST is two-to-four times that of RCT, and the traffic delay caused by rainfall exceeds 10 h.
The transportation system has the ability to self-recover. However, when the rainfall intensity exceeds a certain threshold, the system performance will change suddenly. Extreme weather (such as typhoons, short-term rainstorms, or long-term heavy rainfall) would not only hinder the road service functions but also potentially destroy the physical structure of road facilities. For example, if some road facilities (such as subgrades, pavements, culverts, and sinking bridges) are washed away or submerged, the road will submerge, crack, and collapse, resulting in secondary geological disasters such as landslides or mudslides. These physical damages will lead to sudden changes in the traffic system, making it difficult to restore normal service functions quickly. External intervention will be needed for emergency repairs and even for post-disaster reconstruction. The threshold for self-regulation is helpful in understanding the limits of the resilience of urban road transportation systems.
We also found that different types of rainfall can lead to different urban road transportation resilience. Under various rainfall intensity scenarios, RST and RCT brought by typhoon rainfall are longer than that of general rainfall, and the LOP of roads in typhoon rainfall is one-to-four times that in general rainfall. Even under similar rainfall intensity, typhoon rainfall would bring more serious impacts on urban road systems than general rainfall. The reason is that typhoons landing in China are mainly characterized by the coexistence of wind and rain [
38], which means that typhoon rainfall is often accompanied by strong winds. The superposition effect of wind and rain coupling intensifies the impact on the operation of urban road traffic and is even more likely to cause physical damage.
4.2. A Case of Extreme Weather Event: Typhoon Mangkhut
Typhoon Mangkhut was the strongest typhoon to land in China in 2018, and it is also the most serious typhoon affecting Shenzhen since 1983, causing serious losses to various industries in Shenzhen. At 17:00 on 16 September 2018, Typhoon Mangkhut landed in the coastal area of Jiangmen City, Guangdong Province, China, with a maximum wind force of level 14 near the center, at a distance of only about 150km from Shenzhen [
39].
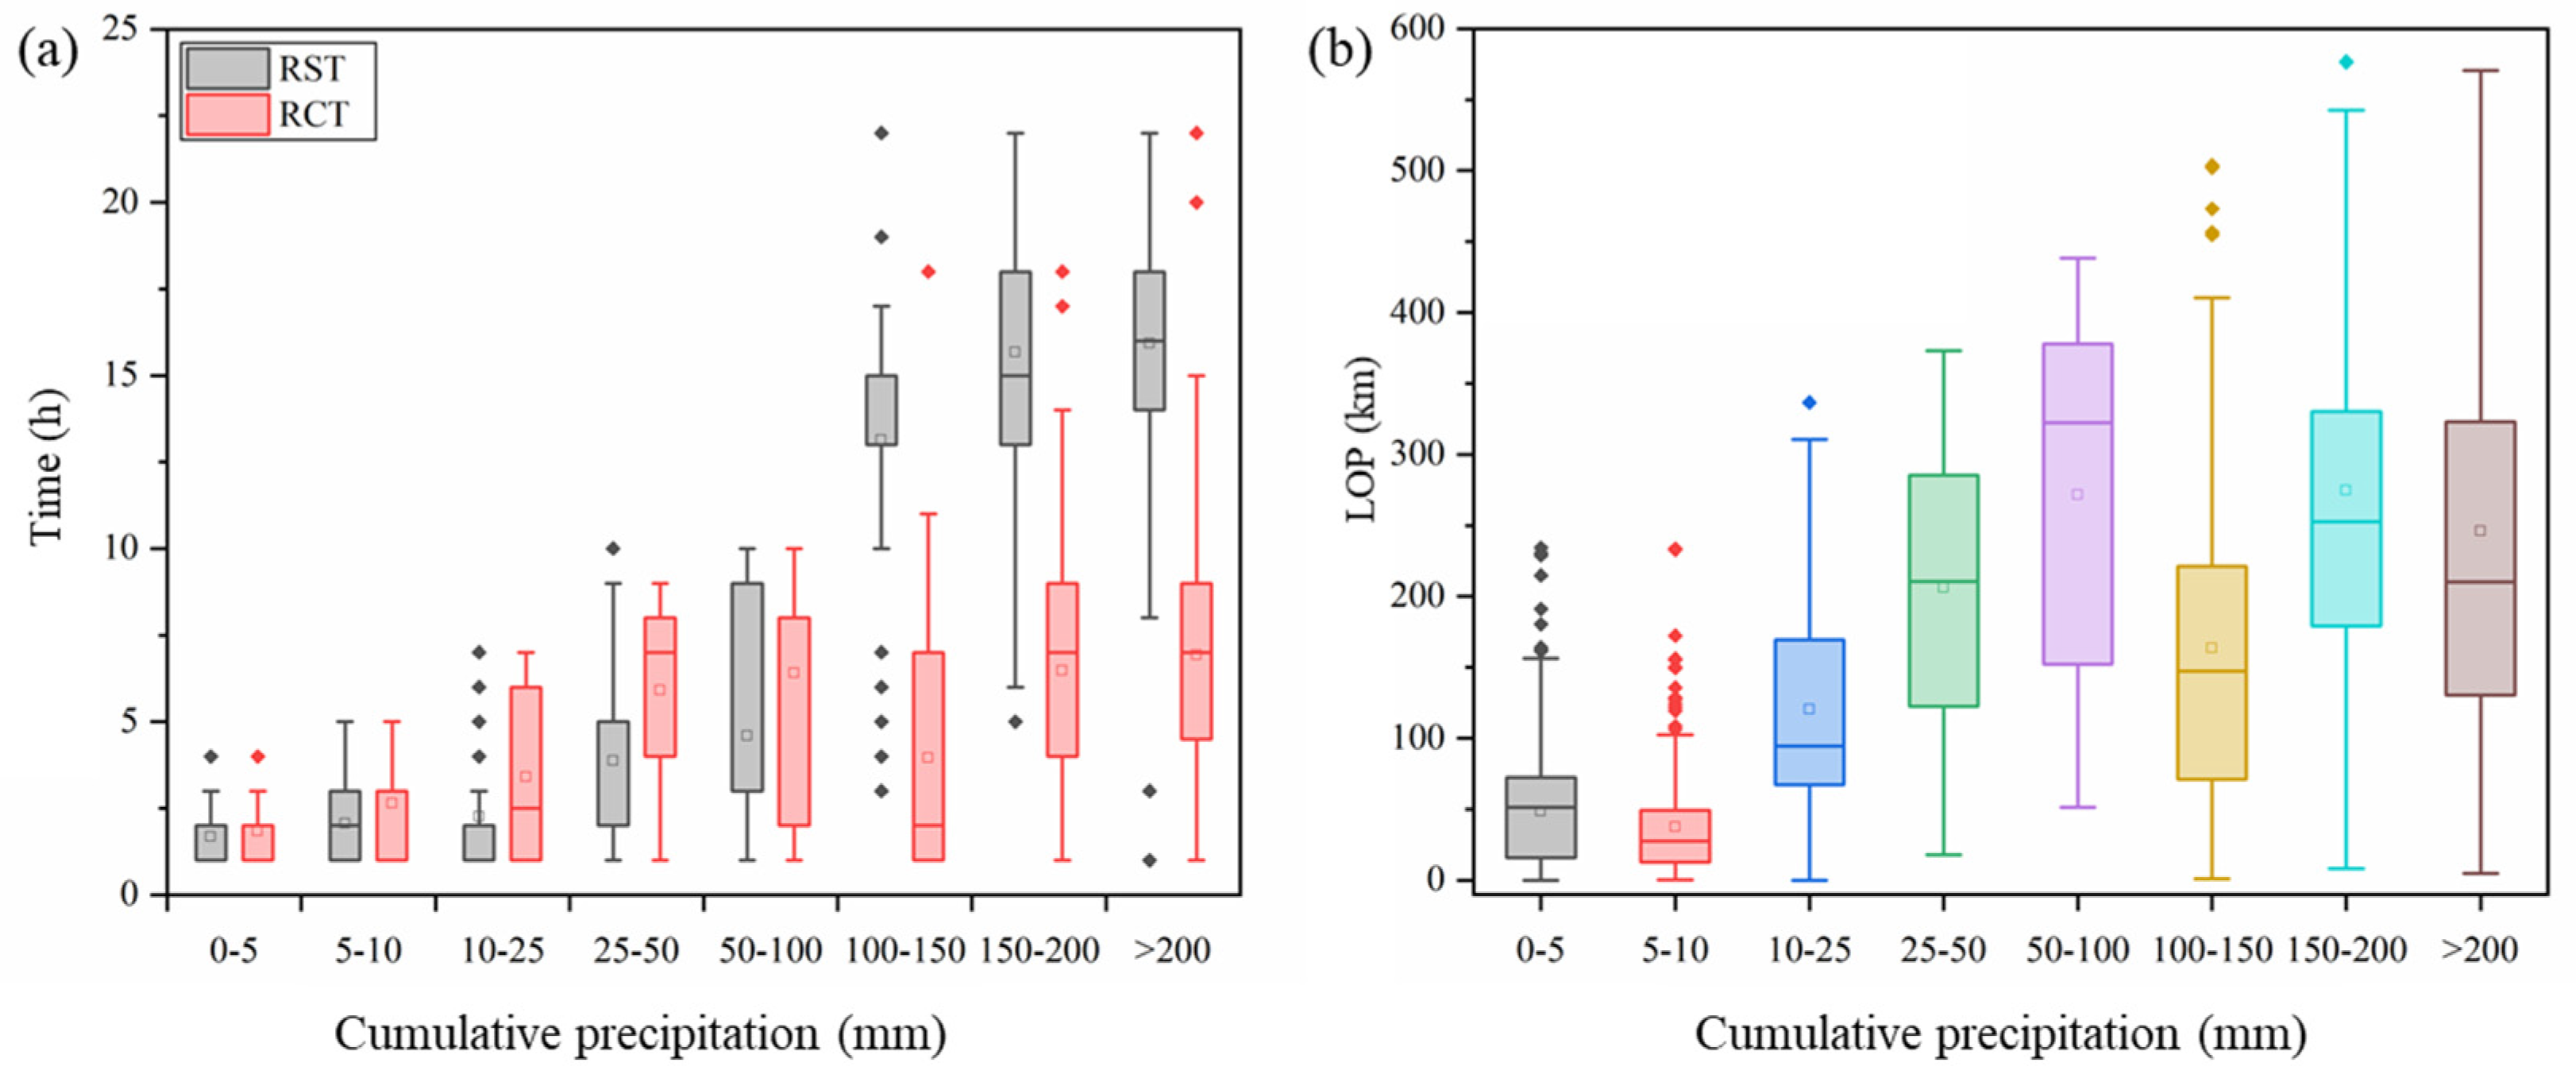
Figure 6 shows the transportation resilience metrics during the rainfalls caused by Typhoon Mangkhut.
Comparing
Figure 5f and
Figure 6a, we found that the variation patterns of RST and RCT under different rainfall intensities during typhoon Mangkhut are consistent with those during general rainfalls, and there is also a self-regulating threshold for the cumulative precipitation of 100 mm. When the cumulative precipitation during the typhoon rainfall process is less than 100 mm, all three metrics increase in fluctuations as the rainfall intensity increases. However, when the cumulative precipitation exceeds 100 mm, the response time and recovery time of urban road traffic to typhoon rainfall events are longer, resulting in a traffic slowdown of up to 15 h, with the RST being two-to-three times the RCT. Comparing
Figure 5h and
Figure 6b, we found that typhoon rainfall causes significantly greater LOP than general rainfall events.
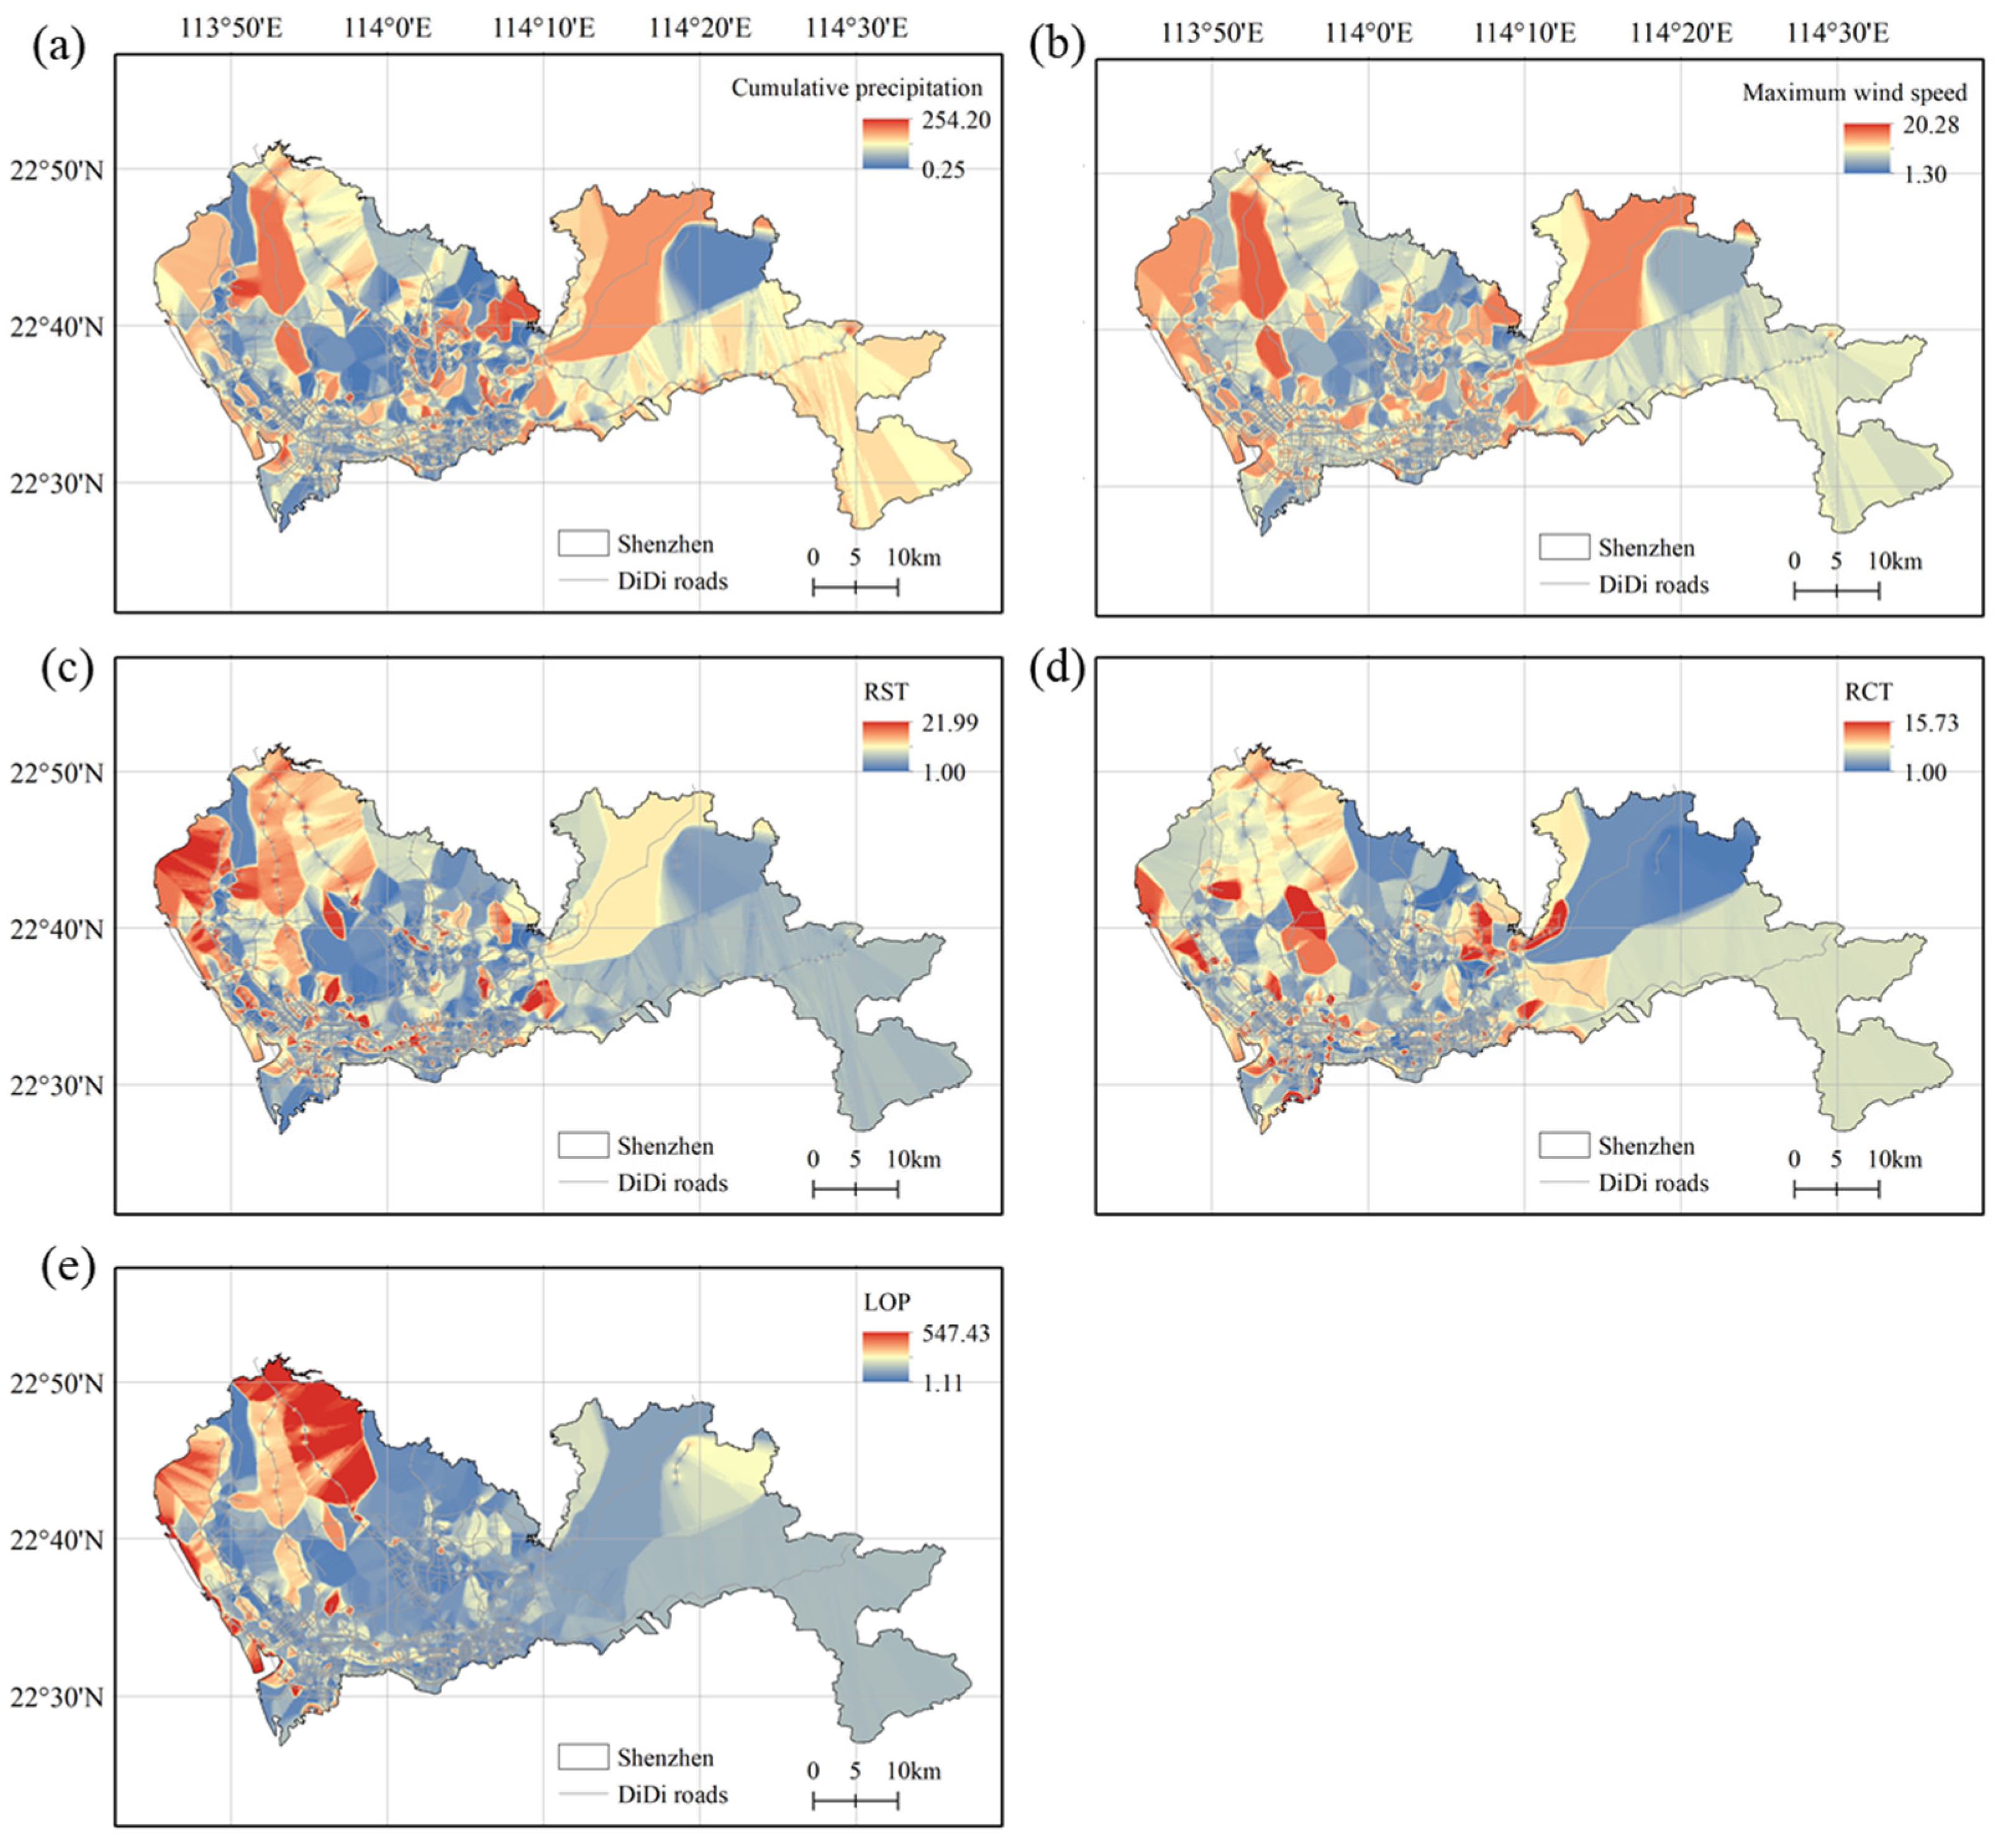
The spatial distribution pattern of urban road traffic resilience during Typhoon Mangkhut is illustrated in
Figure 7. From
Figure 7a,b, we found that the spatial distribution patterns of cumulative rainfall and maximum wind speed are similar. Due to topographical and environmental factors, even within a small area of Shenzhen City, significant spatial heterogeneity in the hazard intensity caused by Typhoon Mangkhut remains. Regarding the response time (
Figure 7c) and recovery time (
Figure 7d) of urban road traffic, road sections with higher RST and RCT primarily occur in the western part of Shenzhen and some areas with sparser road networks. This is attributed to the fact that Typhoon Mangkhut made landfall on the western side of Shenzhen, resulting in more severe damage in the western regions. As identified above, sparse roads are more susceptible to typhoon impacts than dense roads, a conclusion also borne out during Typhoon Mangkhut. Additionally,
Figure 7e suggests that roads with severely compromised transportation systems typically are not those with the highest disaster intensity but rather those with extended response and recovery times. The density of road networks provides a more explanatory framework for the spatial disparities in urban road traffic resilience observed during Typhoon Mangkhut.
4.3. Lessons Learned and Suggestions
Due to different metric definitions and calculations, it is difficult to compare our method with other methods directly. The analysis results of Shenzhen’s datasets can be discussed in relation to the current traffic planning scheme and future resilience measures. It includes the following three perspectives.
Urban road planning: The failure of urban road networks depends more on rainfall intensity, rainfall type, and network density than on its own hierarchy. The experiments show that ➀ as the rainfall intensity increases, the response and recovery time of the traffic system gradually increases; ➁ A sparse road network is more vulnerable than a dense road network and responds more obviously to rainfall; ➂ The resilience gap of roads with different hierarchies in Shenzhen is not obvious. Therefore, urban road construction should not solely be dependent on improving road hierarchy, road width, or number of lanes but also should develop an open and connected narrow-density road network to provide more mobility and evacuation opportunities for traffic flow. Redundant road networks can alleviate the problem of local road failures better, making the entire road network more resilient to disaster interference and post-interruption recovery.
Traffic emergency management: Shenzhen’s traffic system shows strong resilience, and there is also a self-regulation threshold: when the cumulative precipitation exceeds 100 mm, the urban road system will experience a sudden increase in LOP and a slow recovery process. Therefore, it is suggested that the transportation department and the meteorological department should strengthen data sharing and make emergency plans according to real-time weather forecast information. Traffic emergency management in extreme weather is a typical technical-social action that requires multi-department and multi-level organization and cooperation. It includes not only the collective decision-making of the transportation department and road maintenance units but also the transmission of high-precision meteorological information from the meteorological department and the disaster risk assessment from the emergency management department.
Transportation resilience construction: Typhoon rainfall is more destructive to urban road traffic than general rainfall. Global climate change will increase the probability of encountering strong typhoons and super typhoons in China’s coastal areas in the future. To prevent and cope with the extreme weather caused by typhoons, the construction of transportation resilience needs the cooperation of the transport department, meteorological department, municipal administration, greening department, planning department, and others. For high-frequency, low-damage weather, such as general rainfall, the adaptability of urban roads should be strengthened. Low-impact development methods of urban traffic infrastructure can be used to improve transportation resilience, such as ecological grass ditches, sunken green spaces, rain gardens, green roofs, and permeable pavements. For extreme disasters with low frequency and high damage, such as typhoons, the recovery capabilities of urban roads should be enhanced. On the one hand, the city is a complex, coupled, and highly heterogeneous system, and the risk of typhoon disasters is spatially heterogeneous even within the city. It is necessary to improve the accuracy of typhoon hazards and track prediction to achieve a refined and forward-looking understanding. On the other hand, short-term heavy rainfall, such as typhoon rainfall, brings surface water, causes the collapse of street trees, and other losses. Especially for roads with weak traffic resilience or roads in severely affected areas, it is recommended to pay attention to the infrastructure construction around the roads, such as enhancing the wind resistance of street trees—to avoid falling branches and blocking traffic—and improving urban water storage and drainage systems—to prevent urban waterlogging.
5. Conclusions
Facing the increasingly frequent extreme rainfall, a resilience assessment method for urban road traffic systems in rainfall is proposed. Considering the cumulative impact of rainfall on traffic and the dynamic non-stationary characteristics of the road traffic itself, we improved the calculation details of the Resilience Triangle and determined the asynchronous process between rainfall events and traffic changes. The method designed three resilience metrics: response time (RST), recovery time (RCT), and loss of performance (LOP) for the response and recovery process of road traffic to rainfall events. The resilience of urban road traffic systems was quantitatively evaluated from three perspectives: road densities, road hierarchies, and rainfall scenarios. The method can capture the evolution process of the response and recovery of the traffic system to weather events. Therefore, it is still applicable in other gradual weather disaster scenarios such as snowfall, fog, and strong winds.
The proposed method was applied to the real traffic and meteorological data set of Shenzhen, China, to understand the real resilience characteristics of the urban road traffic system in rainfall. Our conclusions can provide scientific references for taking effective response measures and disaster reduction strategies in destructive events.
Besides, it is important to consider the potential bias in the DiDi data. In the future, we would supplement the DiDi data with other traffic data sources, such as traffic counts from fixed sensors, GPS traces from taxis or private vehicles, or other open-source transportation datasets. Integrating multiple data sources can provide a more comprehensive and unbiased picture of Shenzhen’s urban road traffic resilience.
