Abstract
The differences in sensor imaging mechanisms, observation angles, and scattering characteristics of terrestrial objects significantly limit the registration performance of synthetic aperture radar (SAR) and optical heterologous images. Traditional methods particularly struggle in weak feature regions, such as harbors and islands with substantial water coverage, as well as in desolate areas like deserts. This paper introduces a robust heterologous image registration technique based on region-adaptive keypoint selection that integrates image texture features, targeting two pivotal aspects: feature point extraction and matching point screening. Initially, a dual threshold criterion based on block region information entropy and variance products effectively identifies weak feature regions. Subsequently, it constructs feature descriptors to generate similarity maps, combining histogram parameter skewness with non-maximum suppression (NMS) to enhance matching point accuracy. Extensive experiments have been conducted on conventional SAR-optical datasets and typical SAR-optical images with different weak feature regions to assess the method’s performance. The findings indicate that this method successfully removes outliers in weak feature regions and completes the registration task of SAR and optical images with weak feature regions.
1. Introduction
With the rapid development of remote sensing technology, the acquisition and comprehensive analysis of multimodal remote sensing images have become a reality, covering multiple types such as visible light, infrared, lidar, and SAR. Among them, SAR, as an active detection sensor, has the unique advantage of all-day and all-weather, while optical sensors are mature in technology and high in resolution, providing high-resolution images that align with human visual perception. The registration of SAR and optical images serves as an essential process. This step is vital for harnessing the complementary benefits of both modalities. It is crucial in remote sensing applications, including image fusion and visual navigation [1]. However, this process presents significant challenges in remote sensing technology. It demands accurate alignment of the reference image with the sensed image. Additionally, it must address the issues arising from nonlinear radiation distortion (NRD) and complex geometric transformations such as scaling, rotation, and perspective [2].
The current image registration methods can be mainly divided into two categories: manually designed methods and deep learning-based methods [3]. Manually designed methods can be further divided into region-based methods and feature-based methods.
Region-based methods can also be called intensity-based methods, which usually use the grayscale information of the image for template matching. This method first selects a template area on the reference image and then performs a sliding search in the search area of the sensed image. By using a specific similarity measure as the standard for judging image similarity, accurate image registration is achieved. Depending on the similarity measure, representative methods include normalized cross-correlation (NCC [4]), mutual information (MI [5]), etc.
Feature-based methods achieve image registration by extracting common features between input images and evaluating the similarity of these features. This process is divided into three main steps: feature extraction, feature description, and feature matching [6]. Feature extraction is mainly divided into two categories: global features and local invariant features [7]. Global features, such as line features and surface features, have a certain degree of invariance, but not all images contain these features, so their scope of application is limited. In contrast, local invariant feature methods mainly extract point features and area features, of which point features have become the mainstream choice in contemporary state-of-the-art methods owing to their ubiquitous presence and straightforward identification of location. The point feature extraction methods selected for use in current advanced registration methods mainly include Harris [8], ORB (Oriented FAST and Rotated BRIEF) [9], and AKAZE (Accelerated KAZE) [10], while the feature description methods are mainly categorized into constructing descriptors based on the gradient information of the image (e.g., SIFT [11]) and based on phase congruency (PC) (e.g., RIFT [12], MSPC [13]).
Current remote sensing technology can realize system-level geometric correction of images through platform positioning parameters, effectively eliminating rotational and scale differences between SAR images and optical images. Cutting-edge methods tend to combine region-based and feature-based methods to develop feature-based template matching methods. This class of methods usually utilizes similar local structural features between heterologous images. It aims to extract a set of matching point pairs for constructing a geometric transformation model. It is shown that the combination of template region-based and feature-based methods can achieve higher accuracy in SAR-optical heterologous image registration than region-based methods. This type of method usually includes three main steps: feature point extraction, region feature matching, and matching point screening. Depending on the feature descriptors used, common classical methods include: Channel Features of Oriented Gradients (CFOG [14]) proposed by Ye Y et al. and Angle-Weighted Oriented Gradients (AWOG [15]), which improve the accuracy of gradient calculation on this basis; LNIFT (Locally Normalized Image Feature Transform) [16], which uses ORB and HOG-like, SRIF (Scale and Rotation Invariant Feature transform) [17], which has scale invariance on top of LNIFT; and LPHOG [18] which combines line and point features and uses HOG-like (Histogram of Oriented Gradient) descriptors. The main methods for SAR and optical image registration that combine the SIFT algorithm within the domain of computer vision include PSO-SIFT [19] (Position-Scale-Orientation SIFT), OS-SIFT [20] (Optical-SAR SIFT), RTV-SIFT [21] (Relative Total Variation). The main registration methods that use phase congruency include HOPC [22] (Histogram of Phase Congruency), FED-HOPC [23], etc.
Moreover, deep learning-based multimodal image registration research has made significant advancements in the past few years, such as utilizing deep learning networks for feature extraction [24], modal transformation [25] (GAN), and end-to-end registration [26]. Deep learning methods often show superior performance. However, remote sensing image acquisition conditions—such as resolution, imaging conditions, and polarization factors—pose significant challenges. Existing methods struggle with a lack of diverse multimodal remote sensing images and generally display limited generalization abilities. Traditional methods for SAR-optical image registration continue to see widespread usage.
While carrying out heterologous image registration, the extraction of feature points and the screening of matching points are very important links. Only by effectively eliminating outliers in matching point pairs can a correct geometric transformation model be constructed. The prevalent technique for feature point extraction in contemporary heterologous image registration is the Block-Harris method [14]. This method efficiently extracts a substantial quantity of feature points. Next, it employs Non-Maximum Suppression (NMS) to filter the matching points [27]. Finally, RANSAC [28] is utilized to hypothesize a validation model to further eliminate outliers of matching point pairs [29]. RANSAC performs robustly when a majority of correct point pairs exist, but when the proportion of outliers increases, its performance will decrease significantly. Especially when the random distribution of outliers causes incorrect correspondences to be fitted, the computational burden of the algorithm increases, and produces an incorrect geometric transformation model. Fast Sample Consensus (FSC) [30] effectively improves the computational efficiency of RANSAC by optimizing sampling technology. In the past two years, some scholars have also proposed new methods to improve the accuracy of matching point pairs, such as One-Class SVM [31], and CSC [32] (Cascaded Sample Consensus).
In scenarios where ground objects in the observation area exhibit richness and significant structural and textural features, methods such as CFOG can proficiently achieve precise registration of SAR and optical heterologous images [14]. However, it is often necessary to process images with weak feature regions including land-water interface areas characterized by extensive water bodies and deserts with parse structural features in practical applications. At this juncture, the Block-Harris method, widely employed in heterologous image registration, primarily focuses on the importance of structural features and ignores regional variations in weaker feature objects. Consequently, several feature points will also be extracted on the water surface and the desert. These feature points are usually distributed randomly, and even if most of them are eliminated after the processing of regional feature matching and traditional NMS matching point screening, there are still often a few of false matching points remaining in weak feature regions. Their large geometric errors can easily reduce the accuracy of the geometric transformation model, which leads to a significant decrease in the performance of the traditional methods.
Therefore, a regional adaptive processing mechanism and a more comprehensive matching point screening criterion must be introduced into the registration method to determine whether the local region is a weak feature region such as water and desert, so as to control the number of feature points and matching points pairs in such feature regions. Meanwhile, since islands, sporadic villages, and roads are often scattered in a large area of images with weak feature regions, and such features are usually the effective feature regions for extracting highly reliable feature points and obtaining matching points, the use of a sloppy region determination criterion is likely to eliminate a small number of these effective feature regions. This could lead to a deficiency in the number of matching point pairs, thereby diminishing the precision of the geometric transformation model or potentially causing image mismatch.
To significantly improve the robustness of registration in weak feature regions, this paper focuses on two aspects, namely feature point extraction and matching point screening, and proposes a registration method based on region-adaptive keypoint selection that realizes high-precision registration of SAR and optical images with weak feature regions. First, the method adopts a dual threshold criterion of regional information entropy and variance product to effectively identify the weak feature regions. This method aims to avoid extracting the feature points in the weak feature regions while protecting the feature points present in the small number of effective feature regions as much as possible; furthermore, based on the MOGF (Multi-scale Oriented Gradient Fusion) [33] regional feature descriptor to generate similarity maps, a matching point screening method combining similarity map skewness and NMS is proposed, which not only effectively avoids generating false matching points in the weak feature regions such as waters and deserts, but also maximally preserves correct matching points in the effective feature regions such as islands, sporadic villages, and roads in a large area of the weak feature region.
The remainder of this paper is organized as follows: in Section 2, we elaborate on the framework of the registration method and the specific implementation of each processing step; in Section 3, we conduct experiments on different data and verify the effectiveness of the registration method based on region-adaptive keypoint selection by using subjective and objective evaluation criteria; in Section 4, we analyze the impact of key parameters on the registration performance and summarize the limitations of the method; finally, we present conclusions.
2. Method
Figure 1 illustrates the framework of the registration method proposed in the paper, which consists of three main parts: (i) region-adaptive feature point extraction; (ii) region feature matching (to obtain the similarity map); (iii) matching point screening. For a set of SAR-optical heterologous images, we first extract uniformly distributed feature points using the proposed VE-FAST (Variance and Entropy-Features from Accelerated Segment Test) feature point detection method. Following this, it determines the template area and the search area centered on the extracted feature points to construct feature descriptors that facilitate the generation of a similarity map. Finally, the proposed SNMS (combination of Skewness and NMS) matching point screening method is used to filter the false matching point pairs and build the correct geometric transformation model. The details of each process will be described in detail next.
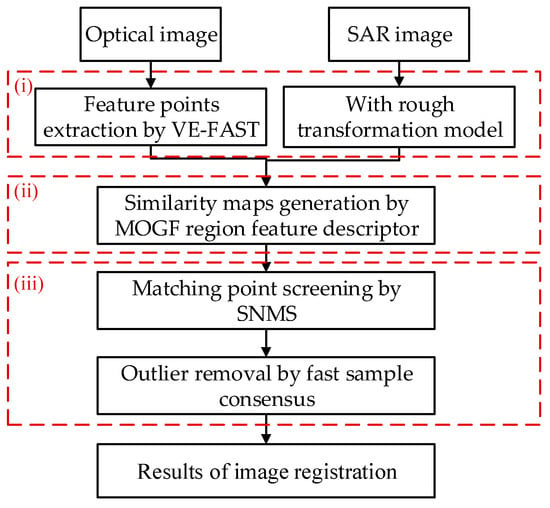
Figure 1.
The framework of the registration method based on region-adaptive keypoint selection.
2.1. Region-Adaptive Feature Point Extraction Based on VE-FAST
Image structural features mainly include edge features, corner point features, and contour features, while texture features mainly refer to statistical features, frequency domain features, and model features. As mentioned earlier, existing methods mostly rely on the structural features (e.g., edges and corner points) of an image for registration. However, when an image contains a large number of weak feature regions, the registration results of traditional methods tend to deviate from the expected ones. Given that the weak feature regions tend to exhibit uniform texture, this paper combines the texture features such as regional information entropy and variance. It introduces a region-adaptive feature point extraction method capable of recognizing the weak feature regions (such as waters, deserts, and other natural regions) and the effective feature regions (which mainly consist of man-made regions such as cities, and farmlands).
In the field of computer vision, there are several mature methods for the recognition of weak feature regions, such as using common image segmentation methods to directly distinguish between weak and effective feature regions. Although these methods can realize region adaptation in SAR-optical registration, their high computational effort is comparable to that of the registration methods, which is not suitable for efficient applications. Since the region-adaptive feature point extraction for SAR-optical registration only needs to extract uniformly distributed feature points in the effective feature region without considering the rotational and scale differences between heterologous remote sensing images, this paper chooses to base the feature point detection on optical images to circumvent the interference of the multiplicative speckle noise of the SAR images on the feature point operator. Commonly used corner detection methods include the Harris operator, the DOG operator in SIFT, and the FAST algorithm in ORB. Among them, the FAST algorithm is fast and has high localization accuracy, which can be applied to feature matching of heterologous images. However, it is prone to clustering phenomenon; therefore, this paper introduces the blocking strategy and combines the texture features including information entropy and variance. Then this paper proposes the VE-FAST method, which has high computational efficiency and registration performance while maintaining uniformity in the spatial distribution of feature points. The method flow chart is shown in Figure 2.
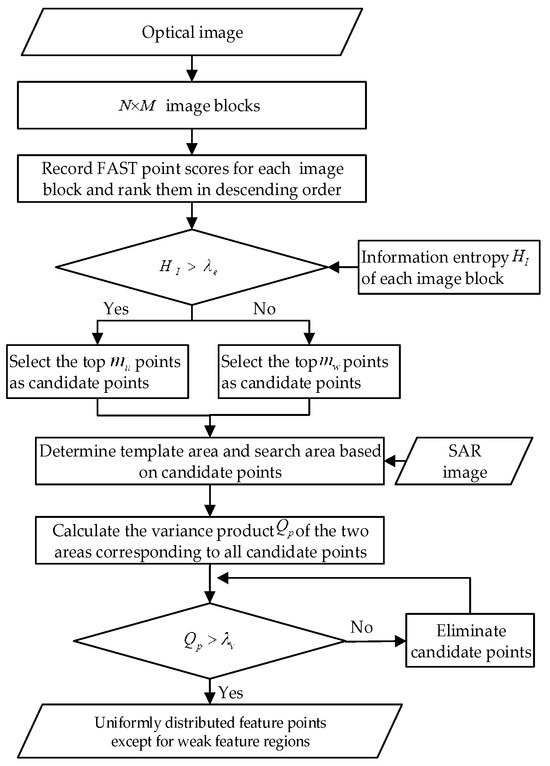
Figure 2.
The flow chart of VE-FAST.
The method first introduces the blocking strategy of UND-Harris [34] operator, which divides the image into image blocks, detects the FAST features individually for each image block, records all the FAST point scores, and arranges them in descending order. According to the information theory approach, let an image with gray levels, where the probability of the occurrence of the th () gray level is , then each pixel band has the amount of information , and the information entropy of each image block can be calculated according to Formula (1). The size of the information entropy reflects the texture transformation of each image block, and the information entropy of the weak feature region is usually small. For each image block with information entropy larger than the set threshold , the first points are selected as candidate points, and to avoid the effective feature region of a small area being neglected, candidate points are extracted from the image blocks that do not satisfy the set threshold of information entropy. Then the number of candidate points ranges from .
Next, for the problem that there are also a small number of candidate points in the weak feature region, the simple texture feature of image variance is introduced, and for a region of size , the variance is computed by Formula (2):
where is the pixel average of the image, given by (3).
Here, we choose to directly utilize the template area and search area determined by the candidate points, calculate the variance of the two areas corresponding to each candidate point, and then construct the variance product for the candidate points from Formula (4). If the variance of both the optical image and SAR image area where the candidate point is located is small, then the variance product does not satisfy the threshold , which means that the grayscale change of the image in the area where the candidate point is located is not obvious. Therefore, the quality of this candidate point is considered poor, and it is not suitable to be used as a feature point for the subsequent descriptor construction.
In the above formula, is the variance of the template area, is the minimum value of the variance of the template area, is the maximum value of the variance of the template area, is the variance of the search area, is the minimum value of the variance of the search area, is the maximum value of the variance of the search area.
The result of VE-FAST using the variance product to exclude the weak feature region and outputting the final feature points is shown in Figure 3. It can be seen that the blue candidate points located in the weak feature region have a lower variance product value, which is basically eliminated so as to realize the region-adaptive feature point extraction, but there may still be false feature points due to the threshold setting marked in yellow in Figure 3, which will be screened out by the SNMS method used subsequently.
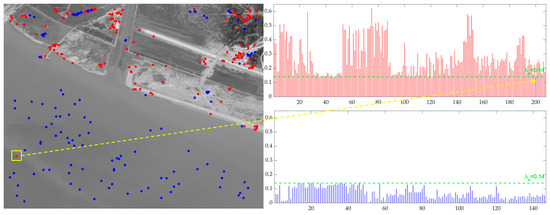
Figure 3.
Example of VE-FAST feature point extraction process. The left figure shows the distribution of candidate points, where the red points represent the candidate points selected as feature points and the blue points represent the eliminated candidate points. The red histogram on the right shows the variance product value of the red points and the blue histogram on the right shows the variance product value of the blue points. The feature point in the yellow square is the false feature point, and the yellow arrow points to its corresponding variance product value.
In this paper, three sets of images are used for experiments and compared with FAST, Block-FAST, and Block-Harris methods. The final feature point extraction results obtained are shown in Figure 4. Block-Harris has better detection performance when the whole image texture feature information is rich, and it is used by many heterologous image registration methods. But when feature points are extracted from images containing a large number of weak feature regions, it will appear as shown in Figure 4, which shows that many feature points extracted by Block-Harris are distributed in the weak feature regions. FAST is one of the popular feature detection operators, which is fast and has high localization accuracy, but it is prone to the clustering phenomenon shown in Figure 4, and the distribution of feature points is too centralized, which will affect the accuracy of the subsequent geometrical model solving, whereas Block-FAST, which introduces the blocking strategy, suffers from the same problem as Block-Harris. In contrast, the VE-FAST method proposed in this paper can ensure that the feature points are uniformly distributed in the effective feature region, while almost no feature points are extracted in the weak feature region.
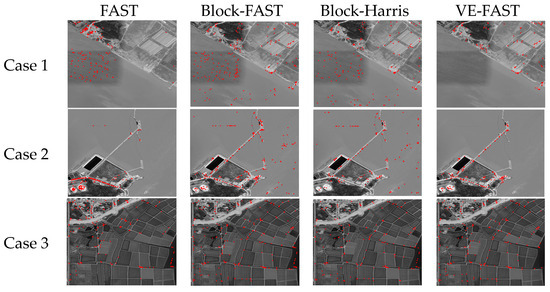
Figure 4.
Comparison of FAST, Block-FAST, Block-Harris, and VE-FAST feature point extraction. The red dots represent the feature points obtained by each feature point extraction algorithm.
This paper quantitatively analyzes the extraction effect of the four feature extraction methods on the above three sets of images from three criteria: the number of effective feature points (NEFP), the total number of feature points (TNFP), and the effective ratio (ER). The results are shown in Table 1, which shows that the feature points extracted by VE-FAST are basically all effective feature points.

Table 1.
Quantitative analysis results of feature point extraction.
Figure 5 shows the run time of the four feature point extraction methods for different image sizes (from to ). All the experiments are conducted on Intel i9-13900HX 2200 MHz and 32 G RAM PC. It can be seen that VE-FAST outperforms Block-Harris, is slightly lower than the FAST and Block-FAST, and has high computational efficiency.
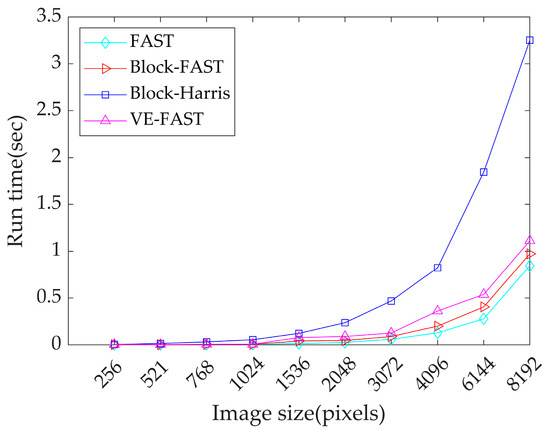
Figure 5.
Run time of FAST, Block-Fast, Block-Harris, and VE-FAST.
2.2. Similarity Map Generation Based on Region Feature Matching
The template matching method needs to construct feature descriptors for the template area of the reference optical image and the search area of the SAR image to be matched, respectively, after the feature points are extracted. Considering that the scale and rotation differences between images have been basically eliminated based on the geometric parameters of the system, the single-scale MOGF descriptor is selected in this paper, which has better computational efficiency and registration performance.
The gradients and of the image in the and directions are first obtained using filters. Considering the robustness of the method, the Sobel operator, which takes into account a combination of factors, is chosen to extract the gradient information for optical images, and the ROEWA operator proposed in the literature [35] is chosen for SAR images due to the effect of multiplicative speckle noise.
The gradient magnitude and gradient orientation of the image can be calculated by using Formulas (5) and (6).
Then the weighted gradient magnitudes and are obtained using Formula (7).
is the image pixel right feature orientation. The definition is given by (8):
where ⌊ ⌋ denotes the downward rounding operator. The gradient orientation is divided into equal parts to obtain the angular interval .
A statistical window is set on the weighted gradient magnitude to form a feature vector for each image pixel, which is then aligned along the z-axis to form a 3D dense structure feature descriptor. Then we choose the Sum of Squared Difference (SSD) between the descriptors as the similarity measure. The formula of SSD is as follows:
where denotes the MOGF descriptor of the template area corresponding to the reference optical image, and denotes the MOGF descriptor of the search area corresponding to the SAR image to be matched; and the variable denotes the offset vector of the search area relative to the center pixel of the search area.
When is the smallest, it corresponds to the best matching position. Thus, the search problem for matching points is converted to compute the offset vector , which minimizes .
Since is a constant, it can be neglected in the calculation, and the latter two terms are converted to the frequency domain using FFT.
In Formula (11), the first term on the right side of the equation represents the autocorrelation of the SAR images to be matched. For the normalized descriptor, this term is close to a constant and has little effect on the subsequent calculations, so it finally simplifies to:
The Formula (12) generates a similarity map, and matching points can be identified by locating the position of the maximum value in the similarity map.
2.3. SNMS-Assisted Matching Point Screening
Matching point screening is crucial to the construction of the geometric transformation model, and the abnormal outliers may lead to a decrease in registration accuracy or even wrong matching. After obtaining the similarity map, NMS is performed and high-quality matching points can be effectively extracted in general feature-rich regions. However, when a small number of false feature points are located in the weak feature region, as shown in Figure 6e–h, the similarity map usually exhibits the characteristics of multiple peaks and random chaos. The histogram is symmetric on the left and right sides, and the data are concentrated on the mean sides, which cannot be effectively removed only by using the traditional NMS.
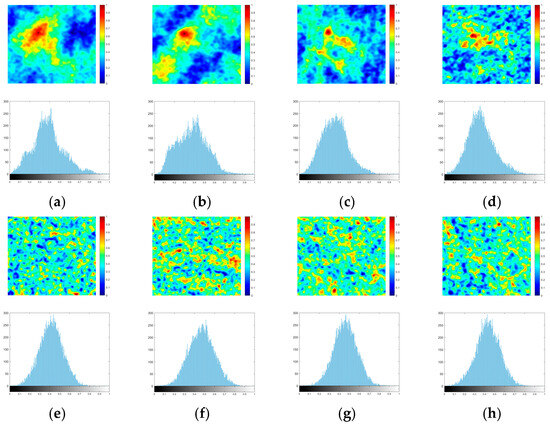
Figure 6.
Comparison of similarity maps and histograms for correct matching points and false matching points. (a–d) Correct matching points; (e–h) false matching points. The first and third rows are normalized similarity maps, and the second and fourth rows are the corresponding histograms.
The conventional method uses NMS to solve the multi-peak problem of the similarity maps [6], however, since the ratio of its primary and secondary peaks is higher than a set threshold and the primary and secondary peaks are far away from each other, the matching points in weak feature regions cannot be effectively eliminated by NMS alone, thus a set of false matching points are incorrectly obtained. On the basis of applying NMS, we further analyze the histogram parameters of the similarity map, calculate its skewness index, and propose the SNMS matching point screening strategy that combines the skewness of the similarity map with NMS. The method achieves the fast screening of the matching points by taking feature consistency as the criterion and finally uses FSC to reject outliers that are inconsistent in geometric relationships. The FSC can stably extract correct matching point pairs, with fewer iterations and higher computational efficiency compared to the RANSC. The overall processing flowchart is shown in Figure 7.
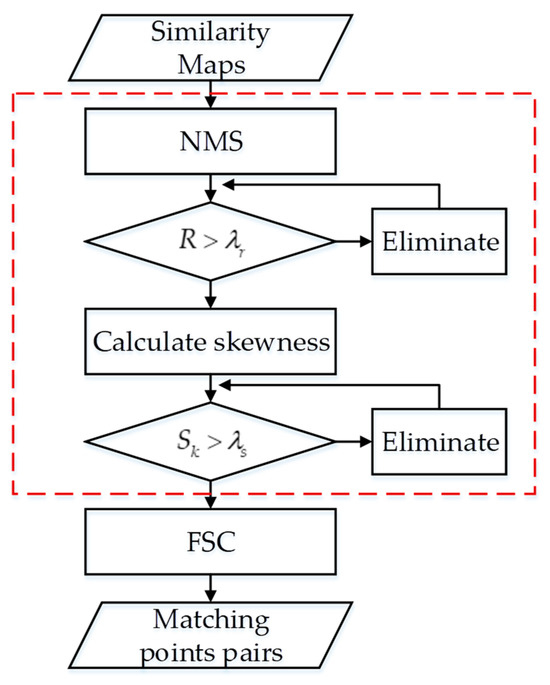
Figure 7.
SNMS flowchart.
The traditional NMS needs to find the primary peak and secondary peak through iteration, which is time-consuming, so this paper adopts a simplified NMS. First, the similarity map is normalized by Formula (13), and converted to a 0–1 grayscale map . Then the peak of the similarity map is found to serve as the primary peak , and the width of the non-searching window is set centered on the peak. After that, the peak of the similarity map outside the non-searching window is found to serve as the secondary peak , as shown in Figure 8. Finally, the primary and secondary peak windows are set centered on the primary and secondary peaks, respectively, with the width , and the Intersection over Union (IoU) of the two windows is calculated.
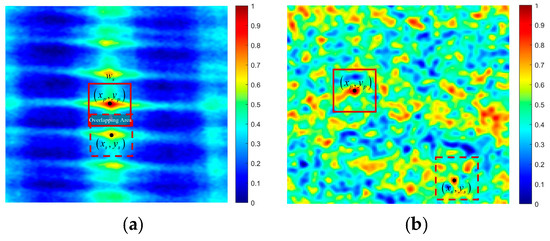
Figure 8.
Simplified NMS example. (a) NMS of the correct matching point; (b) NMS of the false matching point.
In the above formula, is the minimum value of the similarity map and is the maximum value of the similarity map.
When the primary and secondary peak ratio is small, it indicates that the primary and secondary peaks are less differentiated, and the similarity map is less reliable at this time. When IoU is small, it indicates that the secondary peak is farther away from the primary peak, and the similarity map is more reliable. Therefore, the primary and secondary peak ratio is redefined here by Formula (14):
where is the machine epsilon introduced to prevent from being 0, which is a number close to 0 but greater than 0. When is larger than the set threshold , the similarity map is considered reliable, thus outputting the matching points.
However, for false matching points distributed in weak feature regions, such as the case of Figure 8b, they cannot be screened out by the above NMS alone, so in this paper, with reference to the processing idea of medical images, we start from the histogram parameter of the similarity map and further eliminate the false matching points by calculating the skewness. The results of Figure 6 show that the histogram of the correct matching point’s similarity map has a longer tail on the right side and a shorter tail on the left side, with most of the data concentrated on the left side showing an overall right skewness, while the histogram of the false matching point’s similarity map is basically symmetric on the left and right sides, namely, zero skewness, eventually showing a left skewness with a longer tail on the left side and shorter tail on the right side.
The skewness of the similarity map can be calculated through Formula (15):
where is the mean, is the th element, and is the number of samples.

Table 2.
Skewness values for correct and false matching points. The (a)–(h) corresponds to Figure 6.
The difference in the similarity map skewness values between the correct matching points and the false matching points is significant, and when the skewness of the similarity map is lower than the skewness threshold , the matching points corresponding to the similarity map are considered to be false which are not outputted to form the final matching point pairs. Thus, the false matching points in Figure 3 can be screened out. The final result is shown in Figure 9, which shows that the points in the weak feature region are eliminated.

Figure 9.
Example of SNMS-based matching point pair outputs. The red dots represent the feature points obtained by VE-FAST.
3. Results
In this section, the proposed method is validated based on a general dataset and typical weak feature region data, and some selected data are compared with the most representative methods at present, including CFOG [14], LNIFT [16], OS-SIFT [20], and FED-HOPC [23]. All the experiments are conducted in the working environment as shown in Table 3.

Table 3.
The working environment of all the experiments.
3.1. Experimental Data and Evaluation Criteria
To comprehensively evaluate the performance of the proposed method, this paper uses fifty sets of regular feature region images from the OS dataset [36] and six sets of typical images with weak feature regions, respectively.
The OS dataset consists of SAR images from GF-3 and optical images from Google Earth with an image pixel size of . These image pairs mainly cover the three scene types urban, suburban, and rural (as shown in Figure 10). The data in the OS dataset are structural feature-rich images.
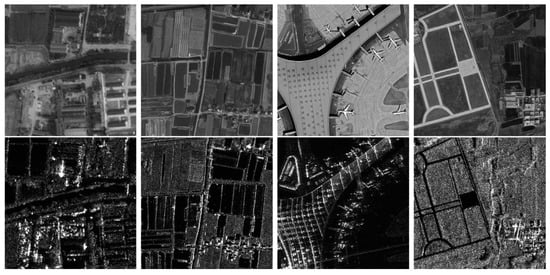
Figure 10.
Example of OS-dataset partial data.
Six sets of representative weak feature region images are selected to evaluate the region adaptivity of the method, as depicted in Figure 11. Each image pair is localized at the system level by the sensor parameters, initially eliminating rotational and scale differences.
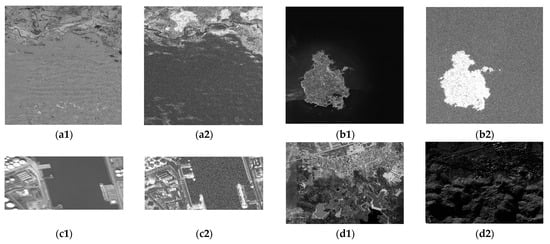

Figure 11.
Six sets of weak feature region images. (a1–f1) Optical images of case A–F; (a2–f2) SAR images of case A–F.
The six sets of images selected contain a variety of weak feature regions such as islands, harbors, etc., with detailed information as shown in Table 4.

Table 4.
Specific information description of six sets of weak feature region images corresponding to Figure 11.
The main parameter settings of the proposed method are shown in Table 5. Each comparison method in the experiment is implemented according to the open-source code provided by the authors. The most critical parameters are the variance product threshold parameter and the skewness threshold parameter . The range of settings for the two parameters is not stringent, mainly because points that are not eliminated by variance product threshold are successfully eliminated in subsequent skewness threshold sessions. From Figure 3, it can be seen that when the variance product threshold is set to 0.14, it is basically able to eliminate the points located in the weak feature region, but there are still a few points that are not eliminated. These uneliminated points are located in the weak feature region and their generated similarity map skewness value is almost close to 0, so they will be eliminated under the skewness threshold. Combining the analysis in Figure 6 and Table 2, we can observe that there is a significant difference in the skewness value between the similarity maps of weak feature regions and those of effective feature regions, with the skewness value of the similarity maps for weak feature regions generally less than 0.05. To ensure the wide applicability of the method, this paper sets a relatively loose skewness threshold value of 0.1.

Table 5.
The experimental parameter settings of the proposed method.
In this paper, Root Mean Squared Error (RMSE) and Correct Match Rate (CMR) are used as the evaluation criteria for registration accuracy. RMSE is the average of the Euclidean distances between the matching result and the true position, which is computed as (16):
where is the number of correct matching points, is the number of all output matching points. and are the coordinates of matching points and true points, respectively.
CMR is the ratio of the correct matching points to all the matching points, which is computed as (17). In this experiment, Euclidean distances of less than 3 pixels are defined as the correct matching.
3.2. Comparison of Registration Experiments
In this paper, the effectiveness of the proposed method is analyzed using the above experimental data. The method is experimented with and compared to several state-of-the-art heterologous image registration methods, which are combinations of feature point extraction and template matching. Among them, the FED-HOPC proposes a region-aware phase descriptor, which can deal with remote sensing images with significant regional differences; the OS-SITF proposes the use of a multi-scale Sobel operator and ROEWA operator to compute the gradient of optical and SAR images, respectively; the feature descriptor adopted in this paper is similar to CFOG, which also utilizes the image gradient magnitude and orientation information to construct the 3D dense structure features; LNIFT is computationally efficient and suitable for real-time registration tasks. Each method in the experiment is implemented according to the open-source code provided by the authors.
3.2.1. Registration Comparison Results for OS-Dataset
For the verification of the wide applicability of the proposed method in rich feature scenes, 50 pairs of images from the OS dataset are randomly selected for the experiments. Figure 12 shows the results of the quantitative evaluation from both CMR and RMSE. In Figure 12b, the symbol represents the pairs of images that fail to match as well as those that have an RMSE greater than 9 pixels.
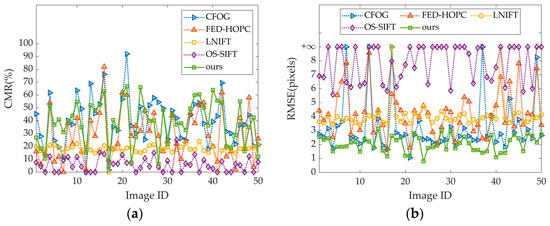
Figure 12.
Comparison of registration results based on OS dataset. (a) Comparison of CMR for five methods; (b) comparison of RMSE for five methods.
Table 6 shows the average results of the five methods for the three criteria of CMR, RMSE, and run time.

Table 6.
Evaluation criteria of the five methods.
The results of the CFOG are represented by the blue dashed line in Figure 12, with an average CMR of 42.64% and an average RMSE of 3.26 pixels. CFOG uses pixel-level feature descriptors for structural similarity representation with excellent registration accuracy and also uses FFT acceleration for high registration efficiency.
The orange dashed line represents the results of the FED-HOPC, which has a slightly lower overall registration efficiency compared to other methods due to the use of the NCC similarity measure, although the speed of NCC computation has been significantly improved by FFT. It has a lower registration accuracy with an average CMR of 31.43% and an average RMSE of 4.23 pixels, but its proposed adaptive feature point extraction method based on WED is of great research significance.
The results of the LNIFT method are marked in yellow, and its average run time is around 0.3 s. The method proposes a locally normalized image feature transform, which can achieve multi-source image registration simply and efficiently with high registration efficiency. However, since it is an algorithm for the registration of multiple image sources such as optical images, infrared images, SAR images, etc., considering the compatibility, it cannot achieve a better registration accuracy when dealing with SAR-optical image registration.
The OS-SIFT method is inefficient in registration, and the multi-scale space it constructs makes the computational resources increase dramatically. With an average CMR of 5.93% and an average RMSE of 7.85 pixels, the registration accuracy is the worst, mainly because the method cannot attenuate the NRDs between SAR and optical images.
The method proposed (marked by the green solid line) is mainly used to accurately perform the registration of images with weak feature regions, but it also has good registration results in general structural feature-rich images, with the average CMR and RMSE second to the CFOG which has the best results.
3.2.2. Regional Adaptation Results for Weak Feature Regions
As can be seen from the experimental results in the previous section, most of the currently popular methods can effectively achieve high-precision registration of SAR-optical heterologous images when the experimental image structure and texture features are more significant. However, when processing images with weak feature regions such as those shown in Figure 11, for example, the waters in the SAR images show large black untextured areas, while the optical images can show complex water surface ripples. This difference leads to a significant decrease in the registration performance of the traditional methods for extracting the feature points in weak feature regions.
In this paper, the method presents a region-adaptive feature point extraction alongside a more comprehensive matching point screening criterion. This ensures that the resultant matching points are excluded from weak feature regions, while simultaneously maximizing the retention of matching points in effective feature regions, such as “isolated islands” on a water surface, to realize the registration of effective feature regions in the entire image. The “isolated island” problem mainly refers to the fact that small effective feature regions in the image are ignored by the blocking strategy and texture thresholding, resulting in the lack of corresponding feature points in these regions, which in turn affects the registration accuracy. For the case of “isolated islands” shown in Table 4 of cases E and F, the method proposed can also realize good registration for each effective feature region. Taking cases E and F as an example, the following table shows the change in the point number of the two images after being processed by each registration process in this paper.
Traditional feature extraction methods are prone to clustering phenomenon, which reduces the registration accuracy and increases the redundant information. The introduction of a blocking strategy can make the distribution of feature points more uniform but introduces the problem of false feature points in the weak feature region. The VE-FAST proposed introduces a blocking strategy while considering the information entropy to ensure the uniform distribution of feature points in the effective feature regions and uses the variance product to eliminate feature points in weak feature regions. The SNMS finally adopted can further screen the matching points that may exist in the weak feature regions, thereby improving the registration accuracy. By synthesizing the findings presented in Table 7 and Figure 13, it becomes apparent that the conclusive output of matching point pairs is predominantly located within efficient feature regions, such as the mainland and islands, whereas there is an absence of matching point pairs in weak feature regions like the water area.

Table 7.
Variation of the point number in the registration process for different feature regions.
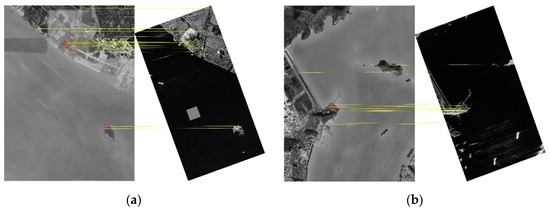
Figure 13.
Distribution of final matching point pairs. (a) Case E matching point distribution; (b) case F matching point distribution.
The final registration splicing effect of the above two sets of experimental images is shown in Figure 14, which shows that accurate correspondence between the optical and SAR images has been established in all regions.
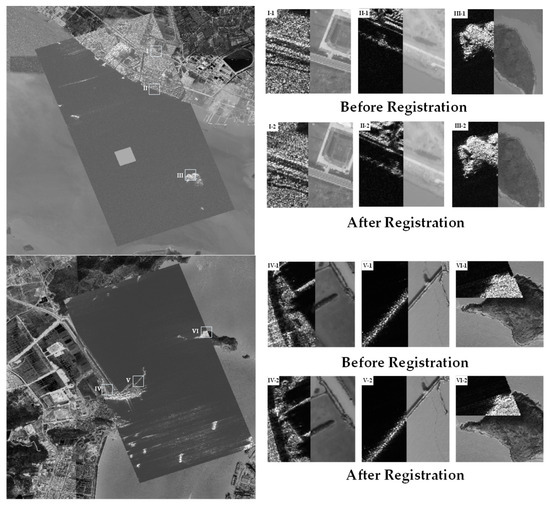
Figure 14.
Comparison of registration results for “isolated islands” case E and F. I-1 to III-1 are localized images of case E before registration, and I-2 to III-2 are localized images of case E after registration. IV-1 to VI-1 are localized images of case F before registration, and IV-2 to VI-2 are localized images of case F after registration.
3.2.3. Registration Comparison Results for Images with Weak Feature Regions
To verify the effectiveness of the proposed method on weak feature regions, we select images with weak feature regions from case A–E, as illustrated in Figure 11, for comparative experiments. The processing results of the five methods under different weak feature regions are shown in Figure 15, where the symbol represents the experimental images that fail to be successfully matched and have RMSE greater than 9 pixels.
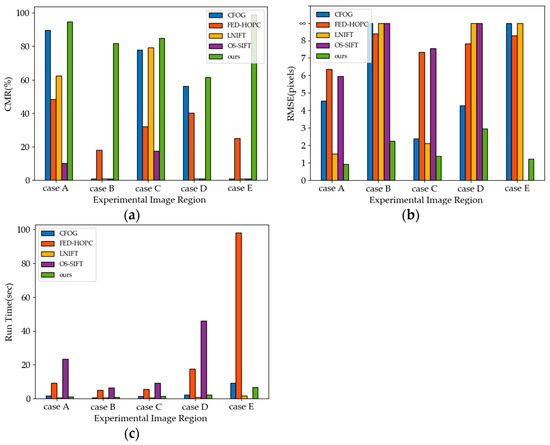
Figure 15.
Registration results of five methods in the weak feature region. (a) CMR comparison results; (b) RMSE comparison results; (c) run time comparison results.
In terms of run time, the LNIFT has the highest registration efficiency, the proposed method in this paper closely resembles CFOG, while the FED-HOPC and OS-SIFT are less efficient. From the aspect of registration accuracy, in weak feature regions such as deserts, islands, harbors, and forests, the proposed method can achieve better registration, and the FED-HOPC with region awareness is also able to complete registration, but with lower accuracy and efficiency. The registration performance of CFOG is close to the method we proposed, but it fails to match in one region due to the fact that some of the erroneous feature points are extracted in weak feature regions in the island images and fail to be eliminated in the matching point screening.
Especially for case E, the “isolated islands”, the OS-SIFT fails to execute effectively and does not properly extract feature points; the LNIFT directly identifies incorrect feature points and is incapable of generating the appropriate geometric transformation model. Conversely, the FED-HOPC, which is tailored for images with a significant proportion of watersheds, can construct the correct geometric transformation model; however, it suffers from diminished registration accuracy. Furthermore, the majority of matching point pairs obtained through CFOG are distributed randomly within weak feature regions, hindering the ability to develop a valid geometric transformation model, and ultimately leading to registration failures.
Figure 16 shows the registration results of this paper’s method in four typical weak feature regions in cases A–D using a checkerboard diagram. The proposed method effectively accomplishes the registration task in all four sets of experimental images.
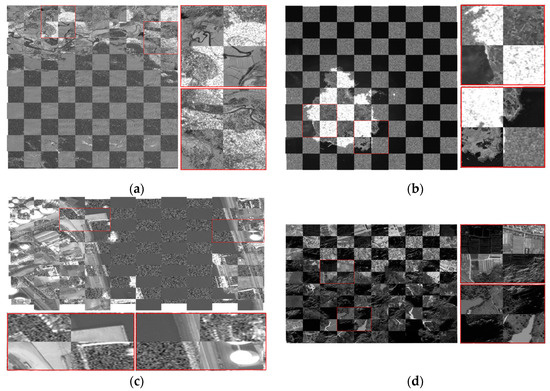
Figure 16.
Registration checkerboard results of this paper’s method under typical weak feature regions. (a) Registration results for desert scene; (b) registration results for island scene; (c) registration results for harbor scene; (d) registration results for forest scene.
4. Discussion
In the preceding section of this paper, the registration experiments conducted on multiple sets of authentic SAR images and optical images clearly illustrate that the proposed method exhibits considerable superiority regarding both registration precision and operational efficiency. Based on the experimental images provided, we now concentrate on evaluating how the number of candidate points affects registration performance. Figure 17 shows the changes in CMR, RMSE, and run time with the number of candidate points, which provides an important reference for further optimizing the registration performance.
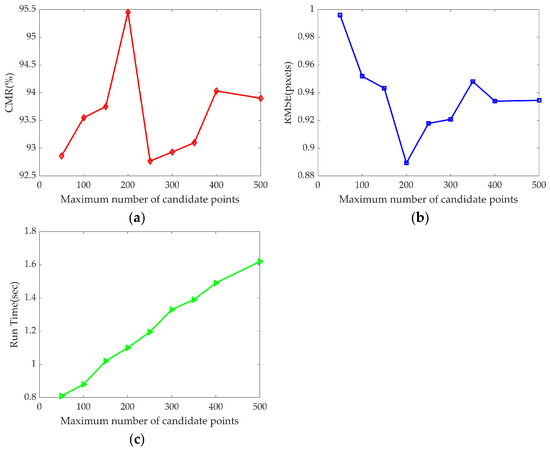
Figure 17.
Impact of the number of candidate points on registration performance. (a) CMR changes; (b) RMSE changes; (c) run time changes.
The choice in the previous experiments is to divide the experimental image into blocks, the information entropy satisfies the threshold of the image block to extract 8 candidate points, and does not satisfy the threshold to extract candidate points, so that the number of candidate points obtained is . For the same set of experimental images, blocks are fixed, candidate points are extracted for those meeting the information entropy threshold, while candidate points arise for those that do not satisfy the threshold, where . Figure 17 has the maximum number of candidate points as the horizontal axis. When corresponds to the best CMR and RMSE results, as well as faster registration efficiency. However, this does not mean that any experimental images select this parameter for registration. In fact, when the image size is large, the number of candidate points can be increased appropriately, but it will relatively bring about a decrease in the registration efficiency, so one must strike a balance between registration accuracy and efficiency to determine the appropriate parameter.
For the limitations and applicability of the method, it shows good registration results in our currently available images with weak feature regions. However, since our current method does not have rotation and scale invariance, the method may not be able to obtain the correct matching point pairs when dealing with optical and SAR images with large rotation and scale differences, which may lead to registration failure. Besides the two keypoint selection aspects of feature point extraction and matching point screening, the universal region feature matching modules do not show robust performance for weak feature regions. Up to now, there is no authoritative literature published on matching modules for weak feature regions, and addressing these limitations will be a priority for our upcoming research efforts.
5. Conclusions
This paper presents a robust registration method for SAR-optical images based on region-adaptive keypoint selection. It addresses performance degradation in registering heterologous images with weak feature regions. This degradation occurs due to varying sensor imaging mechanisms and differences in ground object scattering. The proposed method employs a blocking strategy and integrates texture features like image information entropy and variance with the FAST algorithm. Additionally, it introduces an anti-clustering VE-FAST feature point extraction technique to effectively identify weak feature regions. MOGF descriptors are then constructed from the feature points to create similarity maps. Finally, the method uses SNMS combined with skewness to filter matching points, resulting in highly reliable heterologous image registration. Compared to traditional methods, this approach demonstrates strong adaptability in both standard SAR-optical images and SAR-optical images with weak feature regions.
Nevertheless, it presents limitations, particularly in key parameter settings, such as the number of candidate points. Future research will explore strategies for adaptively selecting appropriate block segments based on image characteristics.
Author Contributions
All the authors made significant contributions to the work. K.Z. and A.Y. carried out the experiment framework. K.Z., A.Y. and W.T. processed the experiment data; K.Z. wrote the manuscript; K.Z. and A.Y. analyzed the data; Z.D. gave insightful suggestions for the work and the manuscript. All authors have read and agreed to the published version of the manuscript.
Funding
This research received no external funding.
Data Availability Statement
The raw data supporting the conclusions of this article will be made available by the authors on request.
Acknowledgments
The authors would like to thank all the anonymous reviewers for their valuable comments and helpful suggestions which led to substantial improvements in this paper.
Conflicts of Interest
The authors declare no conflicts of interest.
References
- Ma, Y.; Li, C.; Jiao, L. Infrared and visible image fusion methods and applications: A survey. Inf. Fusion. 2019, 45, 153–178. [Google Scholar] [CrossRef]
- Wu, Y.; Liu, J.-W.; Zhu, C.-Z.; Bai, Z.-F.; Miao, Q.-G.; Ma, W.-P.; Gong, M.-G. Computational Intelligence in Remote Sensing Image Registration: A Survey. Int. J. Autom. Comput. 2021, 18, 1–17. [Google Scholar] [CrossRef]
- Zhang, X.; Leng, C.; Hong, Y.; Pei, Z.; Cheng, I.; Basu, A. Multimodal Remote Sensing Image Registration Methods and Advancements: A Survey. Remote Sens. 2021, 13, 5128. [Google Scholar] [CrossRef]
- Lu, H.; Gao, L. Improved Algorithm for Multi-source Remote Sensing Images Based on Cross Correlation. Aerosp. Control. 2009, 27, 18–21. [Google Scholar]
- Flynn, T.; Tabb, M.; Carande, R. Coherence Region Shape Extraction for Vegetation Parameter Estimation in Polarimetric SAR Interferometry. In Proceedings of the IEEE International Geoscience and Remote Sensing Symposium, Toronto, ON, Canada, 24–28 June 2002. [Google Scholar]
- Wang, Z.; Yu, A.; Dong, Z.; Zhang, B.; Chen, X. Performance Evaluation of Interest Point Detectors for Heterologous Image Matching. Remote Sens. 2022, 14, 3724. [Google Scholar] [CrossRef]
- Yu, Q.; Ni, D.; Jiang, Y.; Yan, Y.; An, J.; Sun, T. Universal SAR and Optical Image Registration via a Novel SIFT Framework Based on Nonlinear Diffusion and a Polar Spatial-Frequency Descriptor. ISPRS J. Photogramm. Remote Sens. 2021, 171, 1–17. [Google Scholar] [CrossRef]
- Harris, C.; Stephens, M. A Combined Corner and Edge Detector. In Proceedings of the Alvey Vision Conference, Manchester, UK, 15–17 September 1988; Alvey Vision Club: Manchester, UK, 1988. [Google Scholar]
- Rublee, E.; Rabaud, V.; Konolige, K.; Bradski, G. ORB: An efficient alternative to SIFT or SURF. In Proceedings of the 2011 International Conference on Computer Vision, Barcelona, Spain, 6–13 November 2011. [Google Scholar]
- Sharma, S.K.; Jain, K. Image Stitching Using AKAZE Features. J. Indian Soc. Remote Sens. 2020, 48, 1389–1401. [Google Scholar] [CrossRef]
- Lowe, D.G. Distinctive Image Features from Scale-Invariant Keypoints. Int. J. Comput. Vis. 2004, 60, 91–110. [Google Scholar] [CrossRef]
- Li, J.; Hu, Q.; Ai, M. RIFT: Multi-Modal Image Matching Based on Radiation-Variation Insensitive Feature Transform. IEEE Trans. Image Process. 2020, 29, 3296–3310. [Google Scholar] [CrossRef]
- Liu, X.; Ai, Y.; Zhang, J.; Wang, Z. A Novel Affine and Contrast Invariant Descriptor for Infrared and Visible Image Registration. Remote Sens. 2018, 10, 658. [Google Scholar] [CrossRef]
- Ye, Y.; Bruzzone, L.; Shan, J.; Bovolo, F.; Zhu, Q. Fast and Robust Matching for Multimodal Remote Sensing Image Registration. IEEE Trans. Geosci. Remote Sens. 2019, 57, 9059–9070. [Google Scholar] [CrossRef]
- Fan, Z.; Zhang, L. A fast matching method of SAR and optical images using angular weighted oriented gradients. Acta Geod. Cartogr. Sin. 2021, 50, 1390–1403. [Google Scholar] [CrossRef]
- Li, J.; Xu, W.; Shi, P.; Zhang, Y.; Hu, Q. LNIFT: Locally Normalized Image for Rotation Invariant Multimodal Feature Matching. IEEE Trans. Geosci. Remote Sens. 2022, 60, 1–14. [Google Scholar] [CrossRef]
- Li, J.; Hu, Q.; Zhang, Y. Multimodal Image Matching: A Scale-Invariant Algorithm and an Open Dataset. ISPRS J. Photogramm. Remote Sens. 2023, 204, 77–88. [Google Scholar] [CrossRef]
- He, J.; Jiang, X.; Hao, Z.; Zhu, M.; Gao, W.; Liu, S. LPHOG: A Line Feature and Point Feature Combined Rotation Invariant Method for Heterologous Image Registration. Remote Sens. 2023, 15, 4548. [Google Scholar] [CrossRef]
- Ma, W.; Wen, Z.; Wu, Y.; Jiao, L.; Gong, M.; Zheng, Y.; Liu, L. Remote Sensing Image Registration with Modified SIFT and Enhanced Feature Matching. IEEE Geosci. Remote Sens. Lett. 2017, 14, 3–7. [Google Scholar] [CrossRef]
- Xiang, Y.; Wang, F.; You, H. OS-SIFT: A Robust SIFT-Like Algorithm for High-Resolution Optical-to-SAR Image Registration in Suburban Areas. IEEE Trans. Geosci. Remote Sens. 2018, 56, 3078–3090. [Google Scholar] [CrossRef]
- Pang, S.; Ge, J.; Hu, L.; Guo, K.; Zheng, Y.; Zheng, C.; Zhang, W.; Liang, J. RTV-SIFT: Harnessing Structure Information for Robust Optical and SAR Image Registration. Remote Sens. 2023, 15, 4476. [Google Scholar] [CrossRef]
- Ye, Y.; Shan, J.; Bruzzone, L.; Shen, L. Robust Registration of Multimodal Remote Sensing Images Based on Structural Similarity. IEEE Trans. Geosci. Remote Sens. 2017, 55, 2941–2958. [Google Scholar] [CrossRef]
- Ye, Y.; Wang, Q.; Zhao, H.; Teng, X.; Bian, Y.; Li, Z. Fast and Robust Optical-to-SAR Remote Sensing Image Registration Using Region-Aware Phase Descriptor. IEEE Trans. Geosci. Remote Sens. 2024, 62, 1–12. [Google Scholar] [CrossRef]
- Quan, D.; Wei, H.; Wang, S.; Lei, R.; Duan, B.; Li, Y.; Hou, B.; Jiao, L. Self-Distillation Feature Learning Network for Optical and SAR Image Registration. IEEE Trans. Geosci. Remote Sens. 2022, 60, 1–18. [Google Scholar] [CrossRef]
- Tan, D.; Liu, Y.; Li, G.; Yao, L.; Sun, S.; He, Y. Serial GANs: A Feature-Preserving Heterogeneous Remote Sensing Image Transformation Model. Remote Sens. 2021, 13, 3968. [Google Scholar] [CrossRef]
- Ye, Y.; Tang, T.; Zhu, B.; Yang, C.; Li, B.; Hao, S. A Multiscale Framework with Unsupervised Learning for Remote Sensing Image Registration. IEEE Trans. Geosci. Remote Sens. 2022, 60, 1–15. [Google Scholar] [CrossRef]
- Li, S.; Lv, X.; Ren, J.; Li, J. A Robust 3D Density Descriptor Based on Histogram of Oriented Primary Edge Structure for SAR and Optical Image Co-Registration. Remote Sens. 2022, 14, 630. [Google Scholar] [CrossRef]
- Fischler, M.A.; Firschein, O. (Eds.) Random Sample Consensus: A Paradigm for Model Fitting with Applications to Image Analysis and Automated Cartography; Readings in Computer Vision; Morgan Kaufmann: San Francisco, CA, USA, 1987; pp. 726–740. [Google Scholar]
- Ghosh, D.; Kaabouch, N.; Semke, W. Super-Resolution Mosaicing of Unmanned Aircraft System (UAS) Surveillance Video Frames. Int. J. Sci. Eng. Res. 2013, 4, 1–9. [Google Scholar]
- Wu, Y.; Ma, W.; Gong, M.; Su, L.; Jiao, L. A Novel Point-Matching Algorithm Based on Fast Sample Consensus for Image Registration. IEEE Geosci. Remote Sens. Lett. 2015, 12, 43–47. [Google Scholar] [CrossRef]
- Li, Z.; Zhang, H.; Huang, Y.; Li, H. A Robust Strategy for Large-Size Optical and SAR Image Registration. Remote Sens. 2022, 14, 3012. [Google Scholar] [CrossRef]
- Zhang, X.; Wang, Y.; Liu, H. Robust Optical and SAR Image Registration Based on OS-SIFT and Cascaded Sample Consensus. IEEE Geosci. Remote Sens. Lett. 2022, 19, 1–5. [Google Scholar] [CrossRef]
- Tong, W. Research on Unmanned Aerial Vehicle SAR Heterogenous Image Matching and Application Technology. Master’s Thesis, National University of Defense Technology, Changsha, China, 2023. [Google Scholar]
- Fan, J.; Wu, Y.; Li, M.; Liang, W.; Cao, Y. SAR and Optical Image Registration Using Nonlinear Diffusion and Phase Congruency Structural Descriptor. IEEE Trans. Geosci. Remote Sens. 2018, 56, 5368–5379. [Google Scholar] [CrossRef]
- Dellinger, F.; Delon, J.; Gousseau, Y.; Michel, J.; Tupin, F. SAR-SIFT: A SIFT-like algorithm for SAR images. IEEE Trans. Geosci. Remote Sens. 2014, 53, 453–466. [Google Scholar] [CrossRef]
- Xiang, Y.; Tao, R.; Wang, F.; You, H.; Han, B. Automatic Registration of Optical and SAR Images Via Improved Phase Congruency Model. IEEE J. Sel. Top. Appl. Earth Obs. Remote Sens. 2020, 13, 5847–5861. [Google Scholar] [CrossRef]
- Shermeyer, J.; Hogan, D.; Brown, J.; Van Etten, A.; Weir, N.; Pacifici, F.; Hansch, R.; Bastidas, A.; Soenen, S.; Bacastow, T.; et al. SpaceNet 6: Multi-Sensor All Weather Mapping Dataset. In Proceedings of the 2020 IEEE/CVF Conference on Computer Vision and Pattern Recognition Workshops (CVPRW), Seattle, WA, USA, 14–19 June 2020; pp. 768–777. [Google Scholar]
Disclaimer/Publisher’s Note: The statements, opinions and data contained in all publications are solely those of the individual author(s) and contributor(s) and not of MDPI and/or the editor(s). MDPI and/or the editor(s) disclaim responsibility for any injury to people or property resulting from any ideas, methods, instructions or products referred to in the content. |
© 2024 by the authors. Licensee MDPI, Basel, Switzerland. This article is an open access article distributed under the terms and conditions of the Creative Commons Attribution (CC BY) license (https://creativecommons.org/licenses/by/4.0/).