Article

Identifying Habitat Productivity Thresholds to Assess the Effects of Drought on a Specialist Folivore

1
Hawkesbury Institute for Environment, Western Sydney University, Richmond, NSW 2753, Australia
2
Department of Climate Change, Energy, the Environment and Water, Australian Government, Canberra, ACT 2600, Australia
3
Fenner School of Environment and Society, Australian National University, Canberra, ACT 2601, Australia
*
Author to whom correspondence should be addressed.
Remote Sens. 2024, 16(17), 3279; https://doi.org/10.3390/rs16173279
Submission received: 19 June 2024 / Revised: 20 August 2024 / Accepted: 27 August 2024 / Published: 4 September 2024
(This article belongs to the Section Ecological Remote Sensing)

Abstract

:
Climate change has altered the frequency and severity of extreme weather, which can affect vegetation condition and habitat quality for wildlife. Declines in vegetation productivity during droughts and heatwaves can negatively impact animals that depend on vegetation for water and nutrition. We used the normalised difference vegetation index (NDVI) to look at relationships between vegetation productivity and the presence of koalas (Phascolarctos cinereus) in potential habitat throughout much of their range. Using a large, long-term koala presence dataset, we tested the hypothesis that locations where koalas had been observed would exhibit higher NDVI values than a random, representative sample from the same vegetation group. We also identified the minimum NDVI threshold at which koalas occurred across time for each vegetation group and compared these to the minimum NDVI values across potential koala habitat before and during the Millennium Drought, one of the worst recorded in Australia. Additionally, we investigated whether vegetation above the minimum NDVI thresholds was significantly closer to perennial water than unsuitable vegetation. We found that koalas tend to occur at locations with higher NDVI than average for all vegetation groups. Prior to the drought, 49% of potential koala habitat maintained a minimum NDVI above the koalas’ threshold, equating to 190,227 km2, which declined to 166,746 km2 during drought (i.e., a 12% reduction). We also found that unsuitable vegetation tended to occur farther from perennial water than suitable vegetation for some vegetation groups. Areas that remained above the NDVI thresholds during the drought should be considered potential refugia for populations during an event of similar magnitude and could indicate future habitat extent.

Graphical Abstract

1. Introduction

Climate change is impacting ecosystems around the world. Global mean land surface temperatures were 1.34 to 1.83 °C higher in 2011–2020 than in 1850–1900 [1]. A common component of climate change is increased frequency of extreme climate events, such as heatwaves and droughts [2], which can drive rapid change in vegetation and wildlife populations [3,4]. These processes include declining vegetation productivity due to water limitation from drying soils and increased atmospheric demand (i.e., drought) [2], and may negatively impact higher trophic levels [5,6]. For example, declining forage productivity can reduce habitat suitability for herbivores via reduced nutrient, energy, and water availability and result in warmer microclimates from a loss of vegetation cover [7,8]. Analysing this process spatially can indicate the distribution of potentially suitable habitat in future environments (i.e., refugia).
Remotely-sensed measures of ecosystem function, such as the normalised difference vegetation index (NDVI), can reveal changes to vegetation suitability for animals during extreme conditions provided data are continuous across multiple temporal and spatial scales [9,10,11]. The NDVI is the difference between red and near-infrared wavelengths in radiation reflected from vegetation (chlorophyll absorbance and mesophyll reflectance, respectively), and it provides a measure of vegetation productivity and green biomass. The NDVI is highly correlated with several vegetation characteristics including fraction of absorbed photosynthetically-active radiation, foliar nitrogen, chlorophyll, net primary production, and evapotranspiration [12,13]. Multiple studies have used the NDVI to characterise the magnitude of drought impacts on vegetation condition and productivity [14,15]. The index has also been used in numerous studies of plant–animal interactions, including as a measure of forage phenology in assessing the trophic effects of climate on body mass of red deer (Cervus elaphus, [16]) and to test optimal foraging and species-energy theory by analysing vegetation productivity in relation to species diversity, herbivore abundance, and landscape use. (For a review see [12]).
Faunal species distributions have shifted under anthropogenic climate change partly because of changes in habitat suitability, including for specialist herbivores [17,18,19]. In this study, we used the NDVI to identify productivity thresholds for the occurrence of a specialist arboreal folivore, the koala (Phascolarctos cinereus), throughout most of its distribution across eastern Australia. Using a long-term, continental-scale koala observation dataset, vegetation mapping, and NDVI timeseries from Landsat sensors, we tested the hypothesis H1 that locations where koalas had been observed would exhibit higher NDVI values than a random, representative sample from the same vegetation group (i.e., Eucalyptus, woodlands, open forests, or tall open forests). We then obtained the minimum NDVI values at which koalas were observed for each vegetation group. We used these values to represent a NDVI threshold for koala occurrence and investigated how severe drought affected the distribution of potential koala habitat based on the thresholds and drought-related changes to landscape NDVI within vegetation groups. Potential habitat in this context means vegetation groups in which koalas are commonly found.
We tested the hypothesis H2 that drought would reduce the area of potential habitat that is above the NDVI threshold for koalas. We also investigated the hypothesis, H3, that suitable vegetation was significantly closer to perennial water than unsuitable vegetation, both before and during the drought. In this study, we use the term suitable or unsuitable vegetation to describe vegetation that is above or below koala NDVI thresholds in vegetation groups commonly associated with koala habitat. Whether koalas are present in a particular area can also depend on several other factors that are beyond the scope of this study. By quantifying the responses of both our target species (the koala) and of the quality of its potential habitat via fluctuations in the NDVI, we present a simple, powerful analysis capturing the impact of climate stress on vegetation and vegetation-dependent fauna, which can be considered alongside other factors that influence habitat suitability.

2. Materials and Methods

2.1. Study Area

The study area encompassed most of the koala’s distribution, primarily across the Australian states of Queensland, New South Wales, Victoria, and the Australian Capital Territory (Figure 1). Tree cover in the area was predominately temperate evergreen broadleaf forests and woodlands, dominated by trees from the genus Eucalyptus, Angophora, and Corymbia. Maximum mean annual temperatures (MATs) across the range had increased by 0.4–0.6 °C per decade since 1970 [20], and the median MAT was 18.8 °C, increasing to above 20 °C in the northwest [21]. Median mean annual precipitation across the area was 575 mm, with a maximum and minimum of 4385 and 244 mm, respectively. Mean annual potential evaporation ranged from 913 mm to 1948 mm, with a median of 1370 mm [21].

2.2. Study Species

The koala (Phascolarctos cinereus) is a specialist folivore that browses primarily on the foliage of eucalypt trees, from which they also obtain most of their water. Koalas have a wide distribution across the eastern states of Australia where they are associated with forests and woodlands dominated by evergreen trees in the genus Eucalyptus. Koalas have relatively high site fidelity, with sometimes overlapping home ranges that can vary widely in size, from less than 2 ha to over 100 ha in more open woodland environments [22]. Once common, large population declines, particularly in Queensland and New South Wales, have resulted in koalas in those states being recently listed as endangered [17,23,24,25]. Direct and indirect effects of heatwaves and droughts associated with climate change have contributed to koala mortality and population declines [10,26,27,28], along with habitat clearing and degradation [17,29,30]. Population decreases in semi-arid bioregions tend to occur during years of drought [17,24,31].

2.3. NDVI of Koala Observations Compared to Landscapes

We obtained koala observations from the Species Profile and Threats database (SPRAT) for the period 1995–2009 to identify koala observations for which the NDVI and vegetation group could be determined [32] (Table 1, Figure 2 and Figure A1). The observations extended throughout the koala range in eastern Australian states and territories (NSW, Queensland, and ACT) where koalas are listed in legislation as endangered. For the state of Victoria, where the koala is not listed, we obtained koala observations from the Victorian Biodiversity Atlas [33]. For both databases, the koala records had been compiled from many sources, including structured scientific and community surveys and opportunistic sightings. Both databases contain coordinates of the observation locations with uncertainty estimates, and we filtered for locational uncertainty of 100 m or less and removed all unlikely (e.g., aquatic) or duplicate observations. This included removing records that were not associated with a precise date, to allow us to obtain NDVI values associated with each koala observation.

2.3.1. NDVI at Locations of Koala Observations

We extracted NDVI measurements at the filtered koala observation sites to derive suitability thresholds for koala-associated vegetation groups. We used reflectance data from multispectral Landsat satellites 5 and 7 from 1995 to 2009 (25 m ground resolution, Table 1), which have equivalent spectral bands (i.e., red: 0.6–0.7 µm and 0.63–0.69 µm, and near-infrared [NIR]: 0.7–0.8 µm and 0.77–0.90 µm, respectively). Before 1999, Landsat 5 operated and the image timeseries had a 16-day frequency; for the remaining time, both satellites 5 and 7 were operating and two images were acquired and used in each 16-day interval. The NDVI was calculated following Tucker [34]:
NDVI = ( ρ N I R ρ R E D ) / ( ρ N I R + ρ R E D ) ,
We constrained the data to 0.2 ≤ NDVI ≤ 0.86, as values below this window are typically not considered vegetation, and those above may be affected by saturation of the NDVI for the vegetation groups and spatial resolution of our data [35,36]. These data were extracted from Landsat scenes stored in a timeseries datacube hosted by Digital Earth Australia (DEA), which is processed with a nadir-corrected bidirectional reflectance distribution function [37]. We masked poor-quality pixels including cloud using the ‘Fmask’ function built-in to the DEA platform [38]. We then collected the Landsat NDVI value nearest in time to each koala observation, within a maximum of 14-days either side of the observation to limit seasonal effects on the NDVI. We used an arithmetic mean NDVI value from a 3 × 3 window of pixels around the location to obtain a measure more representative of the habitat and reduce the effect of NDVI outliers.

2.3.2. Vegetation Group Assignment for Observations

We assigned the retained koala observations to vegetation groups based on the major vegetation groups dataset (MVG, Table 1) and analysed each vegetation group separately, because differences in the NDVI across these groups, driven by differences in vegetation composition and biomass, limit comparisons between them [12]. To do this, we used Python software (version 3.12.2) packages xarray (version 2023.01.0 [39]) and geopandas (version 0.12.2 [40]). The MVG data are based on structural and floristic information including dominant genus, growth form, height, and cover [41]. It has been assembled from data collected at various on-ground dates; here, we used the most recent combined version (version 6.0, [41]). We excluded records from MVGs including less than 500 koala observations to maintain large sample sizes within groups and because less koala habitat occurs in these groups.

2.3.3. Comparing Koala Observation NDVI with Mean NDVI for Each Vegetation Group

To test whether the NDVI of koala sites differed from the mean NDVI for that vegetation group, we used generalised linear mixed modelling (GLMM). As a response variable, we used presence of koalas and drew an equally-sized random subset of background points from the NDVI data source for respective vegetation groups in the landscape (woodland, open forest, or tall open forest, n = 1500 each). We paired these background landscape NDVI values to the times of koala observations, which were from anytime in 1995–2009, to control for temporal variation in the NDVI. We modelled a binary response, either observations or background landscape pixels, with the NDVI as a predictor in separate binomial GLMMs for each vegetation group. To account for the spatial autocorrelation of the NDVI, we included an exponential covariance term based on the spatial coordinates of observations. We then tested the model residuals for spatial autocorrelation. To fit these GLMMs, we used the software packages glmmTMB (version 1.1.9) [42] and DHARMa (version 0.4.6) [43] in the R environment (version 4.2.2., [44]).

2.4. NDVI Thresholds for Suitable Vegetation

We determined minimum thresholds of the NDVI associated with koala observations by analysing the empirical cumulative distribution functions for all observations (1995–2009), using the statsmodel Python package (version 0.14.1, [45]). The threshold was defined as the NDVI value, for each vegetation group, which had an estimated probability equal to 5%. Therefore,
F ( Χ ) = P ( Χ = 0.05 ) ,
is the NDVI, below which koala occurrence is not likely, and was selected as the threshold, above which vegetation productivity is sufficient to support koalas.

2.4.1. Landscape NDVI in Drought and Non-Drought Periods

From 2001 to 2009, Australia experienced one of its worst droughts on record, dubbed the Millennium Drought [46] which had many harmful ecological impacts [47]. The rainfall anomaly was 12–13% below the mean of the previous century. The climatic and soil changes during the drought varied in degree across the extensive study area (for further description of this see [46,47]). We obtained landscape NDVI data for this period also from the DEA [37]. We used a subset of the Landsat NDVI imagery across the koala range from 2005 to 2009, which was the latter part of the Millennium Drought, when cumulative effects would have been greatest. We reduced this timeseries to the 5th percentile value for each pixel to produce an image of minimal vegetation productivity without capturing low outliers (e.g., unmasked cloud). We repeated this process for a five-year period preceding the drought (1995–1999) to allow for comparisons with the Millenium Drought. Across the study area, the rainfall anomaly relative to the 1961 to 1990 mean was 4.5% for the pre-drought period and −11.2% for the five years of drought.

2.4.2. Vegetation Group Assignment for Landscapes

To limit the analyses to vegetation groups most frequently associated with koala observations in the landscape, we combined the NVIS-derived groups as described previously with the minimum NDVI images. Rasters of each vegetation group and the NDVI images were aligned spatially, to account for the different resolutions and projections. Taking a Boolean mask of each vegetation group, we multiplied it by the NDVI, resulting in a landscape NDVI layer with a resolution of the Landsat input, divided into vegetation groups. This process was repeated for the two time periods, using a raster calculator (QGIS, version 3.34, [48]).

2.4.3. Applying Koala NDVI Thresholds across the Landscape

We applied the suitability thresholds for each vegetation group to the drought and non-drought NDVI images using the raster calculator. The result was a set of NDVI rasters of suitable vegetation for pre- and drought periods, which excluded potential habitat vegetation deemed unsuitable to support koalas because the NDVI value of that vegetation was below the relevant vegetation-group threshold. We then computed difference layers by subtracting pre-drought from drought to reveal how much potential habitat shifted from suitable pre-drought to unsuitable in drought.

2.5. Proximity of Suitable Vegetation to Water

To understand the spatial proximity of vegetation above the NDVI threshold for koalas in relation to distance to perennial surface water, we combined the suitability maps with surface hydrology data [49]. These data describe perennial watercourses and water bodies for the continent (Table 1). We converted the vectors to a raster at the spatial resolution of the NDVI data, then created a proximity raster of distance of each pixel to the target (water) pixels, using the ‘Rasterize’ function (GDAL, version 3.4.0, [50]). With the same software, we multiplied the proximity raster by the mask of vegetation suitability rasters for each of two time periods and the two suitability groups, producing rasters of distance (km) to suitable and unsuitable vegetation pixels. To test whether the distance to perennial water of suitable pixels differed from the average distance to water for each vegetation group, we used generalised linear mixed modelling (GLMM, version 1.4.4). We used a subset of pixels from each vegetation group, which we randomly selected from across the landscape, made up of half suitable and half unsuitable pixels (total n = 4500). The modelling approach was similar to that of koala site~NDVI (H1), except the binomial response was pixels above or below NDVI thresholds and the predictor, distance to water, was logarithmically transformed because of its Euclidean structure. We used this same model structure to test if koala observations were closer to water than random sites, with the response variable being binary: koala site or random location. Here, we used the same coordinates as the subset of observations used in the methods for H1.

3. Results

3.1. NDVI of Koala Observations Compared to Landscapes

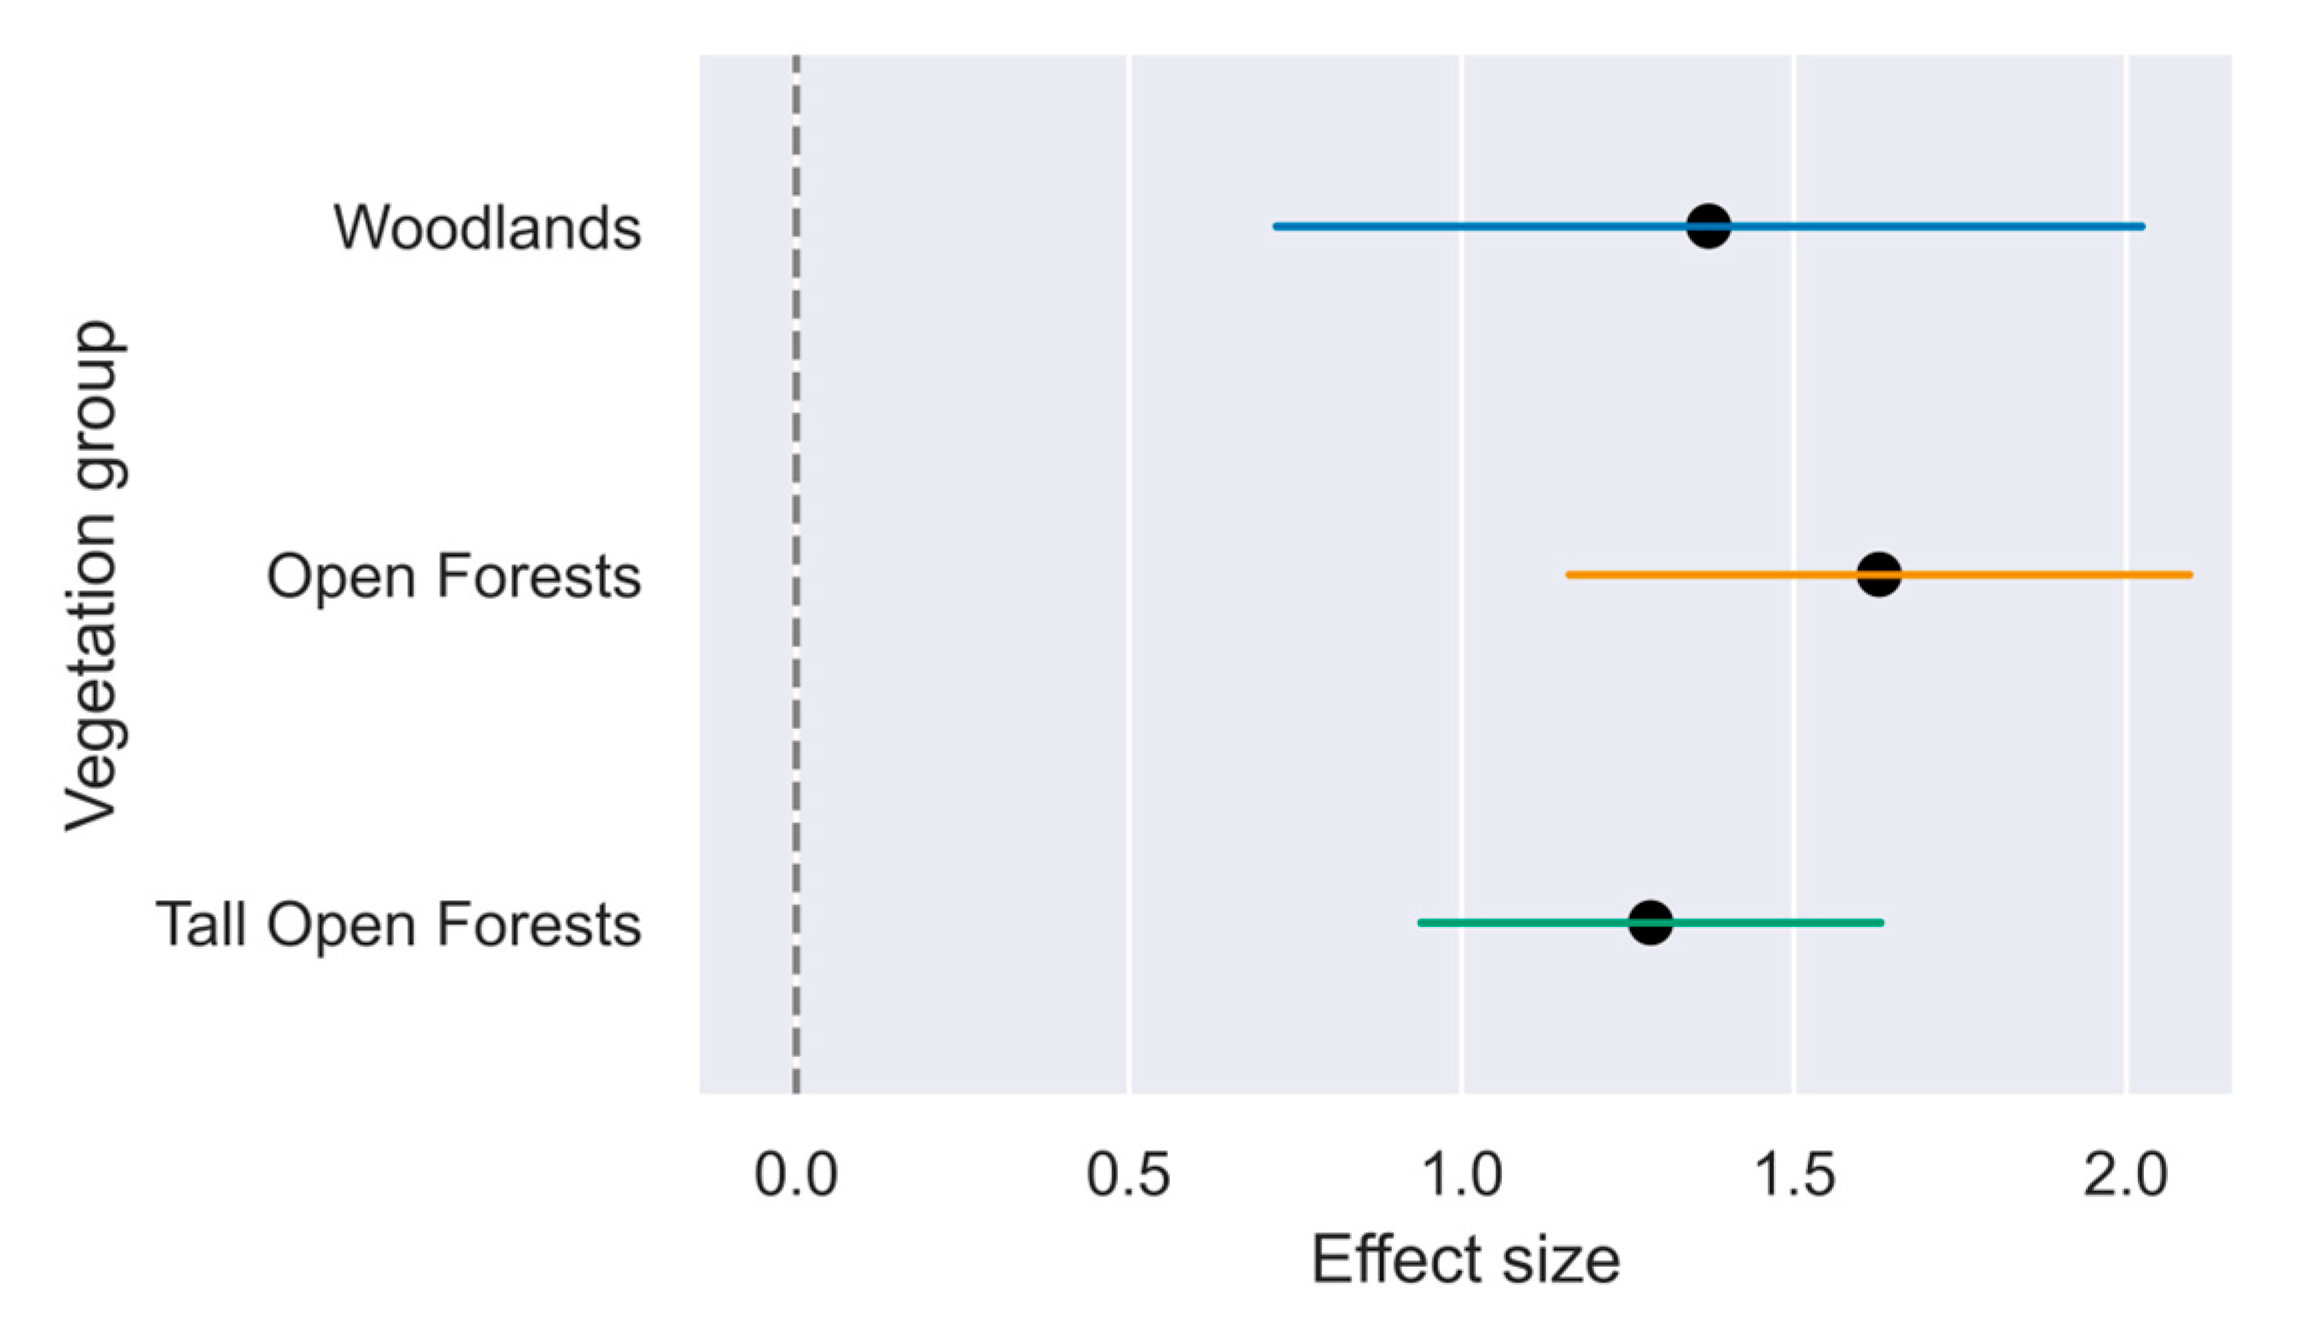
The mean NDVI of observations and random landscape pixels differed significantly for all vegetation groups (all p < 0.0001, Figure 3 and Figure 4). Thus, koalas tended to be found in vegetation with greater-than-average productivity within each vegetation group, confirming our first hypothesis (H1).

3.2. NDVI Thresholds for Suitable Vegetation

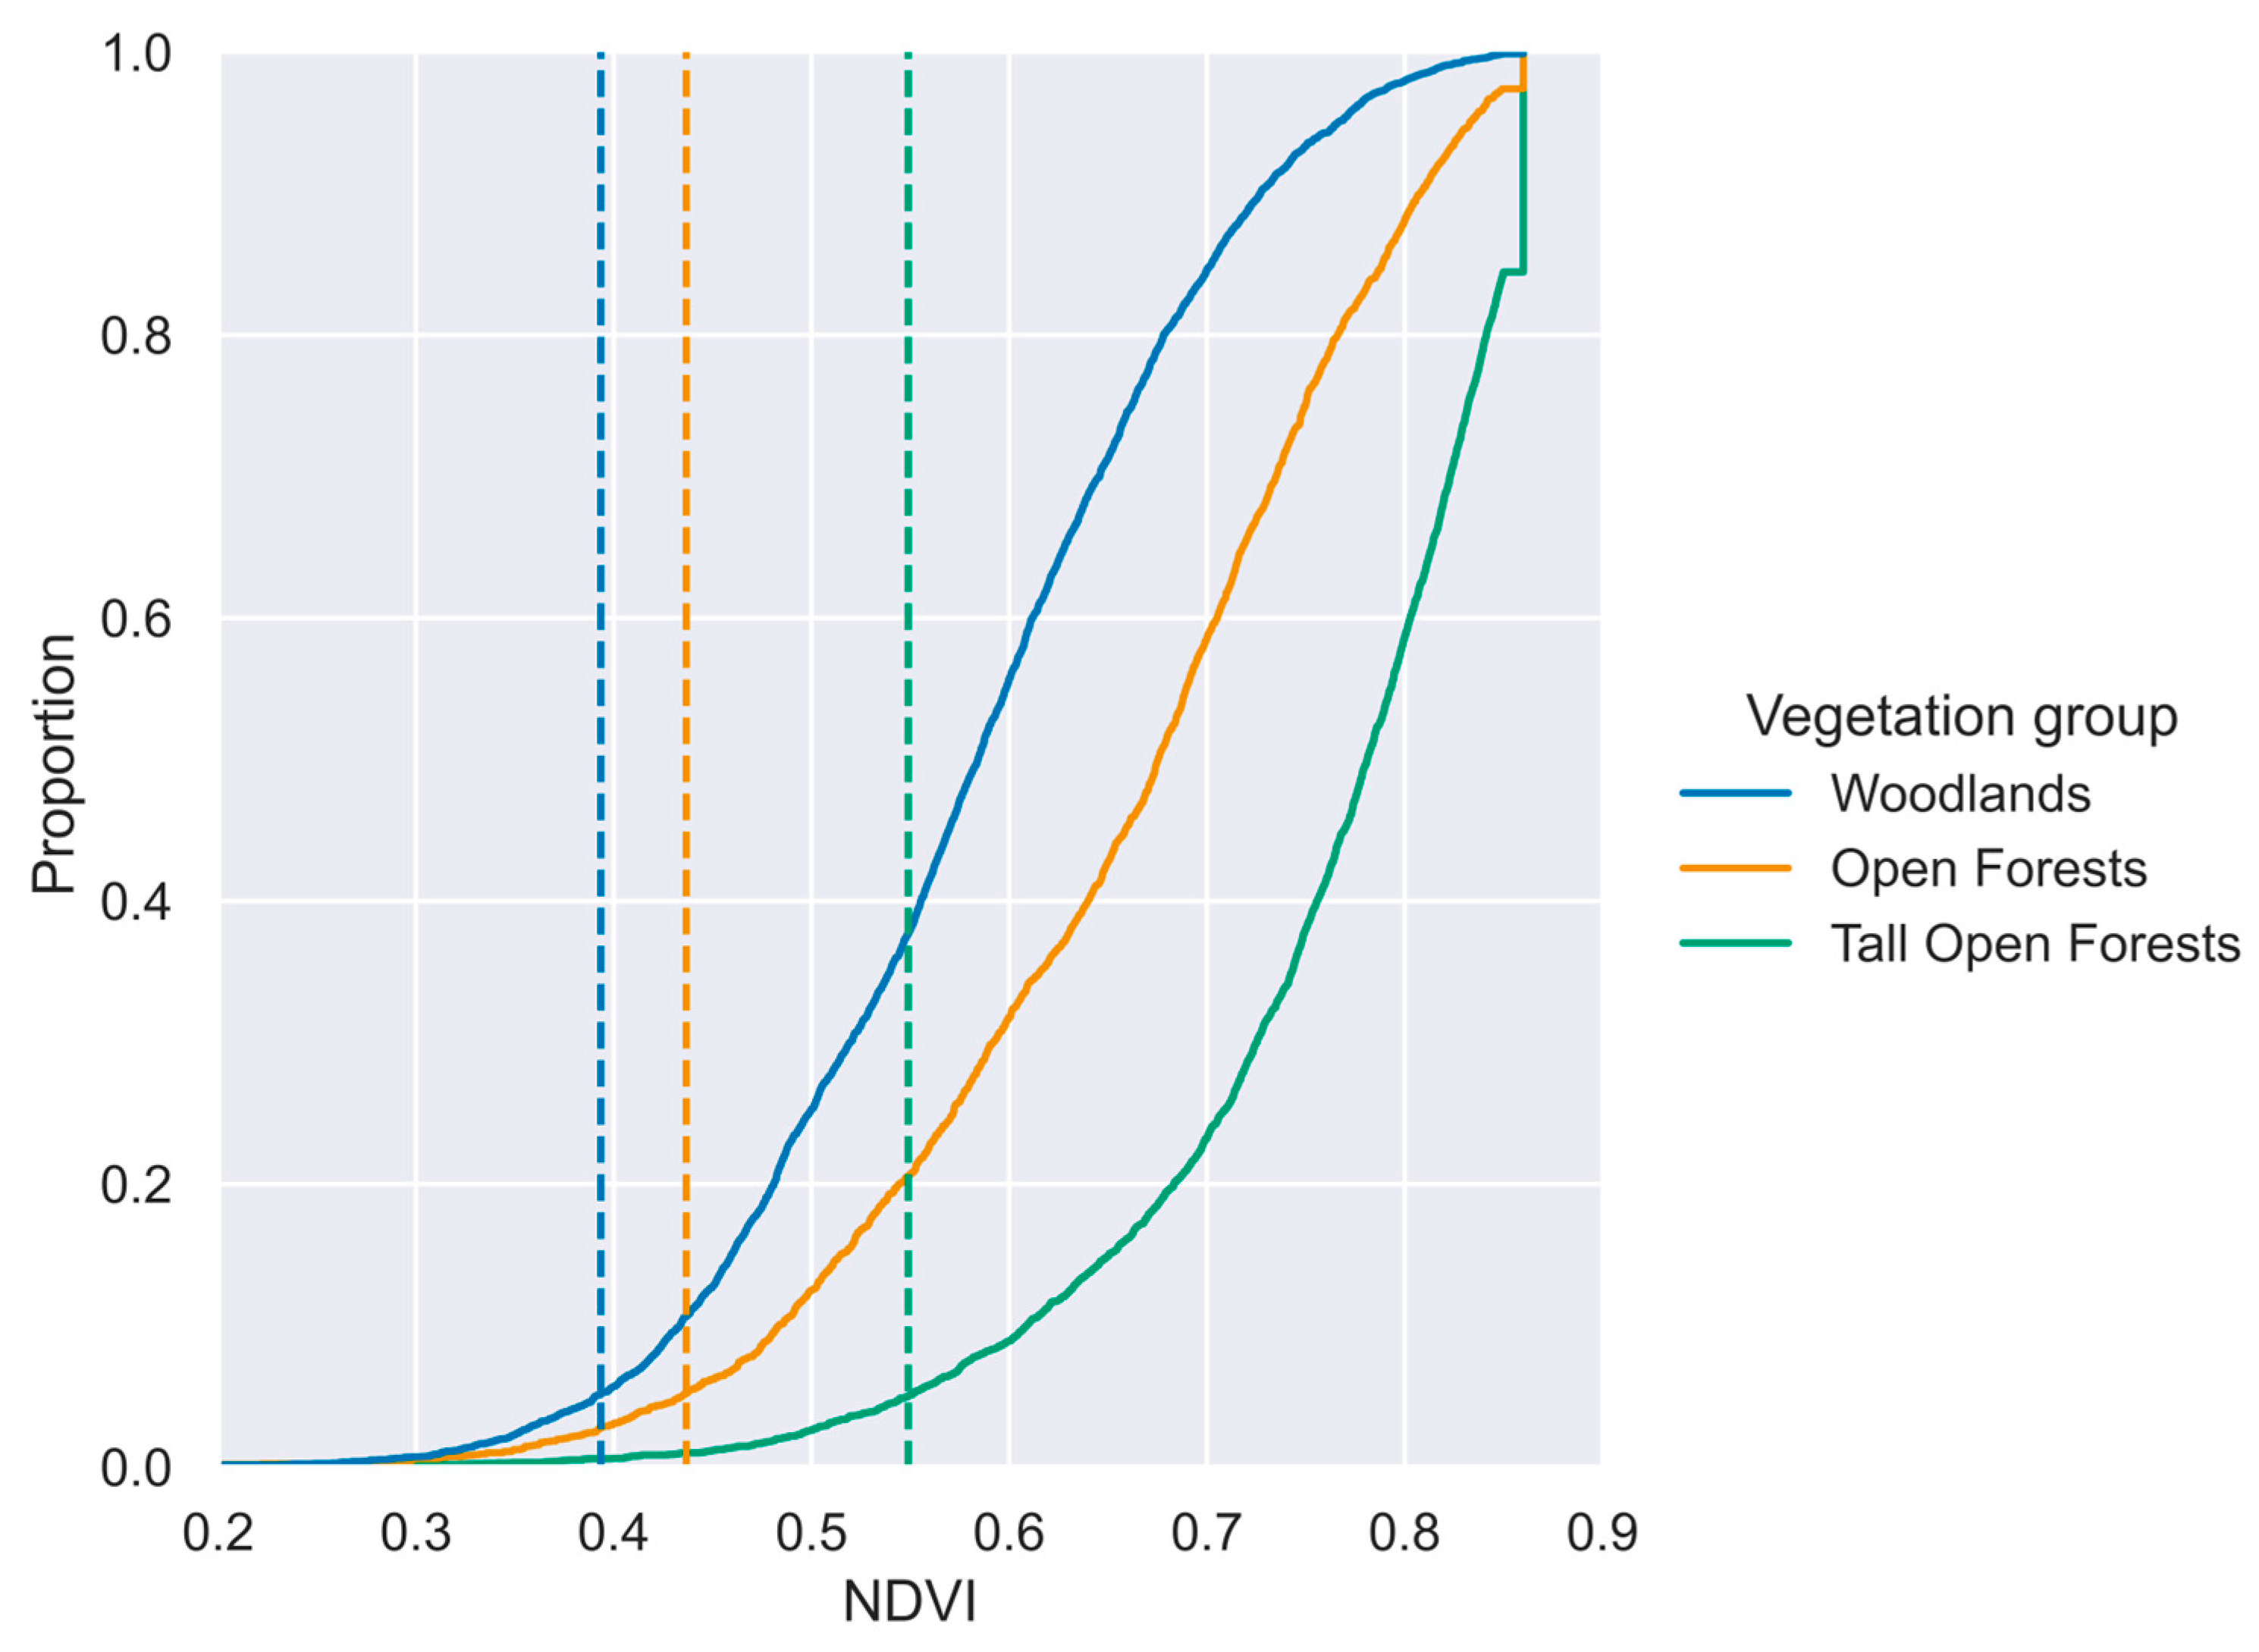
Figure 5 shows the minimum (5th percentile) identified in the cumulative distributions of the NDVI for koala observation pixels for each vegetation group (i.e., vegetation thresholds; woodlands = 0.393, open forests = 0.436, tall open forests = 0.549). Woodlands, followed by open forest, had thresholds lower than the tall open forests, reflecting the different productivity levels of each vegetation group.
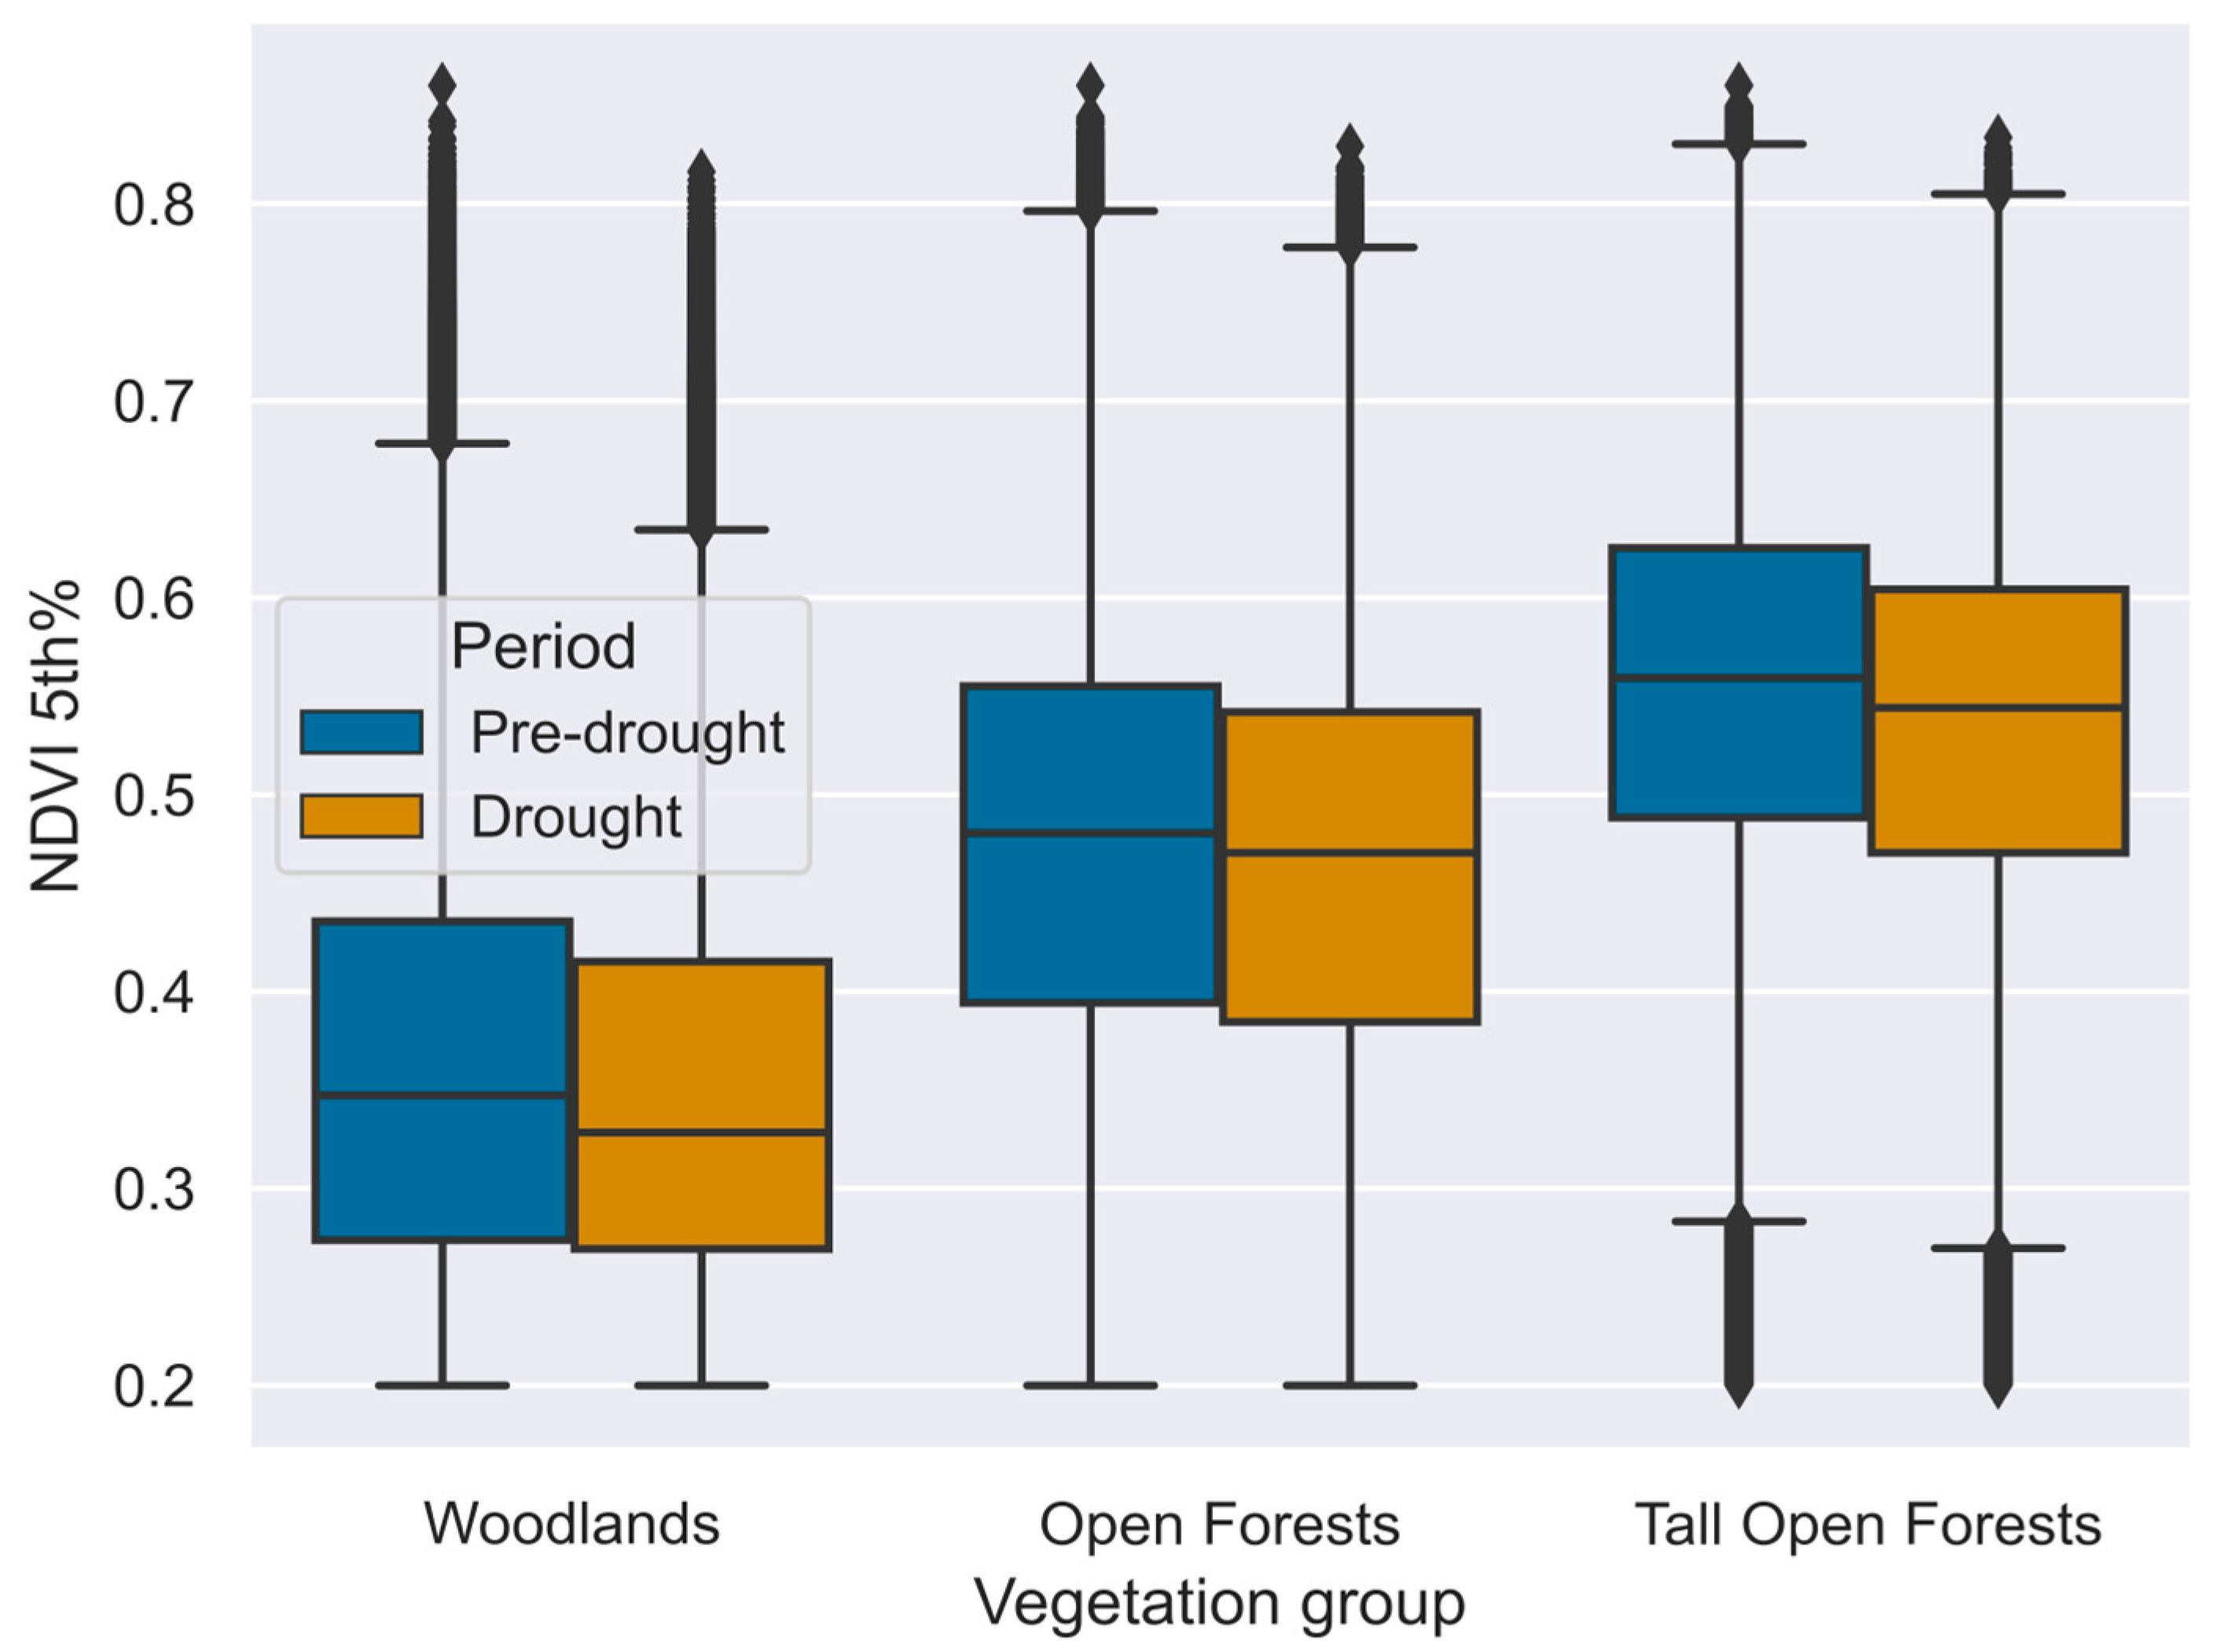
Across the entire study area, the effect of drought was observed most strongly in the minimum NDVI rather than the mean NDVI; changes to the mean were small and not significant in all vegetation groups. The landscape NDVI minimum across vegetation groups declined significantly between pre- and late-drought periods (all p < 0.01), due to declines in all vegetation groups across periods. Figure 6 shows distributions in both periods for respective vegetation groups.
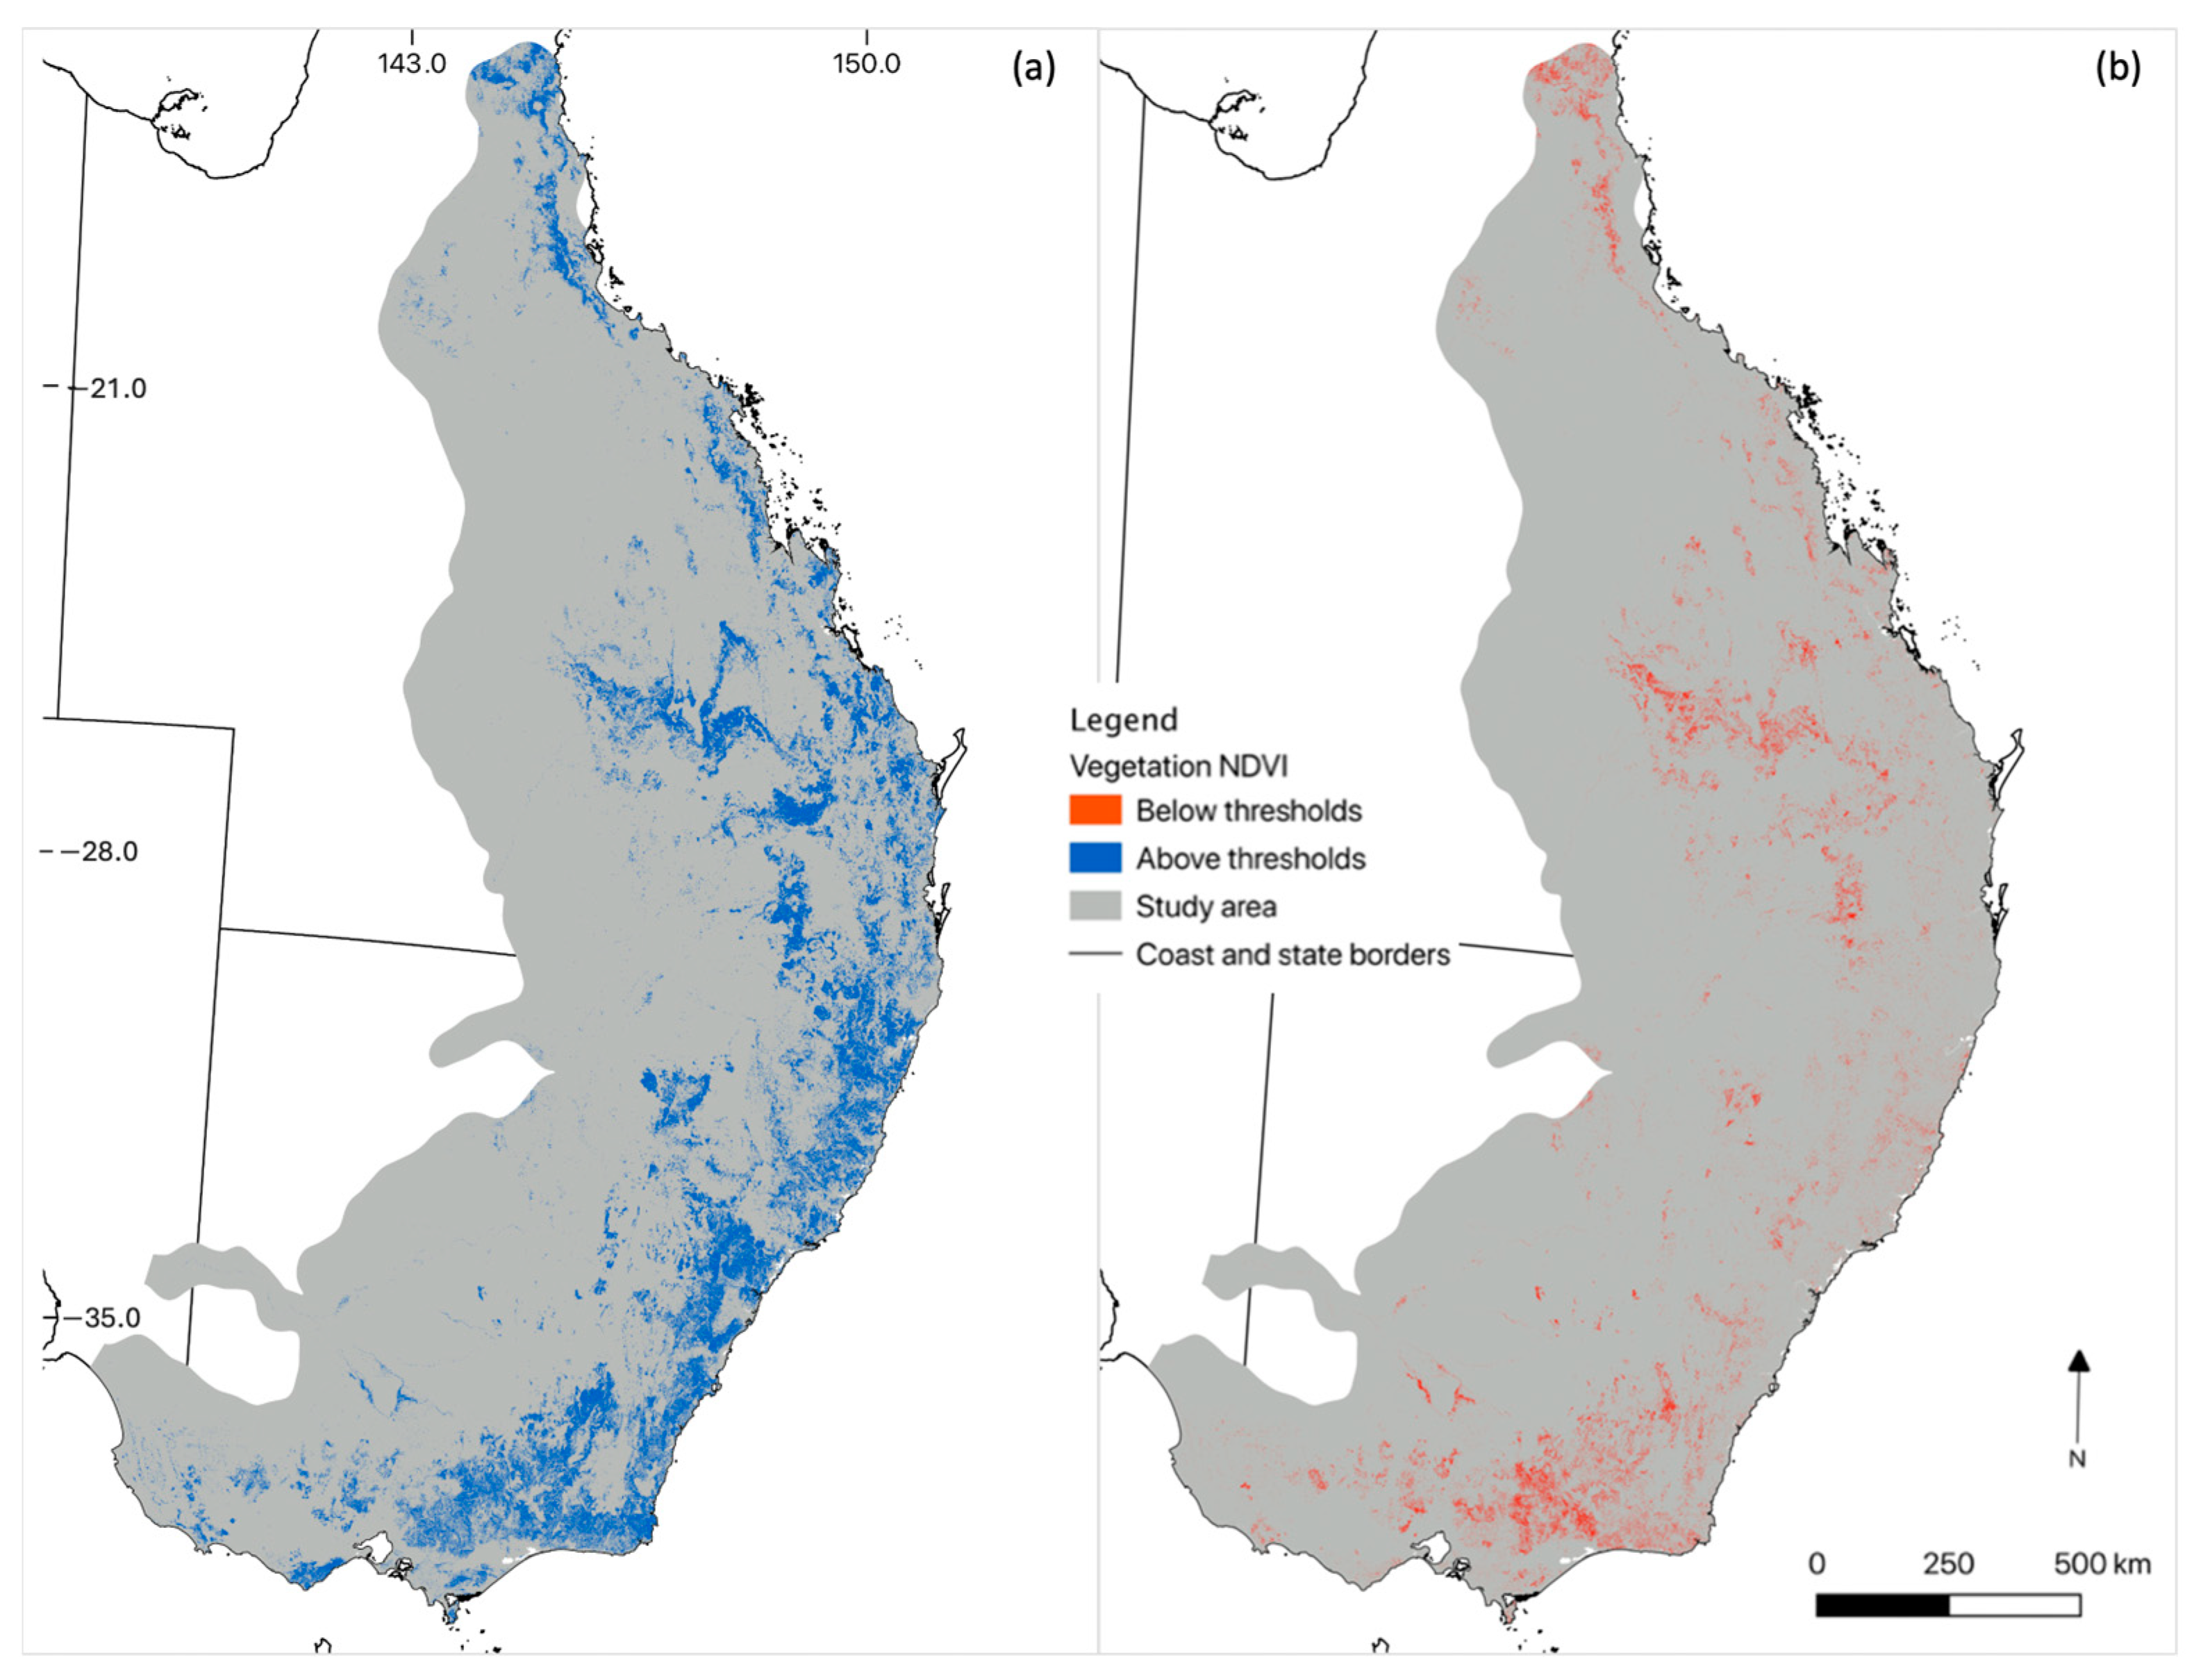
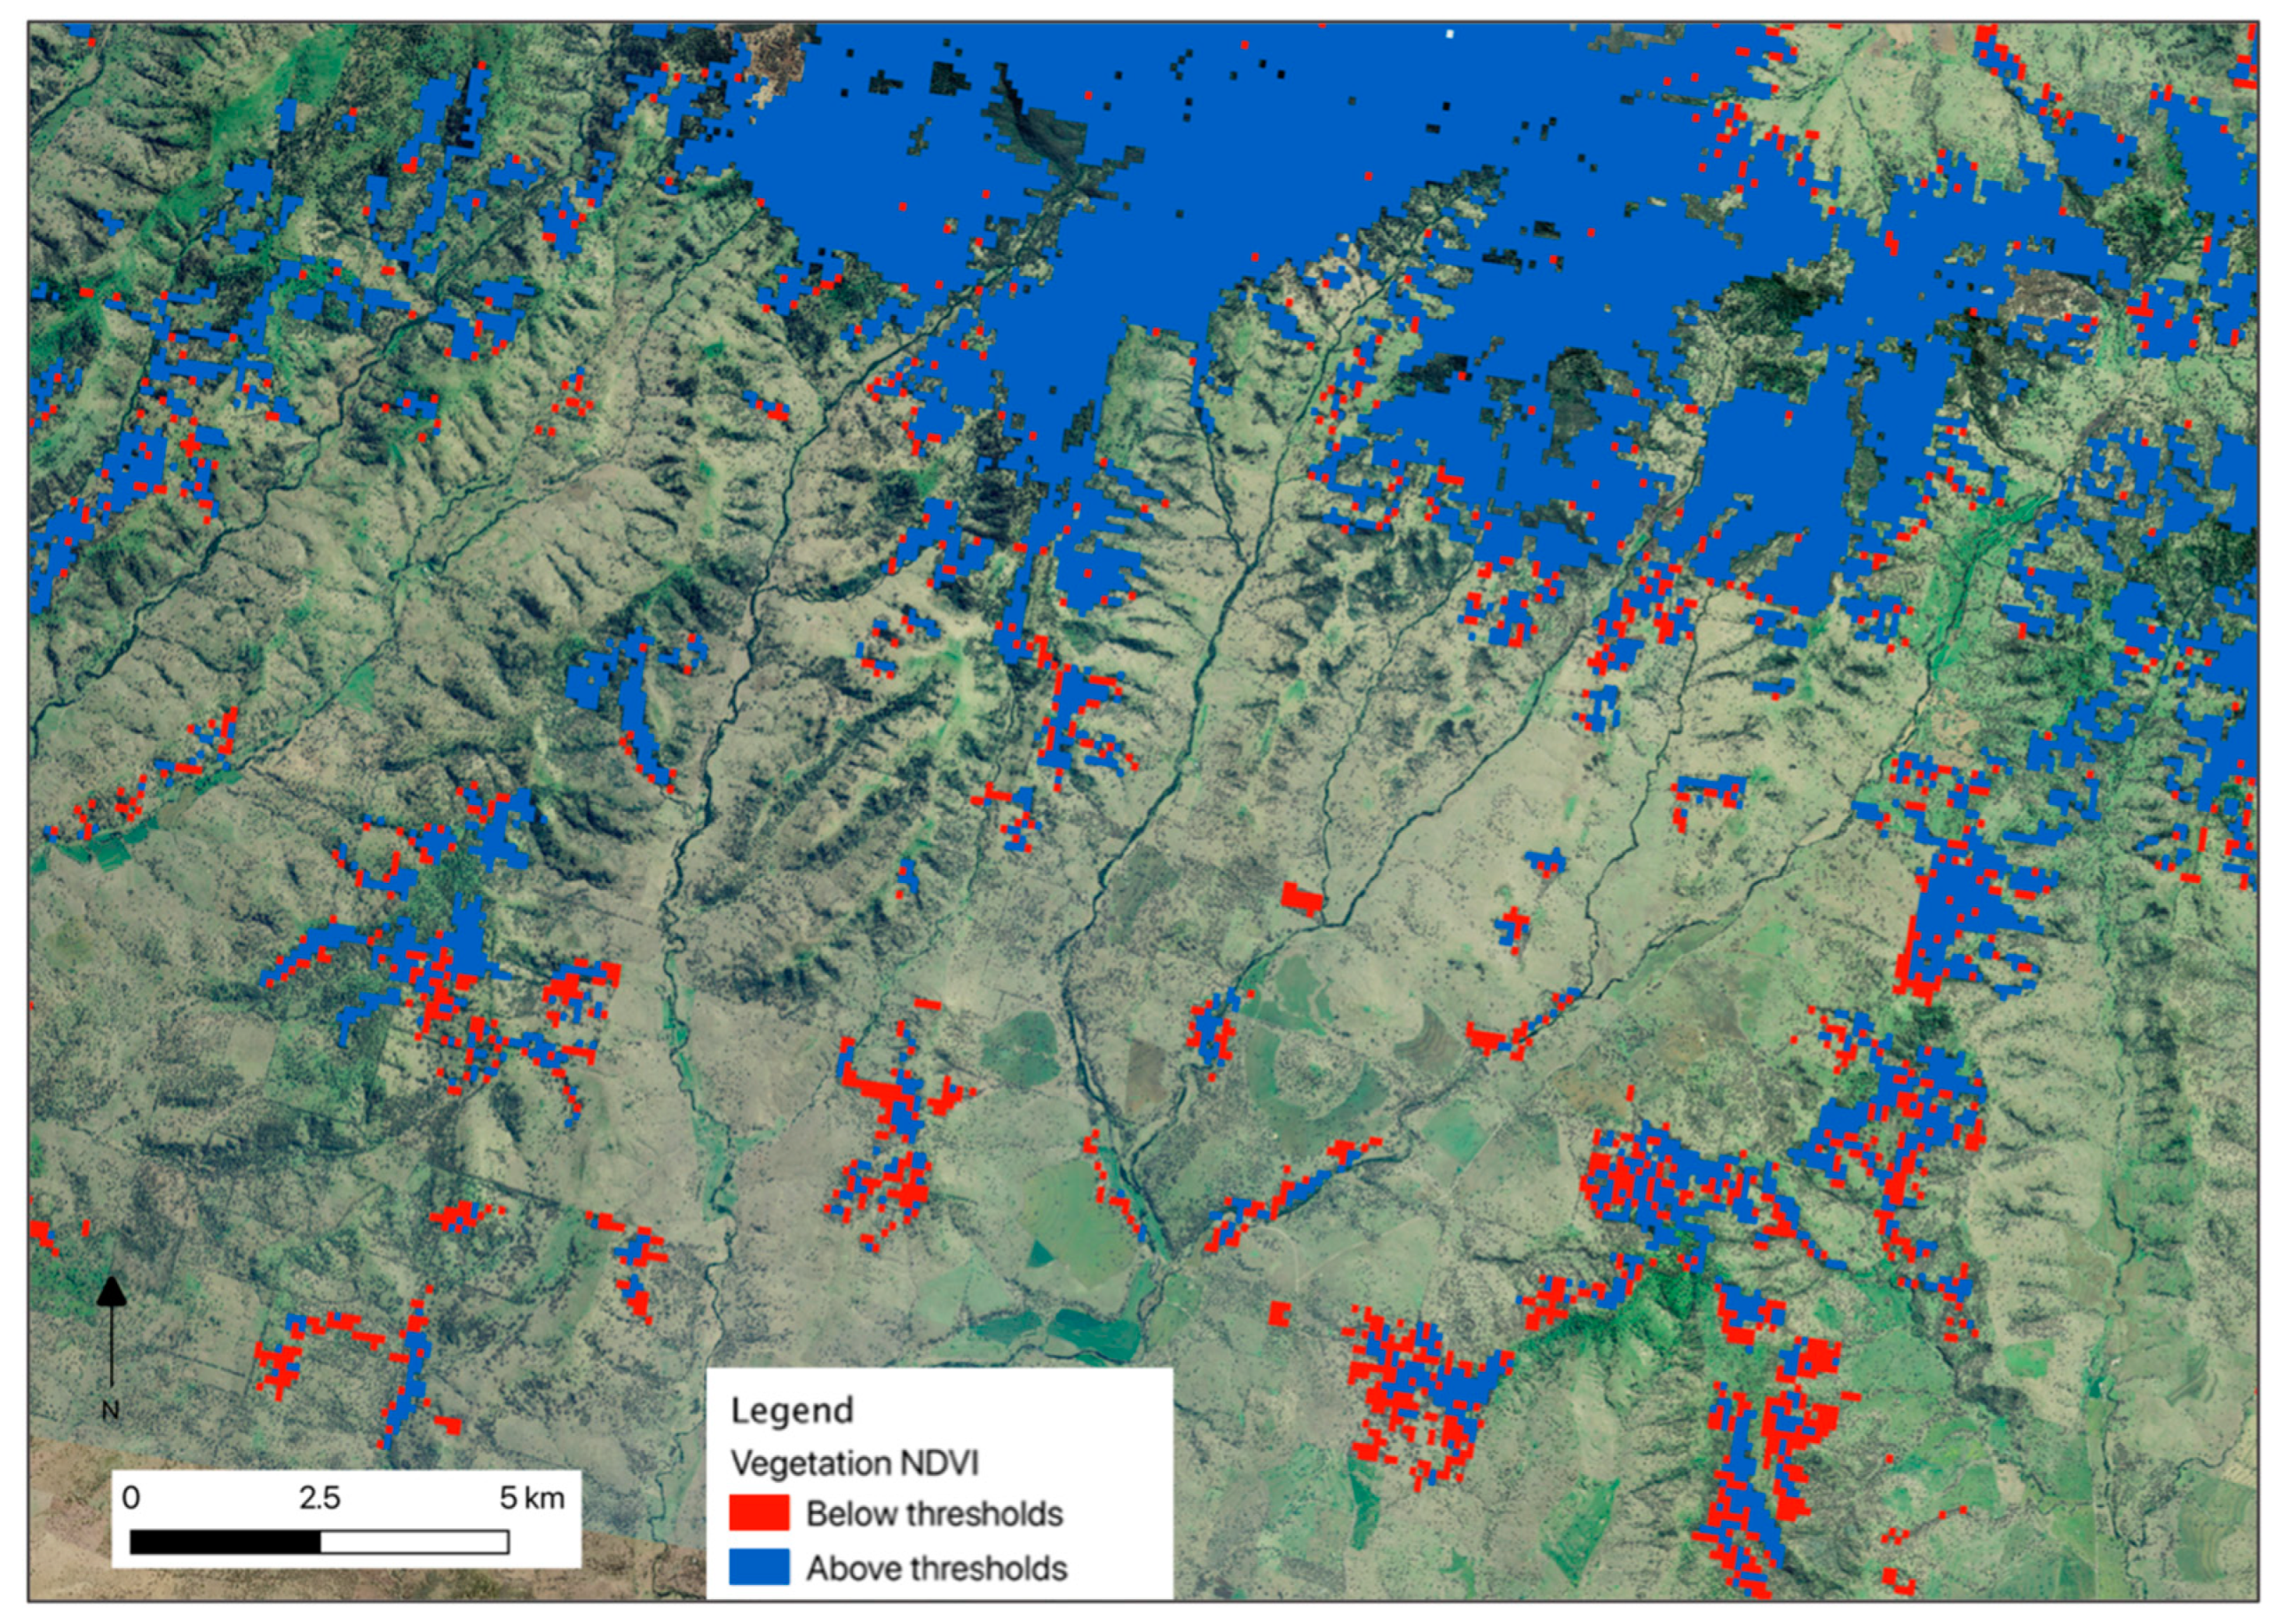
The total area of all three vegetation groups was 429,997 km2. During the pre-drought period, 49% of this area remained above the koala NDVI threshold for all vegetation groups (Table 2; Figure 7). This means approximately half of potential koala habitat was not sufficiently productive to continuously support koalas (i.e., suitable vegetation). During the drought, we observed a 12% reduction in suitable vegetation area, across vegetation groups. This affirmed our second hypothesis, that NDVI decline in drought reduces the area of potential habitat for koalas (H2). Figure 8 shows an example of this reduction within a landscape, where, of 606 ha of suitable vegetation prior to the drought, 16.8% (102 ha) declined below thresholds during the drought.

3.3. Proximity of Suitable Vegetation to Water

The mean distance to water from koala observations was 5 km for woodland observations (SD = 7.9 km), 1.8 km for open forest (SD = 2.4 km), and 1.3 km for tall open forest (SD = 1.6 km). The maximum distances at which koalas were observed from perennial water were 51.4 km, 32.2 km, and 21.1 km in the three vegetation groups, respectively. Koala observations were significantly closer to water in open forests than random points taken from the same landscape type (p < 0.01), but this pattern was not found in woodlands or tall open forests (p = 0.93, and p = 0.3, respectively).
We found that suitable and unsuitable vegetation could occur 40 km or more from water, in all vegetation groups. However, there was a significant effect of distance to water on suitability (i.e., vegetation above or below the NDVI minimum threshold) in tall open forest (p < 0.001) and open forests (p = 0.04) but not in woodlands (p = 0.8).

4. Discussion

Climate change is challenging our abilities to understand rapidly changing current and future habitat suitability and species distributions, creating a need for methods to monitor such changes and identify potential refugia, thus allowing better conservation for wildlife and their habitat [51]. For the first time, we identified thresholds of the minimum NDVI associated with the presence of a specialist folivore, the koala, allowing us to assess the extent of potential habitat before and during a major drought. This study extends previous work focusing on local abundance of folivores with the NDVI (e.g., [52]) by considering the relationship between the NDVI and ecological niche at broader spatial scales. Recognising a basic relationship with available energy, we did not aim to build a model of the whole NDVI–animal relationship, as has been performed elsewhere (e.g., NDVI–abundance, [53]); instead, we identified bounds of that relationship and extrapolated these limits in space.

4.1. NDVI of Koala Observations Compared to Landscapes

In all three vegetation groups, we found that koalas were more likely to be observed in areas of the landscape that had higher NDVI values than the average for that vegetation group (Figure 3). These findings are consistent with earlier, regional koala occupancy modelling, based on acoustic detection, that showed landscape NDVI had a significant, positive effect even within a relatively mesic region, the North Coast and Northern Tablelands of NSW [54]. Similarly, Youngentob et al. [52] found that locations where another specialist eucalypt folivore, the greater glider (Petauroides volans), was observed had significantly higher NDVI on average than areas where they were not observed. That study also showed a positive relationship between abundance and the NDVI.
The association between koala presence and the NDVI found here is important because several studies have suggested that the NDVI correlates to available energy in forage [52,55,56]. Preferentially foraging in patches of higher energy allows animals to increase energy intake while reducing expenditure, although the ability to digest the forage in these patches is also important [57,58]. The NDVI is linked to forage quality and available energy in several ways. The NDVI is a measure of photosynthetic capacity, the system comprising pigments and proteins, of which the latter is a limiting nutrient for koalas and many other folivores [59,60]. Furthermore, the NDVI is highly correlated with net primary productivity and canopy biomass that make up forage energy [12,13,61]. Declines in productivity and biomass will lead to lower NDVI values and can also reflect less available energy for folivores [62]. Additionally, lower canopy biomass means less shade and evapotranspiration, resulting in hotter microclimates that can reduce habitat suitability [63].
Since our data were sourced from koala observations that included opportunistic sightings, rather than a random sample across the entire range, there may be bias in observations towards areas with more observers, which may also be more productive in terms of the NDVI [64]. We expect this effect to be less pronounced in the vegetation groups that are more common along the coast (e.g., tall open forest and open forest) where human populations are most concentrated and therefore tend to observe koalas frequently. This potential bias could not be entirely avoided, but the inclusion of data from scientific surveys and research sites across the koala’s range (Figure A1), as well as the consistent pattern across all forest groups and with earlier studies of folivore occurrence and the NDVI, provide additional support to our findings.

4.2. NDVI Thresholds for Suitable Vegetation

The minimum NDVI thresholds for koala observations differed across vegetation groups (Figure 5), which is in keeping with the differing distributions of NDVI in those groups. However, in all vegetation groups, the minimum NDVI values associated with koala observations were always higher than the minimum value possible for that landscape group (Figure 6). Accordingly, we also found that a sizable area of all three vegetation groups fell below the NDVI minimum, even prior to drought (Table 2). The area of potential habitat above the NDVI thresholds associated with koala occurrence declined by 12% during the Millennium Drought, supporting the notion that during drought, koala habitat contracts in spatial extent. The largest portion of potential habitat that fell below thresholds was in woodlands, but in all vegetation groups there was contraction (Table 2).
The western, inland extent of the koala’s range is typically comprised of woodlands, with intersecting riparian areas where koalas may occur in higher densities relative to other areas [65]. Water is thought to be a limiting factor for both tree and koala abundance in such regions, and previous studies have identified relationships between foliar NDVI and environmentally available water in these western woodlands, particularly in riparian areas predominated by the locally preferred koala browse species, Eucalyptus camaldulensis [17,66]. Notably, these riparian forests, embedded in the broader woodland landscape, were often classified as tall open forests, due to their structural profile that differed from the surrounding woodland landscape. This likely contributed to the overall proportion of tall open forests that fell below the NDVI threshold during the drought period (Table 2), and the significant relationship between distance to perennial water and tall open forest above the NDVI threshold. Although these riparian forests tend to be phreatophytic, maintaining hydration longer during dry conditions, other studies have found that the NDVI values associated with E. camaldulensis dominated riparian forests can decline substantially during prolonged drought conditions [66]. Other types of tall open forests in our study typically occur closer to the coast and experience higher rainfall, so water is less likely to be a limiting factor on vegetation productivity and the NDVI.
In times of drought, koalas may be critically stressed in landscapes that fall below the vegetation productivity threshold associated with their occurrence (Figure 5). Reduced forage water supply can lead to heat-induced water stress in koalas if free water is not available [51]. Dehydration in koalas has been documented to lead to population crashes during drought [31]. Koalas in refugial areas that remain above the threshold of vegetation productivity during times of drought or extreme heat are more likely to survive [31]. The periodic loss of habitat suitability due to drought impacts is particularly concerning for species like the koala and other arboreal folivores that have less capacity for migration [65] and, due to forage specialisation, cannot adapt by expanding their dietary breadth [67]. Such contractions in suitable vegetation may also impact populations by way of habitat fragmentation [68].
Using the relationship between NDVI minimum thresholds and change in vegetation conditions from pre-drought to drought periods, we have revealed the extent of potential koala habitat contraction during the Millennium Drought (Figure 7). In a future of increasingly severe droughts [69], both the extent of habitat contraction and the duration of time in which habitat drops below koala NDVI thresholds could increase. Our analysis considered extant vegetation, by using reflectance data and forest-type mapping, unlike many distribution or population models [51,70,71]. Briscoe et al. [51] estimated the extent and distribution of suitability based on a biophysical, spatial model that does recognise the importance of changes to koala habitat quality. Like the results of that study, we found contractions in potential koala habitat during drought occurred mainly in the inland parts of the koala’s distribution (Figure 7). Such contraction of populations to refugia during drought has been documented [9,31]; however, the contraction of potential habitat in drought has not, to our knowledge, been revealed before this study.
Our study overcomes some of the limitations of predicting species’ habitat distribution based on forecasts of climate averages. Such approaches do not incorporate climate extremes well nor the trophic interactions caused by those extremes [72], whereas the NDVI integrates the many and varied effects of realised ecological drought across landscape vegetation. The drought studied here did contain spatial variability, including particularly strong impacts in the south of Queensland [47]. However, our inclusion of the less affected northern, tropical regions may have reduced the observed drought effect for vegetation groups also occurring there.
Notably, a sizable portion of the vegetation in the Victorian central and eastern highlands that fell below NDVI thresholds during drought was directly affected by the Black Summer Fires of 2009 (Figure 7, see also [73]). The NDVI of burnt forest is typically lower than the same area before fire, particularly if canopy scorch occurs [74]. The Millennium Drought conditions contributed to the intensity of the 2009 fires [75,76], and in the short-term, fire can reduce koala populations and habitat quality due to forage loss [77]. Some trees may recover productivity quickly via epicormic regrowth, providing potential forage for koalas [78], although this recovery was slowed in some areas by ongoing drought [79]. Other possible drivers of NDVI minima, in some cases, could include land clearing [30] and tree dieback [80].

4.3. Proximity of Suitable Vegetation to Water

On average, the distance between suitable vegetation and perennial water was 7 km, which is greater than the width of even the largest koala home ranges. However, we did find that unsuitable vegetation tended to occur significantly farther from water bodies than suitable vegetation for some vegetation groups. During drought, the distance to water was slightly less for suitable vegetation than before drought, but still 6.4 km on average. Our analysis of the suitability maps does not suggest that access to free-standing water is a habitat requirement for most koalas; however, it is possible that koalas in the western part of their range may rely on it more often [17]. In these regions, riparian habitat tends to be classified as open forest (or even tall open forest) rather than woodlands, which likely contributed to the finding of koala proximity to water in the open forest class. This riparian-forest association may also explain some of the relationship between suitable open forest and distance to water, and conversely, the lack of relationship between suitable woodlands and distance to water. Woodlands often occur farther from perennial water, and these tree communities can have greater drought tolerance [17,41,47].
Davies et al. [65] found that presence of free-standing water influenced the home range size of koalas in western Queensland, and koalas in arid sites spent more time in riparian parts of their habitat compared to those in relatively mesic sites (~80% compared to ~40%). Although koalas are thought to obtain most of their water from leaves, they will also drink free water with increasing frequency as temperatures increase [81]. Sources of free water may be available in addition to those used in this study, including during some stages of drought. These sources include ephemeral creeks, waterholes, farm dams, and bores, although koalas survived prior to the construction of the latter two sources. In addition, it is likely that trees in some areas also access water from underground sources that were not considered in this study but could contribute to the NDVI and vegetation suitability. More research is needed to understand how water, both in the koalas’ environment and in their diet of leaves, contributes to habitat suitability and the distribution and resilience of koala populations.

4.4. Further Applications in Other Systems and in Management

Having confirmed the existence of vegetation-specific thresholds for koalas and mapped potential koala habitat during drought, it would be valuable to expand this study temporally. The full Landsat timeseries could be utilised to estimate the length of periods of suitability. This may reveal areas that are resistant to drought and only shift during the most extreme conditions (i.e., highly skewed temporal distributions). Perhaps more valuably, the Landsat data might also provide insight into the link between koala presence and recovery from drought and its interval, including interactions with temperature which may increase the speed of drought onset [82].
Analyses of habitat productivity thresholds need not be limited to specialist folivores, such as the koala. Other possible systems of study include herbivores that are limited by forage quality in environments that experience extreme periods, particularly those systems with vegetation sensitive to climate change. However, stressors other than climate extremes could also be studied using our approach, provided the stressor affects vegetation NDVI (e.g., seasonal insect outbreaks). Examples of other possible study systems include savanna grass specialists of El Niño-affected South Africa [83] or environments in China where vegetation loss in drought is substantial [84]. Such systems could feature generalist herbivores because the NDVI is responsive to productivity in most plants [34,85]; however, analyses may be more complicated if diets are diverse.
Our results consider one measure of habitat quality based on vegetation productivity, but the results may be useful to environmental managers precisely because of that simplicity. This is because the NDVI integrates many environmental effects on vegetation and indicates extant vegetation. Models that include more parameters and complex influences can be harder to comprehend for management purposes [86]. The maps produced in this study provide an outline of areas of potential habitat that could be conserved through future climatic extremes.

Author Contributions

Conceptualization, I.K., K.N.Y., C.M. and B.D.M.; methodology, C.M. and I.K.; software, C.M. and I.K.; formal analysis, I.K., C.M., M.J.E. and K.N.Y.; investigation, I.K., C.M., M.J.E., K.N.Y. and B.D.M.; resources, C.M., K.N.Y. and B.D.M.; data curation, C.M. and I.K.; writing—original draft preparation, I.K.; writing—review and editing, I.K., C.M., M.J.E., K.N.Y. and B.D.M.; visualization, I.K. and M.J.E.; supervision, K.N.Y. and B.D.M.; project administration, I.K., K.N.Y. and B.D.M.; funding acquisition, K.N.Y. and B.D.M. All authors have read and agreed to the published version of the manuscript.

Funding

This research was funded by NSW Department of Climate Change, Energy, the Environment and Water (New South Wales, Australia), project number: A13782. Project funding provided to B.D.M. in the Hawkesbury Institute for Environment.

Data Availability Statement

The code, input, and extracted data can be found at the following webpage: https://hie-pub.westernsydney.edu.au/projects/ndvi_koala_analysis/.

Conflicts of Interest

The authors declare no conflicts of interest.

Appendix A

Figure A1. A plot of locations of koala observations across the study area in eastern Australia.
Remotesensing 16 03279 g0a1

References

  1. Intergovernmental Panel on Climate Change (IPCC). Climate Change 2021: The Physical Science Basis. Contribution of Working Group I to the Sixth Assessment Report of the Intergovernmental Panel on Climate Change; Masson-Delmotte, V., Zhai, P., Pirani, A., Connors, S.L., Pe, C., Berger, S., Caud, N., Goldfarb, M.I., Gomis, M., Huang, K., et al., Eds.; Cambridge University Press: Cambridge, UK; New York, NJ, USA, 2021. [Google Scholar] [CrossRef]
  2. IPCC. Climate Change 2023: Synthesis Report. Contribution of Working Groups I, II and III to the Sixth Assessment Report of the Intergovernmental Panel on Climate Change; Core Writing Team, Lee, H., Romero, J., Eds.; IPCC: Geneva, Switzerland, 2023; Available online: https://www.ipcc.ch/report/ar6/syr/ (accessed on 14 February 2024).
  3. Wagner, B.; Baker, P.J.; Stewart, S.B.; Lumsden, L.F.; Nelson, J.L.; Cripps, J.K.; Durkin, L.K.; Scroggie, M.P.; Nitschke, C.R. Climate change drives habitat contraction of a nocturnal arboreal marsupial at its physiological limits. Ecosphere 2020, 11, 18401–18421. [Google Scholar] [CrossRef]
  4. Walther, G.-R.; Post, E.; Convey, P.; Menzel, A.; Parmesan, C.; Beebee, T.J.C.; Fromentin, J.-M.; Hoegh-Guldberg, O.; Bairlein, F. Ecological responses to recent climate change. Nature 2002, 416, 389–395. [Google Scholar] [CrossRef]
  5. Dublin, H.T.; Ogutu, J.O. Population regulation of African buffalo in the Mara–Serengeti ecosystem. Wildl. Res. 2015, 42, 382–393. [Google Scholar] [CrossRef]
  6. Gedir, J.V.; Cain, J.W., III; Harris, G.; Turnbull, T.T. Effects of climate change on long-term population growth of pronghorn in an arid environment. Ecosphere 2015, 6, 1–20. [Google Scholar] [CrossRef]
  7. Birnie-Gauvin, K.; Peiman, K.S.; Raubenheimer, D.; Cooke, S.J. Nutritional physiology and ecology of wildlife in a changing world. Conserv. Physiol. 2017, 5, cox030. [Google Scholar] [CrossRef]
  8. Fuller, A.; Mitchell, D.; Maloney, S.K.; Hetem, R.S. Towards a mechanistic understanding of the responses of large terrestrial mammals to heat and aridity associated with climate change. Clim. Chang. Responses 2016, 3, 10. [Google Scholar] [CrossRef]
  9. Smith, A.G.; McAlpine, C.A.; Rhodes, J.R.; Lunney, D.; Seabrook, L.; Baxter, G. Out on a limb: Habitat use of a specialist folivore, the koala, at the edge of its range in a modified semi-arid landscape. Landsc. Ecol. 2013, 28, 415–426. [Google Scholar] [CrossRef]
  10. Crowther, M.S.; Lunney, D.; Lemon, J.; Stalenberg, E.; Wheeler, R.; Madani, G.; Ross, K.A.; Ellis, M. Climate-mediated habitat selection in an arboreal folivore. Ecography 2014, 37, 336–343. [Google Scholar] [CrossRef]
  11. Davies, N.; Gramotnev, G.; Seabrook, L.; McAlpine, C.; Baxter, G.; Lunney, D.; Bradley, A. Climate-driven changes in diet composition and physiological stress in an arboreal folivore at the semi-arid edge of its distribution. Biol. Conserv. 2014, 172, 80–88. [Google Scholar] [CrossRef]
  12. Pettorelli, N.; Ryan, S.; Mueller, T.; Bunnefeld, N.; Jedrzejewska, B.; Lima, M.; Kausrud, K. The Normalized Difference Vegetation Index (NDVI): Unforeseen successes in animal ecology. Clim. Res. 2011, 46, 15–27. [Google Scholar] [CrossRef]
  13. Gamon, J.A.; Field, C.B.; Goulden, M.L.; Griffin, K.L.; Hartley, A.E.; Joel, G.; Penuelas, J.; Valentini, R. Relationships Between NDVI, Canopy Structure, and Photosynthesis in Three Californian Vegetation Types. Ecol. Appl. 1995, 5, 28–41. [Google Scholar] [CrossRef]
  14. Karnieli, A.; Agam, N.; Pinker, R.T.; Anderson, M.; Imhoff, M.L.; Gutman, G.G.; Panov, N.; Goldberg, A. Use of NDVI and Land Surface Temperature for Drought Assessment: Merits and Limitations. J. Clim. 2010, 23, 618–633. [Google Scholar] [CrossRef]
  15. Verdon-Kidd, D.C.; Scanlon, B.R.; Ren, T.; Fernando, D.N. A comparative study of historical droughts over Texas, USA and Murray-Darling Basin, Australia: Factors influencing initialization and cessation. Glob. Planet. Chang. 2017, 149, 123–138. [Google Scholar] [CrossRef]
  16. Mysterud, A.; Yoccoz, N.G.; Langvatn, R.; Pettorelli, N.; Stenseth, N.C. Hierarchical path analysis of deer responses to direct and indirect effects of climate in northern forest. Philos. Trans. R. Soc. B Biol. Sci. 2008, 363, 2357–2366. [Google Scholar] [CrossRef]
  17. Seabrook, L.; McAlpine, C.; Baxter, G.; Rhodes, J.; Bradley, A.; Lunney, D. Drought-driven change in wildlife distribution and numbers: A case study of koalas in south west Queensland. Wildl. Res. 2011, 38, 509–524. [Google Scholar] [CrossRef]
  18. Lovari, S.; Franceschi, S.; Chiatante, G.; Fattorini, L.; Fattorini, N.; Ferretti, F. Climatic changes and the fate of mountain herbivores. Clim. Chang. 2020, 162, 2319–2337. [Google Scholar] [CrossRef]
  19. Parida, M.; Hoffmann, A.A.; Hill, M.P. Climate change expected to drive habitat loss for two key herbivore species in an alpine environment. J. Biogeogr. 2015, 42, 1210–1221. [Google Scholar] [CrossRef]
  20. Trewin, B. The Australian Climate Observations Reference Network—Surface Air Temperature ACORN. J. Appl. Met. Climatol. 2016, 48, 2160–2168. [Google Scholar]
  21. BOM. Mean Monthly and Mean Annual Maximum, Minimum and Mean Temperature Data (Base Climatological Data Sets); Bureau of Meteorology: Melbourne, Australia, 2020. [Google Scholar]
  22. Youngentob, K.N.; Marsh, K.J.; Skewes, J. A Review of Koala Habitat Assessment Criteria and Methods, Canberra. 2021. Available online: https://www.agriculture.gov.au/sites/default/files/documents/review-koala-habitat-assessment-criteria-and-methods-2021.pdf (accessed on 12 March 2024).
  23. Predavec, M.; Lunney, D.; Shannon, I.; Lemon, J.; Sonawane, I.; Crowther, M. Using repeat citizen science surveys of koalas to assess their population trend in the north-west of New South Wales: Scale matters. Aust. Mammal. 2017, 40, 47–57. [Google Scholar] [CrossRef]
  24. Lunney, D.; Predavec, M.; Sonawane, I.; Kavanagh, R.; Barrott-Brown, G.; Phillips, S.; Callaghan, J.; Mitchell, D.; Parnaby, H.; Paull, D.C.; et al. The remaining koalas (Phascolarctos cinereus) of the Pilliga forests, north-west New South Wales: Refugial persistence or a population on the road to extinction? Pac. Conserv. Biol. 2017, 23, 277–294. [Google Scholar] [CrossRef]
  25. DAWE. Conservation Advice for Phascolarctos cinereus (Koala) combined populations of Queensland, New South Wales and the Australian Capital Territory, Canberra; The Australian Department of Agriculture, Water and the Environment (DAWE): Canberra, Australia, 2022. [Google Scholar]
  26. Beale, P.K.; Marsh, K.J.; Foley, W.J.; Moore, B.D. A hot lunch for herbivores: Physiological effects of elevated temperatures on mammalian feeding ecology. Biol. Rev. 2018, 93, 674–692. [Google Scholar] [CrossRef]
  27. Adam, D.; Johnston, S.D.; Beard, L.; Nicolson, V.; Gaughan, J.B.; Lisle, A.T.; FitzGibbon, S.; Barth, B.J.; Gillett, A.; Grigg, G.; et al. Body temperature of free-ranging koalas (Phascolarctos cinereus) in south-east Queensland. Int. J. Biometeorol. 2020, 64, 1305–1318. [Google Scholar] [CrossRef]
  28. Youngentob, K.N.; Lindenmayer, D.B.; Marsh, K.J.; Krockenberger, A.K.; Foley, W.J. Food intake: An overlooked driver of climate change casualties? Trends Ecol. Evol. 2021, 36, 676–678. [Google Scholar] [CrossRef]
  29. Reside, A.E.; Beher, J.; Cosgrove, A.J.; Evans, M.C.; Seabrook, L.; Silcock, J.L.; Wenger, A.S.; Maron, M. Ecological consequences of land clearing and policy reform in Queensland. Pac. Conserv. Biol. 2017, 23, 219–230. [Google Scholar] [CrossRef]
  30. Taylor, M.F.J. Destruction of Koala Habitat Increased after Listing as Vulnerable in 2012; WWF-Australia Technical Briefing; WWF-Australia: Canberra, Australia, 2020. [Google Scholar]
  31. Gordon, G.; Brown, A.S.; Pulsford, T. A koala (Phascolarctos cinereus Goldfuss) population crash during drought and heatwave conditions in south-western Queensland. Aust. J. Ecol. 1988, 13, 451–461. [Google Scholar] [CrossRef]
  32. DOEE, Department of Environment and Energy. Species Profile and Threats Database (SPRAT). 2015. Available online: https://www.environment.gov.au/cgi-bin/sprat/public/sprat.pl (accessed on 7 October 2021).
  33. Department of Environment, Land, Water and Planning. Victorian Biodiversity Atlas. 2021. Available online: https://vba.biodiversity.vic.gov.au/ (accessed on 7 October 2021).
  34. Tucker, C.J. Red and photographic infrared linear combinations for monitoring vegetation. Remote Sens. Environ. 1979, 8, 127–150. [Google Scholar] [CrossRef]
  35. Asrar, G.; Fuchs, M.; Kanemasu, E.T.; Hatfield, J.L. Estimating Absorbed Photosynthetic Radiation and Leaf Area Index from Spectral Reflectance in Wheat. Agron. J. 1984, 76, 300–306. [Google Scholar] [CrossRef]
  36. Sebastiani, A.; Salvati, R.; Manes, F. Comparing leaf area index estimates in a Mediterranean forest using field measurements, Landsat 8, and Sentinel-2 data. Ecol. Process. 2023, 12, 28. [Google Scholar] [CrossRef]
  37. Krause, C.; Dunn, B.; Bishop-Taylor, R.; Adams, C.; Burton, C.; Alger, M.; Chua, S.; Phillips, C.; Newey, C.; Kouzoubov, K.; et al. Digital Earth Australia Notebooks and Tools Repository. Geoscience Australia. 2021. Available online: https://knowledge.dea.ga.gov.au/notebooks/ (accessed on 7 October 2021).
  38. Zhu, Z.; Wang, S.; Woodcock, C.E. Improvement and expansion of the Fmask algorithm: Cloud, cloud shadow, and snow detection for Landsats 4–7, 8, and Sentinel 2 images. Remote. Sens. Environ. 2015, 159, 269–277. [Google Scholar] [CrossRef]
  39. Hoyer, S.; Hamman, J. xarray: N-D labeled Arrays and Datasets in Python. J. Open Res. Softw. 2017, 5, 10. [Google Scholar] [CrossRef]
  40. Jordahl, K.; Van Den Bossche, J.; Wasserman, J.; McBride, J.; Gerard, J.; Fleischmann, M.; Tratner, J.; Perry, M.; Farmer, C.; Hjelle, G.A.; et al. Geopandas/geopandas: v0.6.1. 2019. Available online: https://zenodo.org/records/3483425 (accessed on 7 October 2021).
  41. DAWE. National Vegetation Information System V6.0; The Australian Department of Agriculture, Water and the Environment (DAWE): Canberra, Australia, 2020. [Google Scholar]
  42. Brooks, M.E.; Kristensen, K.; Van Benthem, K.J.; Magnusson, A.; Berg, C.W.; Nielsen, A.; Skaug, H.J.; Mächler, M.; Bolker, B.M. glmmTMB balances speed and flexibility among packages for zero-inflated generalized linear mixed modeling. R J. 2017, 9, 378–400. [Google Scholar] [CrossRef]
  43. Hartig, F. DHARMa: Residual Diagnostics for Hierarchical (Multi-Level/Mixed) Regression Models. 2022. Available online: https://cran.r-project.org/web/packages/DHARMa/vignettes/DHARMa.html (accessed on 3 September 2023).
  44. R Core Team. R: A Language and Environment for Statistical Computing; R Foundation for Statistical Computing: Vienna, Austria, 2022. [Google Scholar]
  45. Seabold, S.; Perktold, J. Statsmodels: Econometric and Statistical Modeling with Python. In Proceedings of the 9th Python in Science Conference, Austin, TX, USA, 28 June–3 July 2010; pp. 92–96. [Google Scholar]
  46. Van Dijk, A.I.J.M.; Beck, H.E.; Crosbie, R.S.; de Jeu, R.A.M.; Liu, Y.Y.; Podger, G.M.; Timbal, B.; Viney, N.R. The Millennium Drought in southeast Australia (2001–2009): Natural and human causes and implications for water resources, ecosystems, economy, and society. Water Resour. Res. 2013, 49, 1040–1057. [Google Scholar] [CrossRef]
  47. Jiao, T.; Williams, C.A.; Rogan, J.; De Kauwe, M.G.; Medlyn, B.E. Drought impacts on Australian vegetation during the millennium drought measured with multisource spaceborne remote sensing. J. Geophys. Res. Biogeosci. 2020, 125, e2019JG005145. [Google Scholar] [CrossRef]
  48. QGIS.org. QGIS Geographic Information System. 2021. Available online: https://www.qgis.org/ (accessed on 10 November 2023).
  49. Crossman, S.; Li, O. Surface Hydrology Lines (Regional). 2015. Available online: http://pid.geoscience.gov.au/dataset/ga/83107 (accessed on 3 February 2023).
  50. Rouault, E.; Warmerdam, F.; Schwehr, K.; Kiselev, A.; Butler, H.; Łoskot, M.; Szekeres, T.; Tourigny, E.; Landa, M.; Miara, I.; et al. GDAL. 2022. Available online: https://gdal.org (accessed on 22 March 2022).
  51. Briscoe, N.J.; Kearney, M.R.; Taylor, C.A.; Wintle, B.A. Unpacking the mechanisms captured by a correlative species distribution model to improve predictions of climate refugia. Glob. Chang. Biol. 2016, 22, 2425–2439. [Google Scholar] [CrossRef]
  52. Youngentob, K.N.; Yoon, H.; Stein, J.; Lindenmayer, D.B.; Held, A.A. Where the wild things are: Using remotely sensed forest productivity to assess arboreal marsupial species richness and abundance. Divers. Distrib. 2015, 21, 977–990. [Google Scholar] [CrossRef]
  53. Pettorelli, N.; Bro-Jørgensen, J.; Durant, S.M.; Blackburn, T.; Carbone, C. Energy availability and density estimates in African ungulates. Am. Nat. 2009, 173, 698–704. [Google Scholar] [CrossRef]
  54. Law, B.S.; Brassil, T.; Gonsalves, L.; Roe, P.; Truskinger, A.; McConville, A. Passive acoustics and sound recognition provide new insights on status and resilience of an iconic endangered marsupial (koala Phascolarctos cinereus) to timber harvesting. PLoS ONE 2018, 13, e0205075. [Google Scholar] [CrossRef]
  55. Law, B.; Caccamo, G.; Roe, P.; Truskinger, A.; Brassil, T.; Gonsalves, L.; McConville, A.; Stanton, M. Development and field validation of a regional, management-scale habitat model: A koala Phascolarctos cinereus case study. Ecol. Evol. 2017, 7, 7475–7489. [Google Scholar] [CrossRef]
  56. McArt, S.H.; Spalinger, D.E.; Collins, W.B.; Schoen, E.R.; Stevenson, T.; Bucho, M. Summer dietary nitrogen availability as a potential bottom-up constraint on moose in south-central Alaska. Ecology 2009, 90, 1400–1411. [Google Scholar] [CrossRef]
  57. Pyke, G.H. Optimal foraging theory: An introduction. In Encyclopedia of Animal Behaviour; Elsevier Academic Press: Amsterdam, The Netherlands, 2019; pp. 111–117. [Google Scholar]
  58. Stephens, D.W.; Krebs, J.R. Foraging Theory; Princeton University Press: Princeton, NJ, USA, 1986. [Google Scholar]
  59. Evans, J.R. Photosynthesis and nitrogen relationships in leaves of C3 plants. Oecologia 1989, 78, 9–19. [Google Scholar] [CrossRef]
  60. Moore, B.D.; Foley, W.J. Tree use by koalas in a chemically complex landscape. Nature 2005, 435, 488–490. [Google Scholar] [CrossRef] [PubMed]
  61. Kozlowski, T.T.; Pallardy, S.G. Acclimation and adaptive responses of woody plants to environmental stresses. Bot. Rev. 2002, 68, 270–334. [Google Scholar] [CrossRef]
  62. Wright, I.J.; Reich, P.B.; Westoby, M.; Ackerly, D.D.; Baruch, Z.; Bongers, F.; Cavender-Bares, J.; Chapin, T.; Cornelissen, J.H.C.; Diemer, M.; et al. The worldwide leaf economics spectrum. Nature 2004, 428, 821–827. [Google Scholar] [CrossRef] [PubMed]
  63. Ellis, W.; Melzer, A.; Clifton, I.; Carrick, F. Climate change and the koala Phascolarctos cinereus: Water and energy. Aust. Zool. 2010, 35, 369–377. [Google Scholar] [CrossRef]
  64. Donohue, R.J.; Roderick, M.L.; McVicar, T.R. Deriving consistent long-term vegetation information from AVHRR reflectance data using a cover-triangle-based framework. Remote Sens. Environ. 2008, 112, 2938–2949. [Google Scholar] [CrossRef]
  65. Davies, N.; Gramotnev, G.; Seabrook, L.; Bradley, A.; Baxter, G.; Rhodes, J.; Lunney, D.; McAlpine, C. Movement patterns of an arboreal marsupial at the edge of its range: A case study of the koala. Mov. Ecol. 2013, 1, 8. [Google Scholar] [CrossRef]
  66. Doody, T.M.; Benger, S.N.; Pritchard, J.L.; Overton, I.C. Ecological response of Eucalyptus camaldulensis (river red gum) to extended drought and flooding along the River Murray, South Australia (1997–2011) and implications for environmental flow management. Mar. Freshw. Res. 2014, 65, 1082–1093. [Google Scholar] [CrossRef]
  67. DeGabriel, J.L.; Moore, B.D.; Felton, A.M.; Ganzhorn, J.U.; Stolter, C.; Wallis, I.R.; Johnson, C.N.; Foley, W.J. Translating nutritional ecology from the laboratory to the field: Milestones in linking plant chemistry to population regulation in mammalian browsers. Oikos 2014, 123, 298–308. [Google Scholar] [CrossRef]
  68. Crowther, M.S.; Rus, A.I.; Mella, V.S.A.; Krockenberger, M.B.; Lindsay, J.; Moore, B.D.; McArthur, C. Patch quality and habitat fragmentation shape the foraging patterns of a specialist folivore. Behav. Ecol. 2022, 33, 1007–1017. [Google Scholar] [CrossRef]
  69. CSIRO; BoM. State of the Climate 2022. 2023. Available online: https://www.csiro.au/en/research/environmental-impacts/climate-change/state-of-the-climate (accessed on 14 May 2024).
  70. Santika, T.; McAlpine, C.A.; Lunney, D.; Wilson, K.A.; Rhodes, J.R. Modelling species distributional shifts across broad spatial extents by linking dynamic occupancy models with public-based surveys. Divers. Distrib. 2014, 20, 786–796. [Google Scholar] [CrossRef]
  71. Adams-Hosking, C.; Grantham, H.S.; Rhodes, J.R.; McAlpine, C.; Moss, P.T. Modelling climate-change-induced shifts in the distribution of the koala. Wildl. Res. 2011, 38, 122–130. [Google Scholar] [CrossRef]
  72. Fitzpatrick, M.C.; Hargrove, W.W. The projection of species distribution models and the problem of non-analog climate. Biodivers. Conserv. 2009, 18, 2255–2261. [Google Scholar] [CrossRef]
  73. Nolan, R.H.; Lane, P.N.; Benyon, R.G.; Bradstock, R.A.; Mitchell, P.J. Trends in evapotranspiration and streamflow following wildfire in resprouting eucalypt forests. J. Hydrol. 2015, 524, 614–624. [Google Scholar] [CrossRef]
  74. Caccamo, G.; Bradstock, R.; Collins, L.; Penman, T.; Watson, P. Using MODIS data to analyse post-fire vegetation recovery in Australian eucalypt forests. J. Spat. Sci. 2015, 60, 341–352. [Google Scholar] [CrossRef]
  75. Choat, B.; Brodribb, T.J.; Brodersen, C.R.; Duursma, R.A.; López, R.; Medlyn, B.E. Triggers of tree mortality under drought. Nature 2018, 558, 531–539. [Google Scholar] [CrossRef]
  76. Yebra, M.; Quan, X.; Riaño, D.; Larraondo, P.R.; van Dijk, A.I.; Cary, G.J. A fuel moisture content and flammability monitoring methodology for continental Australia based on optical remote sensing. Remote. Sens. Environ. 2018, 212, 260–272. [Google Scholar] [CrossRef]
  77. Johnson, D.C.; Shapcott, A. Koala forest habitat recovery varies with fire severity. For. Ecol. Manag. 2024, 556, 121704. [Google Scholar] [CrossRef]
  78. Lane, M.R.; Youngentob, K.N.; Clark, R.G.; Marsh, K.J. The nutritional quality of post-fire eucalypt regrowth and its consumption by koalas in the New South Wales Southern Tablelands. Aust. J. Zool. 2024, 71, ZO23024. [Google Scholar] [CrossRef]
  79. Rifai, S.W.; De Kauwe, M.G.; Gallagher, R.V.; Cernusak, L.A.; Meir, P.; Pitman, A.J. Burn severity and post-fire weather are key to predicting time-to-recover from Australian forest fires. Earth’s Future 2024, 12, e2023EF003780. [Google Scholar] [CrossRef]
  80. Losso, A.; Challis, A.; Gauthey, A.; Nolan, R.H.; Hislop, S.; Roff, A.; Boer, M.M.; Jiang, M.; Medlyn, B.E.; Choat, B. Canopy dieback and recovery in Australian native forests following extreme drought. Sci. Rep. 2022, 12, 21608. [Google Scholar] [CrossRef]
  81. Mella, V.S.A.; McArthur, C.; Krockenberger, M.B.; Frend, R.; Crowther, M.S. Needing a drink: Rainfall and temperature drive the use of free water by a threatened arboreal folivore. PLoS ONE 2019, 14, e0216964. [Google Scholar] [CrossRef] [PubMed]
  82. Kirono, D.G.; Round, V.; Heady, C.; Chiew, F.H.; Osbrough, S. Drought projections for Australia: Updated results and analysis of model simulations. Weather. Clim. Extremes 2020, 30, 100280. [Google Scholar] [CrossRef]
  83. Donaldson, J.E.; Parr, C.L.; Mangena, E.H.; Archibald, S. Droughts decouple African savanna grazers from their preferred forage with consequences for grassland productivity. Ecosystems 2020, 23, 689–701. [Google Scholar] [CrossRef]
  84. Guo, W.; Huang, S.; Huang, Q.; Leng, G.; Mu, Z.; Han, Z.; Wei, X.; She, D.; Wang, H.; Wang, Z.; et al. Drought trigger thresholds for different levels of vegetation loss in China and their dynamics. Agric. For. Meteorol. 2023, 331, 109349. [Google Scholar] [CrossRef]
  85. Pettorelli, N. The Normalized Difference Vegetation Index; Oxford University Press: Oxford, UK, 2013. [Google Scholar]
  86. Mitchell, D.L.; Soto-Berelov, M.; Langford, W.T.; Jones, S.D. Factors confounding koala habitat mapping at multiple decision-making scales. Ecol. Manag. Restor. 2021, 22, 171–182. [Google Scholar] [CrossRef]
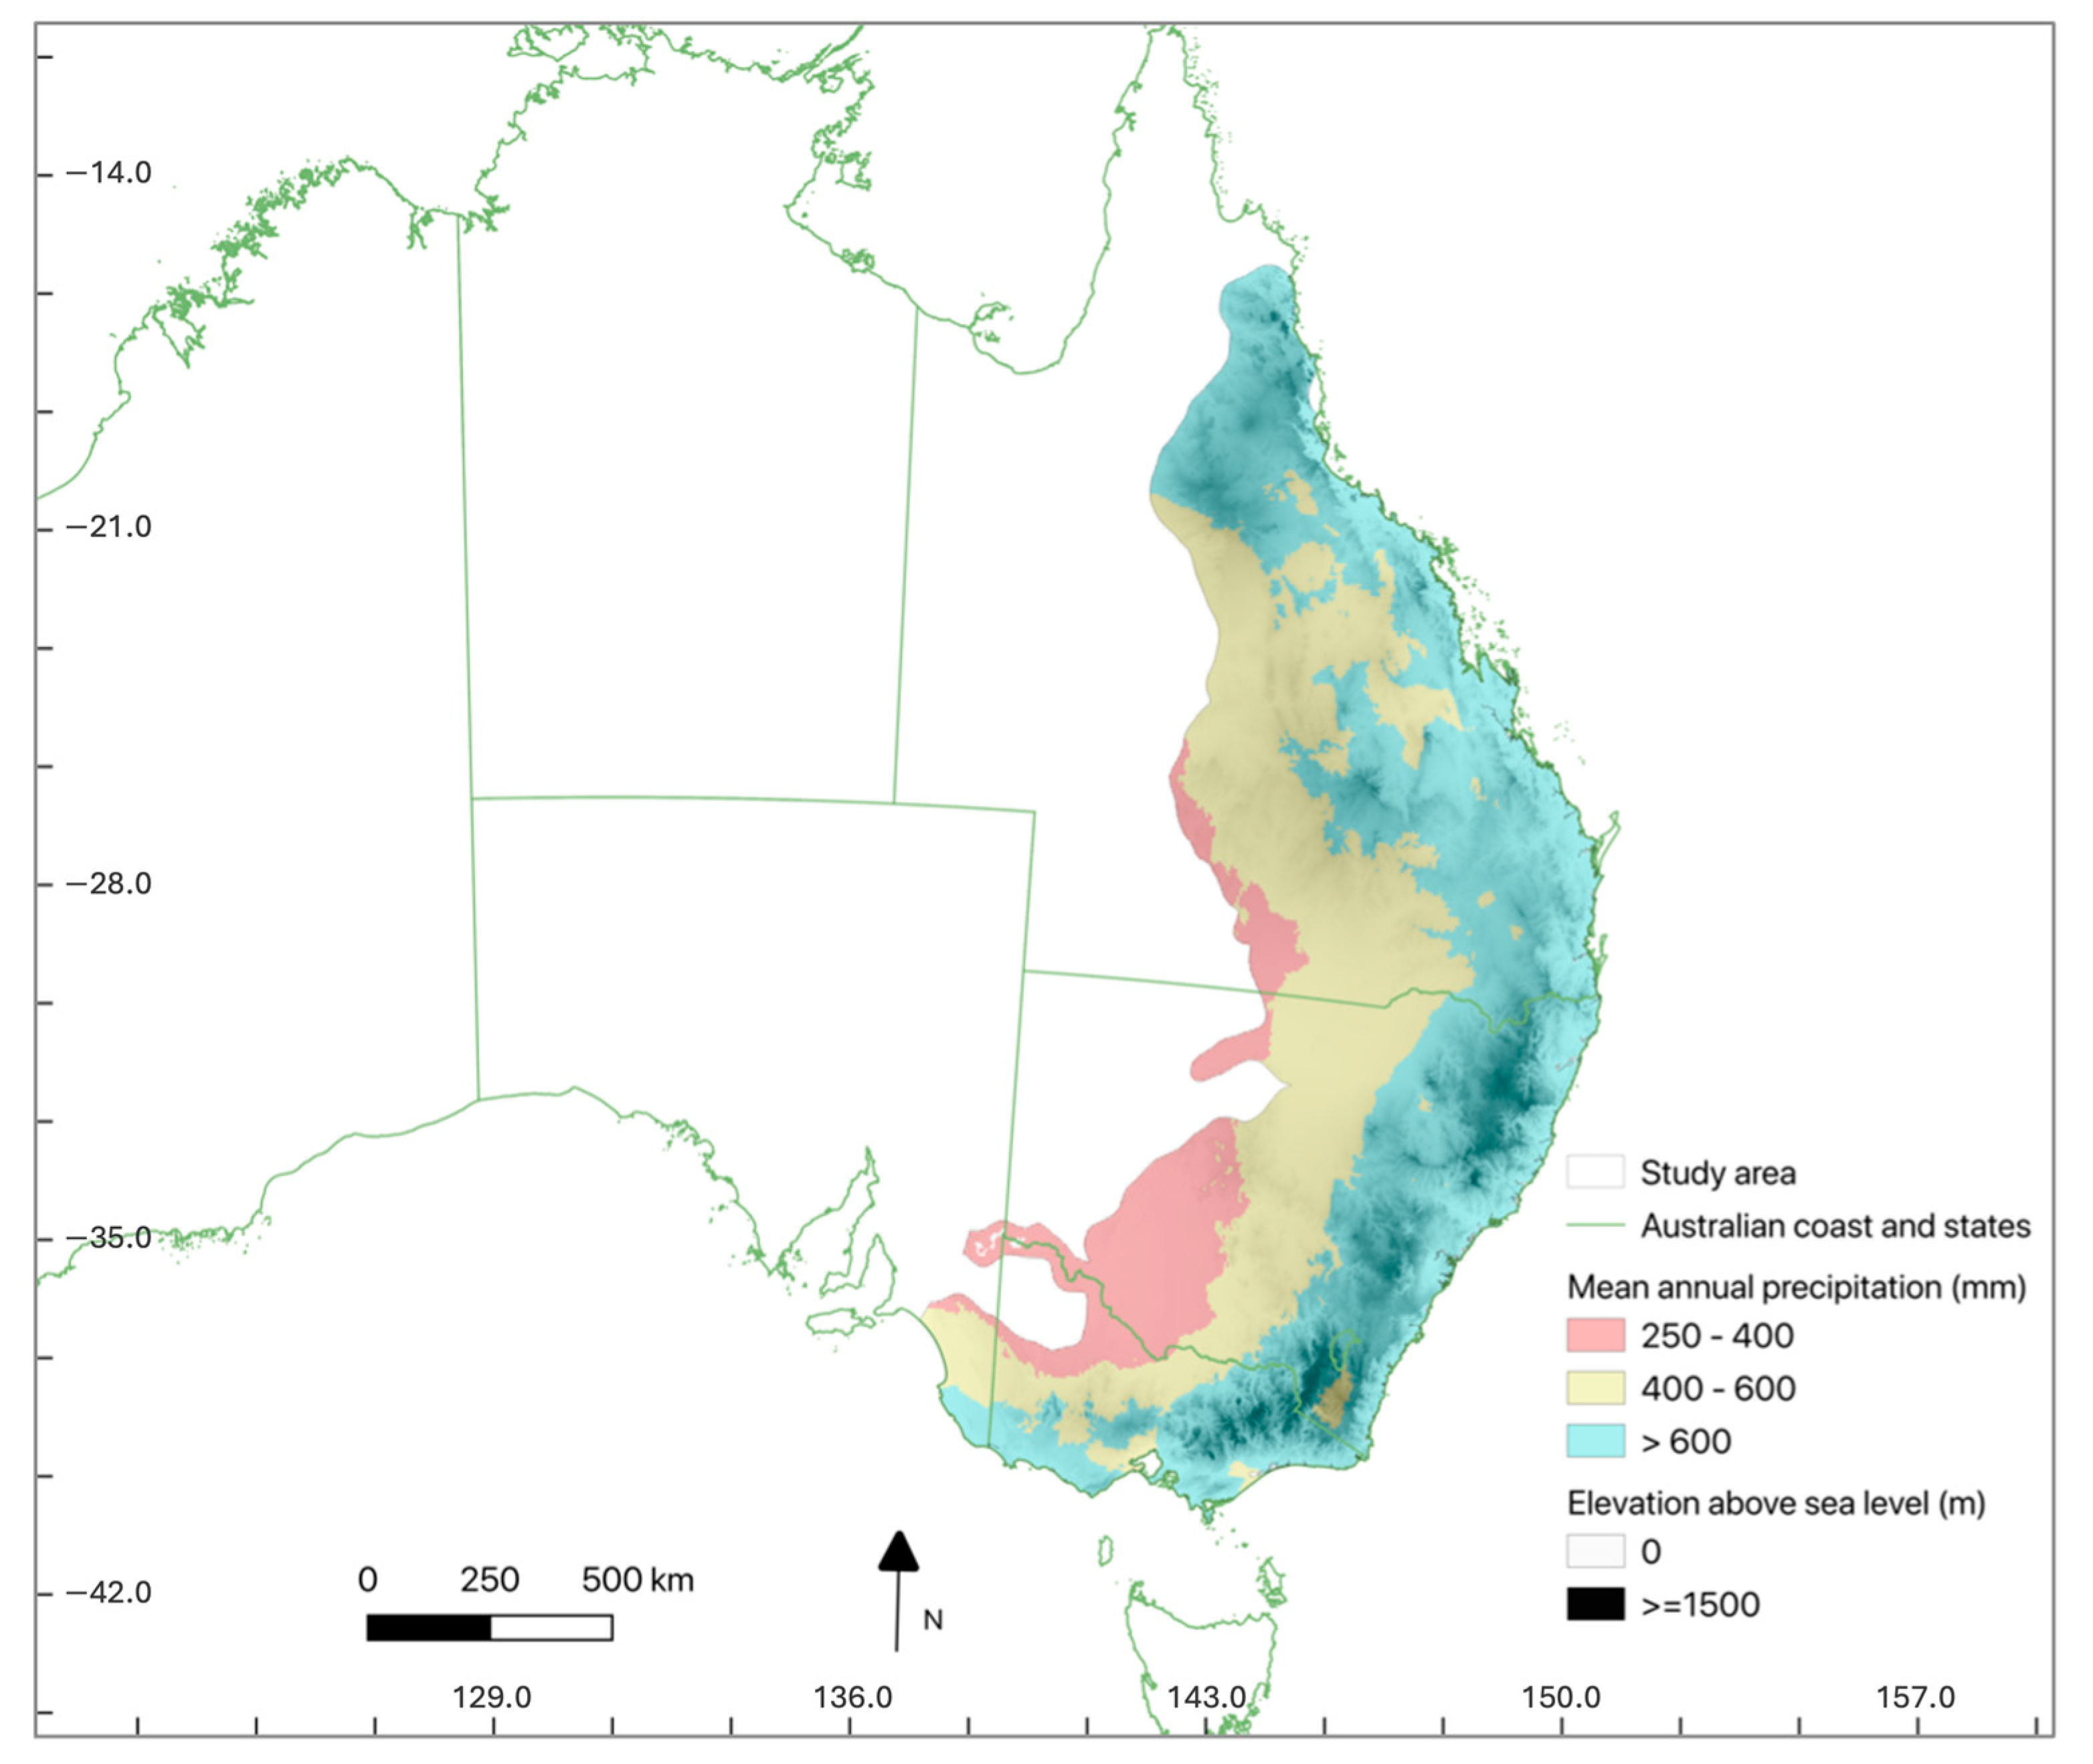
Figure 1. The study area, covering most of the koala range in eastern Australia (i.e., coloured area). The colours show mean annual precipitation classes (http://www.bom.gov.au/climate/maps/ [accessed on 17 March 2023]) and shading represent elevation increasing from lighter at sea level to darker at the highest mountains (https://www.gebco.net/data_and_products/ [accessed on 17 March 2023]).
Remotesensing 16 03279 g001
Figure 2. Methodological framework of this study. Dashed box indicates the input datasets. Directional lines indicate steps in the methods and combinations of data to produce results.
Remotesensing 16 03279 g002
Figure 3. A violin plot of NDVI by vegetation group (colour) and data type (letters and shades): koala site (K, dark) and random landscape location (L, light). n = 4500. The landscape NDVI is random in space, within the respective vegetation group, and paired in time to the koala site NDVI, which is the NDVI value at the time and place of observations from anytime in the study period (1995–2009). The violins are scaled to have the same area. Shown inside the violins are simplified boxplots with a white dot at the median.
Remotesensing 16 03279 g003
Figure 4. Combined effect size plot of three binomial generalised linear mixed models, one per vegetation group, to determine whether the NDVI is a significant explanatory variable for the differences between where koalas have been observed and random pixels across the koala range within the same vegetation groups. The effect sizes are logarithm odds ratios. The error bars represent 95% confidence intervals with those not crossing zero indicating a significant effect. P-values: woodlands = 3.58 × 10⁻⁵, open forests = 8.41 × 10⁻¹², tall open forests = 2.71 × 10⁻¹². n = 4500 (i.e., n = 1500 per vegetation group/model). Models formulation: GLMM = Class ~ NDVI + SpatialCovariance (where class is a koala site or random location and the NDVI is standardised).
Remotesensing 16 03279 g004
Figure 5. Empirical cumulative distributions of the NDVI in koala sites at the time of observation with the 5th percentile thresholds overlaid as dashed lines (i.e., proportion = 0.05). The colours represent vegetation groups. The cut-off in maximum NDVI = 0.86 is visible, with this threshold used as an upper bound of the data to avoid potential saturation of the NDVI, which is known to occur above this NDVI value for this data type.
Remotesensing 16 03279 g005
Figure 6. Differences between pre-drought (1995–1999) and drought (2005–2009) periods in the NDVI minimum (5th percentile) of vegetation groups in the landscape. The NDVI minimum is the 5th percentile across time for each pixel. The boxes are interquartile ranges with a median dividing line.
Remotesensing 16 03279 g006
Figure 7. Maps of potential koala habitat that was (a) above the thresholds in 1995–1999 (pre-drought), (b) potential habitat that had been above thresholds in 1995–1999 that was below thresholds in 2005–2009 (drought).
Remotesensing 16 03279 g007
Figure 8. A map of potential koala habitat in the Liverpool Range, NSW, that was above (blue) the thresholds in 1995–1999 (pre-drought) and vegetation that had been above in 1995–1999 that was below (red) the thresholds in 2005–2009 (drought). Central coordinate: 150.23443, −31.93875 (coordinate system = EPSG:4326). Basemap is the NSW Imagery dataset, accessed via https://datasets.seed.nsw.gov.au/dataset/5601b661-3352-47ad-a8e5-09278927226f (accessed 28 May 2024).
Remotesensing 16 03279 g008
Table 1. Data sources of koala records and landscape layers used in this study.
SourceVariable Study UseNative ResolutionSource Website
Landsat satellite datacube hosted by Geoscience Aus. and NCINormalised difference vegetation index [NDVI] (from corrected reflectance rasters)Landscape vegetation condition and koala site vegetation condition 25 × 25 mhttp://pid.geoscience.gov.au/dataset/ga/144643
(accessed 4 August 2023)
Species Profile and Threats Database (SPRAT)Koala presenceIdentify associated vegetation conditionVector pointshttps://www.environment.gov.au/sprat
(accessed 7 October 2021)
National Vegetation Information System (NVIS v6.0)Vegetation group (based on NVIS major vegetation groups [MVG]) raster Assign NDVI and koala presence observations into vegetation groups100 × 100 mhttps://www.environment.gov.au/fed
(accessed 7 October 2021)
Surface Hydrology Lines (Regional)Perennial water courses and bodiesCalculate distance of observations and potential habitat to waterVector lines and polygonshttp://pid.geoscience.gov.au/dataset/ga/83107
(accessed 17 November 2021)
Table 2. Area of vegetation above thresholds, per group, in the landscape minimum NDVI data for the 1995–1999 and 2005–2009 time periods. Thresholds were based on koala observation sites, identified by the lowest NDVI (5th percentile) of each vegetation group.
Area of Vegetation above the NDVI Thresholds (km2)Difference between Periods (%)
Vegetation GroupPre-Drought
1995–1999
Drought
2005–2009
Woodlands100,30584,370−15.8%
Open Forests54,90451,180−6.8%
Tall Open Forests35,01731,195−10.9%
All groups190,227166,746−12.3%
Disclaimer/Publisher’s Note: The statements, opinions and data contained in all publications are solely those of the individual author(s) and contributor(s) and not of MDPI and/or the editor(s). MDPI and/or the editor(s) disclaim responsibility for any injury to people or property resulting from any ideas, methods, instructions or products referred to in the content.