Article

Spatiotemporal Changes of Glaciers in the Yigong Zangbo River Basin over the Period of the 1970s to 2023 and Their Driving Factors

1
Shaanxi Key Laboratory of Earth Surface System and Environmental Carrying Capacity, College of Urban and Environmental Science, Northwest University, Xi’an 710127, China
2
Institute of Earth Surface System and Hazards, College of Urban and Environmental Sciences, Northwest University, Xi’an 710127, China
3
State Key Laboratory of Tibetan Plateau Earth System, Environment and Resources, Institute of Tibetan Plateau Research, Chinese Academy of Sciences, Beijing 100101, China
*
Author to whom correspondence should be addressed.
Remote Sens. 2024, 16(17), 3272; https://doi.org/10.3390/rs16173272
Submission received: 27 June 2024 / Revised: 29 August 2024 / Accepted: 30 August 2024 / Published: 3 September 2024
(This article belongs to the Special Issue Remote Sensing of the Cryosphere (Second Edition))

Abstract

:
The glaciers in southeastern Tibet Plateau (SETP) influenced by oceanic climate are sensitive to global warming, and there remains a notable deficiency in accurate multitemporal change analyses of these glaciers. We conduct glacier inventories in the Yigong Zangbo River Basin (YZRB) in SETP for the years 1988, 2015, and 2023 utilizing Landsat and Sentinel-2 imagery, and analyze the glacier spatiotemporal variation incorporating the existing glacier inventory data. Since the 1970s until 2023, the glaciers significantly retreated at a rate of 0.76 ± 0.11%·a−1, with the area decreasing from 2583.09 ± 88.80 km2 to 1635.89 ± 71.74 km2, and the ice volume reducing from 221.7017 ± 7.9618 km3 to 152.7429 ± 6.1747 km3. The most significant retreat occurred in glaciers smaller than 1 km2. Additionally, glaciers on southern aspects retreated slower than the northern counterparts. The glaciers in the western YZRB witnessed a significantly greater shrinkage rate than those in the eastern section, with the most pronounced changes occurring in Aso Longbu River Basin. Furthermore, severe glacier mass deficits were observed from 2000 to 2019, averaging a loss rate of 0.57 ± 0.06 m w.e. a−1. The continuous rise in air temperature has primarily induced a general widespread glacier change in the YZRB. However, diverse topography led to spatial variability in glacier changes with discrepancies as large as several times. The features of individual glaciers, such as glacier size, debris cover, and the development of ice-contact glacial lakes enhanced the local complexity of glacier change and elusive response behaviors to climate warming led by the different topographic conditions.

1. Introduction

The Tibetan Plateau (TP) features the most concentrated glaciers outside of the polar regions and Greenland [1], with the state of glaciers exhibiting significant regional differences [2]. From 1961 to 2020, the air temperature on the TP has steadily increased by 0.16 °C every decade surpassing the global average two fold [3]. The sixth assessment report of the Intergovernmental Panel on Climate Change (IPCC AR6) forecasts a further global temperature increase of 1.5 °C within two decades [4]. Ongoing global warming and the significant sensitivity of marine glaciers to temperature increases have precipitated an intense and accelerating loss in glacier mass [5], as well as heightened interannual variability in southeastern Tibet (SETP) [6], with the degree of deficit surpassing that of the interior and western regions of the TP [7]. Thus, the focus on long-term glacial variations in SETP is of paramount significance.
The digital glaciers information in SETP that is often used for large-scale glacier change investigations originates from the first and second Chinese Glacier Inventories (CGI1 and CGI2) [8,9]; both datasets have been incorporated into world glacier inventories such as Global Land Ice Measurements from Space (GLIMS) and the Randolph Glacier Inventory (RGI) [10]. Persistent seasonal snowfall and cloud cover in SETP have resulted in a dearth of available imagery; CGI2 continues to rely on the outcomes derived from CGI1 that primarily identify glaciers through low-altitude aerial photography had limited accuracy, resulting in a potential overestimation of glaciated areas [11]. The updates to the CGI2 still present some discrepancies in glacier boundaries, with the RGI6.0 test labels being concentrated around the year 2005 and the Synthetic Aperture Radar (SAR) imagery dating around 2009 [12]. Recent studies have provided accurate glacier information for glacier monitoring [10] and established a baseline dataset for delineating future glacier changes [11]. These investigations reveal that the glacier area in SETP continued to decrease from the 1970s to 2020, with a total degraded glacier area of 2759.14 km2, corresponding to a melting rate of 0.45%·a−1 [10]. Additionally, a consistent negative mass balance was documented, with the significant losses concentrating post-2000 accounting for 66% of the total reduction. From 2000 to 2020, the glacier mass loss was 3.7 times that of the period from 1970 to 2000 [13], with most maritime glaciers having an average mass balance between −0.66 and −0.61 m w.e. a−1 [14]. The retreat of glacier termini further confirms the sustained reduction [15], and this diminishing trend is exacerbated by regional disparities, particularly within the Nyainqêntanglha range [13]. This region has undergone considerable shrinkage and accelerated annual mass balance loss [16,17,18,19], with the eastern sectors of Yigong Zangbo River Basin (YZRB) exhibiting even more substantial changes [7]. The intense melting combined with precipitated has exacerbated the risk of glacier avalanches and glacial lake outburst floods within the YZRB, garnering widespread attention [19,20,21].
Current research in the focus area, the YZRB, where the glacier area reached 2698 km2 with a glaciation coverage of 27.5% as of 2010, has highlighted spatiotemporal heterogeneity in glacier retreat [22]. During the decade from 1990 to 2000, the glacier coverage in the Linzhi region, which includes the YZRB, significantly decreased by 568.71 km2, averaging a retreat of 56.87 km2·a−1 [23]. The decline in glacier surface elevation accelerated in the YZRB at a rate from −0.94 m·a−1 between 2003 and 2009 to −1.36 m·a−1 between 2003 and 2016 [24,25]. The large glaciers in YZRB diminished by 25.74 km2, representing 64.6% of the total reduction from 1980 to 2010 [26], and the NiwuZangbo River Basin—a sub-watershed of YGRB—exhibited a net reduction in glacier area from 928.76 km2 to 901.51 km2 [27]. Research on individual glaciers within the YZRB has also confirmed the ongoing reduction of glaciers in the region. Notably, the Lanong Glacier’s terminus retreat by 9.8 m·a−1 from 1970 to 1999 slowed to 3.25 m·a−1 from 1999 to 2003 [28]. In addition, the Yalong Glacier in the YZRB recorded the most substantial net area decrease, amounting to 20.43 km2 from 1980 to 2015 [29,30], with an average mass loss rate of −0.73 ± 0.13 m w.e. a−1 from 1974 to 2015 [31]. Additionally, Research by Li Lanyu et al. underscored the persistent decrease in glacial mass and area from 2003 to 2015 within the YZRB, elucidating rising temperatures as the primary driving factors for these changes [32]. While existing analyses are typically confined to specific areas, short time series, or merely general trends of change, comprehensive and detailed multitemporal analyses of the diverse glacier changes in the YZRB remain deficient, warranting further investigation.
The current trend of global warming, coupled with an increase and intensification in extreme weather events like high temperatures and intense precipitation, is expected to cause further significant retreats of maritime glaciers in the basin [14]. This retreat poses a risk of disasters and impacts water supply for rivers, affecting agriculture, the economy, and the lives of residents along the way [33]. This study aims to address the under-researched long-term glacier variation in the YZRB and includes the analysis of the underlying driving factors. By conducting a thorough investigation, this endeavor will enhance our understanding of glaciers; interplay with topographic elements, glaciers’ features, and climatic adaptability within the basin.

2. Materials and Methods

2.1. Study Area

The Yigong Zangbo River Basin (YZRB) is located at the southeastern Tibet Plateau (30°05′–31°03′N, 92°52′–95°19′E), covering parts of Jiali, Bianba, and Bomi counties. As illustrated in Figure 1, it comprises sub-basins of the Aosuo Longbu, Nidu Zangbu, Niwu Zangbu, Jiagong Nongbu, and Xiuda Qu [34]. The combination of high mountainous terrain and abundant precipitation promotes the extensive glacier area, including some of the larger glaciers in the High Asia [27] area. Encompassing 13,533 km2, the average elevation of basin exceeds 4000 m, with the most significant altitudes found in the northern and western regions. It features a widespread spread of glacial debris and scattered glacial lakes and showcases intense glacial erosion activities. The weak geological foundation of the basin predisposes it to frequent mountain natural disasters [35], also altering the topography and impacting glacier distribution. Influenced by humid and warm air flow from the Indian Ocean, the basin receives higher annual precipitation, with over 74.9% occurring in summer [22], and records an annual average temperature of approximately −8.8 °C. The interaction between abundant precipitation and steep valley topography cultivates unique marine-type valley glaciers, making it a typical modern glacier center. At above 5000 m, moraine hills undulate, highlighting the interplay between glaciers, climate, geographic conditions. Recent trends show rising summer temperatures and annual precipitation, positioning the basin as the most obvious area of glacier retreat in the Tibetan Plateau [36], with Glacial Lake Outburst Floods (GLOFs) occurring with increasing frequency [21]. According to the existing glacier inventory data [10], the basin contains 1650 glaciers with a total area of 2583.09 ± 88.80 km2 and a volume of 221.7017 ± 7.9618 km3 in 1970s.

2.2. Materials

2.2.1. Remote Sensing Image

Glacier boundaries were delineated using Landsat images obtained from the United States Geological Survey (USGS) (http://glovis.usgs.gov/) (accessed on 1 June 2023). The employed L1T products, systematically corrected for radiometric and geometric distortions, have a geometric accuracy within 13 m [37]. The Landsat images used in this study are shown in Table 1. A series of preprocessing steps were applied to the images to ensure their quality and accuracy, and we merged the visible and panchromatic bands of Landsat ETM+ and OLl images to improve spatial resolution while preserving multispectral integrity, achieving a 15 m spatial resolution via Gram–Schmidt pan-sharpening tool. All preprocessing steps and classifications of the Landsat images were conducted in ENVI5.3. For minimum impact of seasonal snow cover [38], we selected Landsat data captured at the end of the ablation period and before the first snowfall event (June to September). The rugged terrain, frequent clouds cover and thick debris in mountainous environments, and the seasonal timing restrictions, make it particularly difficult to acquire multiple high-quality images for any one year. To address this, we superimposed surrounding scenes or images from alternate dates to map the hidden glaciers or missing portions. High-resolution Sentinel-2 MSI imagery was also employed as supplementary reference data to enhance the precision of glacier boundary delineation. Furthermore, the first glacier inventory, derived from manual interpretation of aerial topographic maps and photographs from the 1970s to 1980s, with primary data from the Basin dating back to the 1970s, facilitates the examination of glacial fluctuations within this research.

2.2.2. Digital Elevation Model (DEM) Data

Three types of Digital Elevation Model (DEM) data were selected in this study. The NASA/NASADEM_HGT/001 dataset [39], available on Google Earth Engine (GEE) with a 1 arc-second resolution (approximately 30 m), assists in evaluating glacier area changes related to different elevations. In addition to amalgamating data from the original Shuttle Radar Topography Mission (SRTM) DEM, the Advanced Spaceborne Thermal Emission and Reflection Radiometer (ASTER) GDEM, and ground measurements, this dataset improves phase unwrapping for void reduction and uses ICESat Geoscience Laser Altimeter System (GLAS) data for control. The ALOS World 3D Version 3.1 global digital surface model (DSM) serves to assess the current elevation distribution of glacier areas [40]. The updated Version 3.1 with 30 m horizontal resolution, updated in April 2020 for regions north of 60 degrees south latitude and in January 2021 for areas south of it, features latitude-specific variable pixel spacing. Additionally, this iteration introduces enhanced formatting, supplementary data, and refined processing methodologies, and enhancements in anomaly detection have also been realized. The ICESat-2 L3A Land Ice Height data product (ATL06), which features a high firing rate and a multi-beam design, significantly enhances the capability to monitor glacier elevation changes through dense and intersecting measurements [41]. It provides precise measurements of latitude, longitude, elevation, and time for each measured footprint with a 20 m sampling interval and a surface elevation precision of up to 0.1 m. In this study, the data within the YZRB downloaded from the EARTHDATA platform (https://search.earthdata.nasa.gov/) (accessed on 25 March 2024) were converted to UTM coordinates and adjusted by subtracting the geoid height to obtain the corrected altitude for the period from 1 August to 1 October 2019.
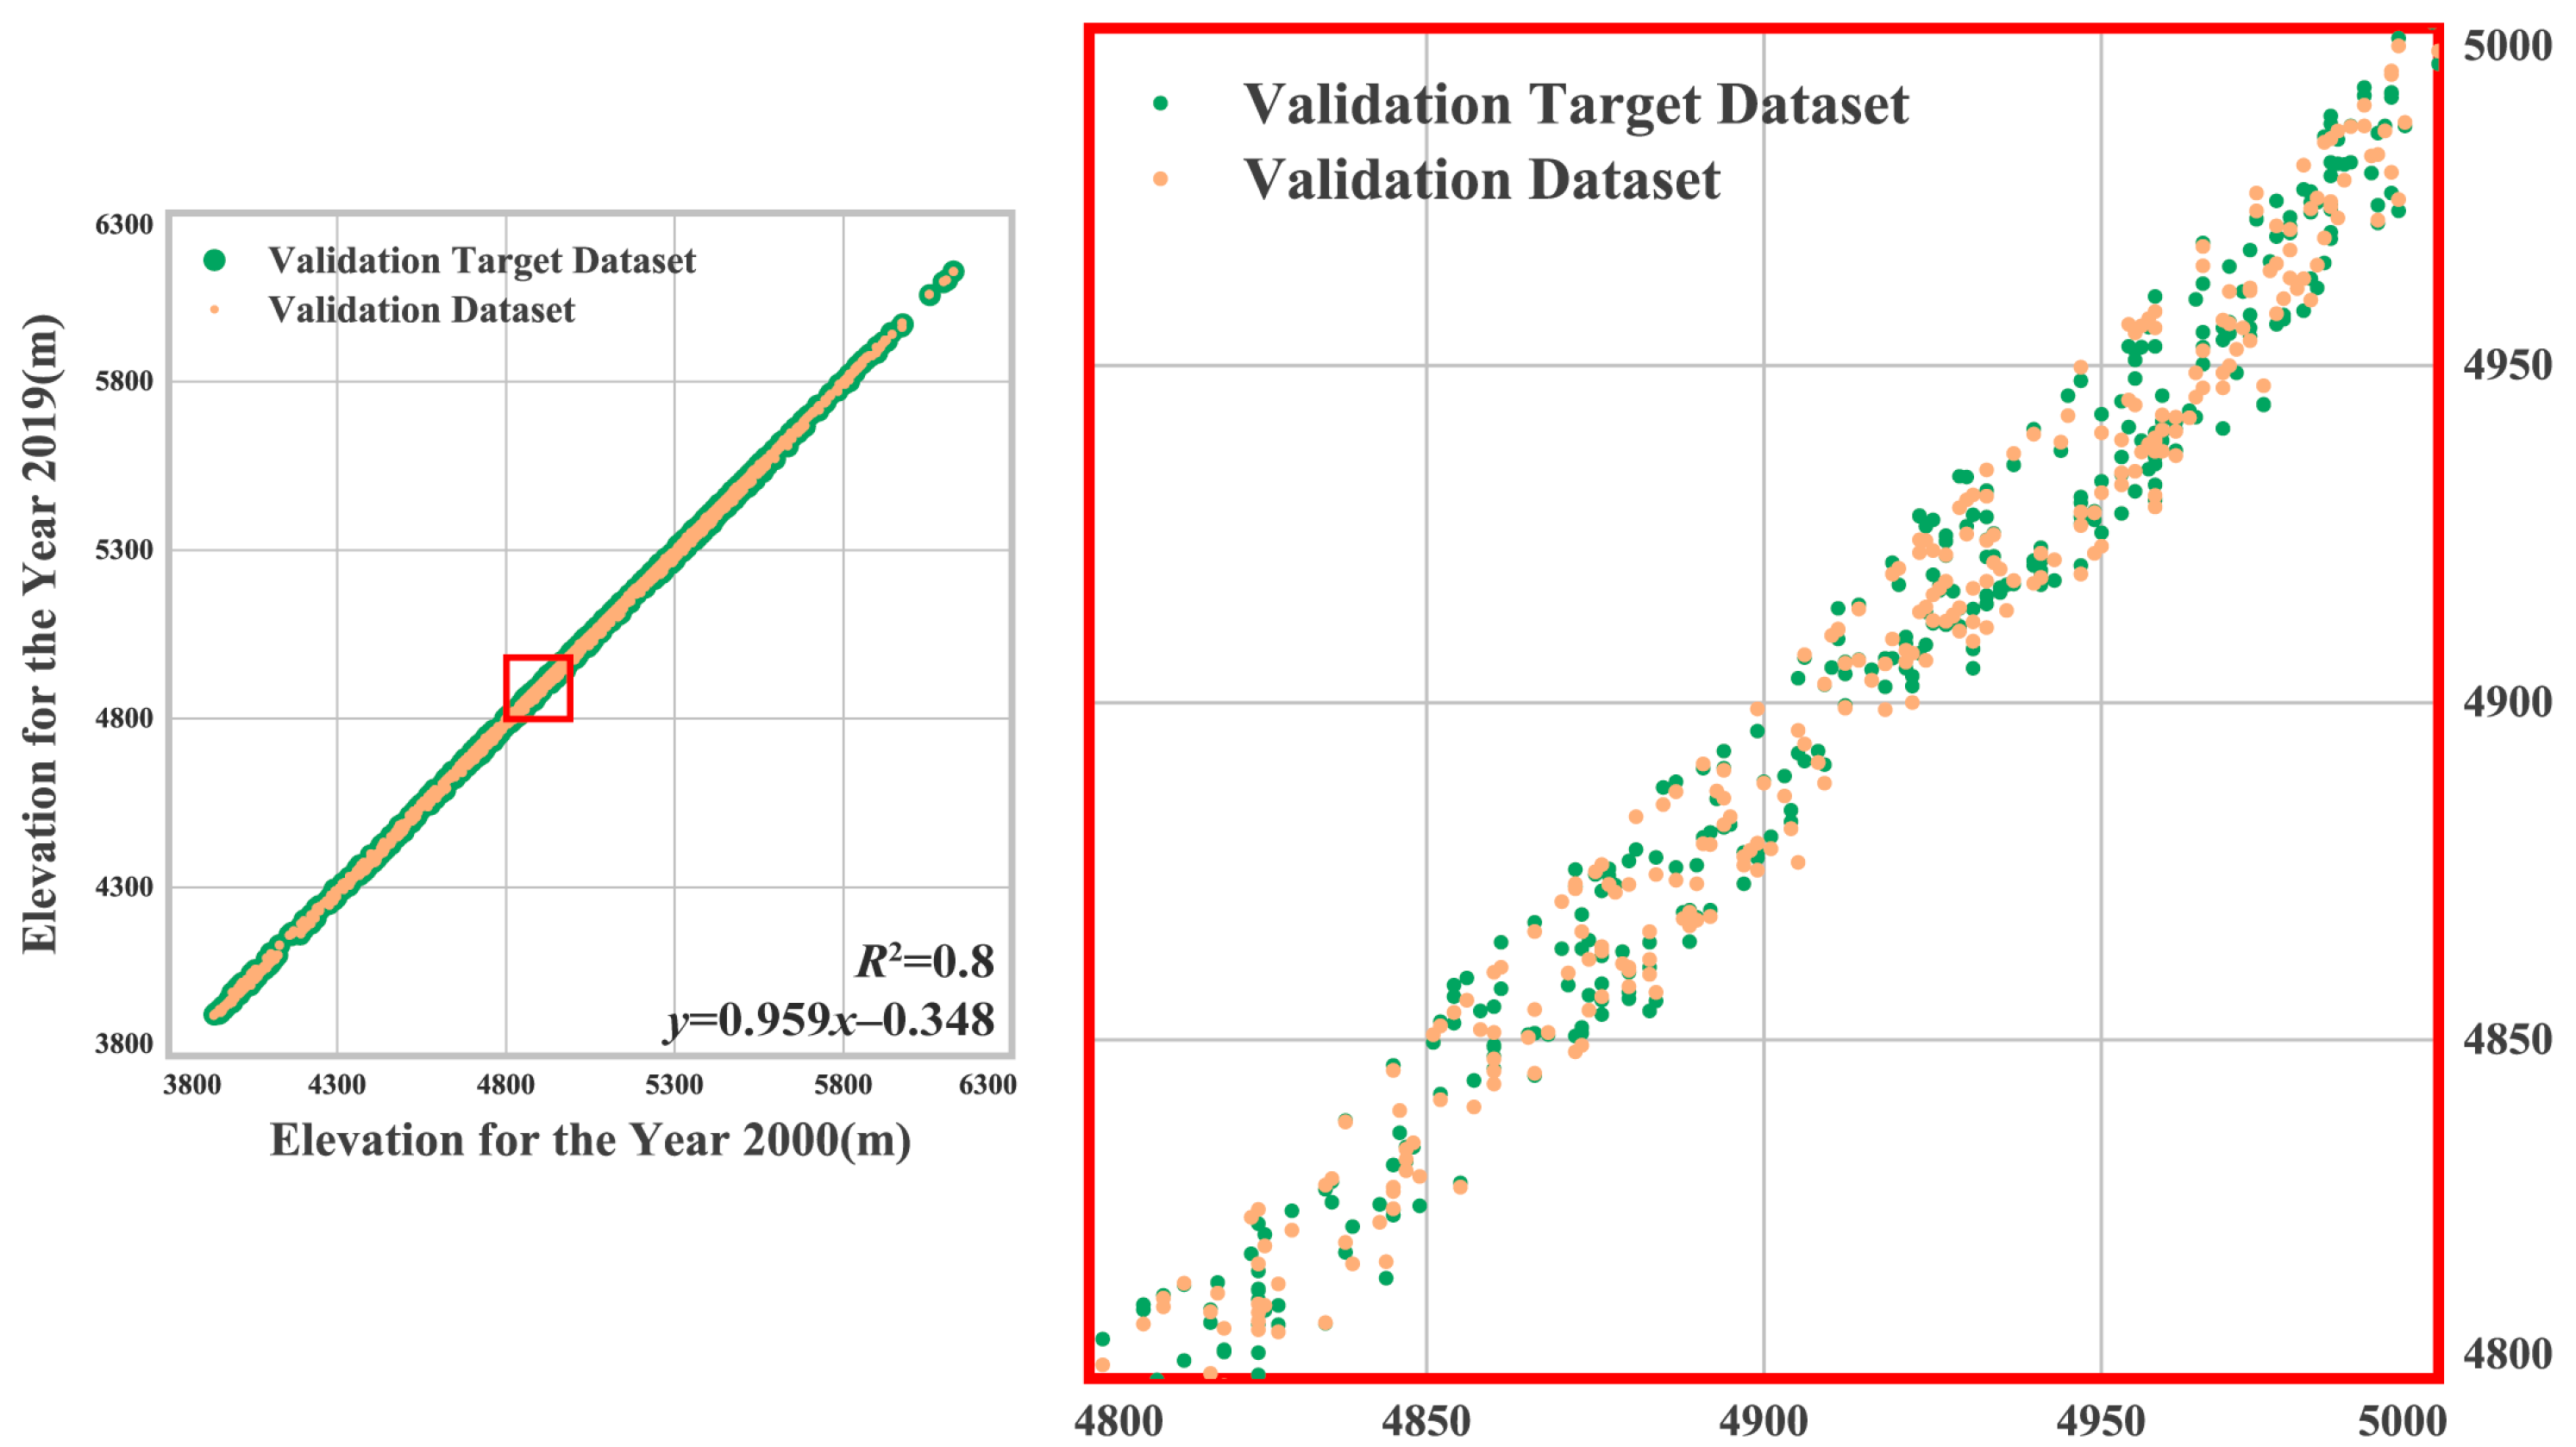
For glacier elevation change analysis, high-resolution datasets provided by Theia [42] were employed to precisely monitor and analyze altitude variations from 2000 to 2019. Theia cartographic layers offer detailed insights into surface elevation changes based on the ASTER stereo imagery, employing advanced atmospheric correction and image synthesis techniques. These layers are presented in the form of annual change rates, with data accessible through Couches cartographiques Theia (http://maps.theia-land.fr/couches-cartographiques-theia.html?year=2024&month=05&collection=n3a_rgb) (accessed on 25 March 2024). To validate the accuracy of these elevation change data, a comparative analysis was conducted between the results in parts of the YZRB and the estimates derived from aligning 2000 NASA DEM data with ICESat-2 altimetry data from 2019 [5]. The calibration results indicate that the dataset’s validation for the YZRB yielded an R2 of 0.8 in this study.

2.2.3. Meteorological Data

Meteorological stations in SETP are sparse and mostly located in inhabited valley areas, which cannot be directly extrapolated to the glacierized high mountain regions. This is because even if glaciers are situated within the same climatic environment, local parameters such as catchment aspect, topography, and debris cover can have a significant impact on how a specific glacier responds to climate change. The ECMWF/ERA5_LAND/HOURLY [43] data, sourced from the GEE, feature a spatial resolution of 0.1° and provide hourly estimates for a vast array of climate variables. We selected hourly 2 m surface air temperature, snowfall, and precipitation data for the excellent consistency between analysis and observational data to investigate the climatic characteristics in the Basin [44,45]. Given that the highest annual temperatures in the basin are typically recorded from June to September, the average temperature for this period is defined as the average melting period temperature. Leveraging the GEE, we averaged (or aggregated) the ERA5 atmospheric reanalysis data from 1960 to 2023 and performed masking extraction to obtain the average melting period temperature and annual precipitation data for the YZRB. Furthermore, the solid precipitation ratio, calculated by the proportion of snowfall to precipitation, is a significant contributor to glacier mass loss. All data are stored in TIFF format on the Google Drive cloud platform.

2.3. Methods

2.3.1. Glacier Boundary Interpretation

Glacial vector boundaries were extracted using ENVI 5.3 software on Landsat and Sentinel-2 MSI images, employing a threshold method of ratio images [38] with a threshold value of 2.1. This method leverages the high reflectance of snow and ice in the visible light spectrum and their strong absorption in the shortwave infrared, demonstrating enhanced performance under shadows and thin debris cover. Median filtering was applied to the extracted boundaries to address the small gaps caused by rocks on the ice and to eliminate snow patches. The classified ice-covered regions were converted into vector data for further analyses. Median filtering was applied to the extracted boundaries to address the small gaps caused by rocks on the ice and to eliminate snow patches. The classified ice-covered regions were converted into vector data for further analyses. The RED/SWIR ratio method (e.g., TM3/TM5) suffers from two primary limitations [46]. First, the spectral reflectance ratio of water bodies is similar to that of snow and ice, and complicates the differentiation in remote sensing imagery. In addition, the spectral resemblance of ice-covered areas to surrounding bedrock adds complexity to remote sensing interpretation [47]. To refine the accuracy of the glacial boundaries, we cross-referenced with Google Earth’s 3D views for a comprehensive manual verification and correction, focusing on misclassified water bodies and bedrock.

2.3.2. Calculation of Glacier-Related Attributes

The glacier vector was projected into Albers Equal Area Conic Projection using ArcGIS 10.8 software and RGI 6.0 internal boundaries were utilized to separate connected glacier outlines, facilitating the detection of individual glacier area changes during the periods from 1970s to 1988, 1988 to 2015, and 2015 to 2023. Additionally, the elevation and aspect distributions, along with their alterations pertinent to the glacier areas, were calculated for these time intervals based on various DEM data.
The glacier area change is the difference between the glacier areas in two periods. Considering the temporal discrepancies in the imagery data used in each phase, the glacier area change rate was employed to compare the glacier area variations [48].
A C = Δ S i S i × Δ T i × 100 %
where AC is the relative rate of change of glaciers area (%·a−1), ΔSi is the change in glacier area (km2) for the i-th period, Si is the initial glacier area in the start of the i-th period (km2), and ΔTi signifies the time interval (years) of the i-th period.
Additionally, an empirical ice volume-area formula was used to estimate glacier volumes.
V = c × A γ
where (V) represents the ice volume in m3, (A) is the glacier area in m2, and c and γ are empirical coefficients and exponents derived from statistical analysis of measured data from multiple glaciers within a specific region [49], with (c = 0.2055) and (γ = 1.375). This model demonstrates broad applicability across various glacier types and geographical regions, especially for those in data-limited areas where field measurements are challenging [50].

2.3.3. Estimation of Glacier Mass Balance

Prior to calculating the glacier mass balance from the elevation change data provided by Theia, we validate this data with ICESat-2 altimetry data and the NASA DEM as the datum DEM. Despite corrections for the effects of clouds, precipitation, and satellite footprint size, the ICESat-2 elevation data may still contain outliers as some laser points register anomalously high elevations. A denoising technique was applied to the satellite altimetric points, where values deviating by multiple standard deviations from the mean were removed as outliers to ensure the accuracy of the data [51]. The main steps for denoising are below.
When considering the elevation difference between the altimetric point and the datum DEM, denoted as Δh, values of Δh that greater than the threshold were eliminated as gross errors, satisfying the following equation:
Δ h = h S A T h D E M < 3 ε
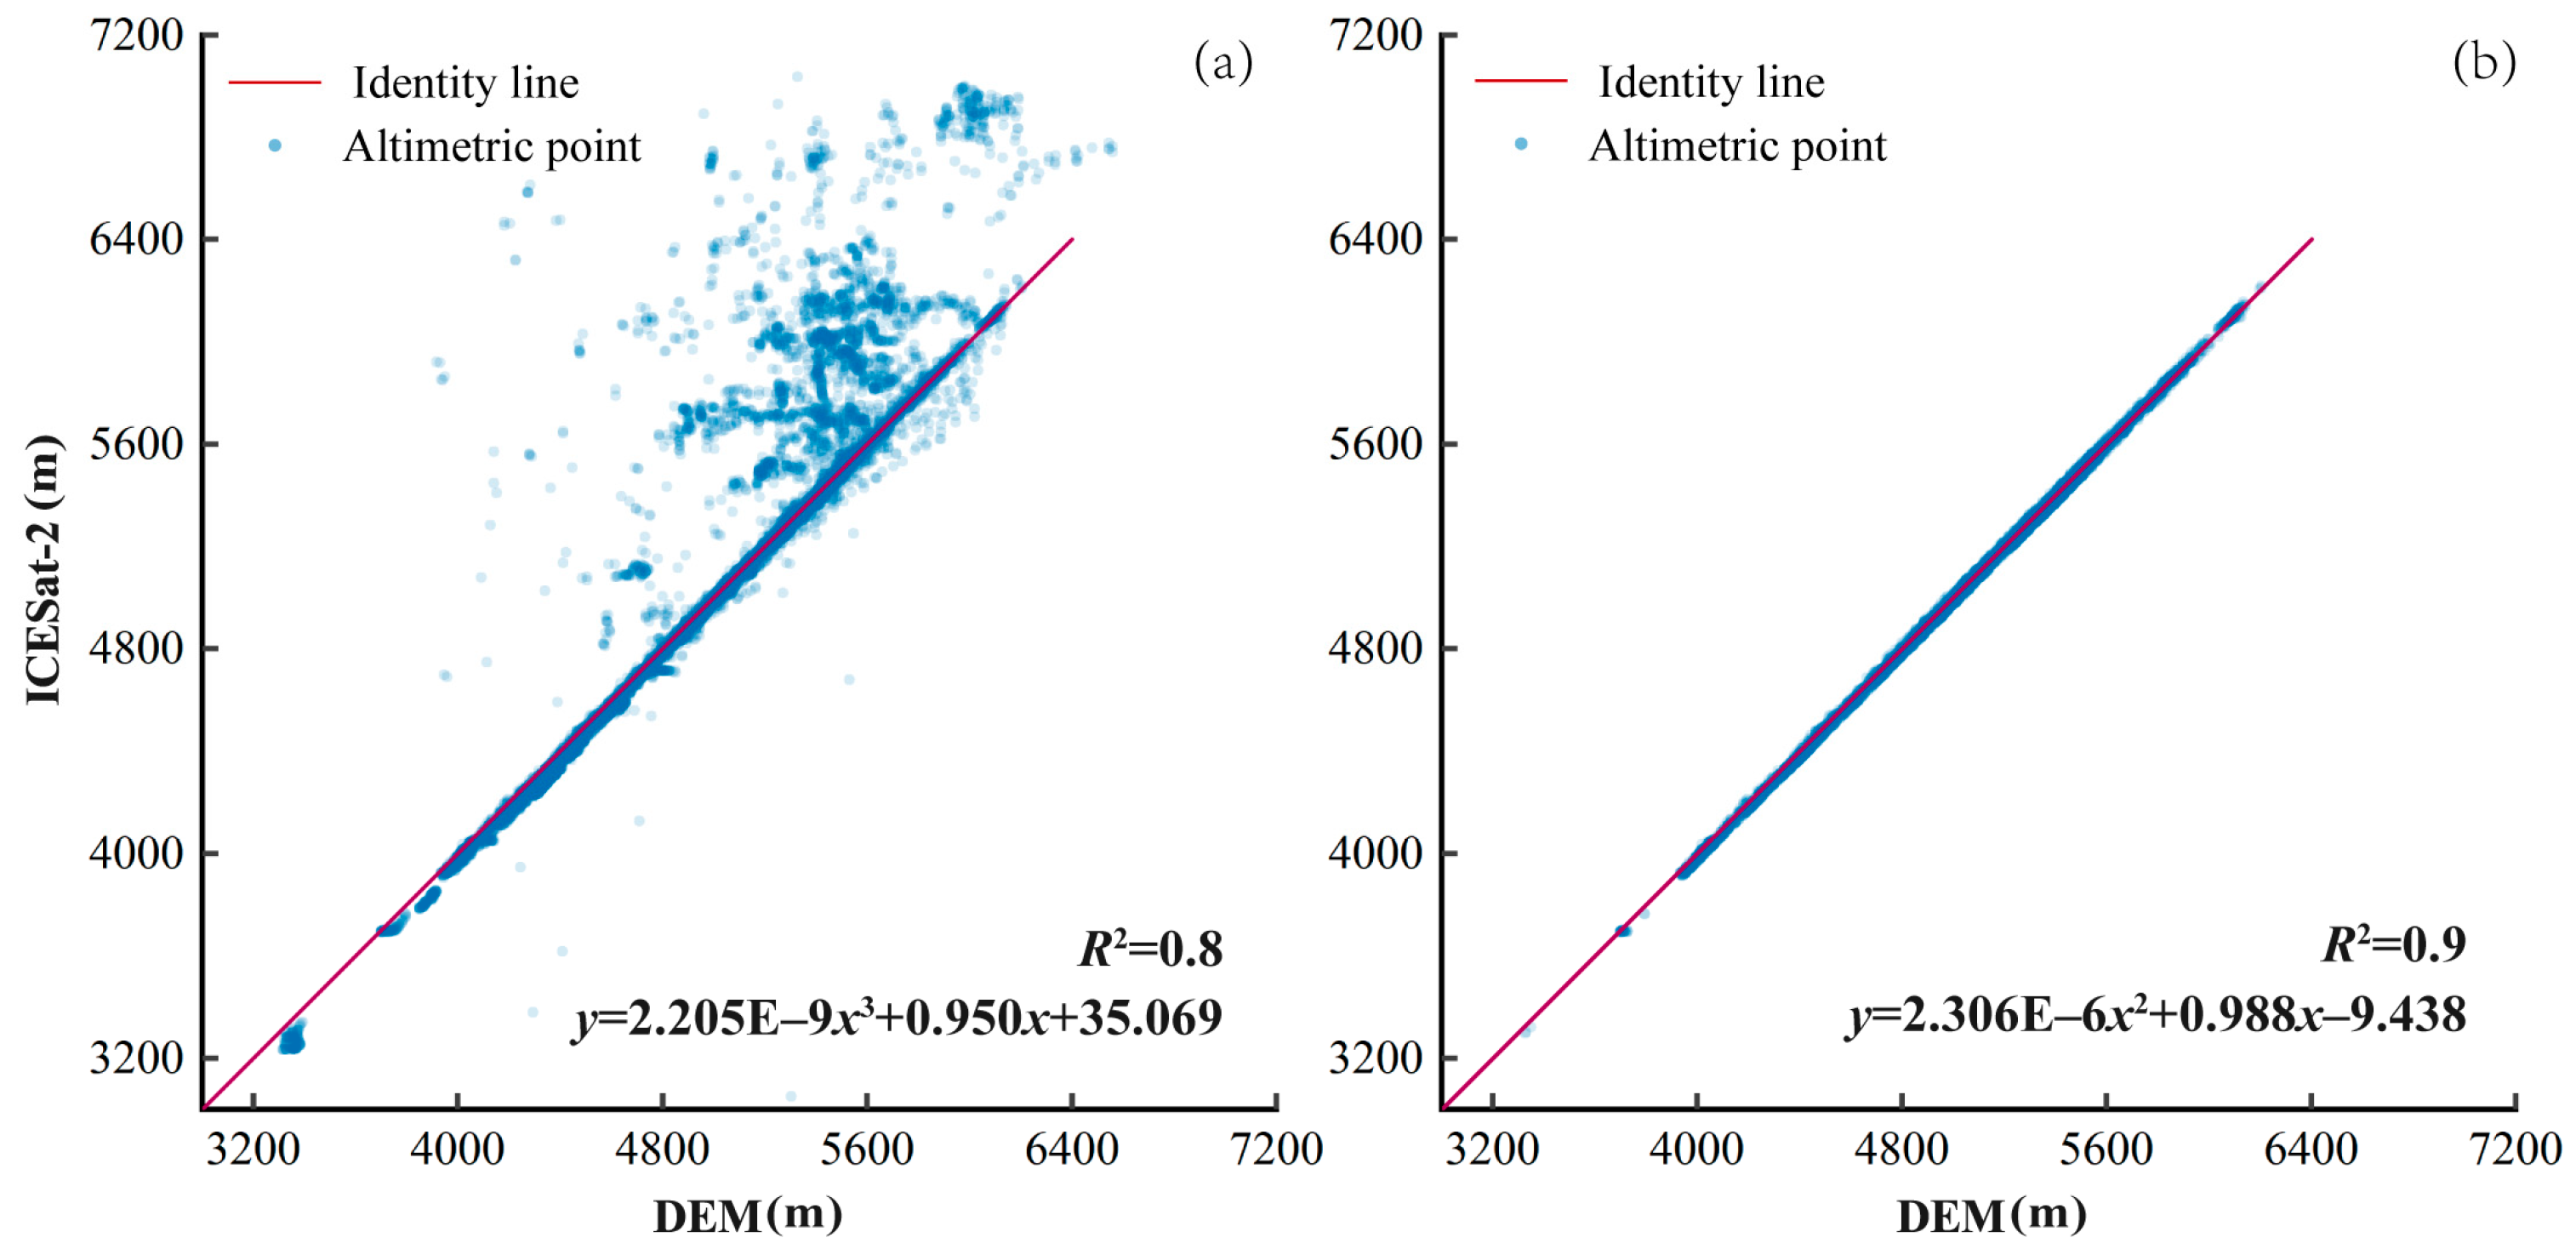
where hSAT is the elevation of the altimetry satellite footprints in glaciers, hDEM is the elevation of the datum DEM, and ε is the absolute elevation accuracy of the datum DEM referencing the elevation precision of the 30 m resolution SRTM DEM within China [52]. Additionally, we developed a polynomial fitting function model to validate the spatial and temporal consistency of the ICESat-2 footprint using the datum DEM as the independent variable and altimetry data elevations as the dependent variable. The validation results are presented in Figure 2.
The elevation changes at each altimetric point, calculated using the results after the removal of outliers, serve as a validation dataset to verify the accuracy of Theia’s elevation change data—the target dataset. In this analysis, Theia’s data serves as the independent variable, while the validation dataset acts as the dependent variable in linear regression. The resulting fit, with an R2 = 0.8 as depicted in Figure 3, confirms the reliability of Theia’s data for mass change studies in the YZRB.
The mass balance of glaciers is estimated using the geodetic method as described below, where (B) represents the mass balance (m w.e. a−1), ( ρ ) is the conversion density, (Sg) is the glacial area (km2), (n) is the total number of pixels in the glacial region, (Δhi) is the elevation difference of the pixel points during the study period (m), and (Sp) is the area of a single pixel (km2). This study adopts the conversion density of 850 ± 60 kg·m−3 [53].
B = ρ S g × i = 1 n   Δ h i S p

2.4. Uncertainty Evaluation

2.4.1. Uncertainty in Glacier-Related Attributes

For glacial attributes in the YZRB, three error terms were calculated: (a) glacier boundary delineation, (b) glacier area change assessment, and (c) ice volume calculation. Due to the limitations of image resolution, spectral characteristics of glacier and non-glacier areas exhibit a certain degree of transition, introducing uncertainties glacier boundary delineation. The orthorectification accuracy of Landsat imagery is roughly half a pixel; a corresponding buffer distance is used to perform buffer analysis on the glacier boundaries to evaluate their precision. The formula [54] is given by
E A = N × λ 2 2
where (EA) represents the uncertainty in glacier boundary interpretation, (N) is the length of the glacier boundary excluding ridgelines or watersheds used to separate adjacent glaciers, and (λ) is the pixel width (The resolution of Landsat TM multispectral band imagery is 30 m, and the resolution of Landsat ETM+/OLI imagery after band fusion is 15 m). The method for assessing the uncertainty in glacier area change are based on the mutual erasure of data from two stages of a single glacier, followed by the merger of the results to obtain vector data, which is then converted into raster data; after that, calculations are performed according to the formula above.
To assess the uncertainty in the estimation of ice volume, the area of each glacier is adjusted by its error margin to obtain the maximum and minimum areas. These values are then used in the ice volume calculation formula to estimate the maximum and minimum ice volumes, thereby determining the error in ice volume estimation. The formula [49] is given by
E V = V m a x V m i n 2
where Ev represents the uncertainty in the estimated ice volume, and Vmax and Vmin respectively denote the calculated maximum and minimum ice volumes.

2.4.2. Uncertainty in Glacial Mass Balance

The uncertainty (E) in glacier mass balance within YZRB is derived as described below [54].
E = Δ h t + Δ ρ ρ ω 2 + σ t + ρ 1 ρ ω 2
where Δh is the average elevation difference across the glacier, t is the time range, Δ ρ is the ice density uncertainty (60 kg·m−3), ρ ω represents the density of water (1000 kg·m−3), and ρ 1 is the conversion density (850 kg·m−3). σ, representing the uncertainty in elevation change between different DEMs, is determined to be 0.007 m·a−1 [42] in the YZRB from 2000 to 2019 at a 1-sigma confidence level.

3. Results

3.1. Contemporary Status of Glaciers in the YZRB

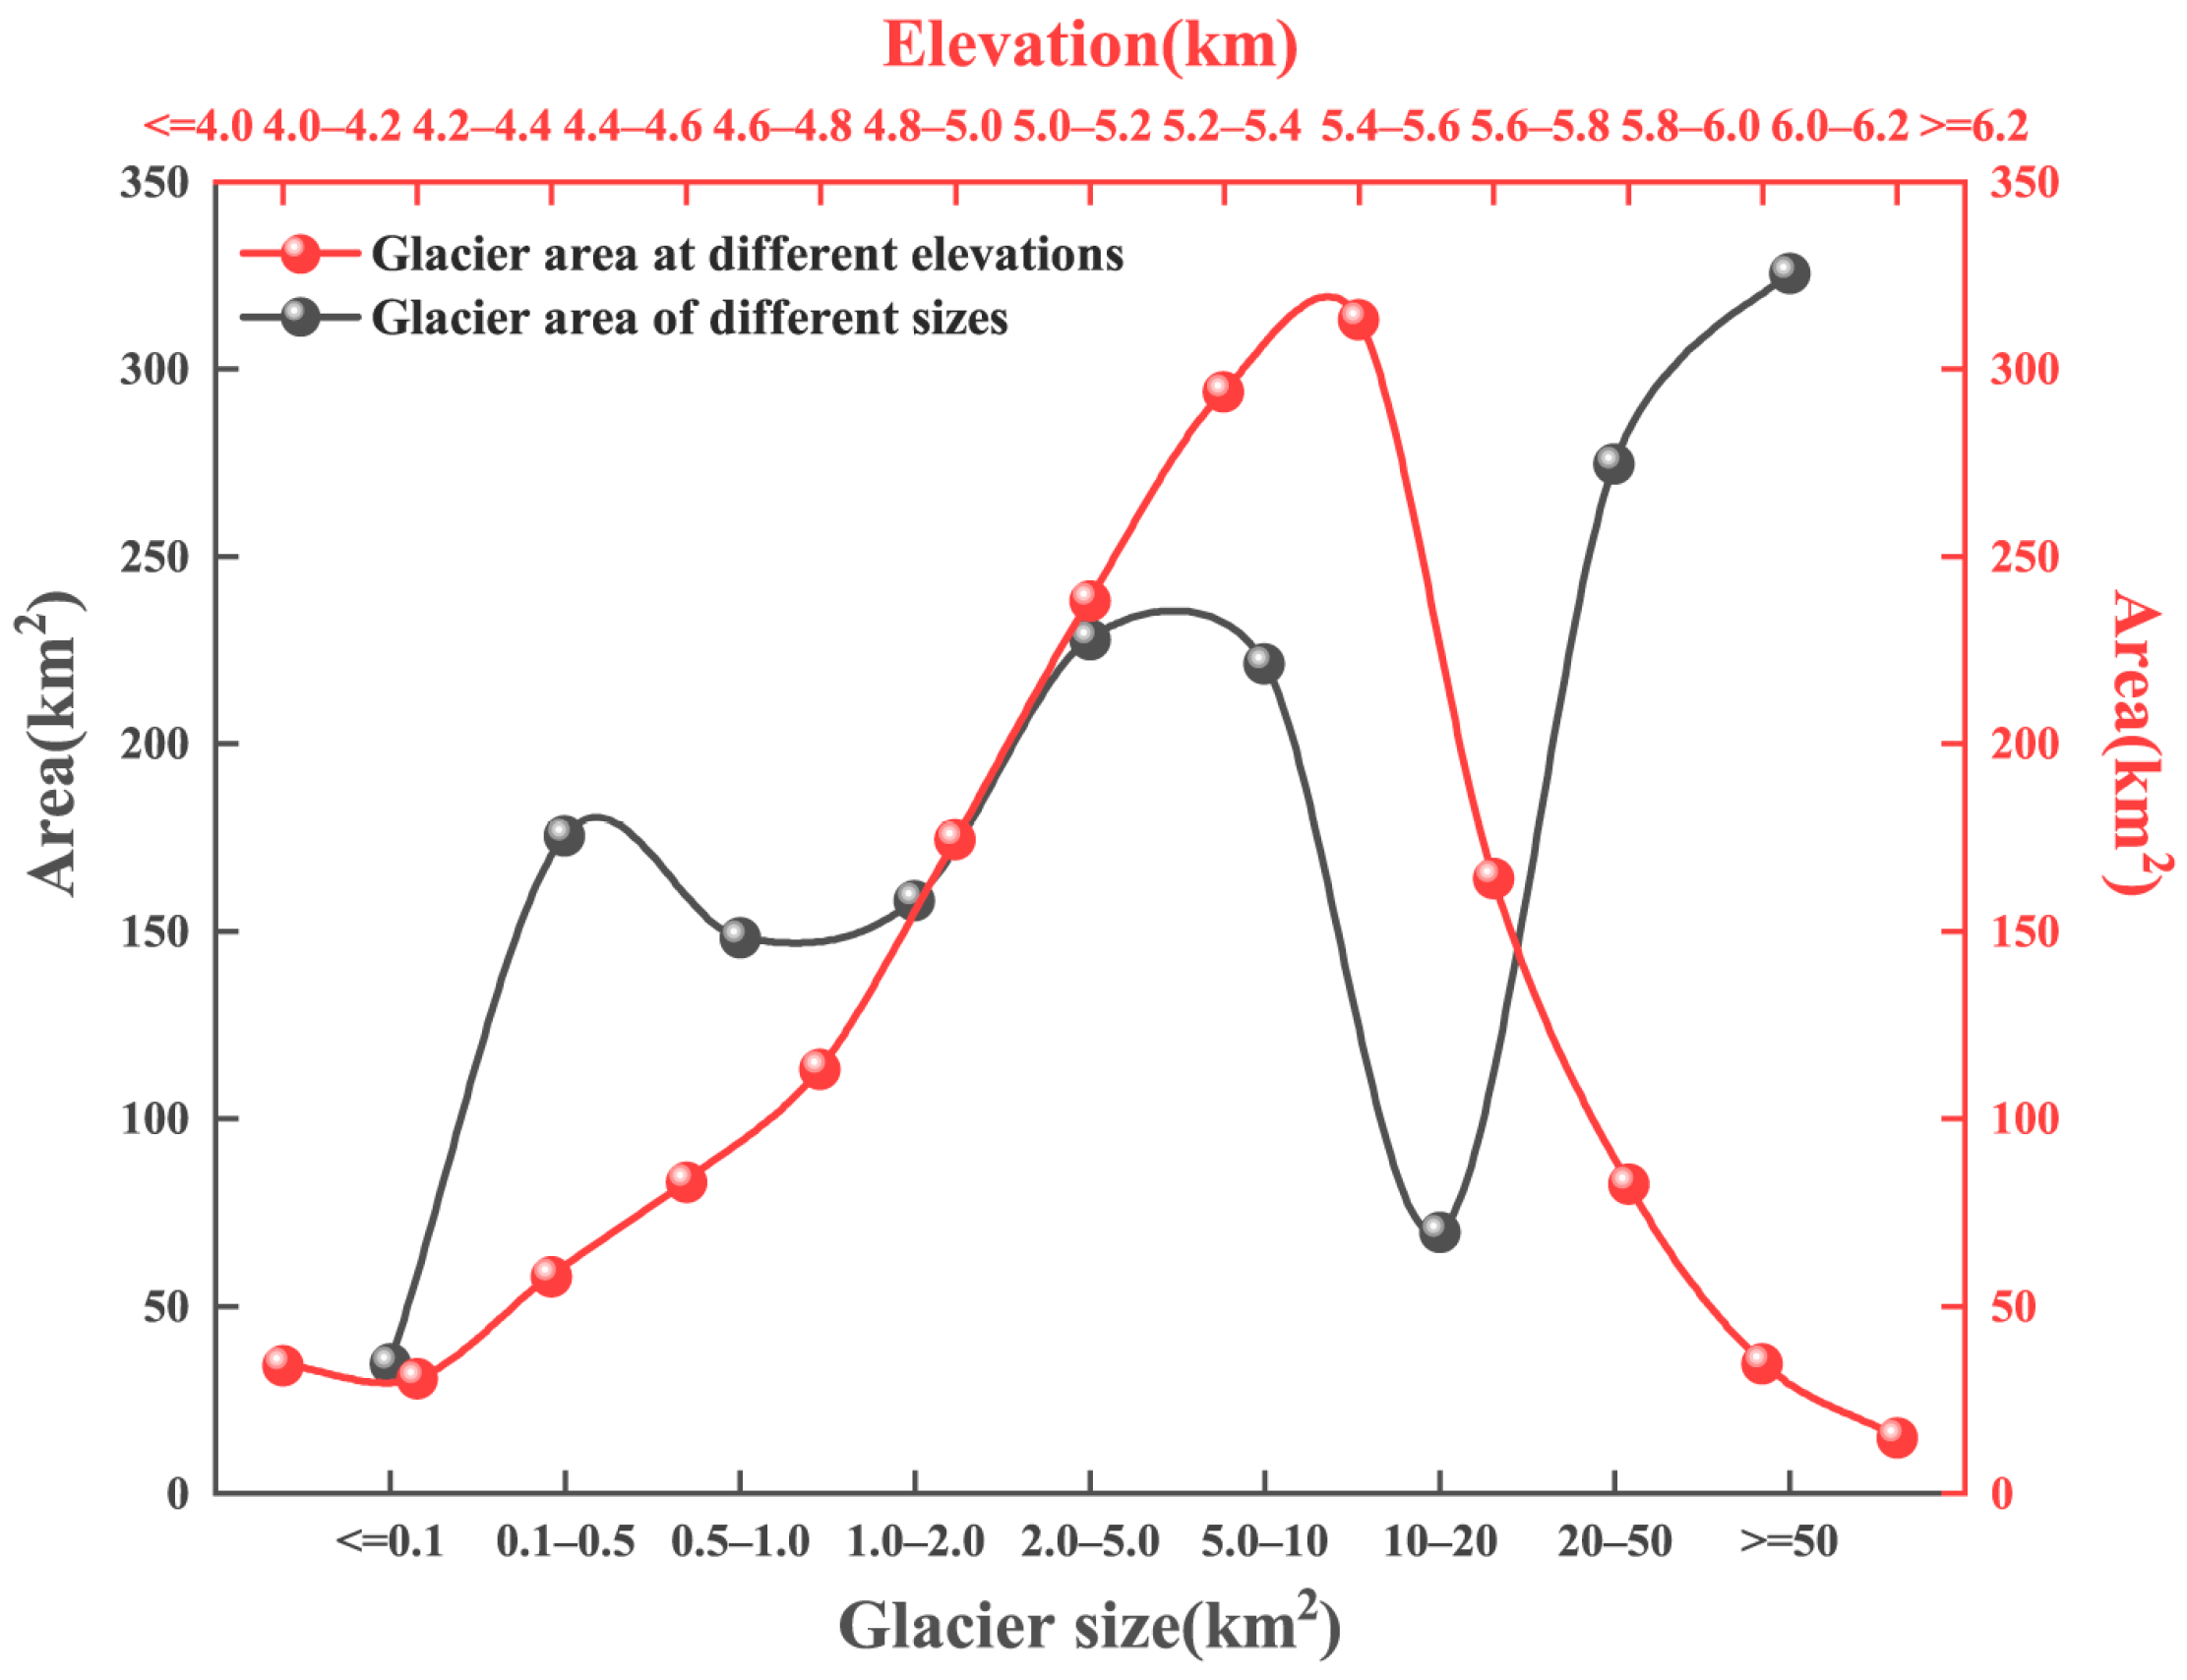
There were 1975 glaciers in the YZRB in 2023, covering an area of about 1635.89 ± 71.74 km2 and accounting for an ice volume of about 152.7429 ± 6.1747 km3. Small glaciers predominate in number but contribute minimally to the total area as shown in Figure 4. Glaciers with an area under 0.5 km2 are the most numerous, with 1518 glaciers representing approximately 77% of the total but covering only 12.84 ± 1.39% of the area. Conversely, the number of glaciers larger than 10 km2 diminishes but a certain number of large glaciers remain. Thirteen large glaciers exceeding 20 km2 cover 600.20 ± 13.32 km2, accounting for 36.69 ± 0.82% of the total glacier area. Medium-sized glaciers display a balanced distribution in both number and area without any extreme values. Glaciers between 2–5 km2 are relatively stable and encompass the largest total area, and those between 2–10 km2 and 0.1–2 km2 occupy 449.4 ± 16.59 km2 and 482.05 ± 33.43 km2, respectively, while the remaining glaciers collectively span less than 100 km2.
Altitudinal gradients significantly influence glacier distribution, whereas glaciers are found at elevations ranging from 4000 to 6200 m occupy comparatively smaller areas at lower elevations. As the altitude increases, the glacier area expands, peaking between 5400 and 5600 m. Beyond this altitude, the glacier area sharply decreases, primarily due to the significant retreat and shrinkage at the glacier terminus and lower glacier, which is much greater than that in the middle and upper sections.
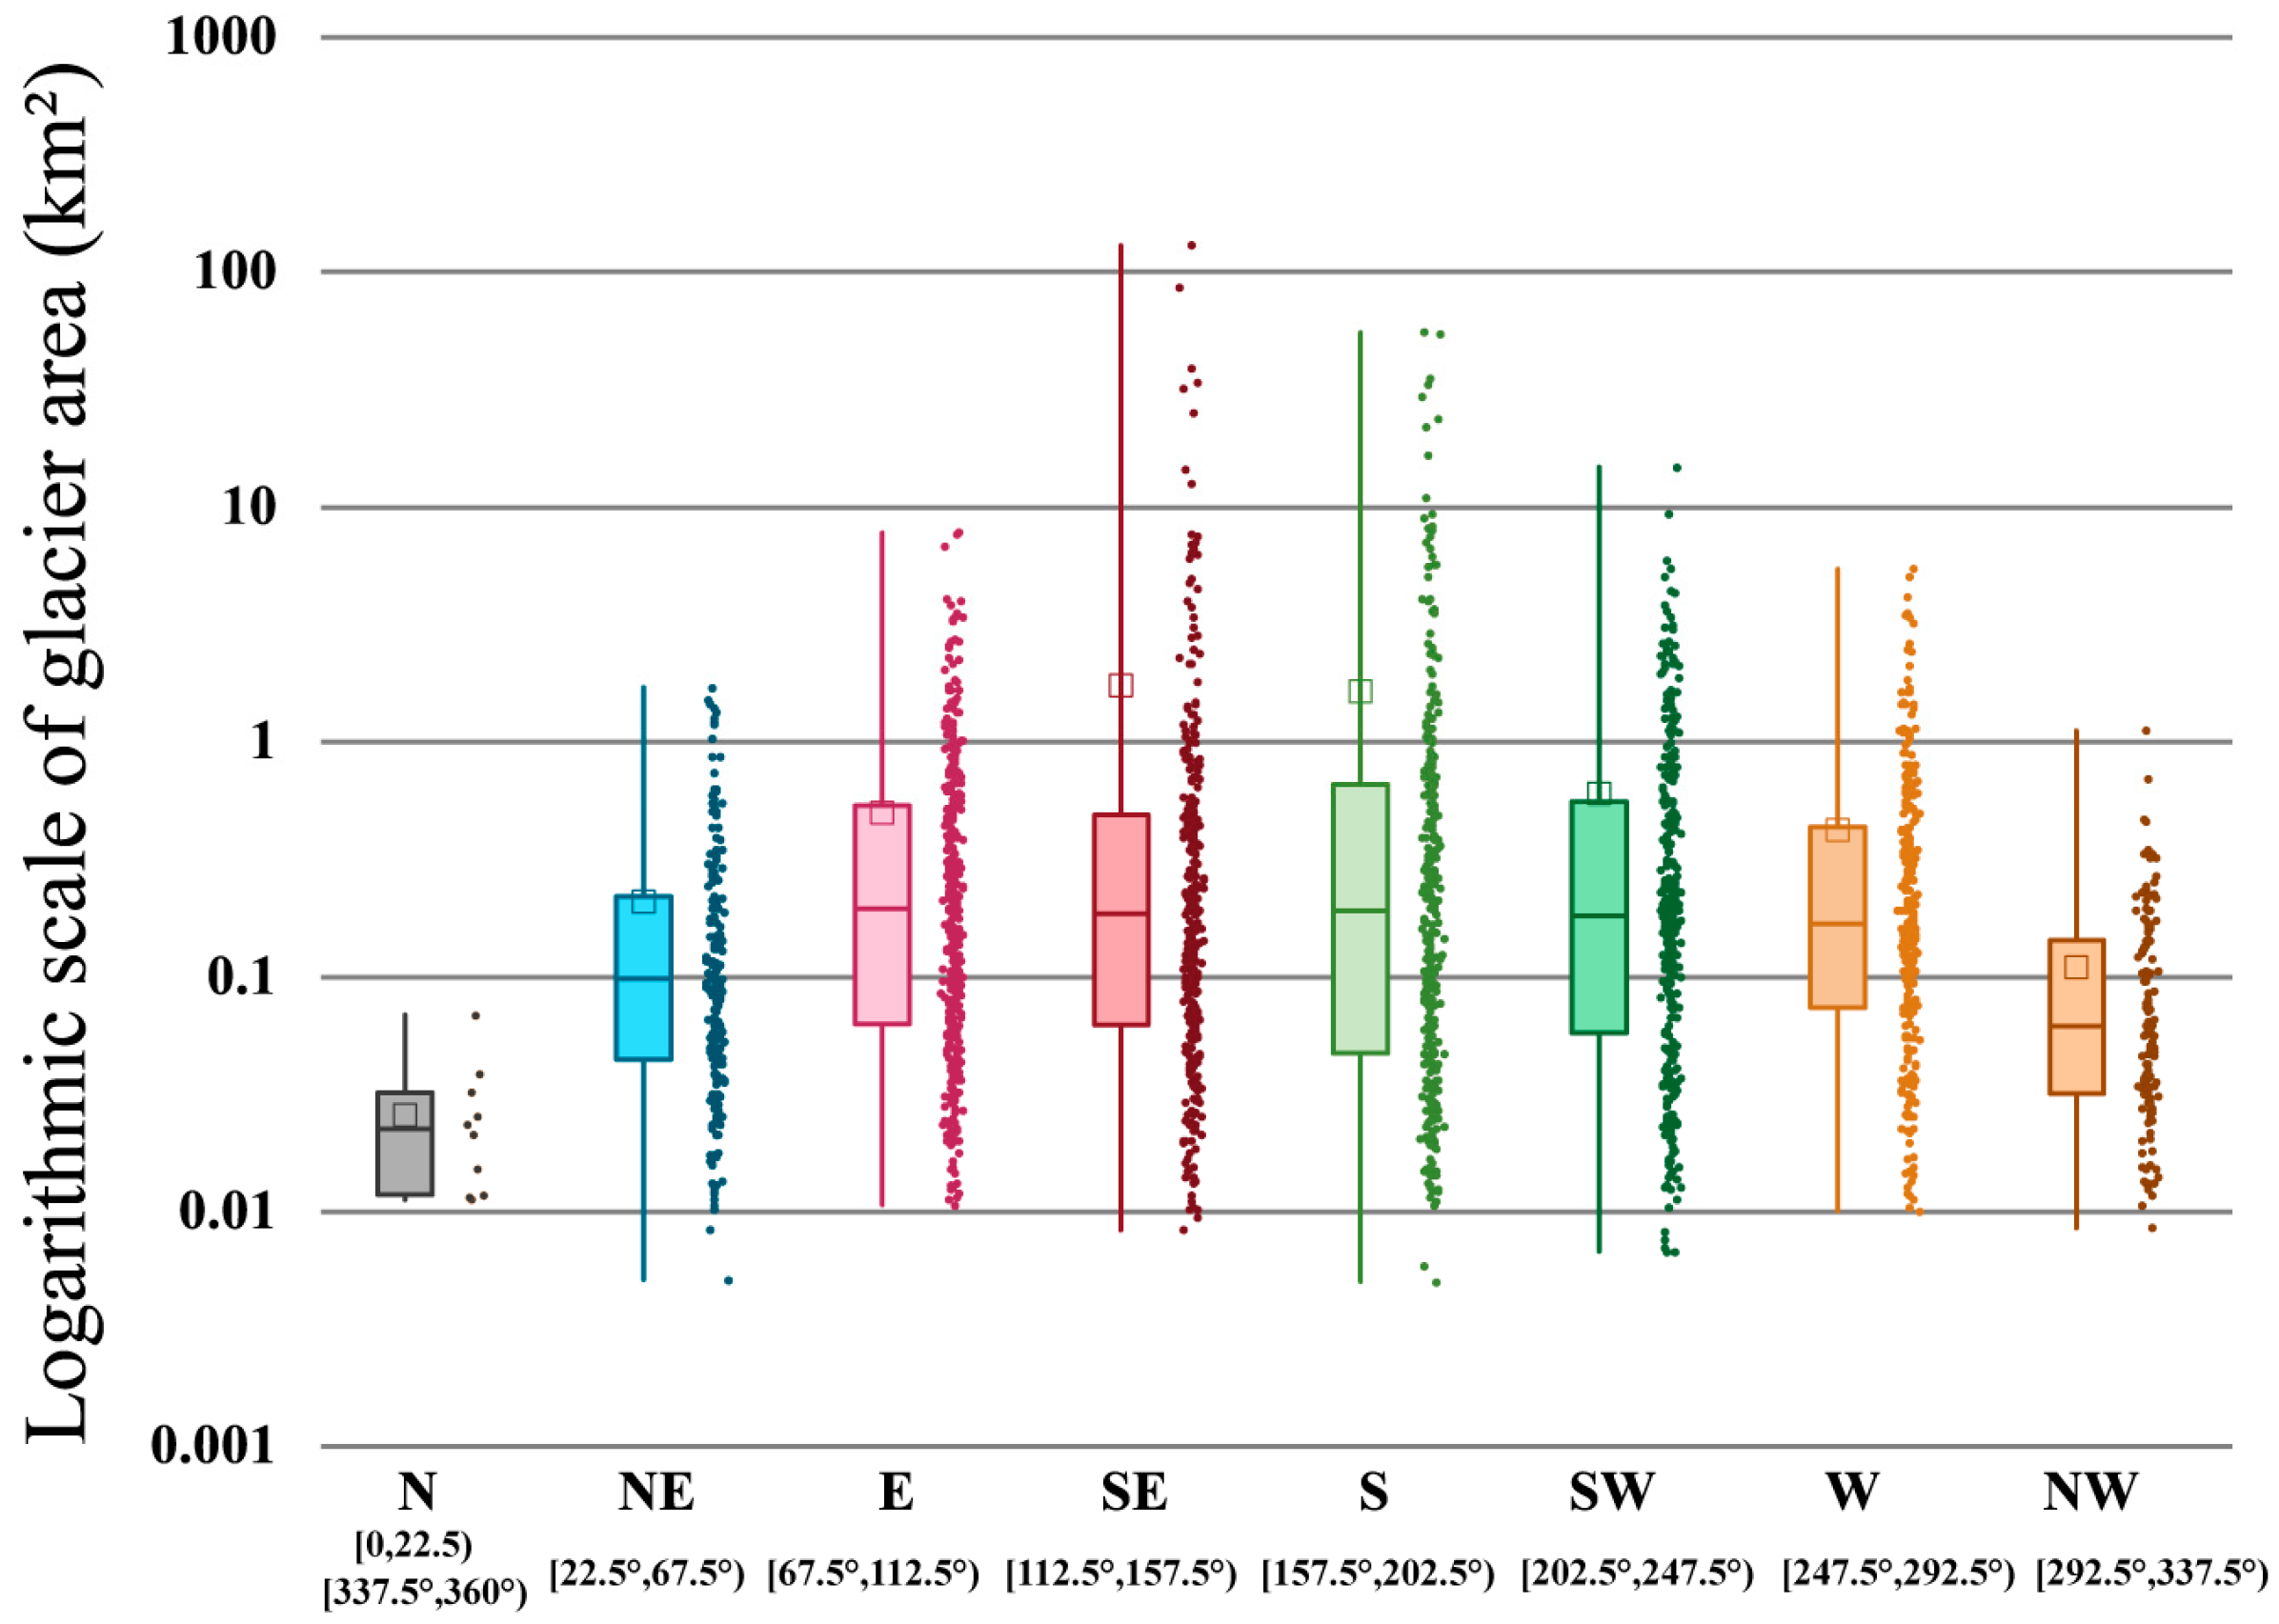
The glacier area distribution exhibits distinct variations by direction [55,56]. Figure 5 illustrates the distinct characteristics of glacier orientations within the YZRB. Southward slope glaciers (S, SE, SW) have the largest areas, comprising 77.02 ± 2.92% of the total glacier area, with a count of 947 glaciers. Following these are glaciers with east (E) orientations, covering an area of 192.13 ± 10.92 km2. Conversely, the north (N) orientations have the least coverage, with only 10 glaciers spanning 0.26 ± 0.15 km2. Analysis of the glacial mean area reveals that the largest are those oriented to the southeast (SE) followed by the east (E) orientations. Additionally, there is a slight decrease in the mean area for southwest (SW) orientations, while the west (W) and east (E) orientations have even lower mean areas. The lowest median and mean area for north-oriented glaciers indicate a concentrated distribution with generally smaller sizes. Conversely, the southeast-oriented (SE) glaciers, with the highest median and mean area, exhibit a more dispersed distribution and relatively larger sizes. The absence of outliers in glacier areas across all orientations indicates a relatively uniform distribution of glacier area in every direction.

3.2. Glacier Changes in the YZRB from 1988 to 2023

3.2.1. Glacier Change at Different Sizes

Glaciers in the YZRB experienced notable shrinkage across all sizes from 1988 to 2023, with the area decreasing from 2224.24 ± 86.97 km2 to 1635.89 ± 71.74 km2 as described in Table 2. The overall area shrinkage rate accelerated marginally from 0.78 ± 0.12%·a−1 during 1988–2015 to 0.85 ± 0.33%·a−1 during 2015–2023, with the most significant changes occurring in glaciers smaller than 1 km2. The most rapid retreat [57] occurred in glaciers smaller than 0.5 km2 at 1.53 ± 0.14%·a−1 in the initial phase (1988–2015), followed by those between 0.5 and 1 km2 at 0.96 ± 0.21%·a−1, while the glaciers between 20 and 50 km2 had the lowest shrinkage rate of only 0.25 ± 0.04%·a−1. During the subsequent phase (2015–2023), the retreat rate for glaciers larger than 50 km2 decreased to 0.35 ± 0.04%·a−1, and glaciers between 10 and 20 km2 diminished slightly to 0.56 ± 0.11%·a−1, whereas the remaining glaciers saw increased rates with the highest shrinkage rate of 2.60 ± 0.87%·a−1 for those under 0.5 km2.
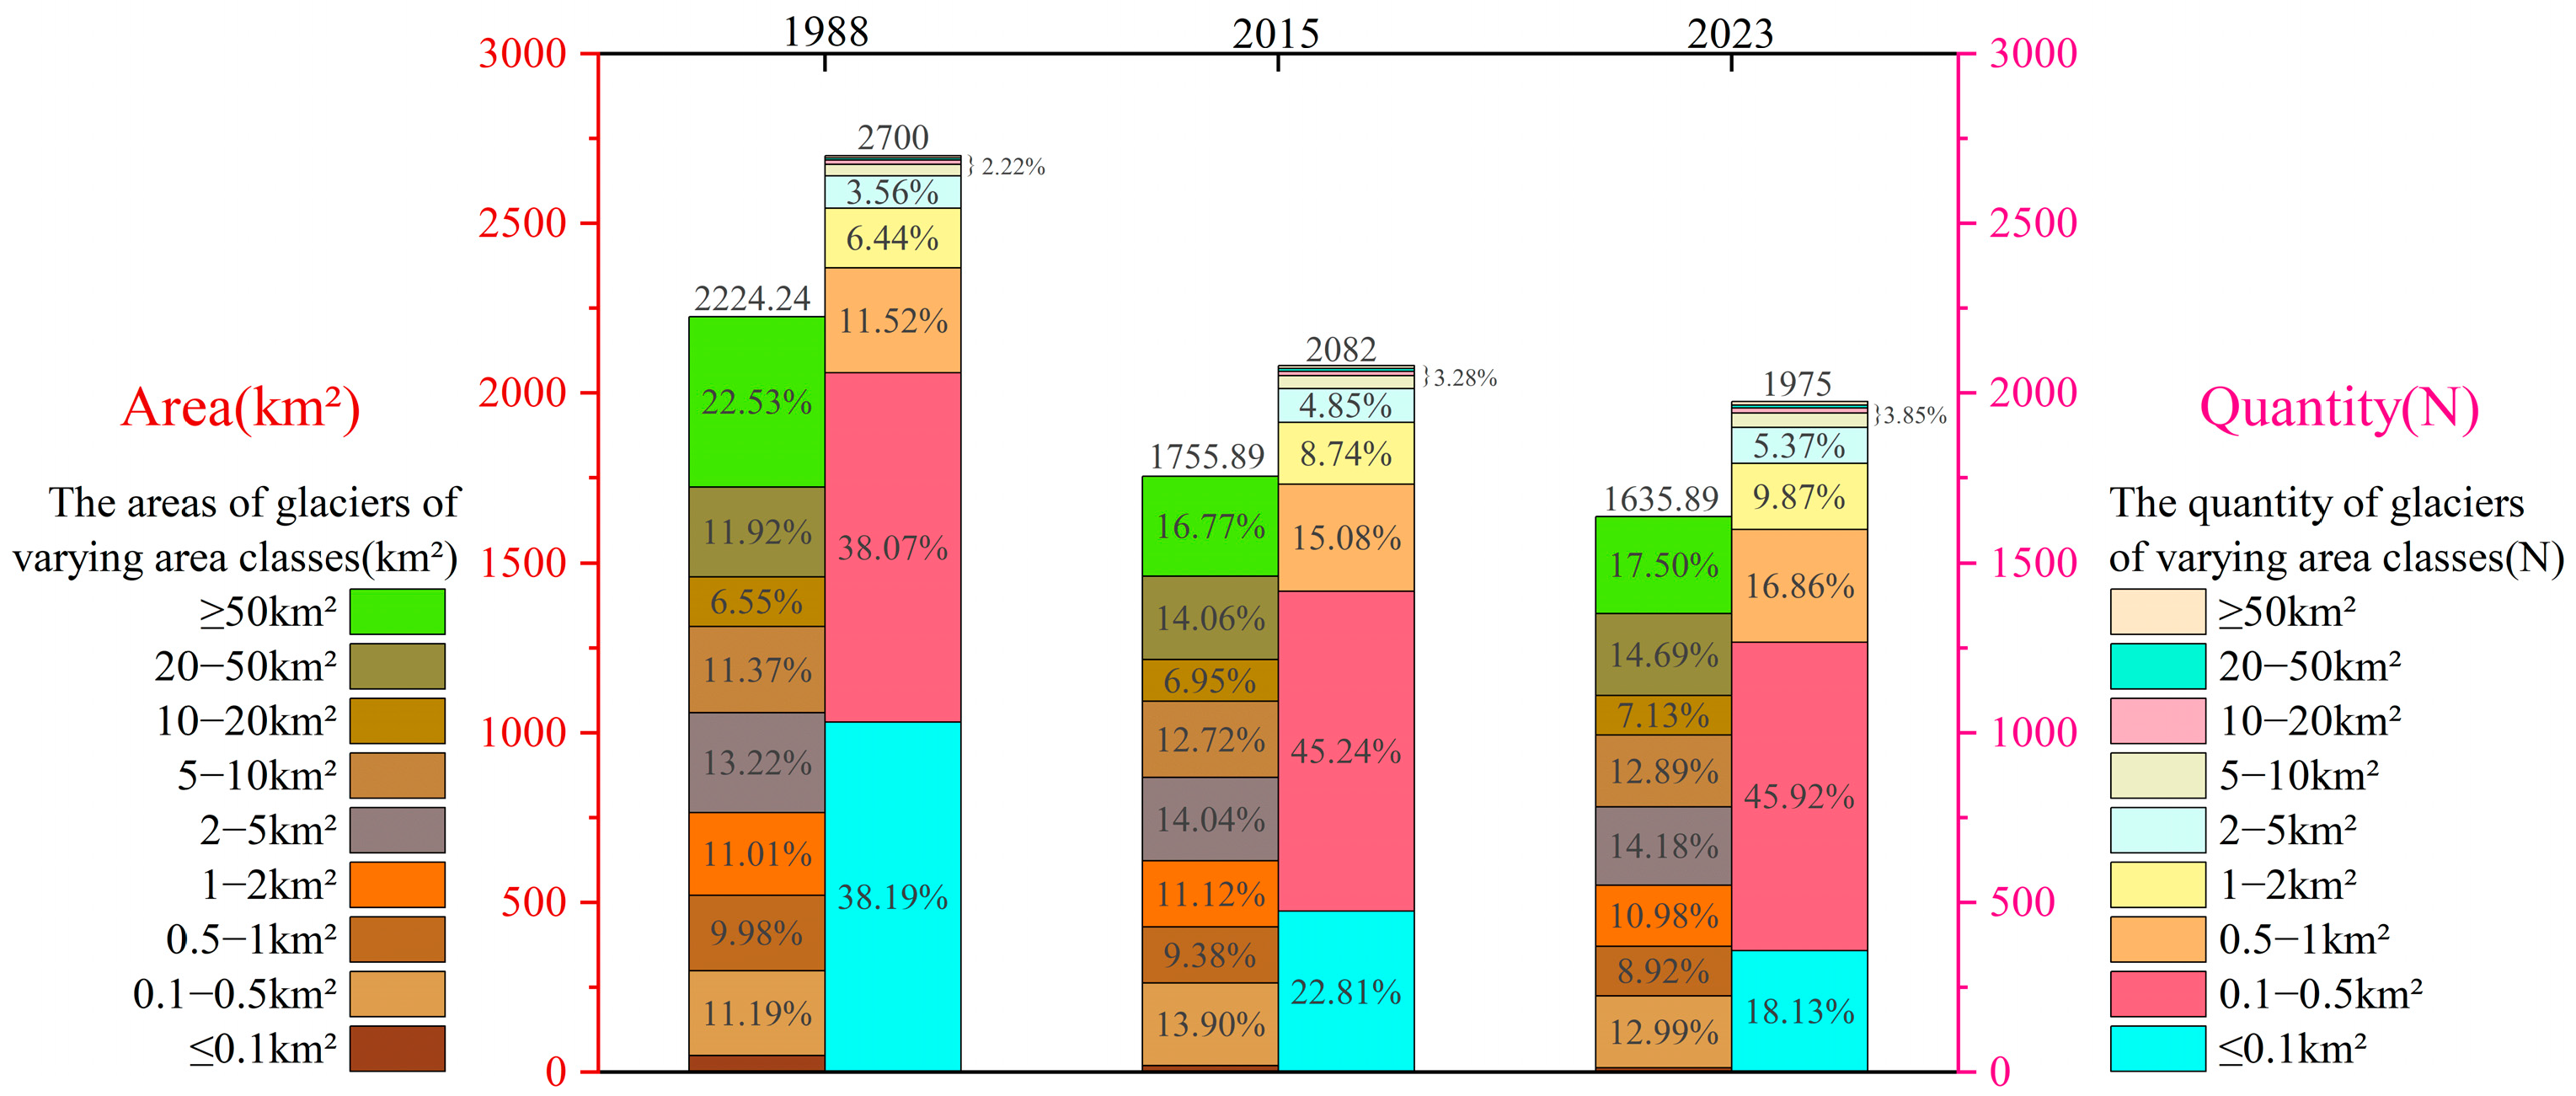
With the glacier change, the proportional distribution of glacier areas and numbers across different years has also undergone noticeable shift, as shown in Figure 6. Glaciers sized 20–50 km2 experienced the most substantial increase in area proportion, by 2.77%, followed by 1.80% and 1.52% increases in 0.1–0.5 km2 and 5–10 km2 glaciers, respectively. Conversely, glaciers over 50 km2 decreased by 5.03%, and glaciers of the remaining sizes exhibited minimal changes or remained stable. In terms of glacier number proportions, the most striking change was an 7.85% increase in glaciers sized 0.1–0.5 km2 and a 20.06% decrease in glaciers not exceeding 0.1 km2. In summary, the decline in both the number and area of glaciers from 1988 to 2023 is primarily due to the persistent ablation of glaciers and the disappearance of vanishing of minor glacial bodies. The increase in the number and area proportions of glaciers in certain area classes resulting from fragmentation was insufficient to offset the overall reduction caused by melting and disappearance.

3.2.2. Glacier Change at Different Orientations

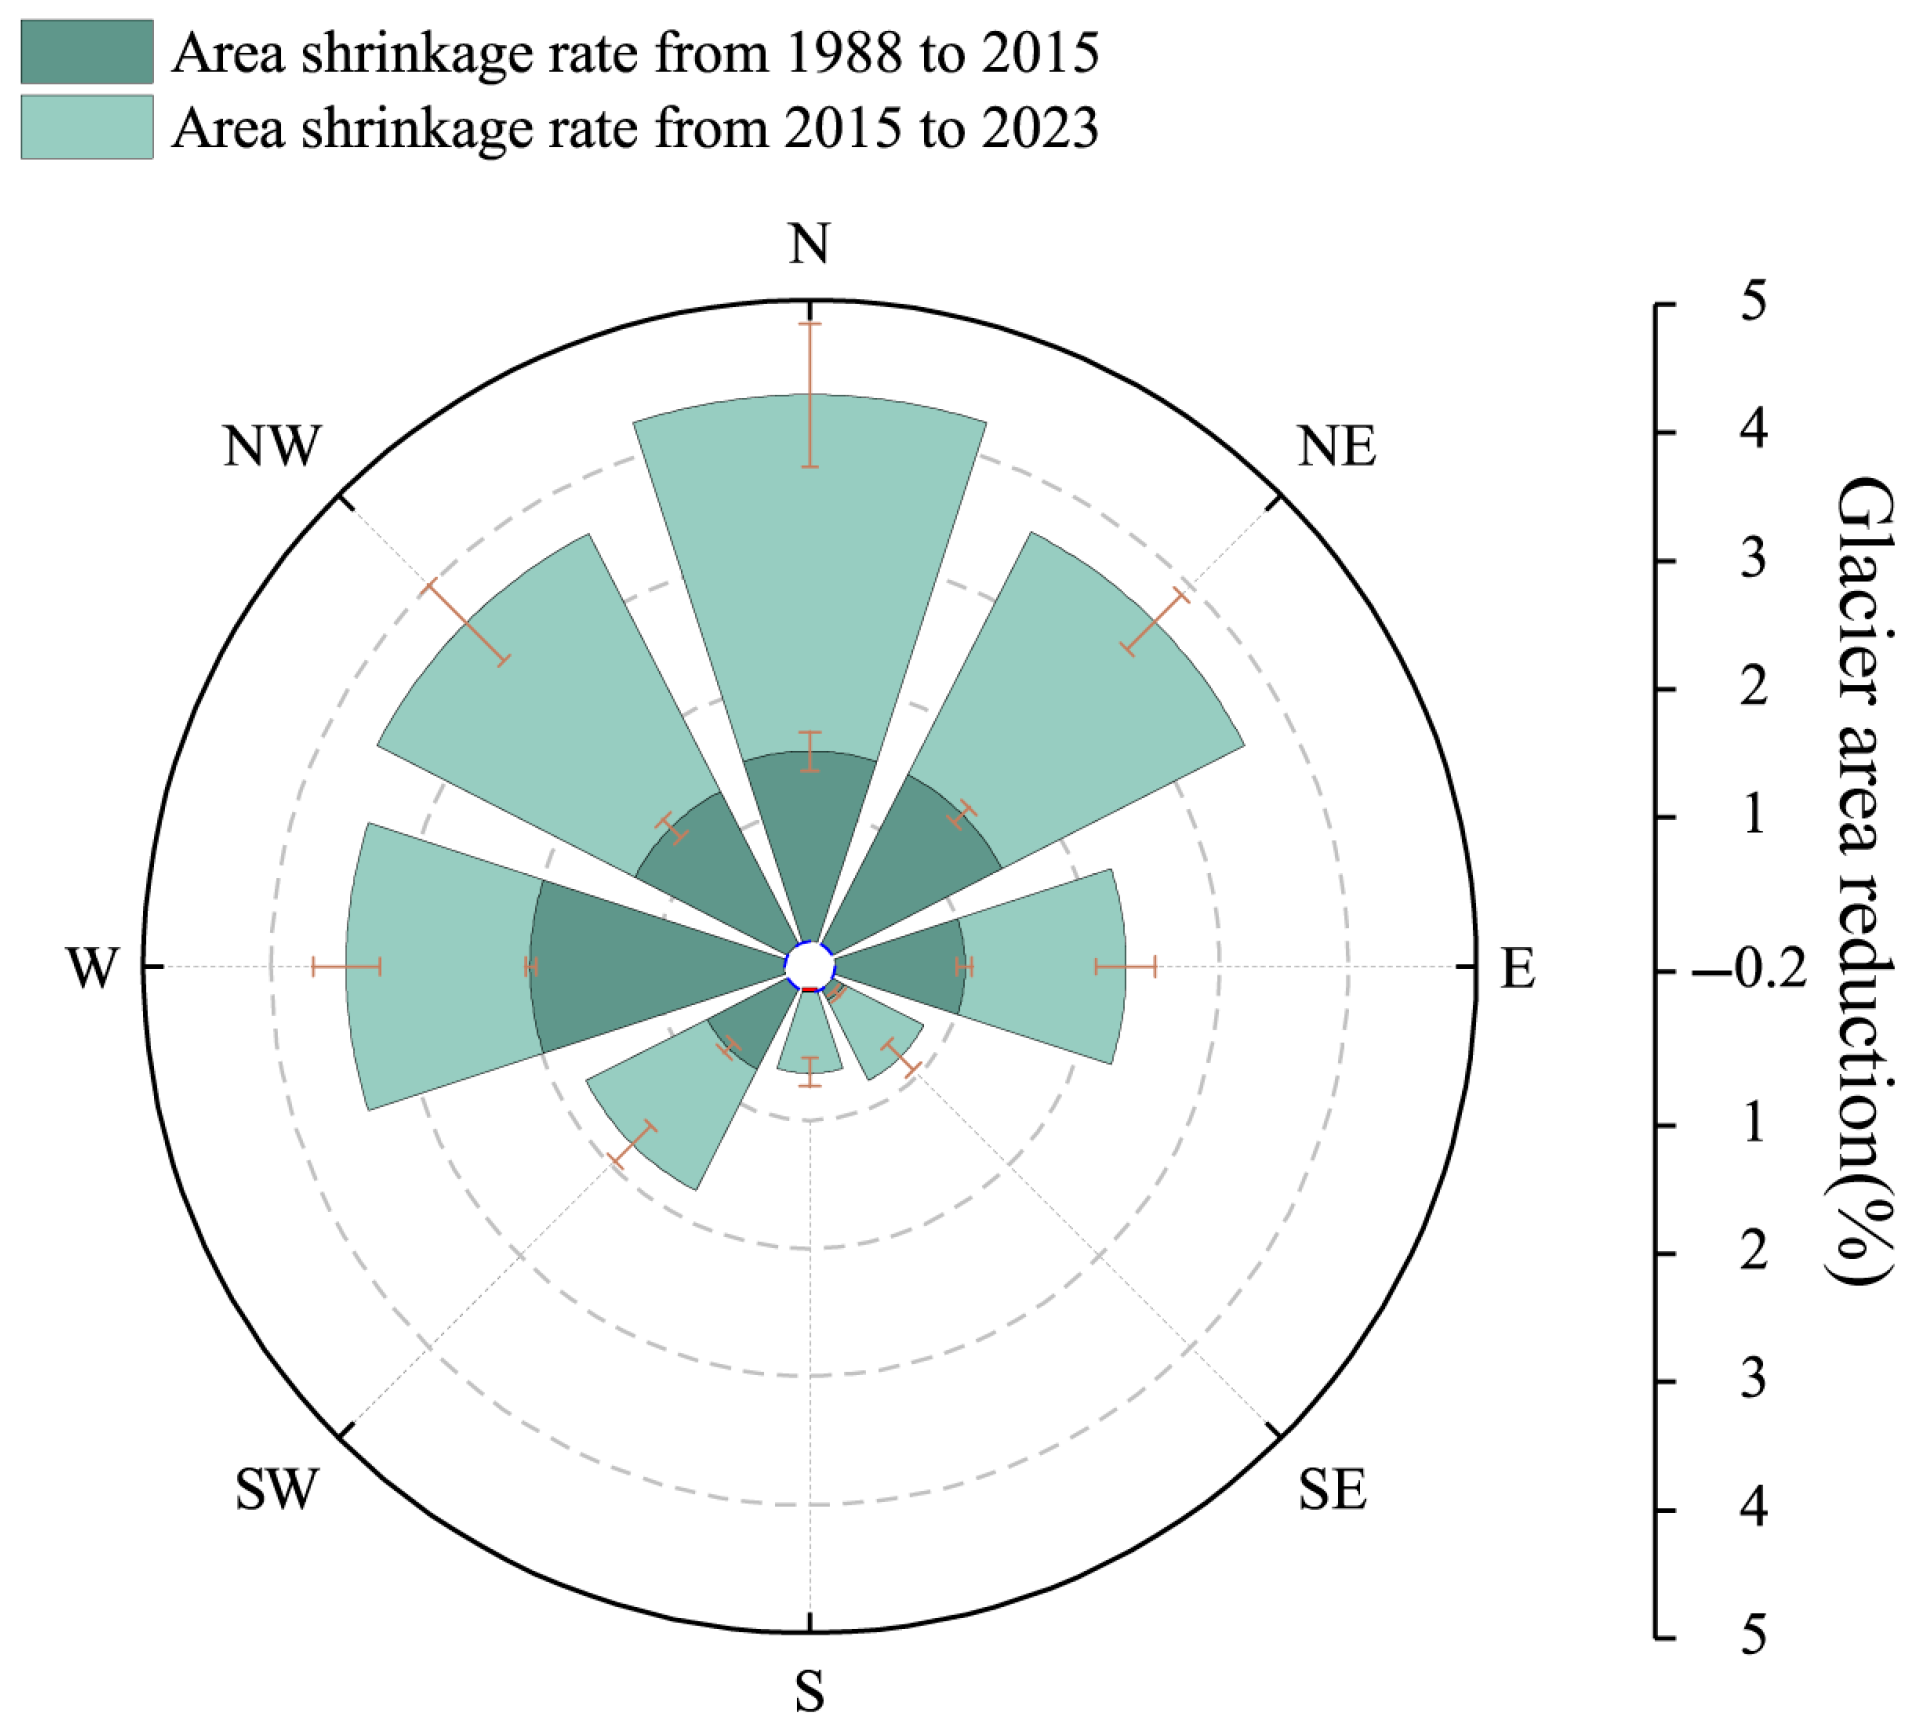
The glacier area on the southern slopes (S, SE, and SW) has seen a substantial absolute area reduction from 1988 to 2023, amounting to 374.71 ± 50.07 km2, while the glaciers on the northern slopes (N, NE, and NW) retreated by only 26.54 ± 4.91 km2. This disparity is accounted for by the predominance of glaciers on the southern slopes (S, SE, and SW) within the YZRB. Regarding the relative area change, the shrinkage rate of the northern slope glaciers increased from 2.7 times that of the southern slope glaciers in the first phase (1988–2015) to 2.9 times in the second phase (2015–2023), as shown in Figure 7. This indicates a substantially larger glacial coverage and a significantly lower retreat rate on the southern slopes (S, SE, and SW) compared to the northern slopes (N, NE, and NW).
In addition, during the initial phase, while glaciers with all other orientations experienced retreat and the lowest retreat rate was observed in southeast-oriented (SE) glaciers at 0.10 ± 0.08%·a−1; those south-oriented (S) glaciers slightly expanded at a rate of +0.02 ± 0.01%·a−1. West-oriented (W) glaciers exhibited the highest retreat rate of 1.98 ± 0.35%·a−1, succeeded by north and northeast-oriented (N and NE) glaciers at approximately 1.48%·a−1. In the subsequent phase, south-oriented (S) glaciers shifted from expansion to contraction, with the lowest retreat rate recorded at 0.63 ± 0.18%·a−1. Although the retreat rate for west-oriented (W) glaciers decreased to 1.44 ± 0.67%·a−1, rates for other orientations increased, with northward (N, NE, and NW) generally exceeding 2%·a−1. East-oriented (E) glaciers retreated at 1.26 ± 0.62%·a−1 which is higher than the 1.06 ± 0.49%·a−1 for southwest-oriented (SW) glaciers and 0.70 ± 0.24%·a−1 for southeast-oriented (SE) glaciers.

3.3. Glacier Changes at Sub-Basins from 1970s to 2023 in Collaboration with the Existing Glacier Inventory Data

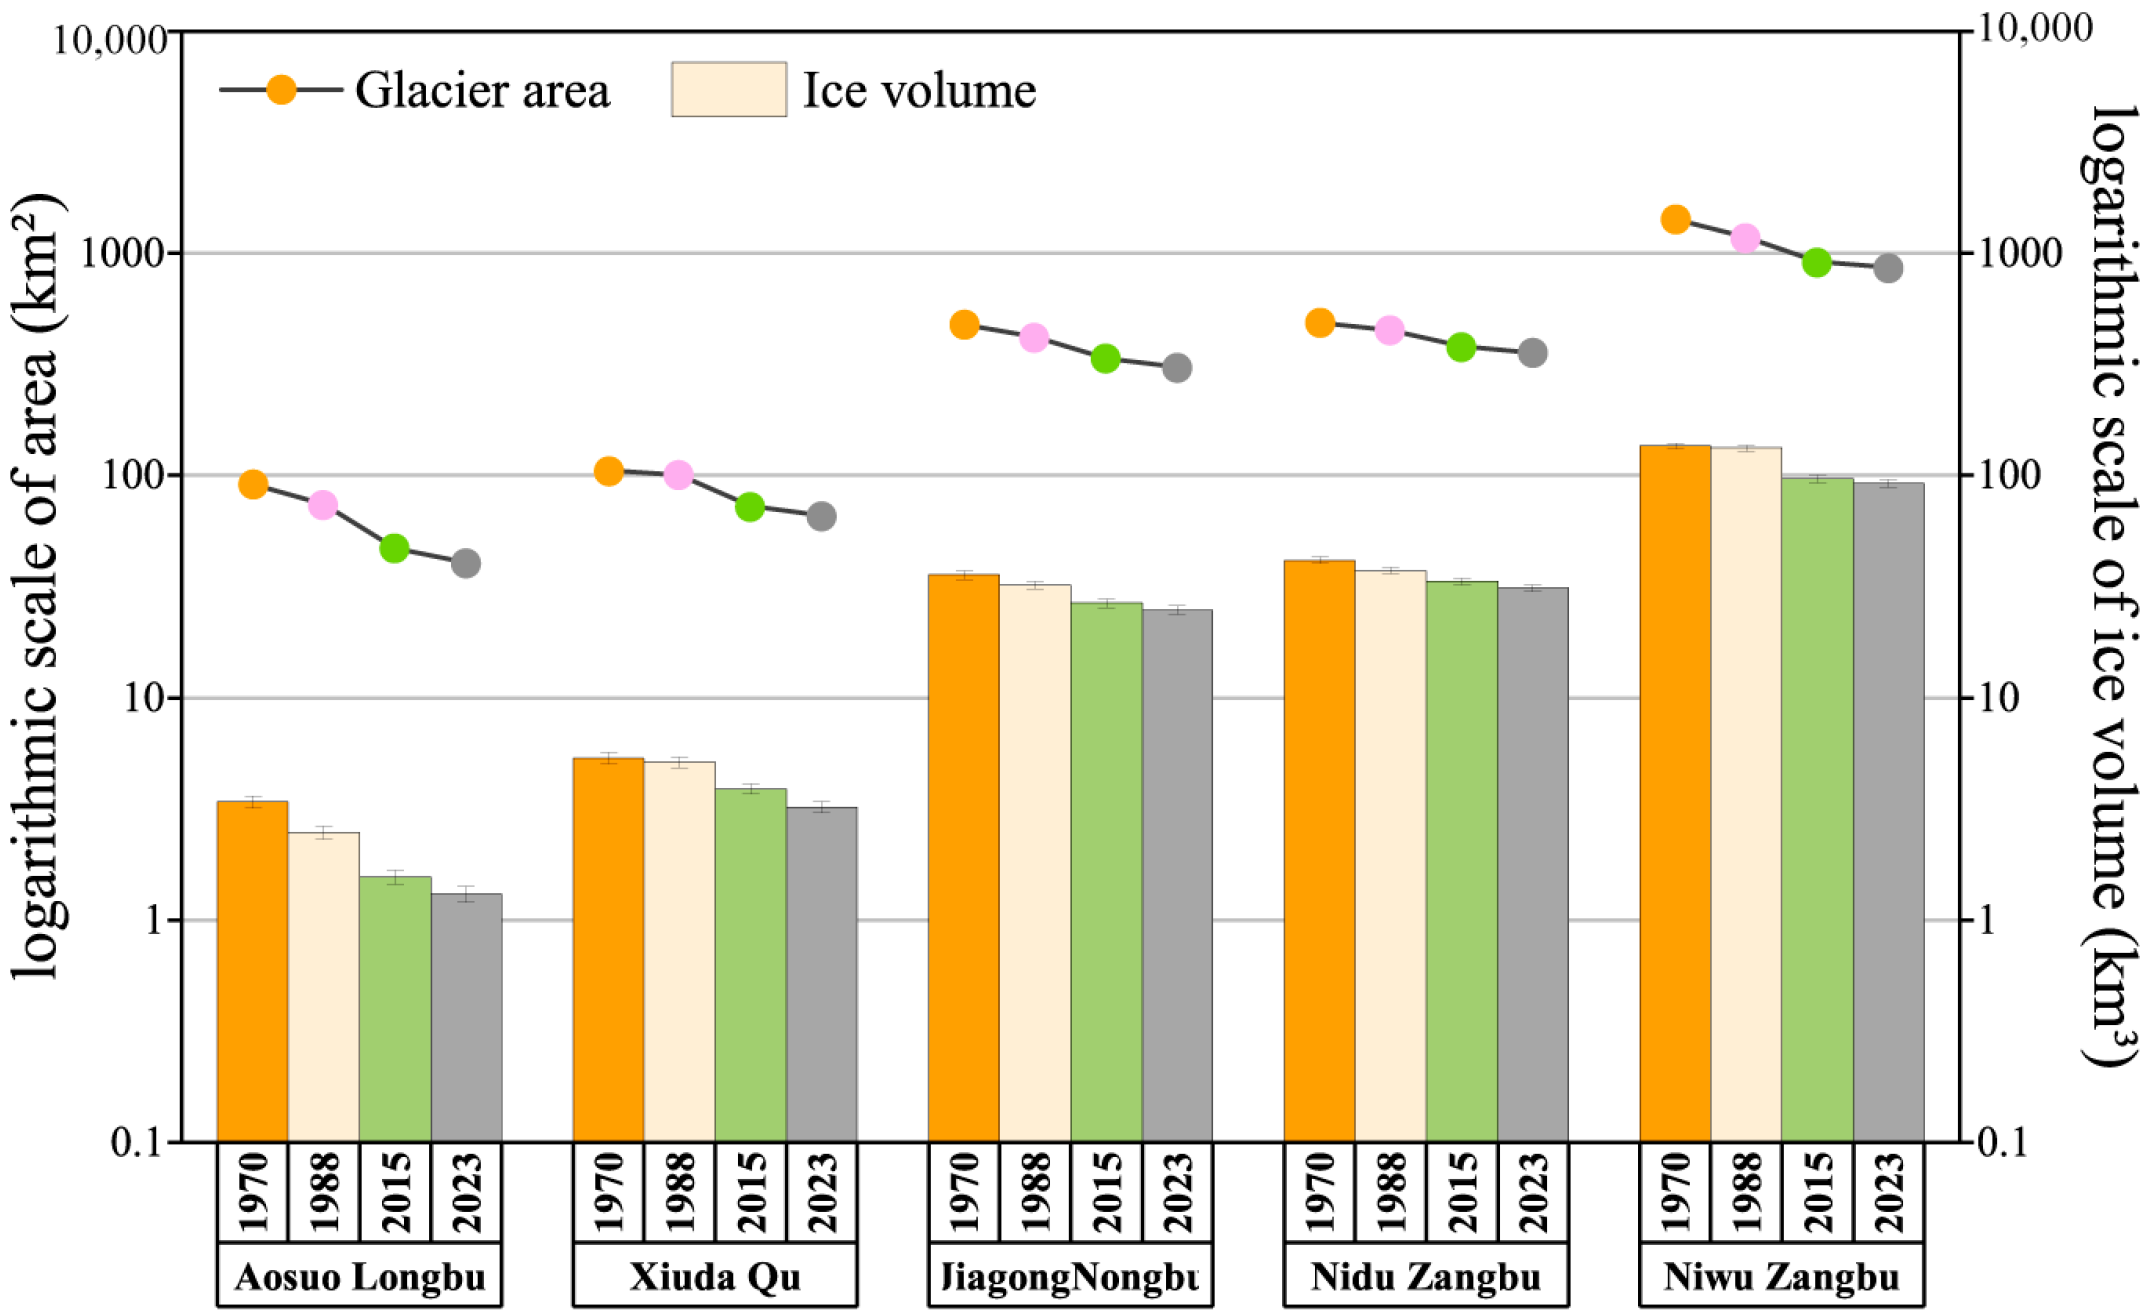
The comprehensive glacier analysis across various basins, constrained by the temporal limitations of the imagery used and conducted in partnership with the existing glacier inventory data, revealed significant reductions in both ice volume and glacier area over the span of 1970 to 2023. Glacier area diminished from 2583.09 ± 88.80 km2 to 1635.89 ± 71.74 km2 and ice volume reduced from 221.7017 ± 7.9618 km3 to 152.7429 ± 6.1747 km3, as illustrated in Figure 8. During this period, all sub-basins exhibited a significant declining trend in glacial areas, with Xiuda Qu River Basin contracting from 105.04 ± 5.32 km2 to 66.03 ± 3.80 km2, Jiagong Nongbu from 478.64 ± 20.80 km2 to 308.15 ± 15.29 km2, and Niwu Zangbu from 1421.45 ± 40.21 km2 to 865.15 ± 35.34 km2, each reducing by nearly 0.80%·a−1. The area of Aso Longbu Basin diminished by 1.16%·a−1, from 91.38 ± 4.83 km2 to 40.48 ± 2.86 km2, and Nidu Zangbu Basin experienced the smallest relative change but still a significant 0.56%·a−1 reduction, from 486.58 ± 17.64 km2 to 356.08 ± 14.45 km2.
The retreat in ice volume essentially paralleled the reductions in area, with the ice volume of Xiuda Qu River Basin decreasing by 0.83%·a−1, the Aso Longbu River Basin decreasing by nearly 1.28%·a−1—the most substantial reduction—and the Nidu Zangbu Basin decreasing by the least at 0.52%·a−1. The Niwu Zangbu and Jiagong Nongbu Basins also saw reductions of around 0.67%·a−1 and 0.63%·a−1, respectively. The precision of the data is evidenced by the consistent reduction in glacier area and ice volume with minimal error margins, yet the disparity in these metrics across various sub-basins remain unchanged. The Niwu Zangbu and Nidu Zangbu River Basins dominate in glacier area and ice volume, followed with the Jiagong Nongbu Basin, while the Aso Longbu and Xiuda Qu Basins report comparatively lower values.
Glacier retreat rate in the YZRB significantly reached 0.76 ± 0.11%·a−1 from the 1970s to 2023. This rate underwent some fluctuations, initially decreasing from 1.07 ± 0.24%·a−1 to 0.78 ± 0.12%·a−1, and was then followed by a modest increase, culminating at 0.85 ± 0.33%·a−1. The absolute decrease in glacier area in the western YZRB was less pronounced compared to the eastern part, while the shrinkage rate was significantly greater, as described in Table 3. Glaciers in the eastern Niwu Zangbu River Basin, initially having a relatively larger glacier size, notably contracted by 556.30 ± 61.35 km2, marking the most significant area reduction recorded. In contrast, glaciers in the western Aso Longbu River Basin decreased by merely 50.90 ± 7.11 km2. However, the glacier shrinkage rate in the Aso Longbu River Basin was the most pronounced across all time periods, averaging 1.16 ± 0.16%·a−1. And in the western Xiuda Qu, the glacier shrinkage rate experienced a sustained and steepest increase, reaching 1.19 ± 0.50%·a−1 from 2015 to 2023, while in Niwu Zangbu, it continued to decline to a minimum of 0.72 ± 0.23%·a−1.

3.4. Glacier Mass Balance Variations in the YZRB from 2000 to 2019

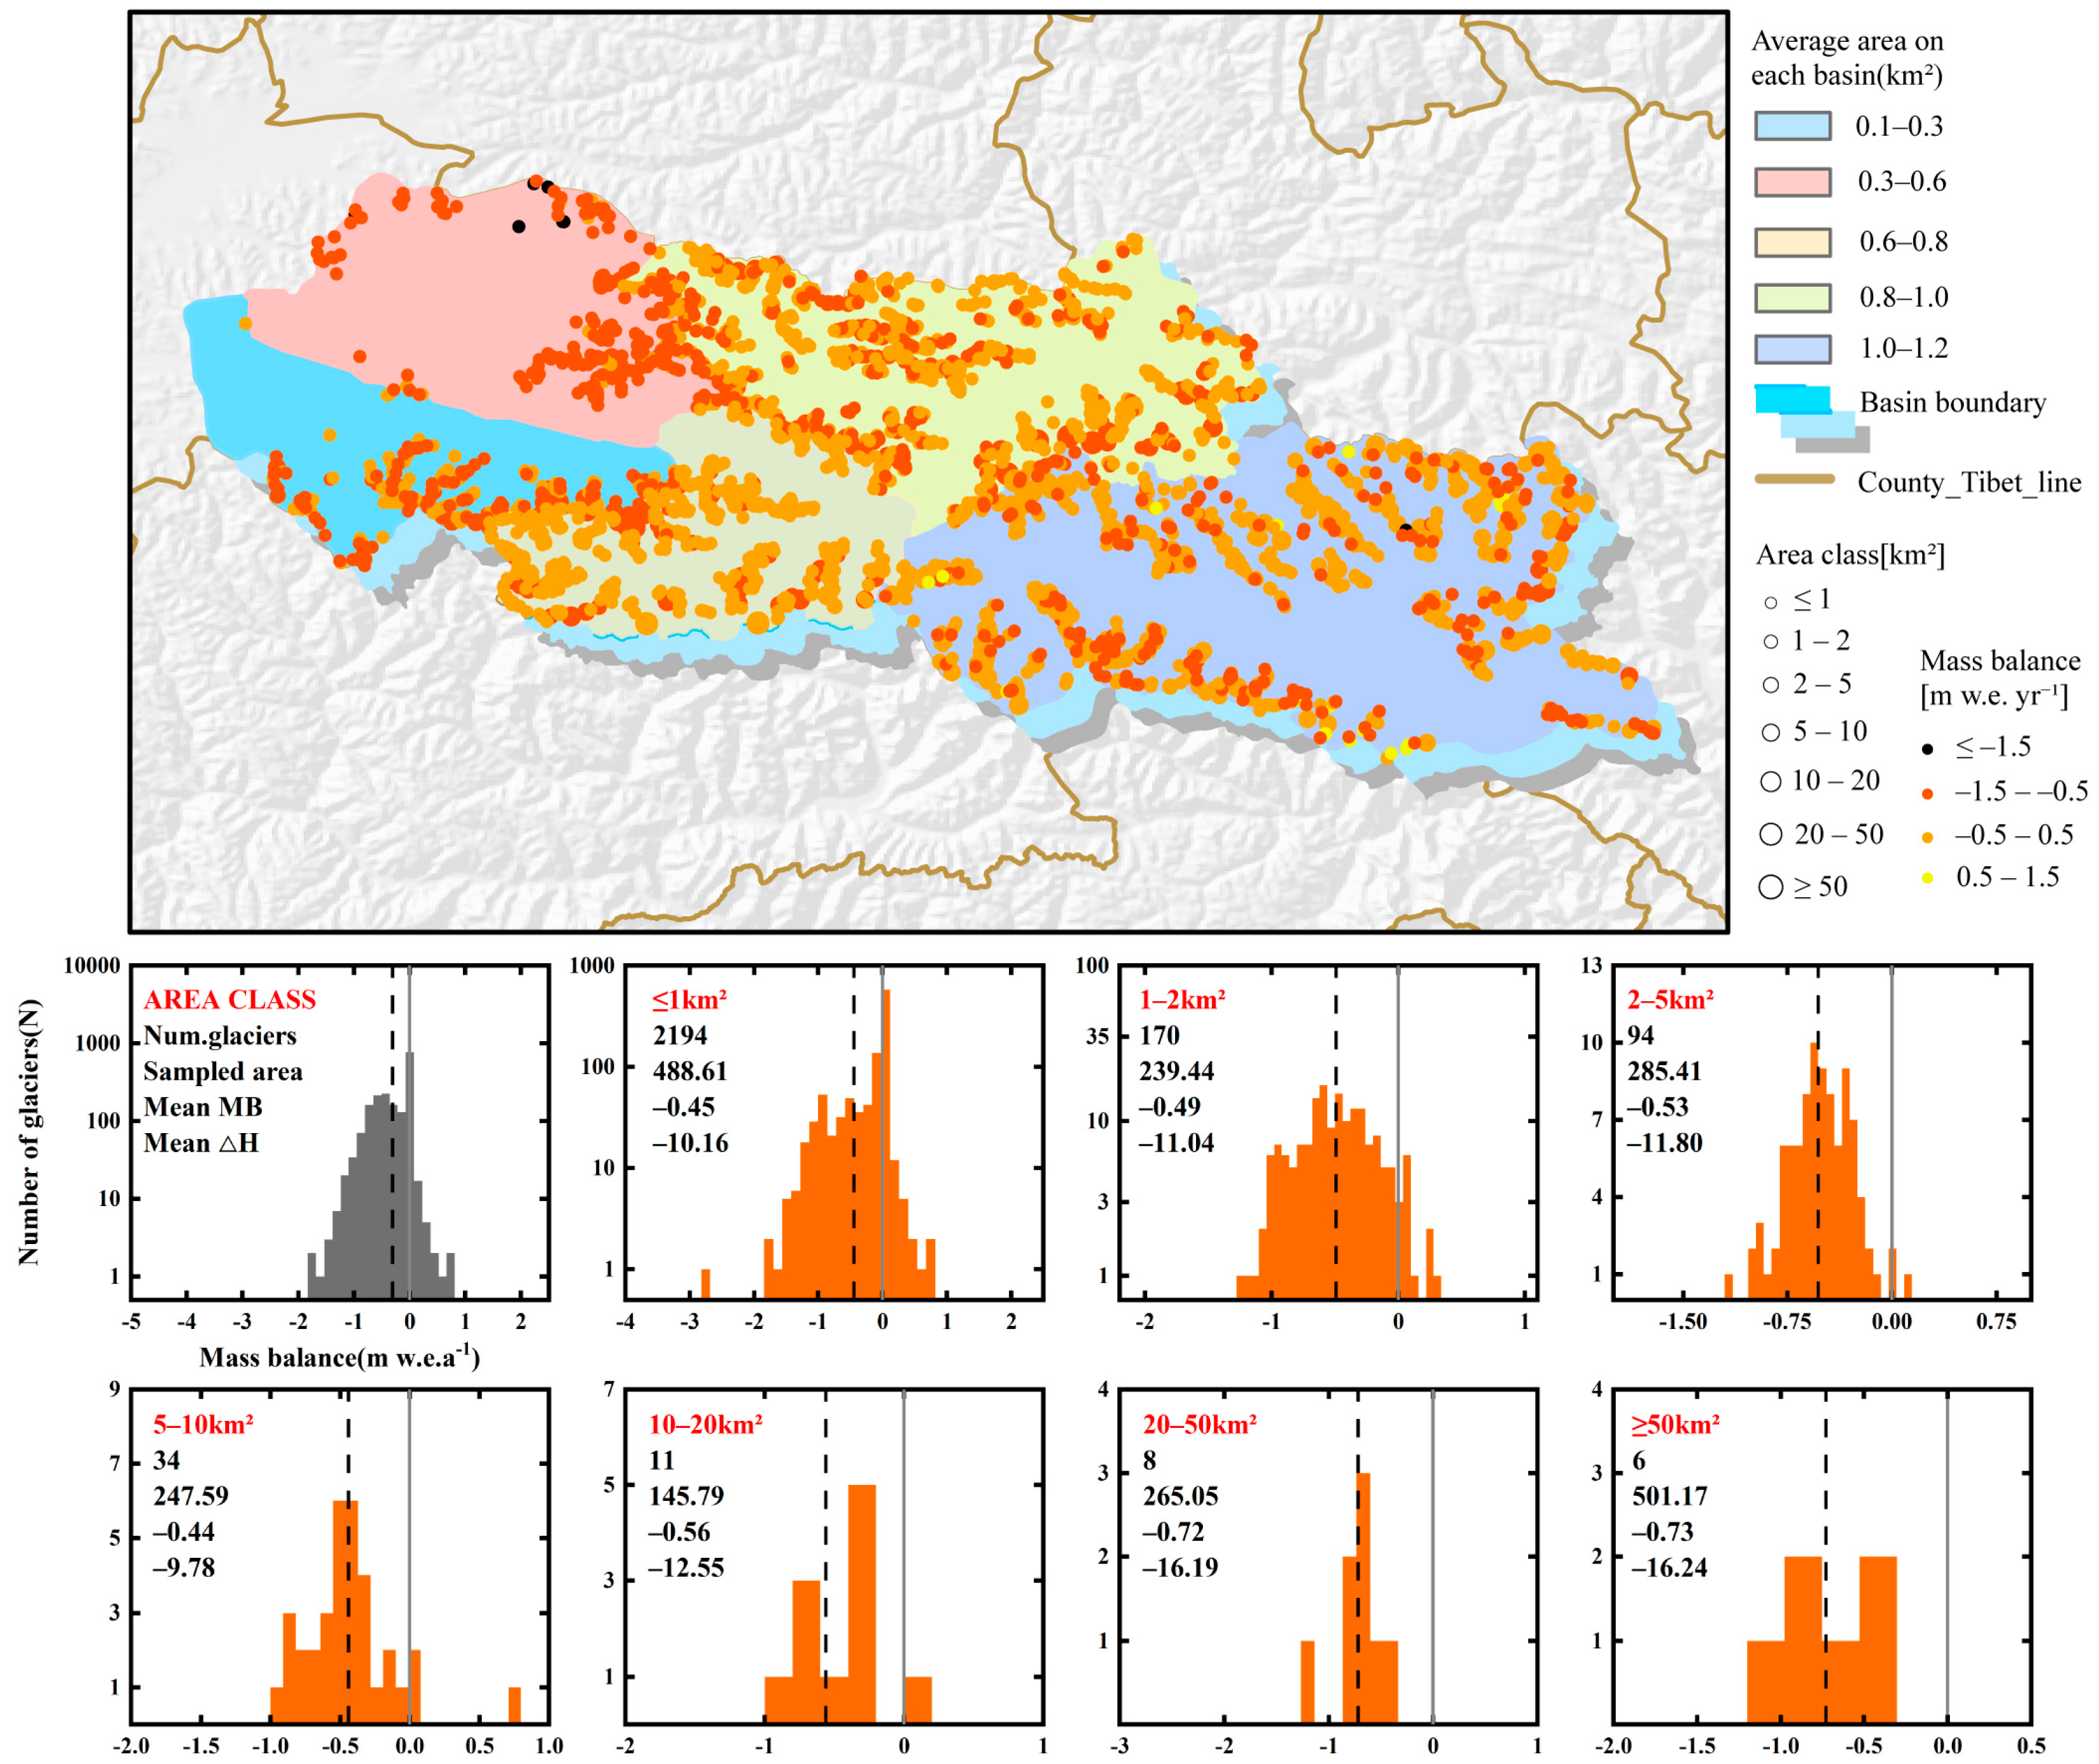
We calculated the glacier mass balance to reflect the climatic changes and corresponding glacier responses within the YZRB [58]. Glacier mass balance within the YZRB reached −0.57 ± 0.06 m w.e. a−1 from 2000 to 2019, aligning with the −0.64 ± 0.16 m w.e. a−1 loss recorded in SETP [59,60]. A positive correlation is observed between glacier area classes and the extent of loss in mass balance and elevation, as presented in Figure 9. Larger glaciers incurred more substantial losses during the study period. Glaciers smaller than 1 km2 altered their mass loss by 0.45 m w.e. a−1 (accompanied by an elevation change of −10.16 m), while those exceeding 50 km2 have seen this value rise to 0.73 m w.e. a−1 (with an elevation reduction of 16.24 m) [31]. This significant mass deficit further substantiates the ongoing reduction in glacier area and ice volume.

4. Discussion

4.1. Glacier Change Response to Climate

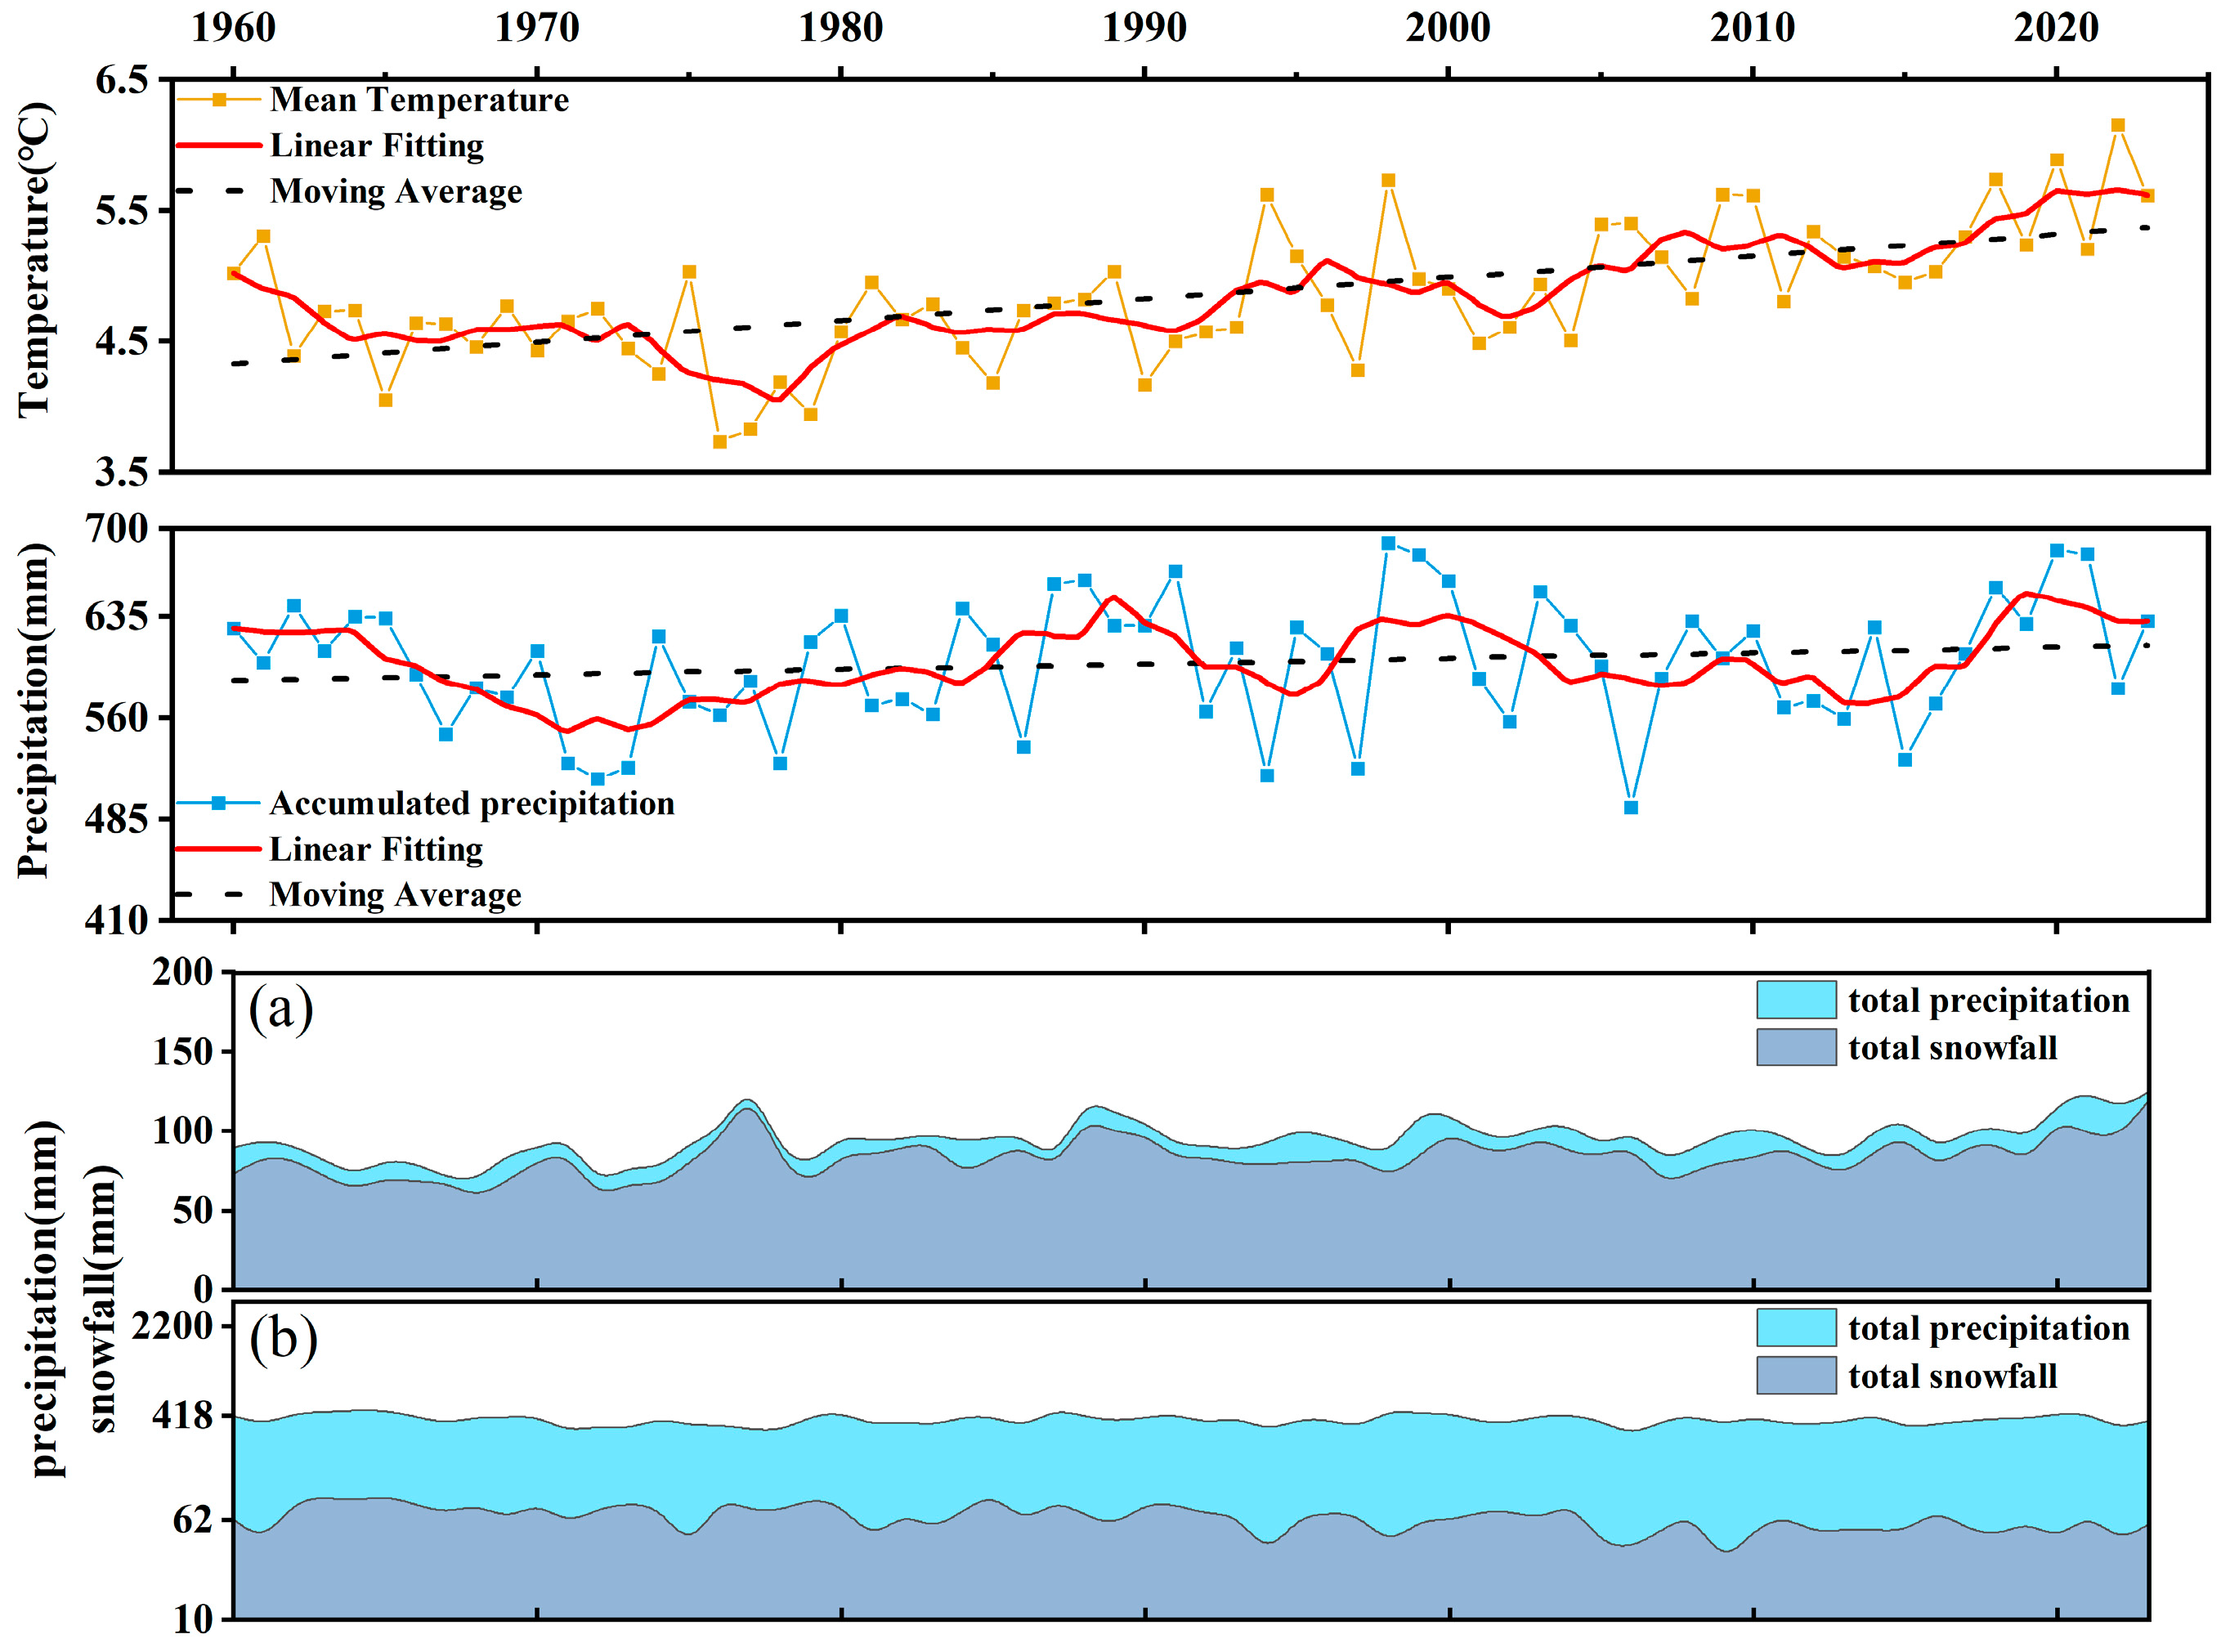
Temperature and precipitation are the main climatic elements influencing glacier change; temperature governs the glacier melting, while precipitation is crucial for glacial accumulation, and their interplay ultimately decides the nature, development, and evolution of glaciers [61]. To elucidate the response of glaciers in the YZRB to climate change, we analyzed the air temperature, precipitation, and snowfall data from the ERA5 reanalysis dataset for the period 1960–2023, as depicted in Figure 10. The results indicate that the average melting period temperature initially dipped to 3.731 °C in 1976, followed by a generally ascending trend, particularly post-1990, culminating in a peak of 5.614 °C in 2023 [62]. During the same period from 1960 to 2023, annual precipitation did not exhibit a clear long-term trend, displaying significant variability with a marginal increase from 626.186 mm in 1960 to 631.577 mm in 2023 [63]. Glacial melting is often considered a lagging indicator of climate change [64]. The glacier retreat rate declined from 1.07 ± 0.24%·a−1, during the period from the 1970s until 1988, to 0.78 ± 0.12%·a−1, during 1988–2015, and, subsequently, increased to 0.85 ± 0.33%·a−1, corresponding consistently with temperature fluctuations that are far from being adequately offset by precipitation replenishment.
Another contributing factor to glacier retreat was the transition of a portion of the precipitation from snow to rain, which curtails the accumulation of snow that would eventually turn into glacial ice [65]. In the Yigong Zangbo Basin, precipitation predominantly occurs during the melt season, with solid precipitation (snow) accounting for less than 0.2% and decreasing. Consequently, more precipitation falls as rain, leading to less accumulation of snow on glaciers and exposing the glacial ice to sun and warmth for an extended duration of the melt season, significantly accelerating the melting process. Additionally, a minor increase in light snowfall during spring, transitioning from rain to snow, is insufficient to compensate the loss of glacial mass. Rising temperatures may further exacerbate glacier melting, as even a greater snowfall proportion may not prevent accelerated glacial melting, ultimately causing a net reduction in glacial mass. As the inherent delay in glacial response to climatic shifts, anticipated continued increases in global temperatures are likely to further drive the glacier retreat.
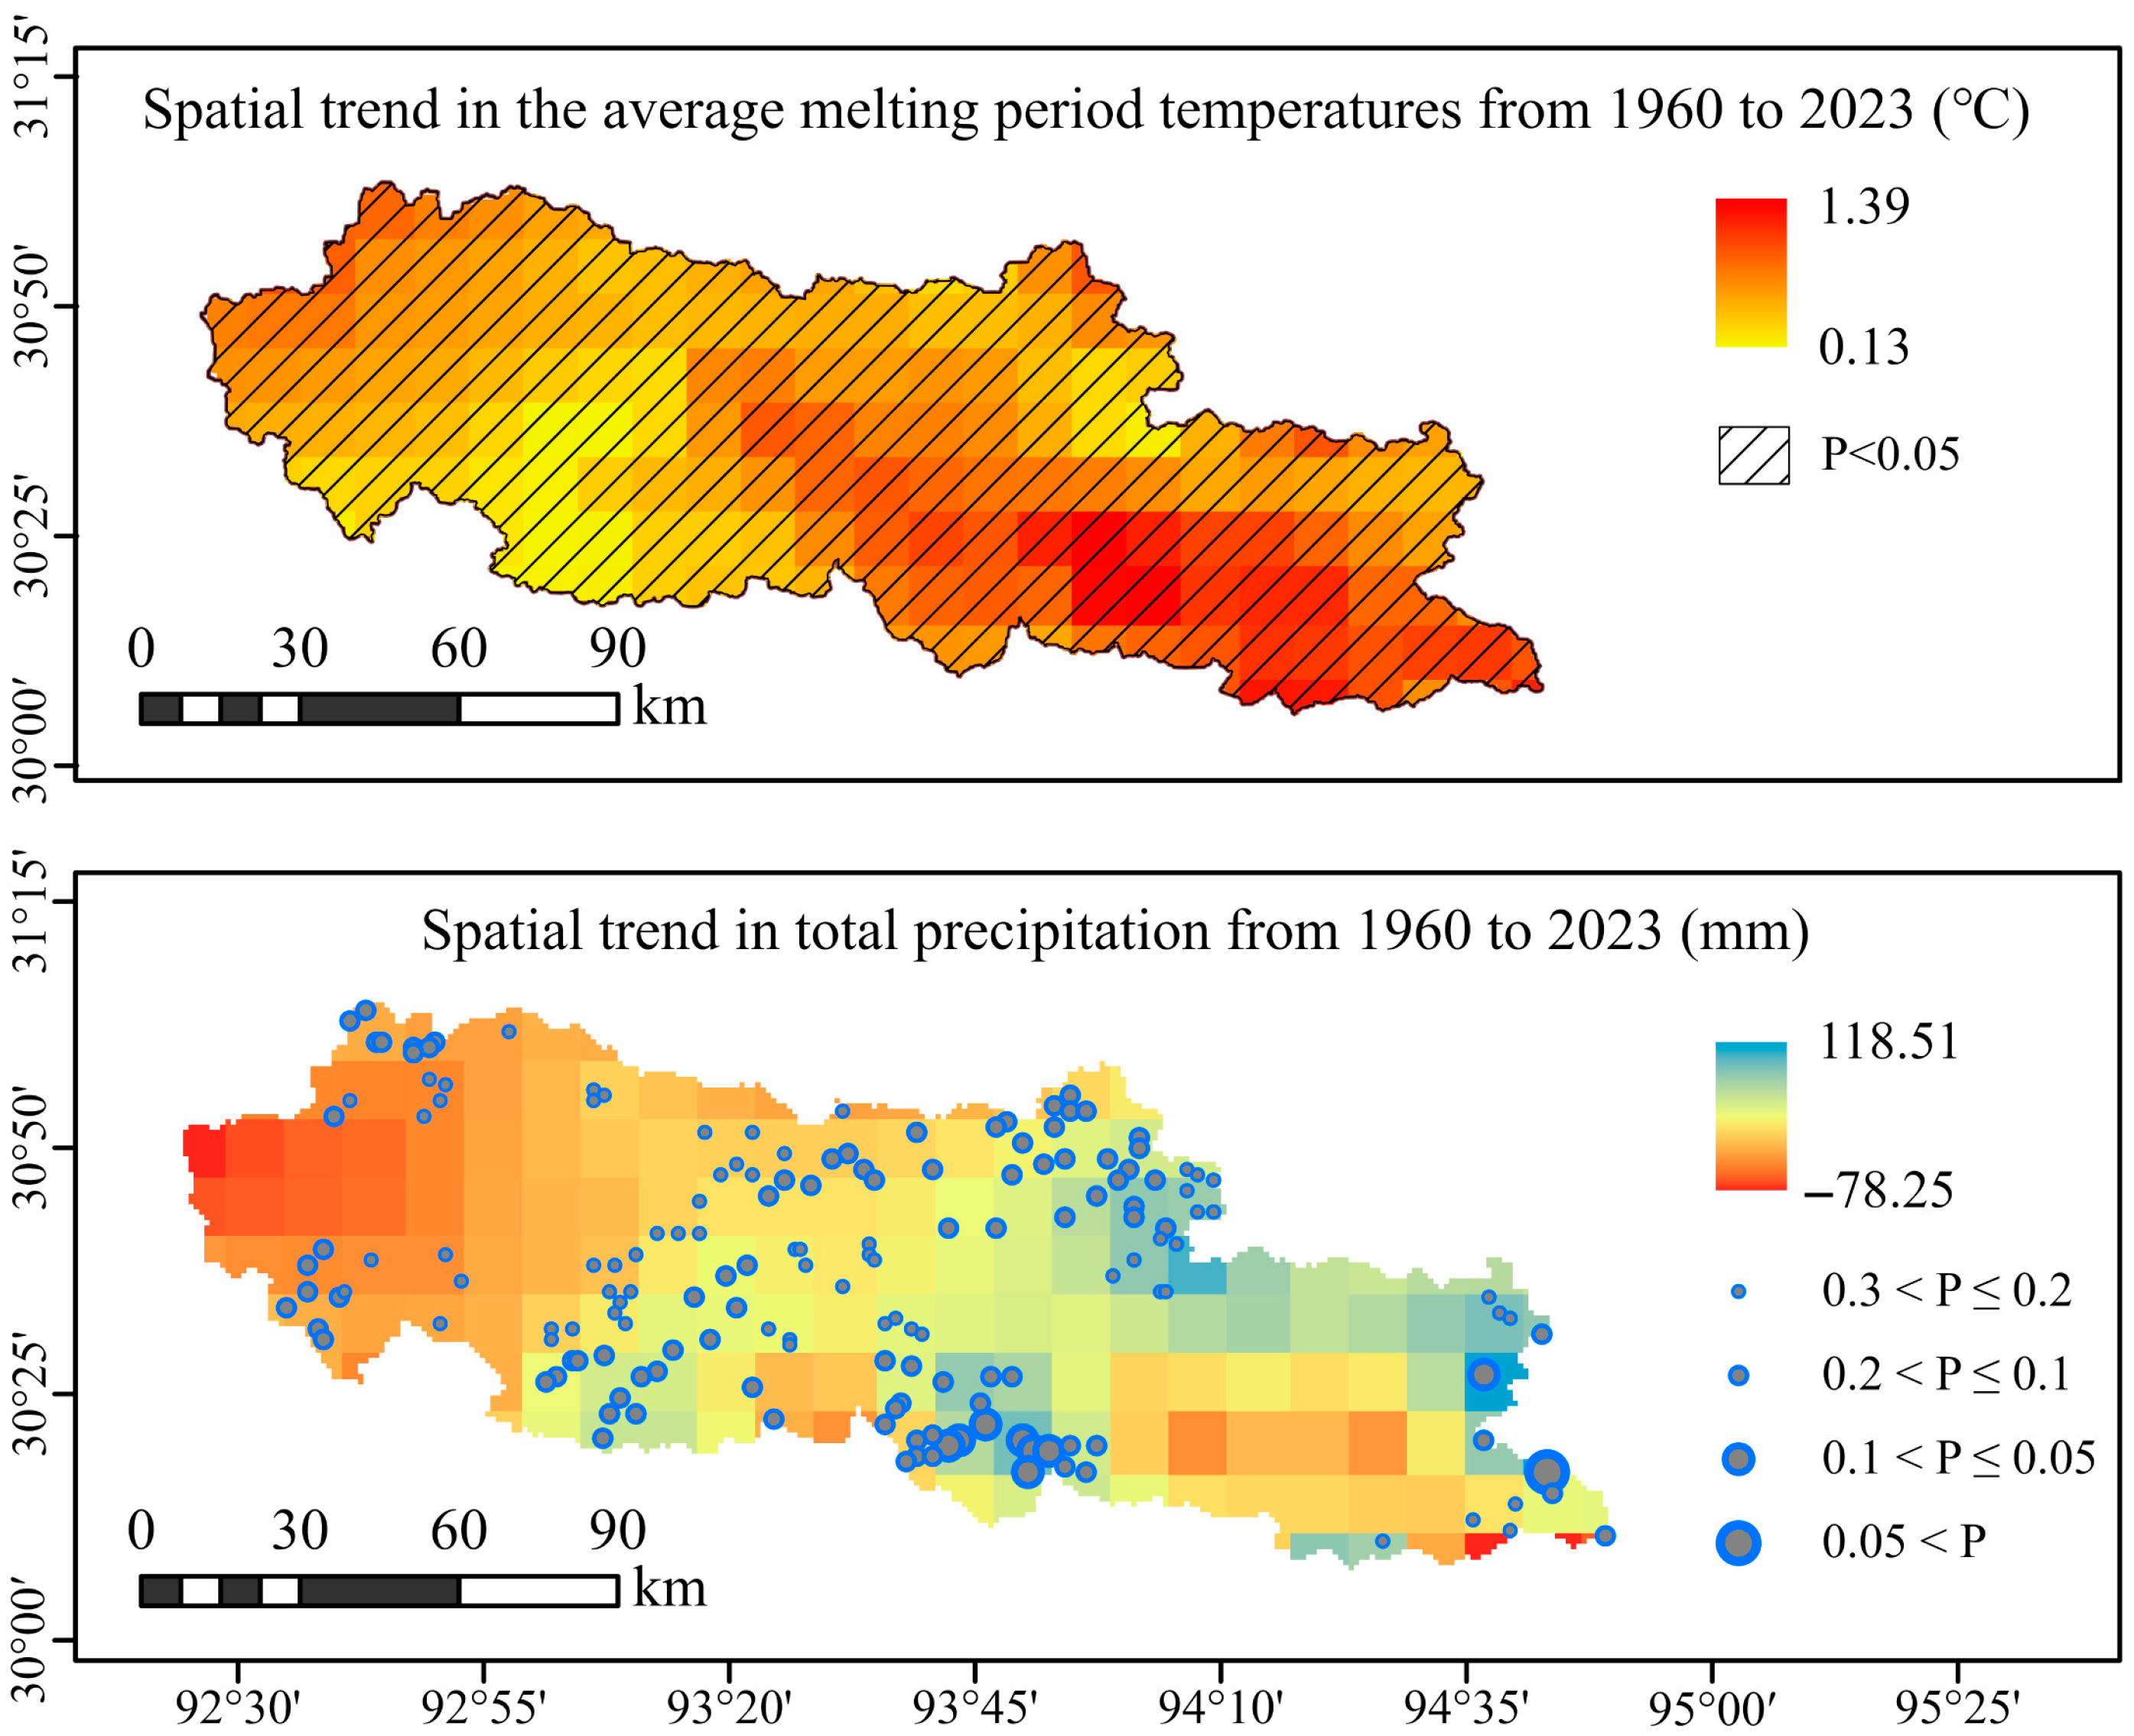
In the YZRB, average melting period temperatures have generally increased, with temperature increments ranging from +0.13 °C to +1.39 °C. The most significant rise is observed in the eastern regions, such as the Niwu Zangbu basin. Conversely, the western regions, including the Aosuo Longbu and Xiuda Qu basins, exhibit relatively minor temperature changes. As indicated in Figure 11, nevertheless, the range of precipitation changes varies from a +118.51 mm increase to a −78.25 mm decrease. The warming trend persists, with the most significant decrease in precipitation correlating with the most pronounced relative retreat of small-scale glaciers in the western regions.
These climatic variables—temperature rise and overall upward trend in precipitation—are the dominant factors in the drastic glacier melt. Nonetheless, these factors alone do not fully explain the observed variability in glacial retreat [66].

4.2. Local Topography and Glacial Changes

Solar radiation is spatially heterogeneous due to varying slope orientations [67], which is the pivotal topographic determinant contributing to spatiotemporal differences in glacier change, even under consistent climatic conditions [68,69,70]. Glaciers receiving higher levels of solar shortwave radiation tend to have quicker internal temperature increases, leading to an accelerated retreat. Conversely, glaciers on shaded slopes retreat more gradually [71]. The YZRB, situating at the great bend of the Yarlung Zangbo River on the Tibetan Plateau, is influenced by warm, moist monsoonal air entering the plateau and the barrier effect of towering mountain to the north. The southern sides of the YZRB receive less solar radiation than the northern sides and benefit from greater precipitation mitigating some of the glacial melt induced by solar heat. Glaciers on the southward slope (S, SE, and SW) have a significantly larger coverage and exhibit a markedly lower rate of retreat compared to those on the northern side, with the area shrinkage rate being 2.7 times lower during 1988–2015 and subsequently increasing to 2.9 times.

4.3. Physical Properties and Glacier Changes

In addition to topography, glacier physical features such as the glacier size, debris cover, and development of ice-contact lakes make the response of glaciers to climate change more complex and variable [72,73,74,75,76,77].
While the absolute decrease in glacier area in the western YZRB was less pronounced compared to the eastern section, the shrinkage rate was significantly greater. This discrepancy can be attributed to the larger glaciers in the east, despite possessing greater inertia and thermal insulation, experiencing a more substantial absolute area change due to their extensive spatial distribution. The increase in surface area and volume of these larger glaciers enhances the likelihood of melting. Even if the retreat rate of these larger glaciers is slower, their mass loss is still greater than that of smaller glaciers in the west. For instance, those in the Aso Longbu and Xiuda Qu River Basin (where over 96% of glaciers have an area below 2 km2), were more climate-sensitive and witnessed the most pronounced relative area shrinkage.
Rising temperatures are expected to continue driving the expansion of debris cover [69], with lower albedo enhancing glacial melting. In the Niwu Zangbo River Basin, which features a multitude of compound valley glaciers, the area of debris-covered glacier expanded from 63.39 km2 in 1990 to 66.24 km2 in 2000 and 71.16 km2 in 2015 [27]. This increase has enveloped nearly every glacier tongue, accelerating their shrinkage.
In 2016, a total of 192 glacial lakes were delineated within the watershed, covering an area of 45.73 ± 6.18 km2 [78]. Amidst global warming, the ongoing glaciers retreat prompted the formation and expansion of numerous glacial lakes in proglacial or deglaciated regions [35]. Additionally, given the higher specific heat capacity of water compared to ice, and the lower albedo of water surfaces, ice-contact lakes can absorb more atmospheric heat, hastening the melting of the terminus [79,80].

5. Conclusions

In this paper, the integrated characteristics of glacier change since the 1970s until 2023 in the YZRB, along with the heterogeneous controlling causes, were examined across multi-source data. There were 1975 glaciers covering an area of 1635.89 ± 71.74 km2 and holding a total ice volume of 152.7429 ± 6.1747 km3 in 2023. These glaciers were distributed between altitudes of 4000 m to 6200 m, with the greatest concentration at 5400 to 5600 m above sea level. The majority were southeast and south-facing with areas less than 0.5 km2. And the glaciers in NiWu Zangbo River Basin surpassed others in all measured attributes. The widespread decline of glacier area, ice volume, and mass balance has generally resulted from temperature increases and the reduction in the ratio of solid precipitation during the ablation season, and it is far from being adequately offset by increased precipitation replenishment. Since the 1970s until 2023, glaciers in the YZRB significantly retreated at a rate of 0.76 ± 0.11%·a−1, with the glacier area decreasing from 2583.09 ± 88.80 km2 to 1635.89 ± 71.74 km2, and the ice volume reducing from 221.7017 ± 7.9618 km3 to 152.7429 ± 6.1747 km3. The shrinkage rate slightly decreased amidst fluctuations and the most significant retreat occurred in glaciers smaller than 1 km2. Additionally, the glaciers experienced an average mass loss of 0.57 ± 0.06 m w.e. a−1 over the two decades from 2000 to 2019, substantiating the ongoing reduction in glacier area and ice volume, with larger glaciers incurring more substantial losses.
Glacier retreat is closely linked to rising temperatures, yet the slope orientations influence their heterogeneous response to climate change. Glaciers on southern aspects maintain larger extents and retreat at significantly slower rates compared to those on the northern side. The interplay of various physical characteristics—such as size, debris cover, and the presence of proglacial lakes—with local topography adds complexity to glacier change. Smaller glaciers exhibited more climate-sensitive behavior and witnessed the most pronounced relative area shrinkage. The debris distribution at the glacier tongue facilitates the formation of glacial lakes, accelerating glacier mass loss.

Author Contributions

Conceptualization, S.Y. and N.W.; methodology, S.Y., N.W. and J.C.; software, S.Y., C.S. and M.Z.; validation, S.Y., J.C. and S.Z.; formal analysis, N.W.; investigation, N.W.; resources, N.W.; data curation, S.Y.; writing—original draft preparation, S.Y.; writing—review and editing, N.W., J.C. and S.Z.; visualization, S.Y.; supervision, N.W.; project administration, N.W.; funding acquisition, N.W. All authors have read and agreed to the published version of the manuscript.

Funding

This work was supported by the Second Tibetan Plateau Scientific Expedition and Research Program under Grant 2019QZKK020102.

Data Availability Statement

The data presented in this study are available on request from the corresponding author. The data are not publicly available due to privacy.

Acknowledgments

The authors would like to thank USGS for the provision of Landsat and Sentinel-2 imagery, to JAXA for the AW3D30 DSM, to GEE for the NASA DEM and meteorological data, to EARTHDATA for the ICESat-2 ATL06 data, to Theia for the glacier surface elevation change data, to IACS for the RGI data, and to Professor Changqing Ke’s team for the glacier inventory data in SETP.

Conflicts of Interest

The authors declare no conflicts of interest.

References

  1. Yao, T.; Thompson, L.; Yang, W.; Yu, W.; Gao, Y.; Guo, X.; Yang, X.; Duan, K.; Zhao, H.; Xu, B.; et al. Different glacier status with atmospheric circulations in Tibetan Plateau and surroundings. Nat. Clim. Chang. 2012, 2, 663–667. [Google Scholar] [CrossRef]
  2. Yao, T.; Pu, J.; Lu, A.; Wang, Y.; Yu, W. Recent glacial retreat and its impact on hydrological processes on the tibetan plateau, China, and sorrounding regions. Arct. Antarct. Alp. Res. 2007, 39, 642–650. [Google Scholar] [CrossRef]
  3. Liu, X.D.; Chen, B.D. Climatic warming in the Tibetan Plateau during recent decades. Int. J. Climatol. 2000, 20, 1729–1742. [Google Scholar] [CrossRef]
  4. Kraaijenbrink, P.D.; Bierkens, M.F.; Lutz, A.F.; Immerzeel, W. Impact of a global temperature rise of 1.5 degrees Celsius on Asia’s glaciers. Nature 2017, 549, 257–260. [Google Scholar] [CrossRef] [PubMed]
  5. Fan, Y.; Ke, C.; Zhou, X.; Shen, X.; Yu, X.; Lhakpa, D. Glacier mass-balance estimates over High Mountain Asia from 2000 to 2021 based on ICESat-2 and NASADEM. J. Glaciol. 2023, 69, 500–512. [Google Scholar] [CrossRef]
  6. Pu, J.; Yao, T.; Wang, N.; Su, Z.; Shen, Y. Fluctuations of the Glaciers on the Qinghai-Tibetan Plateau during the Past Century. J. Glaciol. Geocryol. 2004, 26, 517–522. [Google Scholar]
  7. Ye, Q.; Cheng, W.; Zhao, Y.; Zong, J.; Zhao, R. A Review on the Research of Glacier Changes on the Tibetan Plateau by Remote Sensing Technologies. J. Geo-Inf. Sci. 2016, 18, 920–930. [Google Scholar]
  8. Liu, S.; Yao, X.; Guo, W.; Xu, J.; Shangguan, D.; Wei, J.; Bao, W.; Wu, L. The contemporary glaciers in China based on the Second Chinese Glacier Inventory. Acta Geogr. Sin. 2015, 70, 3–16. [Google Scholar]
  9. Guo, W.; Liu, S.; Xu, J.; Wu, L.; Shangguan, D.; Yao, X.; Wei, J.; Bao, W.; Yu, P.; Liu, Q. The second Chinese glacier inventory: Data, methods and results. J. Glaciol. 2015, 61, 357–372. [Google Scholar] [CrossRef]
  10. Xiao, Y.; Ke, C.; Cai, Y.; Shen, X.; Wang, Z.; Nourani, V.; Lhakpa, D. Glacier Retreating Analysis on the Southeastern Tibetan Plateau via Multisource Remote Sensing Data. J.-STARS 2023, 16, 2035–2049. [Google Scholar] [CrossRef]
  11. Ke, L.; Ding, X.; Zhang, L.; Hu, J.; Shum, C.K.; Lu, Z. Compiling a new glacier inventory for southeastern Qinghai-Tibet Plateau from Landsat and PALSAR data. J. Glaciol. 2016, 62, 579–592. [Google Scholar] [CrossRef]
  12. Wang, S.; Ke, C.; Chen, J. Semi-automatic Update of the Second Chinese Glacier Inventory based on Deep Learning. Remote Sens. Technol. Appl. 2023, 38, 1264–1273. [Google Scholar]
  13. Luo, L.-H.; Ke, C.; Fan, Y.-B.; Wang, Z.-F. Accelerated glacier mass loss in the southeastern Tibetan Plateau since the 1970s. Adv. Clim. Chang. Res. 2023, 14, 372–386. [Google Scholar] [CrossRef]
  14. Zhao, Y.; Zhang, Y.; Liu, S.; Wang, X. Review of maritime glacier mass balance in the southeastern Tibetan Plateau. J. Glaciol. Geocryol. 2022, 44, 930–945. [Google Scholar]
  15. Yang, W.; Yao, T.; Xu, B.; Ma, L.; Wang, Z.; Wan, M. Characteristics of recent temperate glacier fluctuations in the Parlung Zangbo River basin, southeast Tibetan Plateau. Chin. Sci. Bull. 2010, 55, 2097–2102. [Google Scholar] [CrossRef]
  16. Neckel, N.; Loibl, D.; Rankl, M. Recent slowdown and thinning of debris-covered glaciers in south-eastern Tibet. Earth Planet. Sci. Lett. 2017, 464, 95–102. [Google Scholar] [CrossRef]
  17. Wu, K.; Xiao, L.; Liu, S.; Yang, W. Simulation of mass balance of glaciers in the Parlung Zangbo Basin in southeast Tibet from 1980 to 2019. J. Glaciol. Geocryol. 2023, 45, 1829–1839. [Google Scholar]
  18. An, G.; Han, L.; Huang, S.; Gu, Y.; Guo, Z.; Wang, S. Dynamic Variation of Glaciers in Nyaingentanglha Mountain During 1999-2015: Evidence from Remote Sensing. Geoscience 2019, 33, 176. [Google Scholar]
  19. Di, B. Glacier Change in the Nianqing Tanggula Mountains in 36 Years and Its Response to Climate Change. Master’s Thesis, China University of Geosciences, Beijing, China, 2019. [Google Scholar]
  20. Zhang, B. InSAR Monitoring Technology for Geological Hazards in Eastern Jia li Fault. Master’s Thesis, Chang’an University, Xi’an, China, 2022. [Google Scholar]
  21. Yao, T.; Yu, W.; Wu, G.; Xu, B.; Yang, W.; Zhao, H.; Wang, W.; Li, S.; Wang, N.; Li, Z. Glacier anomalies and relevant disaster risks on the Tibetan Plateau and surroundings. Chin. Sci. Bull. 2019, 64, 2770–2782. [Google Scholar]
  22. Feng, W.; Changqing, K. Glacier recognition in the Yigong Zangbo River Basin based on the optical and thermal infrared remote sensing image. China Sci. Pap. 2016, 11, 245–250. [Google Scholar]
  23. Zhang, T.; Zhang, J.; Wu, H. Variation of the glaciers in Nyingchi Municipality of Tibet autonomous region during 1990–2000. J. Glaciol. Geocryol. 2011, 33, 14–20. [Google Scholar]
  24. Neckel, N.; Kropáček, J.; Bolch, T.; Hochschild, V. Glacier mass changes on the Tibetan Plateau 2003–2009 derived from ICESat laser altimetry measurements. Environ. Res. Lett. 2014, 9, 014009. [Google Scholar] [CrossRef]
  25. Li, L. Research on glacier elevation changes in Southeast Tibet based ICESat and CryoSat-2 Data. IOP Conf. Ser. Earth Environ. Sci. 2021, 865, 294–300. [Google Scholar] [CrossRef]
  26. Lingzhi, X.; Zhihong, L.; Jinbao, L.; Xiao, Z. Ynamic Variation of Glaciers in Bomi County of Tibet During 1980∼2010. Procedia Environ. Sci. 2011, 10, 1654–1660. [Google Scholar] [CrossRef]
  27. Ke, C.-Q.; Lee, H.; Han, Y.-F. Glacier Change in the Yigong Zangbo Basin, Tibetan Plateau, China. Korean J. Remote Sens. 2019, 35, 491–502. [Google Scholar]
  28. Zhang, T.-T.; Ren, J.-W.; Kang, S.-C. Lanong Glacier Retreat in Nyainqentanglha Range of Tibetan Plateau during 1970–2003. J. Glaciol. Geocryol. 2004, 26, 736–739. [Google Scholar]
  29. Wu, K.; Liu, S.; Jiang, Z.; Xu, J.; Wei, J.; Guo, W. Recent glacier mass balance and area changes in the Kangri Karpo Mountains from DEMs and glacier inventories. Cryosphere 2018, 12, 103–121. [Google Scholar] [CrossRef]
  30. Liu, S.; Shangguan, D.; Ding, Y.; Han, H.; Xie, C.; Zhang, Y.; Li, J.; Wang, J.; Li, G. Glacier changes during the past century in the Gangrigabu mountains, southeast Qinghai–Xizang (Tibetan) Plateau, China. Ann. Glaciol. 2006, 43, 187–193. [Google Scholar] [CrossRef]
  31. Zhou, Y.; Li, X.; Zheng, D.; Li, Z. Evolution of geodetic mass balance over the largest lake-terminating glacier in the Tibetan Plateau with a revised radar penetration depth based on multi-source high-resolution satellite data. Remote Sens. Environ. 2022, 275, 113029. [Google Scholar] [CrossRef]
  32. Li, L. Study on variation and mass balance estimations of glacier in Yigong Zangbu basin, Tibet by using multi-source remote sensing data. Ph.D. Thesis, Nanjing University, Nanjing, China, 2017. [Google Scholar]
  33. Zhang, Y.; Yao, X.; Duan, H.; Wang, Q. Simulation of Glacial Lake Outburst Flood in Southeastern Qinghai-Tibet Plateau—A Case Study of JiwenCo Glacial Lake. Front. Earth Sci. 2022, 10, 819526. [Google Scholar] [CrossRef]
  34. Lehner, B.; Grill, G. Global river hydrography and network routing: Baseline data and new approaches to study the world’s large river systems. Hydrol. Process. 2013, 27, 2171–2186. [Google Scholar] [CrossRef]
  35. Wang, Q.; Duan, H.; Liu, N.; Du, Z.; Wang, P.; Yi, B.; Xu, J.; Huang, J.; Zhang, Y.; Yao, X. Change of moraine-dammed glacial lakes and simulation of glacial lake outburst flood in the Yi’ong Zangbo River basin. Front. Earth Sci. 2022, 10, 881285. [Google Scholar] [CrossRef]
  36. Brun, F.; Berthier, E.; Wagnon, P.; Kaab, A.; Treichler, D.A. A spatially resolved estimate of High Mountain Asia glacier mass balances, 2000–2016. Nat. Geosci. 2017, 10, 668–673. [Google Scholar] [CrossRef] [PubMed]
  37. Storey, J.; Choate, M.; Lee, K. Landsat 8 Operational Land Imager On-Orbit Geometric Calibration and Performance. Remote Sens. 2014, 6, 11127–11152. [Google Scholar] [CrossRef]
  38. Paul, F.; Kääb, A.; Maisch, M.; Kellenberger, T.; Haeberli, W. The new remote-sensingderived Swiss glacier inventory: Methods. Ann. Glaciol. 2002, 34, 355–361. [Google Scholar] [CrossRef]
  39. Crippen, R.; Buckley, S.; Agram, P.; Belz, E.; Gurrola, E.; Hensley, S.; Kobrick, M.; Lavalle, M.; Martin, J.; Neumann, M. NASADEM global elevation model: Methods and progress. Int. Arch. Photogramm. Remote Sens. Spat. Inf. Sci. 2016, 41, 125–128. [Google Scholar] [CrossRef]
  40. Takaku, J.; Tadono, T.; Tsutsui, K.; Ichikawa, M. Validation of “AW3D” global DSM generated from Alos Prism. ISPRS Ann. Photogramm. Remote Sens. Spat. Lnf. Sci. 2016, 3, 25–31. [Google Scholar]
  41. Markus, T.; Neumann, T.; Martino, A.; Abdalati, W.; Brunt, K.; Csatho, B.; Farrell, S.; Fricker, H.; Gardner, A.; Harding, D.; et al. The Ice, Cloud, and land Elevation Satellite-2 (ICESat-2): Science requirements, concept, and implementation. Remote Sens. Environ. 2017, 190, 260–273. [Google Scholar] [CrossRef]
  42. Hugonnet, R.; McNabb, R.; Berthier, E.; Menounos, B.; Nuth, C.; Girod, L.; Farinotti, D.; Huss, M.; Dussaillant, I.; Brun, F.; et al. Accelerated global glacier mass loss in the early twenty-first century. Nature 2021, 592, 726–731. [Google Scholar] [CrossRef]
  43. Munoz-Sabater, J.; Dutra, E.; Agusti-Panareda, A.; Albergel, C.; Arduini, G.; Balsamo, G.; Boussetta, S.; Choulga, M.; Harrigan, S.; Hersbach, H.; et al. ERA5-Land: A state-of-the-art global reanalysis dataset for land applications. Earth Syst. Sci. Data 2021, 13, 4349–4383. [Google Scholar] [CrossRef]
  44. Chen, Y.; Ding, M.; Zhang, G.; Wang, Y.; Li, J. Evaluation of ERA5 Reanalysis Precipitation Data in the Yarlung Zangbo River Basin of the Tibetan Plateau. J. Hydrometeorol. 2023, 24, 1491–1507. [Google Scholar] [CrossRef]
  45. Zhao, P.; He, Z.; Ma, D.; Wang, W. Evaluation of ERA5-Land reanalysis datasets for extreme temperatures in the Qilian Mountains of China. Front. Ecol. Evol. 2023, 11, 1135895. [Google Scholar] [CrossRef]
  46. Bolch, T.; Buchroithner, M.F.; Peters, J.; Baessler, M.; Bajracharya, S. Identification of glacier motion and potentially dangerous glacial lakes in the Mt. Everest region/Nepal using spaceborne imagery. Nat. Hazards Earth Syst. Sci. 2008, 8, 1329–1340. [Google Scholar] [CrossRef]
  47. Racoviteanu, A.E.; Williams, M.W.; Barry, R.G. Optical remote sensing of glacier characteristics: A review with focus on the Himalaya. Sensors 2008, 8, 3355–3383. [Google Scholar] [CrossRef] [PubMed]
  48. Zhou, S.; Yao, X.; Zhang, Y.; Zhang, D.; Liu, J.; Duan, H. Glacier changes in the Qaidam Basin from 1977 to 2018. Sci. Cold Arid Reg. 2021, 12, 491–502. [Google Scholar]
  49. Radic, V.; Hock, R. Regional and global volumes of glaciers derived from statistical upscaling of glacier inventory data. J. Geophys. Res. Earth Surf. 2010, 115, 1–10. [Google Scholar] [CrossRef]
  50. Cheng, C.; Du, W.; Li, J.; Bao, A.; Ge, W.; Wang, S.; Ma, D.; Pan, Y. Spatiotemporal Variations of Glacier Mass Balance in the Tomur Peak Region Based on Multi-Source Altimetry Remote Sensing Data. Remote Sens. 2023, 15, 4143. [Google Scholar] [CrossRef]
  51. Wu, S.; Yao, Z.; Jiang, L.; Liu, Z. Method Review of Modern Glacier Volume Change. Adv. Earth Sci. 2015, 30, 237–246. [Google Scholar]
  52. Li, P.; Li, Z.; Shi, C.; Liu, J. Quality evaluation of 1 arc second version SRTM DEM in China. Bull. Surv. Mapp. 2016, 9, 24–28. [Google Scholar]
  53. Huss, M. Density assumptions for converting geodetic glacier volume change to mass change. Cryosphere 2013, 7, 877–887. [Google Scholar] [CrossRef]
  54. Li, Z.; Wang, N.; Chen, A.A.; Liang, Q.; Yang, D. Slight change of glaciers in the Pamir over the period 2000–2017. Arct. Antarct. Alp. Res. 2022, 54, 13–24. [Google Scholar] [CrossRef]
  55. Wang, R.; Ding, Y.; Shangguan, D.; Guo, W.; Zhao, Q.; Li, Y.; Song, M. Influence of Topographic Shading on the Mass Balance of the High Mountain Asia Glaciers. Remote Sens. 2022, 14, 1576. [Google Scholar] [CrossRef]
  56. Rupper, S.; Roe, G. Glacier changes and regional climate: A mass and energy balance approach. J. Clim. 2008, 21, 5384–5401. [Google Scholar] [CrossRef]
  57. Garg, P.K.; Shukla, A.; Jasrotia, A.S. On the strongly imbalanced state of glaciers in the Sikkim, eastern Himalaya, India. Sci. Total Environ. 2019, 691, 16–35. [Google Scholar] [CrossRef] [PubMed]
  58. Zemp, M.; Hoelzle, M.; Haeberli, W. Six decades of glacier mass-balance observations: A review of the worldwide monitoring network. Ann. Glaciol. 2009, 50, 101–111. [Google Scholar] [CrossRef]
  59. Shean, D.E.; Bhushan, S.; Montesano, P.; Rounce, D.R.; Arendt, A.; Osmanoglu, B. A systematic, regional assessment of high mountain Asia glacier mass balance. Front. Earth Sci. 2020, 7, 363. [Google Scholar] [CrossRef]
  60. Zhao, F.; Long, D.; Li, X.; Huang, Q.; Han, P. Rapid glacier mass loss in the Southeastern Tibetan Plateau since the year 2000 from satellite observations. Remote Sens. Environ. 2022, 270, 112853. [Google Scholar] [CrossRef]
  61. Hock, R.; Huss, M. Glaciers and climate change. In Climate Change; Elsevier: Amsterdam, The Netherlands, 2021; pp. 157–176. [Google Scholar]
  62. He, Z.; Zhou, T.; Chen, J.; Fu, Y.; Peng, Y.; Zhang, L.; Yao, T.; Farooq, T.H.; Wu, X.; Yan, W.; et al. Impacts of Climate Warming and Humidification on Vegetation Activity over the Tibetan Plateau. Forests 2023, 14, 2055. [Google Scholar] [CrossRef]
  63. Bohner, J. General climatic controls and topoclimatic variations in Central and High Asia. Boreas 2006, 35, 279–295. [Google Scholar] [CrossRef]
  64. Yang, W.; Guo, X.; Yao, T.; Zhu, M.; Wang, Y. Recent accelerating mass loss of southeast Tibetan glaciers and the relationship with changes in macroscale atmospheric circulations. Clim. Dyn. 2016, 47, 805–815. [Google Scholar] [CrossRef]
  65. Jouberton, A.; Shaw, T.E.; Miles, E.; McCarthy, M.; Fugger, S.; Ren, S.; Dehecq, A.; Yang, W.; Pellicciotti, F. Warming-induced monsoon precipitation phase change intensifies glacier mass loss in the southeastern Tibetan Plateau. Proc. Natl. Acad. Sci. USA 2022, 119, e2109796119. [Google Scholar] [CrossRef] [PubMed]
  66. Zhao, X.; Wang, X.; Wei, J.; Jiang, Z.; Zhang, Y.; Liu, S. Spatiotemporal variability of glacier changes and their controlling factors in the Kanchenjunga region, Himalaya based on multi-source remote sensing data from 1975 to 2015. Sci. Total Environ. 2020, 745, 140995. [Google Scholar] [CrossRef] [PubMed]
  67. Zhang, Y.; Qin, X.; Li, X.; Zhao, J.; Liu, Y. Estimation of Shortwave Solar Radiation on Clear-Sky Days for a Valley Glacier with Sentinel-2 Time Series. Remote Sens. 2020, 12, 927. [Google Scholar] [CrossRef]
  68. Hu, M.; Zhou, G.; Lv, X.; Zhou, L.; Wang, X.; He, X.; Tian, Z. Warming Has Accelerated the Melting of Glaciers on the Tibetan Plateau, but the Debris-Covered Glaciers Are Rapidly Expanding. Remote Sens. 2022, 15, 132. [Google Scholar] [CrossRef]
  69. Li, Y.; Li, Y. Topographic and geometric controls on glacier changes in the central Tien Shan, China, since the Little Ice Age. Ann. Glaciol. 2014, 55, 177–186. [Google Scholar] [CrossRef]
  70. Sam, L.; Bhardwaj, A.; Kumar, R.; Buchroithner, M.F.; Martín-Torres, F.J. Heterogeneity in topographic control on velocities of Western Himalayan glaciers. Sci. Rep. 2018, 8, 12843. [Google Scholar] [CrossRef]
  71. Aubry-Wake, C.; Zephir, D.; Baraer, M.; McKenzie, J.M.; Mark, B.G. Importance of longwave emissions from adjacent terrain on patterns of tropical glacier melt and recession. J. Glaciol. 2018, 64, 49–60. [Google Scholar] [CrossRef]
  72. DeBEER, C.M.; Sharp, M.J. Topographic influences on recent changes of very small glaciers in the Monashee Mountains, British Columbia, Canada. J. Glaciol. 2009, 55, 691–700. [Google Scholar] [CrossRef]
  73. Su, D.; Wen, L.; Huang, A.; Wu, Y.; Gao, X.; Wang, M.; Zhao, Y.; Kirillin, G. Simulation of the potential impacts of lakes on glacier behavior over the Tibetan Plateau in summer. Clim. Dyn. 2023, 60, 3435–3454. [Google Scholar] [CrossRef]
  74. King, O.; Bhattacharya, A.; Bhambri, R.; Bolch, T. Glacial lakes exacerbate Himalayan glacier mass loss. Sci. Rep. 2019, 9, 18145. [Google Scholar] [CrossRef]
  75. Banerjee, A. Brief communication: Thinning of debris-covered and debris-free glaciers in a warming climate. Cryosphere 2017, 11, 133–138. [Google Scholar] [CrossRef]
  76. Wei, Y.; Tandong, Y.; Baiqing, X.; Hang, Z. Influence of supraglacial debris on summer ablation and mass balance in the 24K Glacier, southeast Tibetan Plateau. Geogr. Ann. Ser. A Phys. Geogr. 2010, 92, 353–360. [Google Scholar] [CrossRef]
  77. Reznichenko, N.; Davies, T.; Shulmeister, J.; McSaveney, M. Effects of debris on ice-surface melting rates: An experimental study. J. Glaciol. 2010, 56, 384–394. [Google Scholar] [CrossRef]
  78. Duan, H.; Yao, X.; Zhang, D.; Qi, M.; Liu, J. Glacial Lake changes and identification of potentially dangerous glacial lakes in the Yi’ong Zangbo River Basin. Water 2020, 12, 538. [Google Scholar] [CrossRef]
  79. Cheng, Z.; Liu, J.; Liu, J. Debris flow induced by glacial lake break in southeast Tibet. WIT Trans. Eng. Sci. 2010, 67, 101–111. [Google Scholar]
  80. Cheng, Z.-l.; Zhu, P.; Dang, C.; Liu, J. Hazards of debris flow due to glacier-lake outburst in southeastern Tibet. J. Glaciol. Geocryol 2008, 30, 954–959. [Google Scholar]
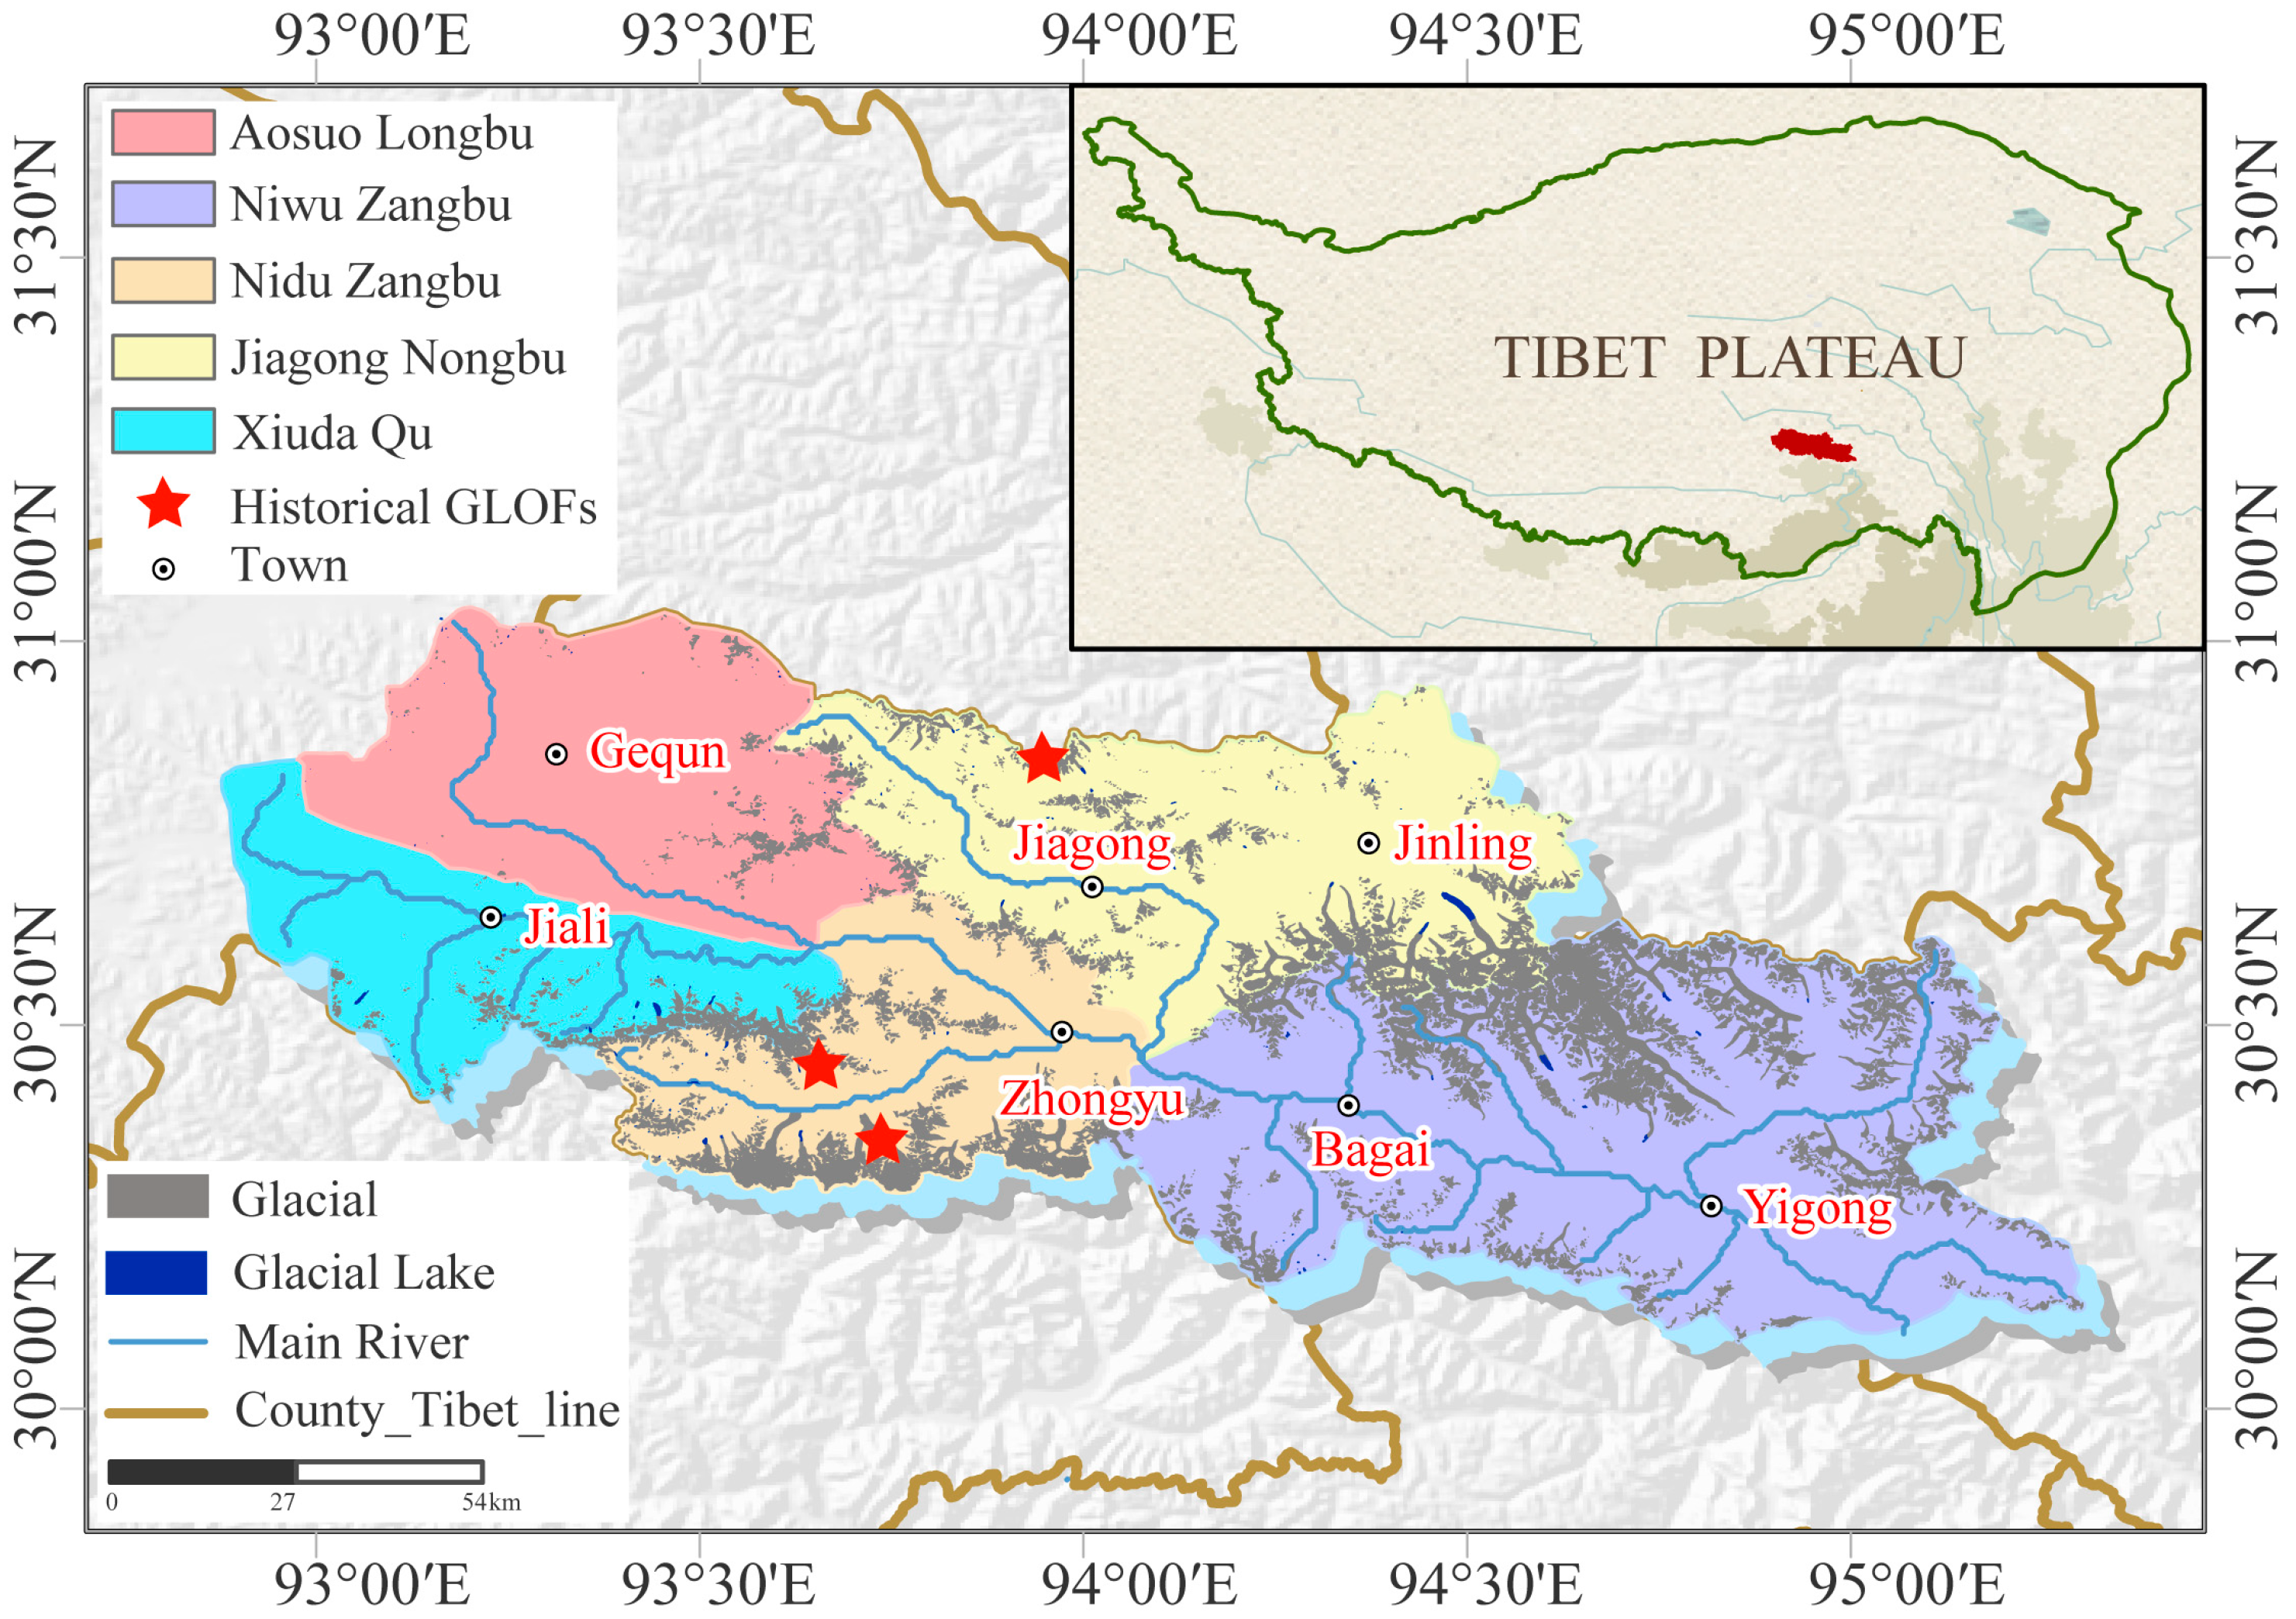
Figure 1. Distribution of Yigong Zangbo River Basin and glaciers. The YZRB is sustained by the Yigong Zangbo River, a tributary of the Yarlung Tsangpo. The combination of topographic features and meteorological conditions promotes the development of unique temperate valley glaciers, as indicated by the gray region. The basin is undergoing intense glacial recession and recurrent Glacial Lake Outburst Floods (GLOFS), which are significantly affecting the downstream infrastructure and ecological systems.
Remotesensing 16 03272 g001
Figure 2. Comparative analysis of ICESat-2/ATL06 data alignment with NASA DEM pre- and post-denoising procedures. Panel (a) is the fitting images prior to denoising, whereas panel (b) depicts the post-denoising results. The ordinate represents the ICESat-2/ATL06 data measurements, and the abscissa corresponds to the NASA Digital Elevation Model (DEM) data values.
Remotesensing 16 03272 g002
Figure 3. Validation images of datasets, comprised by two color-coded point sets: the target dataset in green and the validation dataset in yellow. Each point corresponds to elevations in 2000 (X axes) and 2019 (Y axes). The uniformity observed in two points sets validates the suitability of target dataset.
Remotesensing 16 03272 g003
Figure 4. Bivariate distribution of glacial areas by size classes and elevation. The graph depicts a bivariate analysis of glacier areas, juxtaposing size classes (ranging from ≤0.1 to ≥50 km2) with elevation bands (≤0.40 to ≥6.2 km). Two distinct trajectories, delineated in black and red, illustrate the variance in glacier areas relative to these parameters. The dual Y-axes quantify the area, delineating the variability observed across the spectrum of glacier size classes and elevation ranges.
Remotesensing 16 03272 g004
Figure 5. Spatial distribution of glacial areas by orientation. This figure employs a logarithmic scale on the Y-axis to represent glacial areas (km2) and a categorical X-axis indicating cardinal and intercardinal directions (N, NE, E, SE, S, SW, W, and NW). Each direction features a box plot coupled with superimposed scatter points, delineating the range of data distribution. The upper edge, median, and lower edge of the box plot respectively correspond to the third quartile, median, and first quartile of the glacier area. Whiskers extending from the box plot to the extremities of the dataset indicate the maximum and minimum glacier area values per direction. The arithmetic mean is visually encoded as a distinct transparent square overlaying the box plot.
Remotesensing 16 03272 g005
Figure 6. Temporal variation in glacial area and number by sizes. The graph sequentially presents from left to right the proportional representation of glacier areas (in km2) and numbers (N) across various size classes for the years 1988, 2015, and 2023. Y-axis delineates the glacier area (left) and number (right). Dual columns of stacked bar facilitate the comparative analysis in the proportional distribution of glacier areas (left) and number (right) within specific area classes (“≤0.1 km2”, “0.1–0.5 km2”, “0.5–1 km2”, “1–2 km2”, “2–5 km2”, “5–10 km2”, “10–20 km2”, “20–50 km2”, and “≥50 km2”) over the selected time frame.
Remotesensing 16 03272 g006
Figure 7. Multidirectional analysis of glacial retreat. The chart is partitioned into eight directional sectors (N, NE, E, SE, S, SW, W, and NW) to exhibit the data. The Y-axis corresponds to the relative reduction in glacial area, depicted by green shades with light green representing the period from 1988 to 2015, and dark green for 2015 to 2023.
Remotesensing 16 03272 g007
Figure 8. Glacier area and volume variations with error vars across different basins over time. This integrated diagram delineates the temporal changes in glacier area and volume across several basins. The X-axis categorizes the basins as Aso Longbu, Xiuda Qu, Jiagong Nongbu, Nidu Zangbu and Niwu Zangbu. The left Y-axis corresponds to glacier area (in km2) aligning with the bar chart, while the right Y-axis corresponds to the scatter plot indicating the ice volume (in km3).
Remotesensing 16 03272 g008
Figure 9. Basinal glacial area classes and mass balance visualization (2000–2019). The primary map employs a chromatic scale to demarcate the average area (km2) of each catchment basin. Interspersed throughout are multicolored dots of varying dimensions, symbolizing glaciers across different size classes and their respective mass balances. The accompanying legend the codes for the area range in each sub-basins (km2), as well as the area range (km2) and mass balances (m w.e. a−1) for each glacier. Adjacent histograms stratified by glacier size classes exhibit the diversity in mass balances and the corresponding total numbers. The abscissa signifies the glacier mass balance, while the ordinate enumerates the total number of glaciers associated with each mass balance. The black dashed line indicates the rate of average mass loss. The figures represent, in sequential order, the total count of individual glaciers (first), the aggregate area covered by these glaciers (in km2, second), the mean mass change (in m w.e. a−1, third), and the elevation change (in m, fourth).
Remotesensing 16 03272 g009
Figure 10. Climatic variable temporal trends (1960–2023). The first two figure encapsulates the temporal variations and overarching tendencies of mean temperatures during the ablation season and the annual aggregate precipitation from 1960 to 2023. Trends are discerned via linear regression analyses and moving average computations. The solid lines depict the inter-annual fluctuations in mean temperatures and annual precipitation, while the dashed lines represent the linear regression trends, indicating a consistent uptrend in both temperature and precipitation over the observed period. The last two figures represent the trends in precipitation and snowfall in the same time period, where (a) denotes the spring season (March to May) and (b) corresponds to the ablation season (June to September).
Remotesensing 16 03272 g010
Figure 11. Climatic variable spatial trends (1960–2023) and statistical significance test levels. The upper panel delineates the spatial variation in average melting period temperatures with a color gradient from yellow to red, signifying a pronounced warming trend, with significance levels marked as p < 0.05. The lower panel depicts the interannual variability in precipitation over the same period, using a red to blue gradient to represent a change spectrum, illustrating the heterogeneous precipitation dynamics across the region, with significance levels indicated by dotted grading symbols.
Remotesensing 16 03272 g011
Table 1. List of Landsat images used for glacier boundary interpretation.
Landsat Scene IdentifierDate AcquiredLand Cloud Cover (%)
LT51350391988212BKT0030 July 198835.00
LT51350391988228BJC0115 August 198848.00
LT51350391989198BJC0017 July198978.00
LT51360391989173BKT0022 June 198931.00
LT51360391988283BJC009 October 19881.00
LT51360391989173BKT0022 June 198931.00
LE71350392016265EDC0021 September 201654.00
LE71350392016233EDC0020 August 201635.00
LE71350392016217EDC004 August 201647.00
LE71350392015294EDC0021 October 201520.00
LE71350392015214EDC002 August 201525.00
LC81350392016209LGN0127 July 201627.13
LC81350392015206LGN0125 July 20155.59
LC81360392016232LGN0119 August 201611.94
LC81360392015293LGN0120 October 20153.16
LC81360392014290LGN0117 October 201426.79
LE71360392016240EDC0027 August 201639.00
LE71360392015205EDC0024 July 201528.00
LE71360392015221EDC009 August 20158.00
LE71360392014298EDC0025 October 20145.00
LE71350392022197NPA0016 July 202213.00
LC91350392022201LGN0120 July 202234.02
LC91350392022185LGN014 July 202229.23
LC81350392022209LGN0028 July 202230.39
LC81350392023244LGN001 September 202349.10
LE71360392023244NPA001 September 202322.00
LC91360392023259LGN0016 September 202339.83
LC91360392022224LGN0112 August 202218.04
LC81360392023203LGN0022 July 202338.98
LC81360392022200LGN0019 July 202235.08
LC81360392023235LGN0023 August 202372.80
LC91360392023211LGN0030 July 202360.74
Table 2. Variations in glacier area by size class from 1988 to 2023, detailing both absolute changes and relative changes in glacier area for the intervals 1988–2015 and 2015–2023.
1988–20231988–20152015–2023
Area Shrinkage (km2)Area Shrinkage Rate (%·a−1)Area Shrinkage (km2)Area Shrinkage Rate (%·a−1)Area Shrinkage (km2)Area Shrinkage Rate (%·a−1)
SUM588.35 ± 83.920.76 ± 0.11468.35 ± 74.840.78 ± 0.12120.00 ± 46.190.85 ± 0.33
≤0.5159.64 ± 26.691.53 ± 0.26123.34 ± 11.461.53 ± 0.1436.30 ± 18.232.60 ± 0.87
0.5–176.15 ± 15.360.98 ± 0.2057.29 ± 12.740.96 ± 0.2118.86 ± 9.471.43 ± 0.72
1–265.35 ± 13.060.76 ± 0.1549.69 ± 10.590.75 ± 0.1615.66 ± 7.271.00 ± 0.47
2–562.08 ± 9.700.60 ± 0.0947.54 ± 7.680.60 ± 0.1014.54 ± 5.730.74 ± 0.29
5–1042.04 ± 5.550.47 ± 0.0629.65 ± 4.130.43 ± 0.0612.39 ± 2.910.69 ± 0.16
10–2029.19 ± 1.770.57 ± 0.0323.70 ± 1.660.60 ± 0.045.49 ± 1.030.56 ± 0.11
20–5024.75 ± 1.540.27 ± 0.0218.15 ± 2.900.25 ± 0.046.60 ± 0.640.33 ± 0.03
≥50129.15 ± 1.710.74 ± 0.01118.99 ± 23.680.88 ± 0.1810.16 ± 0.910.35 ± 0.04
Table 3. Variations in glacier area by sub-basins from 1970s to 2023, detailing both the absolute and relative changes in glaciers area for the intervals 1970s–1988, 1988–2015, and 2015–2023.
1970s–20231970s–19881988–20152015–2023
Area Shrinkage
(km2)
Shrinkage
Rate (%·a−1)
Area Shrinkage
(km2)
Shrinkage
Rate (%·a−1)
Area Shrinkage
(km2)
Shrinkage
Rate (%·a−1)
Area Shrinkage
(km2)
Shrinkage
Rate (%·a−1)
SUM947.20 ± 136.360.76 ± 0.11358.85 ± 78.961.07 ± 0.24468.35 ± 74.840.78 ± 0.12120 ± 46.190.85 ± 0.33
Aso Longbu50.90 ± 7.110.82 ± 0.0917.04 ± 4.091.43 ± 0.3427.30 ± 5.451.36 ± 0.276.56 ± 3.561.74 ± 0.95
Xiuda Qu39.01 ± 8.120.56 ± 0.125.06 ± 3.440.37 ± 0.2526.96 ± 5.751.00 ± 0.216.95 ± 2.931.19 ± 0.50
Jiagong Nongbu170.49 ± 31.380.74 ± 0.1458.91 ± 18.480.95 ± 0.3085.00 ± 18.890.75 ± 0.1726.58 ± 11.380.99 ± 0.42
Nidu Zangbu130.50 ± 28.390.77 ± 0.1637.35 ± 15.300.59 ± 0.2466.24 ± 15.950.55 ± 0.1326.95 ± 11.440.88 ± 0.37
Niwu Zangbu556.30 ± 61.361.16 ± 0.16240.49 ± 37.651.30 ± 0.20262.85 ± 28.800.82 ± 0.0952.96 ± 16.880.72 ± 0.23
Disclaimer/Publisher’s Note: The statements, opinions and data contained in all publications are solely those of the individual author(s) and contributor(s) and not of MDPI and/or the editor(s). MDPI and/or the editor(s) disclaim responsibility for any injury to people or property resulting from any ideas, methods, instructions or products referred to in the content.