Article

An Algorithm to Retrieve Range Ocean Current Speed under Tropical Cyclone Conditions from Sentinel-1 Synthetic Aperture Radar Measurements Based on XGBoost

1
College of Oceanography and Ecological Science, Shanghai Ocean University, Shanghai 201308, China
2
Dipartimento di Ingegneria, Università degli Studi di Napoli Parthenope, 80133 Napoli, Italy
3
Hainan Observation and Research Station of Ecological Environment and Fishery Resource in Yazhou Bay, Hainan Institute of Zhejiang University, Sanya 572025, China
4
National Marine Data and Information Service, Tianjin 300171, China
*
Author to whom correspondence should be addressed.
Remote Sens. 2024, 16(17), 3271; https://doi.org/10.3390/rs16173271
Submission received: 18 July 2024 / Revised: 1 September 2024 / Accepted: 2 September 2024 / Published: 3 September 2024
(This article belongs to the Special Issue SAR Monitoring of Marine and Coastal Environments)

Abstract

:
In this study, a novel algorithm to retrieve the current speed along the range direction under extreme sea states is developed from C-band synthetic aperture radar imagery. To this aim, a Sentinel-1 (S-1) dual-polarized synthetic aperture radar (SAR) dataset consisting of 2300 images is collected during 200 tropical cyclones (TCs). The dataset is complemented with collocated wave simulations from the Wavewatch-III (WW3) model and reanalysis currents from the HYbrid Coordinate Ocean Model (HYCOM). The corresponding TC winds are officially released by IFRMER, while the Stokes drift following the wave propagation direction is estimated from the waves simulated by WW3. In this study, first the dependence of wind, Stokes drift, and range current on the Doppler centroid anomaly is investigated, and then the extreme gradient boosting (XGBoost) machine learning model is trained on 87% of the S-1 dataset for range current retrieval purposes. The rest of the dataset is used for testing the retrieval algorithm, showing a root mean square error (RMSE) and a correlation coefficient (r) of 0.11 m/s and 0.97, respectively, with the HYCOM outputs. A validation against measurements collected from two high-frequency (HF) phased-array radars is also performed, resulting in an RMSE and r of 0.12 m/s and 0.75, respectively. Those validation results are better than the 0.22 m/s RMSE and 0.28 r achieved by the empirical CDOP model. Hence, the experimental results confirm the soundness of the XGBoost, exhibiting a certain improvement over the empirical model.

1. Introduction

Tropical cyclones (TCs) are a serious threat to coastal areas. In recent decades, satellite microwave tools as scatterometers and altimeters have been shown to provide reliable global wind maps daily, thus significantly improving the accuracy of meteorological and oceanic forecasting [1,2]. However, there are differences in wind speed between different wind sources [3]. When small-scale observations are needed, synthetic aperture radar (SAR), calling for a fine spatial resolution down to 1 m and a wide swath width approaching 500 km, has been shown to be a key instrument. Hence, it is commonly used in the field of TC-relevant research [4,5,6].
In the last two decades, co-polarized SAR wind retrieval algorithms based on geophysical model functions (GMFs) have been proposed to deal with low-to-moderate sea state, i.e., CMOD family for Rardarsat-2, Sentinel-1 (S-1) and Gaofen-3 SAR imagery, and XMOD2 for TerraSAR-X/TanDEM-X and Cosmo-Skymed SAR data [7,8,9,10,11,12]. Nevertheless, it has been demonstrated that the performance of co-polarized GMF-based wind retrieval algorithms is limited by the saturation issues that affect the co-polarized backscatter signals under strong wind conditions (i.e., >30 m/s) [5,13]. This is no longer the case of the cross-polarized normalized radar cross section (NRCS), which, therefore, is typically considered to estimate TC winds [4,14,15]. However, the cross-polarized GMF approaches are likely to be affected by low signal-to-noise ratios, resulting in discontinuity of the TC winds using even though ad hoc preprocessing such as thermal noise removal and speckle filtering is undertaken. Hence, to improve the accuracy of GMF-based SAR wind retrieval algorithms during TCs, a combination of both co- and cross-polarized backscattering channels is proposed that provides satisfactory results [16,17,18]. It is also worth mentioning that non-GMF-based approaches to TC wind estimation from co-polarized SAR imagery have been proposed, i.e., the ones based on the inversion of the polarization-independent azimuthal cutoff wavelength [19].
When dealing with wave retrieval algorithms from SAR measurements, two main categories can be identified: transfer functions that aim at mapping the co-polarized SAR intensity spectrum into a wave spectrum according to the wave mapping mechanism [20,21,22] and empirical models [23,24], and deep learning-based methods which aim to estimate the integral wave parameters directly from SAR features [25,26]. Nonetheless, even though theoretical algorithms have been implemented for SAR-based wave retrieval under TC conditions [27], their accuracy is not satisfactory due to inaccurate modulation transfer functions and distortion induced by rain cells [28,29].
In the literature, it is shown that the Doppler centroid anomaly (DCA), i.e., the difference in Doppler frequency between SAR measurements and predictions associated with the satellite flight, inherently relates the backscattering roughness pattern with the upper ocean dynamics [30,31,32,33]. Moreover, the measured velocity of the Doppler Centroid Technique (DCT) is exactly the magnitude of the sea surface current vector, and it was used to invert the real sea surface vector field’s weak background current at about 24°N during Hurricane Sam [34]. In previous studies [35,36], it was demonstrated that wind and current in range/look direction, respectively, can be retrieved from DCA by an empirical model, denoted as CDOP. It has also been shown that radial current velocity can be retrieved from SAR Doppler shift during typhoons, and the results show that the contribution of non-geophysical conditions and sea state to Doppler shift can be accurately estimated and eliminated, so that reliable radial current velocity can be obtained under strong wind conditions [37]. In fact, the Stokes drift induced by huge waves during a TC is supposed to be higher than that during a low-to-moderate sea state. In particular, the empirical model has not been tested during TCs considering the strong wind-induced current and Stokes drift caused by huge waves. Except in the case of typhoons, the studies on the inversion of ocean surface currents are mainly concentrated in coastal areas with land cover. In the vicinity of Kuroshio, a non-geophysical Doppler shift correction algorithm for Kuroshio observation has been proposed [38]. In addition, a direct comparison of the surface radial velocity (RVL) of Sentinel-1 and TanDEM-X satellite SAR systems at different frequencies and imaging modes has been made [39].
In this study, 2300 S-1 SAR images collected during TCs are used to study the dependence of upper ocean dynamics, including wind, Stokes drift, and range current, on DCA. Accordingly, an empirical model based on a machine learning method is developed for range current retrieval purposes from SAR imagery. Furthermore, the extreme gradient boosting (XGBoost) machine learning model trained on such datasets is tested on independent 300 S-1 SAR images. The corresponding results are then contrasted with the ones obtained from actual measurements collected by two high-frequency (HF) phased-array radars [40] under two showcased TCs. Meanwhile, the traditional empirical algorithm is also used to compare with HYCOM and two high-frequency phased-array radars. The contribution of this study is to propose a new algorithm to extract the current speed along the range direction in extreme sea conditions from C-band SAR images, which has certain application value for the study of ocean dynamics and related applications. The rest of this paper is organized as follows: Section 2 describes the datasets including SAR images, hindcasting fields, and HF measurements; the methodology, i.e., the machine learning method and empirical model, is briefly introduced in Section 3; the validation of SAR retrieval by two approaches is discussed in Section 4; and the conclusion is summarized in Section 5.

2. Datasets

The dataset used in this study is grouped into three categories: S-1 level-1 and level-2 SAR products and CyclObs wind provided by the French Research Institute for Exploitation of the Oceans (IFREMER); sea surface waves simulated by the Wavewatch-III (WW3) model; and sea surface currents simulated by the HYbrid Coordinate Ocean Model (HYCOM) and measured by two HF phased-array radars.

2.1. S-1 SAR Data and CyclObs Wind

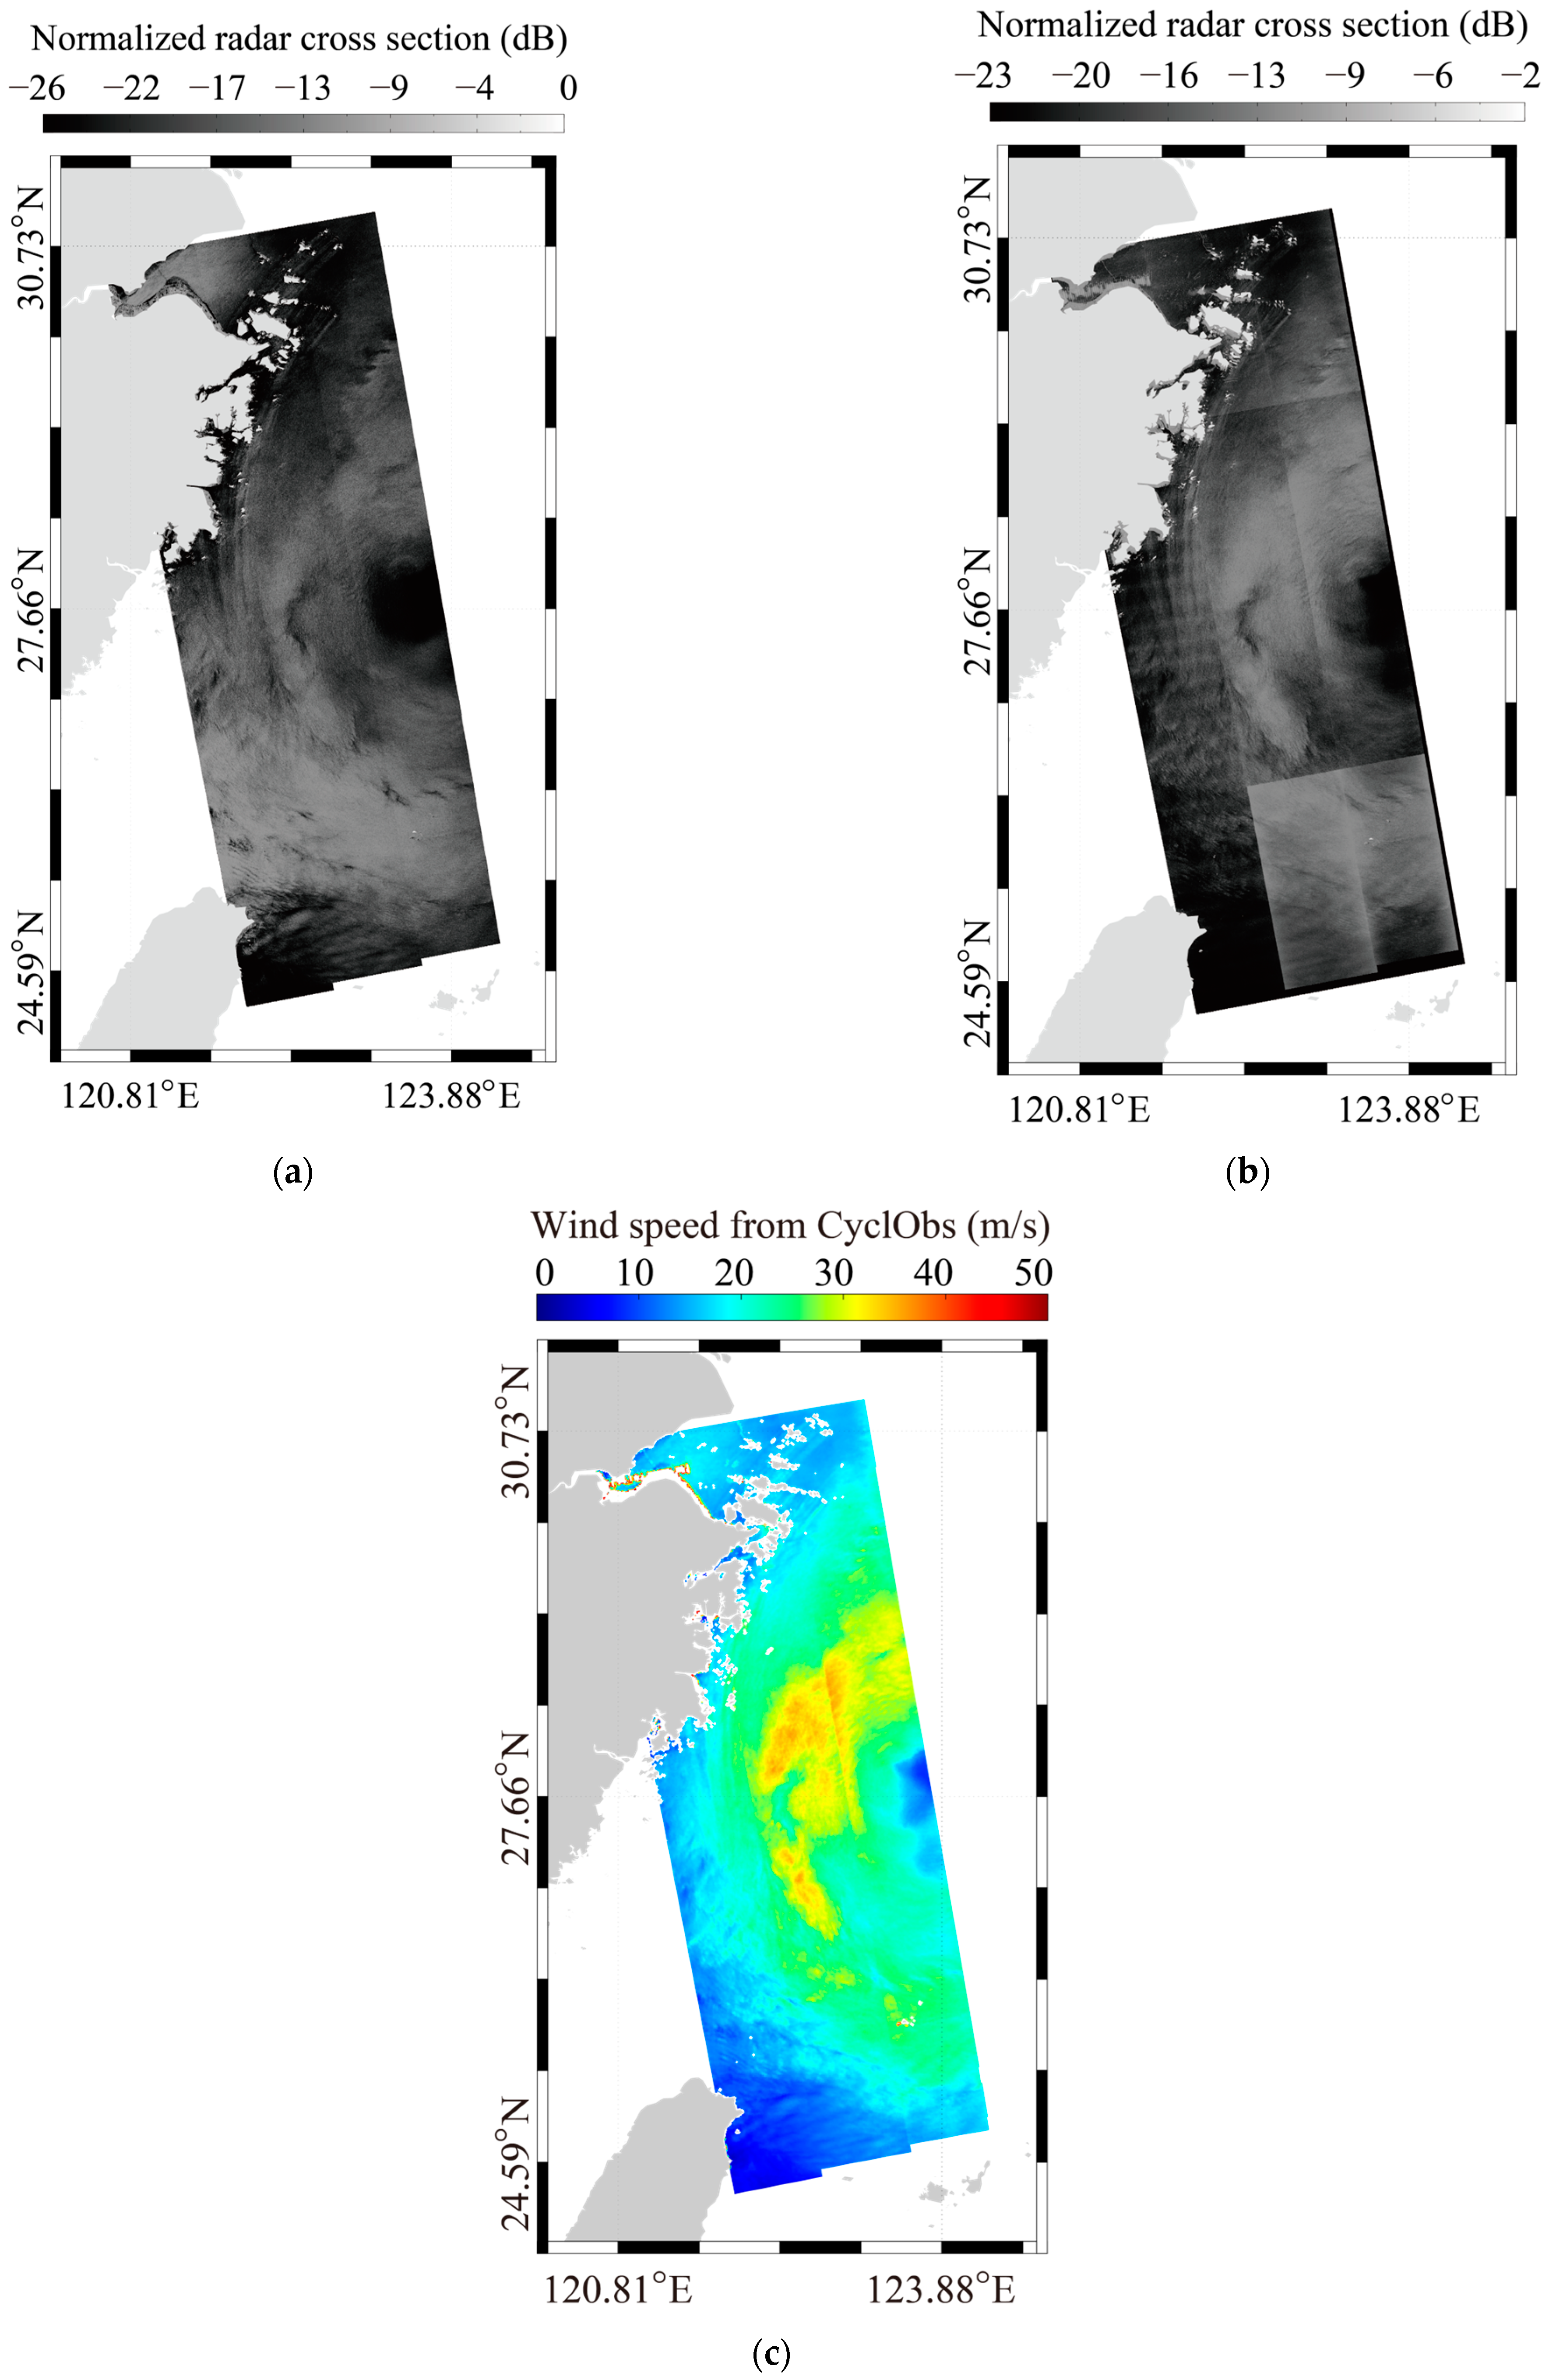
As the TC data after 2016 are relatively complete, we chose to collect SAR images within 500 km of the central eye of the TC at the same TC time from 2016 to build our dataset. Thus, the SAR dataset consists of 2300 dual-polarized (VV and VH) S-1 images collected during 200 different TCs from 2016 to 2023. They are acquired in interferometric and extra-wide swath modes with a pixel size of 10 m and 40 m, respectively. The corresponding S-1 level-2 products (OCN) are also considered, which provide the information on DCA. The frames of the S-1 SAR images overlaid on the TC track and maximum wind speeds are shown as boxes in Figure 1, in which the red boxes indicate the training set and the black boxes indicate the test set. The wind information is obtained from the IFREMER CyclObs winds generated according to [17]. The aim was to develop a unique database of satellite and field data related to TC, estimating new sea surface wind speeds using L-band radiometer and C-band SAR (i.e., S-1A/B and RADARSAT-2). We match the wind field information with other parameter information to form the training dataset used in this paper. As a showcase, the VV- and VH-polarized NRCS graytone image relevant to the S-1 SAR acquisition, collected during the TC Infa on 24 July 2021 at 09:55 UTC, is shown, in decibel scale, in Figure 2a,b, while the corresponding CyclObs wind map is depicted in Figure 2c.

2.2. WW3-Simulated Wave

WW3 is a mature numeric wave model commonly used for hindcasting waves [41,42]. It was already successfully adopted to deal with wave analysis during TCs [43,44]. Nowadays, the wave parameters from the altimeter and Surface Wave Investigation and Monitoring (SWIM) instruments onboard the Chinese-French Oceanography Satellite was used to validate the accuracy of the WW3-simulated result [45,46]. As a showcase, the significant wave height (SWH) map relevant to the TC Infa (24 July 2021, 10:00 UTC) overlaid on the Haiyang-2B (HY-2B) altimeter footprint is shown in Figure 3a, with a time difference of one hour. The reliability of WW3-simulated SWHs is confirmed by the results depicted in Figure 3b, where they are compared with HY-2B SWHs. These results refer to the 15°N–45°N and 110°E–135°E observed in the China seas between June and August 2022, showing a root mean squared error (RMSE) of 0.41 m and a correlation coefficient (r) of 0.88. Substantially, the WW3-simulated wave result is suitable for this study. Considering the varying influences of sea conditions, during the data matching process, the range of significant wave heights in the effective dataset exceeds 100,000 entries, with the significant wave height ranging from 0 to 8 m. As the SWHs are below 2.5 m, they can be classified as normal sea conditions; when the SWHs exceed 2.5 m, they can be considered as extreme sea conditions. As depicted in Figure 3b, there is a high degree of conformity when the SWHs are less than 6 m.

2.3. Ocean Current Data

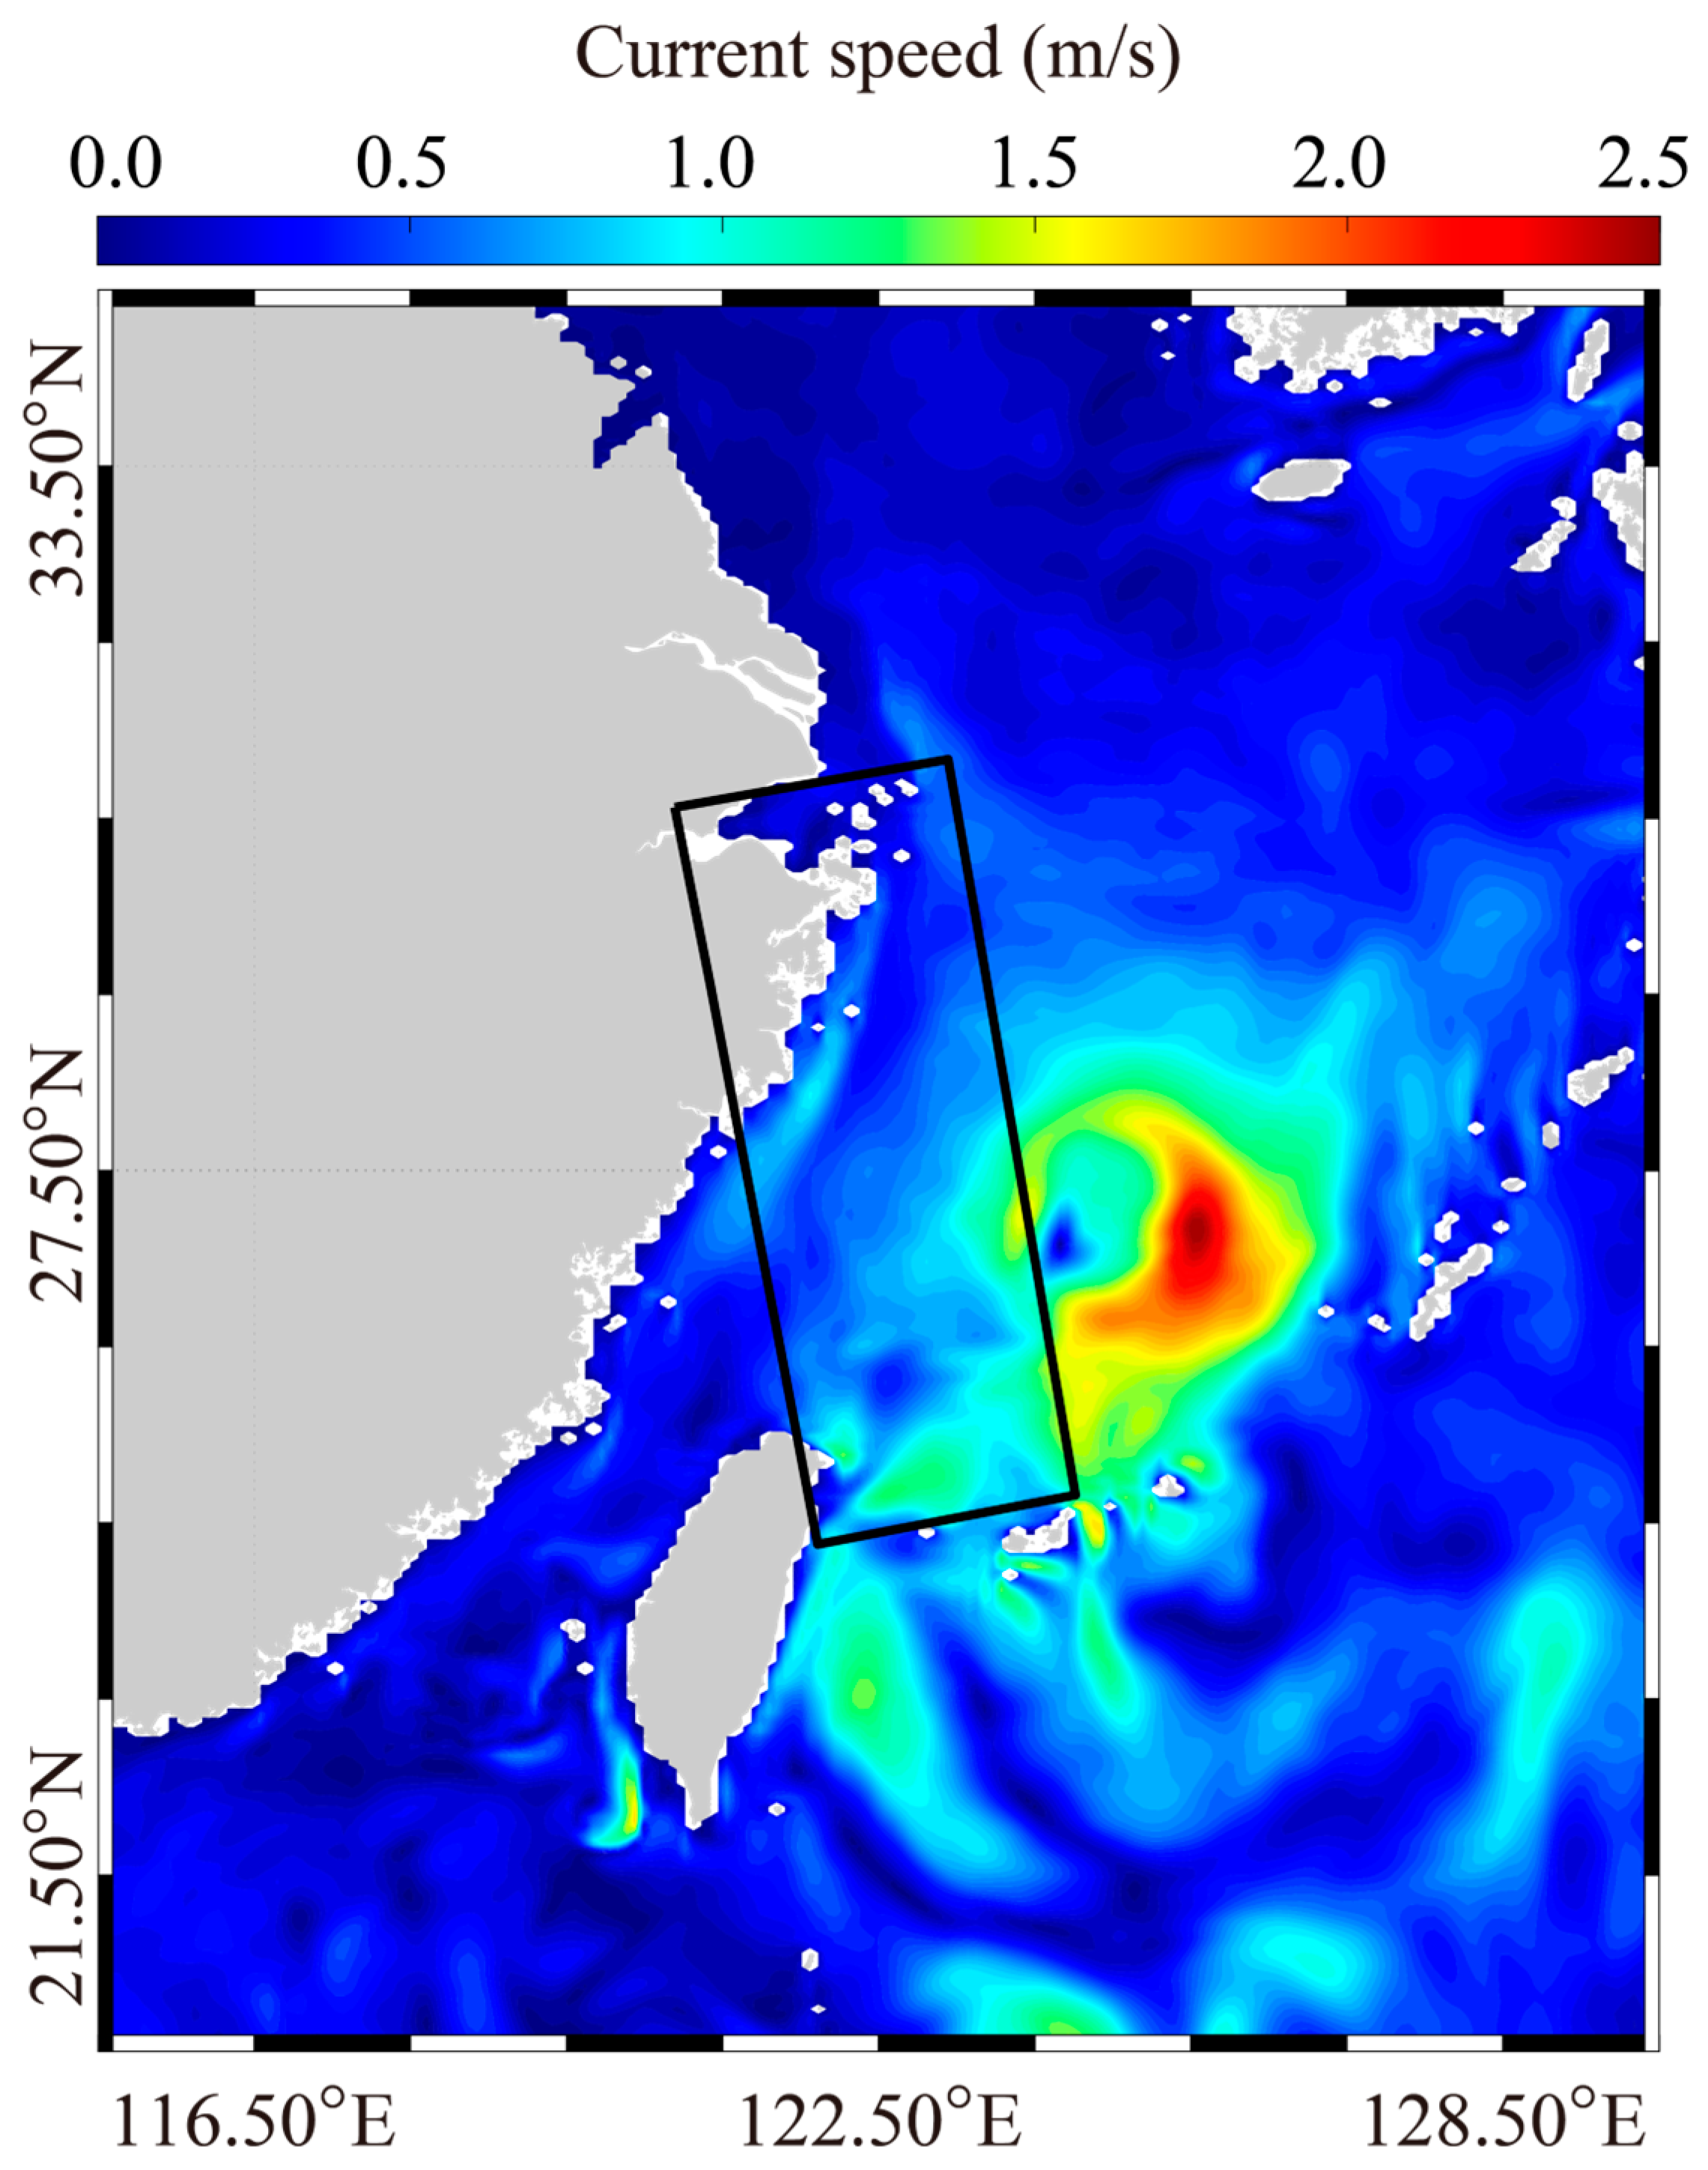
The current dataset in this study consists of HYCOM reanalysis currents and HF radar measurements. The spatial resolution of HYCOM data is a ~0.08° grid at 3 h intervals [47]. An example of the reanalysis current map (24 July 2021, 09:00 UTC) produced using HYCOM is shown in Figure 4, where the S-1 SAR image footprint of Figure 2a is annotated as a black box. The resolution of the HF phased-array ground radar measurements data is 0.03°. A showcase of the HF phased-array ground radar measurements that refer to the TC Infa is shown in Figure 5, where the current maps measured on 24 July 2021 at 09:55 UTC and on 25 July 2021 at 21:51 UTC are displayed in panels (a) and (b), respectively. In Figure 5, the red circle is the typhoon eye position at different times, while the red triangle corresponds to the typhoon eye position at the corresponding time of the HF phased-array ground radar, and the black line is the typhoon track. HYCOM data are used as the real values of the training dataset, and they are matched with other parameter data in time and space to build the training set, while HF data are matched with a single TC in time and space to build the dataset, so that it can be used for the prediction and result verification of the proposed model.

3. Methodology

In this section, an analysis of the relationship between upper oceanic dynamics and DCA is undertaken, and then, the machine learning-based XGBoost model and empirical algorithm of range current retrieval, denoted as the CDOP model, are briefly presented.

3.1. Relationship between Upper Oceanic Dynamics and DCA

According to the microwave scattering theory, the DCA in the range direction is given by
f DC = f DR f DP + Δ
where fDC is the DCA, fDR and fDP are the SAR and predicted Doppler shift, and Δ is the error in the estimation process of fDR and fDP. All those parameters are provided by the S-1 level-2 (OCN) product. The Stokes drift in the range direction can be estimated as a function of SWH and mean wave period as follows:
u 0 = 2 π 3 H s 2 g T 3
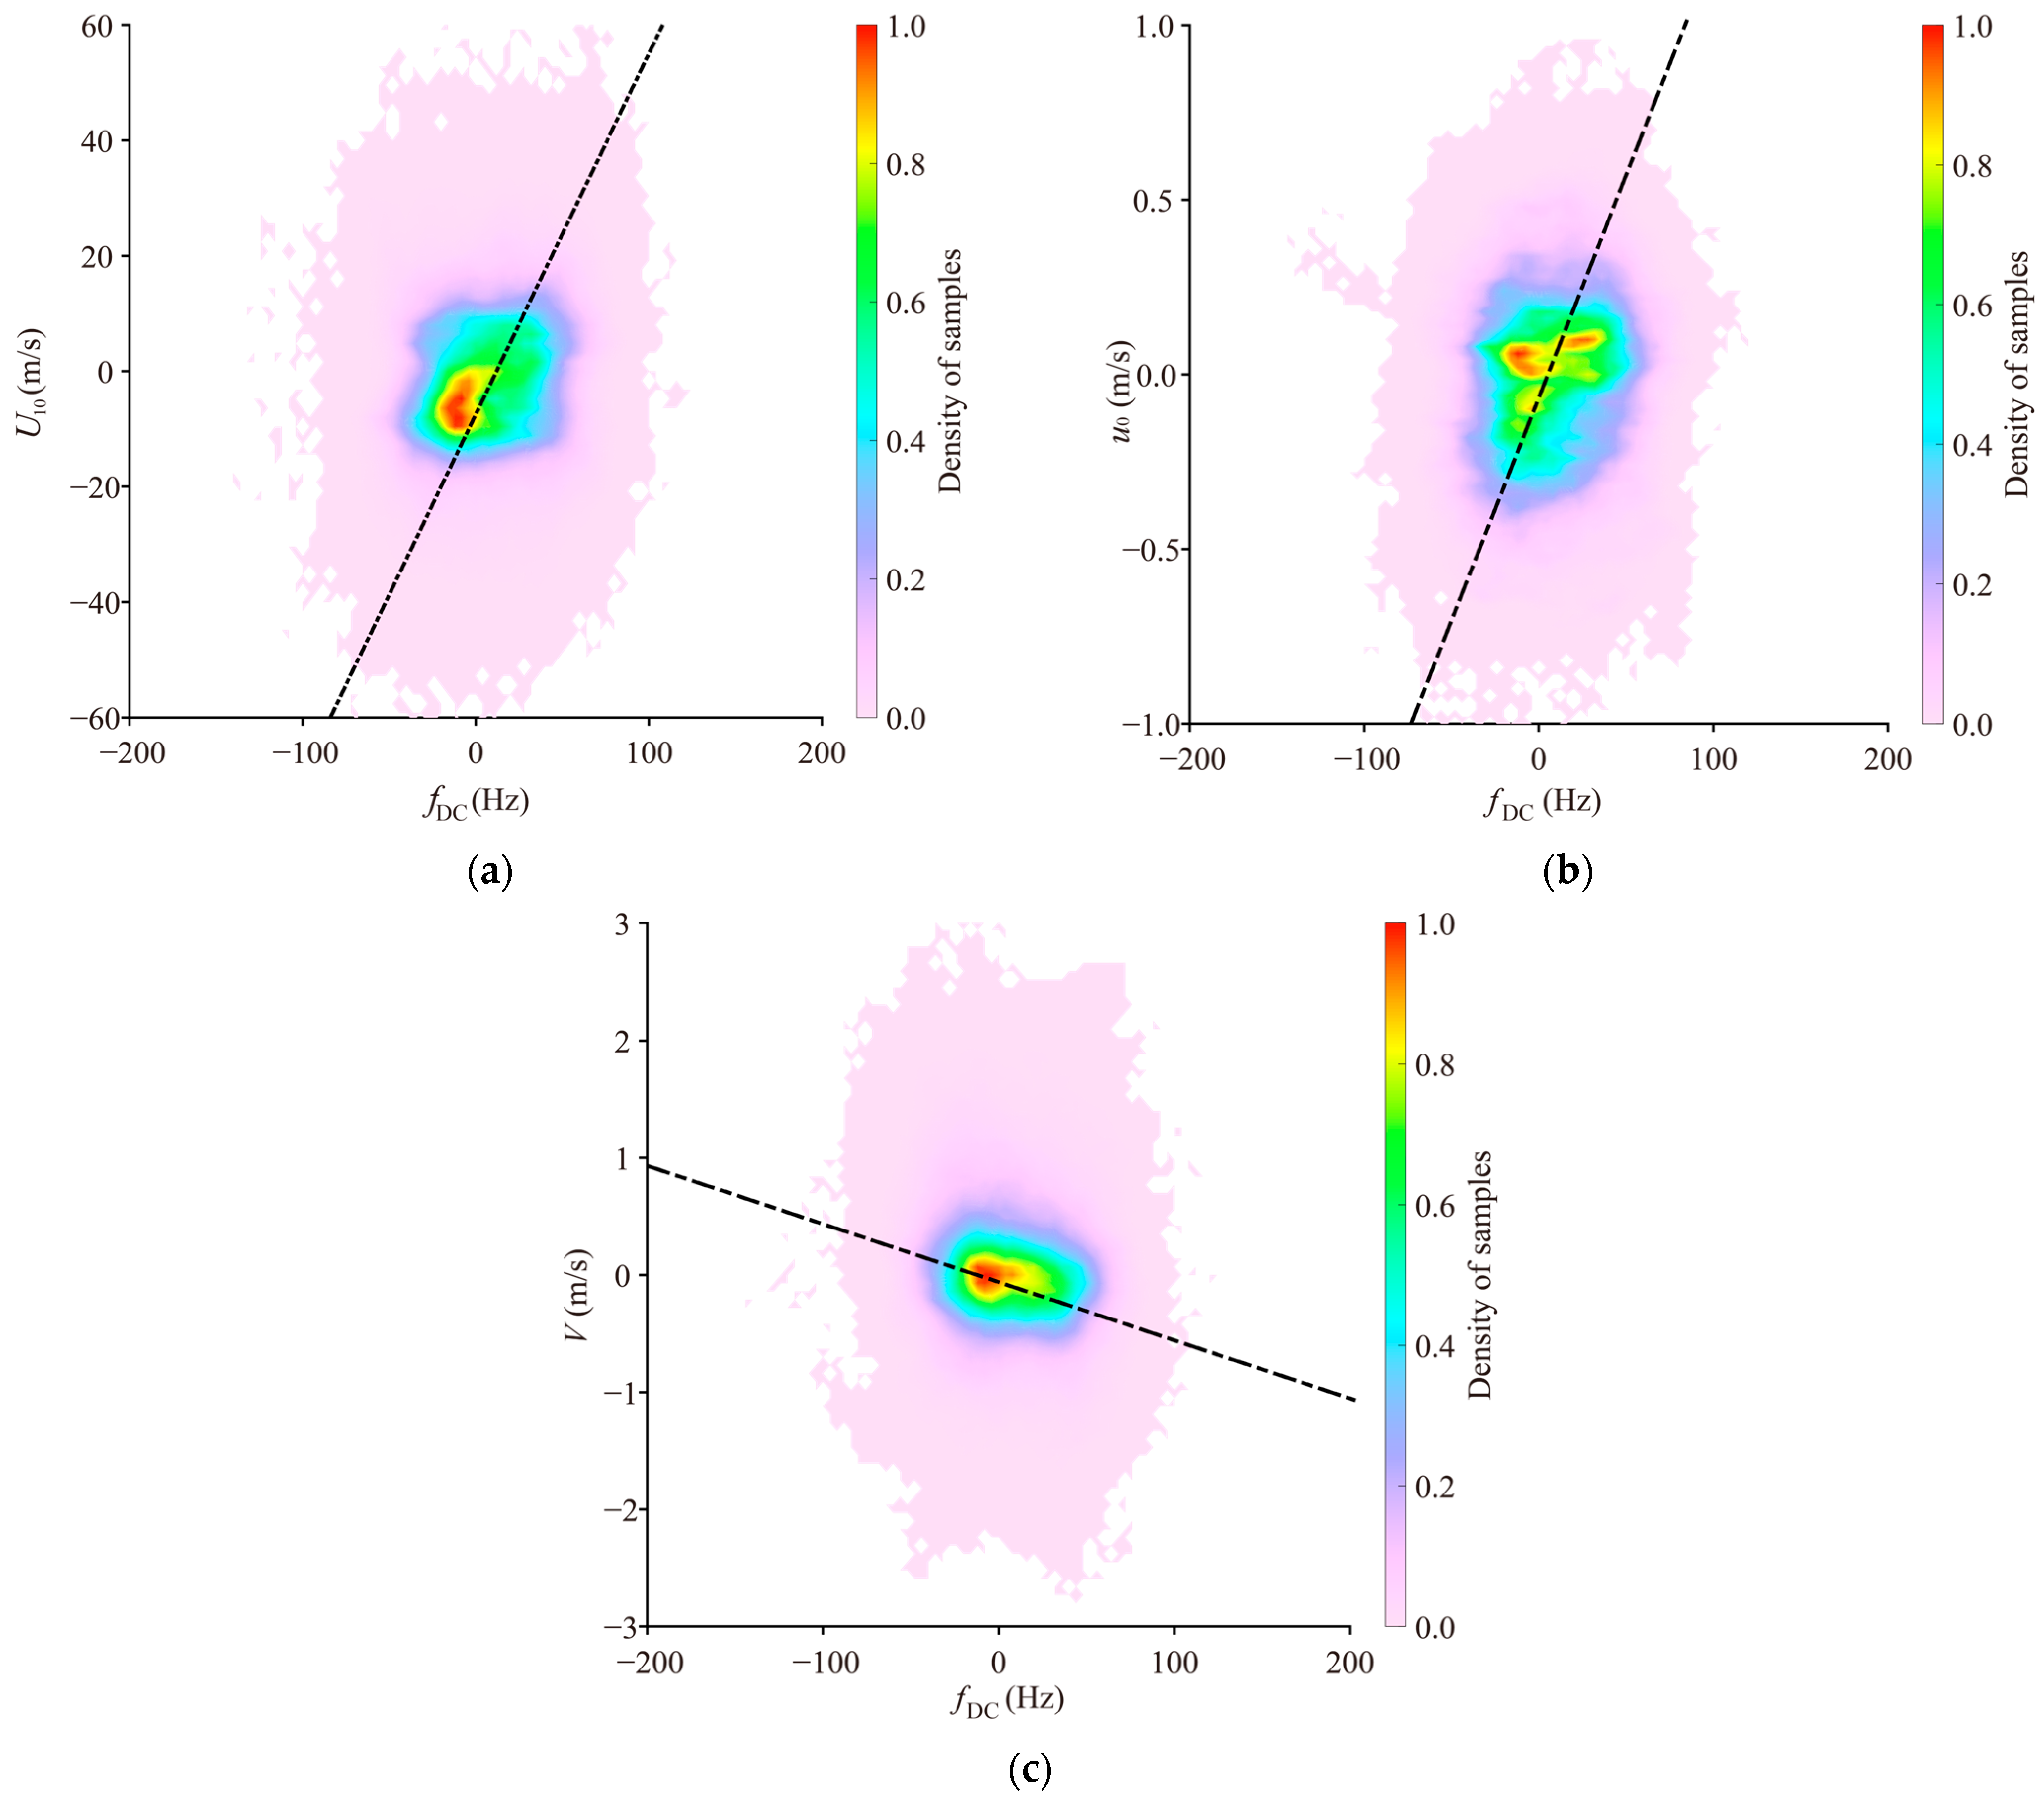
where u0 is the Stokes drift, Hs is the SWH, T is the mean wave period, and g is the gravitational acceleration. Those parameters can be obtained from WW3 model simulations. The behavior of the DCA with respect to the range wind vector component (U10), the Stokes drift, and the current speed (V), projected onto the range direction, is depicted in Figure 6a–c, respectively, where black lines represent the linear regression results. It can be observed that fDC calls for a linear trend with the range-oriented components of U10, u0 and V. This matter lies at the basis of the proposed approach for the range component of ocean current retrieval during TC conditions.

3.2. XGBoost

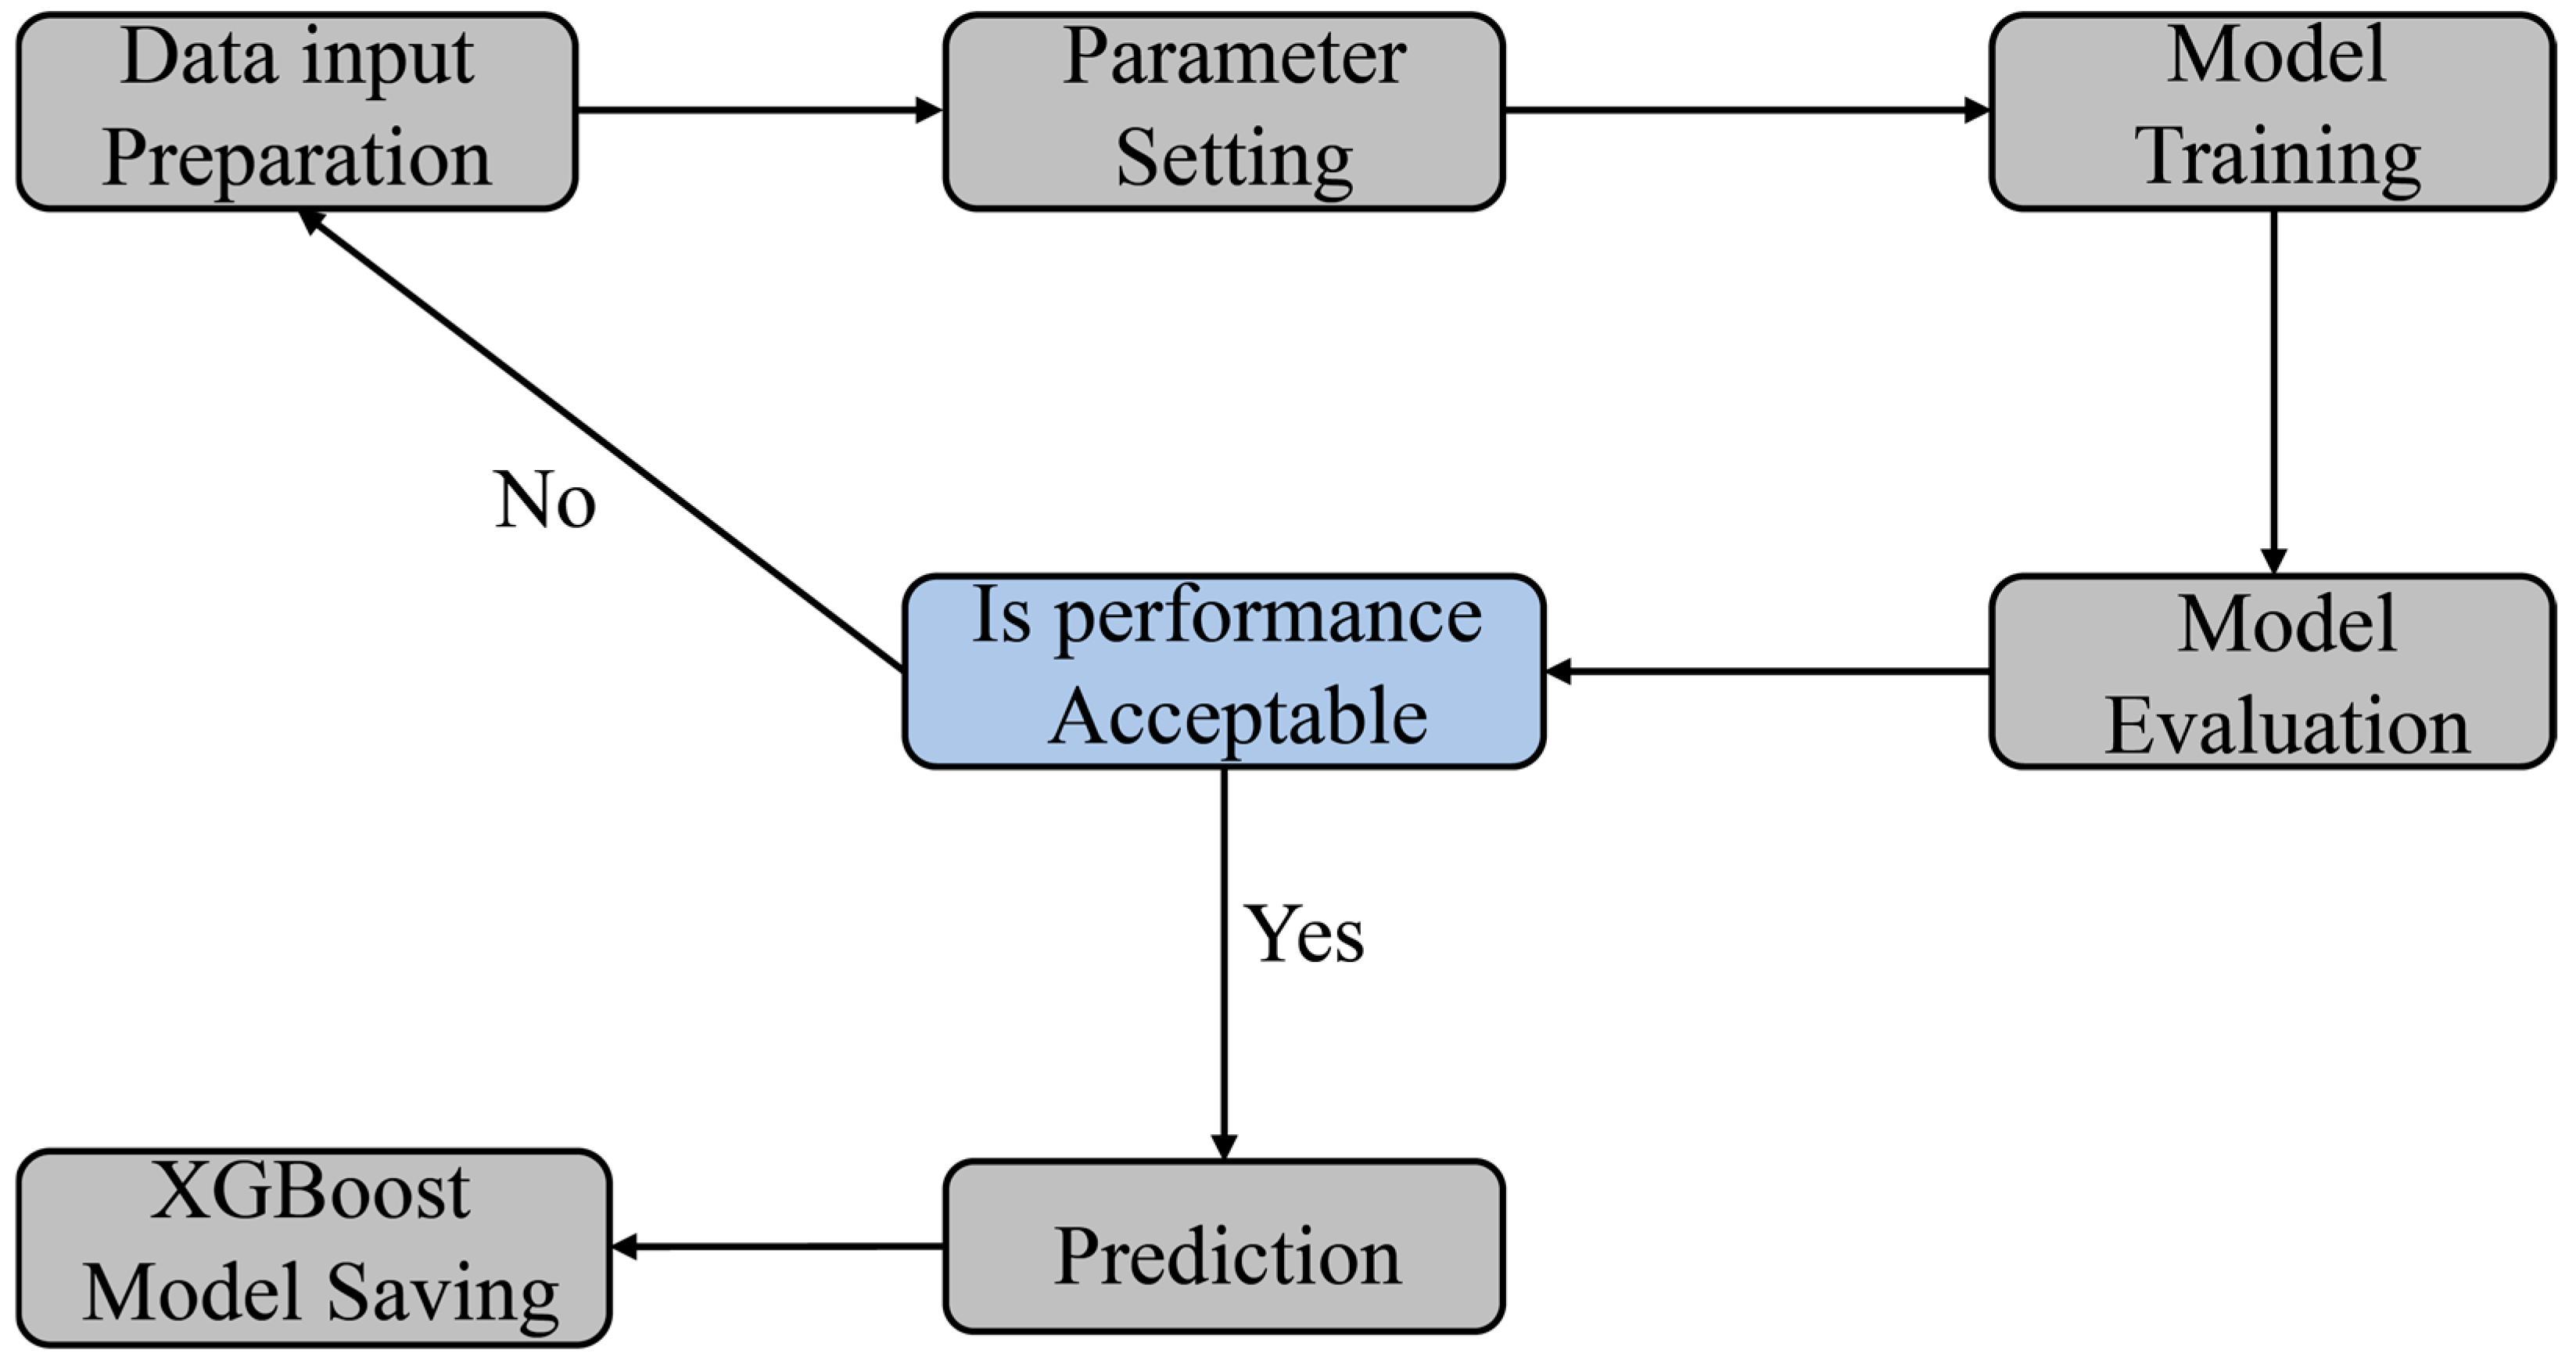
The XGBoost machine learning model is an ensemble learning algorithm with high computational efficiency and precision. It is an iterative algorithm based on Gradient Boosted Decision Trees (GBDTs) that minimizes the loss function by gradually adding new weak prediction models (usually decision trees). However, it also requires careful hyperparameter tuning and feature engineering to achieve optimal performance [18]. Through continuous adjustment and optimization of hyperparameters, the specific parameters of the XGBoost model used in this study are shown in Table 1. The 2300 S-1 SAR imagery used in this study is divided into 2000 images (>200 million samples) for training and 300 images for testing. The XGBoost algorithm flow chart is presented in Figure 7. In the training process, the XGBoost model is fed with the DCA fDC, the range wind vector component U10, the range component of the Stokes drift u0, the radar incidence angle θ, and the azimuth direction from SAR ϕ to obtain the range component of the ocean current V as output. The behavior of the XGBoost training process with three wave parameters is illustrated in Figure 8a. As the model training process iterates, the XGBoost training processes converge eventually, and the RMSE between the achieved predicted value and the true value is less than 0.1 m/s of range current speed. SHAP (Shapley Additive exPlanations) is a method of explaining machine learning model predictions, and the SHAP value is used to measure the importance of each feature to the model. Details can be found in the relevant literature, as described in [48]. Figure 8b shows the SHAP values highlighted by the feature value relative to the characteristic of the input parameter (fDC, U10, ϕ, u0, θ). Each row in Figure 8b represents a feature, and the horizontal coordinate is the SHAP value. The features are ranked according to the average absolute value of the SHAP, which is the most important feature to the model. Wide areas indicate a large number of sample clusters. A dot represents a sample; the redder the color, the larger the value of the feature itself, and the bluer the color, the smaller the value of the feature itself. It is found that U10 and ϕ have the greatest impact on the XGBoost model, while θ is the least important factor. It can be seen from the results of the SHAP values in this paper that the relationship between wind speed and azimuth direction angle is obvious, which can indirectly prove that these two parameters have a strong correlation with the velocity, and it can also be understood that these two parameters have a high contribution to the final results in model training and prediction.

3.3. Empirical Algorithm

The principle of the estimation of sea surface current speed based on SAR Doppler centroid frequency was first proposed by Advanced Synthetic Aperture Radar (ASAR) wave mode images [31]. Utilizing data from the Envisat ASAR images, the measured velocity by Doppler centroid frequency encompassed the combined effects of sea surface wind, waves, and ocean currents [31]. In this study, the fDC mentioned in Section 3.1 is obtained after effective correction of the SAR Doppler shift. And the fDC here can be considered as a combination of sea state and current, and the influence of the sea state needs to be further removed to obtain more accurate sea surface current. In the previous study, the existing CDOP model was used to obtain the Doppler shift caused by sea surface wind [35], and the specific formula is as follows:
f w = CDOP ( U 10 , θ ,   φ ω ,   p o l )
in which U 10 and φ ω are the wind speed and direction relative to the radar look direction at a height of 10 m; θ is the incidence angle and pol is the polarization mode of radar.
In addition, the remaining Doppler anomalies expected to be associated with sea surface currents are obtained by subtraction [49]:
f c u r = f D C f w
in which f c u r represents the residual Doppler shift associated with the surface radial current velocity and f w contributes to the sea state that needs to be removed from the corrected geophysical Doppler.
Surface current velocity is related to the residual Doppler shift following the equation below [33,50]:
V D = π f c u r k e sin   θ
where k e is the incident radar wavenumber and V D is assumed to be the line-of-sight velocity of the ocean surface current. In this study, the CyclObs wind provided by the IFREMER was used in the CDOP model to remove the wind-induced Doppler shift.
In this study, two methods were used to derive the current speed from SAR images in TCs. The major difference is the parameters, and the parameter pairs of XGBoost and empirical algorithms are shown in Table 1.

4. Results and Discussion

In this section, the comparisons of the range current speeds between SAR retrievals by XGBoost and the CDOP model against the HF measurement are presented. Moreover, the error of SAR retrievals is measured.

4.1. Validation

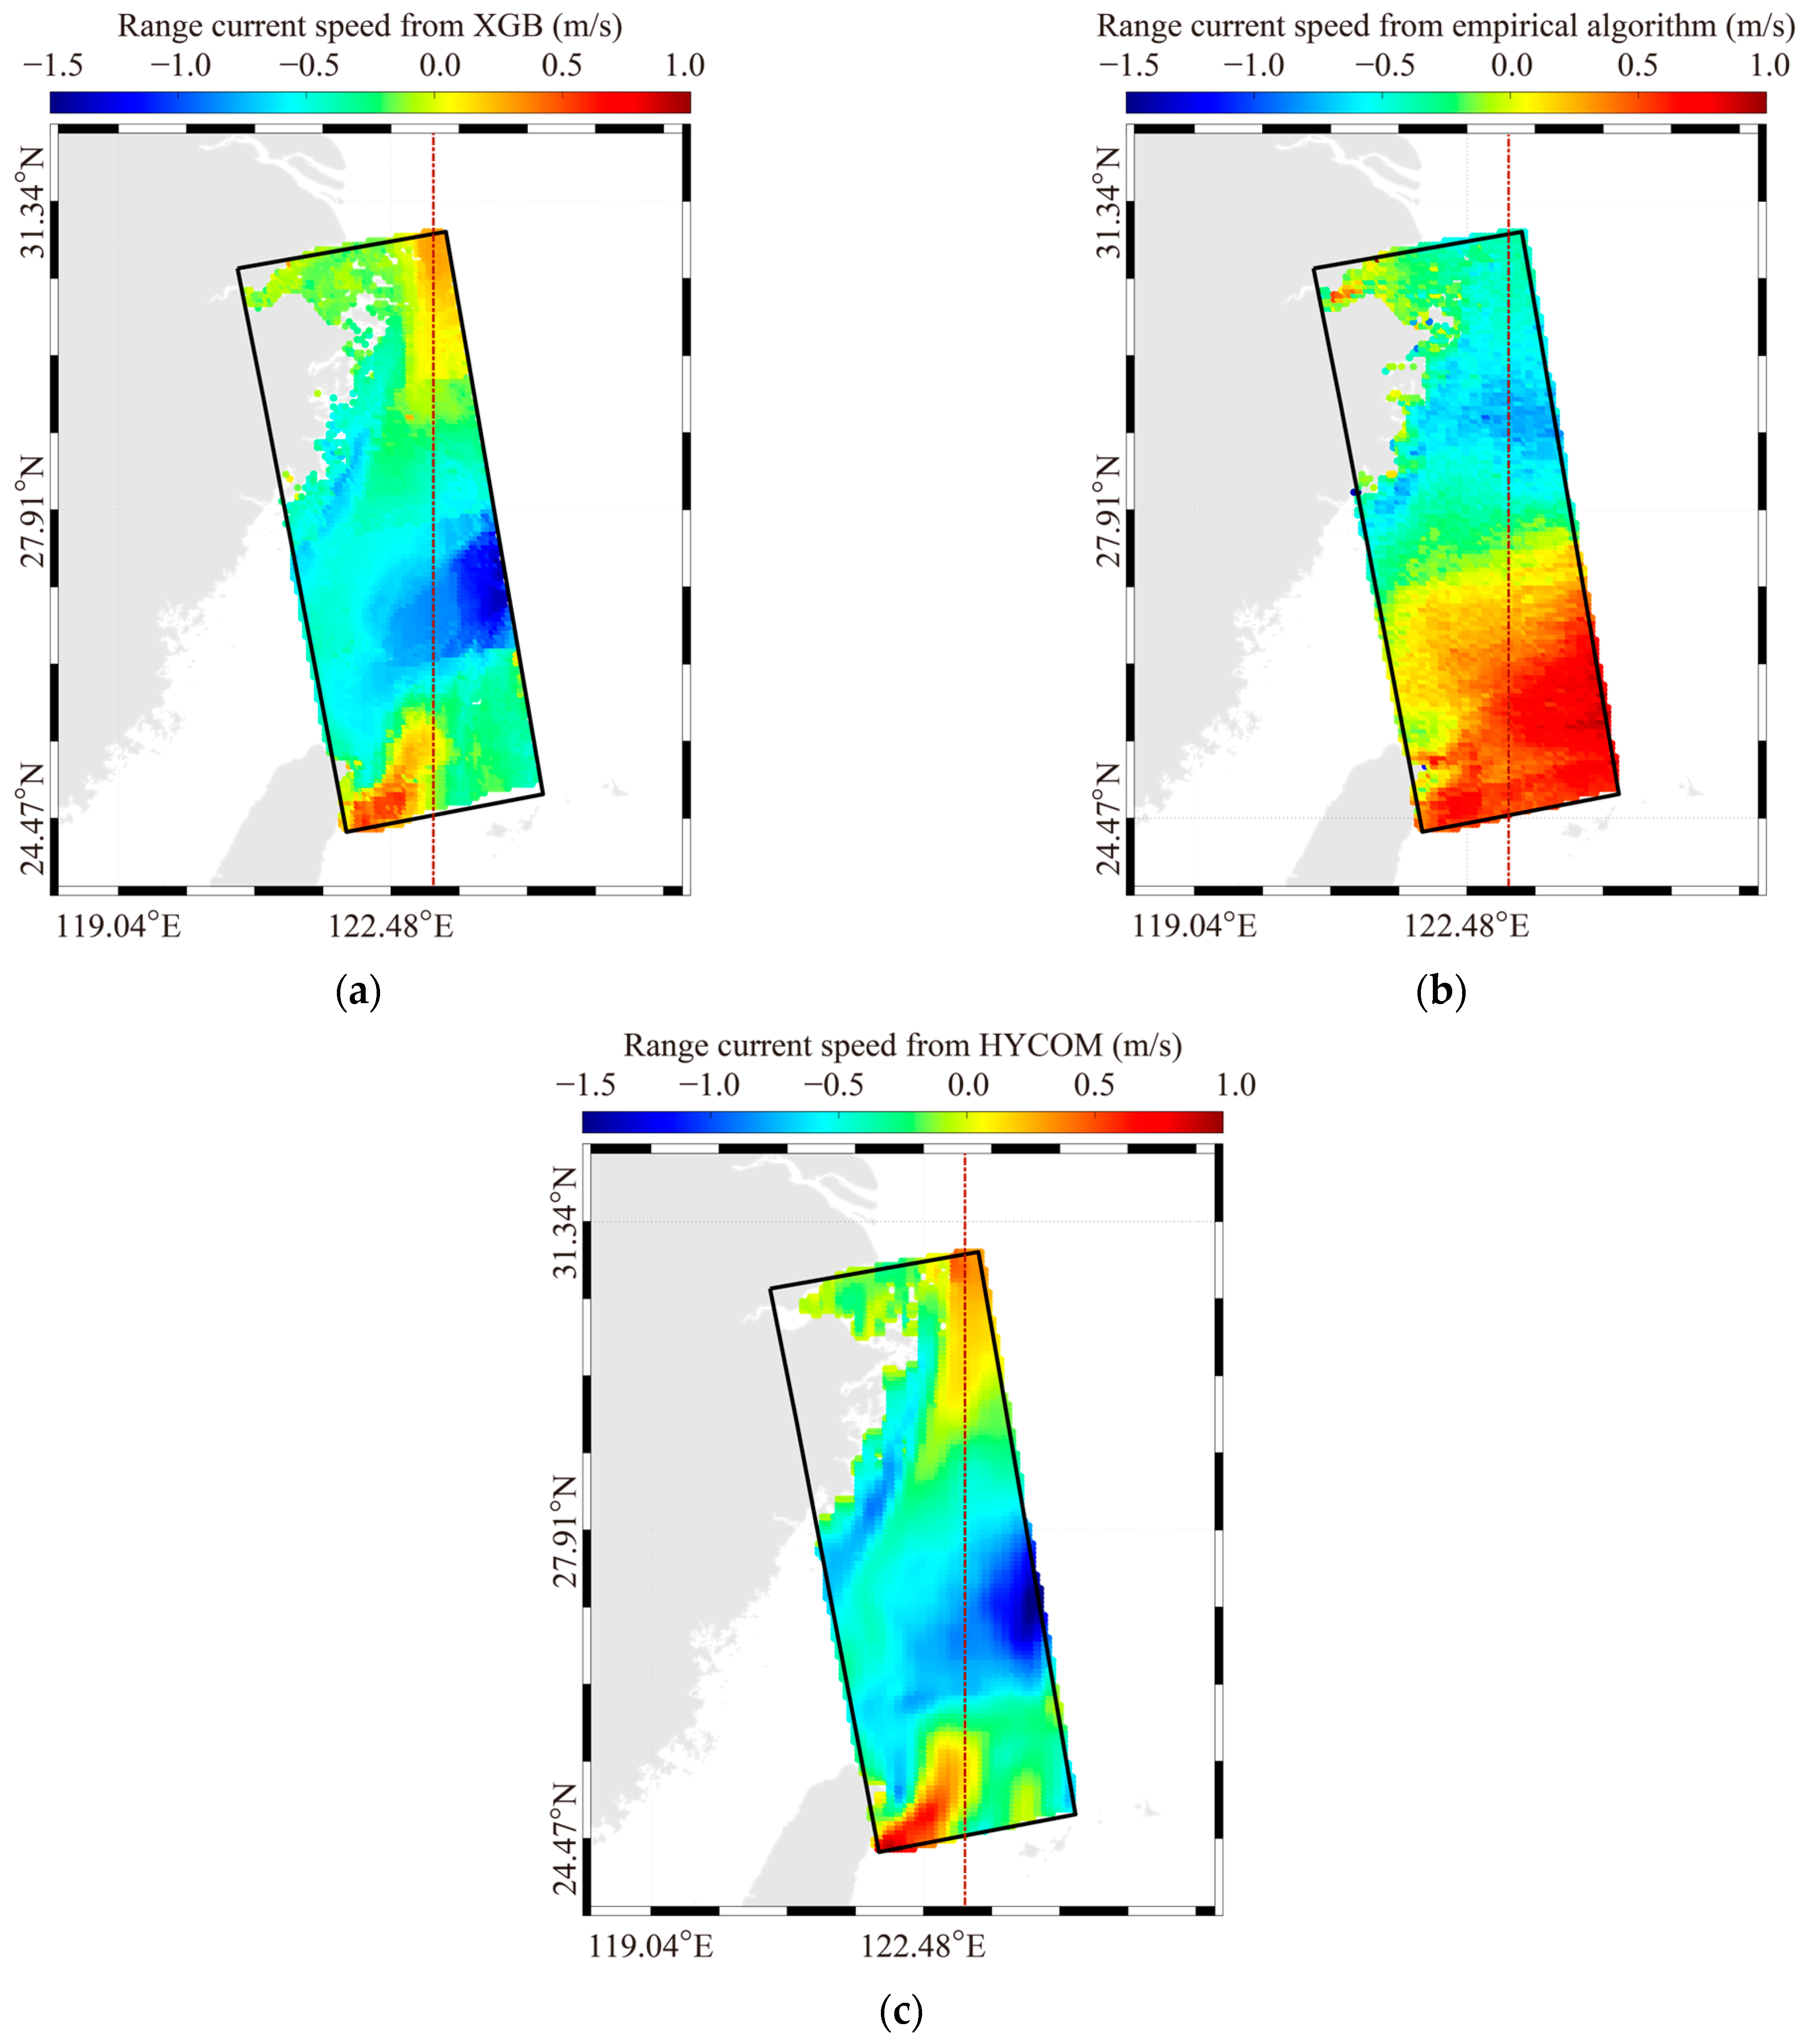
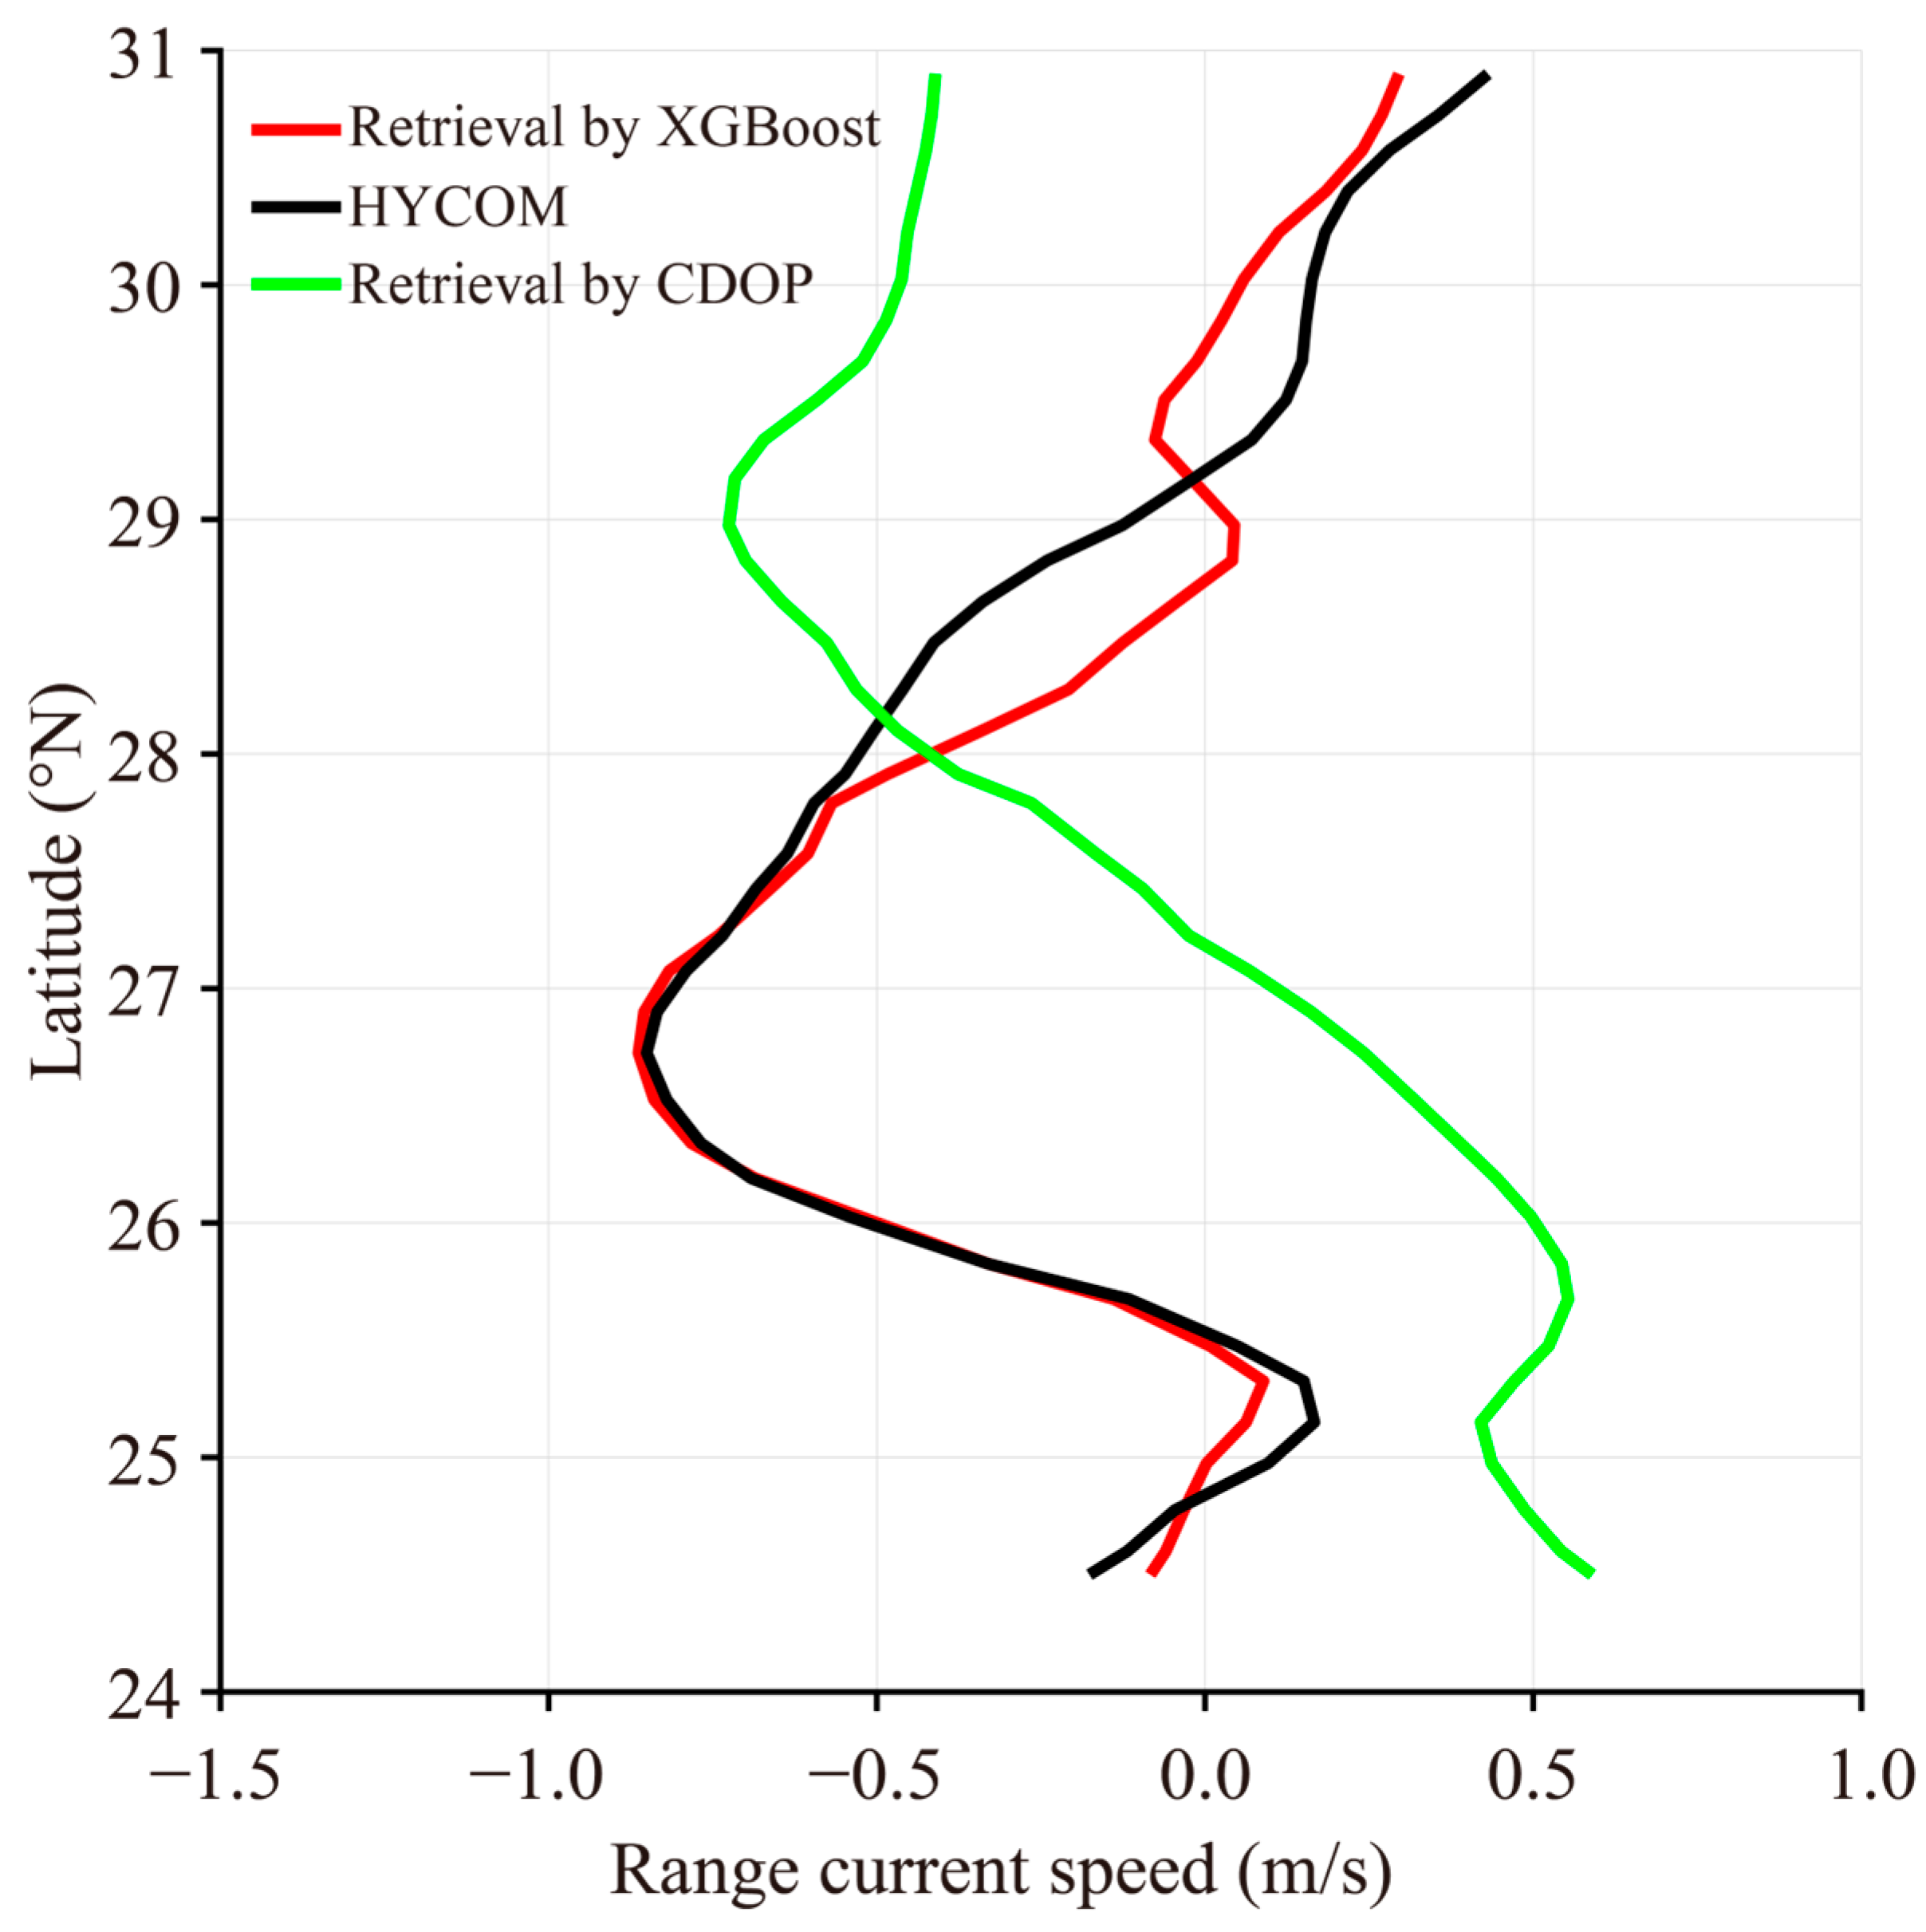
The trained XGBoost model and the empirical algorithm are applied to the test dataset to retrieve the range component of the ocean current. A showcased result by XGBoost relevant to the TC Infa is depicted in Figure 9a. Similarly, the example of the empirical algorithm is shown in Figure 9b, and the HYCOM range current speed map on 24 July 2021, 09:00, is presented in Figure 9c. It was found that the range current speed result by the XGBoost model is consistent with the HYCOM range current speed map, which is better than the inversion result by the empirical algorithm. A comparison between the XGBoost result, the empirical algorithm result, and the HYCOM output along the 123° longitude (see the dashed red line in panel (a)) is shown in Figure 10. It can be noted that the range component of the ocean current pattern inverted from S-1 SAR imagery by the XGBoost model is generally consistent with that from HYCOM simulations. However, the inversion result by the empirical algorithm has a huge error with the HYCOM simulations.
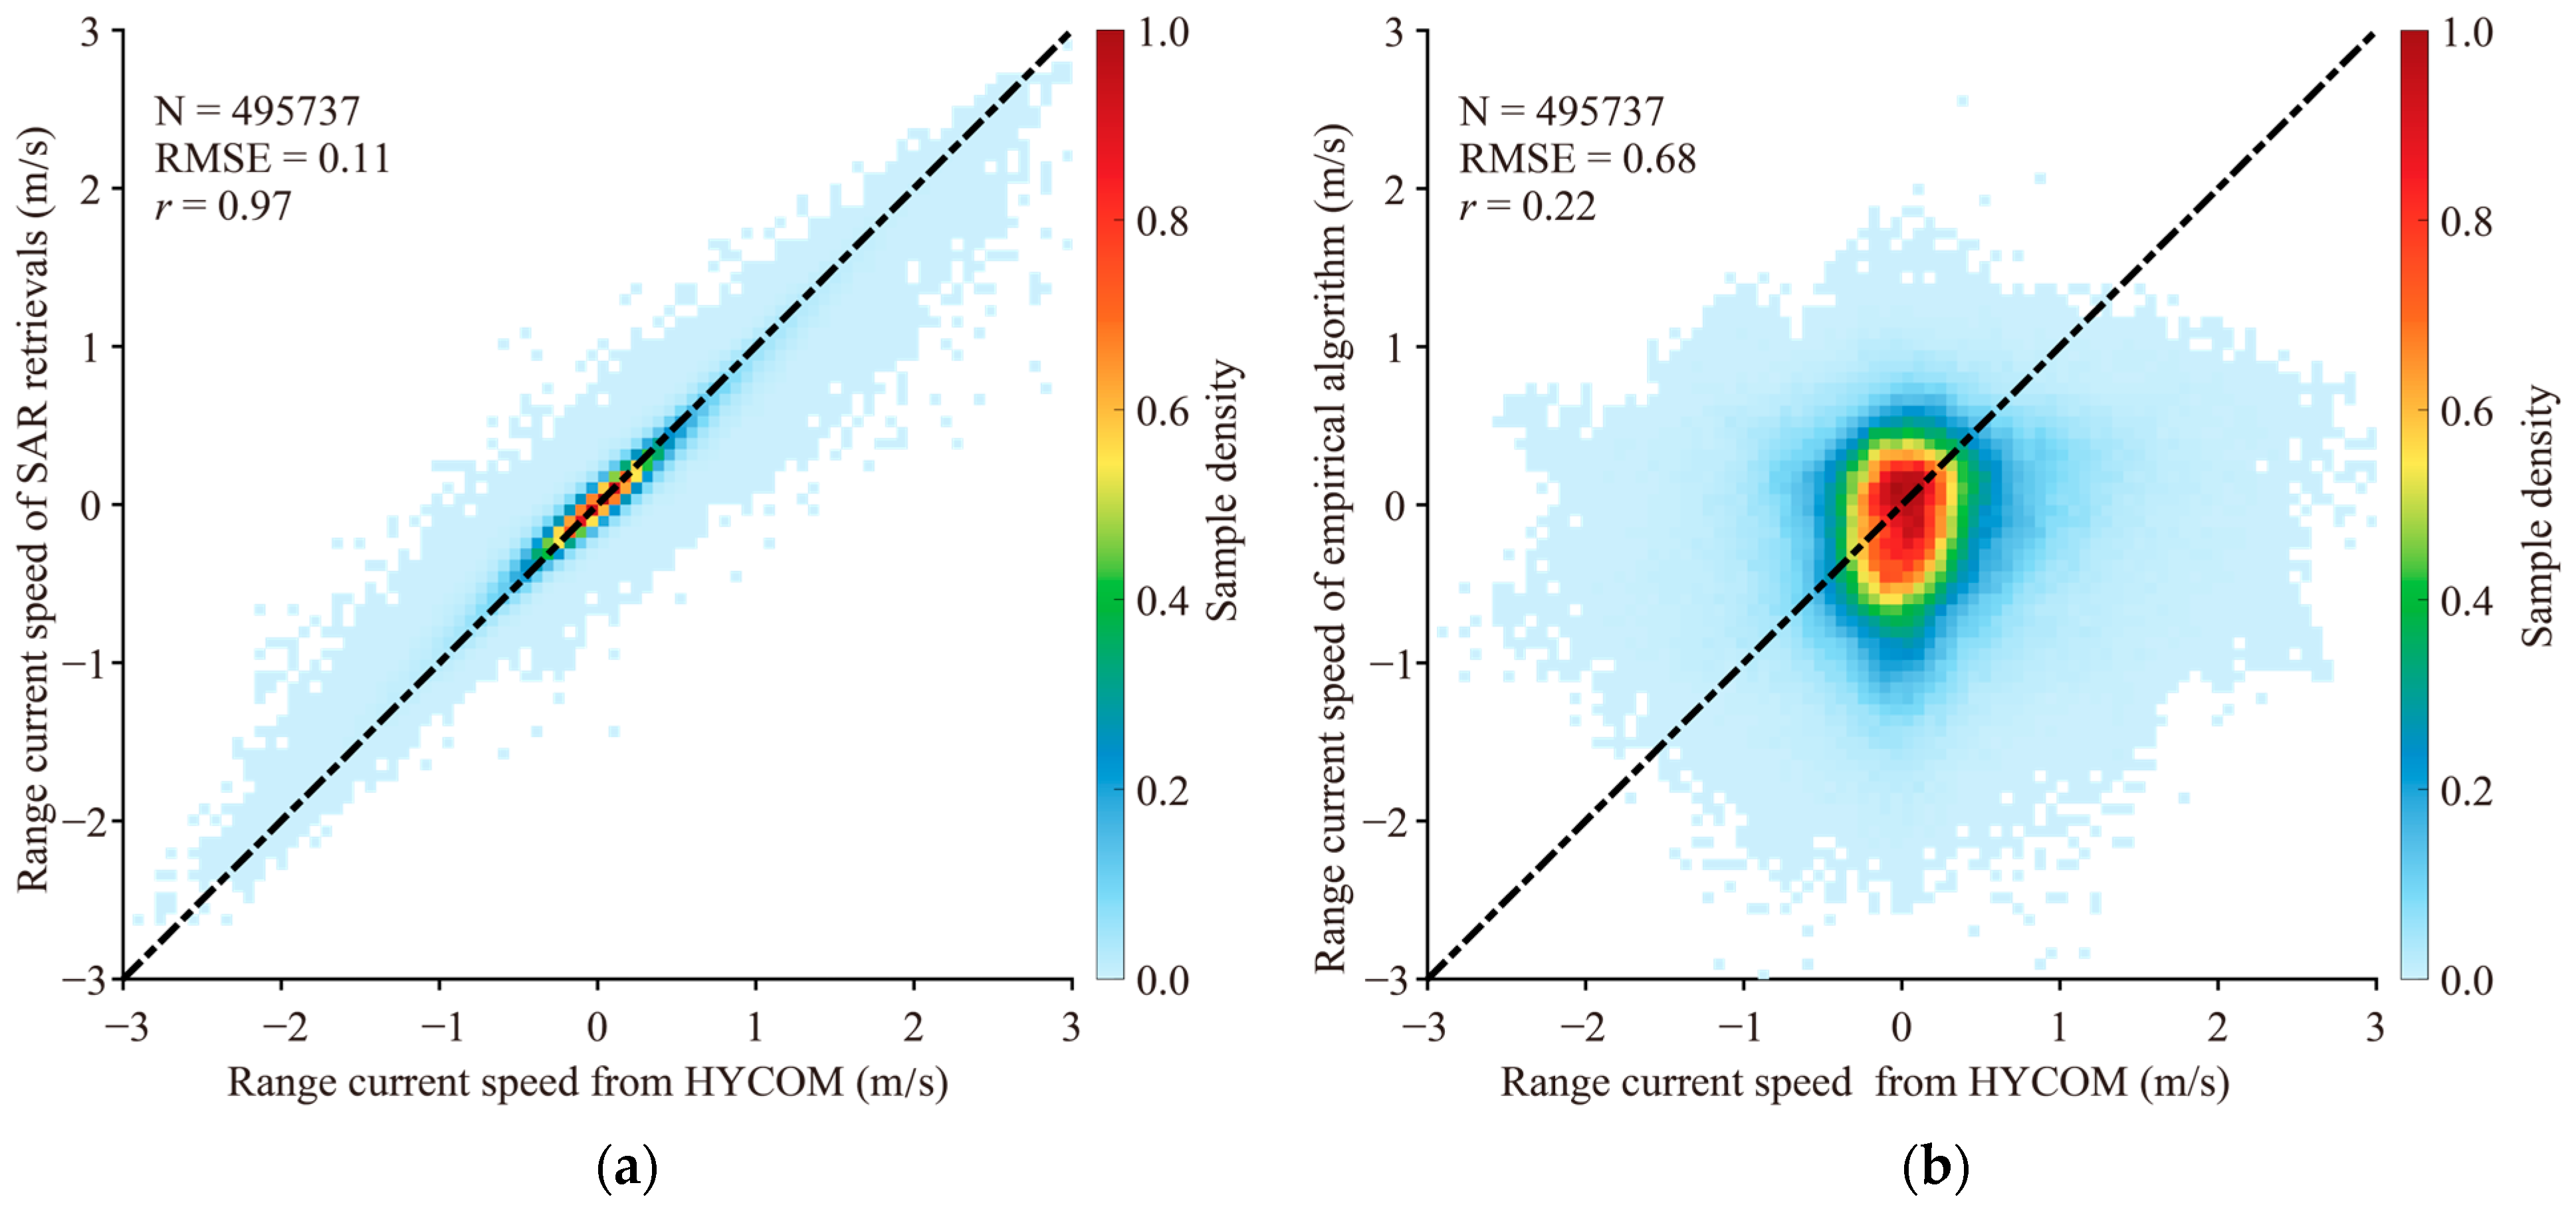
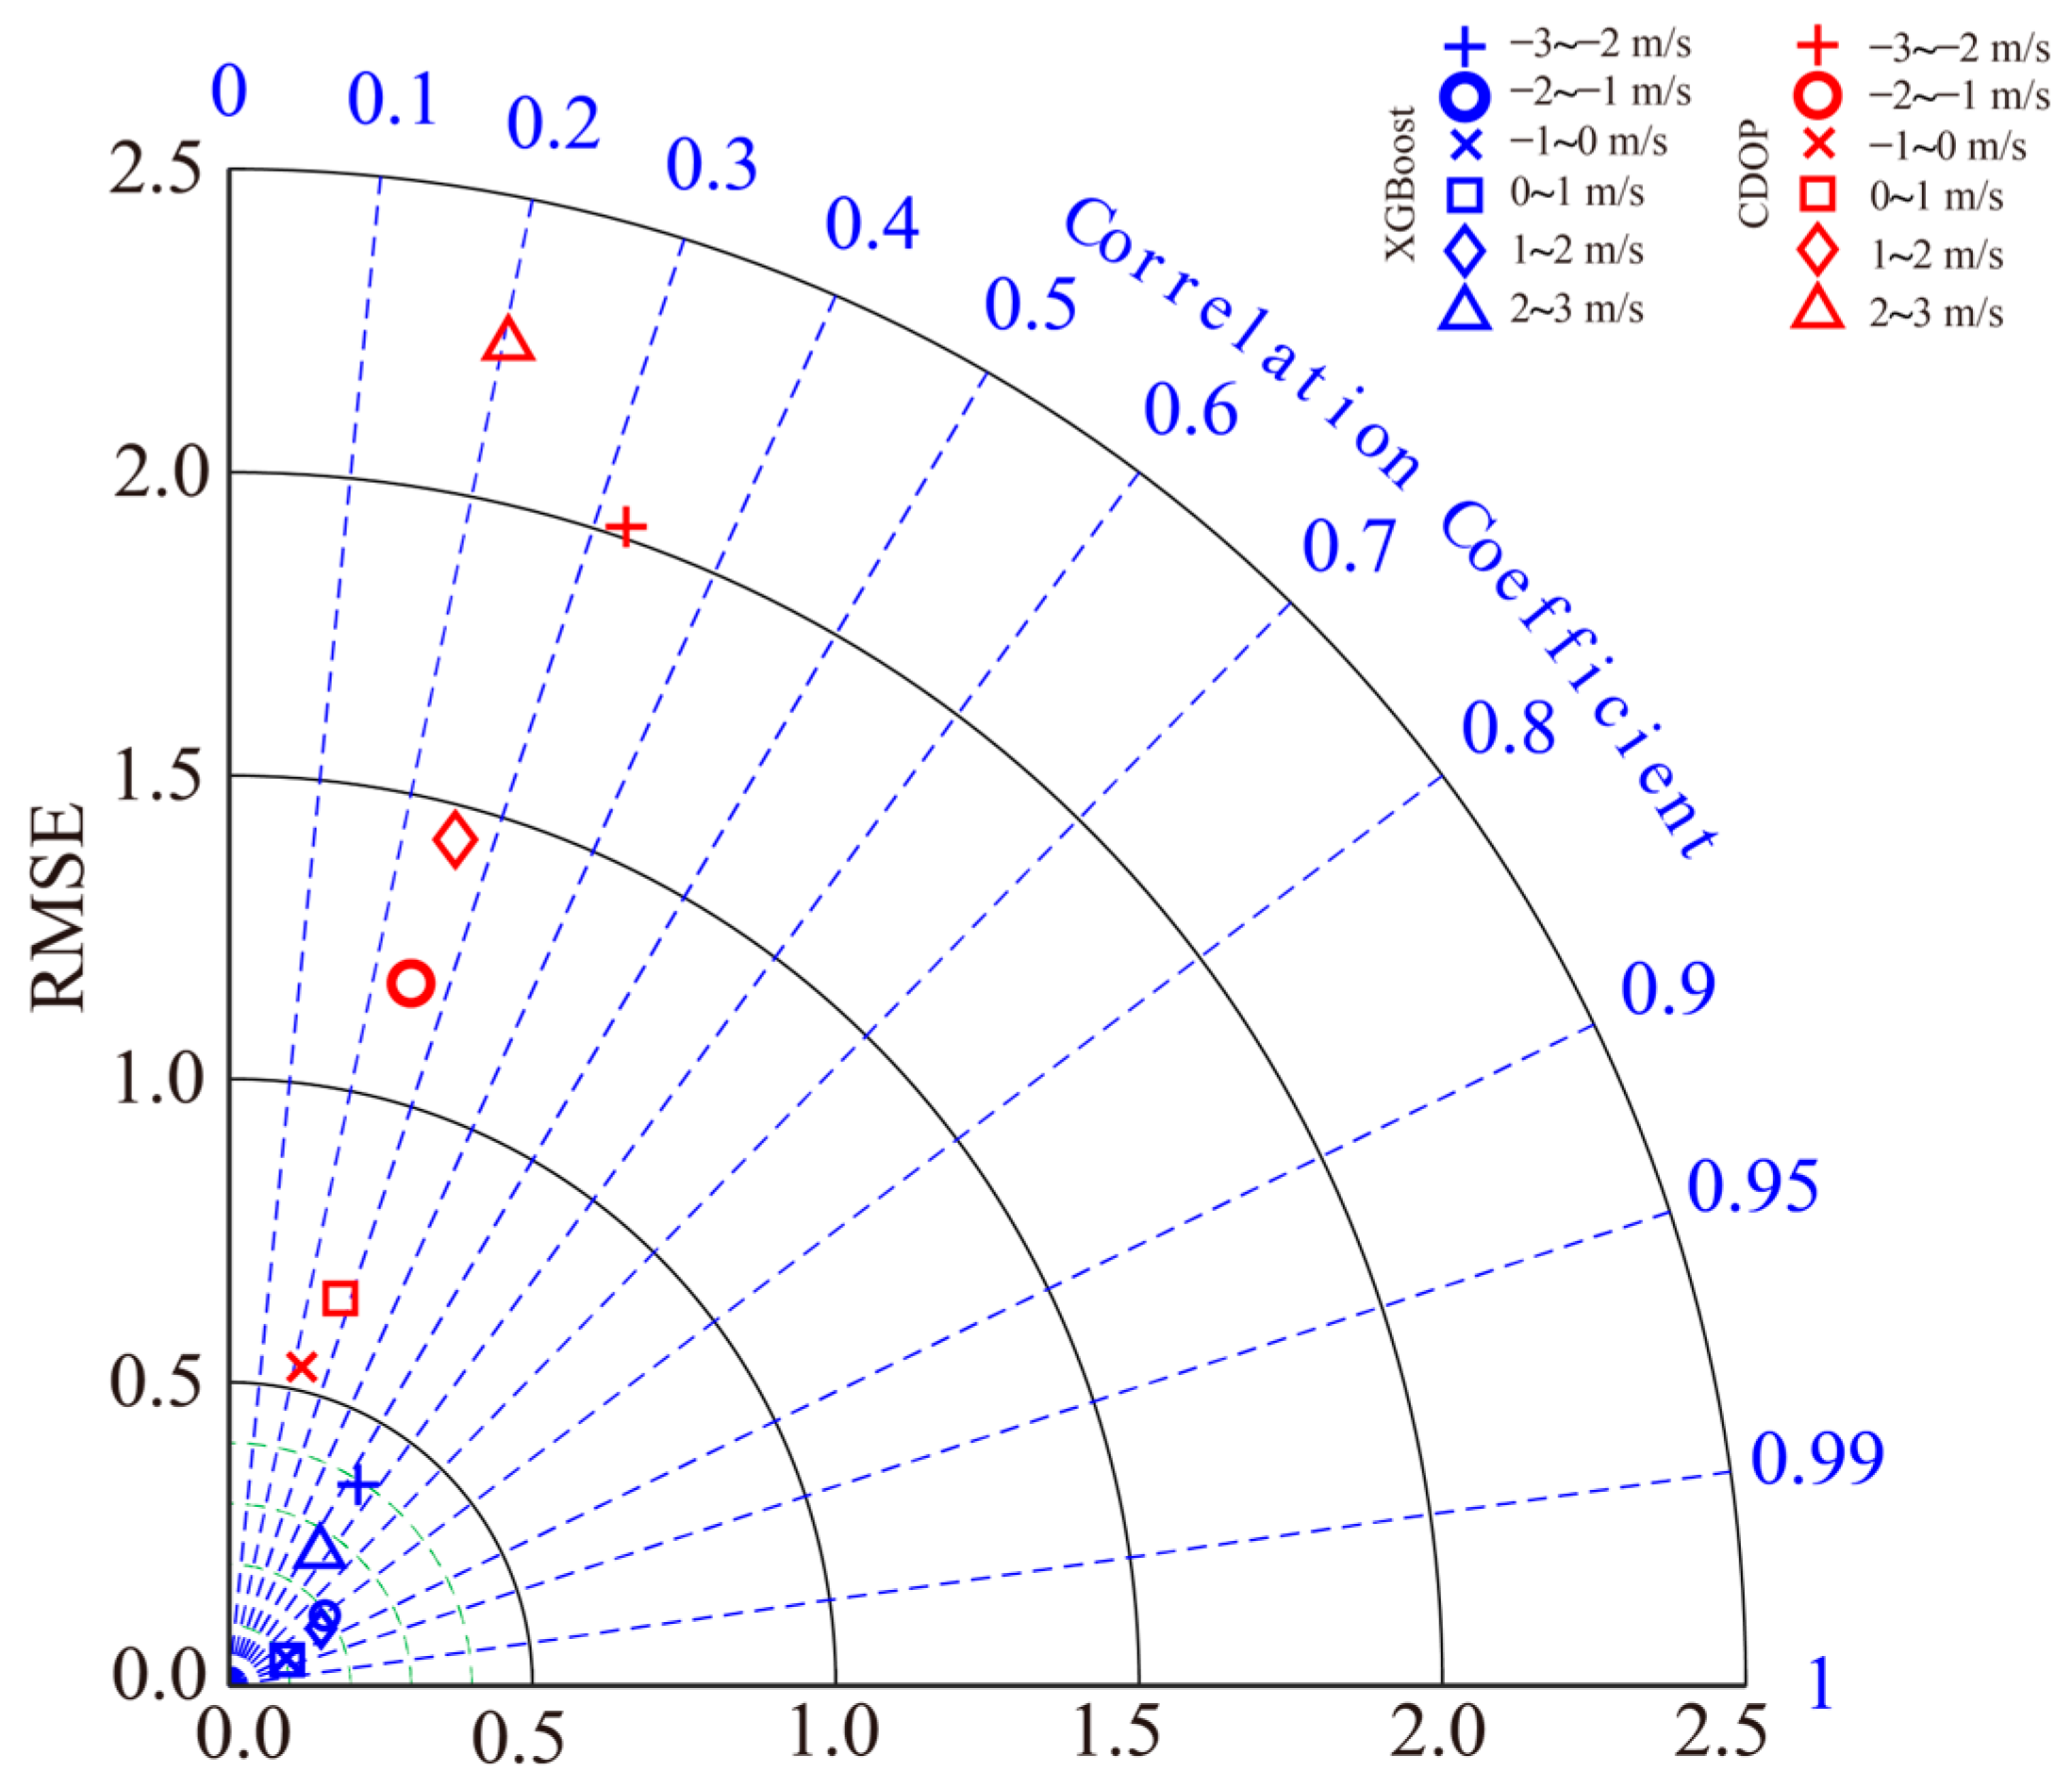
In addition, the statistical results of the range current wind speeds based on the XGBoost result, the empirical algorithm, and the HYCOM data are presented in Figure 11. The composition of the validation data is made up of 300 random pieces of data in 2300 images. The analysis revealed that the accuracy assessment of the XGBoost SAR retrievals with respect to HYCOM data results in an RMSE = 0.11 m/s and r = 0.97, which is better than the empirical algorithm result with an RMSE of 0.68 m/s and r = 0.22. Similarly, the verification results of the two high-frequency radar measurements in Figure 5 are shown in Figure 12a and Figure 12b, respectively. The comparison of the inversion result by the XGBoost model shows an RMSE = 0.12 m/s and r = 0.75, which is better than the RMSE = 0.22 m/s and r = 0.28 in the empirical algorithm. Nonetheless, it is worth noting that even though the use of a machine learning approach results in remarkable improvements, prior information on the sea waves and wind speed is needed. A Taylor diagram with respect to the current speed up to 3 m/s at intervals of 1 m/s is shown in Figure 13, in which the blue and red symbols represent the result using XGBoost and the empirical algorithm. In total, the inversion result by the XGBoost method is better than the empirical algorithm under the difference current speed ranges. Therefore, the XGBoost method is an optional way to retrieve range current speed from SAR typhoon images.

4.2. Discussion

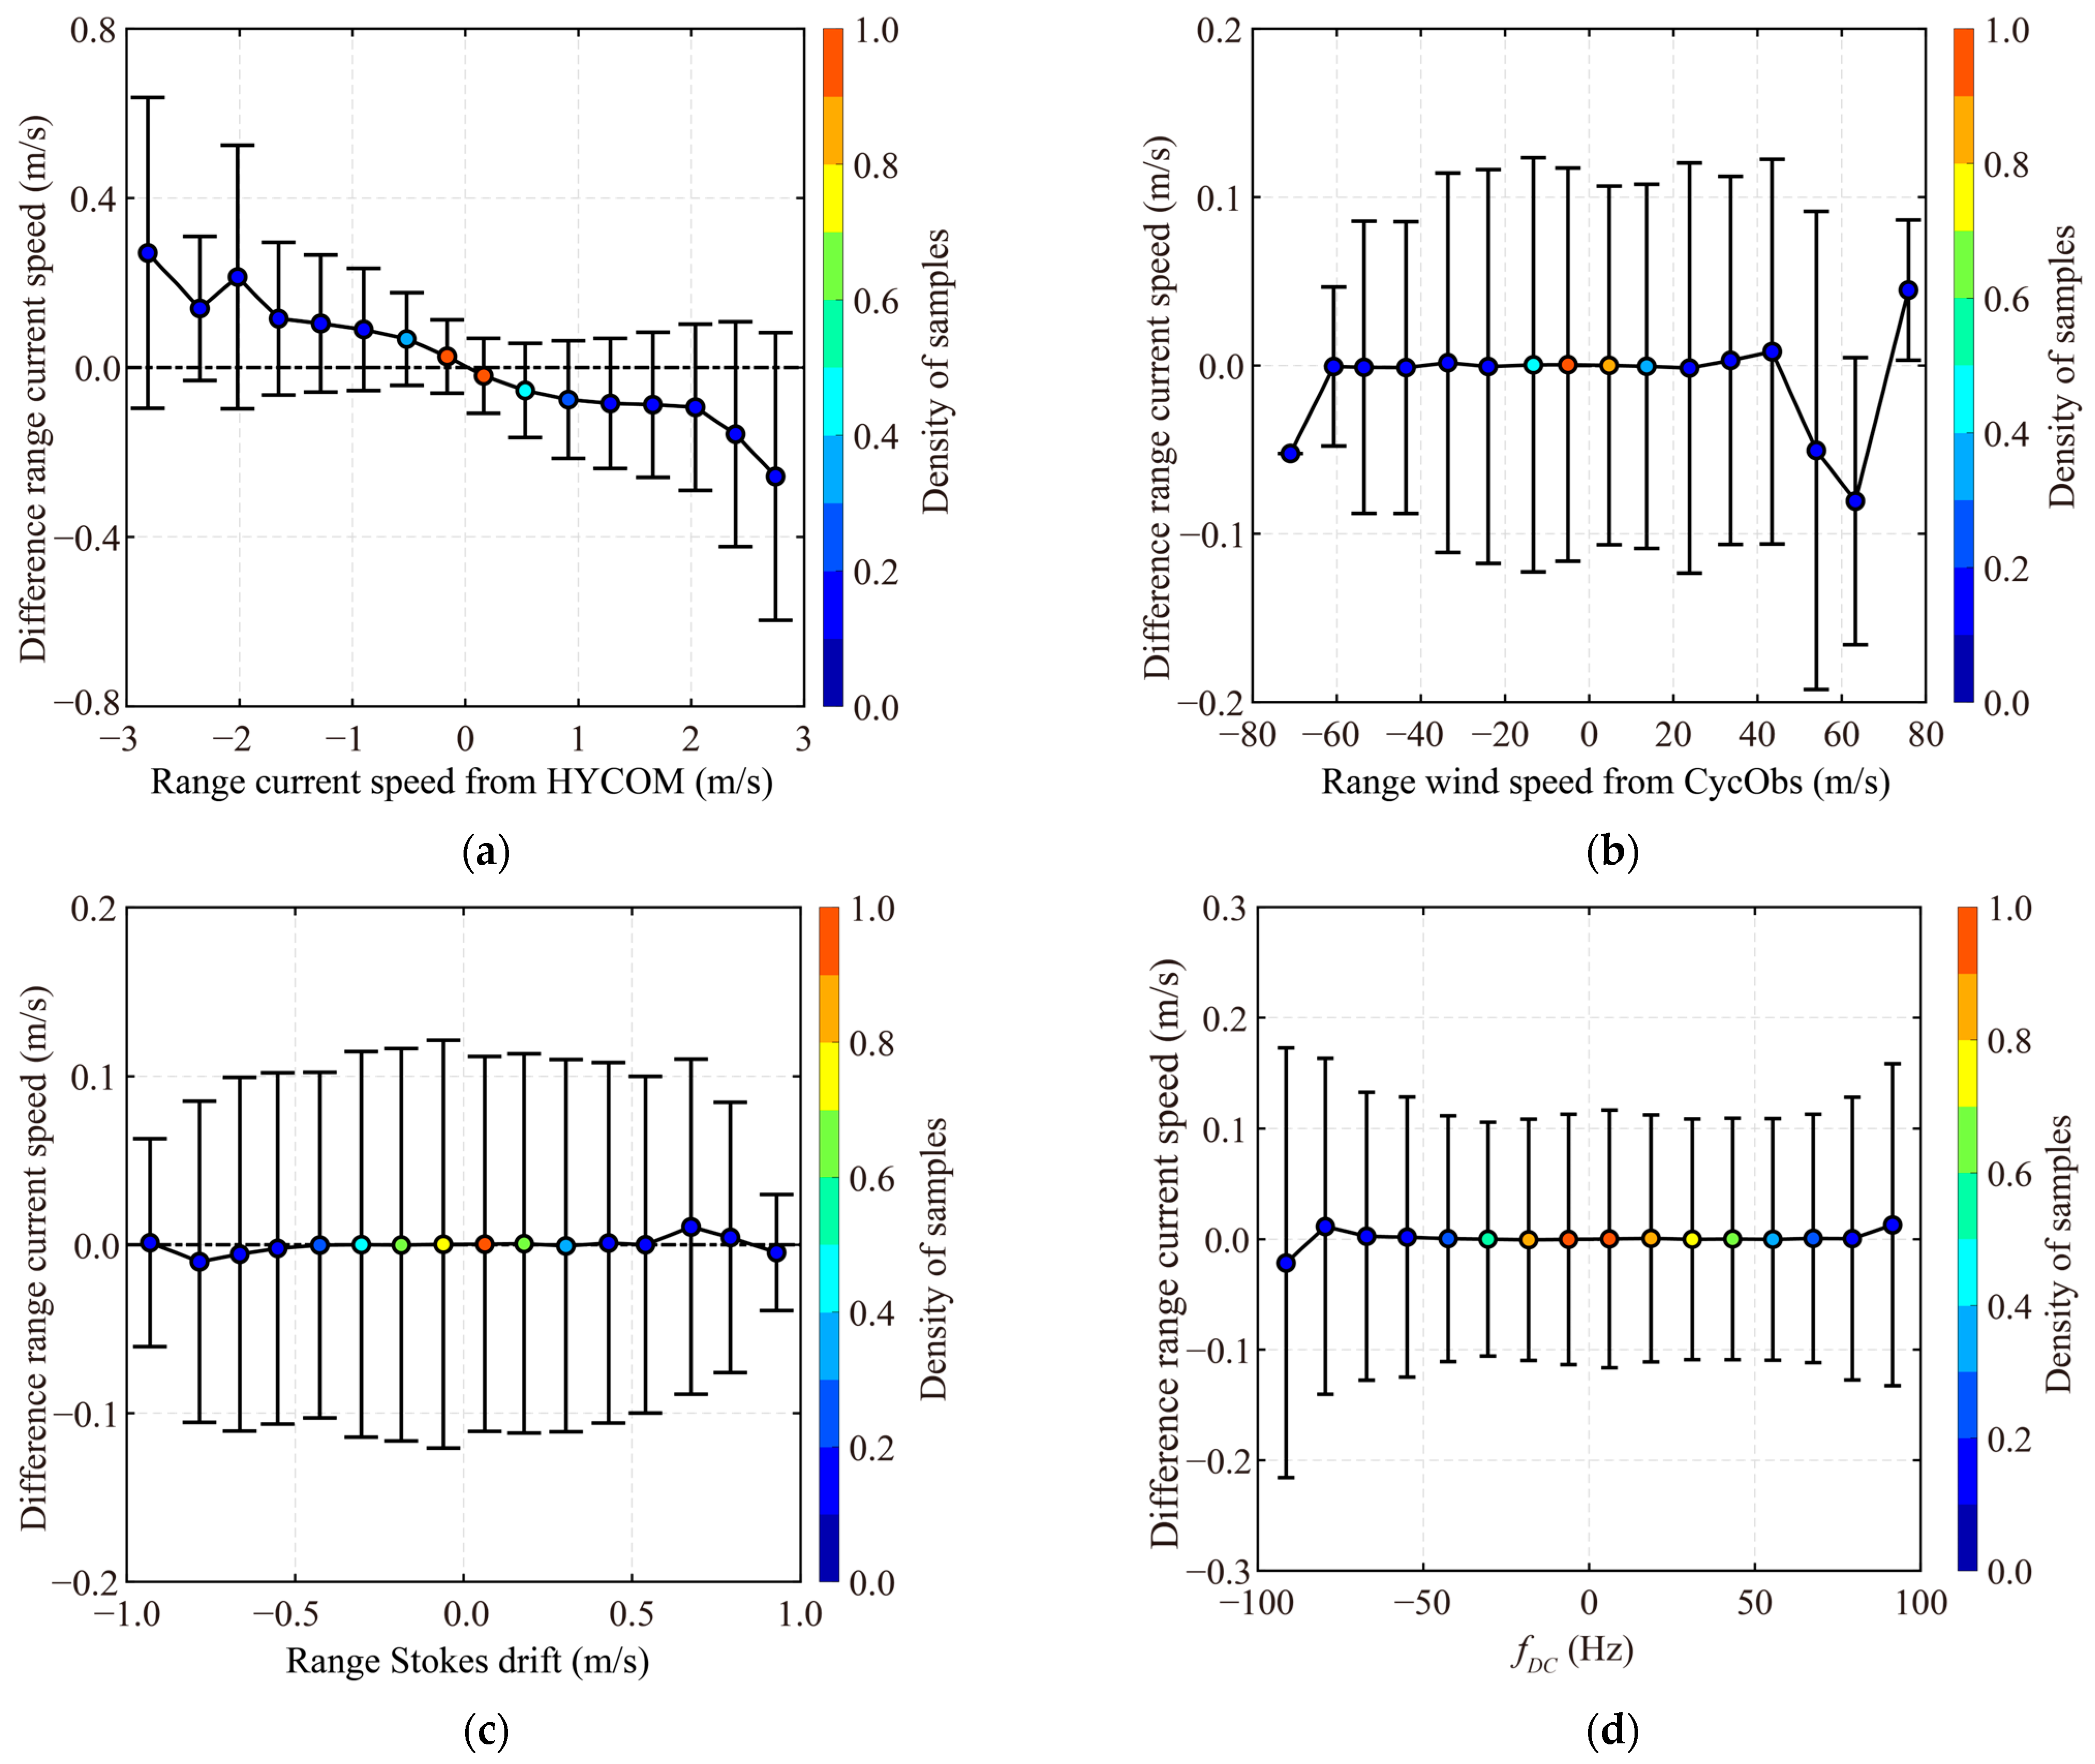
Error analysis of the SAR retrieval using the XGBoost method and the HYCOM data was conducted. The relationships between the bias (SAR-derived minus HYCOM data) of the range current speed and the range HYCOM current speed for a 0.375 m/s bin, the range wind speed for a 10 m/s bin, the range Stokes drift for a 0.125 m/s bin, and the DCA for a 12.5 Hz bin are shown in Figure 14. The analysis revealed that the range wind speed, the range Stokes drift, and the DCA created less distortion in the performance of XGBoost at a range wind speed between −60 m/s and 40 m/s, a range Stokes drift between −0.75 m/s and 0.6 m/s, and a DCA between −75 Hz and <75 Hz. At a range wind speed > 40 m/s and <−60 m/s, higher wind speed has a sensitive effect on the performance of XGBoost. In other cases, the range Stokes drift has a symmetric effect on the performance of XGBoost, while there is no special relationship for the DCA as a whole. However, it is found that the bias was decreased as the range HYCOM current speed increased. Thus, the XGBoost model is recommended for the SAR range component of ocean current retrieval under extreme sea states, although prior wave information is necessary.

5. Conclusions

In this study, a novel algorithm to retrieve the range component of the ocean current during a TC from SAR measurements is proposed. To this aim, 2300 S-1 SAR images collocated with waves simulated by WW3 and reanalysis currents from HYCOM are considered. The comparison of WW3-simulated SWHs with HY-2B products collected in China seas in the period of June–August 2022 demonstrates their effectiveness, since RMSE = 0.41 m and r = 0.88 are obtained. Stokes drift is estimated by the SWH, and the mean wave period is simulated using the WW3 model. The CyclObs winds provided by IFREMER by inverting co- and cross-polarized backscattering signals are also considered, while the DCA information, expressed as the difference between the radar return Doppler frequency and the predicted Doppler shift, is provided by S-1 level-2 OCN products. The main conclusions can be summarized as follows:
(1)
Under TC conditions, both wind and current speeds call for a linear relationship with the DCA. This agrees with the findings reported in [35,40]. In addition, we also found that the Stokes drift is linearly correlated with the DCA.
(2)
The range component of the ocean current obtained as output of the trained XGBoost machine learning model is compared with HYCOM data and two collocated HF phased-array radar measurements. It results in RMSE = 0.11 m/s and r = 0.97, and RMSE = 0.12 m/s and r = 0.75, respectively. The above result is better than the empirical CDOP model with an RMSE = 0.68 m/s and r = 0.22 for HYCOM and an RMSE = 0.22 m/s and r = 0.28 for HF data.
(3)
The error analysis confirms the steady performance of XGBoost at a range wind speed between −60 m/s and 40 m/s, a range Stokes drift between −0.75 m/s and 0.6 m/s, and a DCs between −75 Hz and 75 Hz. However, the accuracy is gradually reduced by XGBoost with increasing current speed.
Hence, the XGBoost model is recommended for the SAR range component of ocean current retrieval under extreme sea states, although prior wave information is necessary. Future work will include the use of SAR imagery as the unique source of wave information, without the need to use the simulations from a numeric model. In the future, more validation data will be collected to verify the model, analyze the dataset according to different regions and different latitudes, and perform regionalization simulation of the data under various conditions.

Author Contributions

Conceptualization, W.S. and Y.Z.; methodology, W.S. and Y.Z.; software, Y.Z.; validation, W.S., F.N. and W.W.; formal analysis, W.S. and C.L.; investigation, Y.Z. and W.S.; resources, W.S.; data curation, Y.Z. and F.N.; writing—original draft preparation, W.S. and C.L.; writing—review and editing, Y.Z., W.S. and F.N.; visualization, Y.Z. and W.S.; supervision, W.W.; project administration, F.N. and W.S.; funding acquisition, W.S. All authors have read and agreed to the published version of the manuscript.

Funding

This research was supported by the National Natural Science Foundation of China (Grant nos. 42076238 and 42376174) and the Natural Science Foundation of Shanghai (Grant no. 23ZR1426900).

Institutional Review Board Statement

Not applicable.

Informed Consent Statement

Not applicable.

Data Availability Statement

The data that support the findings of this study are available on request from the corresponding author.

Acknowledgments

We truly appreciate the provision of Sentinel-1 images and ocean products by the European Space Agency. CyclObs wind products were generated by the IFREMER team. Additionally, the measurements of the Haiyang-2B altimeter were provided by the National Satellite Ocean Application Service. We also give thanks for the current observations from high-frequency ground wave radar and the reanalysis HYCOM data shared by the National Marine Data and Information Service.

Conflicts of Interest

The authors declare no conflicts of interest.

References

  1. Fetterer, F.; Gineris, D.; Wackerman, C.C. Validating a scatterometer wind algorithm for ERS-1 SAR. IEEE Trans. Geosci. Remote Sens. 1998, 36, 479–492. [Google Scholar] [CrossRef]
  2. Lemoine, F.G.; Zelensky, N.P.; Chinn, D.S.; Pavlis, D.E.; Luceri, V. Towards development of a consistent orbit series for Topex, Jason-1, and Jason-2. Adv. Space Res. 2010, 46, 1513–1540. [Google Scholar] [CrossRef]
  3. Ni, W.C.; Stoffelen, A.; Ren, K.J.; Yang, X.F.; Vogelzang, J. SAR and ASCAT tropical cyclone wind speed reconciliation. Remote Sens. 2022, 14, 5535. [Google Scholar] [CrossRef]
  4. Zhang, B.; Perrie, W. Cross-polarized synthetic aperture radar: A new potential technique for hurricanes. Bull. Am. Meteorol. Soc. 2012, 93, 531–541. [Google Scholar] [CrossRef]
  5. Hwang, P.A. Fetch- and duration-limited nature of surface wave growth inside tropical cyclones: With applications to air-sea exchange and remote sensing. J. Phys. Oceanogr. 2016, 46, 41–56. [Google Scholar] [CrossRef]
  6. Gao, Y.; Sun, J.; Zhang, J.; Guan, C.L. Extreme wind speeds retrieval using Sentinel-1 IW mode SAR data. Remote Sens. 2021, 13, 1867. [Google Scholar] [CrossRef]
  7. Hersbach, H.; Stoffelen, A.; Haan, S. An improved C-band scatterometer ocean geophysical model function: CMOD5. J. Geophys. Res. 2007, 112, C03006. [Google Scholar] [CrossRef]
  8. Hersbach, H. Comparison of C-band scatterometer CMOD5.N equivalent neutral winds with ECMWF. J. Atmos. Ocean. Technol. 2010, 27, 721–736. [Google Scholar] [CrossRef]
  9. Stoffelen, A.; Verspeek, J.; Vogelzang, J.; Verhoef, A. The CMOD7 geophysical model function for ASCAT and ERS wind retrievals. IEEE J. Sel. Top. Appl. Earth Obs. Remote Sens. 2017, 10, 2123–2134. [Google Scholar] [CrossRef]
  10. Lu, Y.R.; Zhang, B.; Perrie, W.; Li, X.F.; Wang, H. A C-band geophysical model function for determining coastal wind speed using synthetic aperture radar. IEEE J. Sel. Top. Appl. Earth Obs. Remote Sens. 2018, 11, 2417–2428. [Google Scholar] [CrossRef]
  11. Shao, W.Z.; Jiang, X.W.; Sun, Z.F.; Hu, Y.Y.; Marino, A.; Zhang, Y.G. Evaluation of wave retrieval for Chinese Gaofen-3 synthetic aperture radar. Geo-Spat. Inf. Sci. 2022, 25, 229–243. [Google Scholar] [CrossRef]
  12. Li, X.M.; Lehner, S. Algorithm for sea surface wind retrieval from TerraSAR-X and TanDEM-X data. IEEE Trans. Geosci. Remote Sens. 2014, 52, 928–2939. [Google Scholar] [CrossRef]
  13. Hwang, P.A.; Fois, F. Surface roughness and breaking wave properties retrieved from polarimetric microwave radar backscattering. J. Geophys. Res.-Oceans 2015, 120, 3640–3657. [Google Scholar] [CrossRef]
  14. Gao, Y.; Guan, C.L.; Sun, J.; Xie, L. A new hurricane wind direction retrieval method for SAR images without hurricane eye. J. Atmos. Ocean. Technol. 2018, 35, 2229–2239. [Google Scholar] [CrossRef]
  15. Zhang, G.S.; Li, X.F.; Perrie, W.; Hwang, P.; Zhang, B.; Yang, X.F. A hurricane wind speed retrieval model for C-band RADARSAT-2 cross-polarization ScanSAR images. IEEE Trans. Geosci. Remote Sens. 2017, 55, 4766–4774. [Google Scholar] [CrossRef]
  16. Mouche, A.A.; Chapron, B. Global C-band Envisat, RADARSAT-2 and Sentinel-1 SAR measurements in copolarization and cross-polarization. J. Geophys. Res. 2016, 120, 7195–7207. [Google Scholar] [CrossRef]
  17. Mouche, A.A.; Chapron, B.; Zhang, B.; Husson, R. Combined co- and cross-polarized SAR measurements under extreme wind condition. IEEE Trans. Geosci. Remote Sens. 2017, 55, 6476–6755. [Google Scholar] [CrossRef]
  18. Hu, Y.Y.; Shao, W.Z.; Shen, W.; Zhou, Y.H.; Jiang, X.W. Machine learning applied to a dual-polarized Sentinel-1 image for wind retrieval of tropical cyclones. Remote Sens. 2023, 15, 3948. [Google Scholar] [CrossRef]
  19. Corcione, V.; Grieco, G.; Portabella, M.; Nunziata, F.; Migliaccio, M. A novel azimuth cutoff implementation to retrieve sea surface wind speed from SAR imagery. IEEE Trans. Geosci. Remote Sens. 2019, 57, 3331–3340. [Google Scholar] [CrossRef]
  20. Hasselmann, K.; Hasselmann, S. On the nonlinear mapping of an ocean wave spectrum into a synthetic aperture radar image spectrum. J. Geophys. Res.-Oceans 1991, 96, 10713–10729. [Google Scholar] [CrossRef]
  21. Sun, J.; Guan, C.L. Parameterized first-guess spectrum method for retrieving directional spectrum of swell-dominated waves and huge waves from SAR images. Chin. J. Oceanol. Limnol. 2006, 24, 12–20. [Google Scholar]
  22. Shao, W.Z.; Hu, Y.Y.; Jiang, X.W.; Zhang, Y.G. Wave retrieval from quad-polarized Chinese Gaofen-3 SAR image using an improved tilt modulation transfer function. Geo-Spat. Inf. Sci. 2023, 1–19. [Google Scholar] [CrossRef]
  23. Schulz-Stellenfleth, J.; Konig, T.; Lehner, S. An empirical approach for the retrieval of integral ocean wave parameters from synthetic aperture radar data. J. Geophys. Res.-Oceans 2007, 112, C03019. [Google Scholar] [CrossRef]
  24. Pleskachevsky, A.; Jacobsen, S.; Tings, B.; Schwarz, E. Estimation of sea state from Sentinel-1 synthetic aperture radar imagery for maritime situation awareness. Int. J. Remote Sens. 2019, 40, 4104–4142. [Google Scholar] [CrossRef]
  25. Wang, H.; Yang, J.S.; Lin, M.S.; Li, W.W.; Zhu, J.H.; Ren, L.; Cui, L.M. Quad-polarimetric SAR sea state retrieval algorithm from Chinese Gaofen-3 wave mode imagettes via deep learning. Remote Sens. Environ. 2022, 273, 112969. [Google Scholar] [CrossRef]
  26. Pleskachevsky, A.; Tings, B.; Wiehle, S.; Imber, J.; Jacobsen, S. Multiparametric sea state fields from synthetic aperture radar for maritime situational awareness. Remote Sens. Environ. 2022, 280, 113200. [Google Scholar] [CrossRef]
  27. Hu, Y.Y.; Hao, M.Y.; Shao, W.Z.; Shen, W.; Jiang, X.W. Wave retrieval for Sentinel-1 synthetic aperture radar under complex sea state. Int. J. Remote Sens. 2024, 45, 3807–3826. [Google Scholar] [CrossRef]
  28. Zhao, X.B.; Shao, W.Z.; Zhao, L.B.; Gao, Y.; Hu, Y.Y.; Yuan, X.Z. Impact of rain on wave retrieval from Sentinel-1 synthetic aperture radar images in tropical cyclones. Adv. Space Res. 2021, 67, 3072–3086. [Google Scholar] [CrossRef]
  29. Bao, L.W.; Zhang, X.; Cao, C.H.; Wang, X.C.; Jia, Y.J.; Gao, G.; Zhang, Y.; Wan, Y.; Zhang, J. Impact of polarization basis on wind and wave parameters estimation using the azimuth cutoff from GF-3 SAR imagery. IEEE Trans. Geosci. Remote Sens. 2022, 60, 22070380. [Google Scholar] [CrossRef]
  30. Hansen, M.; Collard, F.; Dagestad, K.F.; Johannessen, J.A.; Chapron, B. Retrieval of sea surface range velocities from Envisat ASAR doppler centroid measurements. IEEE Trans. Geosci. Remote Sens. 2011, 49, 3582–3592. [Google Scholar] [CrossRef]
  31. Chapron, B.; Collard, F.; Ardhuin, F. Direct measurements of ocean surface velocity from space: Interpretation and validation. J. Geophys. Res.-Oceans 2005, 110, C07008. [Google Scholar] [CrossRef]
  32. Moiseev, A.; Johnsen, H.; Hansen, M.W.; Johannessen, J.A. Evaluation of radial ocean surface currents derived from Sentinel-1 IW doppler shift using coastal radar and Lagrangian surface drifter observations. J. Geophys. Res.-Oceans 2020, 125, e2019JC015743. [Google Scholar] [CrossRef]
  33. Shao, W.Z.; Zhou, Y.H.; Hu, Y.Y.; Li, Y.; Zhou, Y.S.; Zhang, Q.J. Range current retrieval fromsentinel-1 SAR ocean product based on deep learning. Remote Sens. Lett. 2024, 15, 145–156. [Google Scholar] [CrossRef]
  34. Yang, X.B.; He, Y.J. Retrieval of a real-time sea surface vector field from SAR doppler centroid: 2. on the radial velocity. J. Geophys. Res.-Oceans 2023, 128, 1. [Google Scholar] [CrossRef]
  35. Mouche, A.A.; Collard, F.; Chapron, B.; Dagestad, K.F.; Guitton, G.; Johannessen, J.A.; Kerbaol, V.; Hansen, M.W. On the use of doppler shift for sea surface wind retrieval from SAR. IEEE Trans. Geosci. Remote Sens. 2012, 50, 901–2909. [Google Scholar] [CrossRef]
  36. Johannessen, J.A.; Chapron, B.; Collard, F.; Kudryavtsev, V.; Mouche, A.; Akimov, D.; Dagestad, K.F. Direct ocean surface velocity measurements from space: Improved quantitative interpretation of Envisat ASAR observations. Geophys. Res. Lett. 2008, 35, L22608. [Google Scholar] [CrossRef]
  37. Fan, S.R.; Zhang, B.; Kudryavtsev, V.; Perrie, W. Mapping radial ocean surface currents in the outer core of hurricane maria from synthetic aperture radar doppler measurements. IEEE J. Sel. Top. Appl. Earth Obs. Remote Sens. 2024, 17, 2090–2097. [Google Scholar] [CrossRef]
  38. Tan, B.H.; Wang, L.H.; Ge, D.C.; Fang, Z.; Sun, W.W.; Feng, T. An investigation of inversion method to measure the radial velocity of Kuroshio from Sentinel-1 SAR data. GISci. Remote Sens. 2024, 61, 1. [Google Scholar] [CrossRef]
  39. Elyouncha, A.; Eriksson, L.E.B.; Johnsen, H. Direct Comparison of Sea Surface Velocity Estimated from Sentinel-1 and TanDEM-X SAR Data. IEEE J. Sel. Top. Appl. Earth Observ. Remote Sens. 2022, 15, 2425–2436. [Google Scholar] [CrossRef]
  40. Wang, W.L.; Forget, P.; Guan, C.L. Inversion and assessment of swell waveheights from HF radar spectra in the Iroise sea. Ocean Dyn. 2016, 66, 527–538. [Google Scholar] [CrossRef]
  41. Cui, H.; He, H.L.; Liu, X.H.; Li, Y. Effect of oceanic current on typhoon-wave modeling in the east China sea. Chin. Phys. B 2012, 21, 109201. [Google Scholar] [CrossRef]
  42. Li, J.K.; Alison, L.K.; Hayley, H.S. Comparison of wave propagation through ice covers in calm and storm conditions. Geophys. Res. Lett. 2015, 42, 5935–5941. [Google Scholar] [CrossRef]
  43. Liu, Q.X.; Babanin, A.; Fan, Y.L.; Zieger, S.; Guan, C.L.; Moon, I.J. Numerical simulations of ocean surface waves under hurricane conditions: Assessment of existing model performance. Ocean Modell. 2017, 118, 73–93. [Google Scholar] [CrossRef]
  44. Sheng, Y.X.; Shao, W.Z.; Li, S.Q.; Zhang, Y.M.; Yang, H.W.; Zuo, J.C. Evaluation of typhoon waves simulated by WaveWatch-III model in shallow waters around Zhoushan islands. J. Ocean Univ. China 2019, 18, 365–375. [Google Scholar] [CrossRef]
  45. Wang, J.B.; Xu, H.; Yang, L.; Song, Q.J.; Ma, C.F. Cross-calibrations of the HY-2B altimeter using Jason-3 satellite during the period of April 2019–September 2020. Front. Earth Sci. 2021, 9, 647583. [Google Scholar] [CrossRef]
  46. Yao, R.; Shao, W.Z.; Zhang, Y.; Wei, M.; Hu, S.; Zuo, J.C. Feasibility of wave simulation in typhoon using WAVEWATCH-III forced by remote-sensed wind. J. Mar. Sci. Eng. 2023, 11, 2010. [Google Scholar] [CrossRef]
  47. Yang, Z.H.; Shao, W.Z.; Ding, Y.; Shi, J.; Ji, Q.Y. Wave simulation by the SWAN model and FVCOM considering the sea-water level around the Zhoushan Islands. J. Mar. Sci. Eng. 2020, 8, 783. [Google Scholar] [CrossRef]
  48. Guyon, I.; Luxburg, U.V.; Bengio, S.; Wallach, H.; Fergus, R.; Vishwanathan, S.; Garnett, R. A unified approach to interpreting model predictions. Adv. Neural Inf. Process. Syst. 2017, 30, 4768–4777. [Google Scholar]
  49. Collard, F.; Mouche, A.A.; Chapron, B.; Danil, C.; Johannessen, J. Routine high resolution observation of selected major surface currents from space. Adv. SAR Oceanogr. Envisat. ERS Missions 2008, 679, 21–25. [Google Scholar]
  50. Sun, J.B.; Li, H.M.; Lin, W.M.; He, Y.J. Joint inversion of sea surface wind and current velocity based on Sentinel-1 synthetic aperture radar observations. J. Mar. Sci. Eng. 2024, 11, 450. [Google Scholar] [CrossRef]
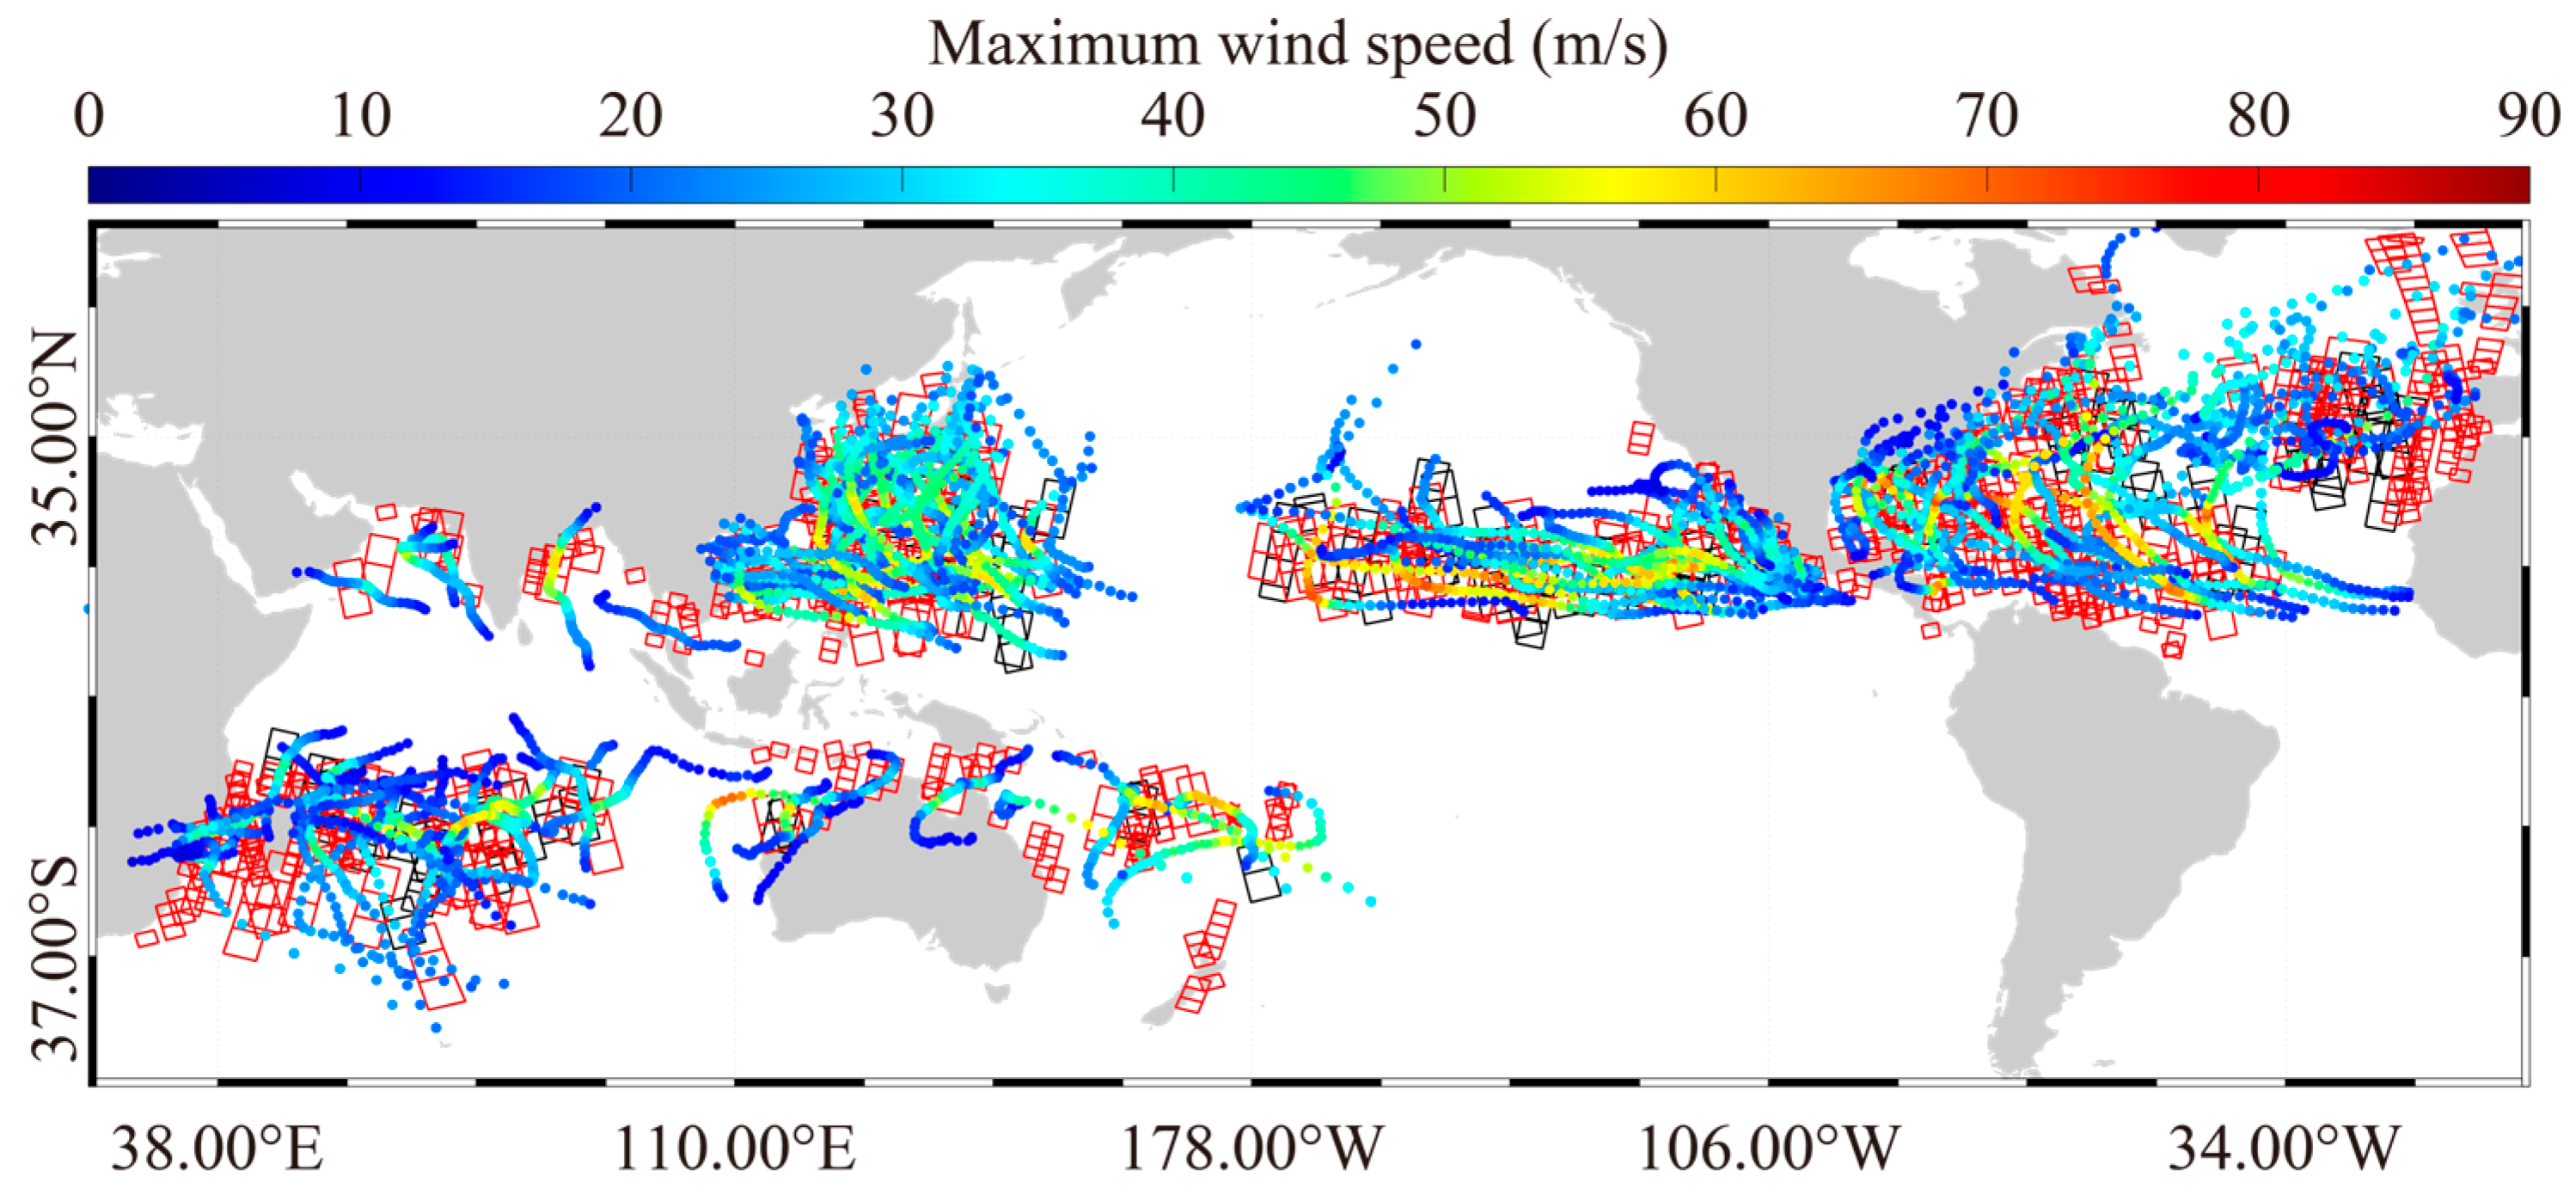
Figure 1. The frames of the 2300 S-1 SAR images overlaid on the TC tracks and maximum wind speeds, in which the red boxes indicate the training set and the black boxes indicate the test set.
Remotesensing 16 03271 g001
Figure 2. (a) S-1 VV-polarized NRCS image collected during the TC Infa (24 July 2021, 09:55 UTC); (b) S-1 VH-polarized NRCS image collected during the TC Infa (24 July 2021, 09:55 UTC); (c) corresponding CyclObs wind map.
Remotesensing 16 03271 g002
Figure 3. (a) SWH map simulated by WW3 at 10:00 UTC on 24 July 2021 relevant to the TC Infa, where the footprint of the HY-2B altimeter track is highlighted. (b) Validation of WW3-simulated SWH against the HY-2B products during the period of June–August 2022 in China seas.
Remotesensing 16 03271 g003
Figure 4. Current speed map simulated for 24 July 2021, 09:00 UTC, using HYCOM. The black box represents the footprint of the S-1 SAR image shown in Figure 2a.
Remotesensing 16 03271 g004
Figure 5. Current speed maps measured by the HF phased-array radars over the TC Infa on (a) 24 July 2021, 09:55 UTC, and (b) 25 July 2021, 21:51 UTC. The black line and red dot are the typhoon track, and the red triangle is the current typhoon time position.
Remotesensing 16 03271 g005
Figure 6. DCA versus (a) wind speed, (b) Stokes drift, and (c) current speed, projected onto the range direction. Black lines stand for the linear regression results.
Remotesensing 16 03271 g006
Figure 7. The flow chart of the eXtreme gradient boosting (XGBoost).
Remotesensing 16 03271 g007
Figure 8. (a) The behavior of the XGBoost training process and (b) the SHAP value map.
Remotesensing 16 03271 g008
Figure 9. (a) Range current speed map by XGBoost method and (b) the empirical algorithm obtained from the S-1 SAR scene collected over TC Infa on 24 July 2021, 09:55 UTC; (c) the HYCOM range current speed map on 24 July 2021, 09:00.
Remotesensing 16 03271 g009
Figure 10. Latitude variation given the longitude—see the dashed red line in (Figure 9a)—of the range current speed retrieved by XGBoost (red line), by CDOP model (green line), and simulated with HYCOM (black line).
Remotesensing 16 03271 g010
Figure 11. Validation of SAR-derived range current wind speeds by (a) XGBoost and (b) the CDOP model against HYCOM data.
Remotesensing 16 03271 g011
Figure 12. Validation of SAR-derived range current wind speeds by (a) XGBoost and (b) CDOP model against HF radar measurements.
Remotesensing 16 03271 g012
Figure 13. Taylor diagram with respect to current speed up to 3 m/s at intervals of 1 m/s, in which the red and blue symbols represent the result using XGBoost and the CDOP model.
Remotesensing 16 03271 g013
Figure 14. Variation in the bias (SAR-derived minus HYCOM data) of the range current speed with respect to (a) the HYCOM current speed for 0.375 m/s, (b) the wind speed for 10 m/s, (c) the Stokes drift for a 0.125 m/s bin, and (d) the DCA for a 12.5 Hz bin.
Remotesensing 16 03271 g014
Table 1. The hyperparameters used in XGBoost.
HyperparameterValue
max_depth15
learning_rate0.05
n_estimators400
objectivereg: linear
boostergbtree
gamma0.3
min_child_weight1
subsample1
colsample_bytree1
reg_alpha0
reg_lambda1
eval_metricrmse
Disclaimer/Publisher’s Note: The statements, opinions and data contained in all publications are solely those of the individual author(s) and contributor(s) and not of MDPI and/or the editor(s). MDPI and/or the editor(s) disclaim responsibility for any injury to people or property resulting from any ideas, methods, instructions or products referred to in the content.