Article

Improvement of the Estimation of the Vertical Crustal Motion Rate at GNSS Campaign Stations Based on the Information of GNSS Reference Stations

School of Geography and Information Engineering, China University of Geosciences, Wuhan 430074, China
*
Author to whom correspondence should be addressed.
Remote Sens. 2024, 16(17), 3144; https://doi.org/10.3390/rs16173144
Submission received: 28 July 2024 / Revised: 19 August 2024 / Accepted: 21 August 2024 / Published: 26 August 2024

Abstract

:
With the enrichment of GNSS data and the improvement in data processing accuracy, GNSS technology has been widely applied in fields such as crustal deformation. The Crustal Movement Observation Network of China (CMONOC) has provided decades of Global Navigation Satellite System (GNSS) data and related data products for crustal deformation research on the Chinese mainland. The coordinate time series of continuously observed reference stations contain abundant information on crustal movements. In contrast, the coordinate time series of periodically observed campaign stations have limited data, making it difficult to separate or remove instantaneous non-tectonic movements from the time series, as performed with reference stations, to obtain a stable and reliable crustal movement velocity field. To address this issue, this paper proposes a method to improve the estimation of crustal movement velocity at campaign stations using the information of neighboring reference stations. This method constructs a Delaunay triangulation of reference stations and fits the periodic movement of each campaign station using an inverse distance weighted interpolation algorithm based on the reference station information. The crustal movement velocity of the campaign stations is then estimated after removing the periodic movement. This method was verified by its application to the estimation of the vertical motion rate at some reference and campaign stations in Yunnan Province. The results show that the accuracy of vertical motion rate estimation for virtual and real campaign stations improved by an average of 24.4% and 9.6%, respectively, demonstrating the effectiveness of the improved method, which can be applied to estimate crustal movement velocity at campaign stations in other areas.

Graphical Abstract

1. Introduction

The Crustal Movement Observation Network of China (CMONOC) includes 260 continuously observed reference stations and over 2000 periodically observed campaign stations. This network has been applied to crustal deformation research on the Chinese mainland, yielding a series of research achievements [1,2,3,4,5,6]. Global Navigation Satellite System (GNSS) reference stations conduct high-time-resolution continuous observations, accumulating decades of observational data that contain abundant information on both crustal and non-tectonic movements [7,8]. In contrast, the periodically observed GNSS campaign stations, though spatially dense, have low time resolution, with approximately 4-day mobile observations conducted every 1–2 years. These limited data makes it difficult to directly separate instantaneous non-tectonic movements from the time series, as is performed with reference stations, thus hindering accurate estimation of station movement velocity [9].
Currently, GNSS nonlinear movement corrections are mainly based on the GRACE model or environmental load data, but they are limited by their resolution and model accuracy, resulting in suboptimal correction effects. Existing research has shown significant spatial correlation between the coordinate time series of adjacent GNSS stations [1]. Previous studies have leveraged this characteristic to improve the estimation of campaign station movement rates, but issues such as insufficient improvement effects or lack of specific analysis remain. For instance, Liang et al. [3] constructed a Delaunay triangulation to apply the annual wave function results of reference stations to campaign stations using inverse distance weighting, thereby correcting for non-tectonic movements at campaign stations. However, there is limited evaluation and analysis of this method’s effectiveness. Zhan et al. [10] used inverse distance weighting interpolation of the annual periodic movement amplitudes of all reference stations within 200 km of campaign stations to solve for the annual movement information of campaign stations and subsequently calculate their movement velocities but did not explain the choice of radius. Liang and Yang [11] attempted to use an established vertical annual movement time-varying field model to obtain annual amplitude and phase information, with varying correction effects and only slight improvements in correction accuracy.
Li et al. [12] comprehensively evaluated methods for obtaining vertical annual periodic movement parameters from GNSS coordinate time series, finding that spatial consistency of vertical annual periodic movements was good among reference stations in Yunnan. Comparative results showed that spatial weighting and multi-kernel function methods were most effective, followed by the GRACE model and environmental load model methods. Therefore, GNSS reference station information can be used to simulate non-tectonic movements at campaign stations, leveraging the correlation between non-tectonic movements at campaign and reference stations to remove non-tectonic movements from campaign station coordinate time series, thereby obtaining more accurate crustal movement velocities. This approach significantly improves estimation accuracy, especially for vertical movement velocities susceptible to seasonal movement influences [13,14,15]. Hence, correcting the estimation of campaign station crustal movement velocities using reference station information has significant scientific and practical value for accurately and reliably solving regional crustal movement velocity fields.
The Yunnan region, located on the southeastern edge of the Tibetan Plateau, is influenced by crustal movements from the Indian, South China, and Burma plates. This region is characterized by active crustal movements, the development of a series of significant active faults, and the occurrence of frequent moderate to strong earthquakes [16]. Additionally, the region experiences abundant rainfall, with annual average precipitation exceeding 700 mm, leading to prominent non-tectonic deformations caused by surface water changes [17]. These factors complicate the accurate and reliable estimation of the crustal movement velocity field in the Yunnan region. Using GNSS reference and campaign station observation data from Yunnan Province during the period of 2011–2020, this paper aims to correct non-tectonic movements potentially present in the coordinate time series of spatially related campaign stations using reference station information, thereby obtaining more precise crustal movement velocities for campaign stations.

2. Data and Methods

2.1. Observation Data

This study uses GNSS stations from the CMONOC in Yunnan Province as an example for the related experimental research. The dataset includes 25 GNSS reference stations and 10 campaign stations. The observation period for the reference stations spans from 2011 to 2020. The campaign stations were observed in 5–6 campaigns during the years 2011, 2013, 2015, 2016, 2017, and 2019, with each campaign lasting approximately 4 days. The distribution of the stations is shown in Figure 1. In Figure 1, the dots represent GNSS reference stations, with the color indicating the data missing rate of each reference station. The average data missing rate for the reference stations is 2.4%, with the highest missing rate being 13.7% at the YNMH station. The red triangles in Figure 1 represent the 10 selected campaign stations.
Furthermore, the coordinate time series data for the reference stations were obtained by processing the raw observational data using high-precision data processing strategies [6], which include error corrections and yield high single-day solution accuracy. For the campaign station data, both virtual and real campaign stations were used in comparative experiments. The coordinate time series for the virtual campaign stations were derived from the reference stations’ coordinate time series but were downsampled to synthesize the actual observation conditions of the campaign stations. Specifically, approximately 4 days of single-day solutions were selected from the reference stations’ coordinate time series every 1–2 years to serve as the experimental data for the virtual campaign stations. In summary, the experimental data are abundant and of high quality, providing reliability for the final results.

2.2. Experimental Methods

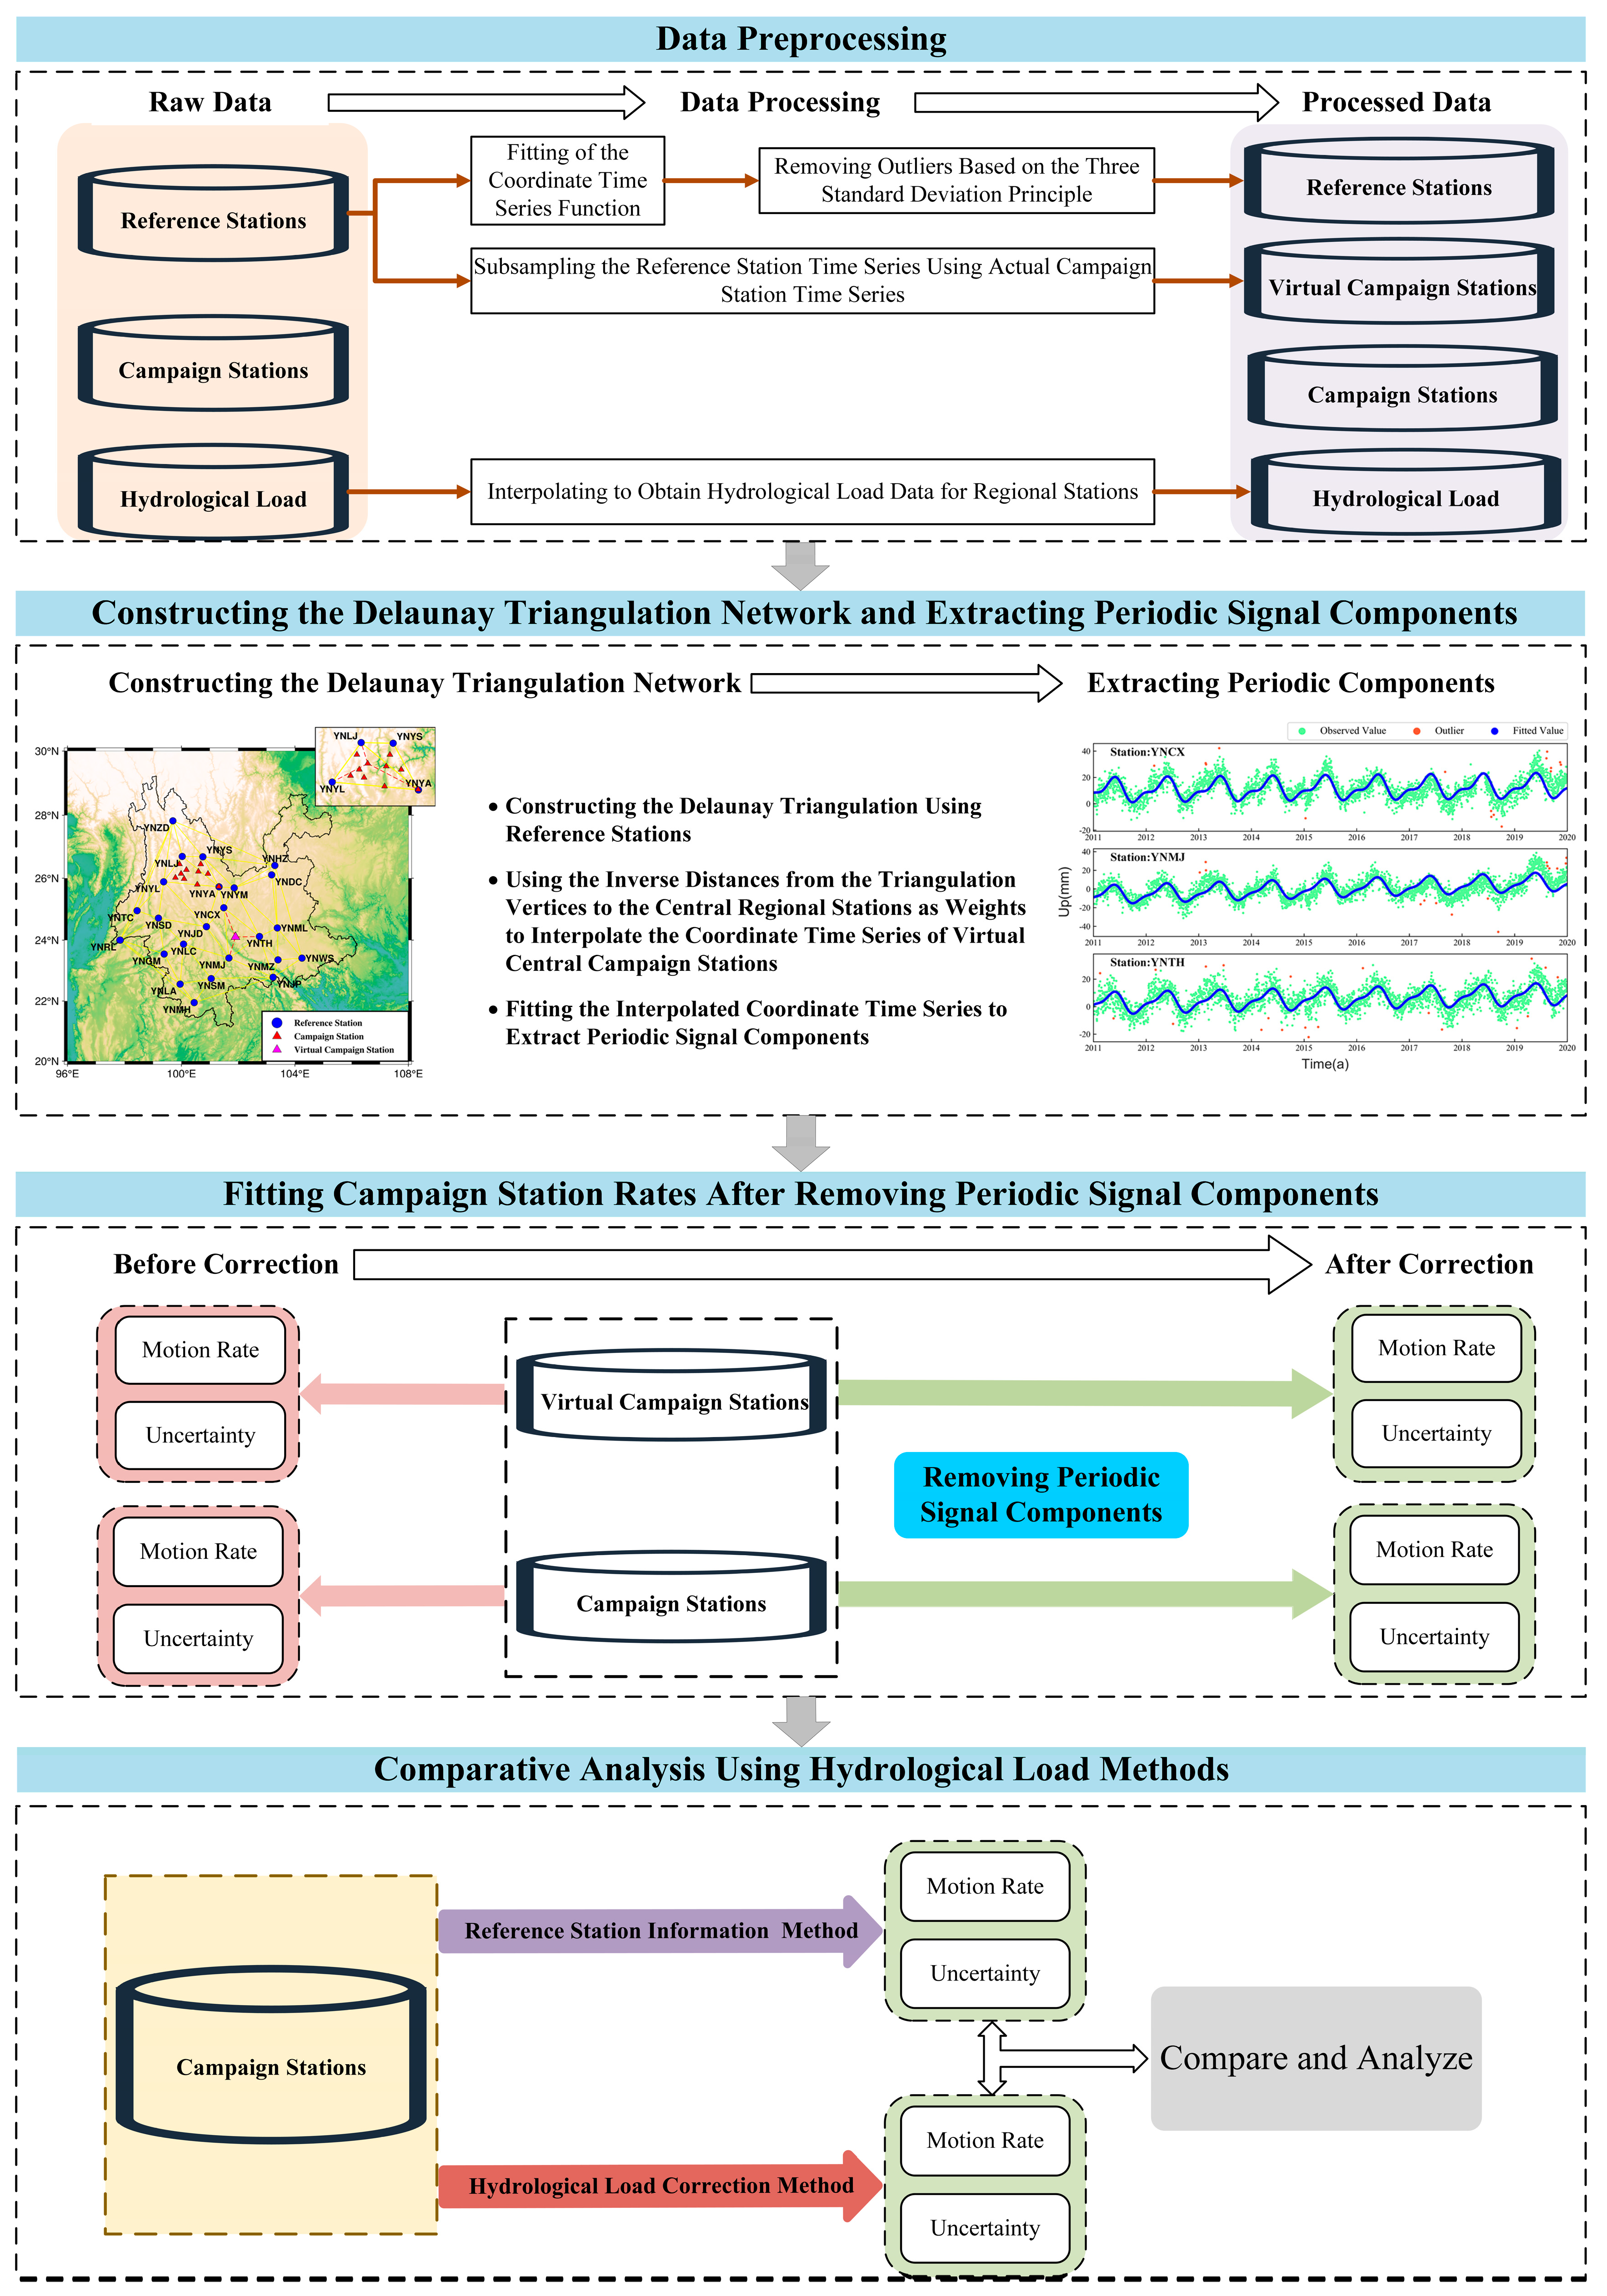
As shown in Figure 2, the technical approach of this study consists of four main components. First, data preprocessing is performed to identify and eliminate outliers in the original coordinate time series of the reference stations. Simultaneously, the coordinate time series of the reference stations undergoes thinning to simulate the observational characteristics of real regional stations, resulting in a coordinate time series for “virtual regional stations” for subsequent comparative analysis.
Next, a Delaunay triangulation is constructed based on the reference stations in Yunnan Province, which is then used to interpolate the coordinate time series of the regional stations. A functional model is fitted to the interpolated series to extract periodic signals. After removing these periodic signals from the regional station coordinate time series, the linear motion rates of the measurement stations are calculated. By comparing the rate estimation accuracy of the virtual regional stations and the real regional stations before and after correction, we evaluate the reliability and effectiveness of the proposed method.
Finally, this study also compares the motion rate estimation accuracy of the regional station sequences before and after correction using the hydrological loading method, followed by analysis and discussion to further demonstrate the stability of the proposed approach.

2.2.1. GNSS Coordinate Time Series Fitting

The GNSS reference station coordinate time series typically includes trend terms caused by crustal movements and periodic information resulting from environmental changes [17,18,19]. The daily solution time series of the coordinate components can be described by Equation (1) [1]:
y i = a + b t i + c sin 2 π t i + d cos 2 π t i + e sin 4 π t i + f cos 4 π t i + j = 1 n g g j H t i T g j + v i
In the equation, t i represents the epoch of the daily coordinate solution; a is the initial position of the station; b is the long-term velocity; c, d, e, and f are the annual and semi-annual periodic motion coefficients of the station; j = 1 n g g j H t i T g j is the jump correction term due to changes such as antenna height variations or coseismic displacements [15]; g j represents the jump amplitude; T g j represents the epoch at which the jump occurs; n g represents the number of jumps; H is the Heaviside function, which is 0 before the jump and 1 after the jump; and v i is the residual of the observed value.
The least squares method is typically used to find the best fit function for the data by minimizing the sum of the squared errors. This approach involves solving for the unknown parameters in Equation (1) to ensure that the sum of the squared errors between the modeled data and the observed data is minimized.
Thus, the matrix equation shown in Equation (2) can be constructed, where the coefficient matrix B, parameter vector X, and observation vector L are defined in Equations (3), (4), and (5), respectively:
V = B X L
B = [ 1 t 1 sin 2 π t 1 cos 2 π t 1 sin 4 π t 1 cos 4 π t 1 H t 1 T g 1 H t 1 T g n 1 t 1 sin 2 π t 2 cos 2 π t 2 sin 4 π t 2 cos 4 π t 2 H t 2 T g 1 H t 1 T g n 1 t 1 sin 2 π t m cos 2 π t m sin 4 π t m cos 4 π t m H t m T g 1 H t 1 T g n ]
X = a b c d e f g 1 g n T
L = y 1 y 2 y m T
The unknown parameters in Equation (2) are solved using the least squares method:
X = B T P B 1 B T P L

2.2.2. Preprocessing of GNSS Coordinate Time Series

Since the raw coordinate time series of the reference stations may contain outliers, the following steps are taken to detect and remove these outliers to minimize their impact on the parameter estimation results:
(1)
Use the least squares method to process the original coordinate time series, obtain the residual sequence matrix v i , and calculate its standard deviation [20]. The standard deviation σ is calculated as shown in Equation (7), where y i and y i ^ are the observed and simulated values of the coordinate time series components, respectively, and n is the number of epochs of observations.
σ = 1 n 1 i = 1 n y i y i ^ 2
(2)
According to the 3 σ criterion, if the residual value between the observed and simulated values at a certain time exceeds ± 3 σ , the observation at that time is considered a gross error and should be eliminated [21].
(3)
Repeat steps 1 and 2 until all values in the residual time series are within ± 3 σ . After completing the gross error detection and elimination, use the Regularized Expectation-Maximum (RegEM) algorithm to fill in the missing data in the original coordinate time series of the reference station [22].

2.2.3. Estimation of Non-Tectonic Motion Signals at Campaign Stations

Inverse Distance Weighted (IDW) interpolation is a commonly used spatial interpolation method. Due to its simple principle, easy computation, and adherence to the first law of geography [23,24], it is widely used in the processing of GNSS coordinate time series. The algorithm uses the inverse of the distance between the interpolation point and the sample points as weights, with closer sample points given higher weights. In this study, a Delaunay triangulation is constructed based on the locations of the reference stations. In the triangulation, the vertices of the triangles are the sample points, and the interior points are the interpolation points. The periodic information at the campaign stations is interpolated using the periodic information at the vertices of the triangles according to the IDW algorithm [25].
The influence of the sample points (reference stations) on the interpolation points (campaign stations) is measured by the distance between them. The closer the sample point is to the interpolation point, the higher the weight it is given. The weights decrease as the distance increases, which is why this method is called Inverse Distance Weighted interpolation [26,27]. The calculation is as follows:
y i O = P 1 × y i A + P 2 × y i B + P 3 × y i C
In the equation, O represents the interpolation point, and A, B, C are the sample points. The weight calculation formula is as follows:
P i = 1 d i i = 1 3 1 d i
After interpolating the coordinate time series of the campaign stations using the reference station information, Equation (1) is still employed for fitting. Since the periodic motion parameters c, d, e, and f in the equation are obtained through fitting, and the jump parameters are determined and corrected using station observation logs during the reference station processing, the periodic motion information of the campaign stations can be solved using these parameters. By subtracting the periodic components from the original campaign station data, the periodic terms in Equation (1) can be disregarded. Thus, the crustal movement velocity of the campaign stations can be solved using the least squares method with the parameters a and b.

3. Results and Analysis

3.1. Analysis of Reference Station Coordinate Time Series

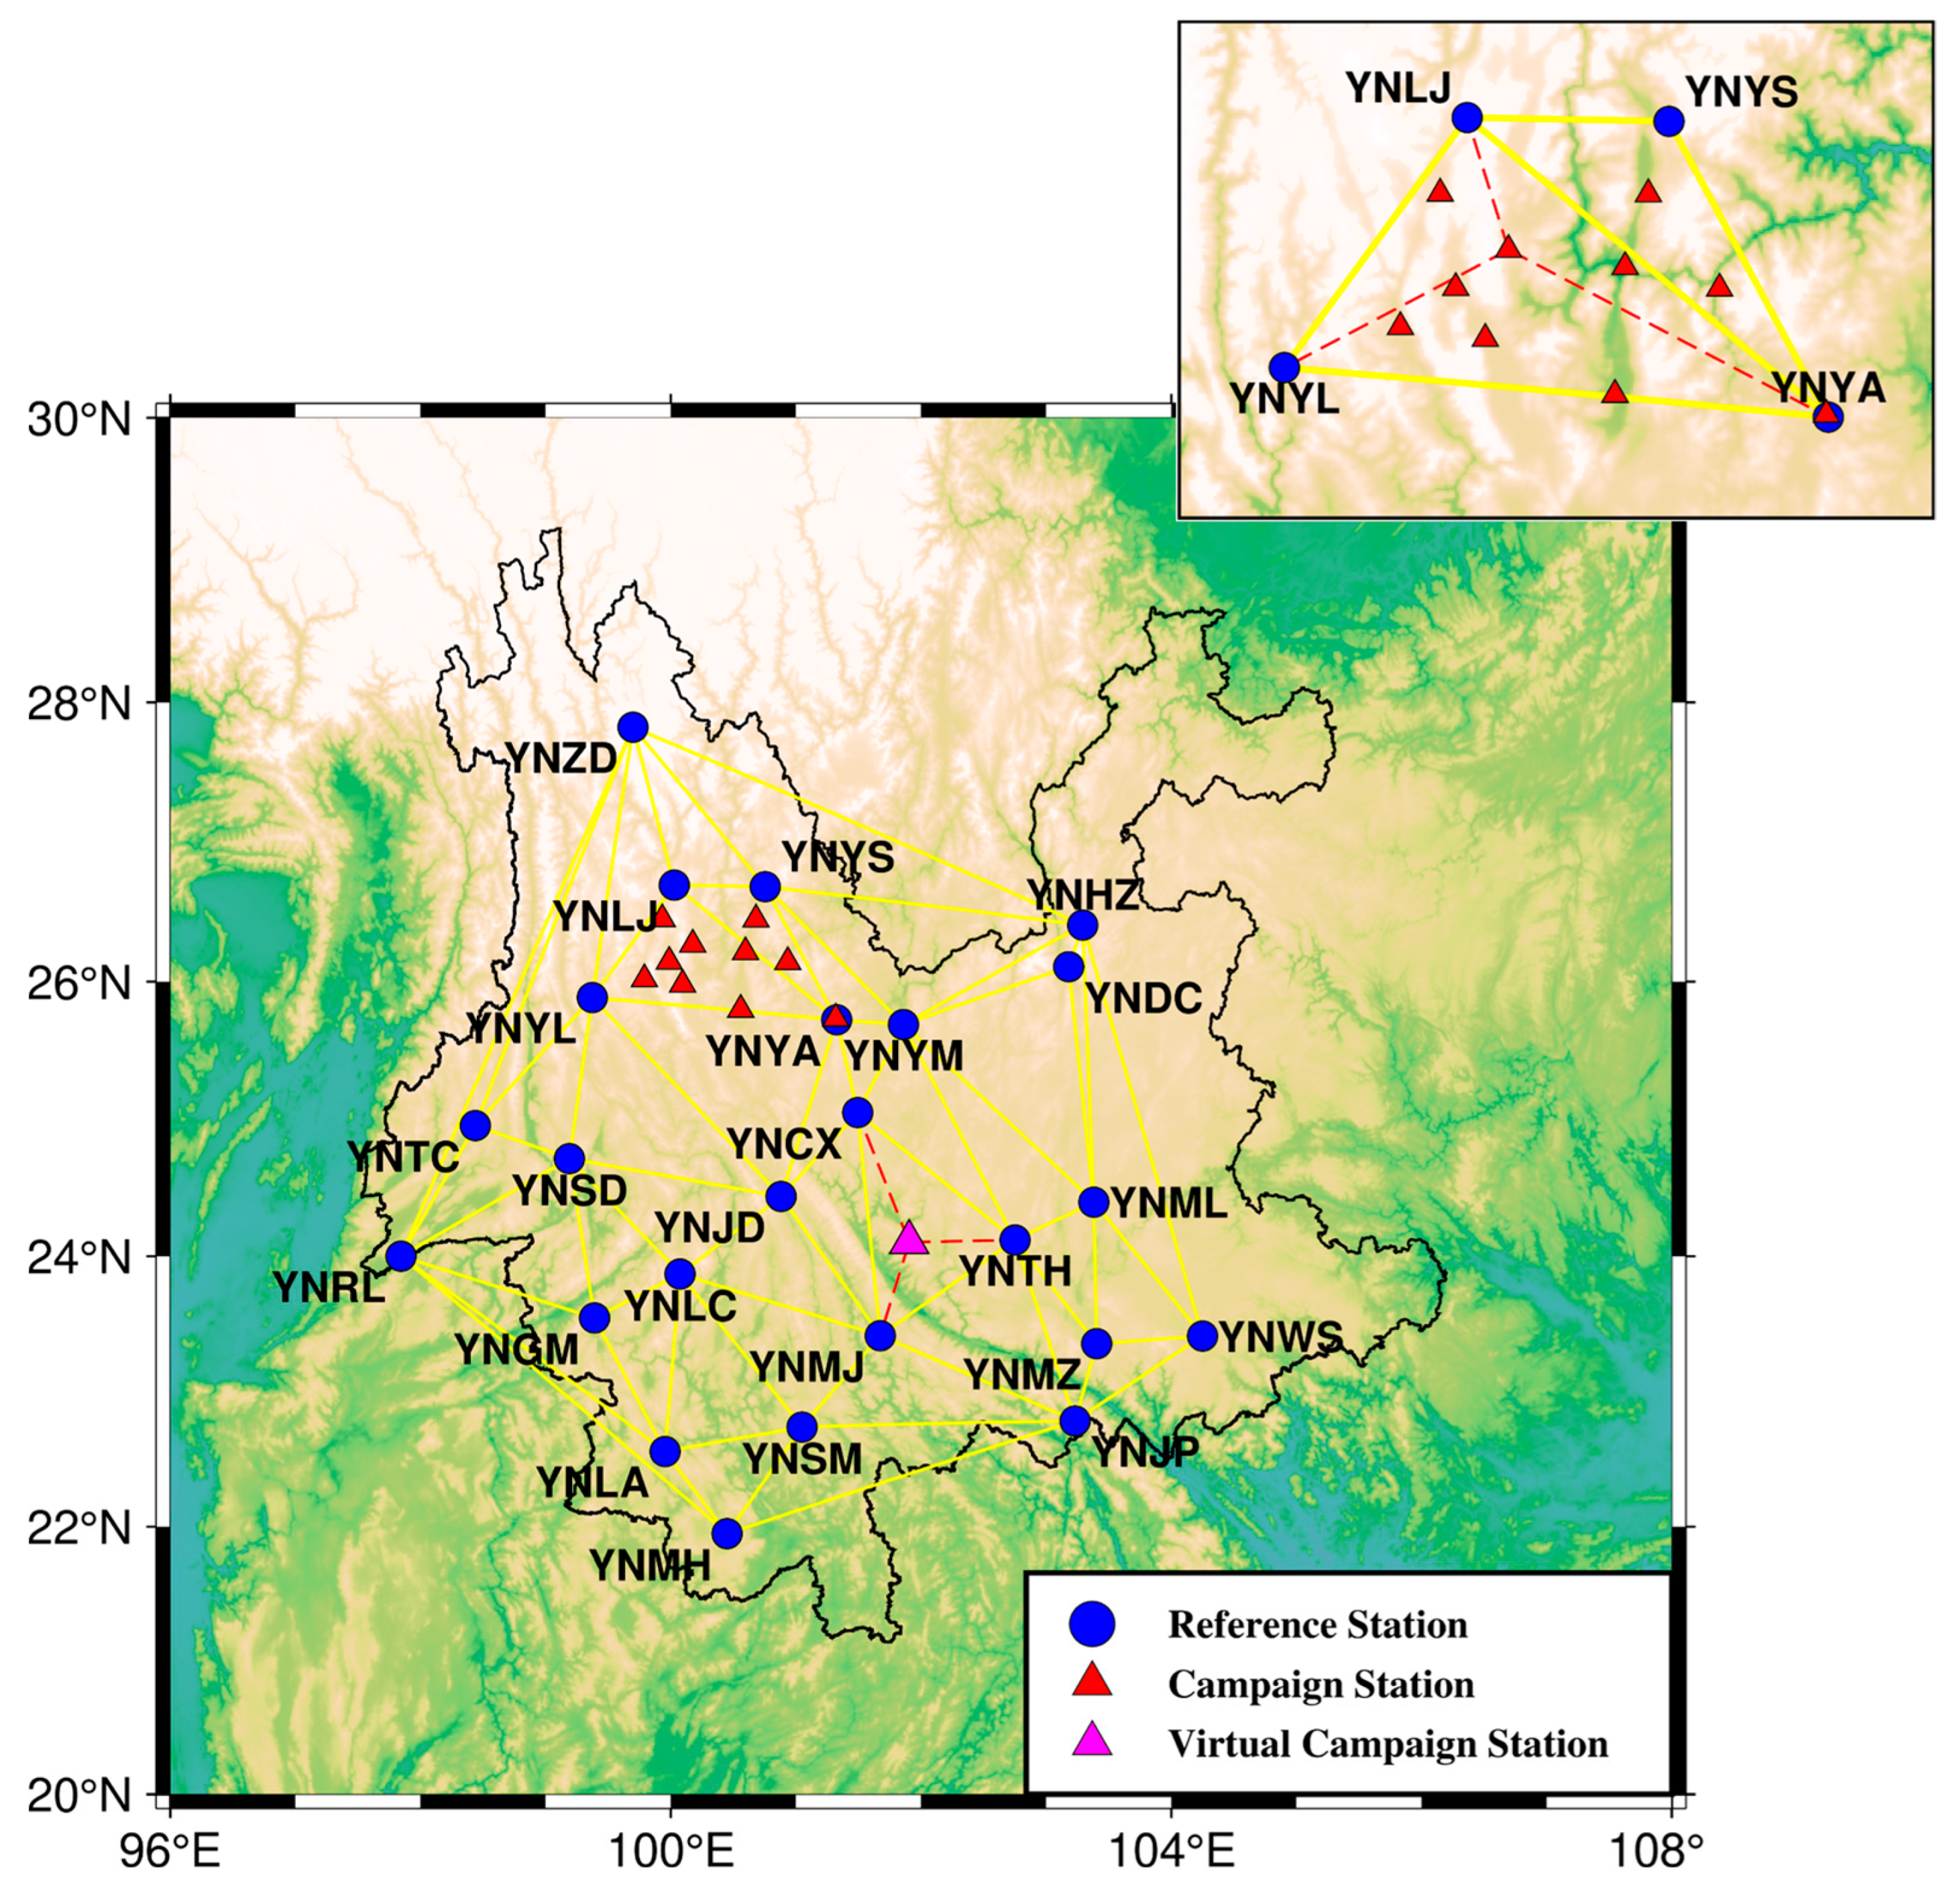
The distribution of GNSS reference stations in Yunnan Province and the constructed Delaunay triangulation are shown in Figure 2. The reference stations YNCX, YNTH, and YNMJ form a triangulation, with the YNXP station inside this network regarded as a virtual campaign station. The real campaign stations are distributed within the triangulation formed by the four reference stations YNLJ, YNYS, YNYL, and YNYA.
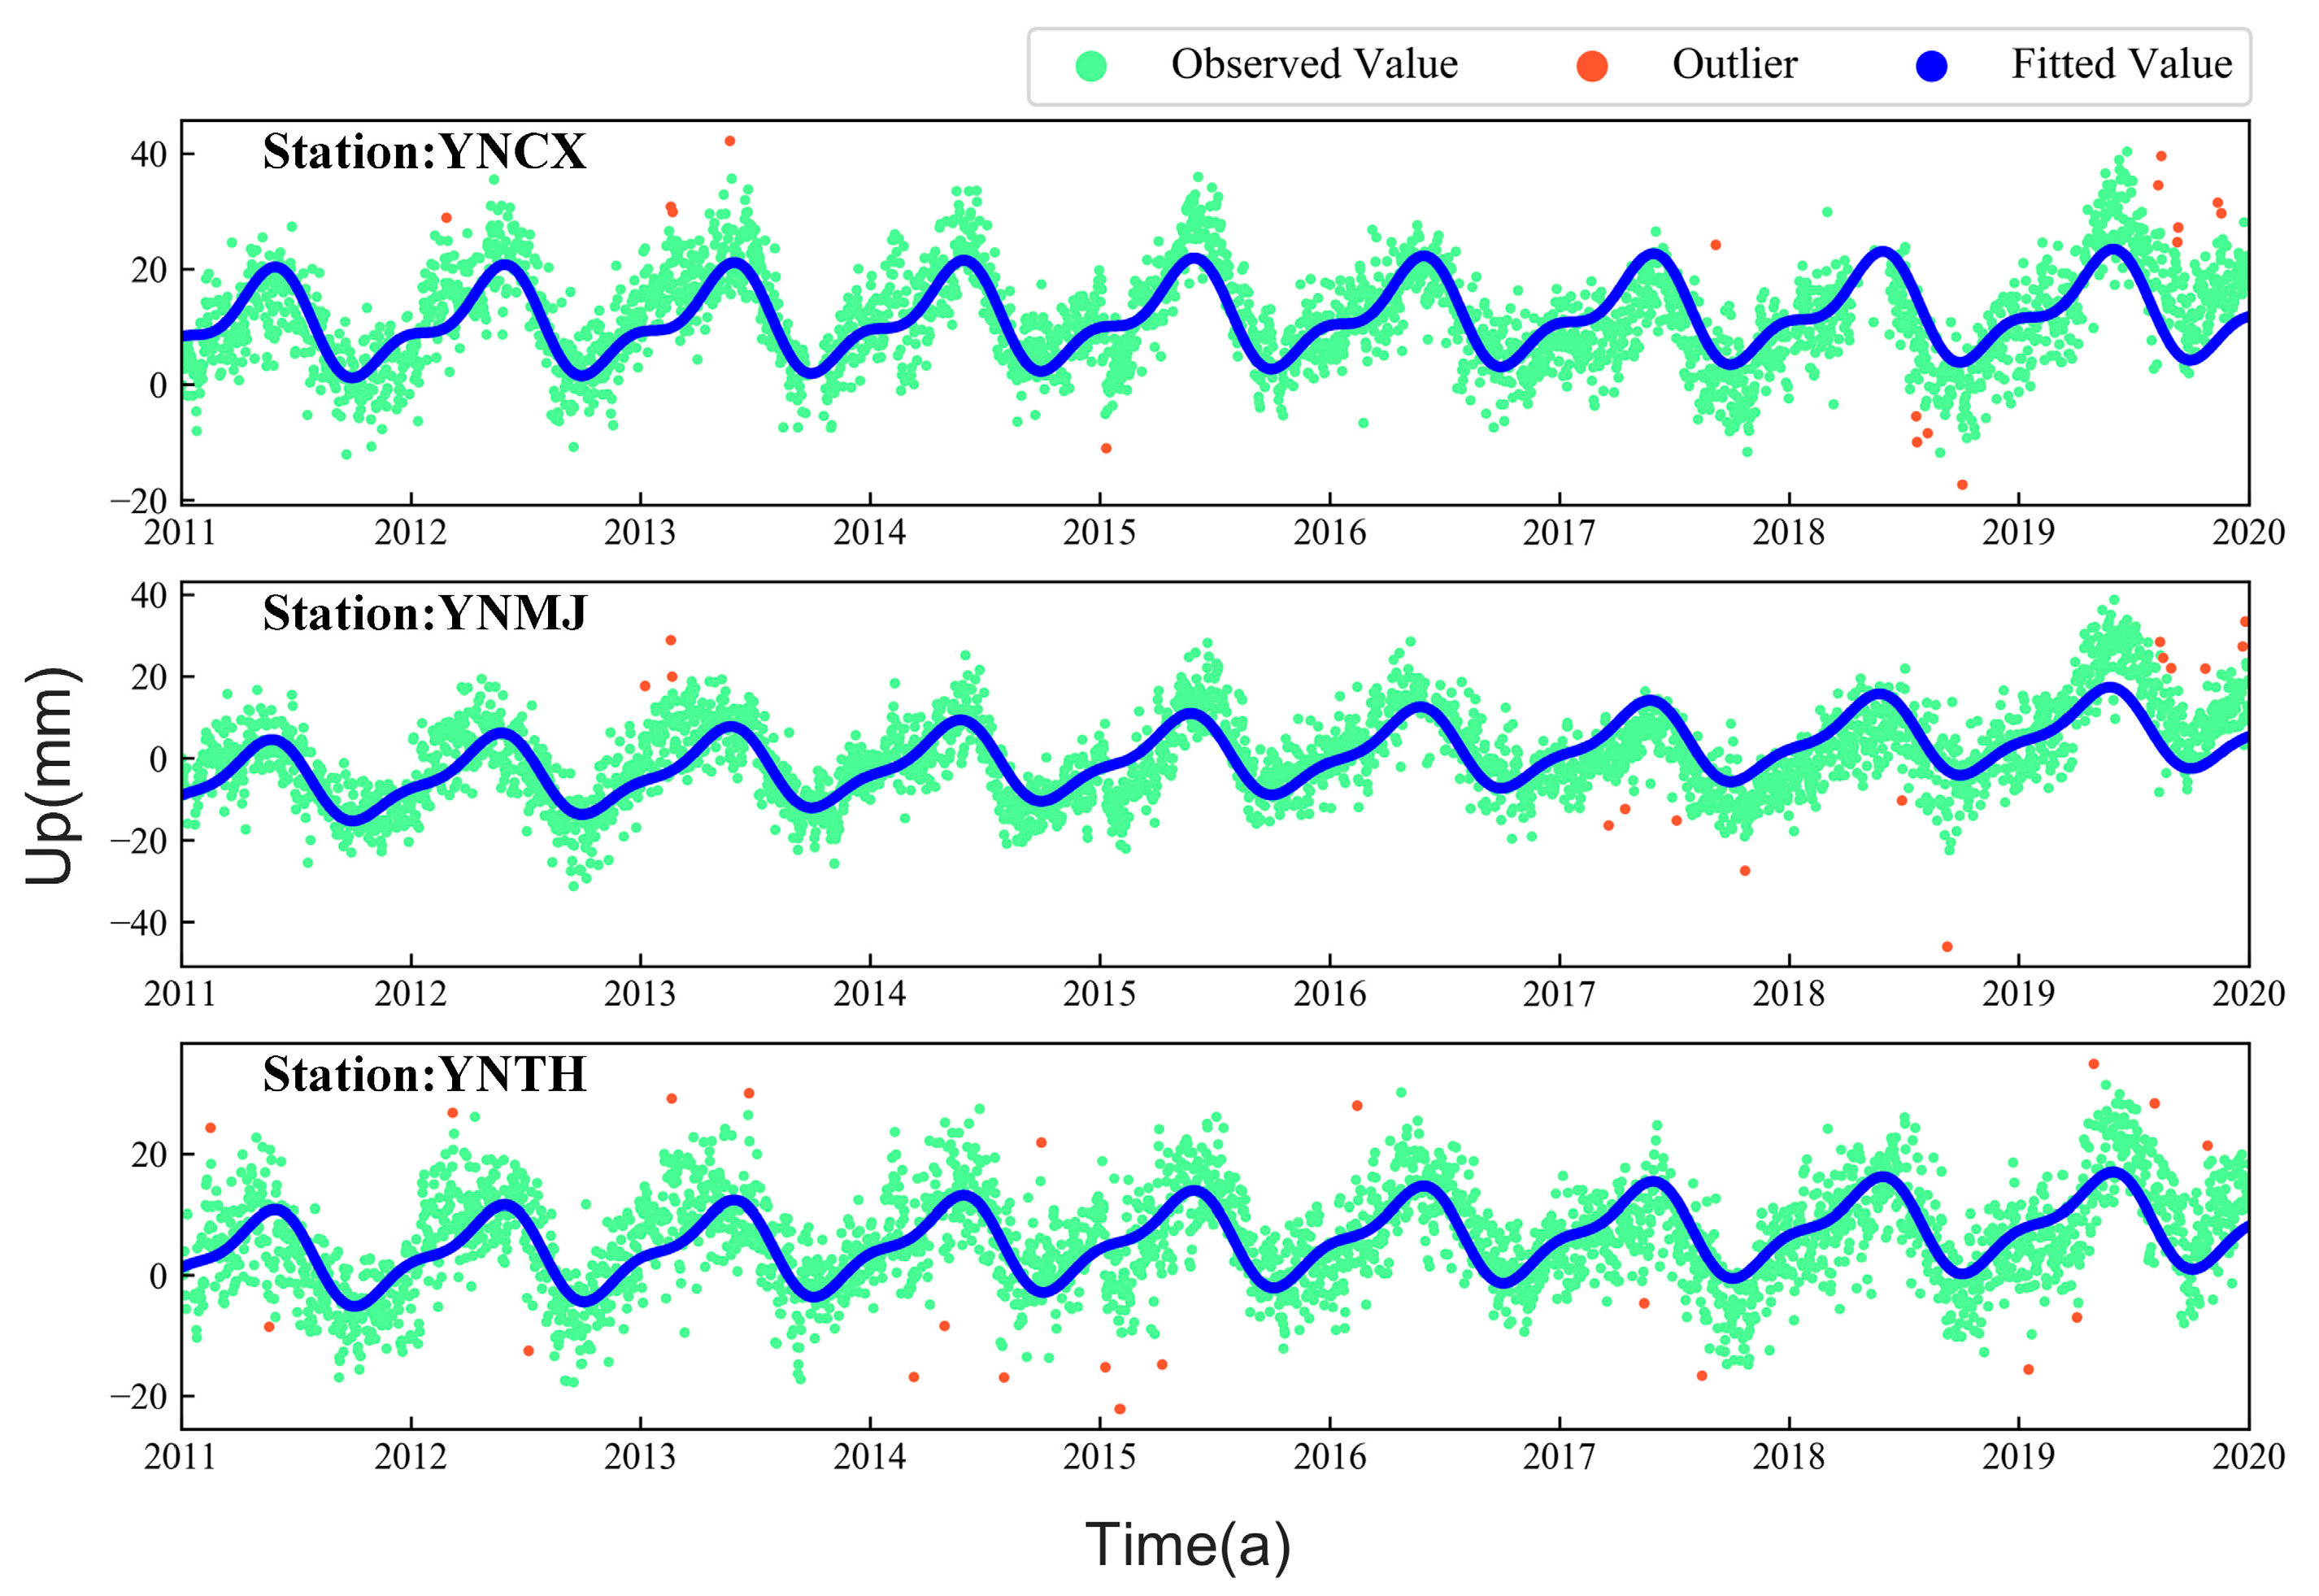
As an example, using the triangulation identified in Figure 3, the vertical coordinate time series of the three reference stations after gross error detection and data completion processing are shown in Figure 4.
From Figure 4, it can be observed that the vertical coordinate time series of the three reference stations exhibit significant periodic motion and strong spatial correlation. Therefore, the interior region of the triangulation formed by these three reference stations should also exhibit a similar spatial correlation. That is, the campaign stations within this area also experience periodic motion, with the amplitude being controlled by the periodic motion amplitude of the reference stations on the triangulation.

3.2. Analysis of Virtual Campaign Station Results

Within the triangulation formed by the three reference stations YNCX, YNTH, and YNMJ, this study interpolates the periodic motion of the “virtual campaign station” YNXP using IDW method. Here, weights are assigned to the three reference stations based on their distances from the YNXP station, with closer reference stations given larger weights. The weights are 0.27, 0.38, and 0.35, respectively, as detailed in Table 1.
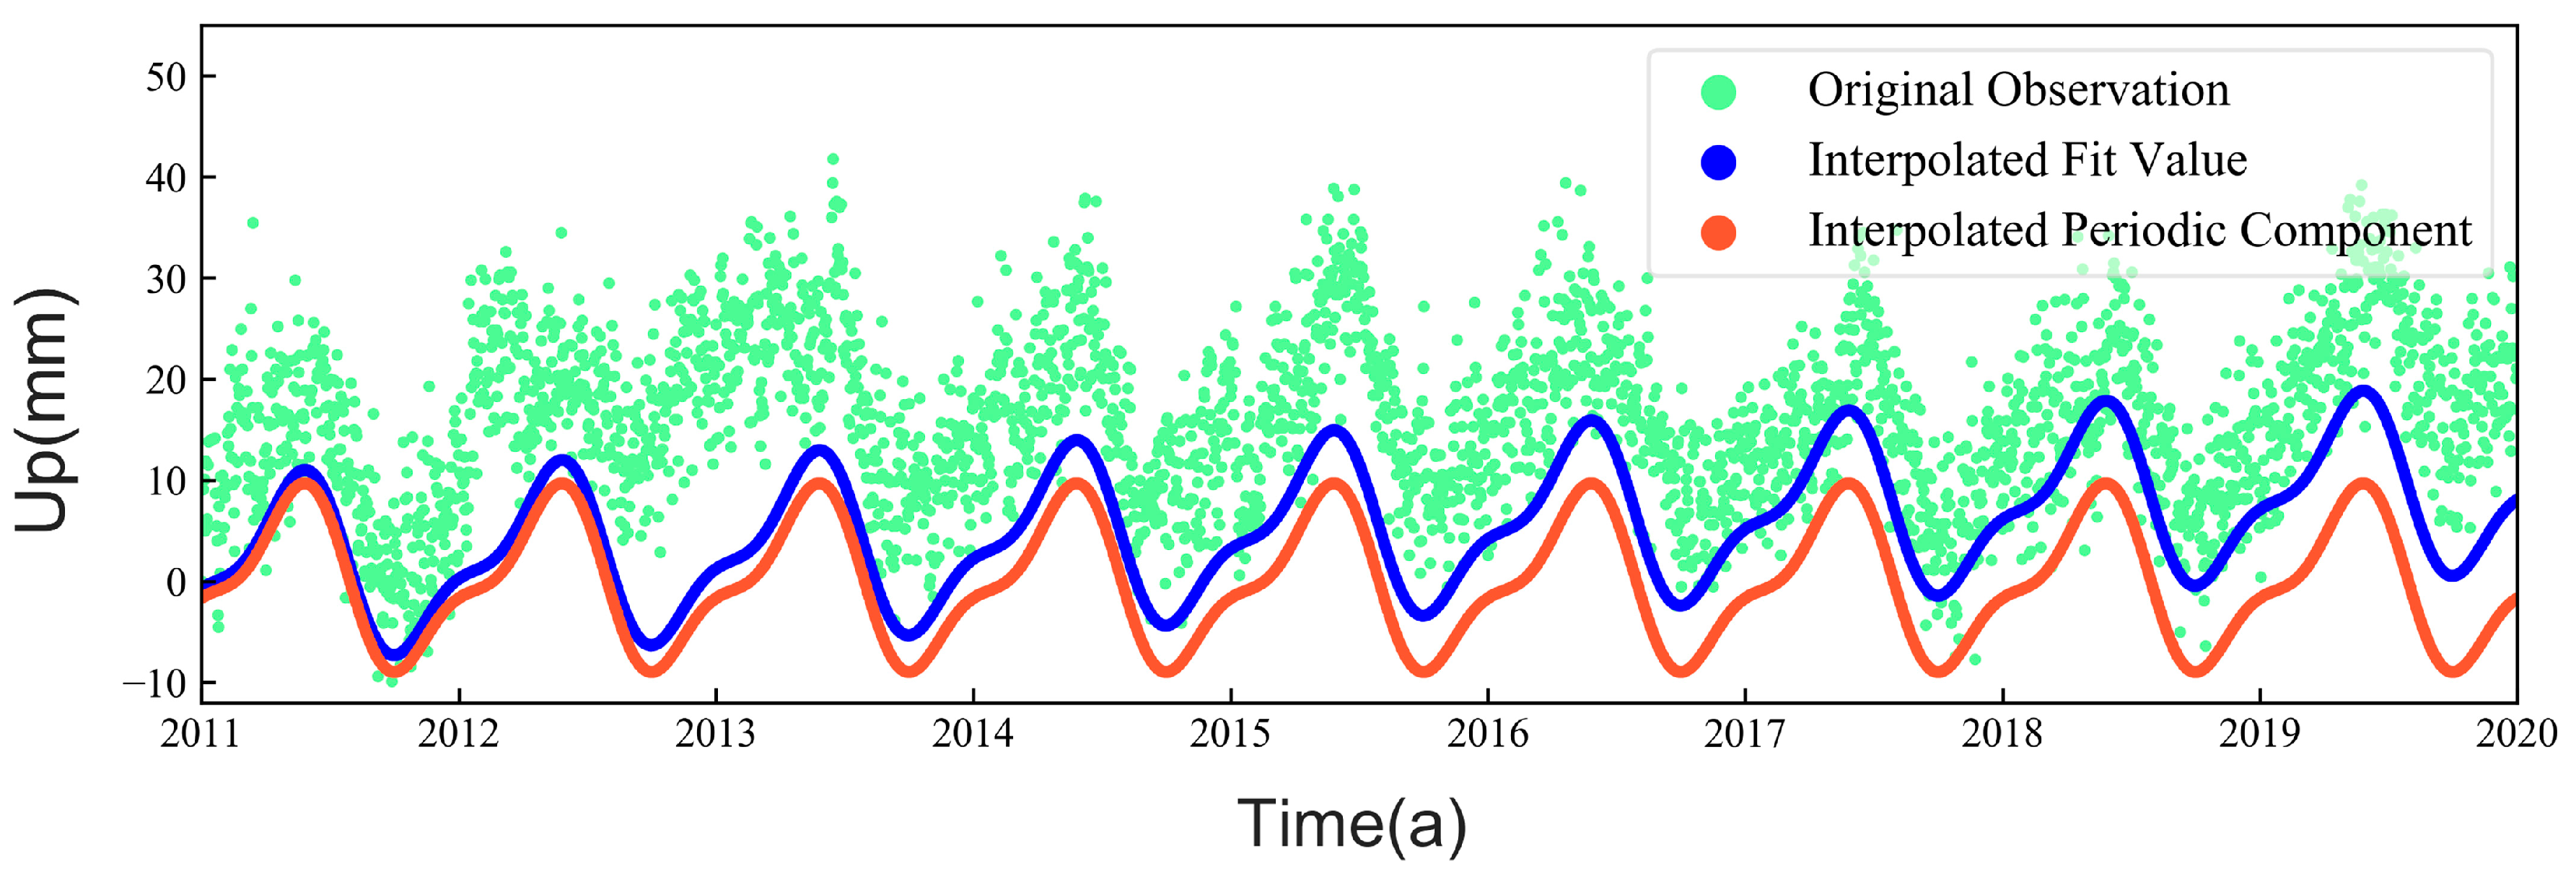
The periodic motion of the “virtual campaign station” YNXP interpolated from the reference stations in its triangulation is shown in Figure 5. To evaluate the reliability of the interpolation results, the original vertical coordinate series of the YNXP station (shown as green dots in Figure 5) is compared with the function fitting series of the interpolation results (shown as the blue curve in Figure 5) and the periodic terms derived using Equation (1) (shown as the red curve in Figure 5). It can be seen that there is good periodic consistency between the interpolation results and the simulated results, with only some differences in amplitude.
In addition, in this study, we performed periodic term correction on the sparsified vertical coordinate time series of the virtual campaign station YNXP to verify the effectiveness of the proposed method in correcting its motion rate. As shown in Figure 6, before correction, the original time series values mainly range between 10 and 30 mm, with a calculated vertical motion rate of −0.56 ± 0.64 mm/a. After correction, the time series values range between −10 and 10 mm, with the rate changing to 1.54 ± 0.46 mm/a, and the precision of the rate estimation improves. This indicates that periodic term correction reduces the divergence of the campaign station series and effectively improves the estimation of the campaign station’s motion rate.
To validate the effectiveness of the proposed method, additional virtual campaign stations such as YNMZ, YNDC, YNLJ, and YNMJ were selected for similar testing. The impact of periodic term correction on the velocity estimates of these stations is shown in Table 2 and Figure 7. The vertical velocity values of each station changed before and after correction, with most stations showing changes in the range of 0.5–1.5 mm/a. The precision of the velocity estimates improved after the correction, with an increase ranging from 10% to 36%, averaging about 24.4%. This demonstrates that in the estimation of virtual campaign station velocities, applying periodic term correction not only eliminates biases caused by periodic terms but also significantly improves the precision of velocity estimates.

3.3. Analysis of Real Campaign Station Results

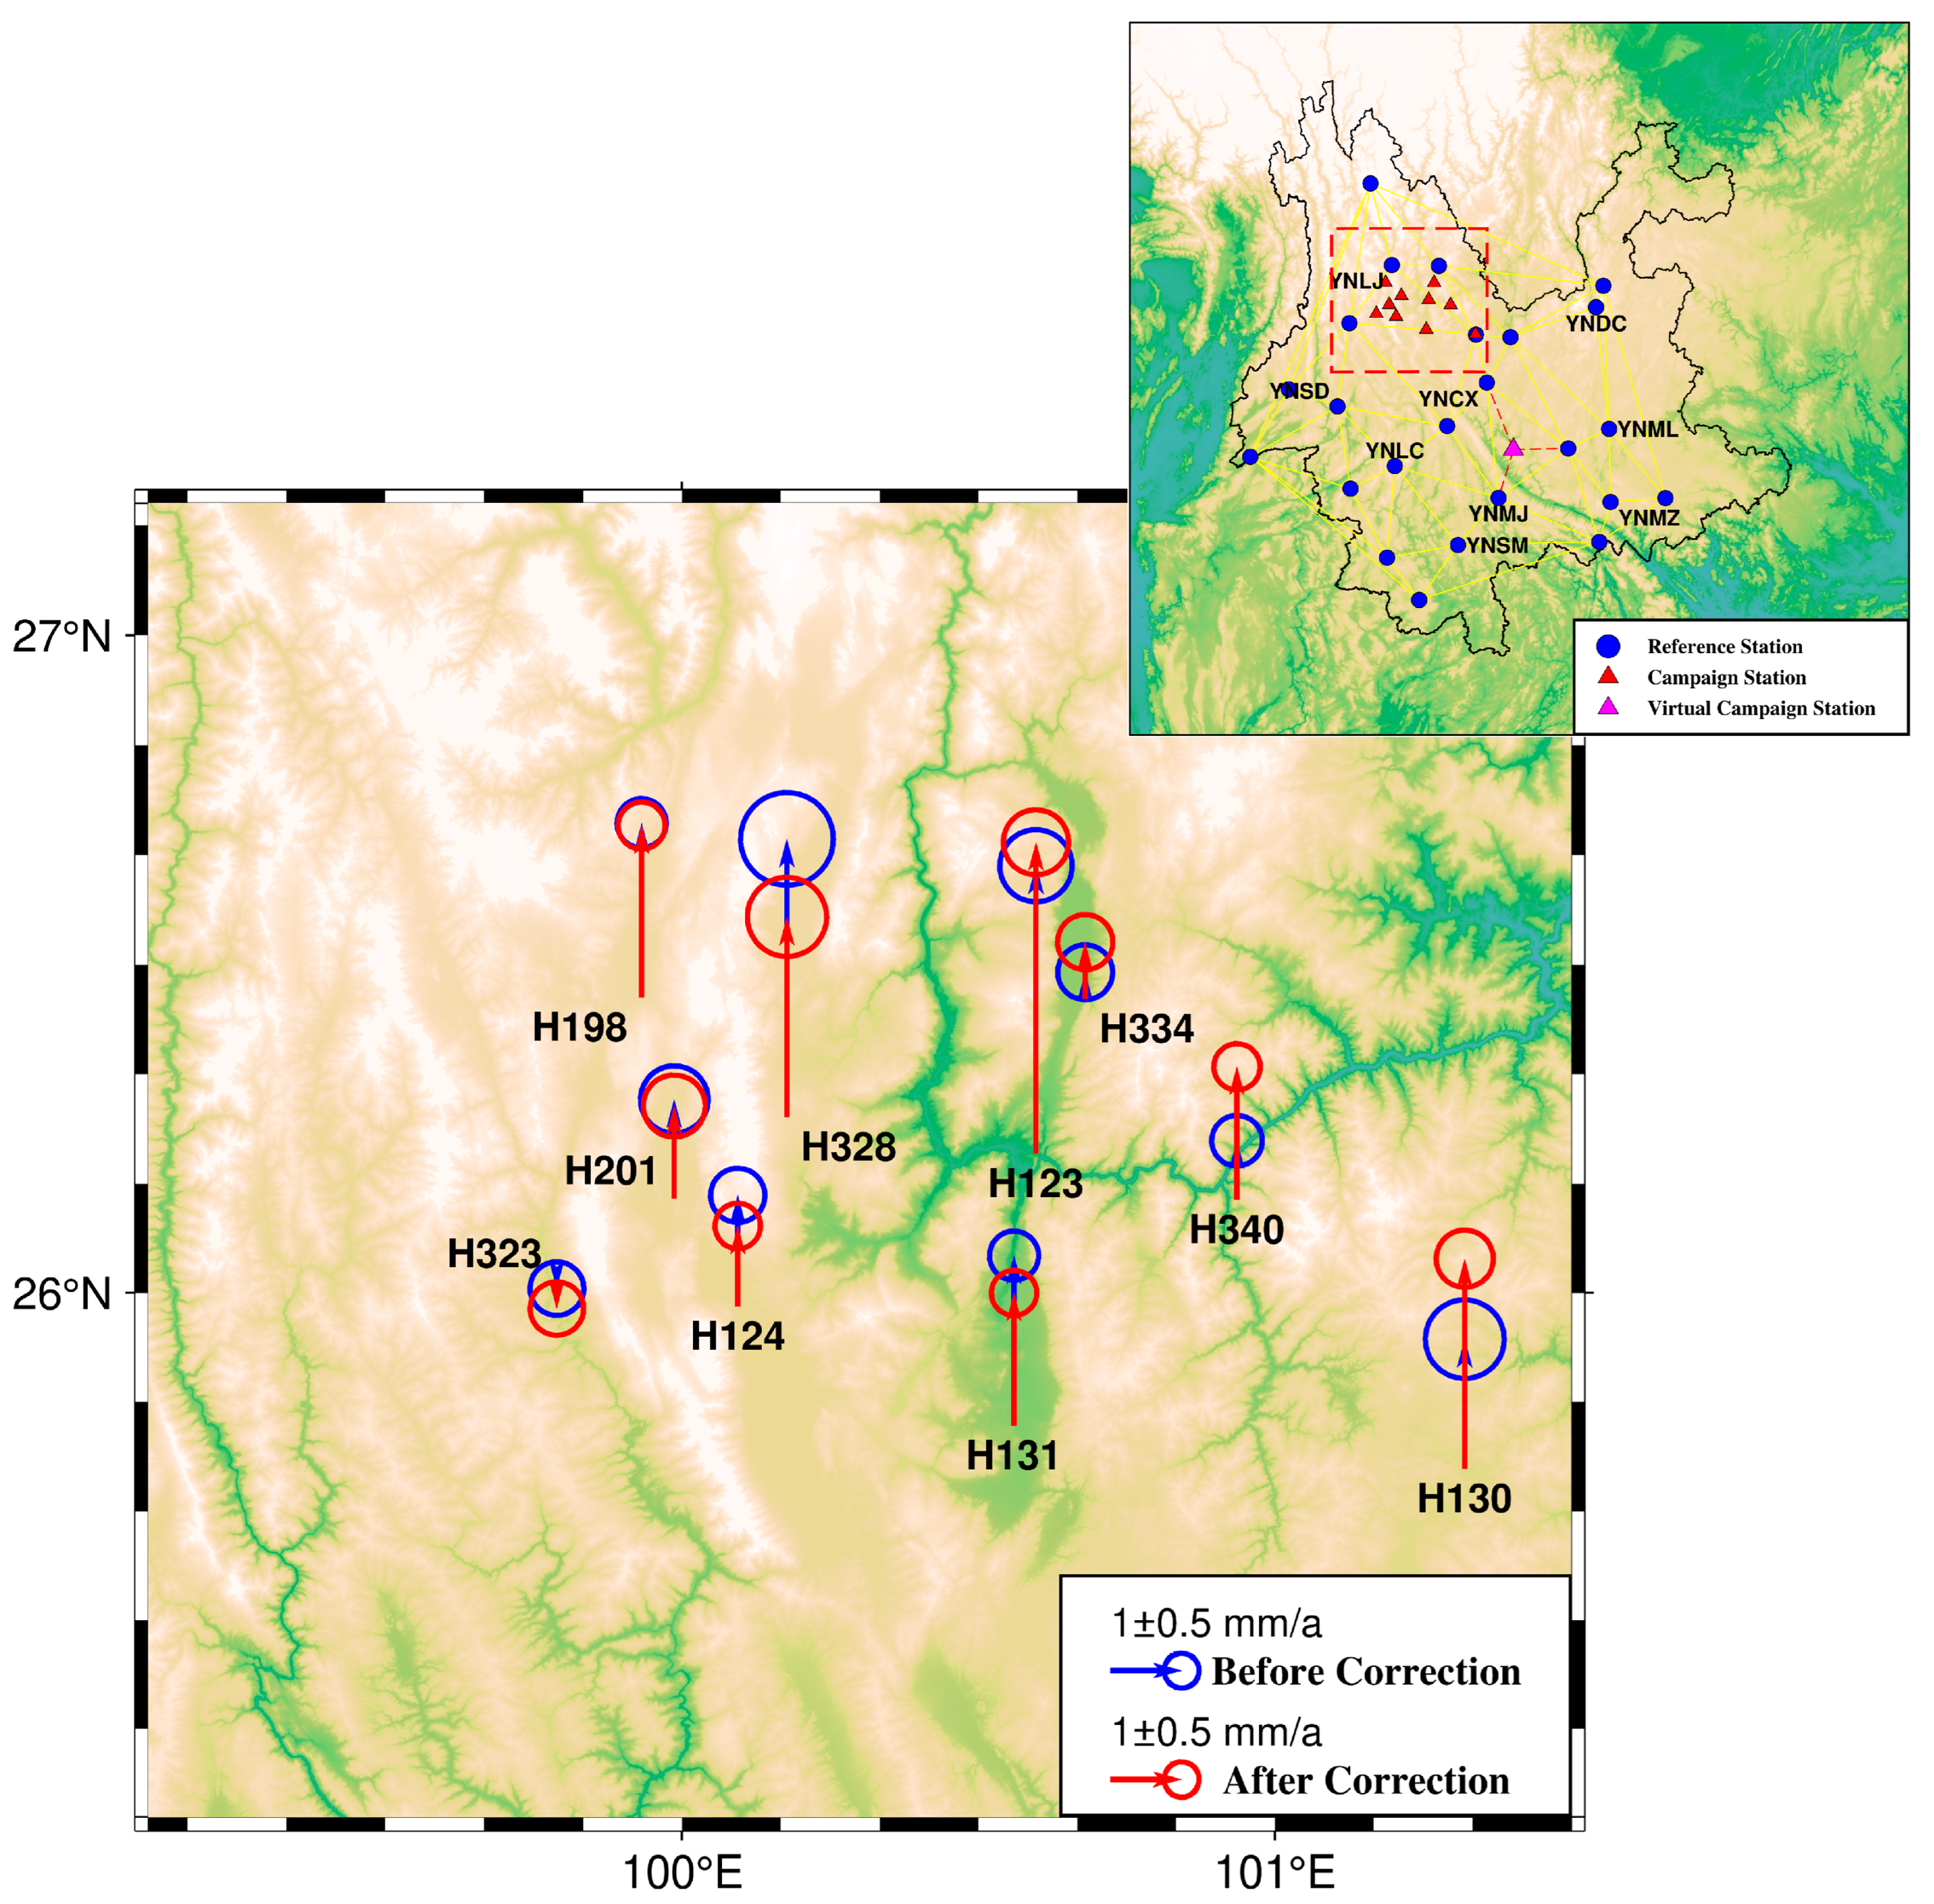
In this study, the effectiveness of the correction method was further validated for real campaign stations within the two triangulations formed by the four reference stations YNLJ, YNYL, YNYA, and YNYS. As shown in Figure 3, the red stations are the campaign stations, with the red dashed lines in the inset indicating the connections from the campaign station H328 to the YNLJ, YNYL, and YNYA stations. The weights calculated using the Inverse Distance Weighting method are 0.52, 0.28, and 0.20, respectively. The vertical coordinate series of H328 was interpolated using the reference stations in its triangulation, and the periodic terms were fitted accordingly. The original time series of H328 was then corrected for periodic terms to validate the effectiveness of the proposed method in correcting the motion rate of real campaign stations.
As shown in Figure 8, before correction, the original time series values mainly ranged from −10 to 40 mm, with a calculated vertical motion rate of 4.35 ± 1.48 mm/a. After the correction, the time series values mainly ranged from −10 to 30 mm, with the rate changing to 3.13 ± 1.26 mm/a, and the precision of the rate estimate improved by 14.7%. This demonstrates that periodic term correction also has a good correction on the motion rate estimation of real campaign stations.
To further validate the effectiveness of the proposed method for real campaign stations, additional stations such as H123, H124, H131, and H198 were selected for similar experiments. The impact of periodic term correction on the velocity estimates of these stations is shown in Table 3 and Figure 9. The vertical velocity values of each station changed before and after correction, with changes ranging from approximately 0.1 to 1.2 mm/a. The precision of the velocity estimates improved after correction, with an increase ranging from 0% to 27%, averaging about 9.6%. This indicates that in the estimation of real campaign station velocities, applying periodic term correction can also eliminate biases caused by periodic terms and improve the precision of the velocity estimates to some extent.
The test results for the 10 real campaign stations are shown in Table 3. Among these stations, eight stations showed a significant improvement in vertical velocity precision after periodic term correction. Notably, station H130, which is very close to the reference station YNYA, exhibited a high correlation with YNYA, resulting in a correction effect superior to other campaign stations, with a precision improvement of 27%. Additionally, the precision of H323 improved by 0.36%, and the precision of H334 decreased by 0.49%, indicating that the precision remained only slightly changed before and after correction. This means that 80% of the campaign stations achieved a good correction in vertical motion estimation, validating the effectiveness of the proposed method.
Considering that GNSS coordinate time series contain various environmental load information, previous studies applied Independent Component Analysis (ICA) to decompose atmospheric, soil moisture, and other environmental load signals from vertical coordinate time series [14], which show a high correlation with real environmental load signals. The Sichuan–Yunnan region experiences abundant rainfall, making hydrological loading the main component of non-tectonic information [20], with dominant vertical periodic signals at the stations. To compare with the correction effect of the proposed method, we used hydrological load data provided by the German Research Centre for Geosciences (GFZ) to correct the non-tectonic motion signals of the campaign stations. The results before and after correction are shown in Table 3.
From Table 3, it is evident that the vertical velocity values of each station changed before and after correction, with changes ranging from approximately 0.1 to 1.5 mm/a. The precision of the velocity estimates improved for most stations after correction, with an increase ranging from −13% to 26%, averaging about 8.2%. However, compared to the method proposed in this paper for improving campaign station rate estimation based on reference station information, its correction effect is slightly inferior, thereby further validating the reliability and effectiveness of our proposed method.

4. Discussion

The proposed method was applied to both virtual and real campaign stations, yielding satisfactory correction results in both cases. The interpolated series showed good periodic consistency with the original coordinate time series, with only some differences in amplitude. The correction significantly reduced the divergence of the campaign station series.
To compare the effectiveness and reliability of the proposed method, we considered the significant rainfall in Yunnan Province and its strong correlation with the vertical coordinate time series [28]. We used hydrological load data to remove non-tectonic signals from the vertical coordinate time series of campaign stations [29,30], which also yielded good results. However, since hydrological load only accounts for part of the periodic signal in the coordinate time series, many residual non-tectonic signals remained after correction. Therefore, although the station data in Yunnan showed a good correlation with environmental loads, the correction effect was unstable; some stations showed good correction results, while others showed poor results, with even a decrease in precision.
In contrast, the proposed method demonstrated stable correction effects, with most campaign stations showing improved precision in vertical motion velocity estimation, and other stations maintaining their precision before and after correction. Overall, the proposed method outperformed the environmental load correction method. However, this method requires certain conditions: the motion between campaign stations and adjacent reference stations must have a strong spatial correlation. If the correlation between the reference station and the campaign station is weak, the interpolation results for the campaign station may have large errors, potentially leading to inaccurate periodic information estimation and affecting the correction results. Inaccurate fitting results of the reference station’s periodic information can also lead to inaccurate interpolation information, thus affecting the precision improvement after correction.
To explore the spatial consistency of vertical periodic motion within the region, we also examined the radius of 200 km used in the experiment by Zhan et al. [10] for correcting the vertical velocity of campaign stations. Using the campaign station as the center, we sequentially used the 1 to 25 nearest reference stations within Yunnan Province for IDW interpolation to correct the vertical velocity estimation of the campaign station. The experimental results can be broadly categorized into two types: the first type shows a gradual improvement in correction effect as more reference stations are included, while the second type shows a gradual decline in correction effect as more reference stations are included.
For the first type, it is possible that the periodic information interpolated becomes more accurate as more reference stations are included, thereby improving the correction effect. For the second type, it is possible that the campaign station has a higher correlation with the first one to two reference stations included in the calculation. Further increasing the number of reference stations introduces less correlated information into the interpolated periodic terms. Figure 10 shows typical stations for both types of results: stations H340 and H131 belong to the first type, while stations H130 and H123 belong to the second type. From the correction effects of the two types of results, it can be seen that within a 200 km radius, the proportion of precision improvement in velocity estimation is roughly at the median position, making it suitable for most stations. However, this requires the involvement of many reference stations, making the calculation complex and potentially introducing information from stations with low periodic consistency.
In contrast, the proposed method constructs a Delaunay triangulation with the station within it having a similar motion background, and it only requires selection of three reference stations with a proper spatial resolution to achieve a relatively accurate correction effect.

5. Conclusions

To address the issue of low precision in solving the vertical velocity field of campaign stations due to limited data and the influence of non-tectonic movements, this paper proposes a method for improving the precision of campaign station velocity field estimation by constructing a triangulation network. Using vertical motion as an example, we performed least squares fitting of the periodic terms interpolated from the coordinate time series of campaign stations. The periodic terms were then subtracted from the original coordinate time series within the triangle, enhancing the precision of campaign station velocity field estimation. The following conclusions were drawn:
(1)
Virtual campaign stations: After correcting the coordinate time series of virtual campaign stations, the precision of velocity estimation improved for all virtual campaign stations. The range of improvement percentages was 10–36%, with an average improvement of 24.4%, indicating a significant correction effect.
(2)
Real campaign stations: After correcting the coordinate time series of the real campaign stations, 9 out of 10 campaign stations showed improved precision in vertical motion velocity estimation. One station’s precision decreased by 0.49%, with an overall average precision improvement of approximately 9.6%. In contrast, the correction results using the environmental load method were unstable, with only six stations showing improved precision and an overall average improvement of about 8.2%.
(3)
Comparison between virtual and real stations: The improvement effect for virtual campaign stations was better than for real campaign stations. This is because the virtual campaign stations’ time series were obtained by downsampling the reference station coordinate time series, resulting in higher estimation precision compared to the campaign stations. Therefore, the daily solution precision of the campaign stations also affects the effectiveness of this method.
In summary, this paper proposes a method for correcting the vertical velocity estimation of campaign stations using the motion information of reference stations with strong spatial correlation. This method effectively eliminates the bias caused by neglecting periodic information in traditional campaign station velocity estimation and significantly improves the precision of regional velocity estimation. This has important application value and scientific significance for accurately solving the regional crustal motion velocity field. To further improve the velocity estimation of campaign stations, it is necessary to continue exploring the spatial correlation of motion between regional and reference stations. This paper only presents a method for improving the non-tectonic information of campaign stations by interpolating periodic terms within a triangulation network. Future work will consider more complex periodic information models and their impact on the precision of campaign station estimation.

Author Contributions

Conceptualization, K.D.; methodology, K.D.; validation, J.J. and G.L.; formal analysis, J.J., K.D. and G.L.; data curation, J.J. and G.L.; writing-original draft preparation, J.J.; writing-review and editing, J.J. and K.D.; visualization, J.J. and G.L.; supervision, K.D.; funding acquisition, K.D. All authors have read and agreed to the published version of the manuscript.

Funding

This work was supported by the Natural Science Foundation of China (Grant No. 42174012).

Data Availability Statement

GNSS data utilized in this study were sourced from the Crustal Movement Observation Network of China (CMONOC) (accessible at https://data.earthquake.cn/index.html, accessed on 30 June 2022)The hydrological load data were obtained from the Helmholtz-Centre Potsdam—GFZ German Research Centre for Geosciences (accessible at http://esmdata.gfz-potsdam.de:8080/repository/entry/show?entryid=24aacdfe-f9b0-43b7-b4c4-bdbe51b6671b, accessed on 15 September 2023).

Acknowledgments

We thank CMOMOC for providing the GNSS data and GZF for sharing their hydrological products. We also thank editors and three anonymous reviewers for their valuable comments to improve the manuscript. Some of the figures were prepared using the GMT graphics package [31].

Conflicts of Interest

The authors declare no conflicts of interest.

References

  1. Xie, S.M.; Pan, P.F.; Zhou, X.H. Research on Common Mode Error Extraction Method for Large Spatial Scale GPS Networks. Geomat. Inf. Sci. Wuhan Univ. 2014, 39, 1168–1173. [Google Scholar] [CrossRef]
  2. Jia, L.L.; Wang, Y.B.; Lian, W.P.; Xiang, L.W. Comparative Analysis of Vertical Deformation of the Chinese Mainland Surface Using “China’s Crustal Movement Observation Network” GPS and GRACE Data. Acta Geod. Cartogr. Sin. 2018, 47, 899–906. [Google Scholar]
  3. Liang, S.; Gan, W.; Shen, C.; Xiao, G.; Liu, J.; Chen, W.; Ding, X.; Zhou, D. Three-dimensional velocity field of present-day crustal motion of the Tibetan Plateau derived from GPS measurements. J. Geophys. Res. Solid Earth 2013, 118, 5722–5732. [Google Scholar] [CrossRef]
  4. Zhan, W.; Li, F.; Hao, W.; Yan, J. Regional characteristics and influencing factors of seasonal vertical crustal motions in Yunnan, China. Geophys. J. Int. 2017, 210, 1295–1304. [Google Scholar] [CrossRef]
  5. Jiang, W.; Yuan, P.; Chen, H.; Cai, J.; Li, Z.; Chao, N.; Sneeuw, N. Annual variations of monsoon and drought detected by GPS: A case study in Yunnan, China. Sci. Rep. 2017, 7, 5874. [Google Scholar] [CrossRef] [PubMed]
  6. Zhou, W.; Ding, K.; Liu, P.; Lan, G.; Ming, Z. Spatiotemporal filtering for continuous GPS coordinate time series in mainland China by using independent component analysis. Remote Sens. 2022, 14, 2904. [Google Scholar] [CrossRef]
  7. Wang, M.; Shen, Z.K.; Dong, D.N. The Impact and Correction of Non-Tectonic Deformation on GPS Continuous Station Position Time Series. Chin. J. Geophys. 2005, 48, 1045–1052. [Google Scholar] [CrossRef]
  8. Li, Q.; You, X.Z.; Yang, S.M.; Du, R.L.; Qiao, X.J.; Zou, R.; Wang, Q. High-Precision and High-Density GPS Monitoring of Tectonic Deformation in the Chinese Mainland: Present-Day Velocity Field. Sci. Sin. (Terrae) 2012, 42, 629–632. [Google Scholar]
  9. Wang, D.Z.; Zhao, B.; Yu, J.S.; Tan, K. Can Mobile GPS Observation Data Be Used for Crustal Vertical Deformation Monitoring? A Case Study of the Chinese Mainland. J. Geod. Geodyn. 2021, 41, 290–295. [Google Scholar]
  10. Zhan, W.; Li, F.; Zhu, S.; Zhang, J. Analysis and Experiment on Correcting Vertical Velocity of Mobile Observations Using Continuous GPS Observations. Geomat. Inf. Sci. Wuhan Univ. 2016, 41, 963–968. [Google Scholar]
  11. Liang, H.B.; Yang, G.H. Characteristics of Vertical Deformation in the Northern Section of the North-South Seismic Belt Before and After the Wenchuan M_S8.0 Earthquake. J. Seismol. Res. 2021, 44, 613–621. [Google Scholar]
  12. Li, J.W.; Zhan, W.; Liang, H.B.; Wang, Y.; Guo, N.N. Accurate Acquisition and Method Evaluation of GPS Vertical Annual Periodic Motion. J. Seismol. Res. 2020, 43, 95–100. [Google Scholar]
  13. Bos, M.; Bastos, L.; Fernandes, R. The influence of seasonal signals on the estimation of the tectonic motion in short continuous GPS time-series. J. Geodyn. 2010, 49, 205–209. [Google Scholar] [CrossRef]
  14. Liu, B.; Dai, W.; Peng, W.; Meng, X. Spatiotemporal analysis of GPS time series in vertical direction using independent component analysis. Earth Planets Space 2015, 67, 1–10. [Google Scholar] [CrossRef]
  15. Ding, Y.H.; Huang, D.F.; Shi, Y.L.; Jiang, Z.S.; Chen, T. Analysis of Vertical Surface Displacement Changes in Sichuan Using GPS and GRACE. Chin. J. Geophys. 2018, 61, 4777–4788. [Google Scholar]
  16. Qiao, X.J.; Wang, Q.; Du, R.L. Present-Day Crustal Deformation Characteristics of Active Blocks in the Sichuan-Yunnan Region. Chin. J. Geophys. 2004, 47, 805–811. [Google Scholar]
  17. Sheng, C.Z.; Gan, W.J.; Liang, S.M.; Chen, W.T.; Xiao, G.R. Identification and Removal of Terrestrial Water Load Deformation Interference in GPS Time Series in Western Yunnan Using GRACE. Chin. J. Geophys. 2014, 57, 42–52. [Google Scholar]
  18. Gülal, E.; Erdoğan, H.; Tiryakioğlu, İ. Research on the stability analysis of GNSS reference stations network by time series analysis. Digit. Signal Process. 2013, 23, 1945–1957. [Google Scholar] [CrossRef]
  19. Jiang, W.P.; Li, Z.H.; Liu, H.F.; Zhao, Q. Analysis of the Causes of Nonlinear Changes in the Coordinate Time Series of IGS Reference Stations in China. Chin. J. Geophys. 2013, 56, 2228–2237. [Google Scholar]
  20. Wu, H.; Lu, N.; Zou, J.G.; Guo, S.T. Improved 3σ Outlier Detection Method for GNSS Deformation Monitoring Time Series. Geomat. Inf. Sci. Wuhan Univ. 2019, 44, 1282–1288. [Google Scholar] [CrossRef]
  21. Xu, H.Q.; Lu, T.D.; He, X.X.; Zhou, S.J.; Tao, R. Outlier Detection in GNSS Coordinate Time Series Based on the SSA-S_n Method. J. Geod. Geodyn. 2022, 42, 258–263+285. [Google Scholar] [CrossRef]
  22. Hu, S.Q.; Wang, T.; Guan, Y.H.; Yang, Z.Y. Study on Vertical Seasonal Fluctuation Changes and Tectonic Deformation in Yunnan Using GPS and Hydrological Load Models. Chin. J. Geophys. 2021, 64, 2613–2630. [Google Scholar]
  23. Tobler, W.R. A computer movie simulating urban growth in the Detroit region. Econ. Geogr. 1970, 46, 234–240. [Google Scholar] [CrossRef]
  24. Li, X.W.; Cao, C.X.; Chang, C.Y. The First Law of Geography and the Proposal of Spatio-temporal Proximity. Chin. J. Nat. 2007, 29, 69–71. [Google Scholar]
  25. Ren, Y.Y.; Wang, J.X.; Wang, H.; Lian, L.Z.; Hou, Y.F.; Wang, Y.Z. Construction of the Velocity Field of the Chinese Mainland Based on the Local Seamless Delaunay Triangulation Inverse Distance Weighting Method. Geomat. Inf. Sci. Wuhan Univ. 2021, 46, 1071–1080. [Google Scholar]
  26. Dhevi, A.S. Imputing missing values using Inverse Distance Weighted Interpolation for time series data. In Proceedings of the 2014 Sixth International Conference on Advanced Computing (ICoAC), Chennai, India, 17–19 December 2014; pp. 255–259. [Google Scholar]
  27. Yan, X.R.; Wang, X.C.; Liang, W.; Mu, Y.X.; Song, Y.L.; Ding, N.; Zhang, W.Y. Optimized IDW Interpolation Method Considering GNSS Water Vapor Distribution Characteristics and Inter-Station Distance. J. Nanjing Univ. Inf. Sci. Technol. (Nat. Sci. Ed.) 2022, 14, 287–293. [Google Scholar] [CrossRef]
  28. He, Y.F.; Nie, G.G.; Wu, S.G.; Li, H.Y.; Liao, M.; Guo, Y. Analysis of the Relationship Between CMONOC Coordinate Time Series Considering Rainfall and Hydrological Load in the ITRF2014 Framework. Geomat. Inf. Sci. Wuhan Univ. 2024, 49, 960–969. [Google Scholar] [CrossRef]
  29. Feng, T.F.; Shen, Y.Z.; Wang, F.W.; Chen, Q.J. Extraction and Physical Mechanism Analysis of Seasonal Vertical Displacement Signals in North China. Geomat. Inf. Sci. Wuhan Univ. 2022, 47, 866–874. [Google Scholar] [CrossRef]
  30. Ming, F.; Yang, Y.; Zeng, A.; Zhao, B. Spatiotemporal filtering for regional GPS network in China using independent component analysis. J. Geod. 2017, 91, 419–440. [Google Scholar] [CrossRef]
  31. Wessel, P.; Luis, J.F.; Uieda, L.; Scharroo, R.; Wobbe, F.; Smith, W.H.F.; Tian, D. The Generic Mapping Tools version 6. Geochem. Geophys. Geosystems 2019, 20, 5556–5564. [Google Scholar] [CrossRef]
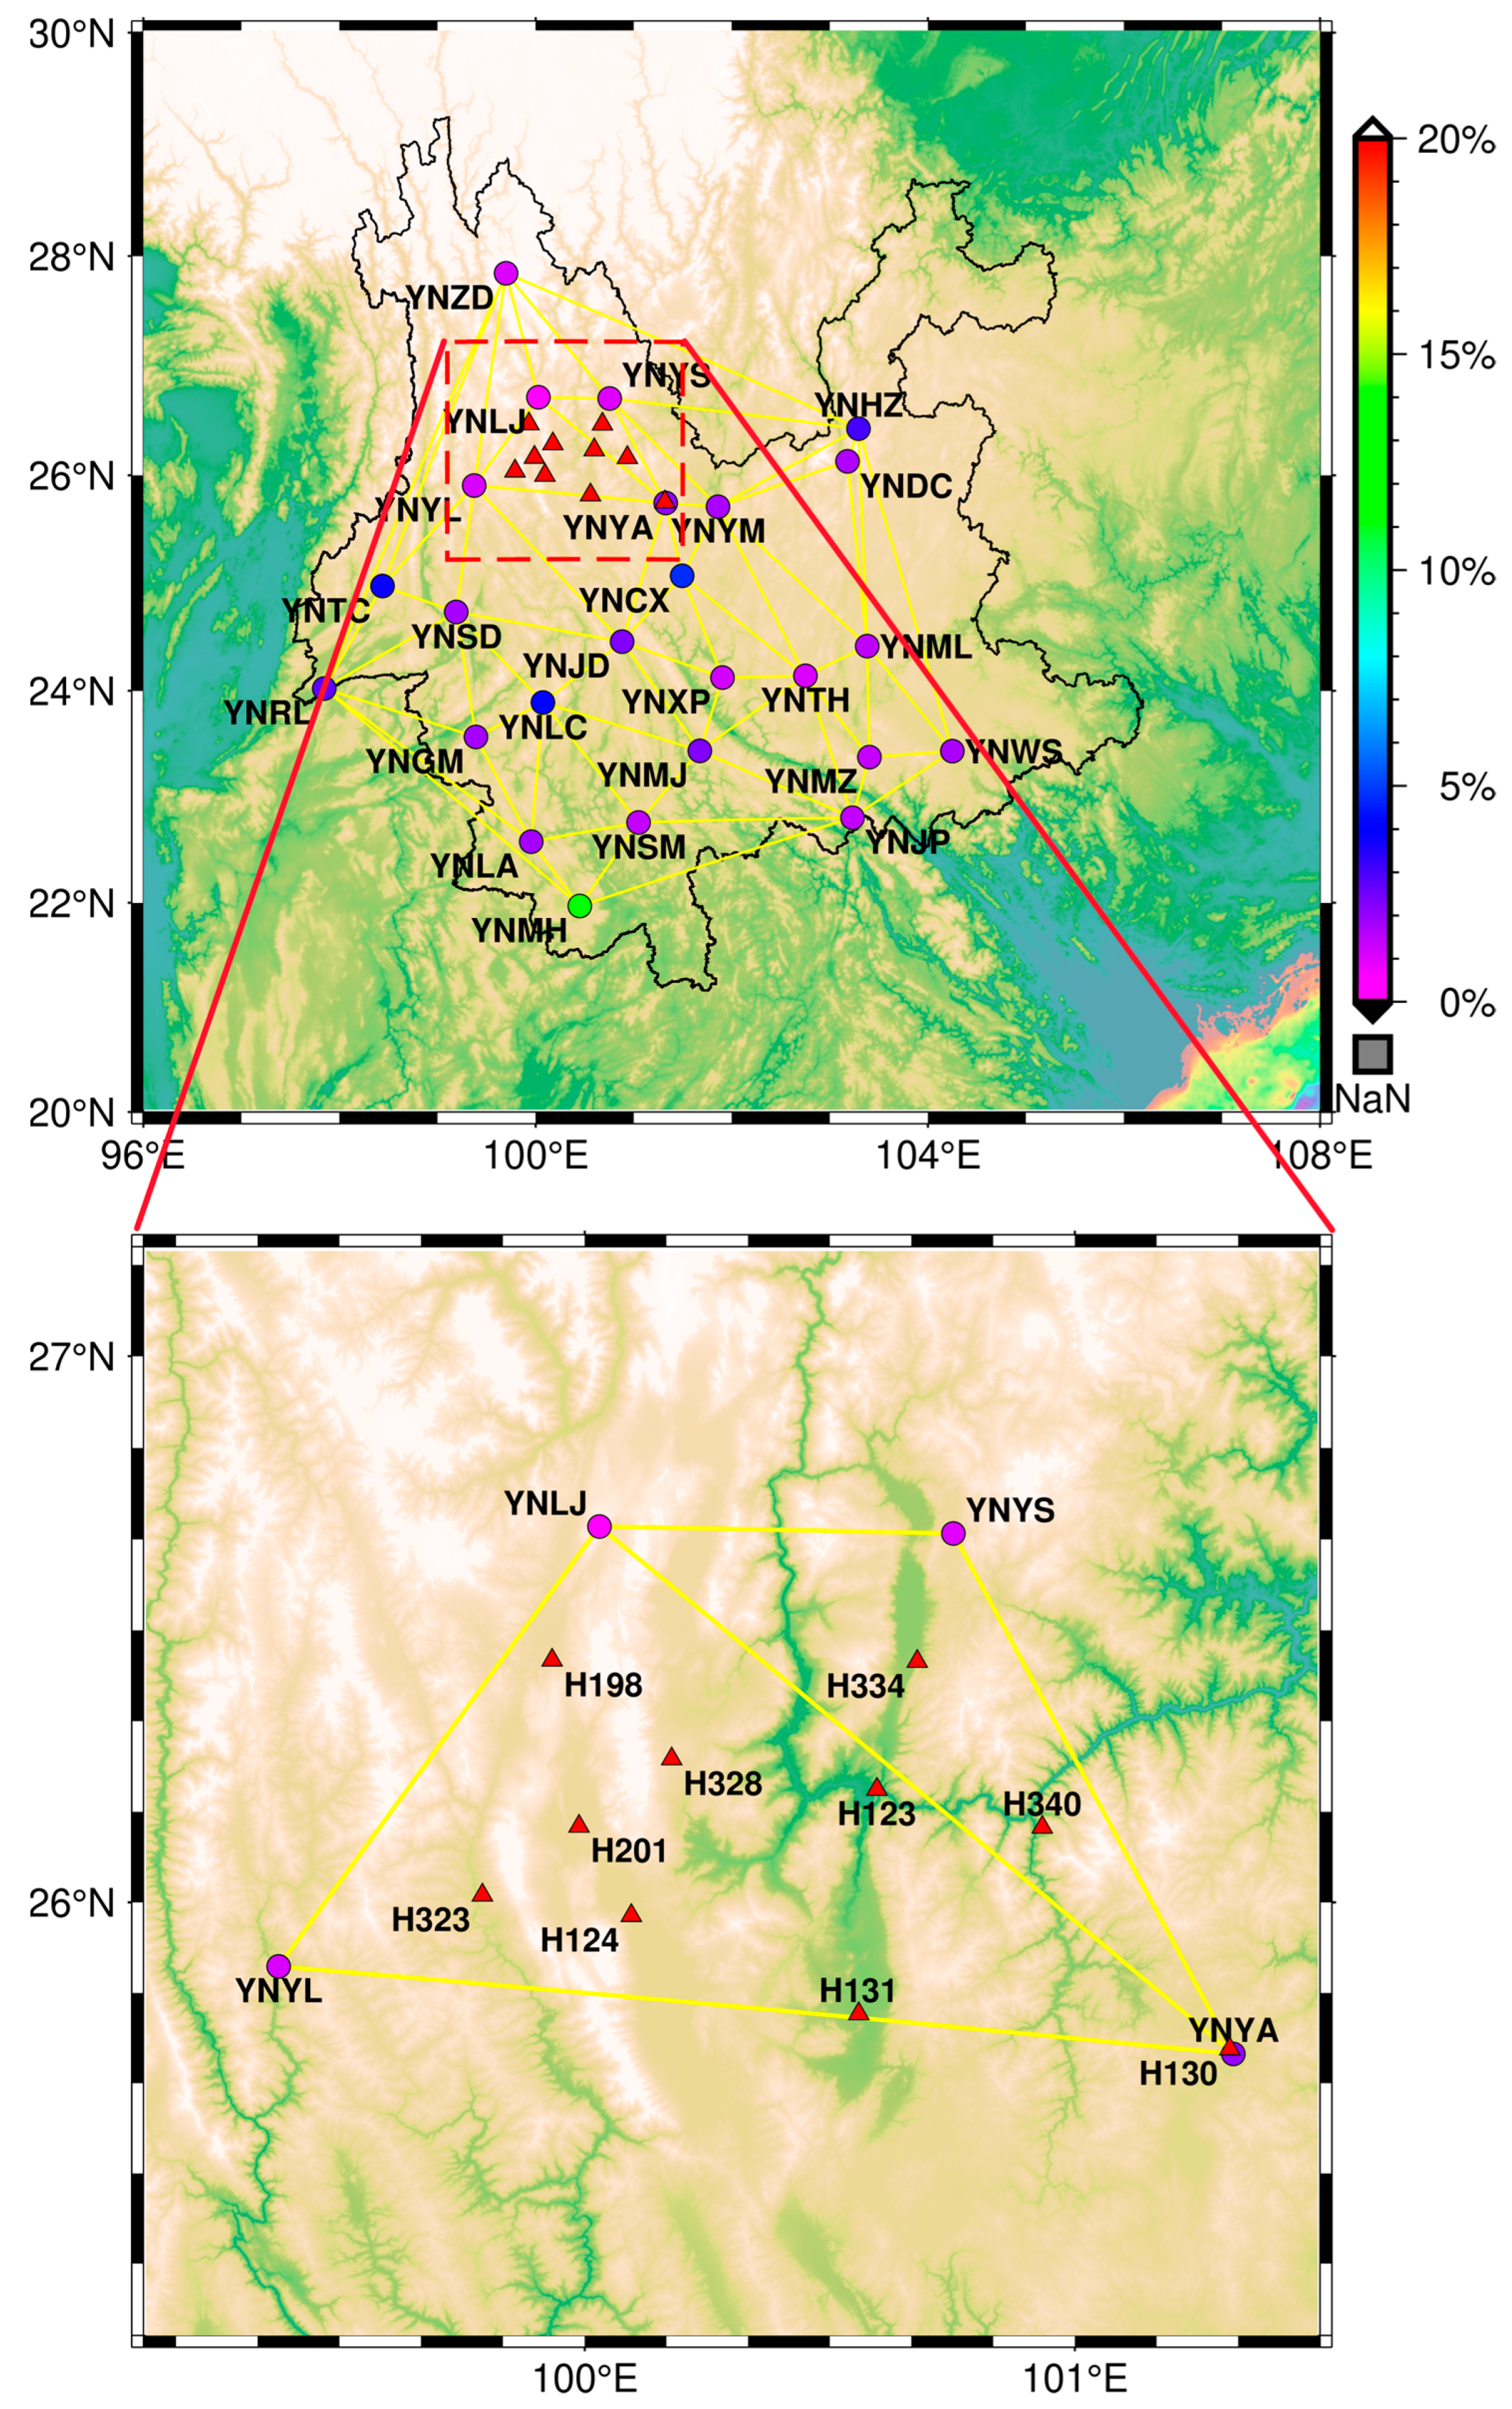
Figure 1. In the top panel, the data missing rate of GNSS reference stations is indicated by color dots; in the bottom panel, red triangles denote the selected campaign GNSS stations used to test the effectiveness of the proposed strategy.
Remotesensing 16 03144 g001
Figure 2. Methodological framework (this framework consists of four main steps: data preprocessing; construction of the triangulation network and model fitting; method application; and discussion and analysis).
Remotesensing 16 03144 g002
Figure 3. Distribution of GNSS reference stations in the crustal movement observation network of Yunnan Province and the Delaunay triangulation formed by the reference stations.
Remotesensing 16 03144 g003
Figure 4. Vertical coordinate time series of the three reference stations YNCX, YNTH, and YNMJ in the triangulation.
Remotesensing 16 03144 g004
Figure 5. Vertical coordinate time series of the YNXP Station (green dots) and the interpolated function fit (blue line) and periodic term fit (red line).
Remotesensing 16 03144 g005
Figure 6. Effect of periodic term correction on the YNXP Station and changes in station velocity after correction.
Remotesensing 16 03144 g006
Figure 7. Changes in velocity before and after periodic term correction for the reference stations.
Remotesensing 16 03144 g007
Figure 8. Effect of periodic term correction on station H328 and changes in the estimation of vertical velocity before and after the correction.
Remotesensing 16 03144 g008
Figure 9. Changes in estimated velocity before and after the periodic term correction at campaign stations (the main figure corresponds to the area outlined by the red dashed box in the subfigure).
Remotesensing 16 03144 g009
Figure 10. Variation in the correction effectiveness of campaign station velocity with increasing interpolation radius (the blue line represents the first type of result, the orange line represents the second type of result, and the green dashed line represents the effect of interpolation within a 200 km radius).
Remotesensing 16 03144 g010
Table 1. Inverse distance weighting information for each reference station in the triangulation.
StationLongitude (°)Latitude (°)Distance (km)Weight
YNCX101.49325.050113.00.268
YNMJ101.67523.41679.50.380
YNTH102.75124.11885.90.352
Table 2. Changes in vertical velocity and improvement percentage in precision before and after periodic term correction for different virtual campaign stations.
StationVelocity before Correction (mm/a)Velocity after Correction (mm/a)Improvement Percentage in Precision (%)
YNXP 0.56 ± 0.64 1.55 ± 0.46 28%
YNMZ 0.03 ± 0.82 0.59 ± 0.62 25%
YNDC 2.17 ± 1.02 1.61 ± 0.84 18%
YNLJ 0.63 ± 0.74 0.03 ± 0.50 33%
YNMJ 2.66 ± 1.08 2.07 ± 0.87 20%
YNLC 2.22 ± 1.06 2.03 ± 0.67 36%
YNSD 1.78 ± 0.94 0.26 ± 0.66 30%
YNML 1.63 ± 0.84 0.19 ± 0.60 29%
YNSM 4.04 ± 1.04 1.19 ± 0.69 33%
YNTH 0.03 ± 0.87 1.68 ± 0.78 10%
YNCX 1.50 ± 0.84 0.07 ± 0.60 29%
YNGM 0.15 ± 0.63 1.62 ± 0.51 20%
YNLA 2.39 ± 0.67 0.34 ± 0.56 16%
YNYL 1.96 ± 0.88 3.03 ± 0.65 27%
YNYM 0.84 ± 0.68 0.25 ± 0.52 24%
YNYS 1.67 ± 0.41 0.21 ± 0.36 13%
Table 3. Changes in vertical velocity and improvement percentage in precision before and after periodic term correction using different methods for real campaign stations.
StationVelocity before
Correction (mm/a)
Reference Station InformationHydrological Load
Velocity after Correction (mm/a)Improvement Percentage in Precision (%)Velocity after Correction (mm/a)Improvement Percentage in Precision (%)
H198 2.73 ± 0.79 2.69 ± 0.75 4% 3.15 ± 0.89 −13%
H328 4.35 ± 1.48 3.13 ± 1.26 15% 2.78 ± 1.10 26%
H201 1.55 ± 1.08 1.45 ± 0.99 8% 2.56 ± 0.87 19%
H323 0.11 ± 0.86 0.42 ± 0.86 0.36% 0.73 ± 0.88 −2%
H124 1.74 ± 0.87 1.26 ± 0.73 16% 1.89 ± 0.75 14%
H123 4.51 ± 1.15 4.88 ± 1.04 10% 5.21 ± 0.97 16%
H131 2.66 ± 0.78 2.08 ± 0.72 7% 2.70 ± 0.70 10%
H334 0.42 ± 0.88 0.89 ± 0.88 −0.49% 0.96 ± 0.94 −7%
H340 0.93 ± 0.81 2.08 ± 0.74 8% 2.00 ± 0.81 0%
H130 2.02 ± 1.26 3.28 ± 0.91 27% 3.15 ± 1.02 19%
Disclaimer/Publisher’s Note: The statements, opinions and data contained in all publications are solely those of the individual author(s) and contributor(s) and not of MDPI and/or the editor(s). MDPI and/or the editor(s) disclaim responsibility for any injury to people or property resulting from any ideas, methods, instructions or products referred to in the content.