Article

Assessment of Satellite Differential Code Biases and Regional Ionospheric Modeling Using Carrier-Smoothed Code of BDS GEO and IGSO Satellites

1
College of Information and Control Engineering, Xi’an University of Architecture and Technology, Xi’an 710055, China
2
School of Geosciences and Info-Physics, Central South University, Changsha 410083, China
3
(NWEPDI) of China Power Engineering Consulting Group, Northwest Electric Power Design Institute Co., Ltd., Xi’an 710075, China
*
Author to whom correspondence should be addressed.
Remote Sens. 2024, 16(17), 3118; https://doi.org/10.3390/rs16173118
Submission received: 23 June 2024 / Revised: 15 August 2024 / Accepted: 21 August 2024 / Published: 23 August 2024
(This article belongs to the Special Issue Autonomous Space Navigation (Second Edition))

Abstract

:
The geostationary earth orbit (GEO) represents a distinctive geosynchronous orbit situated in the Earth’s equatorial plane, providing an excellent platform for long-term monitoring of ionospheric total electron content (TEC) at a quasi-invariant ionospheric pierce point (IPP). With GEO satellites having limited dual-frequency coverage, the inclined geosynchronous orbit (IGSO) emerges as a valuable resource for ionospheric modeling across a broad range of latitudes. This article evaluates satellite differential code biases (DCB) of BDS high-orbit satellites (GEO and IGSO) and assesses regional ionospheric modeling utilizing data from international GNSS services through a refined polynomial method. Results from a 48-day observation period show a stability of approximately 2.0 ns in BDS satellite DCBs across various frequency signals, correlating with the available GNSS stations and satellites. A comparative analysis between GEO and IGSO satellites in BDS2 and BDS3 reveals no significant systematic bias in satellite DCB estimations. Furthermore, high-orbit BDS satellites exhibit considerable potential for promptly detecting high-resolution fluctuations in vertical TECs compared to conventional geomagnetic activity indicators like Kp or Dst. This research also offers valuable insights into ionospheric responses over mid-latitude regions during the March 2024 geomagnetic storm, utilizing TEC estimates derived from BDS GEO and IGSO satellites.

1. Introduction

The ionosphere, an ionized component of Earth’s atmosphere, extends approximately from 50 km to about 1000 km and plays a pivotal role in facilitating the transmission of radio signals within communication systems [1,2]. Its behavior is highly intricate and closely intertwined with space weather phenomena due to profound interactions with the thermosphere and magnetosphere [3,4]. Research consistently shows that electron density can serve as the fundamental parameter governing the refractive index for radio waves propagating through the ionosphere [5,6]. This principle can also extend to the characterization of total electron content (TEC), which quantifies the electron density integration and is typically expressed in units of 1016 electrons per m2 [7,8]. Given that radio signals from the global navigation satellite system (GNSS) must pass through the ionosphere to reach Earth-based receiver antennas, utilizing GNSS technology for ionospheric investigations presents a compelling method for investigating ionospheric disruptions through GNSS-derived TEC estimations [9].
It is important to emphasize that higher-order ionospheric effects contribute minimally, accounting for less than 0.1% of the total ionospheric delay [10] and are typically neglected in TEC estimation. As the first-order ionospheric effect is frequency-independent, it can be accurately estimated through a geometry-free (GF) combination of dual-frequency GNSS measurements due to the fact that most modern GNSS receivers are capable of recording both code and carrier-phase measurements across multiple frequencies [11]. Code measurements provide unambiguous distance readings, enabling the derivation of absolute TEC estimates with an accuracy of 1–5 TECU [12,13]. In contrast, carrier-phase-derived TEC estimates offer a significantly higher accuracy but pose challenges in resolving ambiguities. To enhance the accuracy of code-derived TEC estimates and avoid ambiguity resolution, the carrier-phase smoothing code (CPSC) algorithm based on Hatch filtering has become the most classical and widely adopted approach [14,15,16]. This algorithm utilizes a dual-frequency ionospheric-free combination, extracting the low-frequency component of code observations through an arithmetic average operation, while capturing the high-frequency component of carrier-phase observations using a time-difference operator [17].
With a substantial amount of precise TEC data derived from dual-frequency GNSS, recent studies have focused on analyzing the profound coupling mechanisms between the ionosphere, magnetosphere, and thermosphere [18,19]. Wen and Mei [20] illustrated notable TEC enhancements at the equatorial ionization anomaly crests, which are associated with neutral winds and an eastward prompt penetration electric field, particularly during the main phase of the storm. Similarly, Nayak et al. [21] identified a strong correlation between ionospheric anomalies and earthquake epicenters by examining both station-specific VTEC data and pseudorandom noise codes. In another noteworthy study, Sharma et al. [22] investigated fluctuations in ionospheric TEC derived from GPS data as a potential precursor to the Mw 7.2 earthquake that struck Mexico on 4 April 2010. These findings highlight the potential of ionospheric science to enhance earthquake early warning systems and deepen our understanding of earthquake precursors, thereby aiding in the mitigation of seismic impacts and the protection of lives and infrastructure.
Despite these advancements, modeling and forecasting ionosphere variations on a larger scale remain challenging, primarily due to the complex vertical structure of the ionosphere (i.e., D, E, F1, and F2 layers). Current efforts often simplify the ionosphere by treating it as a single-layer model (SLM) at a specific height above the Earth’s surface [23]. The signal transmission path between the GNSS receiver and the space satellite intersects the SLM at a designated point known as the ionospheric pierce point (IPP). However, due to the global movement of the medium earth orbit (MEO) satellites, the TEC data derived from them faces challenges in the continuous monitoring of ionospheric variations [24]. In contrast, the GEO satellites of the Beidou Navigation Satellite System (BDS) offer a promising approach for investigating TEC variations during long-term observations, owing to their quasi-invariant orbital positions [25]. Yang et al. [26] utilized BDS GEO observations to estimate vertical TEC using data from eight tracking sites. Additionally, Huang et al. [27] demonstrated that BDS GEO satellites can provide precise TEC estimators for studying ionospheric variability.
Benefiting from the advantageous features of GEO satellites for the continuous monitoring of ionospheric disturbances, the TEC series derived from GEO measurements are not only used to establish reliable ionospheric maps but are also adopted for investigating and analyzing the ionospheric response to the changing space weather conditions [28,29,30]. However, when computing TEC through dual-frequency smoothed codes, the issue of the differential code bias (DCB) parameter emerges as an inevitable challenge. DCB refers to the discrepancies in hardware delays associated with GNSS code observations at varying signal frequencies, tracking channels, and technologies [31,32]. The magnitudes of GNSS satellite DCBs typically range from a few to several tens of nanoseconds, leading to ranging errors of several meters [33,34]. Consequently, accurately estimating DCBs is essential for GNSS TEC calculations and precise positioning applications [35].
General methodologies for estimating GNSS DCBs can be categorized into two distinct approaches [36]. The first method focuses on estimating the DCBs for both satellites and receivers by incorporating accurate ionospheric products [37,38]. The second approach involves the simultaneous estimation of local or global ionospheric parameters along with the DCBs [39,40]. Although previous studies have examined the DCBs of BDS satellites, specifically BDS2 and BDS3 [41,42], there remains a critical need for further investigation. This necessity arises due to the limited availability of BDS3 satellites and the constrained number of stations utilized in the current research. Moreover, exploring the potential of systematic biases between the DCBs of BDS2 and BDS3 satellites is vital for users who require joint processing of observations from both systems. Such exploration will enhance the accuracy of TEC estimations and improve the reliability of precise positioning services dependent on these satellite systems.
In addition to GEO, the inclined geosynchronous orbit (IGSO) is another type of geosynchronous orbit with an altitude of about 36,000 km and an inclination of 55° [43]. The orbital period of IGSOs matches that of GEOs, corresponding to one sidereal day, which is approximately 23 h and 56 min. Despite sharing the same orbital period as GEO, IGSO has a noticeable inclination relative to the Earth’s equator, resulting in ground-tracks that continuously repeat in a distinct figure eight shape, covering a latitude band of about 55°. Utilizing multiple tracking receivers at low and middle latitudes, the corresponding IGSO-based TECs could be recorded over an extended observation time, allowing for a comprehensive understanding of the ionospheric variations across continuous latitudes [44]. Nevertheless, a thorough assessment is necessary to understand the characteristics of IGSO satellite DCBs and their implications for ionospheric TEC estimations.
The objective of this study is to provide a detailed assessment of satellite DCB characteristics and the performance of ionospheric modeling utilizing BDS high-orbit satellites (GEO and IGSO). To achieve this, experiments and analyses were conducted based on multi-frequency observations from BDS2 and BDS3 at 71 International GNSS Monitoring and Assessment System (IGMAS) and Multi-GNSS Experiment (MGEX) sites. These sites were selected based on geographical distribution, data availability, and operational status during specific periods in 2024. The paper is structured as follows. First, the estimation method employed to determine TEC and satellite DCB is described in detail. Subsequently, a comprehensive analysis of BDS2 and BDS3 high-orbit satellite DCBs is presented. Additionally, the performance of the regional ionospheric modeling (RIM) is verified and assessed through comparisons with IGS-related final products. Finally, we utilize observations from high-orbit satellites to investigate the regional ionospheric response to a geomagnetic storm that occurred in March 2024.

2. Methods

This section commences with a comprehensive review of the dual-frequency smoothed-code leveling methodology for extracting DCB and vertical TEC (VTEC). It then progresses to the discussion of two typical ionospheric modeling methods, elaborates on the data processing strategy, and culminates with a detailed exposition on the weight matrix designing.

2.1. Extraction of DCB and Vertical TEC

Neglecting multipath effects and measurement noise, the raw GNSS code and carrier-phase observations, expressed in units of length, can be formulated as follows:
P r , i s = ρ r s + α i · I r , 1 s + c · B r , i + c · B i s       L r , i s = ρ r s α i · I r , 1 s + λ i · N r , i s + λ i · b i s
where P r , i s and L r , i s represent the code and phase measurements for receiver r and satellite s at frequency i ; the term ρ r s = ϱ r s + c · d t r c · d t s + T r s denotes the combination of frequency-independent components, including the geometric distance from the satellite antenna to the receiver antenna ϱ r s , receiver clock error d t r , satellite clock error d t s , and tropospheric delay; T r s ; I r , 1 s is the slant ionospheric delay on the reference frequency (here using the first frequency); α i = f 1 / f i 2 is frequency-based ionospheric impact factor; B r , i and B i s refer to the code hardware delays of the receiver and satellite, respectively; N r , i s is the real-valued ambiguity of the phase observable; b i s signifies the phase instrumental delay, typically absorbed by the ambiguity parameter; and c and λ i denote the speed of light in a vacuum and the signal wavelength, respectively.
Given the dispersive nature of ionospheric refractivity, the first-order ionospheric delay can be derived from the geometry-free (GF) linear combination of dual-frequency GNSS measurements, as outlined below:
P r , i j s = P r , i s P r , j s = ( α i α j ) · I r , 1 s + c · D C B r , i j + c · D C B i j s L r , i j s = L r , i s L r , j s = α i α j · I r , 1 s + ( λ i · N r , i s λ j · N r , j s )
where P r , i j s and L r , i j s indicate the frequency-differenced code and phase measurements between signal i and j , respectively; and D C B r , i j = B r , i B r , j and D C B i j s = B i s B j s refer to the receiver and satellite DCBs, respectively.
Equation (2) suggests that the non-dispersive terms can be effectively mitigated through a frequency-difference method [45]. Considering the significantly lower noise level in carrier-phase measurements compared to code measurements, the carrier-smoothed code approach is commonly utilized to obtain a more precise ionospheric and DCB estimators [46], as depicted below:
P ¯ r , i j s ( t ) = 1 M P r , i j s ( t ) + M 1 M P r , i j s t 1 + L r , i j s t L r , i j s t 1
where P ¯ r , i j s ( t ) refers to the smoothed code at epoch ( t ) and M denotes the smoothing window, typically ranging from 2 to 100 [47,48].
While the CPSC is a straightforward algorithm that effectively reduces noise in code measurements under normal conditions, the variability of ionospheric errors between consecutive epochs should not be overlooked. As the smoothing window increases, the assumption stated in Equation (3) that the ionosphere remains relatively stable throughout the smoothing period becomes difficult to maintain, particularly during periods of heightened space weather activity [49]. To mitigate the impact of this error accumulation, it is essential to reset the smoothing window and reprocess the smoothed-code observations whenever this accumulation exceeds a predetermined threshold. To optimize the precise evaluation of ionospheric parameters and DCBs, this study recommends setting the smoothing window to 20, as inspired by previous research [50]. This specific value is suggested to achieve a balance between adequate smoothing and the requirement for stable ionospheric conditions.
The ionospheric delay induced by electromagnetic waves in the transmission medium can be expressed as
I r , 1 s = K f 1 2 N e · d s = K f 1 2 S T E C
where N e refers to the electron density along the signal path s ; K = e 2 8 π 2 ε 0 m e 40.309   m 3 s 2 is a constant; and S T E C denotes the integral extended over the path of the signal, measured in TEC units.
By substituting the smoothed code P ¯ r , i j s for P r , i j s in Equation (1) and inserting Equation (4) into Equation (1), we can rewrite an equation related to STEC as
P ¯ r , i j s = α i α j · 40.309 · 10 16 f 1 2 S T E C + c · D C B r , i j + c · D C B i j s = 40.309 · 10 16 · f j 2 f i 2 f i 2 · f j 2 S T E C + c · D C B r , i j + c · D C B i j s
Considering that slant TEC is intricately linked to the geometric properties of the ray path as it traverses the ionosphere, it is beneficial to determine an equivalent vertical TEC value that remains unaffected by the elevation of the ray path. By assuming a thin-shell ionosphere and utilizing fundamental geometric principles, the mapping function M ( ) for converting from STEC to the corresponding VTEC at the IPP at a height ( H ) within the ionospheric shell can be expressed as follows:
M μ Z = cos sin 1 R R + H sin μ Z
where Z refers to the satellite elevation angle and R denotes the Earth’s radius. The values of the parameters can be taken as R = 6371 km, H = 506.7 km, and μ = 0.9782 , respectively [51]. It is evident that by establishing the height of the ionospheric shell at a specific value, the thin-shell mapping function becomes solely dependent on the elevation angle of the ray path. Consequently, this approach neglects the spatial complexities within the ionosphere, such as horizontal gradients [52].
By substituting Equation (6) into Equation (5), the equation for the smoothed code can be reformulated as
β i j · M μ Z · P ¯ r , i j s = V T E C + β i j · M μ Z · c · D C B r , i j + c · D C B i j s β i j = f i 2 · f j 2 / 40.309 · 10 16 · f j 2 f i 2                                                                                    
For BDS, the coefficients are β 12 8.9912 and β 13 11.7512 , corresponding to the signal frequencies B1 (1561.098 MHz), B2 (1207.140 MHz), and B3 (1268.520 MHz), respectively.

2.2. Estimation of Vertical TECs and DCBs

In principle, directly estimating VTEC using Equation (7) would yield a vast number of VTEC parameters for a specific period and region. Therefore, VTECs are generally expressed through a mathematical model that expresses them as a function of epoch time and spatial position. Instead of directly solving for VTECs, model parameters are typically estimated to significantly reduce the number of parameters involved. Various mathematical models exist for expressing VTECs and their performance can vary considerably.
Given that the trajectories of GEO and IGSO satellites of BDS predominantly cover specific regions in the Eastern Hemisphere, we mathematically evaluate two models to capture the spatiotemporal variation of VTECs. These models have been identified as optimal choices, previously validated by research for their effectiveness in representing the regional ionospheric variations [53,54].

2.2.1. Polynomial Model (POLY)

The polynomial model, expressed as a function of geography latitude ( B ) and sun angle ( S ) at IPP, is well-suited for capturing regional ionospheric characteristics over time. It is formulated as follows:
V T E C B , λ = i = 0 n j = 0 m E i j · B B 0 i · S S 0 j
where E i j represents the unknown ionospheric parameters; the term S S 0 = L L 0 + ( t t 0 ) · π 12 denotes the difference of the sun angle between IPP ( B , L ) and the regional center ( B 0 , L 0 ) at the middle epoch ( t 0 ); t is the observation epoch; and n and m indicate the order and degree of the POLY model. Previous research has demonstrated that the polynomial model can achieve high fitting precision within small regions and over short time periods [55]. However, it is important to note that the polynomial model does not account for spherical characteristics, which can result in inaccuracies at the boundaries of larger regions [56].

2.2.2. Spherical Harmonic Function Model (SHF)

The spherical harmonic function model of VTEC can be expressed as follows:
V T E C B , λ = i = 0 n j = 0 i P i j sin B · A i j cos j λ + B i j sin j λ
where n refers to the model order; A i j and B i j are the normalized spherical harmonic coefficients to be estimated; and P i j ( · ) is the associated normalized Legendre function. B and λ can be estimated using the following equations:
B = s i n 1 ( sin B P sin B + cos B P cos B cos ( L L P ) ) λ = L + π 12 t 12
where B and L are the geographic latitude and longitude at IPP, respectively; B P and L P are the geographic latitude and longitude in the geomagnetic north pole; and t represents the universal time of observation epoch. It is evident that, compared to POLY, the SHF exhibits a more complex structure and calculation process. Nonetheless, it effectively captures the spherical characteristics of ionospheric TEC, making it a valuable tool for regional ionospheric modeling [37,55].

2.2.3. Least Squares Adjustment

The simplified observation equation derived from Equation (7) can be expressed as:
V = B x L ,     P                                                   x = D C B r D C B s I o n T
where L and V represent the vectors of smoothed-code measurements and observation residuals; B is the design matrix of unknown parameters; x refers to the vector of the unknown parameters, including the receiver DCBs, satellite DCBs, and ionospheric modeling parameters; and P is the weight matrix of observables.
It should be noted that the interdependence of receiver and satellite DCB parameters results in a rank deficiency of one in the VTEC inverse observation equations (refer to Equation (10)) [57]. Consequently, at least one constraint must be imposed to render the VTEC inverse system estimable. In principle, the number of potential constraints is infinite, and different constraints will produce varying estimated parameters. To facilitate comparison with the products from the IGS analysis center, we adopt the same constraint equation as
H x = 0
where H represents a constraint vector, with elements corresponding to satellite DCBs set to 1, and all other elements set to 0. This formulation implies that the sum of the DCBs of available satellites is zero, thereby establishing a barycentric datum for all satellite DCBs.
Utilizing the principle of least squares, the solutions for the unknown parameter ( x ) can be determined by
x = B T P B + H T H 1 · ( B T P L )
After resolving the ionospheric parameter ( I o n ) and substituting it into Equation (8) or Equation (9), the corresponding ionospheric VTEC values can be obtained. Assuming that observations between different epochs are uncorrelated, conventional least squares estimation allows for the accumulation of sub-matrices from each epoch into the overall normal matrix, while simultaneously aggregating the observational contributions from each epoch on the right-hand side of Equation (11). Once all the data from all epochs have been processed, the normal matrix can be inverted to derive the parameter estimates and their associated covariance matrix. A key advantage of this classical algorithm is that it eliminates the need to invert the normal matrix for each individual epoch, thereby saving time [58].

2.2.4. Enhanced Weight Matrix Formulation

In the context of satellite-based measurements, the elevation angle plays a pivotal role in evaluating the accuracy of the obtained data. When the satellite elevation angle is high, the likelihood of errors, such as atmospheric delay, diminishes, and the multipath effect on the receiver, is significantly reduced. To mitigate the inherent noise in the measurements, we introduce a refined formula for calculating weights that depends on the satellite elevation angle ( e l e ) [59]:
p s = a 2 + b 2 a 2 + b · sin 1 e l e 2
where p s is s -th diagonal element of the weight matrix and a and b are constants, with values set to 0.03 in this study.
Although GEO and IGSO share the same orbital period, the latter has a noticeable inclination relative to the Earth’s equator, creating a figure 8 shape in the ECEF coordinate frame. Hence, it is essential to consider the geometric distance between the satellite and the receiver in formulating a more appropriate weight matrix. Moreover, when integrating data from multiple receivers, the ionospheric activity, particularly in the zenith direction, exhibits diurnal variation influenced by the varying latitudes of the receivers. In equatorial and low-latitude regions, the ionospheric electron density peaks and fluctuates most intensely. To address these challenges, we propose a composite weighting method that amalgamates factors such as satellite elevation angle, satellite receiver distance, and receiver latitude. This method is an extension of Equation (14) and can be expressed as
p s = a 2 + b 2 + c 2 a 2 + b · sin 1 e l e 2 + c · cos l a t 2 · ϱ 0 ϱ s
where c and ϱ 0 are constants, with values designated as 0.03 and 20,000 km, respectively; l a t refers to receiver latitude in an earth-fixed geomagnetic frame; and ϱ s is the satellite receiver geometric distance in kilometers.

3. Results

In this chapter, we start by providing detailing foundational information about the BDS high-orbit satellites and the experimental datasets utilized in the study. Subsequently, we analyze the characteristics of DCBs of the BDS high-orbit satellites. Following that, we explore the performance of the RIMs estimated solely with observables from BDS high-orbit satellites.

3.1. Experimental Datasets

Nowadays, GEO and IGSO satellites are increasingly becoming an integral part of constellations, driven by the imperative need for continuous regional monitoring, improved global coverage, enhanced ionospheric TEC monitoring, regional augmentation, and the goal of achieving seamless global connectivity. As a result, a substantial number of high-orbit satellites are capable of providing multi-frequency signals, significantly aiding in ionospheric estimation. Table 1 and Table 2 present basic information about seven GEO satellites and ten IGSO satellites currently in service. It should be noted that one BDS3 GEO satellite (PRN: C61) is excluded from this study due to its testing status.
To determine the positions of BDS high-orbit satellites, we utilize precise satellite orbit solutions provided in the Extended Standard Product-3 (*.SP3) format by the IGS analysis center, with a time interval of 5 min. We then employ Lagrange interpolation using a ninth-order polynomial to obtain satellite positions in the ECEF coordinate frame at the desired epochs. For the BDS satellites discussed in this paper, the precise orbit solutions are sourced from Wuhan University (WMC0). Additionally, the Chinese Academy of Sciences (CAS0) provides daily DCB solutions in the Bias Solution Independent Exchange Format (Bias-SINEX), which served as the foundational estimations for the DCB analyses. The precise positions of GNSS stations in the ECEF frame are also supplied by the IGS Analysis Center (ISC0) in the Solution Independent Exchange Format (SINEX).
We chose two observation periods in 2024 for our study. The first period, spanning from day of the year (DOY) 001 to 048, was designated to assess the stability of high-orbit satellite DCBs and the effectiveness of RIMs utilizing purely BDS GEO and IGSO satellites. The subsequent period, from DOY 082 to 086, was earmarked for investigating ionospheric disturbance responses to geomagnetic storms.
The Kp index serves as a crucial parameter for evaluating disturbances in Earth’s magnetic field caused by interactions with solar wind. It offers a quantitative measure of geomagnetic storms on a scale of 0 to 9, where higher Kp values indicate more severe disturbances in the geomagnetic field. These disturbances are commonly associated with heightened solar activity, such as solar flares and coronal mass ejections. On the other hand, the disturbance storm time (Dst) index reflects changes in the ring current around Earth due to the influx of protons and electrons from solar wind [60]. Notably, unlike Kp, the Dst index decreases as storm level intensifies. During geomagnetic storms, the ring current strengthens, resulting in a reduction in the Dst value.
In Figure 1, the upper subgraph illustrates the 3 h Kp series sourced from GFZ, whereas the lower subgraph exhibits 3 h Dst values from the World Data Analysis Center for Geomagnetism (https://wdc.kugi.kyoto-u.ac.jp/dst_realtime/202401/index.html, accessed on 20 August 2024). Analysis of the initial 48 days of 2024 reveals rare instances where the Kp value exceeds 6.0, indicating a relatively stable geomagnetic field during this timeframe. Similarly, the Dst values range from −22 nT to 26 nT, suggesting a lack of extreme negative Dst values and consequently, minimal levels of intense ring current activity in this period. Upon comparing the upper (Kp) and lower (Dst) graphs, a noticeable negative correlation between the two indices emerges. Specifically, as the Kp index increases (indicating increased geomagnetic activity), the Dst index tends to decrease (in the negative direction), although there might be some lag attributed to the time taken for solar wind disturbances to travel from the Sun to Earth.
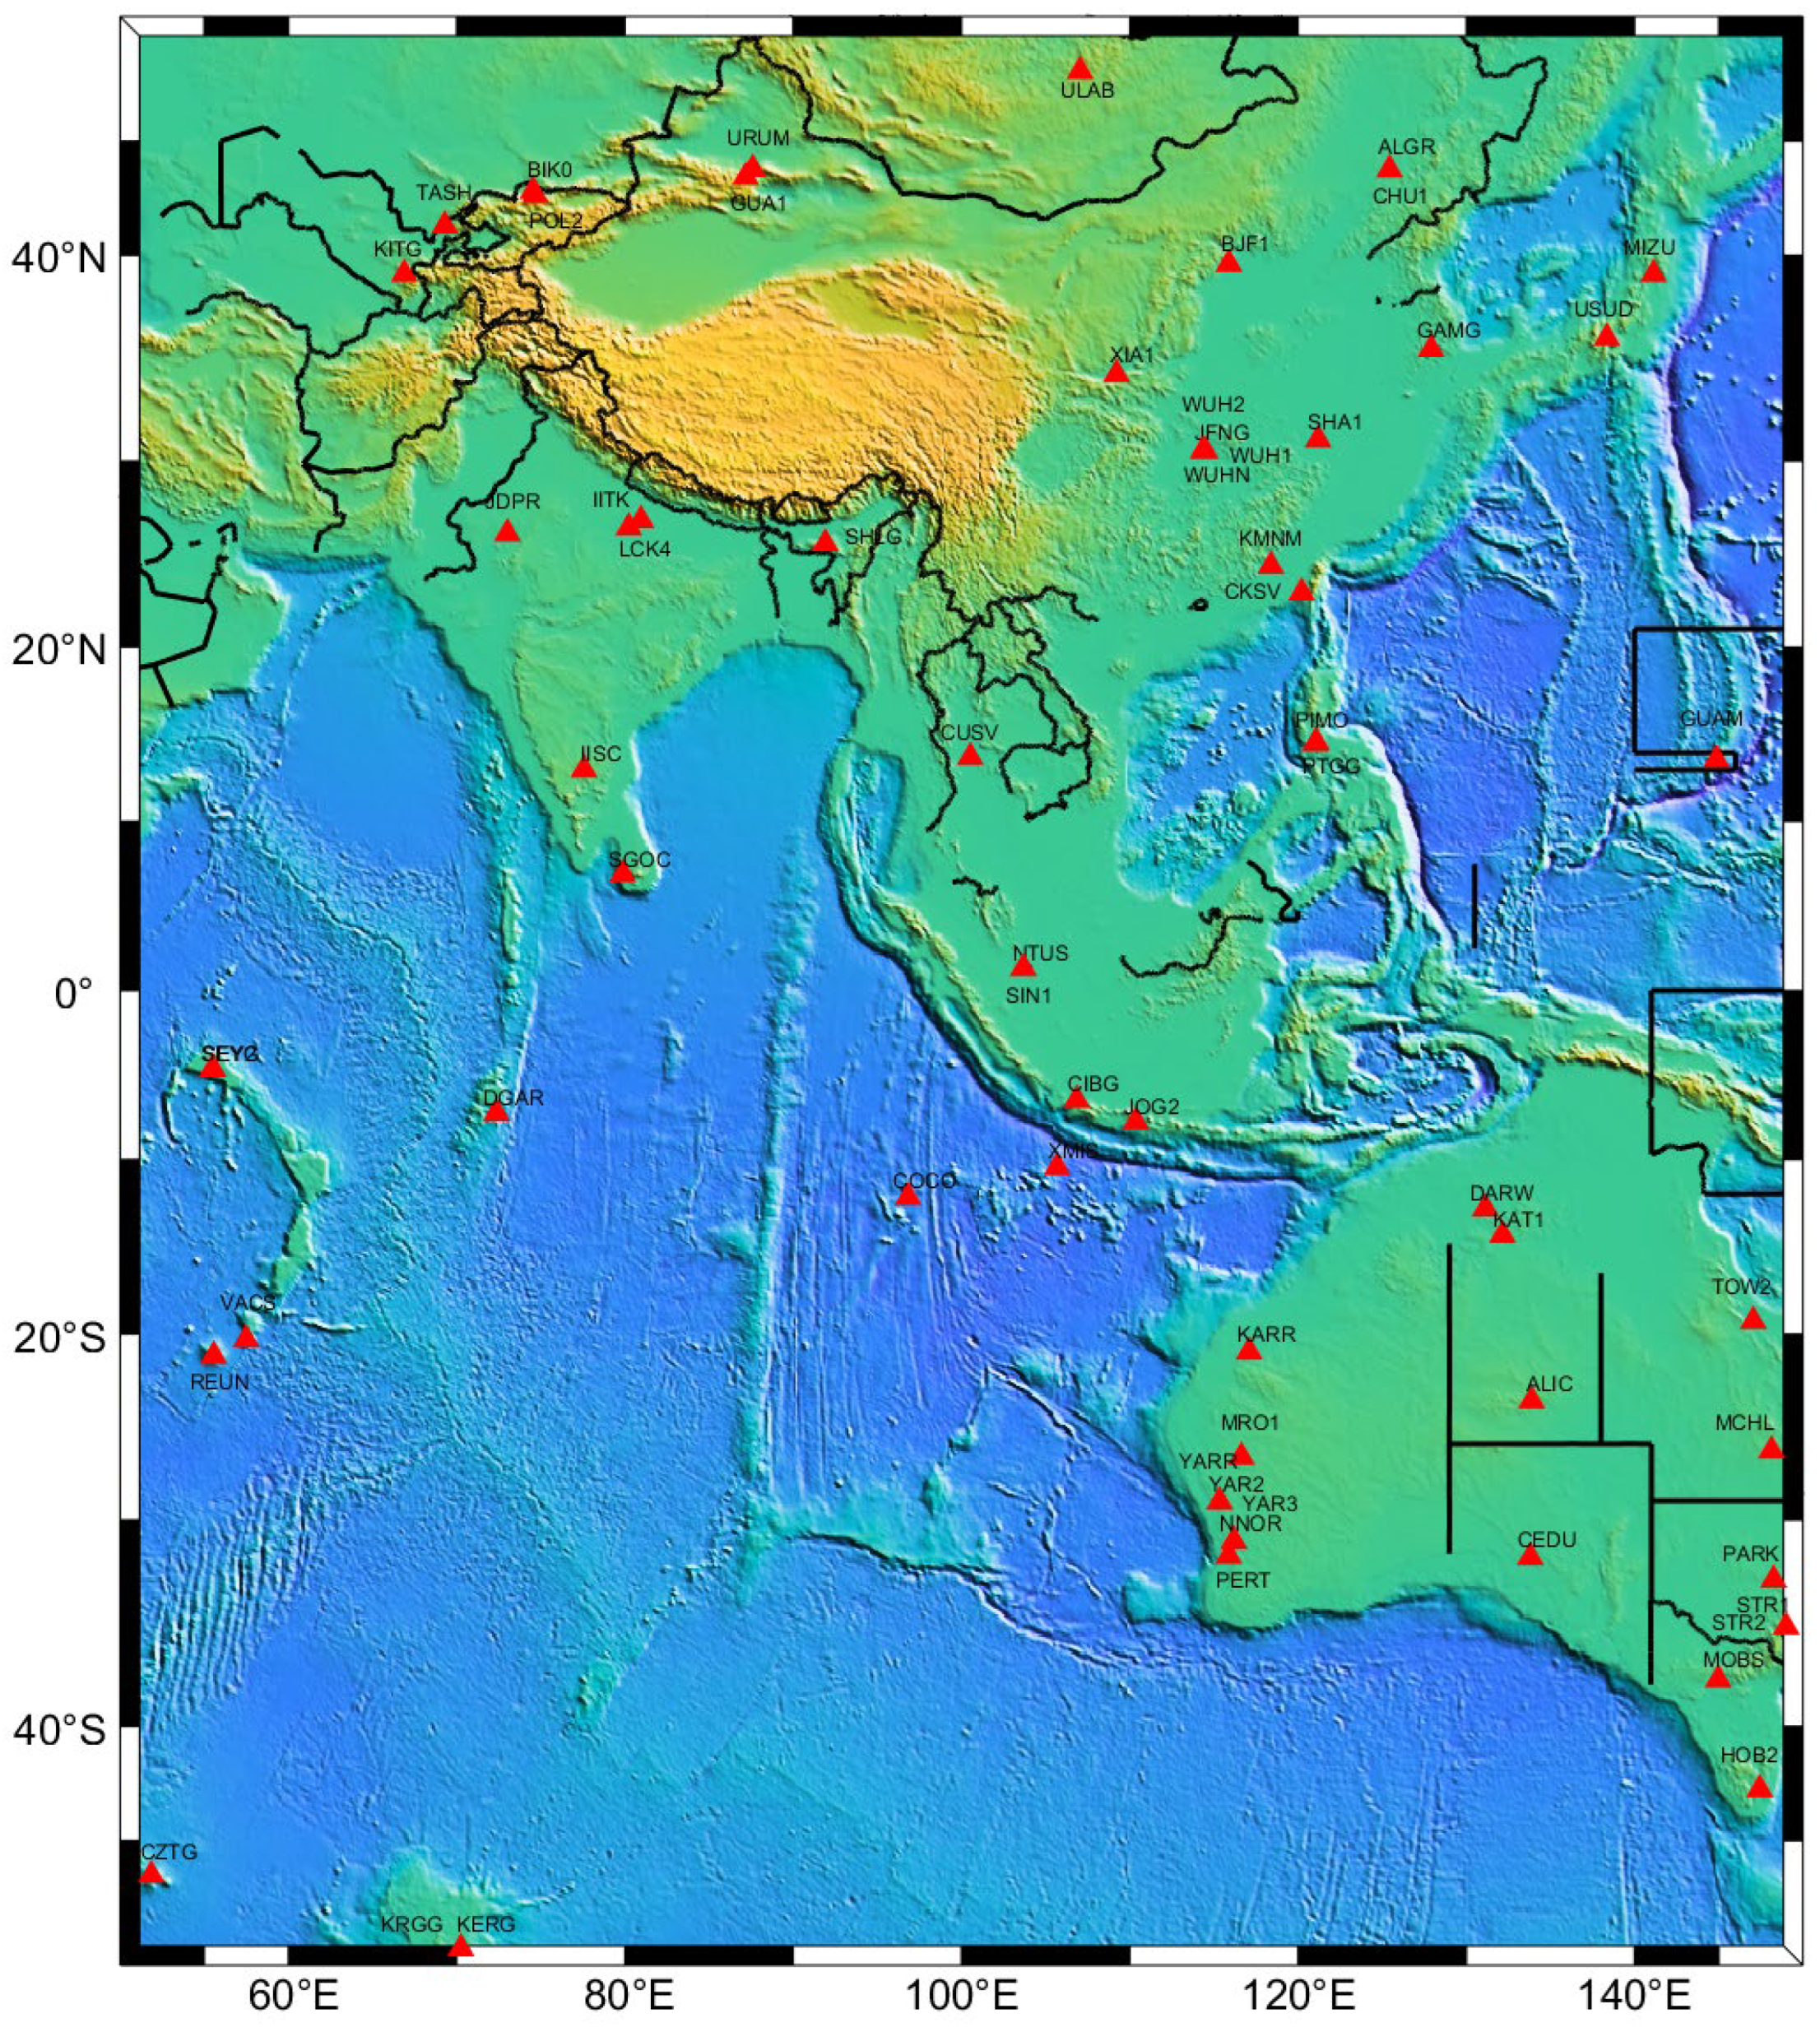
Subsequently, regionally distributed stations from the iGMAS and MGEX tracking networks in the Eastern Hemisphere (with latitude limited to 50°S~50°N and longitude limited to 50°E~150°E) were chosen for the evaluation and analysis of TEC variations, as illustrated in Figure 2. The selected GNSS stations exhibit a relatively uniform distribution in the chosen Eastern Hemisphere region, which is conducive to high-precision regional ionospheric modeling. It is noteworthy that nine regional stations (i.e., ANMG, BRUN, CMUM, DAE2, DAEG, HKSL, HKWS, PGEN, and TWTF) were excluded due to their limited capability to track dual-frequency BDS signals. Moreover, another seven GNSS stations (i.e., ALIC, COCO, DARW, HOB2, KAT1, KIRI, and NRMG) were also rejected due to frequent missing measurements. Therefore, a total of 71 stations (as indicated by the red triangle in Figure 2) were involved in the DCB estimating and ionospheric modeling. The data sampling interval was standardized to 30 s, and the satellite elevation angle cutoff was set to 15 degrees to minimize the multipath effect.
Table 3 provides the characteristics of the BDS signals, including signal frequencies, observation types of code, and the number of accessible stations, during the period of DOY 001-048, 2024. It can be seen that although all 71 GNSS stations can track multi-frequency data, only C2I and C6I signals are trackable by all stations. Therefore, all subsequent research in this paper is based on the C2I–C6I signals for computation and analysis. Besides, as 91.5% of the stations are capable of tracking C7I data alongside C2I, the dual-frequency combination of C2I–C7I is utilized to enhance our understanding of the characteristics of BDS satellite DCBs.

3.2. Select an Appropriate Method for Estimating BDS High-Orbit Satellite DCB

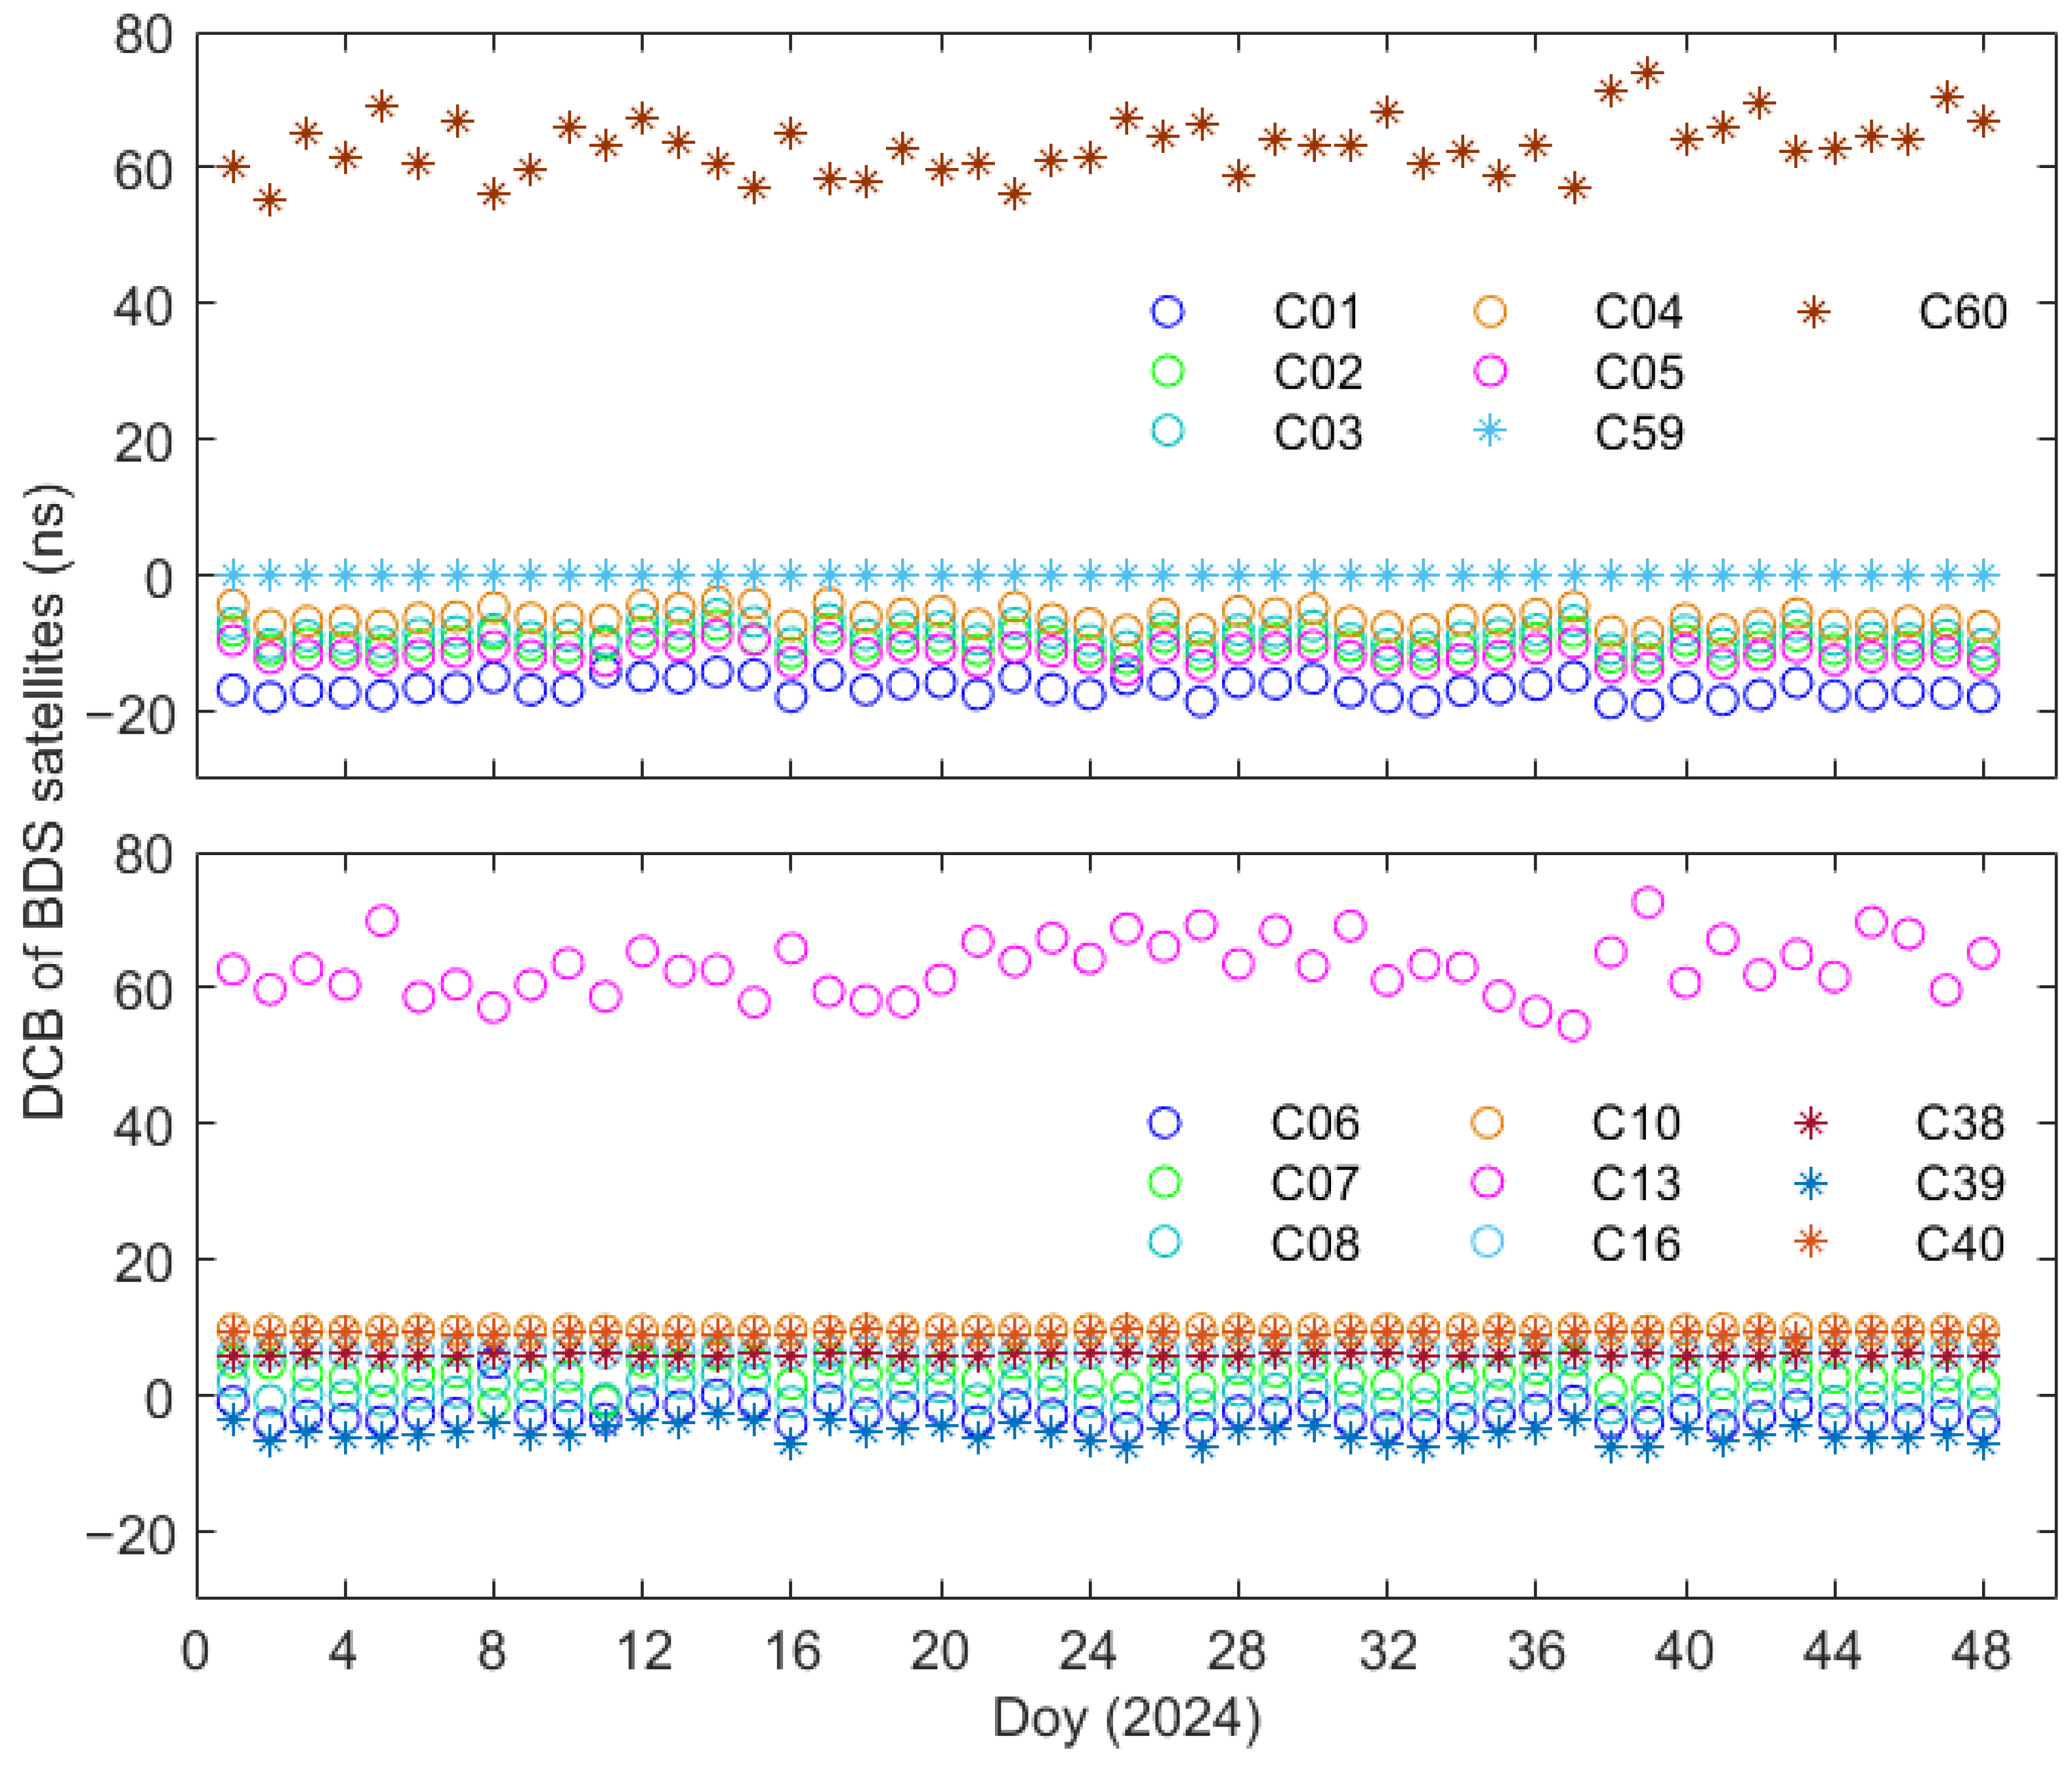
Both POLY and SHF models can be utilized to estimate DCBs, leading to the adoption of these two methods for calculating the daily DCB of BDS high-orbit satellites. Figure 3 shows the daily estimated DCBs of BDS high-orbit satellites with C2I and C6I measurements using a polynomial model in the first 48 days of 2024. The upper subplot in Figure 3 illustrates the estimated daily DCBs of seven BDS GEO satellites, comprising five BDS2 satellites (PRN: C01~C05) and two BDS3 satellites (PRN: C59 and C60). Meanwhile, the lower subplot displays the DCB values of BDS IGSO satellites, including nine BDS2 satellites (PRN: C06~C10, C13, C16, C38~C40). Notably, C09 is excluded due to its frequent cycle slips. The calculated DCBs of BDS GEO satellites exhibit small fluctuations with the exception of C60, the estimated DCBs of BDS GEO satellites typically fall within the range of 0 to 20 ns. Similarly, the DCB values of BDS2 IGSO satellites also demonstrate small fluctuations, with differences generally below 9 ns. It is worth mentioning that the DCBs of IGSO satellites in the same orbit exhibit significant correlation, while the DCBs of IGSO satellites in different orbits show distinct differences.
Likewise, Figure 4 illustrates the daily estimated DCBs of BDS high-orbit satellites using the SHF model during the first period. It is evident that both GEO and IGSO satellites exhibit good consistency in their DCB estimators, with the exception of C13 and C60. When compared the DCB estimations depicted in Figure 3, the differences in DCBs obtained using the SHF model can reach up to 15 ns, demonstrating a lower level of consistency. This discrepancy could be attributed to the fact that the unknown parameters of the POLY model are roughly half of those in the SHF method. With the same set of measurement data, a reduction in parameters typically leads to more accurate estimations. It is important to highlight that the anomalous daily DCB estimates for certain high-orbit satellites occur during the periods from DOY 001 to 048, as observed in both Figure 3 and Figure 4.
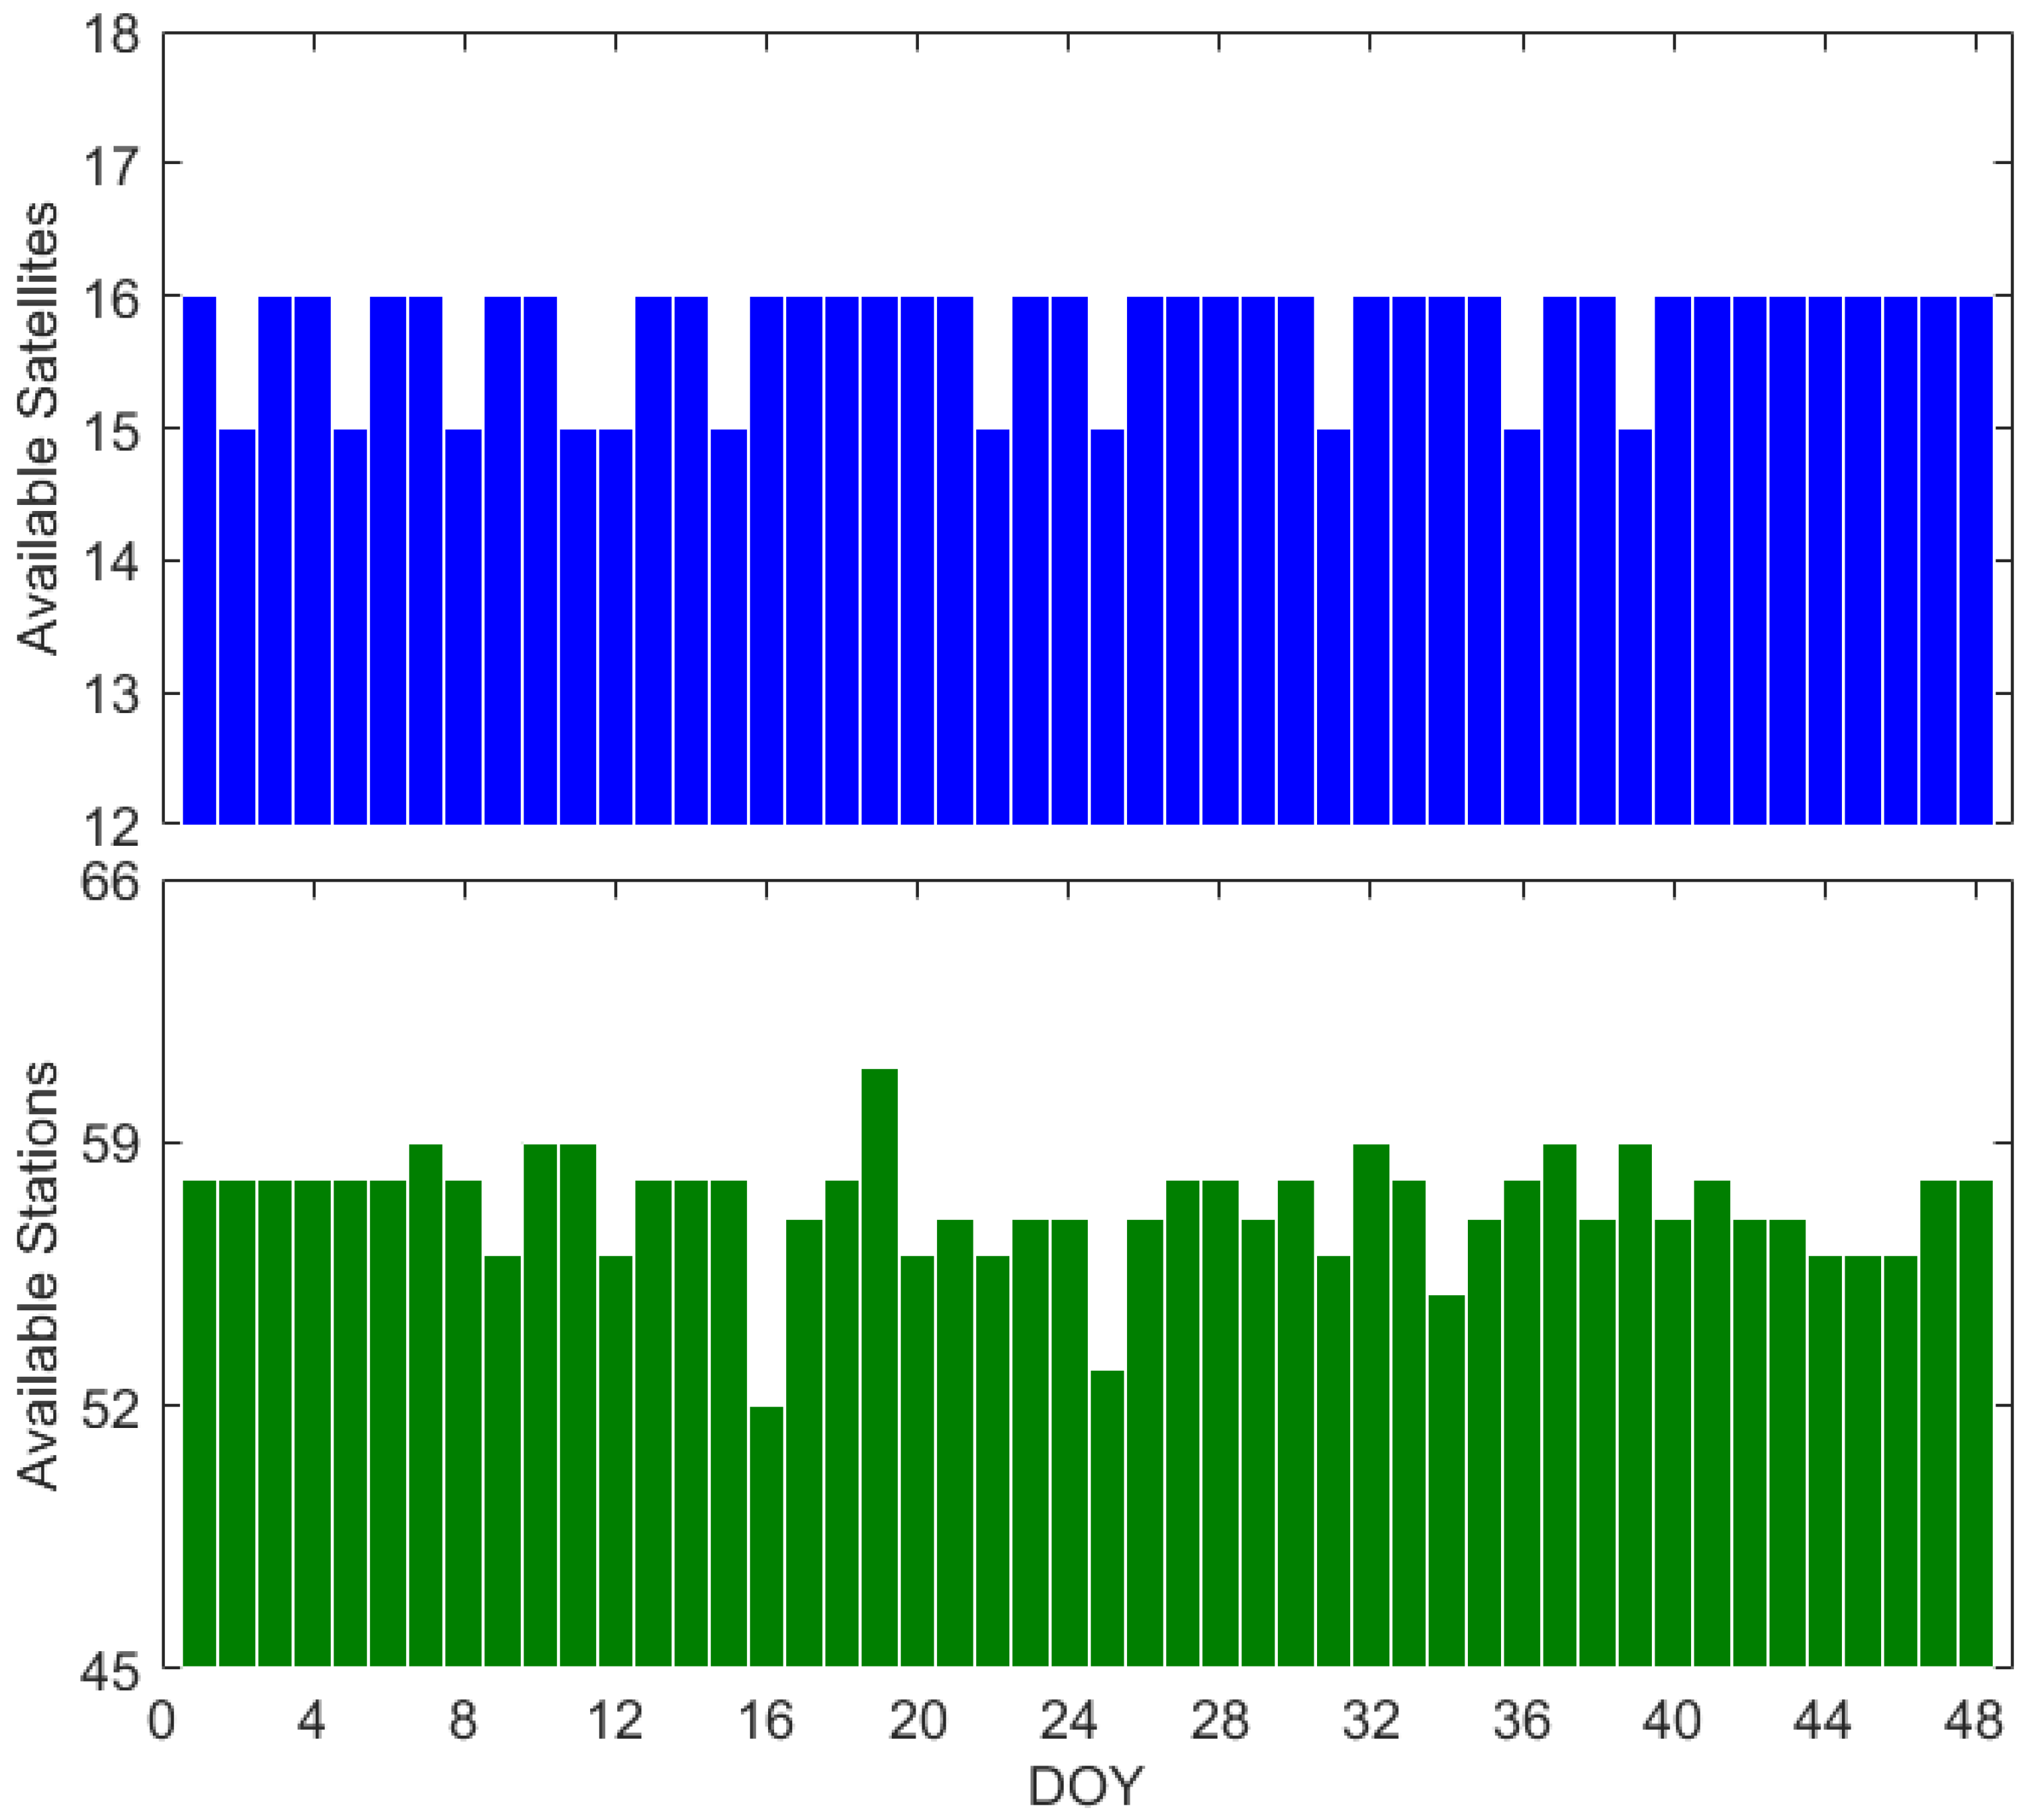
To further analyze the origins of anomalous DCB estimates, we conducted a meticulous statistical analysis spanning 48 days. Within Figure 5, the upper subplot shows the count of accessible BDS high-orbit satellites, whereas the lower subplot illustrates the number of available regional GNSS stations. Notably, since the sub-satellite points of BDS high-orbit satellites are mainly concentrated in the Asia–Pacific region, the count of available satellites throughout the 48-day period exhibits a remarkable constancy, hovering around 16. It should be noted that the variation in the number of satellites not only affects changes in unknown parameters but also alters the least squares constraint conditions. Therefore, even though the change in satellite count is small, its impact cannot be overlooked, especially concerning C13 and C60. Furthermore, the landscape of available GNSS stations changes significantly due to equipment upgrades at specific stations, leading to noticeable changes in operable GNSS stations. For instance, on DOY 16 and DOY 25, the number of available stations decreased to 52 and 54, respectively. Notably, the satellite DCB estimators for those days in Figure 3 and Figure 4 also exhibited significant fluctuations. Therefore, we can reasonably conclude that variations in both the number of accessible satellites and stations impact the stability of satellite DCB estimations, with the former having a more pronounced effect.
In prior research, the DCBs of BDS high-orbit satellites, sourced from CAS or other analytical centers, have consistently served as reference points. However, our study introduces a novel approach by imposing a zero-mean constraint solely on the available high-orbit satellites, rather than considering all available satellites. This deviation from the conventional method results in distinct DCB estimations. Subsequently, the mean DCB of satellites is adopted as a benchmark for a comparative evaluation of the efficacy and limitations of the two methodologies.
Table 4 presents a comparative analysis, with the fourth and fifth columns showcasing the statistical outcomes of the SHF method, while the sixth and seventh columns present the statistical findings derived from the POLY method. The term ‘Max-Min’ denotes the difference between the maximum and minimum DCB values (sometimes referred to as the range), whereas the ‘RMS’ can be computed by
R M S = i = 1 n D C B _ E S T i D C B _ E S T ¯ 2 n
where i represents index of DOY; n is the total number of signal tracking days; and D C B _ E S T and D C B _ E S T ¯ refer to daily estimated and mean DCB values, respectively [61].
The analysis reveals that the DCB ranges computed using the SHF model exceed 10 ns, notably exceeding 18.1 ns for C13 and C60. In contrast, the DCB ranges derived from the POLY model uniformly fall below 9.9 ns, indicating a high level of consistency in BDS satellite DCB estimates. Additionally, the RMS values for the discrepancies between the estimated values and mean estimators using the SHF model consistently exceed 1.5 ns, peaking at 4.0 ns for C13 and C60. Conversely, the RMS values for the POLY model consistently remain under 2.0 ns. These statistical findings align with the results presented in the preceding figures, supporting the selection of the POLY model for subsequent analysis. Furthermore, it can be seen that there is no systematic difference in the satellite DCB between BDS2 and BDS3, whether using the SHF or POLY method.
It is essential to note that the ranges and RMS values for satellites C13 and C60 are larger than those of other satellites. This increase may be attributed to inconsistent tracking, which could arise from their positions or the geometry of the GNSS constellation at various times, resulting in the poor continuity of observations. For example, during the first observation period (DOY 001-048) in 2024, the CHU1 station recorded a total of 138,240 epochs. During this period, the number of tracked epochs for satellite C16 was 95,913, accounting for 69.4% of the total observations. In comparison, satellite C13 was tracked for 92,040 epochs, representing 66.5%. For the GEO satellite C59, tracking occurred for 137,938 epochs, accounting for an impressive 99.8% of the total; however, the CHU1 station completely failed to track satellite C60 during this same period. Thus, these tracking disparities may significantly impact the reliability of DCB estimations.
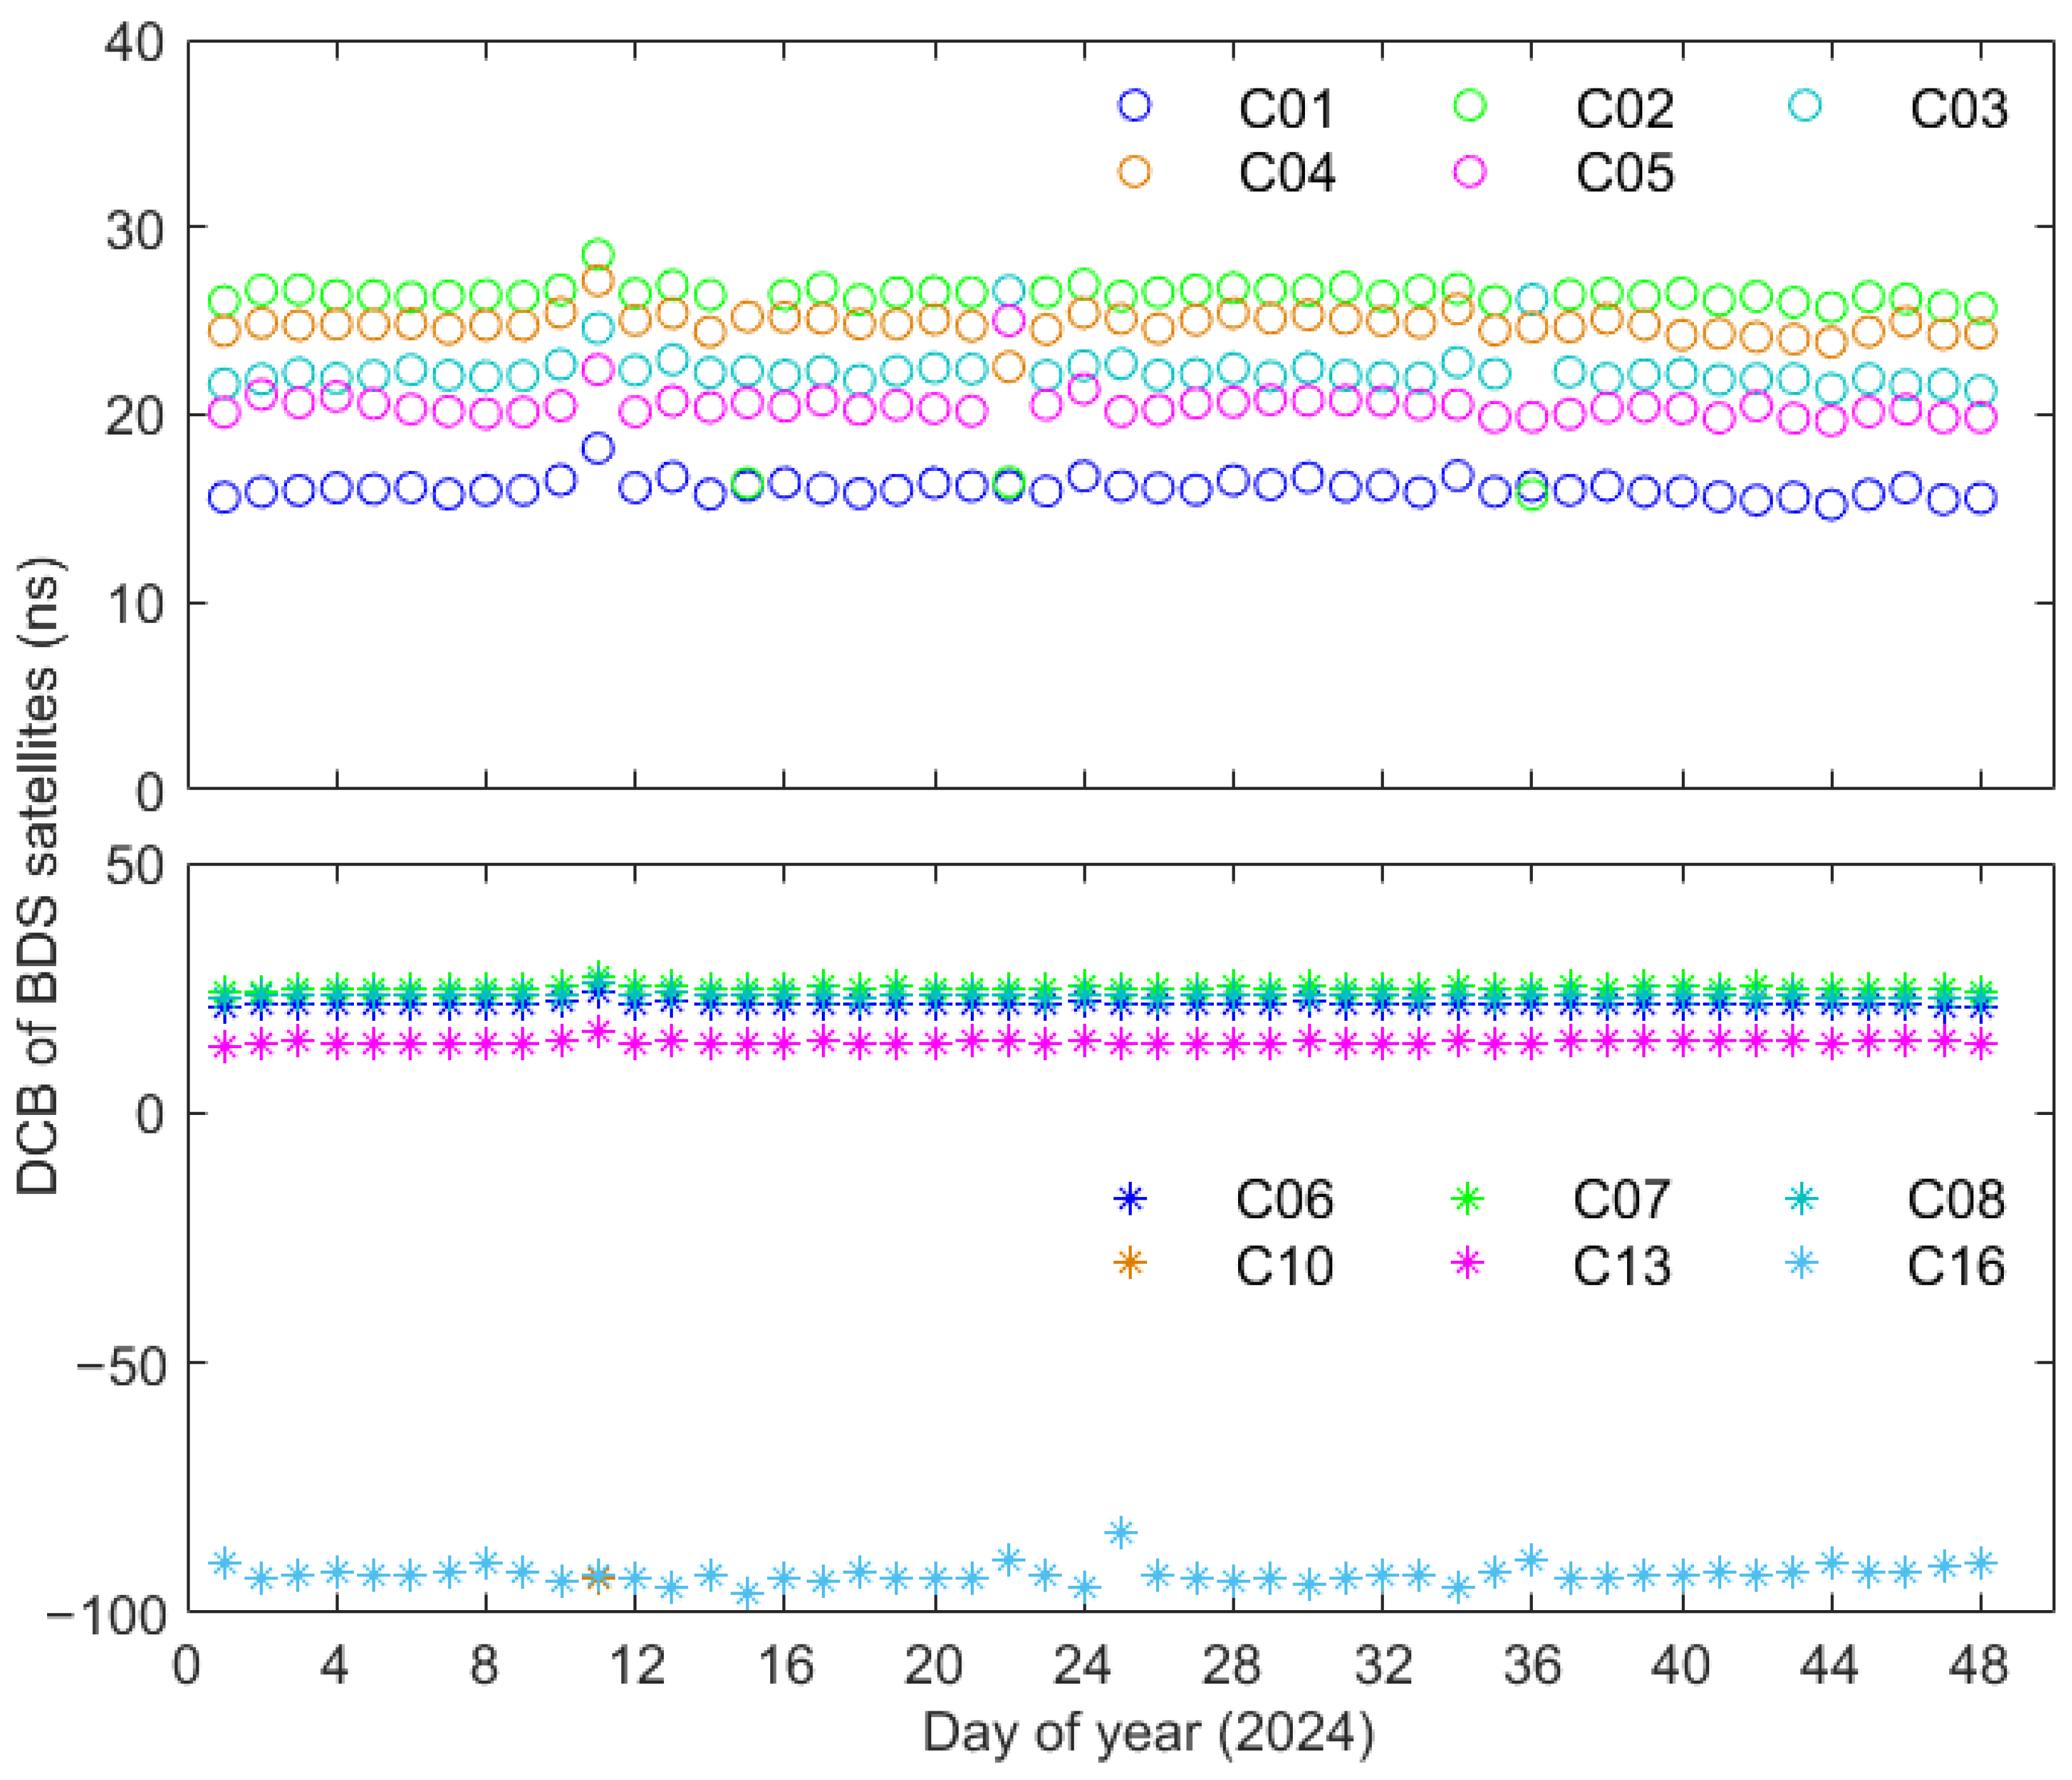
To gain a deeper insight into the characteristics of BDS high-orbit satellite DCBs, a polynomial model was employed to estimate the daily satellite DCBs utilizing C2I and C7I signals. The daily estimated DCBs of five GEO satellites and six IGSO satellites are depicted in Figure 6. It is evident that a close correspondence of high-orbit DCBs among signals of the same frequency is observable, with the DCB estimators based on C2I and C7I signals falling within a range of 10 to 30 ns, except for C16. Notably, the DCBs of the BDS3 high-orbit satellites are omitted from this illustration due to the replacement of the 7I signal with 7A, 7D, or 7Z in the BDS3 system. In comparison with Figure 3, the estimated satellite DCBs between C2I and C7I exhibit notable disparities from those between C2I and C6I, which can be attributed to the altered number of available satellites under the zero-mean constraint condition. Furthermore, the RMS errors of BDS2 high-orbit satellite DCB estimators predominantly fall within 1.9 ns, indicating a similar stability to that of C2I–C6I satellite DCBs. Despite the superior signal quality of C6I over C7I, the stability of the C2I–C6I DCBs does not surpass that of the C2I–C7I DCBs, which might be attributed to the smaller coefficients delineated in Equation (7).

3.3. Performance of Estimated RIMs Using Dual-Frequency Signals from BDS High-Orbit Satellites

As the global ionospheric TEC is typically modeled using dual-frequency signals from GPS or GLONASS satellites, it is important to investigate the performance of BDS signals in ionospheric modeling. Given the limited coverage of BDS high-orbit satellites, the RIMs generated using C2I–C6I signals from BDS high-orbit satellites are compared with the final GIM products from the IGS Analysis Center. Two metrics are used in this study to evaluate the consistency of RIMs and IGS final products, with their calculation formulas as follows:
b i a s = i = 1 n × m cos ( B i ) V T E C i V T E C r e f / i = 1 n × m cos B i           R M S = i = 1 n × m cos ( B i ) V T E C i V T E C r e f 2 / i = 1 n × m cos B i
where b i a s and R M S refer to the difference and root mean square between the estimated VTEC with BDS measurements and the final ionospheric products from Whrg and B represents the latitude of the grid point. For a global ionospheric product with a resolution of 5° × 2.5° for longitude and latitude, each epoch includes 5183 grid points. Considering that ionospheric grid points are densely distributed at high latitudes and sparsely distributed at low latitudes, weighted processing based on the cosine function of B is applied to calculate these two metrics.
Measurements from the first eight days of 2024 were utilized to evaluate the validity of the weighting method proposed in Section 2.2.4. Both the traditional elevation angle weighting (as described in Equation (14)) and the enhanced elevation angle weighting formula (Equation (15)) were employed to determine the weight matrix. The POLY method with degrees (8,4) was applied for modeling the regional ionosphere. Then the VTEC estimators were compared with ionospheric products from Whrg, with RMS errors calculated using Equation (17). As shown in Table 5, the adoption of the improved method resulted in a decrease in the RMS errors of the 8-day period, achieving a reduction of up to 0.927 TECU and a corresponding improvement rate of 7.87%. This suggests that the new method can enhance the accuracy of RIM. However, it is important to note that the improvement achieved by this method is modest. The primary reason for this limited enhancement is that the satellites used to establish the RIM are all high-orbit satellites (GEO and IGSO), which operate at nearly identical orbital altitudes. This results in minimal differences in the term on the far right of Equation (15). Consequently, incorporating data from multiple orbital satellites in the ionospheric model will likely yield further improvements in modeling accuracy.
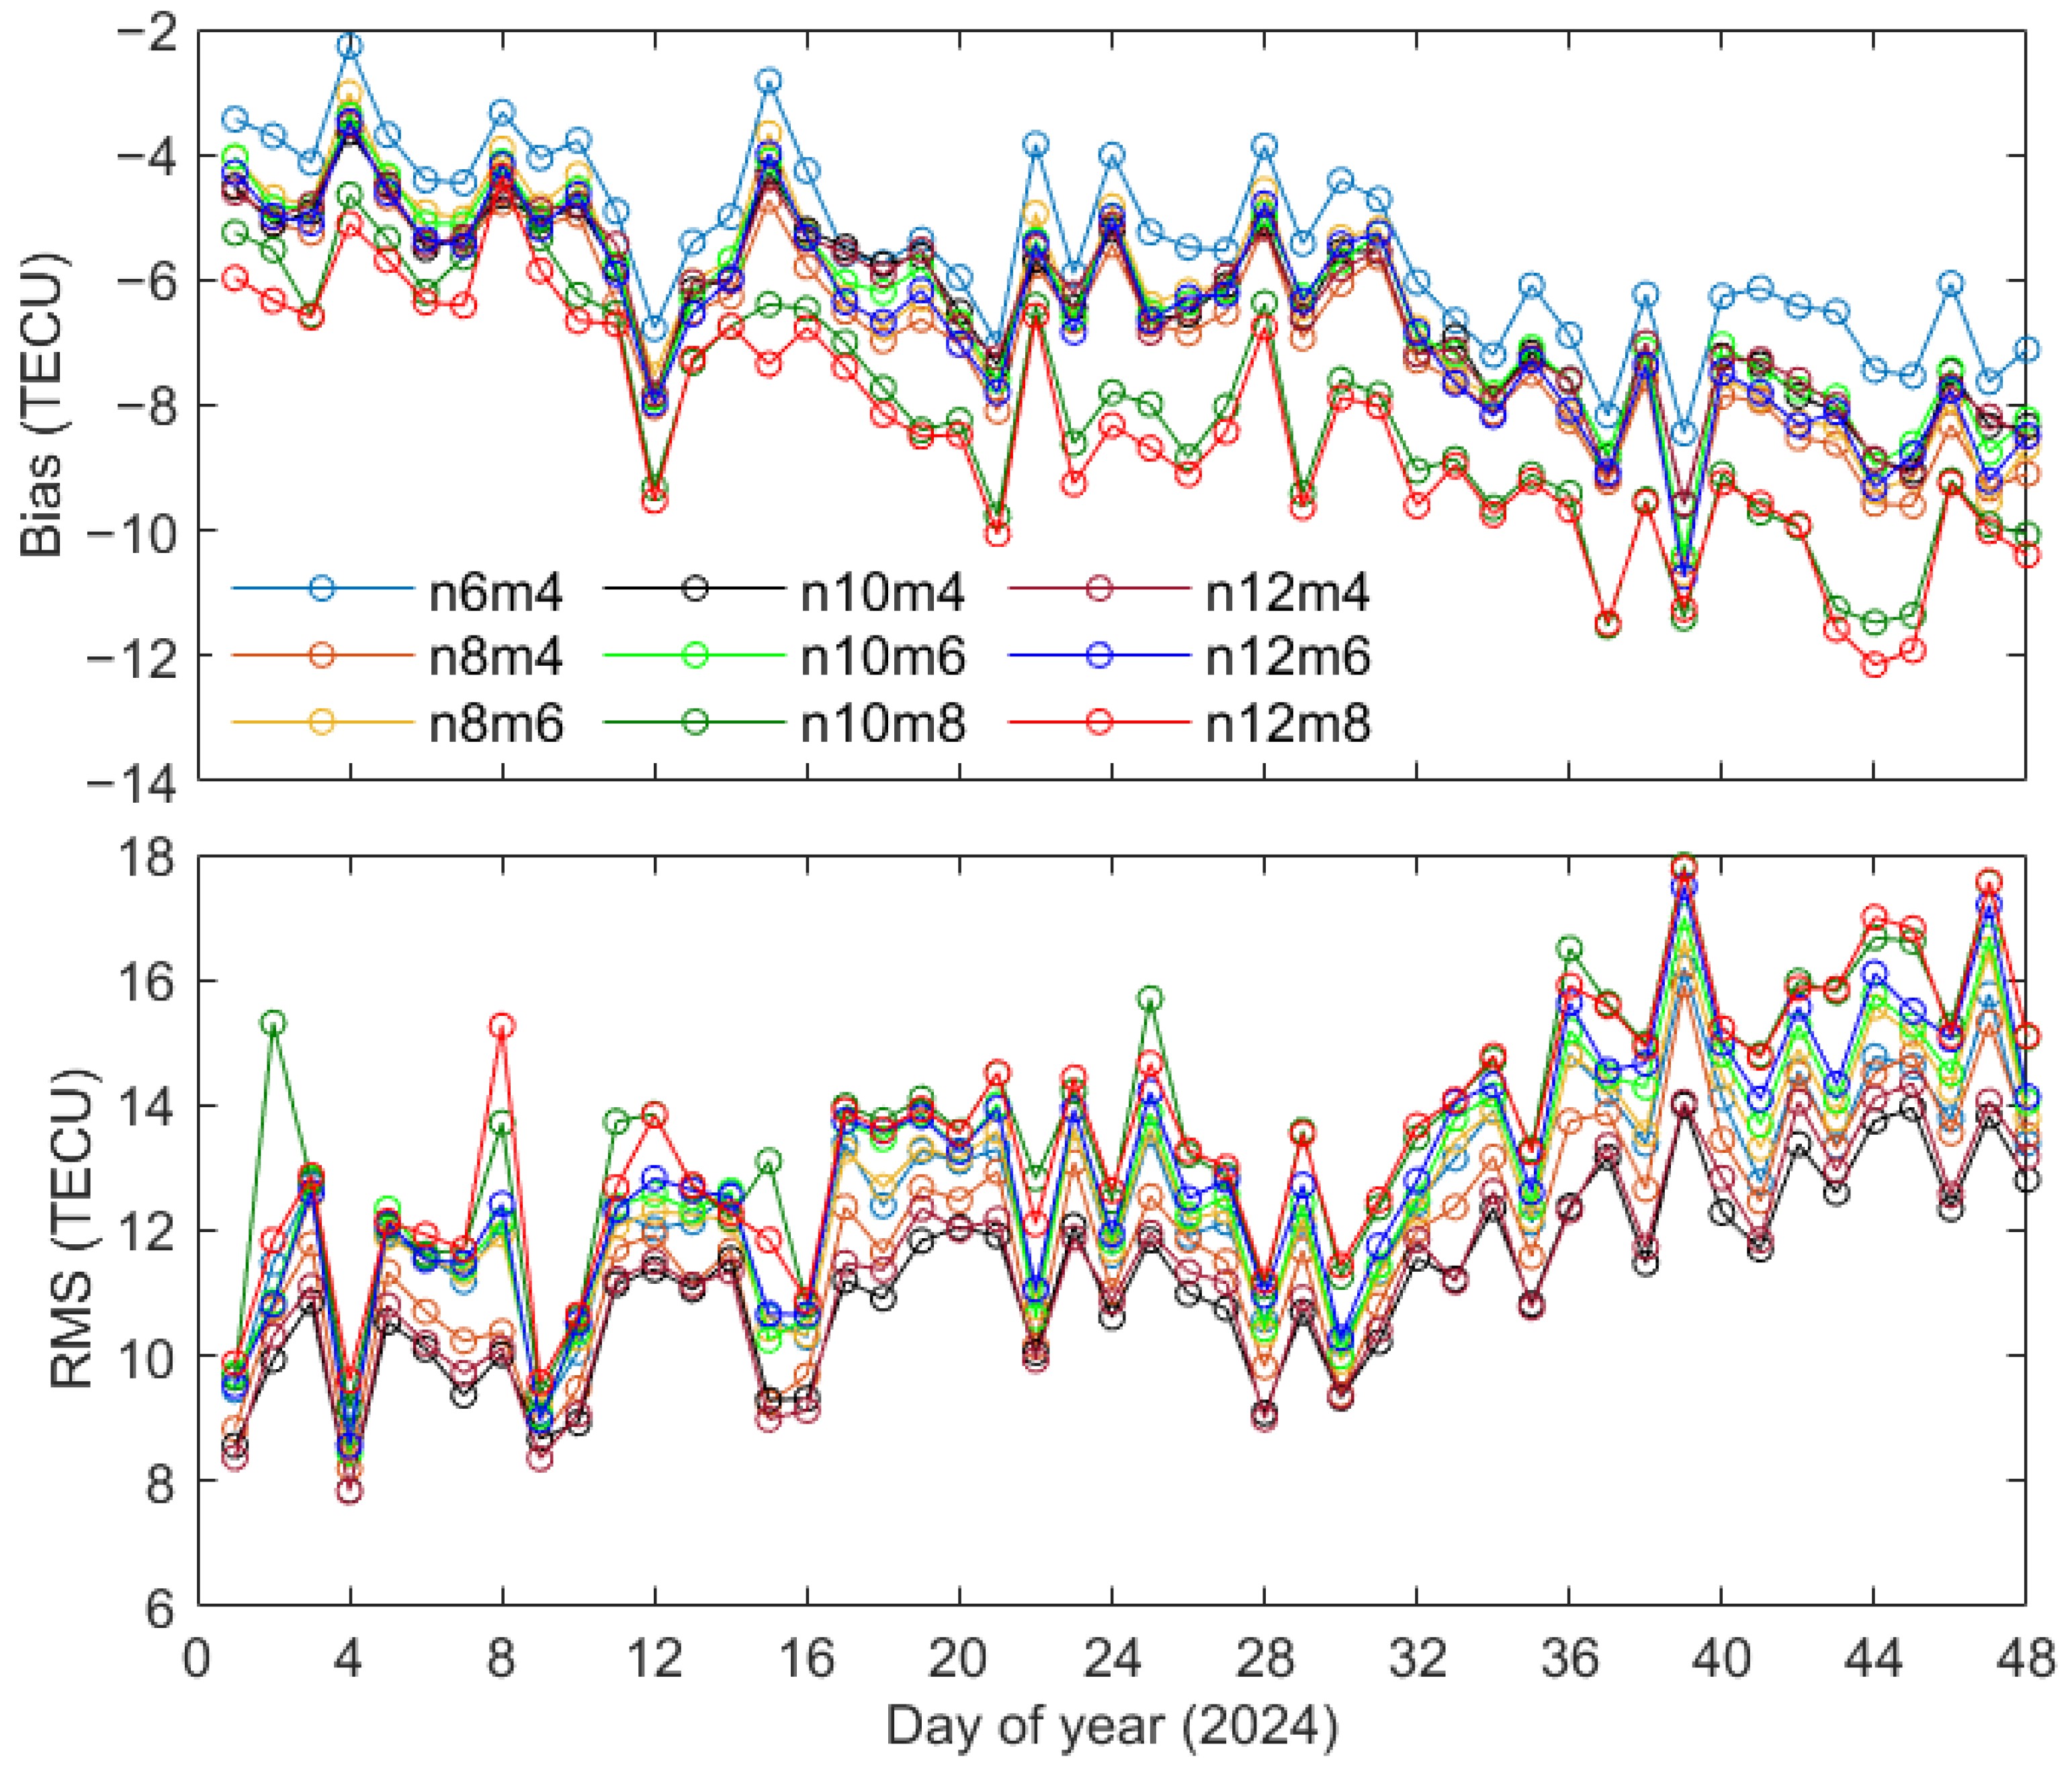
To determine the optimal order ( n ) and degree ( m ) of the POLY model, the differences between the BDS-based RIMs and the final GIMs produced by the IGS Analysis Center during the DOY 001-048 in 2024 are illustrated in Figure 7. The upper subplot shows the bias series, while the lower subplot showcases the RMS values. Despite variations in the parameters utilized in different schemes, both the bias and RMS sequences demonstrate notable consistency. For specific settings, when the degree is set to four and the order ranges from six to twelve, the respective maximum RMS values of VTEC over 48 days are 16.2, 15.9, 14.0, and 14.3 TECU, respectively. Similarly, with the order fixed at 10 and the degree increasing from four to eight, the corresponding maximum RMS values of VTEC over 48 days are 14.0, 17.0, and 17.8 TECU. It is crucial to note that the changes in the availability of satellites and operational stations affect not only the DCB estimators but also the VTEC estimations, leading to corresponding fluctuations in bias and RMS errors.
An interesting phenomenon is observed in the bias of BDS-based VTEC estimators, which is the consistent displaying of negative values. This suggests that the VTEC values derived from the dual-frequency signals of BDS high-orbit satellites are lower than those provided by the GIM products, potentially attributed to the regional distribution of sub-satellite points of BDS GEO and IGSO satellites. Importantly, increasing the degrees and orders of the POLY model does not always correlate with improved modeling accuracy. A higher degree and order of the polynomial model results in a larger number of parameters to be estimated ( ( n + 1 ) × m + 1 ), which in turn increases computational complexity. Due to the limited raw measurements and reduced redundant observations, there is a risk of decrease in estimating model parameters, potentially leading to an escalation in RMS errors. For instance, setting n and m to six and four, respectively, the range of RMS values over a span of 48 days varies from 8.8 to 16.2 TECU. However, increasing n and m to twelve and eight, the RMS variation can rise to 17.8 TECU. Consequently, in the subsequent sections of this study, the maximum order and degree of the POLY model will be capped at ten and eight, respectively.
Figure 8 illustrates the spatial distribution of regional ionospheric maps over six specified days in 2024 (DOY: 008, 016, 024, 032, 040, and 048). These VTEC maps are generated using a POLY model with dual-frequency observables (C2I–C6I) obtained from BDS high-orbit satellites. The study area spans from 60°E to 160°E longitudinally and from 15°S to 50°N latitudinally, with the geometric center of the modeling domain precisely at 10°N latitude and 110°E longitude. The VTEC maps exhibit notable consistency across different days, with small fluctuations in the mid-latitude zone, suggesting a periodic pattern in the ionosphere behavior during stable magnetic periods. In the western part of the study area, the VTEC values generally stay below 20 TECU, whereas in the eastern part, they can reach up to 40 TECU. This variation may be due to the geographic location of regions east of 120°E, which are significantly influenced by the North Pacific Ocean. High levels of water vapor evaporation in this area during morning hours (8–11 a.m. local time) could induce a positive disturbance in the ionosphere, resulting in the higher VTEC values observed.

3.4. Analysis of the Ionospheric Disturbance Responses to Severe Geomagnetic Storm

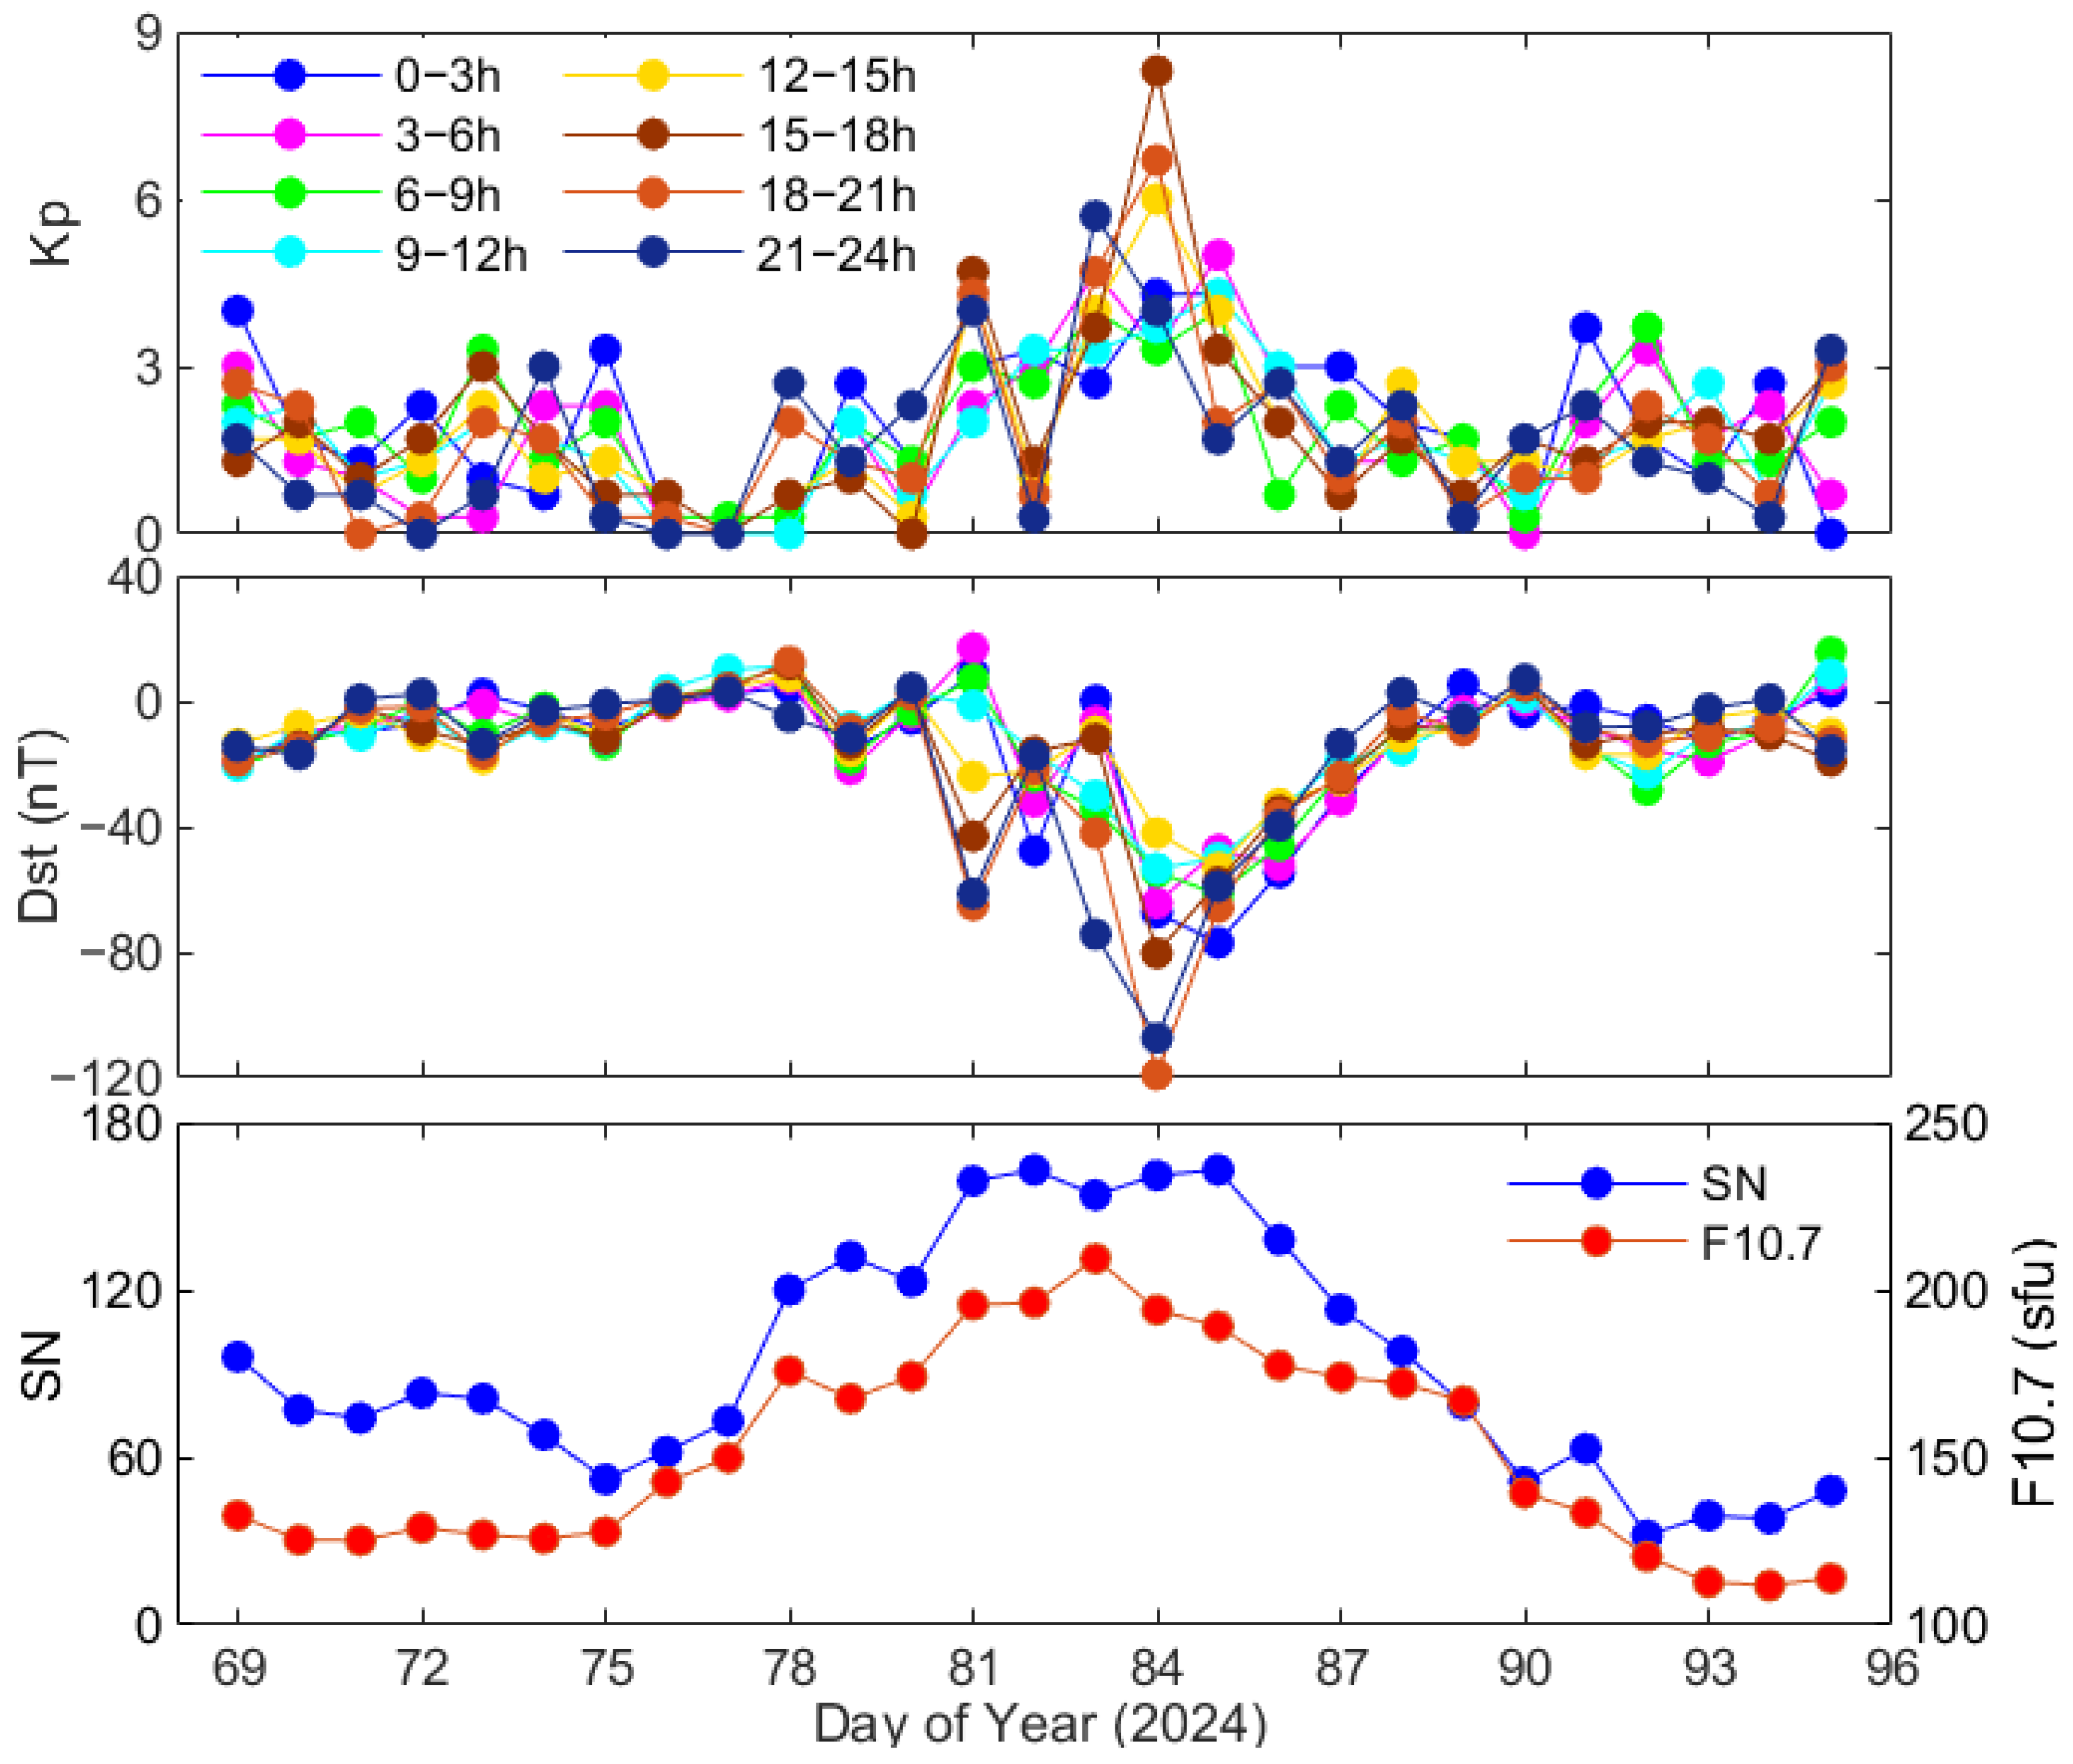
This section, based on previous research, establishes a regional ionospheric model using POLY to study the response characteristics of the ionosphere during geomagnetic storms. In Figure 9, the Kp index, Dst, international sunspot number (SN), and the 10.7 cm solar radio flux (F10.7) are utilized to illustrate the geomagnetic condition variations from 9 March (DOY: 69) to 9 April (DOY: 95) in 2024. The Kp and SN are dimensionless, while the Dst and F10.7 are measured in nanoteslas (nT) and solar flux units ( 1   s f u = 10 22   W m 2 H z 1 ), respectively [62,63]. The upper subgraphs present the three-hourly Kp and Dst index series, which serve as consistent indicators of the energy transfer between solar wind and Earth, thereby enabling the assessment of geomagnetic activity intensity. The lower subgraph shows the solar activity levels through the daily variations of SN and F10.7.
It is apparent that the indices Kp, Dst, SN, and F10.7 exhibit regular fluctuations during the initial eight days, indicating relatively stable solar activity and geomagnetic conditions. However, both SN and F10.7 display a sudden increase on 17 March, indicating an escalation in solar activity. The SN index rises to 159 on 21 March, maintaining a stable variation of around −5 to 5 until 25 March. Subsequently, the SN series demonstrates a distinct downward trend, reaching a minimum of 32 on 1 April. Similarly, the F10.7 series demonstrates a bimodal feature, with the first peak at 175.8 sfu on 18 March and the second peak at 209.3 sfu on 23 March. Due to the Kp index’s delayed response to solar activity, its bimodal peaks occur later on 21 March (4.7) and 24 March (9.4). Correspondingly, the Dst series peaks on 21 Marth (−74 nT) and 24 Marth (−128 nT), further confirming the presence of a severe geomagnetic storm.
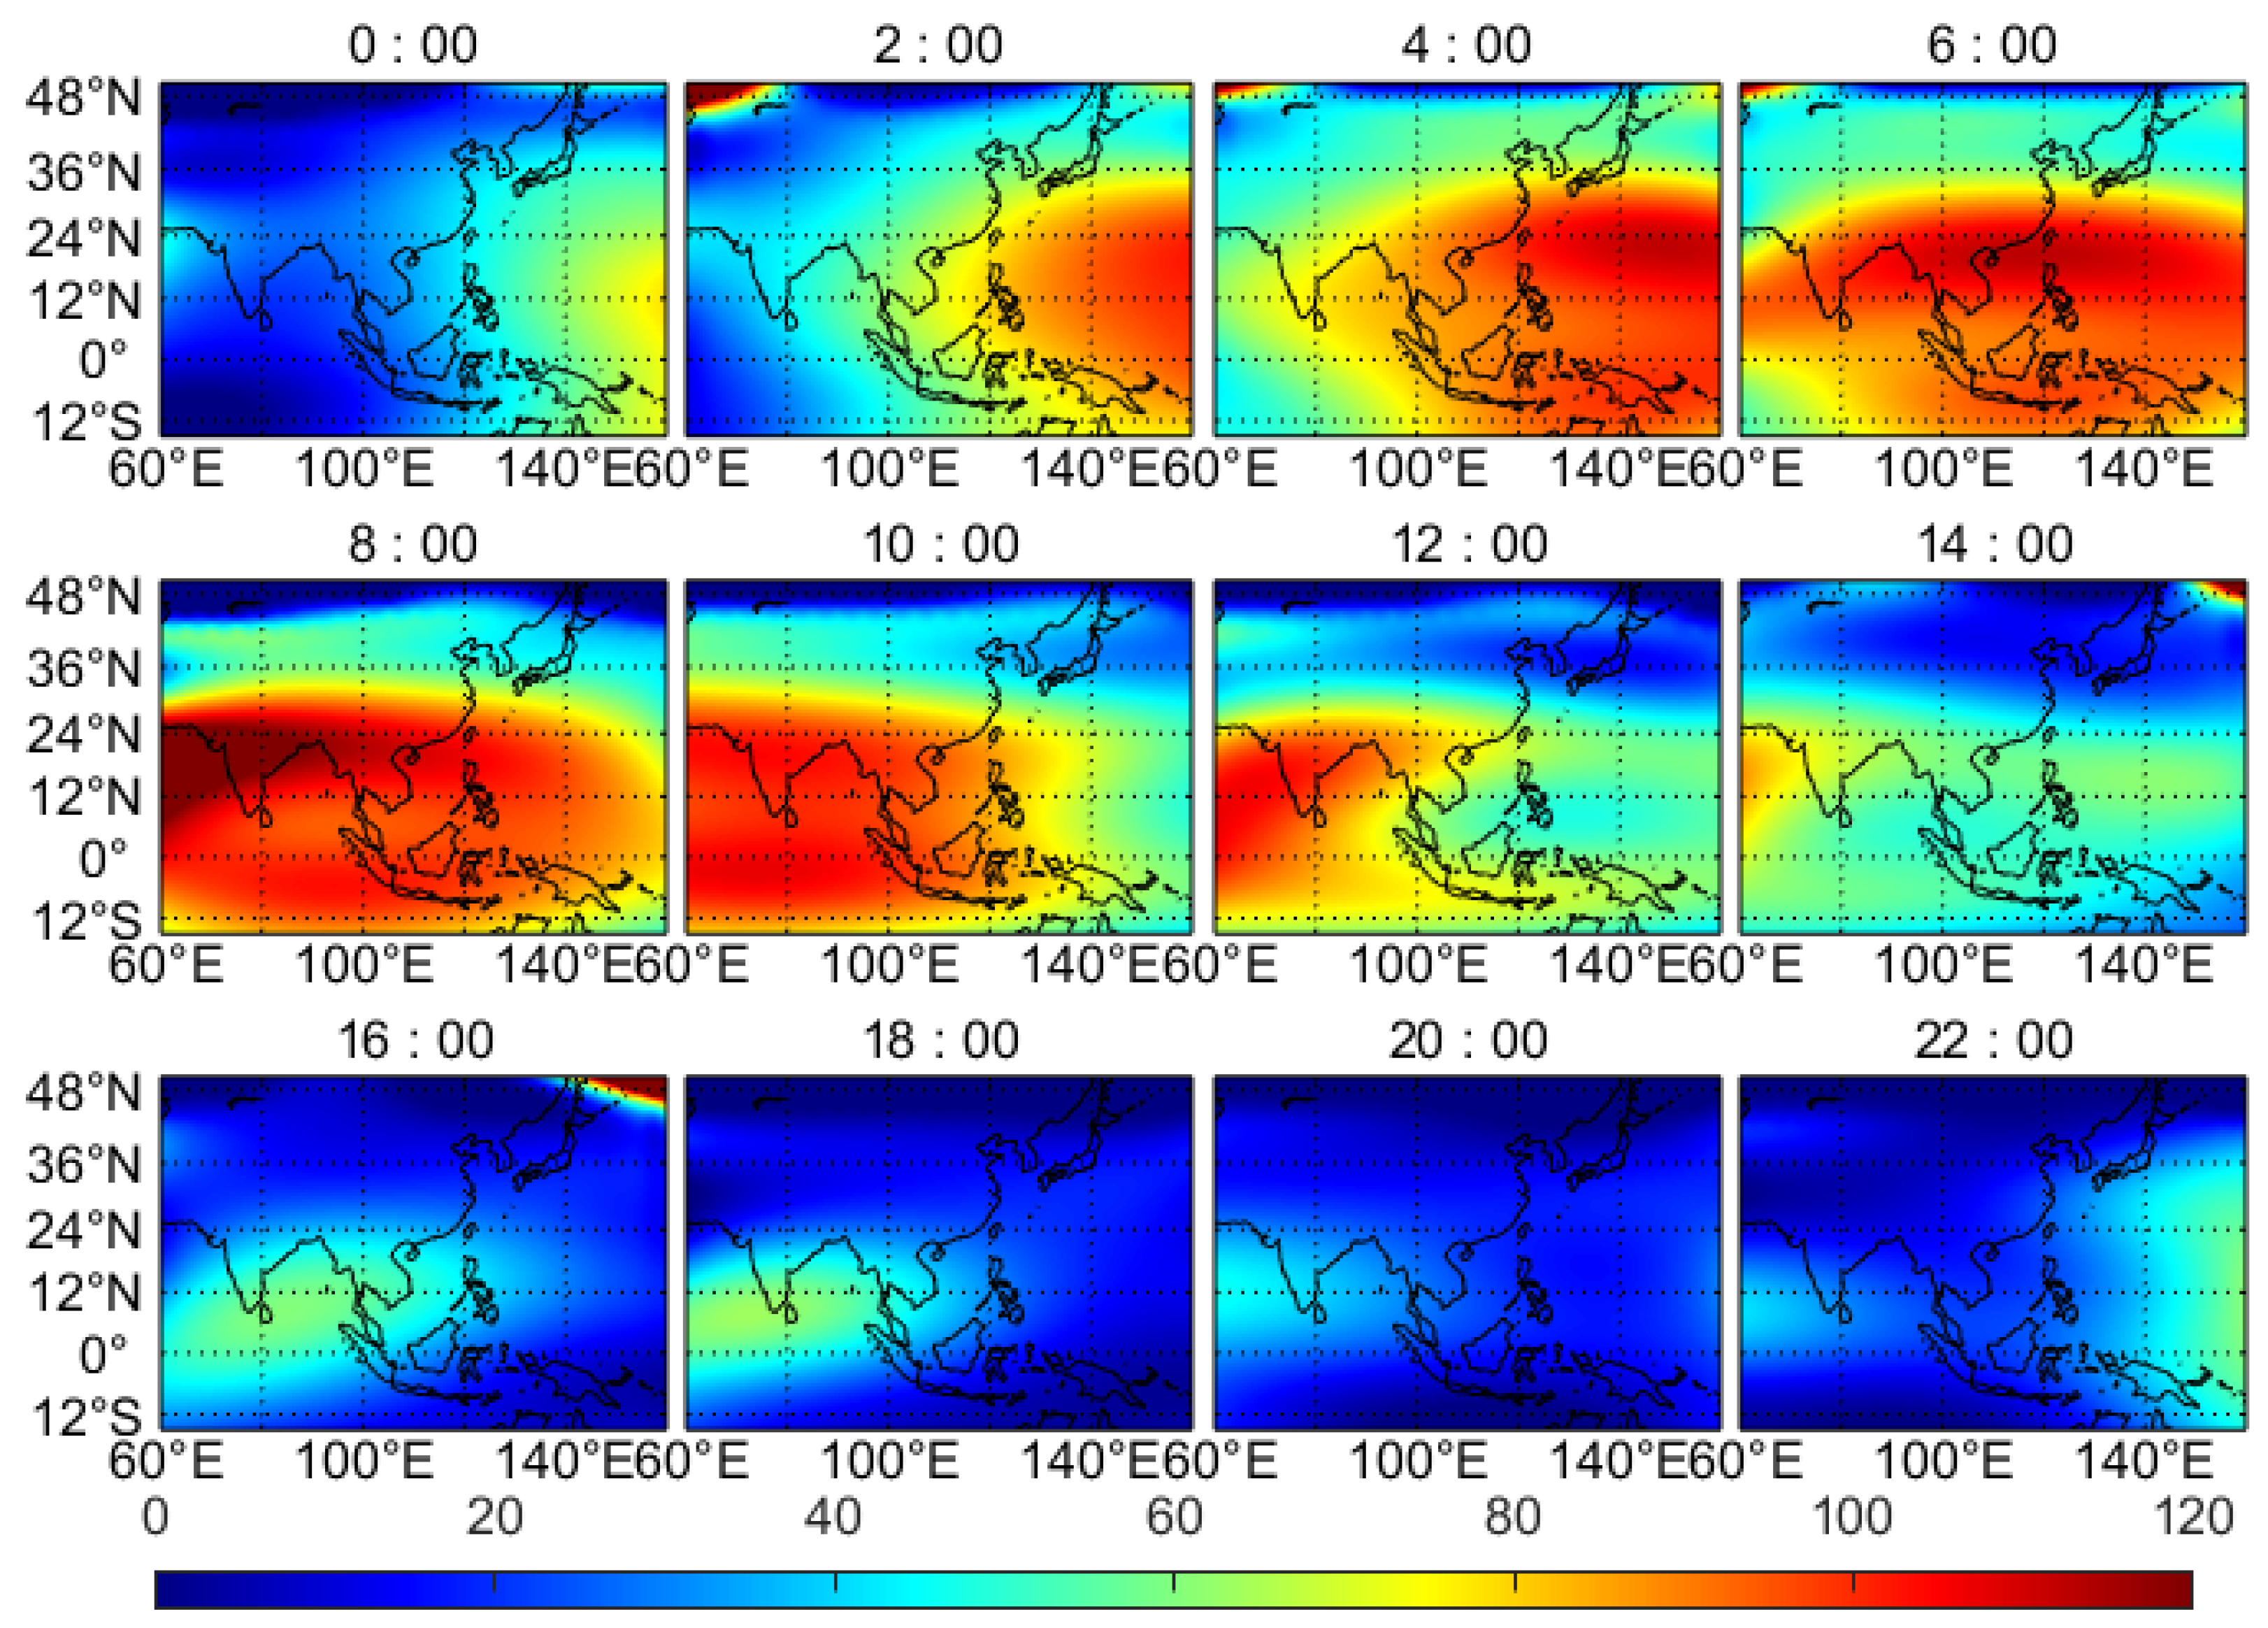
Given the occurrence of a geomagnetic storm on 24 March 2024, which was caused by a coronal mass ejection associated with an X1.1-class solar flare on the 23rd reaching Earth (www.swpc.noaa.gov), BDS observables (C2I–C6I) from high-orbit satellites at regional stations were utilized for ionospheric modeling. A polynomial model with a degree of ten and an order of eight was employed to compute the diurnal variation of VTEC. With a sampling interval of 7200 s, 12 subgraphs were generated for the specific day (refer to Figure 10). To enhance our comprehension of the ionospheric disturbance response, the geographic coordinates of the magnetic center were strategically set at 10°N and 110°E, which can effectively capture the activity trajectory of BDS high-orbit satellites.
Upon analyzing Figure 9, the Kp values began to increase notably at 15:00 and continued until 24:00 (UT). In contrast, the data from Figure 10 illustrates a significant positive disturbance response within the ionosphere, initially detected at 02:00 (UT) and lasting for 10 h. During this period, the VTEC estimators peaked at 100 TECU, indicating a substantial disruption in the ionospheric environment. Moreover, the eastern low-latitude region was the first to detect a positive ionospheric response, followed by a westward propagation of this response, highlighting the dynamic nature of ionospheric disturbances. The VTEC series exhibited a consistent upward trend during this propagation, reaching a peak value of 120 TECU at 8:00 (UT). By 14:00, VTEC values in the East Asia region had decreased to below 80 TECU, signaling a gradual return to normal ionospheric conditions. Subsequently, by 20:00, all VTEC values had dropped below 40 TECU, indicating the resolution of the ionospheric anomalies induced by the solar flare event.
Moreover, analysis of Figure 9 reveals three distinct periods characterized by Kp values exceeding 6.0, totaling nine hours in duration. Concurrently, Figure 10 demonstrates that the ionospheric positive response persisted for approximately ten hours, showcasing a good correlation between the two datasets. Given the inherent delay in the manifestation of geomagnetic storms following solar activity, as evidenced by the approximately 12 h delay observed in this instance, leveraging BDS high-orbit satellites is instrumental in the timely and effective detection of ionospheric anomalies.

4. Discussion

Given the synchronous rotation of BDS GEO satellites around the Earth’s equator, the sub-satellite points of these satellites remain stationary, providing a unique opportunity for continuously monitoring the temporal variations of ionospheric TEC. Assuming the position of a GEO satellite is fixed in the ECEF coordinate frame, TEC estimators derived from GEO measurements can be obtained along a fixed IPP without spatial variability, enabling the precise estimation of temporal ionosphere variations in specific regions. However, the limited dual-frequency coverage of GEO satellites poses a challenge in establishing an ionospheric model solely based on GEO observables. In contrast to the global movement of MEO satellites, IGSO is another type of geosynchronous orbit that tracks a figure eight shape in the ECEF, aiding accurate VTEC estimation. The focus of this study is therefore on evaluating the performance of the BDS high-orbit satellites in modeling regional ionospheric VTEC.
Considering the effects of DCB on VTEC estimation and satellite clock correction, both polynomial and non-SH models are utilized to calculate the DCB values of BDS high-orbit satellites under the same zero-mean constraint condition. The results indicate that there is no obvious systematic bias in the satellite DCBs between BDS2 and BDS3. Furthermore, contrary to previous research conclusions, no systematic difference in the stability of DCB estimators is found between GEO and IGSO satellites. While both the polynomial and non-SH models can be employed to establish the regional ionospheric model, the latter requires estimating approximately 50% more parameters than the former, leading to reduced observations and extra computational time. Consequently, the polynomial model may be the preferable choice for estimating DCBs and regional VTECs.
This paper presents the ionospheric disturbance responses over eastern Asia using dual-frequency signals from BDS high-orbit satellites during the geomagnetic storm in March 2024. Experimental results demonstrate significant positive responses in the ionospheric maps of VTEC during solar activity, consistent with previous studies. The duration of this response aligns well with the KP index reflecting geomagnetic activity. Compared to geomagnetic activity indices (i.e., Kp or Dst), VTEC appears to have the potential for timely predictions of the occurrence, duration, and development trends of geomagnetic storms. However, we acknowledge that the spatiotemporal characteristics of ionospheric variations are highly complex, influenced by a myriad of factors. Moreover, the energy transfer between solar wind and the magnetosphere remains a difficult matter [64] and much effort is needed.
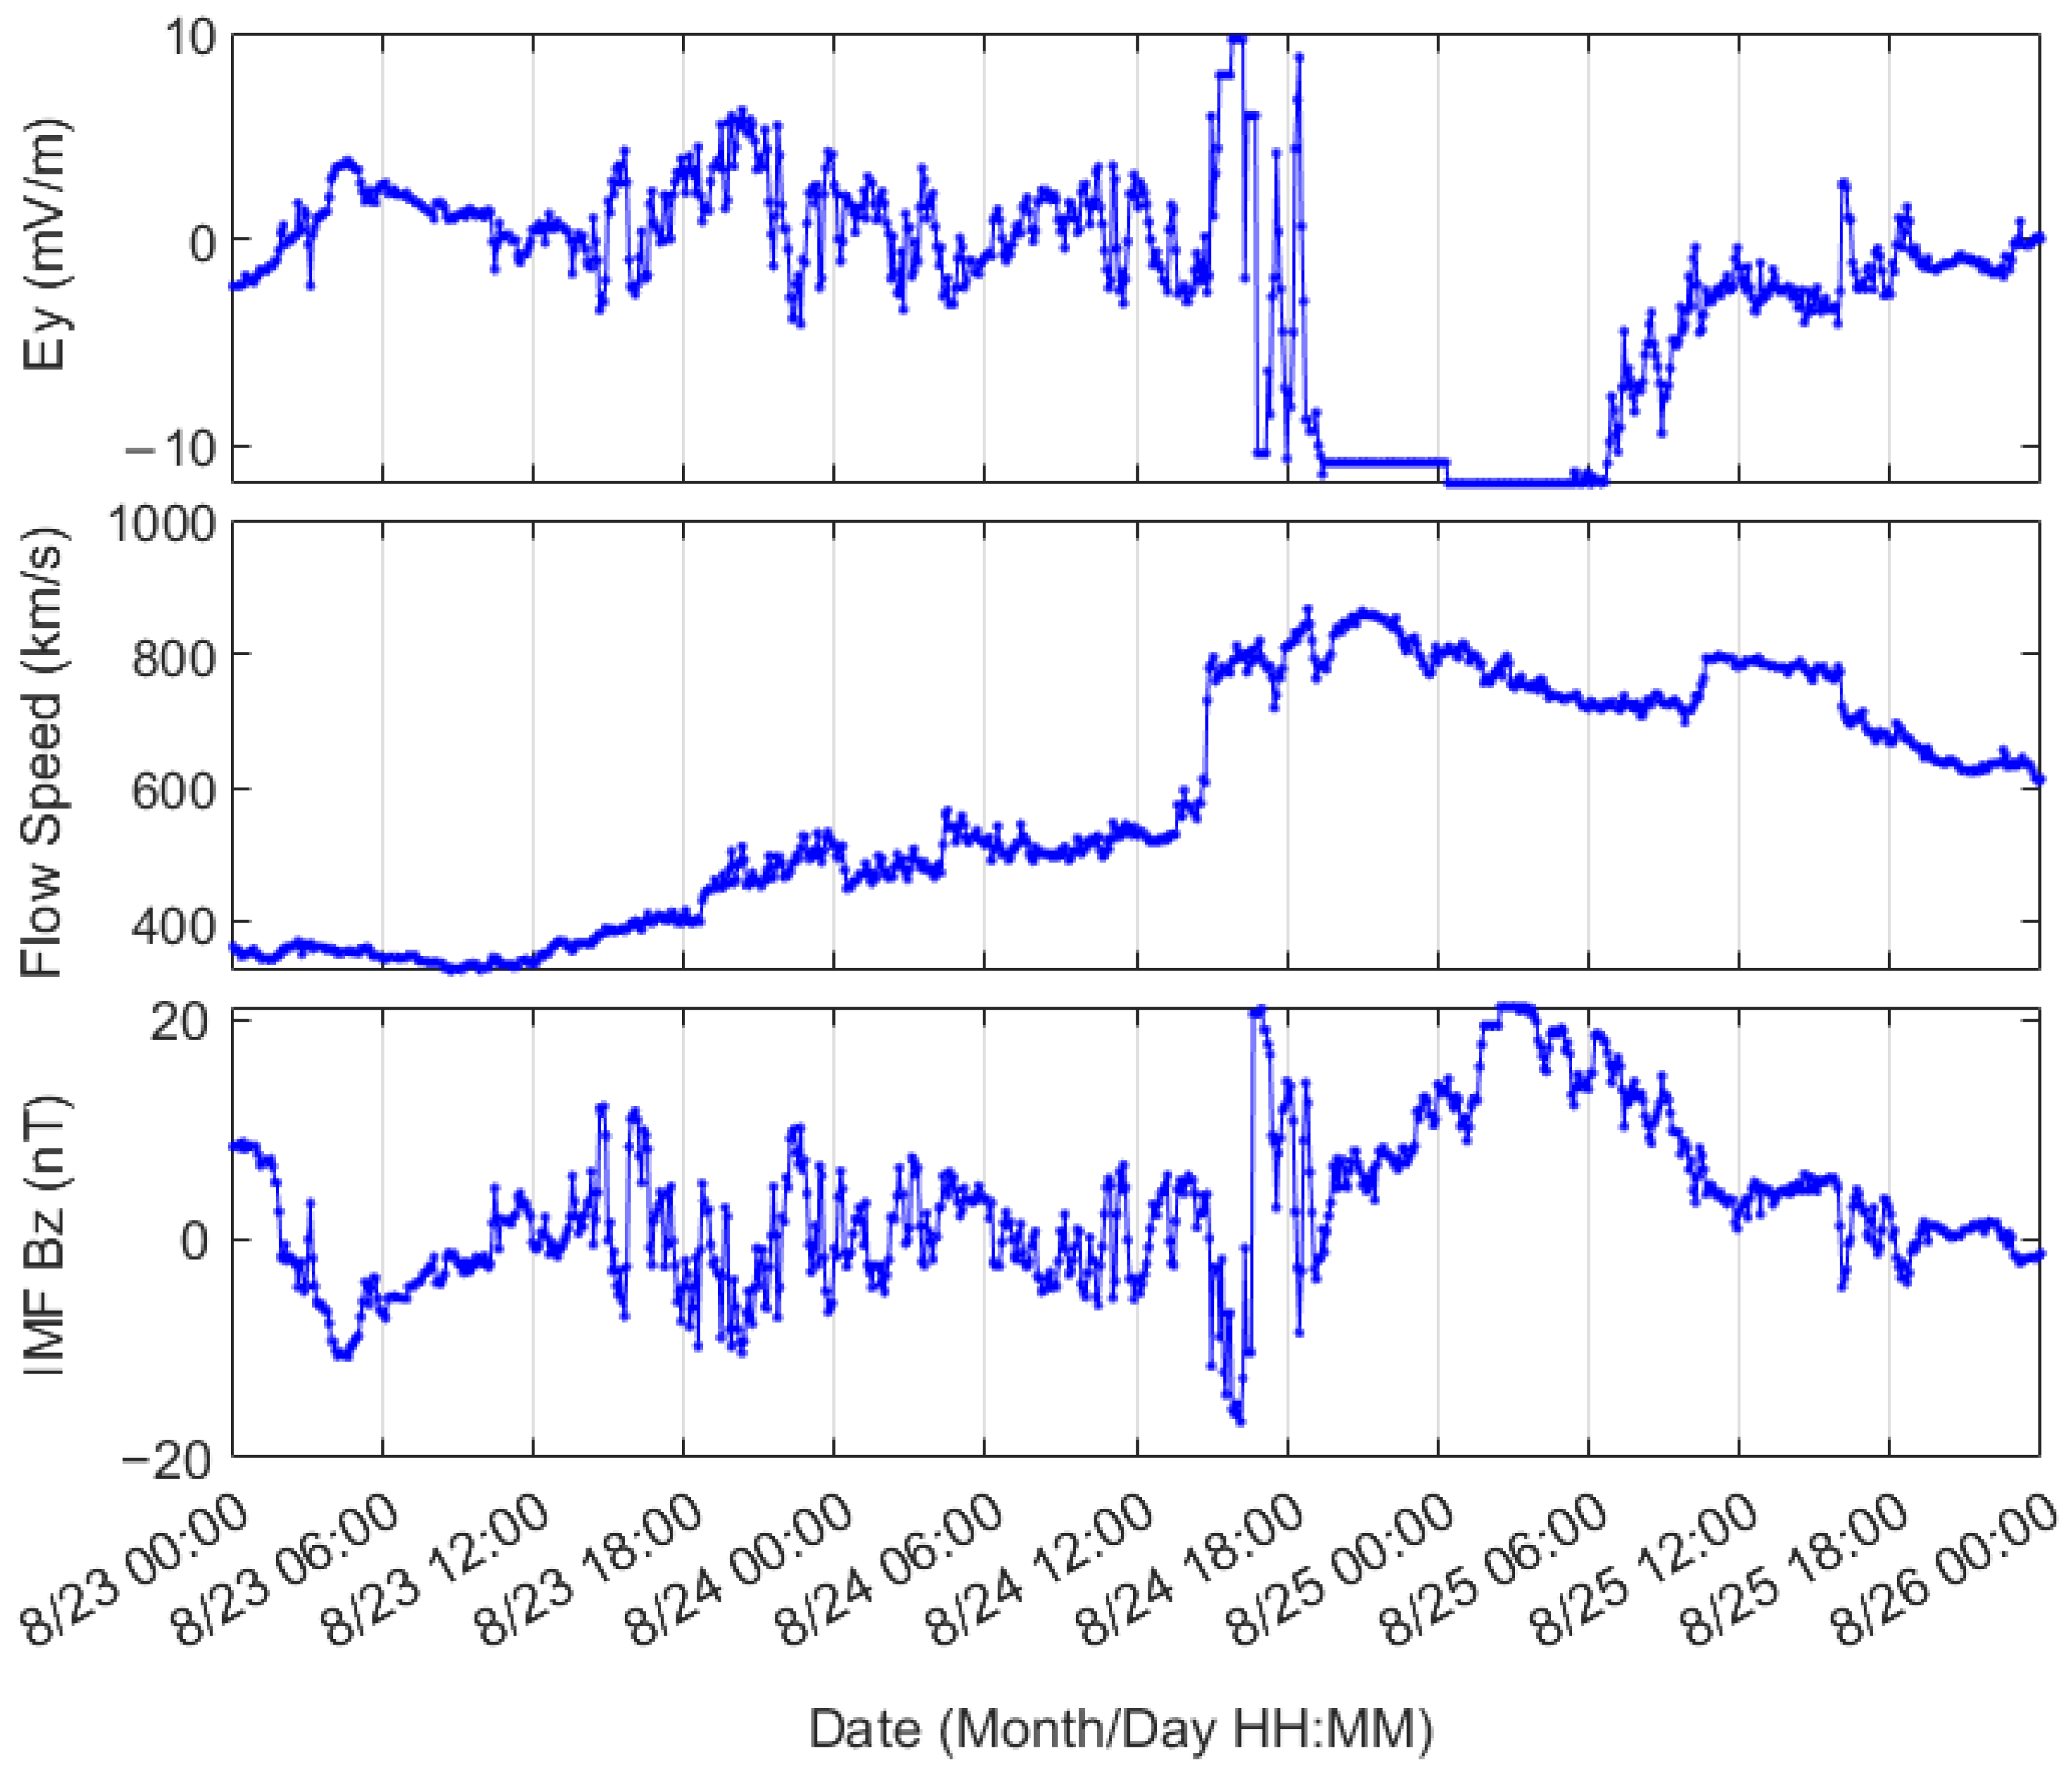
Research suggests interplanetary electric field variations may contribute to positive disturbance responses [30,64,65]. An analysis of data from 23–25 March 2024, reveals a clear positive correlation between the interplanetary magnetic field component Bz (IMF Bz) and the east–west electric field component (Ey) during the main phase of the geomagnetic storm. This phase was characterized by an unexpected increase in solar wind velocity, as illustrated in Figure 11, which depicts the Ey, solar wind flow speed, and IMF Bz series for this period. In contrast, during the recovery phase, the Ey series exhibited prolonged negative phases, while the IMF Bz demonstrated an upward trend. According to the Kp series presented in Figure 9, the sudden commencement (SSC) of the geomagnetic storm began at 12:00 and lasted approximately 10 h. Throughout the main phase, a definitive positive correlation between the IMF Bz and Ey series was noted, with solar wind velocity rising unexpectedly from 500 km/s to 867 km/s. Conversely, during the storm’s recovery phase, the Ey sequence displayed extended negative phases, while the IMF Bz series trended upward, peaking at 20 nT on 25 March.
Figure 11 illustrates that an increase in solar wind speed corresponds to a higher flux of charged particles (primarily electrons and protons) directed toward Earth. When the IMF Bz is negative (southward), it opposes the Earth’s magnetic field lines, facilitating magnetic reconnection [66]. This reconnection enables solar wind particles to penetrate the magnetosphere more readily, typically occurring at the magnetopause where solar wind interacts with Earth’s magnetic field. As a result of magnetic reconnection, electric fields (Ey) are induced within the magnetosphere, accelerating charged particles toward the polar regions.
From a global perspective, the energy transfer from solar wind to the magnetosphere is primarily governed by reconnection and magnetospheric convection processes [65]. The interaction between solar wind and the magnetospheric response highlights the increased geoeffectiveness resulting from various outcomes of solar activity [67]. Notable signatures in the interplanetary medium include considerable enhancements in solar wind density and significant shifts in the southward orientation of the IMF Bz. These signatures are critical contributors to sharp declines in the Dst index (see Figure 9). Additionally, it is proposed that variations in solar wind also influence the response of the O/N2 ratios [30,68]. It is further hypothesized that an increased O/N2 ratio may lead to positive ionospheric disturbances in low-latitude regions during geomagnetic storms.

5. Conclusions

This article presents a comprehensive analysis of satellite DCBs encompassing multi-frequency signals from BDS GEO and IGSO satellites. It further provides an in-depth evaluation of the efficacy of regional ionospheric modeling based solely on BDS high-orbit satellites. The estimation of ionospheric VTEC and satellite DCBs was conducted using a polynomial method with an improved weight matrix that processes multi-frequency observables from the iGMAS and MGEX networks. The experimental results reveal that the stability of BDS high-orbit satellite DCB estimations is closely associated with the number of accessible satellites and GNSS stations involved in the estimation process. Notably, no discernible systematic bias is observed between the DCB estimators of GEO and IGSO satellites for both BDS2 and BDS3. In comparison to geomagnetic activity indicators such as Kp or Dst, the VTEC series derived from high-orbit BDS satellites shows potential for timely detection regarding the occurrence, duration, and developmental trends of geomagnetic storms. However, the spatiotemporal characteristics of ionospheric variations are inherently complex and influenced by numerous factors, underscoring the need for further research.
A notable consistency in VTEC values across different days suggests a predictable periodicity in ionospheric behavior, especially during magnetically quiet periods. Employing a polynomial model with parameters set at the tenth degree and eighth order, the diurnal variation of VTEC on 24 March 2024 was meticulously analyzed. A conspicuous positive perturbation within the ionosphere was initially identified at 02:00 (UT) and endured for a span of 10 h. Throughout this period, VTEC estimations peaked at 100 TECU, indicating a significant disturbance in the ionospheric conditions. Subsequently, after 12 h, VTEC values in the East Asia region dropped below 80 TECU, signaling a gradual return to normal ionospheric states. By the 18 h mark, all VTEC values fell below 40 TECU, showcasing the resolution of the ionospheric anomalies triggered by the solar flare event. Experimental results reveal substantial positive responses in the ionospheric VTEC maps during periods of solar activity, aligning with findings from previous studies. Magnetic reconnection generates electric fields (Ey) within the magnetosphere, which accelerate charged particles toward the polar regions. This suggests that variations in the interplanetary electric field may play a role in eliciting positive disturbance responses. Furthermore, fluctuations in solar wind impact the O/N2 ratios, leading to the hypothesis that an increased O/N2 ratio could be another contributing factor driving positive ionospheric disturbances in low-latitude regions during geomagnetic storms.

Author Contributions

X.G. provided the initial idea and wrote the manuscript; Z.M. and L.S. designed and performed the research; L.P. analyzed the data; X.G., S.Y., and H.Z. helped with the review and edited the research. All authors have read and agreed to the published version of the manuscript.

Funding

This research was funded by the Natural Science Basic Research Program of Shaanxi (No. 2024JC-YBQN-0340), the Project of Collaborative Innovation Center of Shaanxi Provincial Department of Education (No. 23JY038), the Key Research and Development Project of China Energy Engineering Group Co., Ltd. (No. CEEC2022-ZDYF-01), and the Science and Technology Development Plan Project of Shaanxi Provincial Department of Construction (No.2023-K50).

Data Availability Statement

The multi-GNSS observation data from the IGS networks are available at https://cddis.nasa.gov/archive/gps/data/daily/ (accessed on 20 August 2024). The multi-GNSS broadcast ephemeris data are available at https://cddis.nasa.gov/archive/gnss/data/campaign/mgex/daily/rinex3/ (accessed on 20 August 2024). The GIM and DCB products from IGS can be obtained at https://cddis.nasa.gov/archive/gnss/products (accessed on 20 August 2024). The OMNI data are obtained from the GSFC/SPDF OMNIWeb interface (http://omniweb.gsfc.nasa.gov (accessed on 20 August 2024)).

Acknowledgments

The authors gratefully acknowledge IGS for providing multi-GNSS measurements, DCB, and GIM products.

Conflicts of Interest

Authors Hailong Zhang and Shuai Yang are employed by the company Northwest Electric Power Design Institute Co., Ltd. The remaining authors declare that the research was conducted in the absence of any commercial or financial relationships that could be construed as a potential conflict of interest.

References

  1. Davies, K. Ionospheric Radio, 1st ed.; Peter Peregrinus Ltd.: London, UK, 1990; pp. 1–5. [Google Scholar]
  2. Kintner, P.M.; Ledvina, B.M. The ionosphere, radio navigation, and global navigation satellite systems. Adv. Space Res. 2005, 35, 788–811. [Google Scholar] [CrossRef]
  3. Teunissen, P.J.G.; Montenbruck, O. Springer Handbook of Global Navigation Satellite Systems, 1st ed.; Springer: Berlin/Heidelberg, Germany, 2017; pp. 177–183. [Google Scholar]
  4. Milan, S.E.; Clausen, L.B.; Coxon, J.C.; Carter, J.A.; Walach, M.T.; Laundal, K.; Østgaard, N.; Tenfjord, P.; Reistad, J.; Snekvik, K.; et al. Overview of solar wind–magnetosphere–ionosphere–atmosphere coupling and the generation of magnetospheric currents. Space Sci. Rev. 2017, 206, 547–573. [Google Scholar] [CrossRef]
  5. Fuller-Rowell, T.J.; Codrescu, M.V.; Moffett, R.J.; Quegan, S. Response of the thermosphere and ionosphere to geomagnetic storms. J. Geophys. Res. Space Phys. 1994, 99, 3893–3914. [Google Scholar] [CrossRef]
  6. Di Giovanni, G.; Radicella, S.M. An analytical model of the electron density profile in the ionosphere. Adv. Space Res. 1990, 10, 27–30. [Google Scholar] [CrossRef]
  7. Nava, B.; Coisson, P.; Radicella, S.M. A new version of the NeQuick ionosphere electron density model. J. Atmos. Solar-Terr. Phys. 2008, 70, 1856–1862. [Google Scholar] [CrossRef]
  8. Mendillo, M. Storms in the ionosphere: Patterns and processes for total electron content. Rev. Geophys. 2006, 44, RG4001. [Google Scholar] [CrossRef]
  9. Landa, V.; Reuveni, Y. Assessment of dynamic mode decomposition (DMD) model for ionospheric TEC map predictions. Remote Sens. 2023, 15, 365. [Google Scholar] [CrossRef]
  10. Hernández-Pajares, M.; Aragón-Ángel, À.; Defraigne, P.; Bergeot, N.; Prieto-Cerdeira, R.; García-Rigo, A. Distribution and mitigation of higher-order ionospheric effects on precise GNSS processing. J. Geophys. Res. Solid Earth 2014, 119, 3823–3837. [Google Scholar] [CrossRef]
  11. Ren, X.; Chen, J.; Li, X.; Zhang, X. Ionospheric total electron content estimation using GNSS carrier phase observations based on zero-difference integer ambiguity: Methodology and assessment. IEEE Trans. Geosci. Remote Sens. 2020, 59, 817–830. [Google Scholar] [CrossRef]
  12. Liu, Z.; Gao, Y.; Skone, S. A study of smoothed TEC precision inferred from GPS measurements. Earth Planets Space 2005, 57, 999–1007. [Google Scholar] [CrossRef]
  13. Skone, S. Variations in point positioning accuracies for single frequency GPS users during solar maximum. Geomatica 2002, 56, 131–140. [Google Scholar]
  14. Hernández-Pajares, M.; Juan, J.; Sanz, J. High resolution TEC monitoring method using permanent ground GPS receivers. Geophys. Res. Lett. 1997, 24, 1643–1646. [Google Scholar] [CrossRef]
  15. Jin, S.; Park, J.; Wang, J.; Choi, B.; Park, P. Electron density profiles derived from ground-based GPS observations. J. Navig. 2006, 59, 395–401. [Google Scholar] [CrossRef]
  16. Hatch, R. Dynamic differential GPS at the centimeter level. In Proceedings of the 4th International Geodetic Symposium on Satellite Positioning, Austin, TX, USA, 28 April–2 May 1986. [Google Scholar]
  17. Montenbruck, O.; Hauschild, A.; Steigenberger, P. Differential code bias estimation using multi-GNSS observations and global ionosphere maps. Navigation 2014, 61, 191–201. [Google Scholar] [CrossRef]
  18. Crowley, G.; Hackert, C.L.; Meier, R.R.; Strickland, D.J.; Paxton, L.J.; Pi, X.; Mannucci, A.; Christensen, A.B.; Morrison, D.; Bust, G.S.; et al. Global thermosphere-ionosphere response to onset of 20 November 2003 magnetic storm. J. Geophys. Res. 2006, 111, A10S18. [Google Scholar] [CrossRef]
  19. Rama Rao, P.V.; Gopi Krishna, S.; Vara Prasad, J.; Prasad, S.N.; Prasad, D.S.; Niranjan, K. Geomagnetic storm effects on GPS based navigation. Ann. Geophys. 2009, 27, 2101–2110. [Google Scholar] [CrossRef]
  20. Wen, D.; Mei, D. Ionospheric TEC disturbances over China during the strong geomagnetic storm in September 2017. Adv. Space Res. 2020, 65, 2529–2539. [Google Scholar] [CrossRef]
  21. Nayak, K.; López-Urías, C.; Romero-Andrade, R.; Sharma, G.; Guzmán-Acevedo, G.M.; Trejo-Soto, M.E. Ionospheric Total Electron Content (TEC) anomalies as earthquake precursors: Unveiling the geophysical connection leading to the 2023 Moroccan 6.8 Mw earthquake. Geosciences 2023, 13, 319. [Google Scholar] [CrossRef]
  22. Sharma, G.; Nayak, K.; Romero-Andrade, R.; Aslam, M.M.; Sarma, K.K.; Aggarwal, S.P. Low ionosphere density above the earthquake epicentre region of M 7.2, El Mayor–Cucapah earthquake evident from dense CORS data. J. Indian Soc. Remote Sens. 2024, 52, 543–555. [Google Scholar] [CrossRef]
  23. Brunini, C.; Azpilicueta, F. GPS slant total electron content accuracy using the single layer model under different geomagnetic regions and ionospheric conditions. J. Geod. 2010, 84, 293–304. [Google Scholar] [CrossRef]
  24. Zhao, X.; Jin, S.; Mekik, C.; Feng, J. Evaluation of regional ionospheric grid model over China from dense GPS observations. Geod. Geodyn. 2016, 7, 361–368. [Google Scholar] [CrossRef]
  25. Chen, M.; Liu, L.; Xu, C.; Wang, Y. Improved IRI-2016 model based on BeiDou GEO TEC ingestion across China. GPS Solut. 2020, 24, 1–11. [Google Scholar] [CrossRef]
  26. Yang, H.; Xuhai, Y.; Zhe, Z.; Zhao, K. High-precision ionosphere monitoring using continuous measurements from BDS GEO satellites. Sensors 2018, 18, 714. [Google Scholar] [CrossRef]
  27. Huang, F.; Lei, J.; Dou, X.; Luan, X.; Zhong, J. Nighttime medium-scale traveling ionospheric disturbances from airglow imager and Global Navigation Satellite Systems observations. Geophys. Res. Lett. 2018, 45, 31–38. [Google Scholar] [CrossRef]
  28. Jin, S.; Jin, R.; Kutoglu, H. Positive and negative ionospheric responses to the March 2015 geomagnetic storm from BDS observations. J. Geod. 2017, 91, 613–626. [Google Scholar] [CrossRef]
  29. Liu, Y.; Fu, L.; Wang, J.; Zhang, C. Studying ionosphere responses to a geomagnetic storm in June 2015 with multi-constellation observations. Remote Sens. 2018, 10, 666. [Google Scholar] [CrossRef]
  30. Tang, J.; Gao, X.; Yang, D.; Zhong, Z.; Huo, X.; Wu, X. Local persistent ionospheric positive responses to the geomagnetic storm in August 2018 using BDS-GEO satellites over low-latitude regions in Eastern Hemisphere. Remote Sens. 2022, 14, 2272. [Google Scholar] [CrossRef]
  31. Jia, X.; Liu, J.; Zhang, X. The Analysis of Ionospheric TEC Anomalies Prior to the Jiuzhaigou Ms7. 0 Earthquake Based on BeiDou GEO Satellite Data. Remote Sens. 2024, 16, 660. [Google Scholar] [CrossRef]
  32. Sardón, E.; Rius, A.; Zarraoa, N. Estimation of the transmitter and receiver differential biases and the ionospheric total electron content from Global Positioning System observations. Radio Sci. 1994, 29, 577–586. [Google Scholar] [CrossRef]
  33. Jin, R.; Jin, S.; Feng, G. M_DCB: Matlab code for estimating GNSS satellite and receiver differential code biases. GPS Solut. 2012, 16, 541–548. [Google Scholar] [CrossRef]
  34. Wilson, B.; Mannucci, A. Instrumental Biases in Ionospheric Measurements derived from GPS data. In Proceedings of the ION GPS-93, Salt Lake City, UT, USA, 22–24 September 1993. [Google Scholar]
  35. Wang, Q.; Zhu, J.; Hu, F. Ionosphere total electron content modeling and multi-type differential code bias estimation using multi-mode and multi-frequency global navigation satellite system observations. Remote Sens. 2023, 15, 4607. [Google Scholar] [CrossRef]
  36. Lou, Y.; Zhang, Z.; Gong, X.; Zheng, F.; Gu, S.; Shi, C. Estimating GPS satellite and receiver differential code bias based on signal distortion bias calibration. GPS Solut. 2023, 27, 48. [Google Scholar] [CrossRef]
  37. Schaer, S. Mapping and Predicting the Earth’s Ionosphere Using the Global Positioning System. Ph.D. Dissertation, University of Berne, Berne, Switzerland, 1999. [Google Scholar]
  38. Sophan, S.; Myint, L.M.; Saito, S.; Supnithi, P. Performance improvement of the GAGAN satellite-based augmentation system based on local ionospheric delay estimation in Thailand. GPS Solut. 2022, 26, 130. [Google Scholar] [CrossRef]
  39. Li, Z.; Yuan, Y.; Li, H.; Ou, J.; Huo, X. Two-step method for the determination of the Differential Code Biases of COMPASS satellites. J. Geod. 2012, 86, 1059–1076. [Google Scholar] [CrossRef]
  40. Li, W.; Wang, K.; Yuan, K. Performance and consistency of final global ionospheric maps from different IGS analysis centers. Remote Sens. 2023, 15, 1010. [Google Scholar] [CrossRef]
  41. Li, X.; Xie, W.; Huang, J.; Ma, T.; Zhang, X.; Yuan, Y. Estimation and analysis of differential code biases for BDS3/BDS2 using iGMAS and MGEX observations. J. Geod. 2019, 93, 419–435. [Google Scholar] [CrossRef]
  42. Li, M.; Yuan, Y. Estimation and analysis of BDS2 and BDS3 differential code biases and global ionospheric maps using BDS observations. Remote Sens. 2021, 13, 370. [Google Scholar] [CrossRef]
  43. Montenbruck, O.; Hauschild, A.; Steigenberger, P.; Hugentobler, U.; Teunissen, P.; Nakamura, S. Initial assessment of the COMPASS/BeiDou-2 regional navigation satellite system. GPS Solut. 2013, 17, 211–222. [Google Scholar] [CrossRef]
  44. Li, Z.; Zhong, J.; Hao, Y.; Zhang, M.; Niu, J.; Wan, X.; Huang, F.; Han, H.; Song, X.; Chen, J. Assessment of the orbital variations of GNSS GEO and IGSO satellites for monitoring ionospheric TEC. GPS Solut. 2023, 27, 62. [Google Scholar] [CrossRef]
  45. Chen, C.; Chang, G.; Luo, F.; Zhang, S. Dual-frequency carrier smoothed code filtering with dynamical ionospheric delay modeling. Adv. Space Res. 2019, 63, 857–870. [Google Scholar] [CrossRef]
  46. Hwang, P.Y.; McGraw, G.A.; Bader, J.R. Enhanced differential GPS carrier-smoothed code processing using dual-frequency measurements. Navigation 1999, 46, 127–138. [Google Scholar] [CrossRef]
  47. Kim, E.; Walter, T.; Powell, J.D. Adaptive carrier smoothing using code and carrier divergence. In Proceedings of the 2007 National Technical Meeting of the Institute of Navigation, San Diego, CA, USA, 22–24 January 2007. [Google Scholar]
  48. Park, B.; Sohn, K.; Kee, C. Optimal Hatch filter with an adaptive smoothing window width. J. Navig. 2008, 61, 435–454. [Google Scholar] [CrossRef]
  49. Gunther, C.; Henkel, P. Reduced-noise ionosphere-free carrier smoothed code. IEEE Trans. Aerosp. Electron. Syst. 2010, 46, 323–334. [Google Scholar] [CrossRef]
  50. Zhou, H.; Li, Z.; Liu, C.; Xu, J.; Li, S.; Zhou, K. Assessment of the performance of carrier-phase and Doppler smoothing code for low-cost GNSS receiver positioning. Results Phys. 2020, 19, 103574. [Google Scholar] [CrossRef]
  51. Yasyukevich, Y.V.; Kiselev, A.V.; Zhivetiev, I.V.; Edemskiy, I.K.; Syrovatskii, S.V.; Maletckii, B.M.; Vesnin, A.M. SIMuRG: System for ionosphere monitoring and research from GNSS. GPS Solut. 2020, 24, 1–12. [Google Scholar] [CrossRef]
  52. Chen, J.; Ren, X.; Xiong, S.; Zhang, X. Modeling and analysis of an ionospheric mapping function considering azimuth angle: A preliminary result. Adv. Space Res. 2022, 70, 2867–2877. [Google Scholar] [CrossRef]
  53. Zhao, J.; Zhou, C. On the optimal height of ionospheric shell for single-site TEC estimation. GPS Solut. 2018, 22, 1–11. [Google Scholar] [CrossRef]
  54. Li, Z.; Yuan, Y.; Wang, N.; Hernandez-Pajares, M.; Huo, X. SHPTS: Towards a new method for generating precise global ionospheric TEC map based on spherical harmonic and generalized trigonometric series functions. J. Geod. 2015, 89, 331–345. [Google Scholar] [CrossRef]
  55. Li, B.; Wang, M.; Wang, Y.; Guo, H. Model assessment of GNSS-based regional TEC modeling: Polynomial, trigonometric series, spherical harmonic and multi-surface function. Acta Geod. Geophys. 2019, 54, 333–357. [Google Scholar] [CrossRef]
  56. Komjathy, A.; Sparks, L.; Wilson, B.; Mannucci, A. Automated daily processing of more than 1000 ground-based GPS receivers for studying intense ionospheric storms. Radio Sci. 2005, 40, 1–11. [Google Scholar] [CrossRef]
  57. Hernández-Pajares, M.; Olivares-Pulido, G.; Hoque, M.M.; Prol, F.S.; Yuan, L.; Notarpietro, R.; Graffigna, V. Topside ionospheric tomography exclusively based on LEO POD GPS carrier phases: Application to autonomous LEO DCB estimation. Remote Sens. 2023, 15, 390. [Google Scholar] [CrossRef]
  58. Paige, C.; Saunders, M. LSQR: An algorithm for sparse linear equations and sparse least squares. ACM Trans. Math. Softw. (TOMS) 1982, 8, 43–71. [Google Scholar] [CrossRef]
  59. Jin, S.; Wang, J.; Park, P. An improvement of GPS height estimations: Stochastic modeling. Earth Planets Space 2005, 57, 253–259. [Google Scholar] [CrossRef]
  60. Astafyeva, E.; Heki, K. Vertical TEC over seismically active region during low solar activity. J. Atmos. Sol.-Terr. Phys. 2011, 73, 1643–1652. [Google Scholar] [CrossRef]
  61. Zhang, F.; Tang, L.; Li, J.; Du, X. A simple approach to determine single-receiver differential code bias using precise point positioning. Sensors 2023, 23, 8230. [Google Scholar] [CrossRef] [PubMed]
  62. Tapping, K.F. The 10.7 cm solar radio flux (F10.7). Space Weather 2013, 11, 394–406. [Google Scholar] [CrossRef]
  63. Clette, F.; Lefèvre, L. The New Sunspot Number: Assembling All Corrections. Sol. Phys. 2016, 291, 2629–2651. [Google Scholar] [CrossRef]
  64. Saiz, E.; Cerrato, Y.; Cid, C.; Dobrica, V.; Hejda, P.; Nenovski, P.; Stauning, P.; Bochnicek, J.; Danov, D.; Demetrescu, C.; et al. Geomagnetic response to solar and interplanetary disturbances. J. Space Weather Spac. 2013, 3, A26. [Google Scholar] [CrossRef]
  65. Lockwood, M.; Stamper, R.; Wild, M. A doubling of the Sun’s coronal magnetic field during the past 100 years. Nature 1999, 399, 437–439. [Google Scholar] [CrossRef]
  66. Lissa, D.; Srinivasu, V.K.D.; Prasad, D.S.V.V.D.; Niranjan, K. Ionospheric response to the 26 August 2018 geomagnetic storm using GPS-TEC observations along 80 E and 120 E longitudes in the Asian sector. Adv. Space Res. 2020, 66, 1427–1440. [Google Scholar] [CrossRef]
  67. Tsurutani, B.T.; Hajra, R. Energetics of shock-triggered supersubstorms (SML < −2500 nT). Astrophys. J. 2023, 946, 17. [Google Scholar]
  68. Lee, W.; Kil, H.; Paxton, L.; Zhang, Y.; Shim, J. The effect of geomagnetic-storm-induced enhancements to ionospheric emissions on the interpretation of the TIMED/GUVI O/N2 ratio. J. Geophys. Res. Space 2013, 118, 7834–7840. [Google Scholar] [CrossRef]
Figure 1. The geomagnetic three-hourly Kp index sequences provided by GFZ from 1 January to 17 February 2024 (Doy: 001~048).
Remotesensing 16 03118 g001
Figure 2. Distributions of selected MGEX and iGMAS stations where multi-frequency BDS signals can be reliably tracked (latitude limited to 50°S~50°N; longitude limited to 50°E~150°E).
Remotesensing 16 03118 g002
Figure 3. Daily estimated DCBs of the BDS high-orbit satellites using the POLY method during the period of day of the year (DOY) 001-048 in 2024.
Remotesensing 16 03118 g003
Figure 4. Daily estimated DCBs of the BDS high-orbit satellites using the non-SH method during the period of day of the year (DOY) 001-048 in 2024.
Remotesensing 16 03118 g004
Figure 5. The numbers of available BDS high-orbit satellites and GNSS stations during the period of day of the year (DOY) 001-048 in 2024.
Remotesensing 16 03118 g005
Figure 6. Daily estimated DCBs of the BDS high-orbit satellites using the POLY model with C2I and C7I during the period of day of the year (DOY) 001-048 in 2024.
Remotesensing 16 03118 g006
Figure 7. The bias and RMS series of the BDS-based RIMs with regard to the final GIM products produced by Whrg during the period spanning from DOY 01 to 48 in 2024.
Remotesensing 16 03118 g007
Figure 8. The regional VTEC maps calculated by the POLY model using dual-frequency signals from BDS high-orbit satellites during specified days in 2024 (Unit: TECU).
Remotesensing 16 03118 g008
Figure 9. Temporal variations of Kp indexes, Dst, SN, and F10.7 during the second period (DOY: 69–96) in 2024.
Remotesensing 16 03118 g009
Figure 10. Diurnal variation of VTEC series from dual-frequency signals of BDS high-orbit satellites using a polynomial model on March 24 (DOY: 084) in 2024 (Unit: TECU).
Remotesensing 16 03118 g010
Figure 11. Temporal variation of interplanetary electric field (Ey), flow speed of solar wind, and IMF Bz series from OMNI during 23–25 March 2024.
Remotesensing 16 03118 g011
Table 1. List of available BDS GEO satellites in 2024.
SystemPRNSVNNORADIDClockTypeLaunchInclination (rad)
BDS-2C01GEO-844231Rubidium2019/05/170.095815041
C02GEO-6389532012/10/250.061223427
C03GEO-7415862016/06/120.061247412
C04GEO-4372102010/11/010.078722163
C05GEO-5380912012/02/250.060379663
BDS-3C59GEO-143683Hydrogen2018/11/010.107197479
C60GEO-2453442020/03/090.121404913
Table 2. List of available BDS IGSO satellites in 2024.
SystemPRNSVNNORADIDClockTypeLaunchInclination (rad)
BDS-2C06IGSO-136828Rubidium2010/08/010.944323177
C07IGSO-2372562010/12/180.893534803
C08IGSO-3373842011/04/101.039540317
C09IGSO-4377632011/07/270.949210898
C10IGSO-5379482011/12/020.895253611
C13IGSO-6414342016/03/301.000638794
C16IGSO-7435392018/07/100.959717824
BDS-3C38IGSO-144204Hydrogen2019/04/200.973775532
C39IGSO-2443372019/06/250.960276832
C40IGSO-3447092019/11/051.014828481
Table 3. BDS observable types and corresponding frequencies based on the observation header in Rinex 3.x format.
SignalsFrequency (MHz)Observation TypeNumber of Stations
B1I1561.098C2I71 (100.0%)
B1C1575.420C1P36 (50.7%)
C1X21 (29.6%)
C1A4 (5.6%)
C1B3 (4.2%)
B2a1176.450C5I6 (8.4%)
C5Q1 (1.4%)
C5P36 (50.7%)
C5X21 (29.6%)
B2b1207.140C7A4 (5.6%)
C7Z6 (8.4%)
C7D45 (63.4%)
B2 (B2a + B2b)1191.795C8X6 (8.4%)
B2I1207.140C7I65 (91.5%)
B3I1268.520C6I71 (100.0%)
Table 4. Statistics of the differences between the BDS high-orbit satellite DCB estimates and GIM products provided by CAS during the period of DOY 001-048 in 2024.
SystemTypePRNSHF ModelPOLY Model
Max-MinRMSMax-MinRMS
BDS2GEOC014.82461.26496.65411.1965
C024.99651.21598.39691.3651
C035.10771.27504.90931.0269
C044.62211.24007.45101.4082
C055.12411.21157.40021.4676
IGSOC069.60171.63937.56811.5817
C077.30001.51957.26431.3439
C085.10831.28329.86511.8937
C104.35041.07444.95041.1315
C1318.11764.08288.81041.9778
C164.82461.26491.21681.1887
BDS3GEOC6018.56984.21578.80751.9859
IGSOC384.68101.15084.58101.1545
C395.13341.26447.48641.2103
C404.95501.24414.95501.2450
Table 5. The RMS errors between the estimated VTEC estimations and the final ionospheric products derived from Whrg using different methods for determining the weight matrix.
Doy001002003004005006007008
Classical8.83810.74611.7828.21011.33910.70610.23710.384
Ours8.5709.93710.8557.85310.54310.1079.37310.022
Disclaimer/Publisher’s Note: The statements, opinions and data contained in all publications are solely those of the individual author(s) and contributor(s) and not of MDPI and/or the editor(s). MDPI and/or the editor(s) disclaim responsibility for any injury to people or property resulting from any ideas, methods, instructions or products referred to in the content.