


Aeolian Desertification Dynamics from 1995 to 2020 in Northern China: Classification Using a Random Forest Machine Learning Algorithm Based on Google Earth Engine

Abstract
1. Introduction
2. Methods and Data Sources
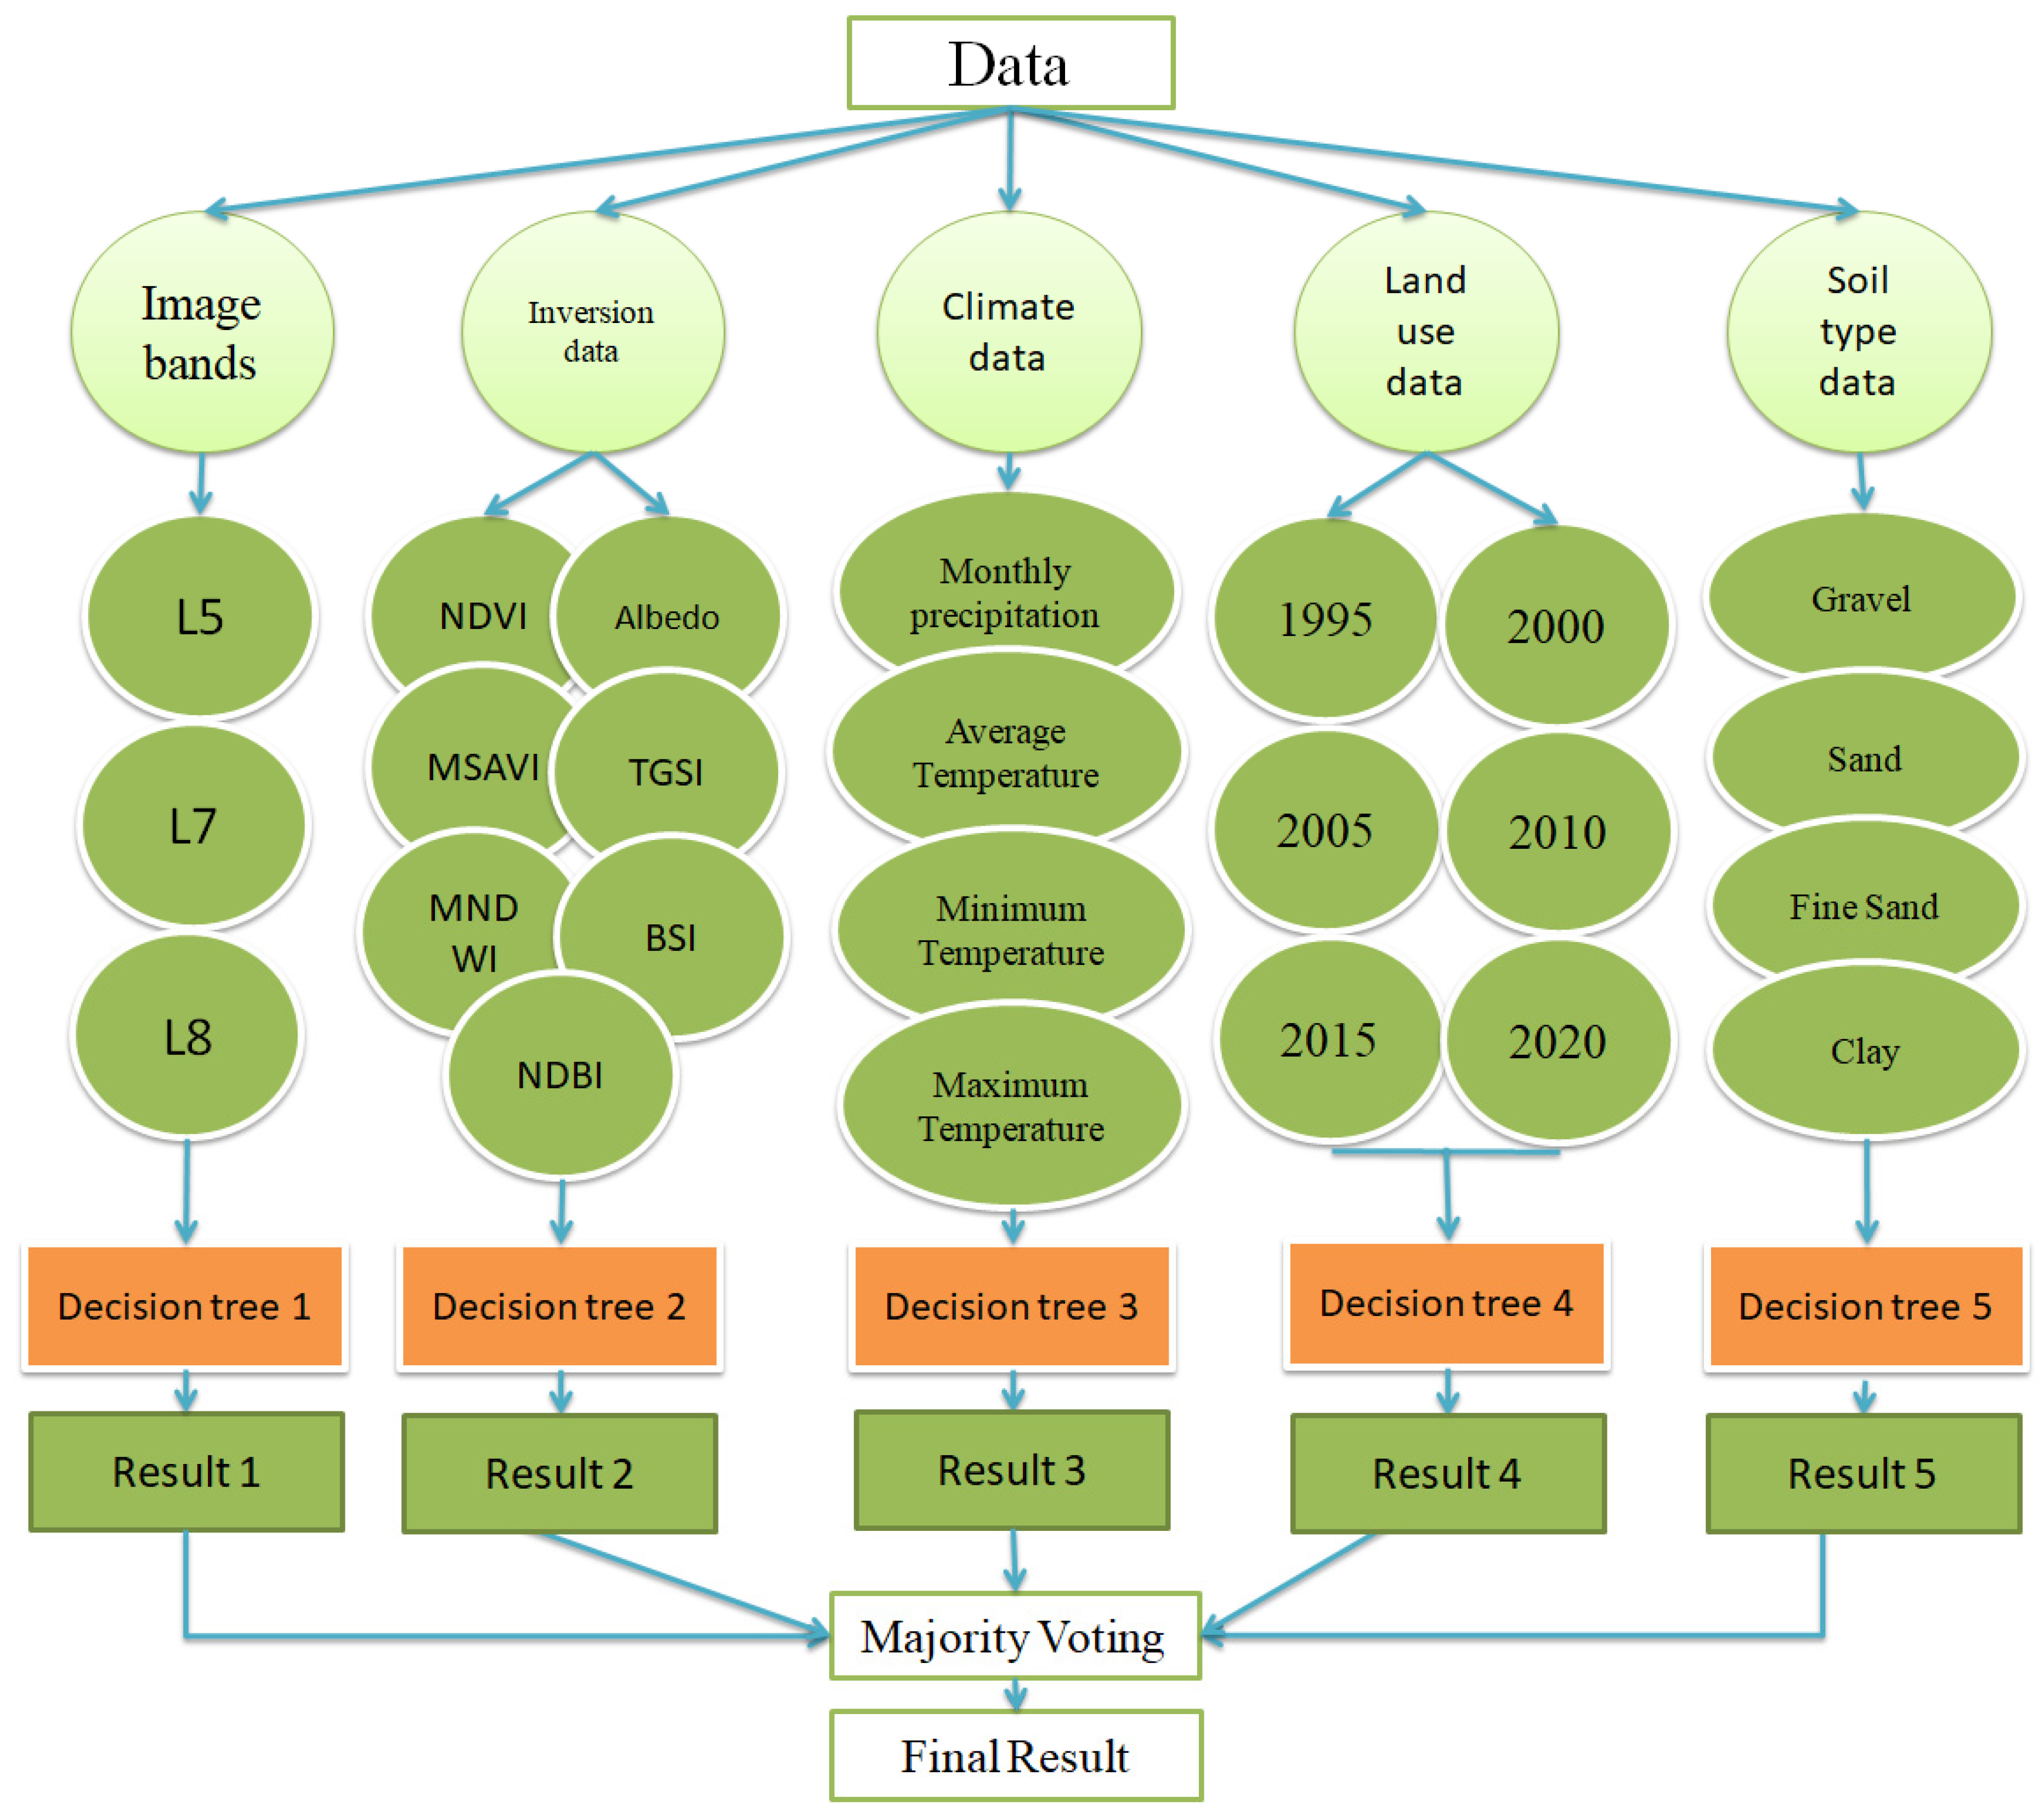
2.1. Methods
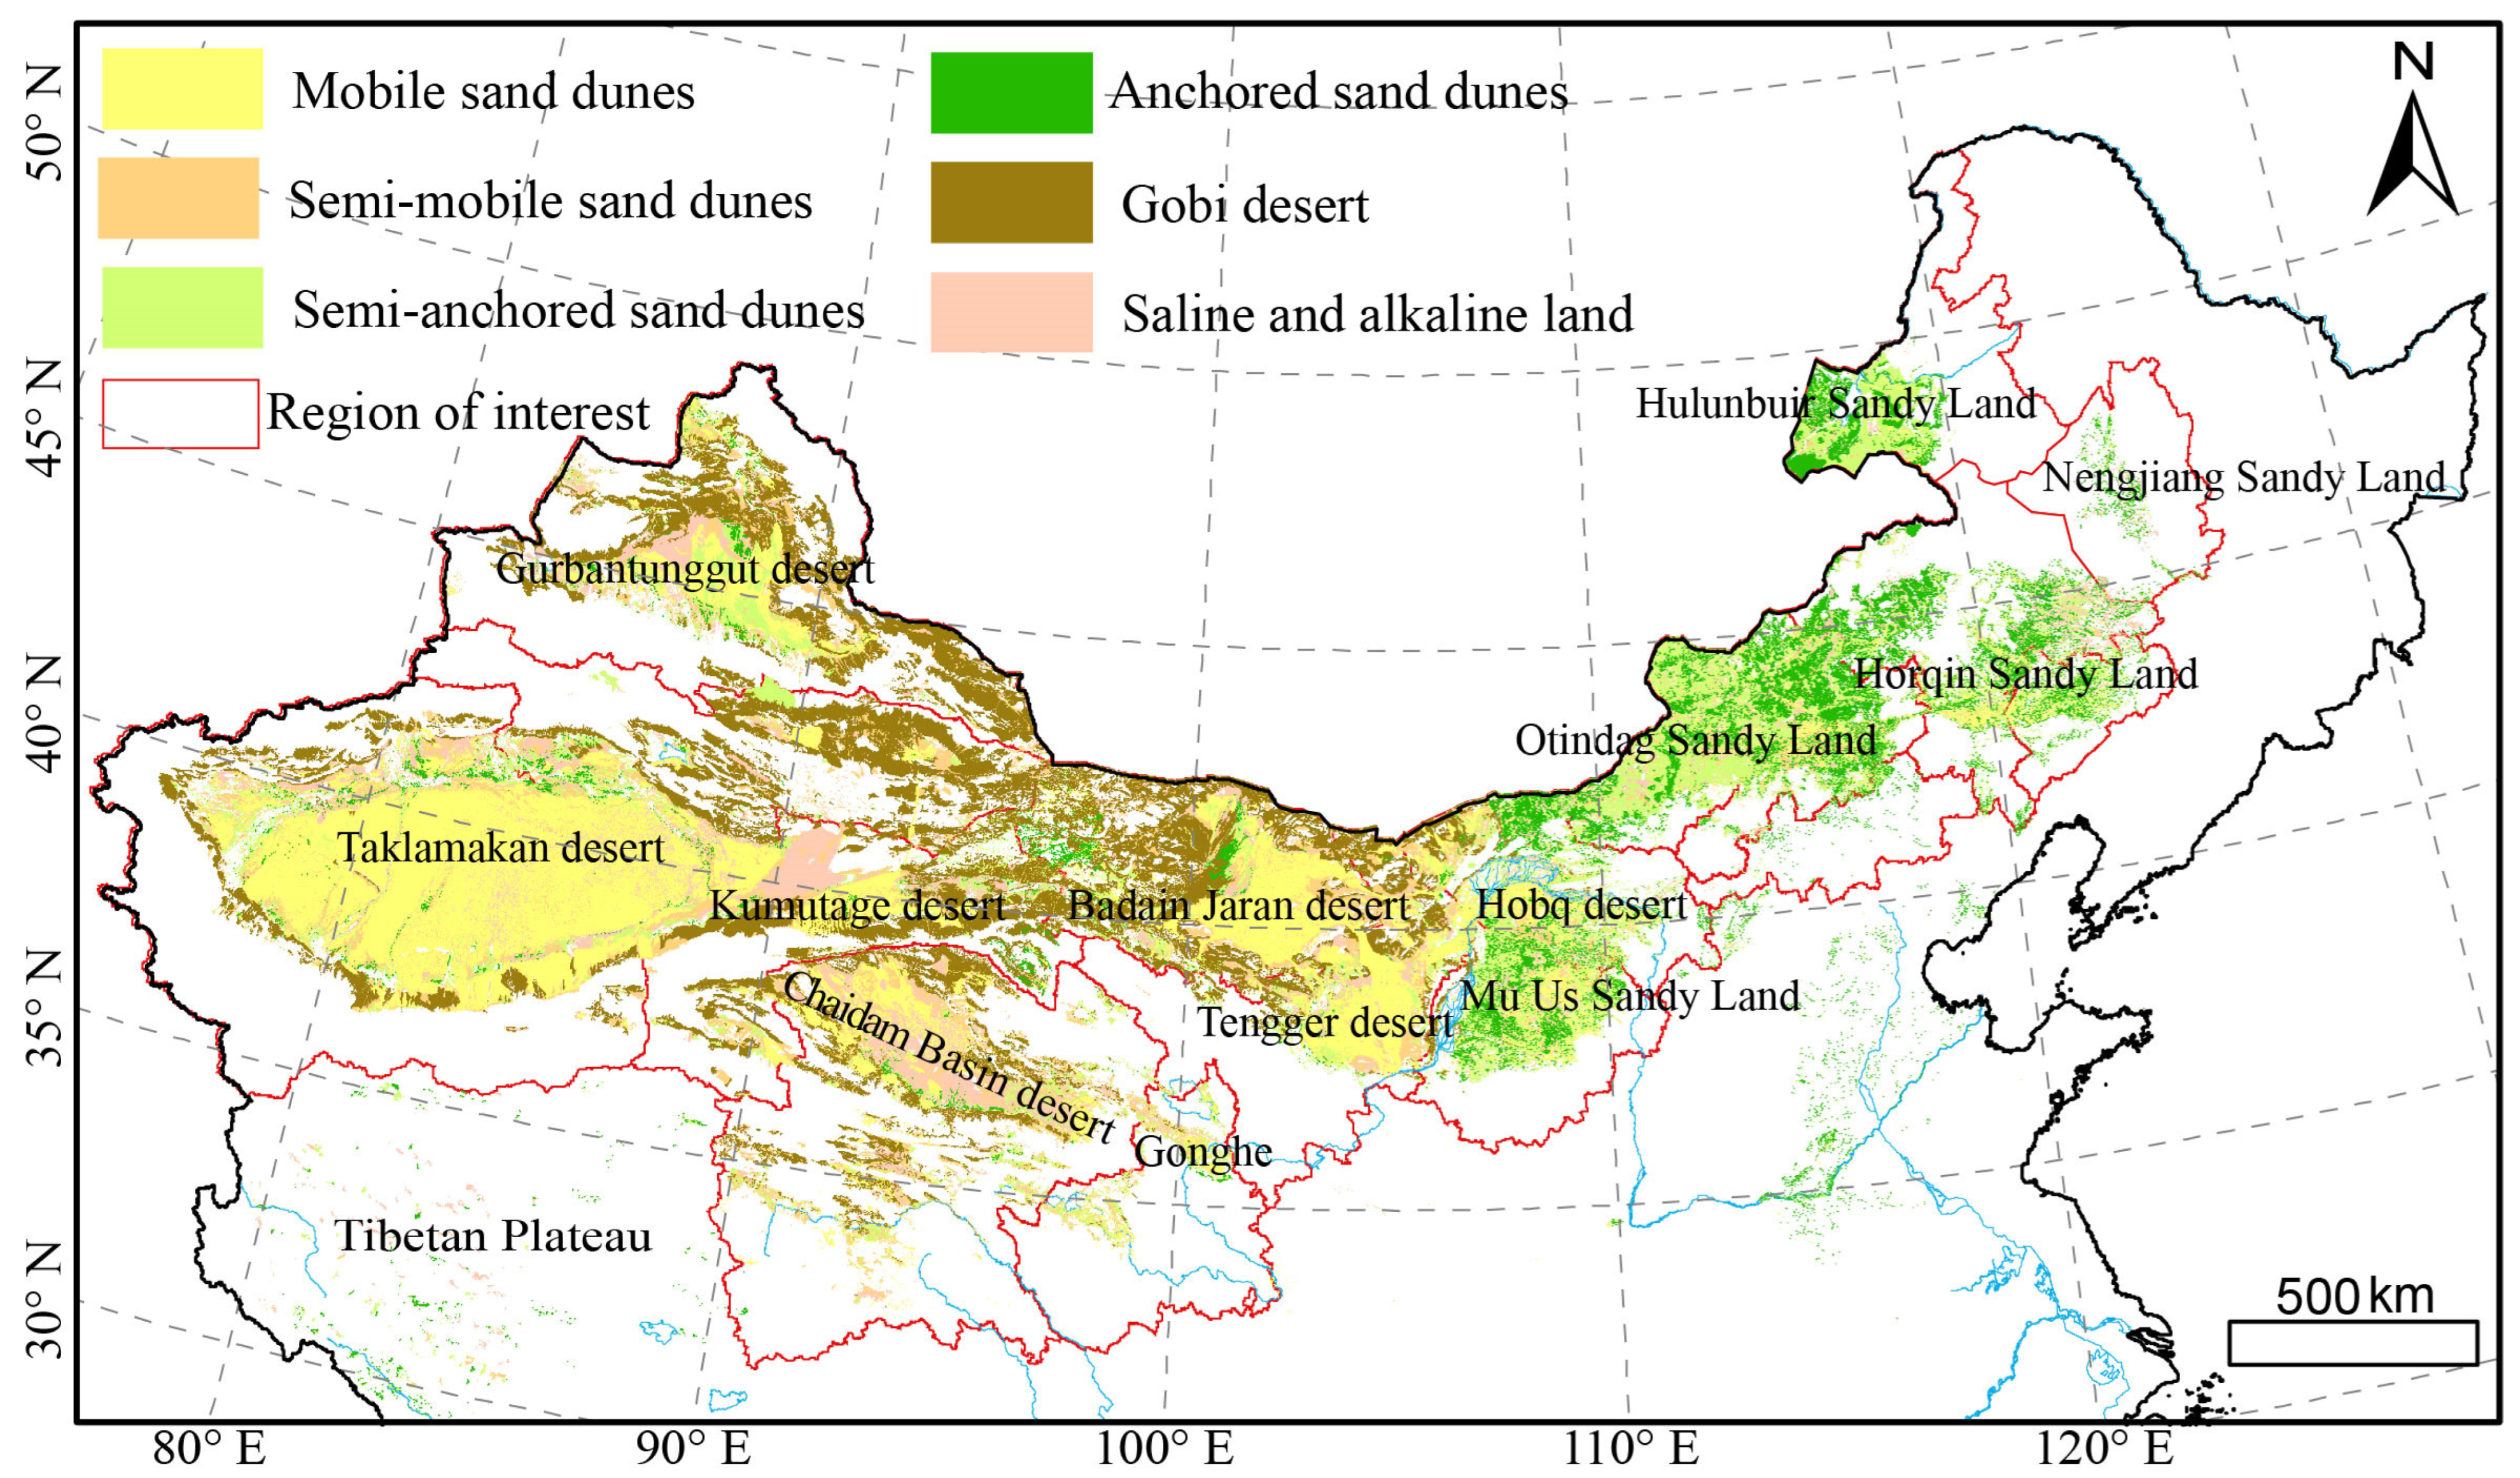
2.2. Data Sources
3. Results
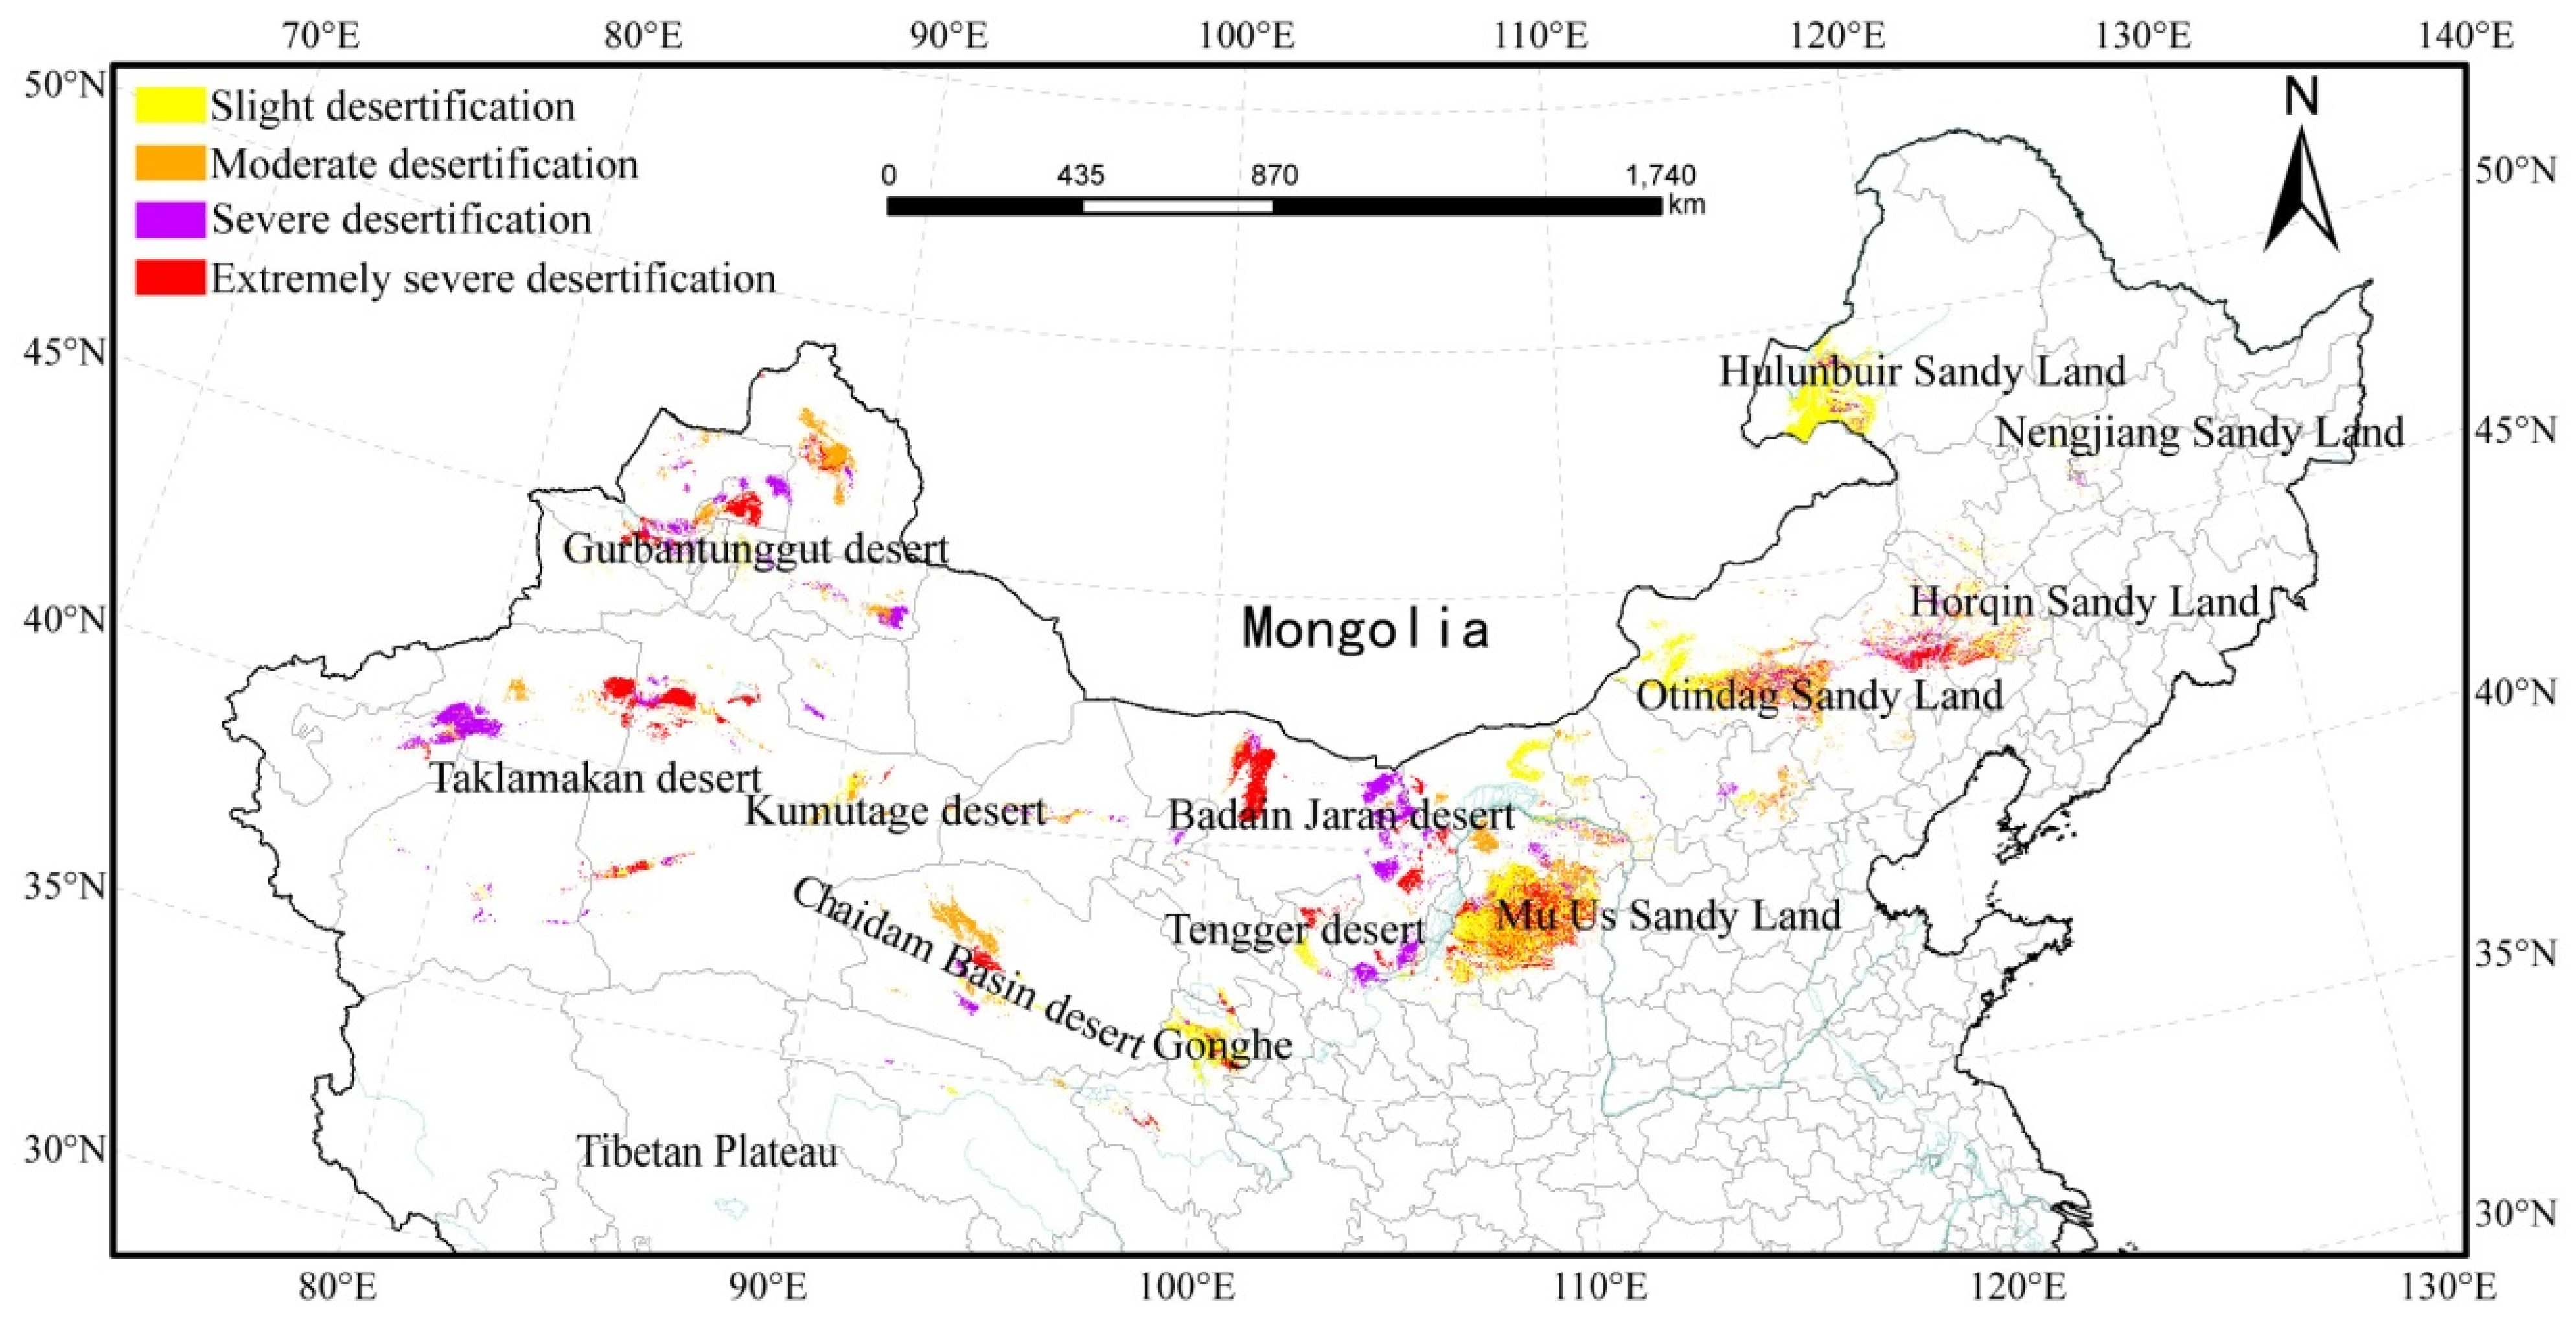
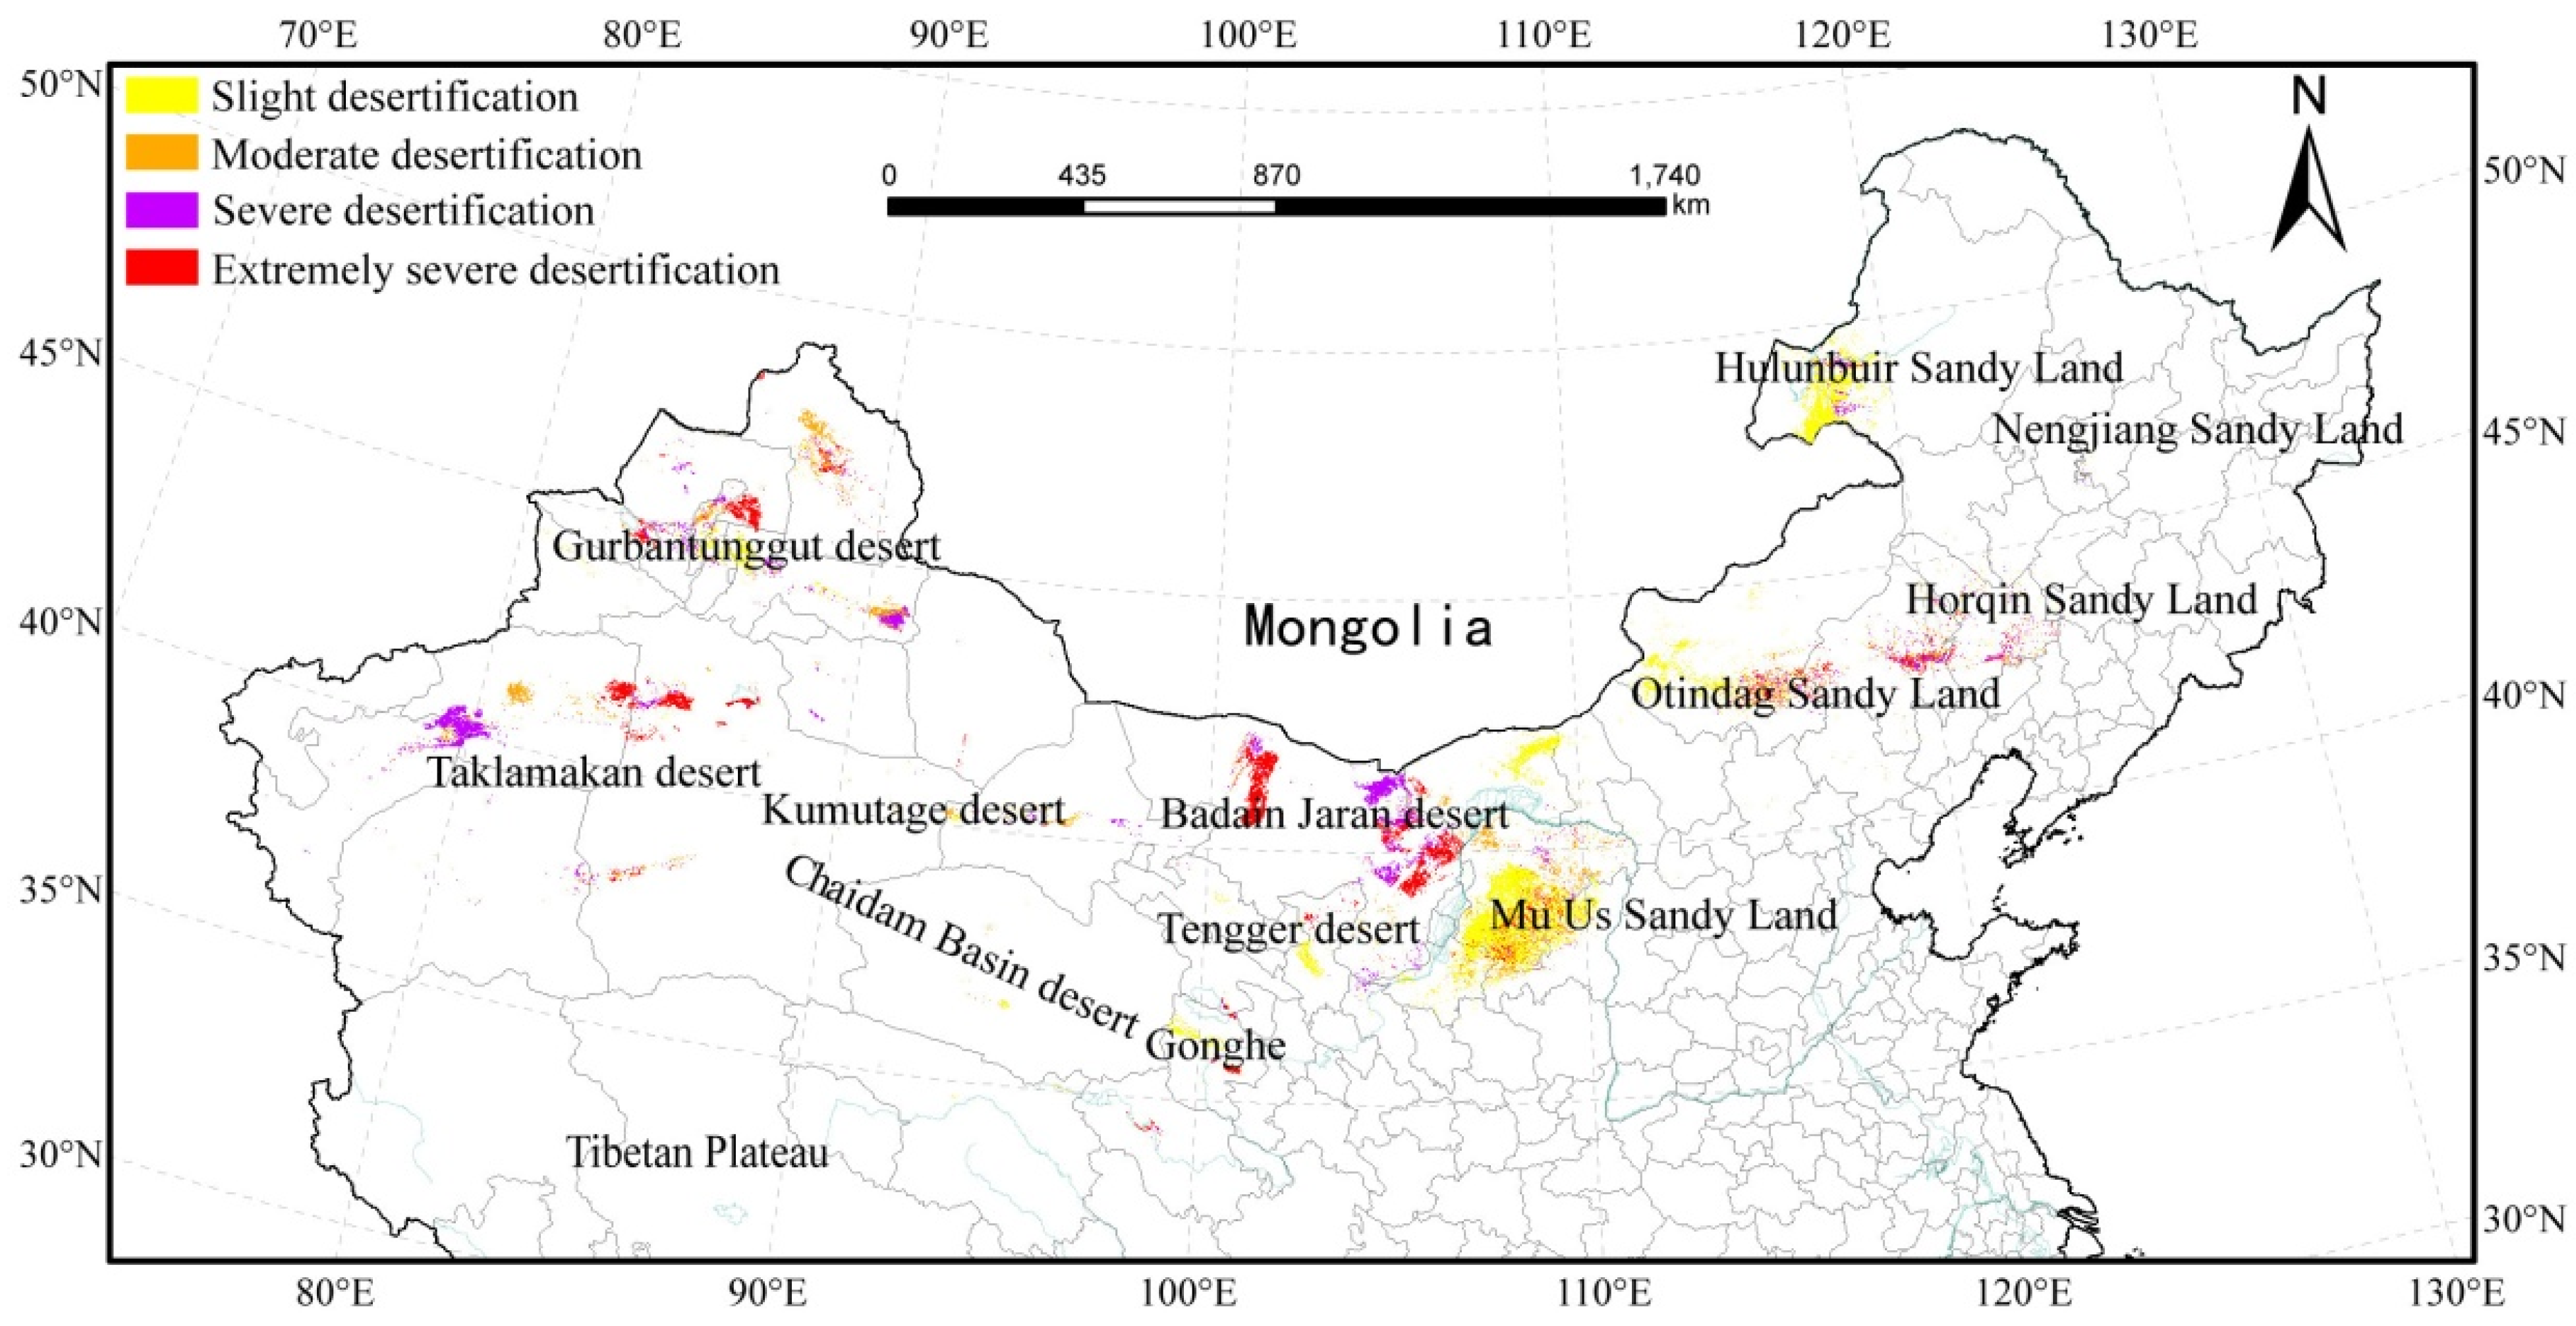
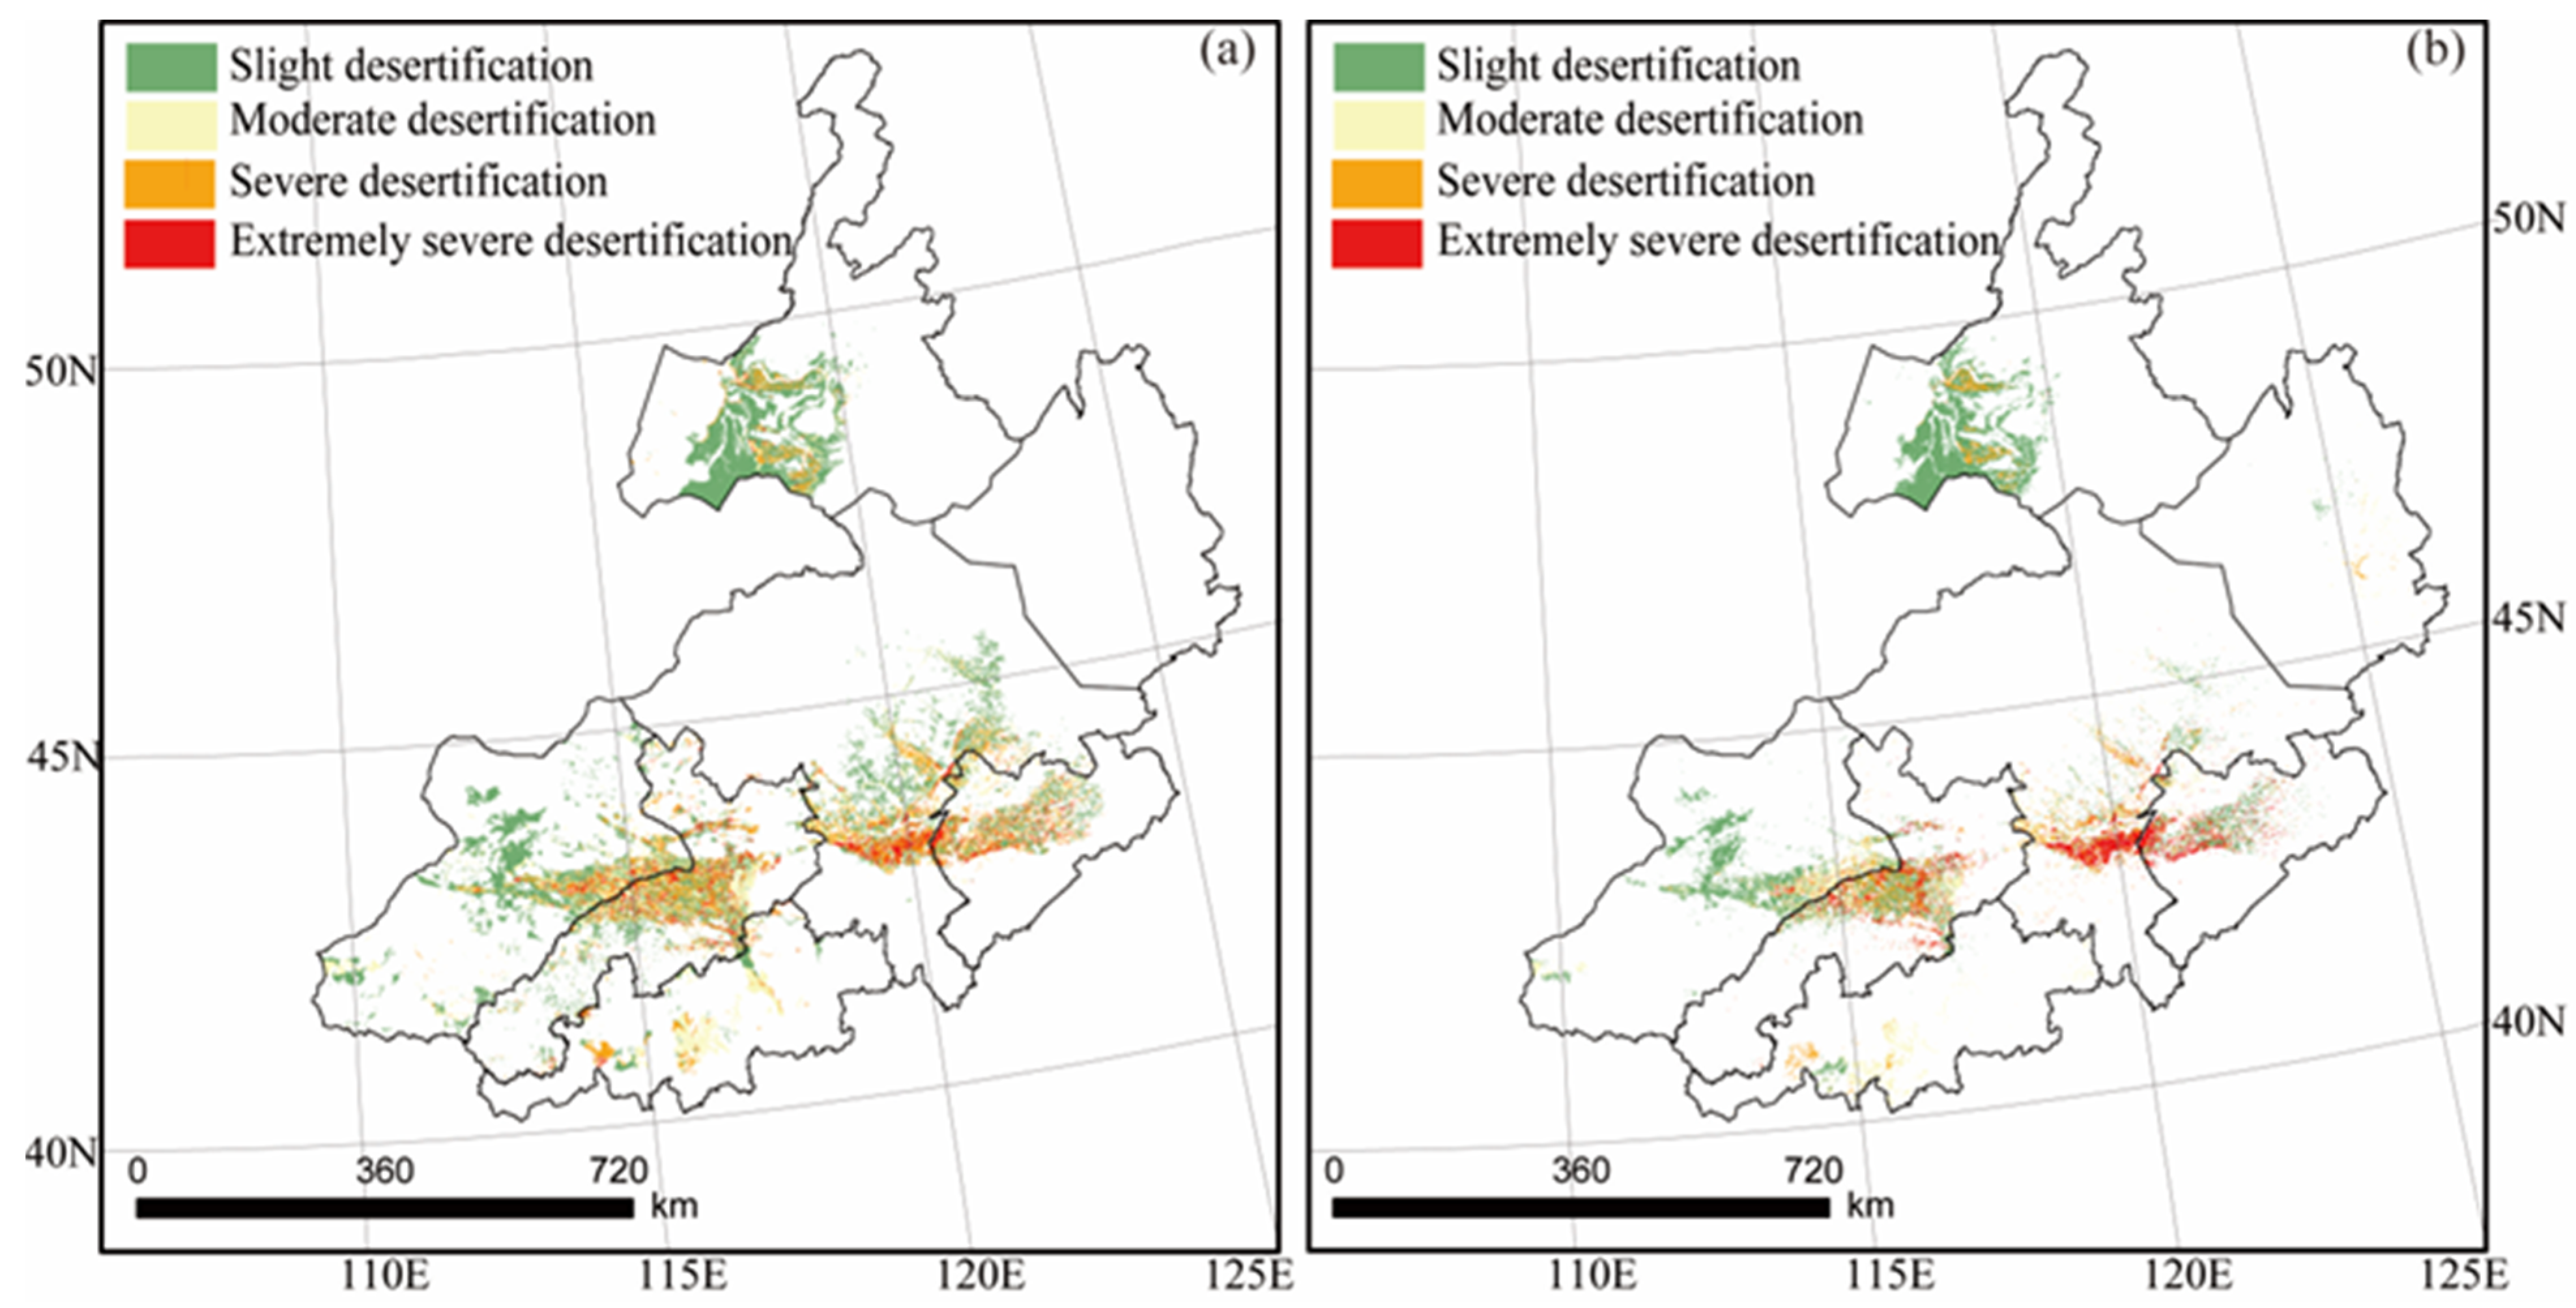
3.1. Desertification Distribution across Northern China in 1995
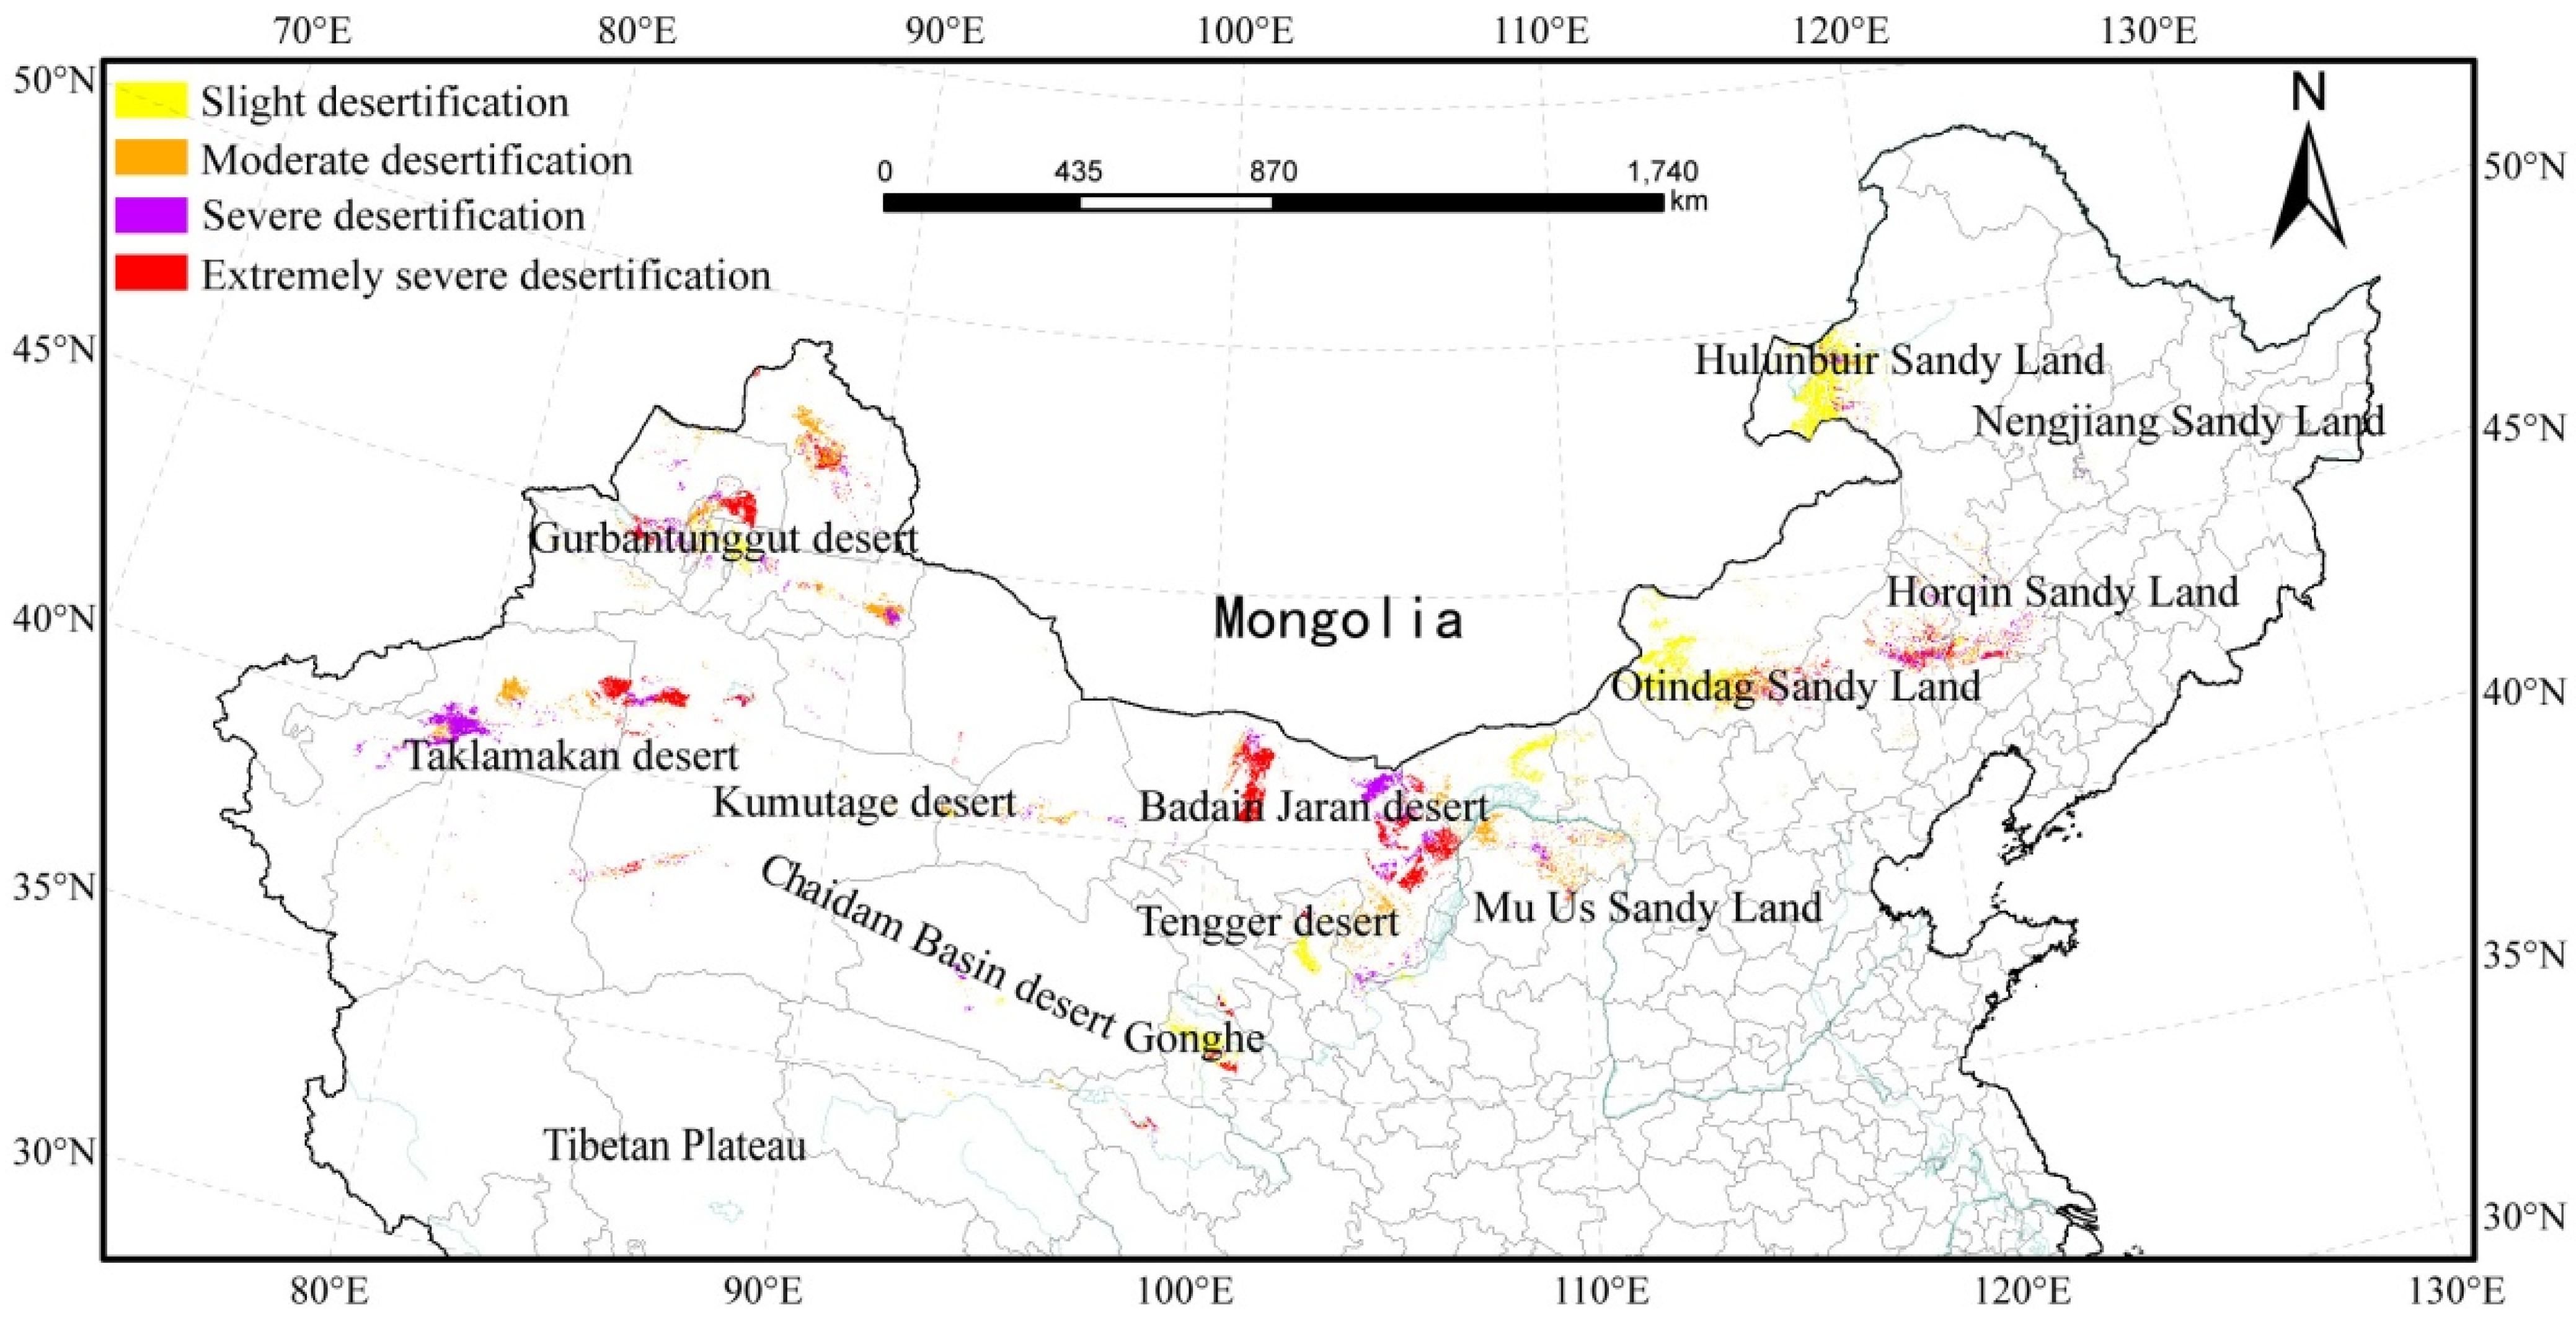
3.2. Changes in Desertification from 1995 to 2000 in Northern China
3.3. Changes in the Area of Desertification from 2000 to 2005 in Northern China
3.4. Changes in the Area of Desertification from 2005 to 2010 in Northern China
3.5. Changes in the Desertification Area from 2010 to 2015 in Northern China
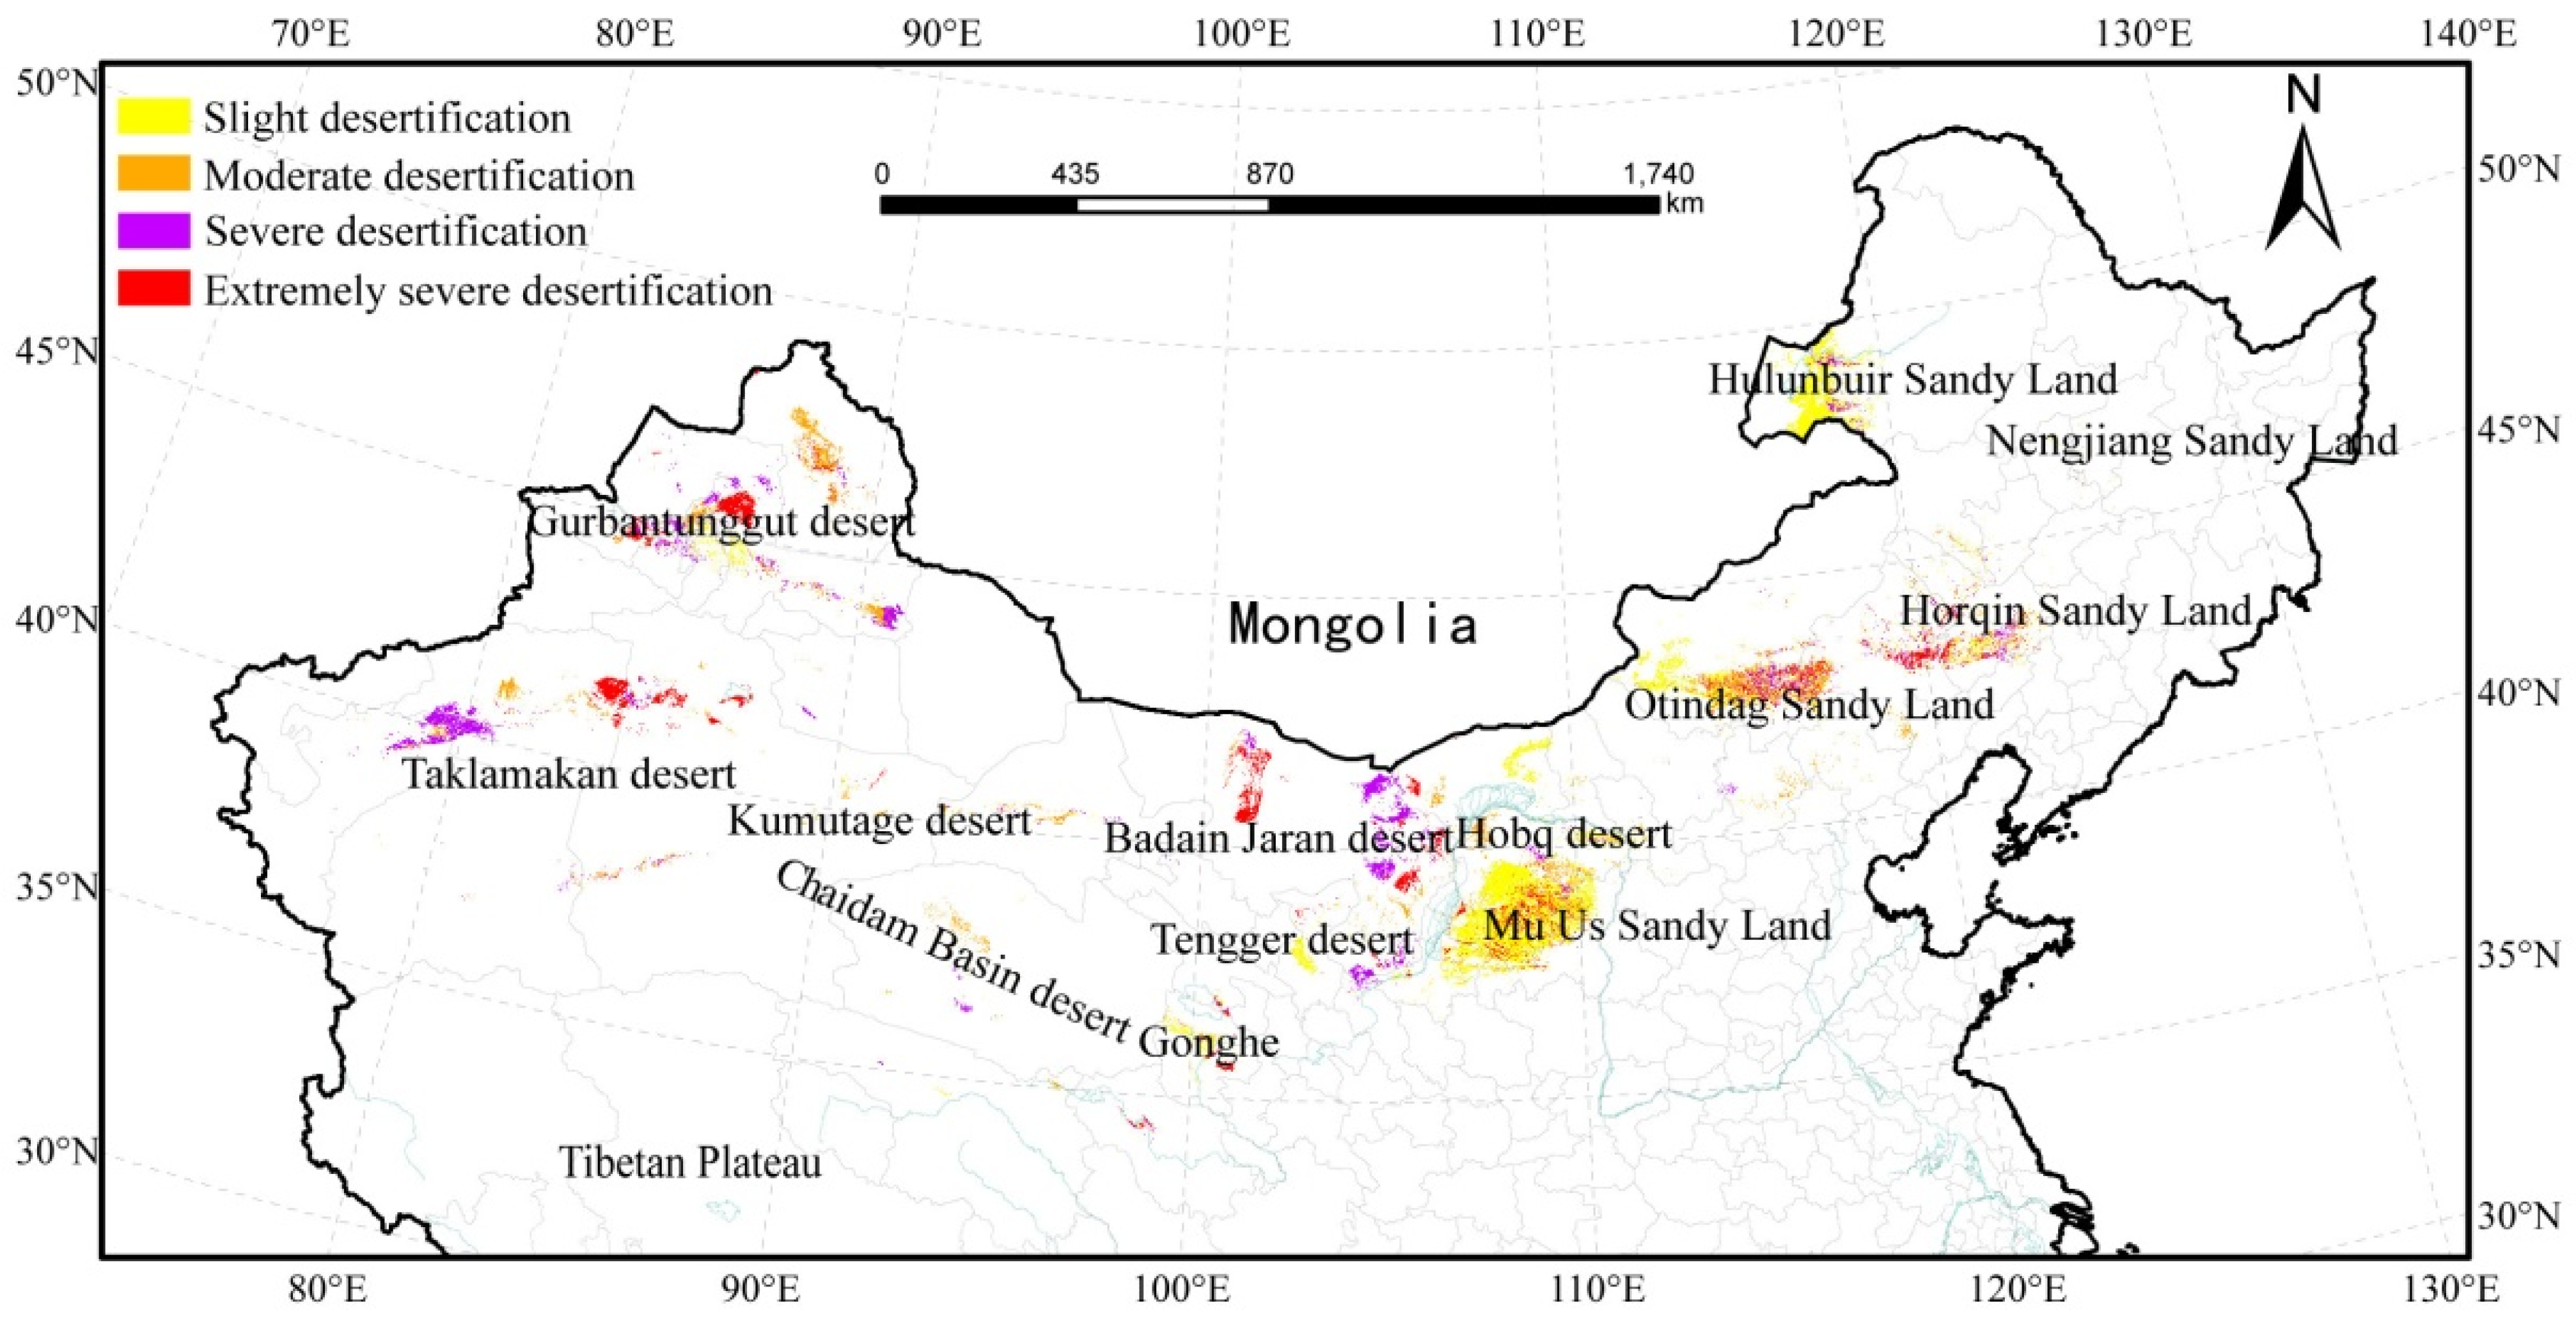
3.6. Changes in the Area of Desertification from 2015 to 2020 in Northern China
4. Discussion
4.1. Accuracy Evaluation
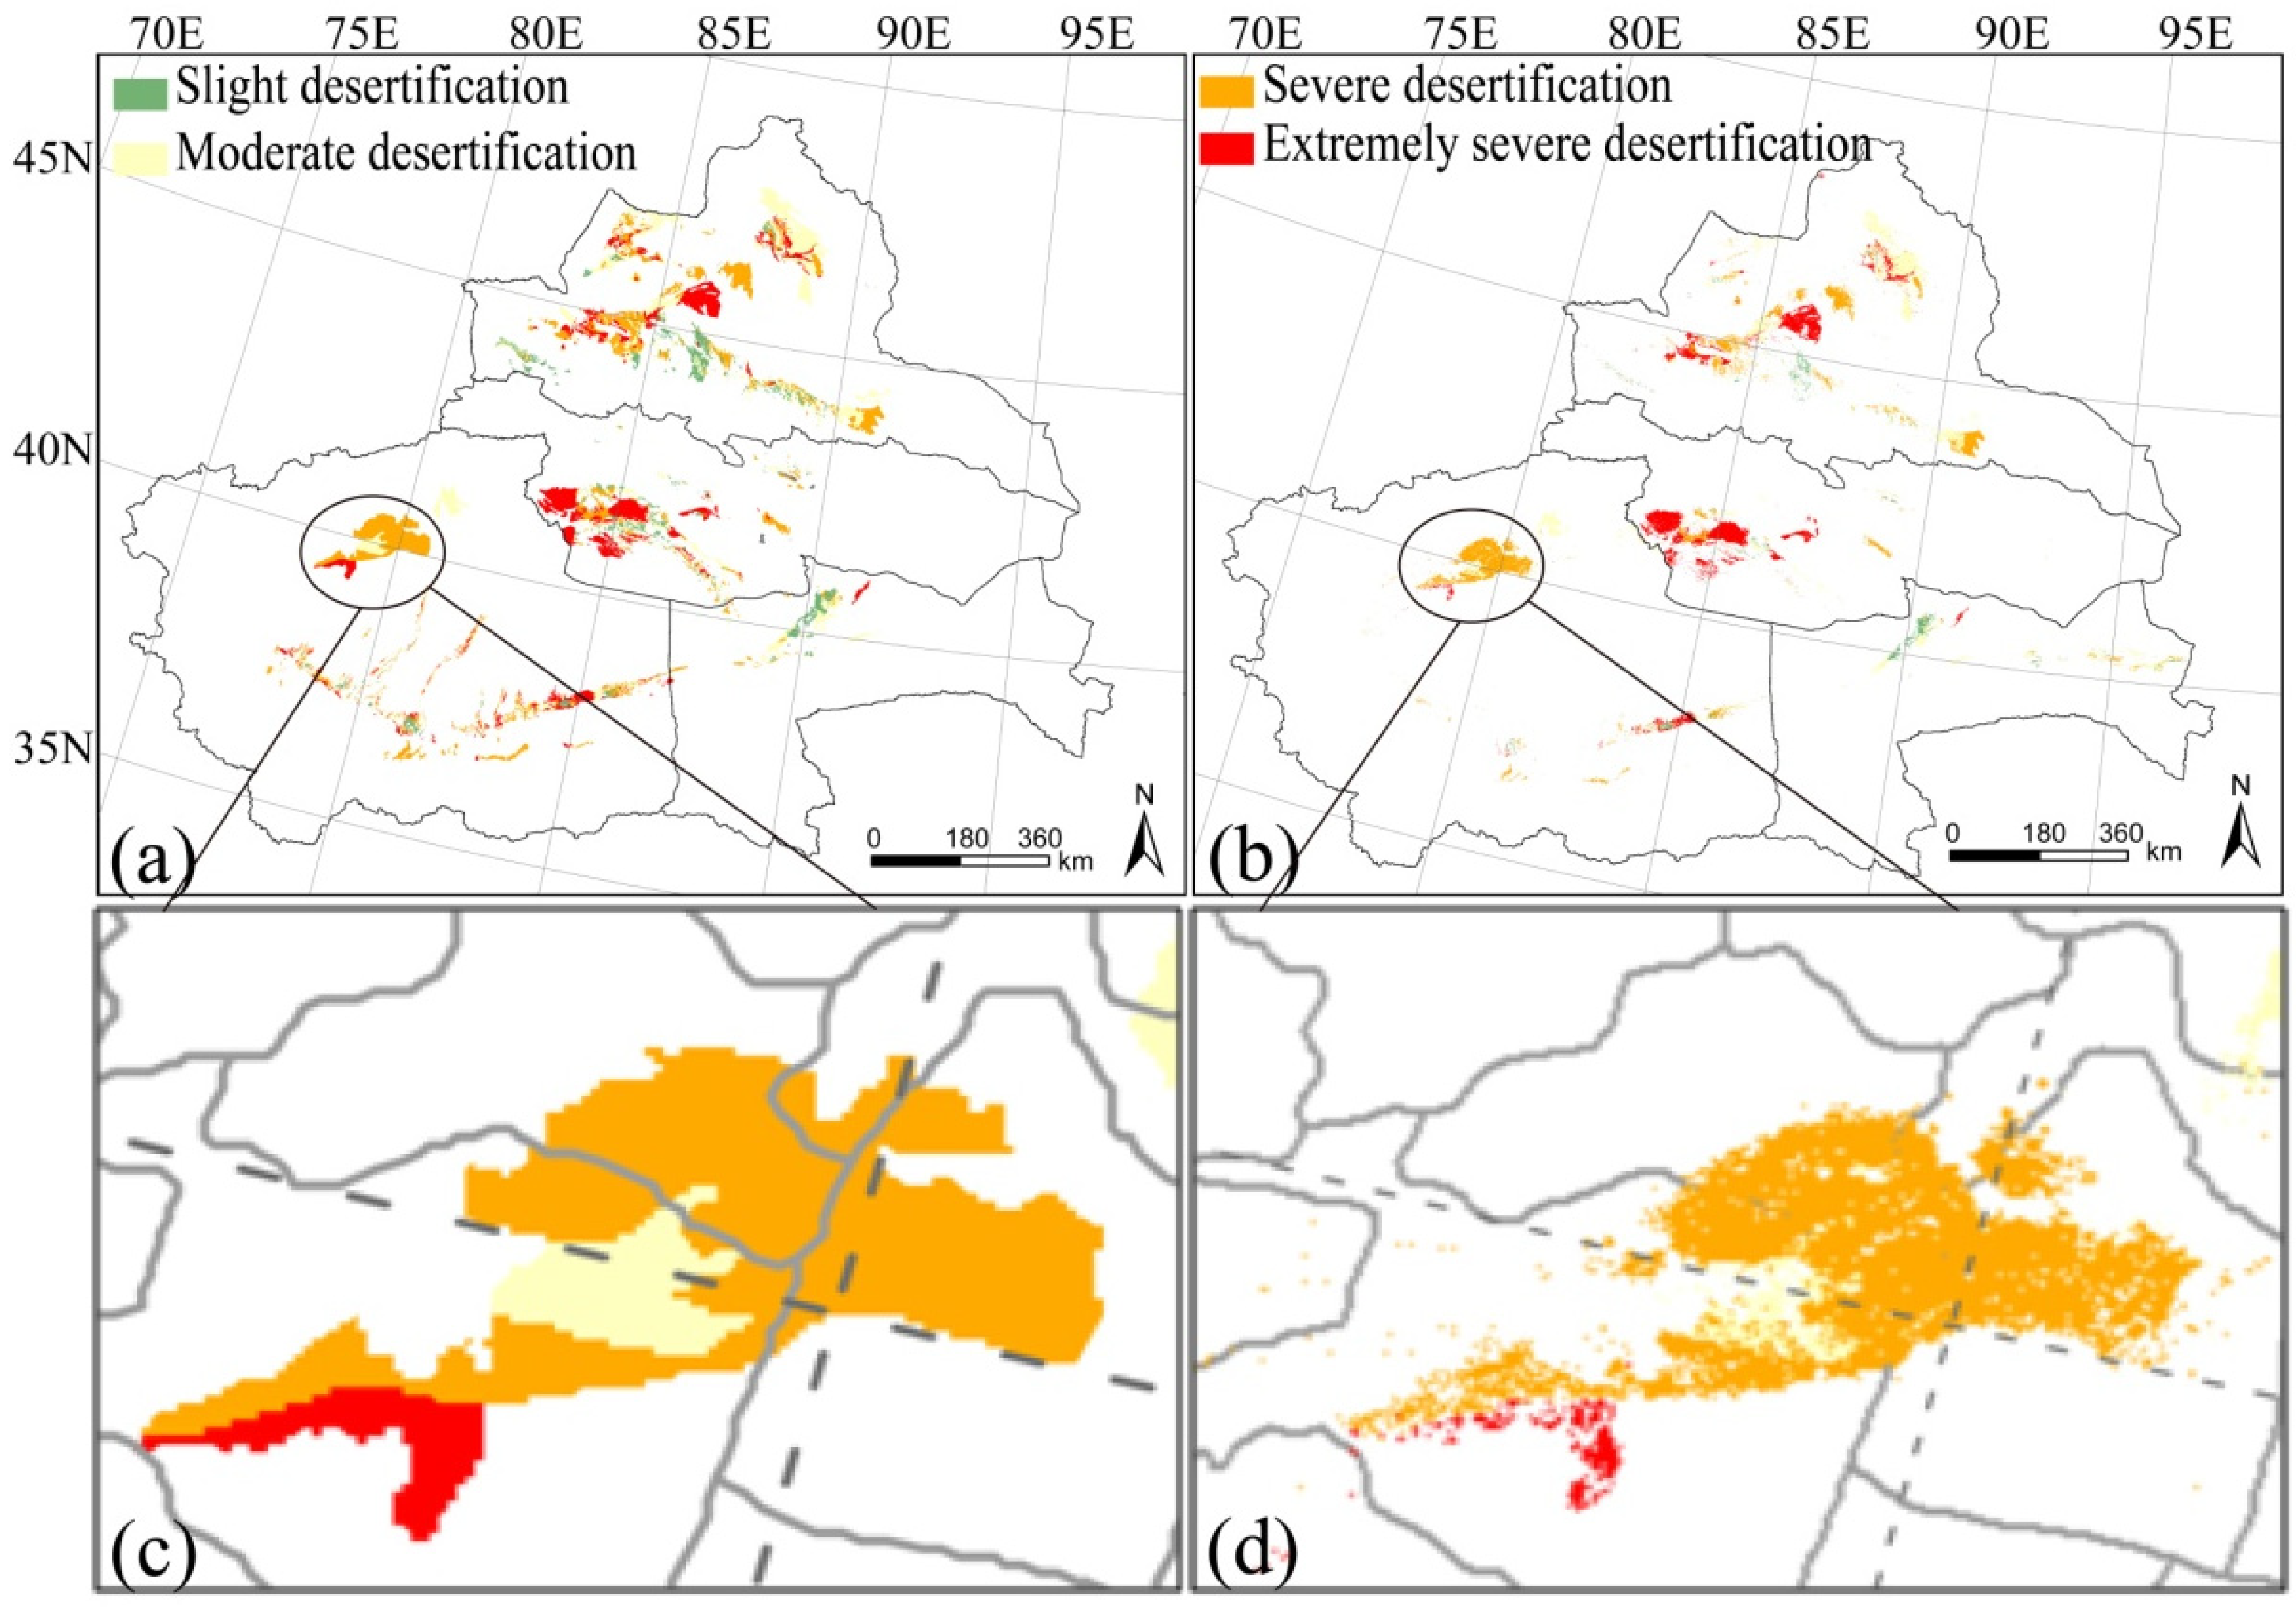
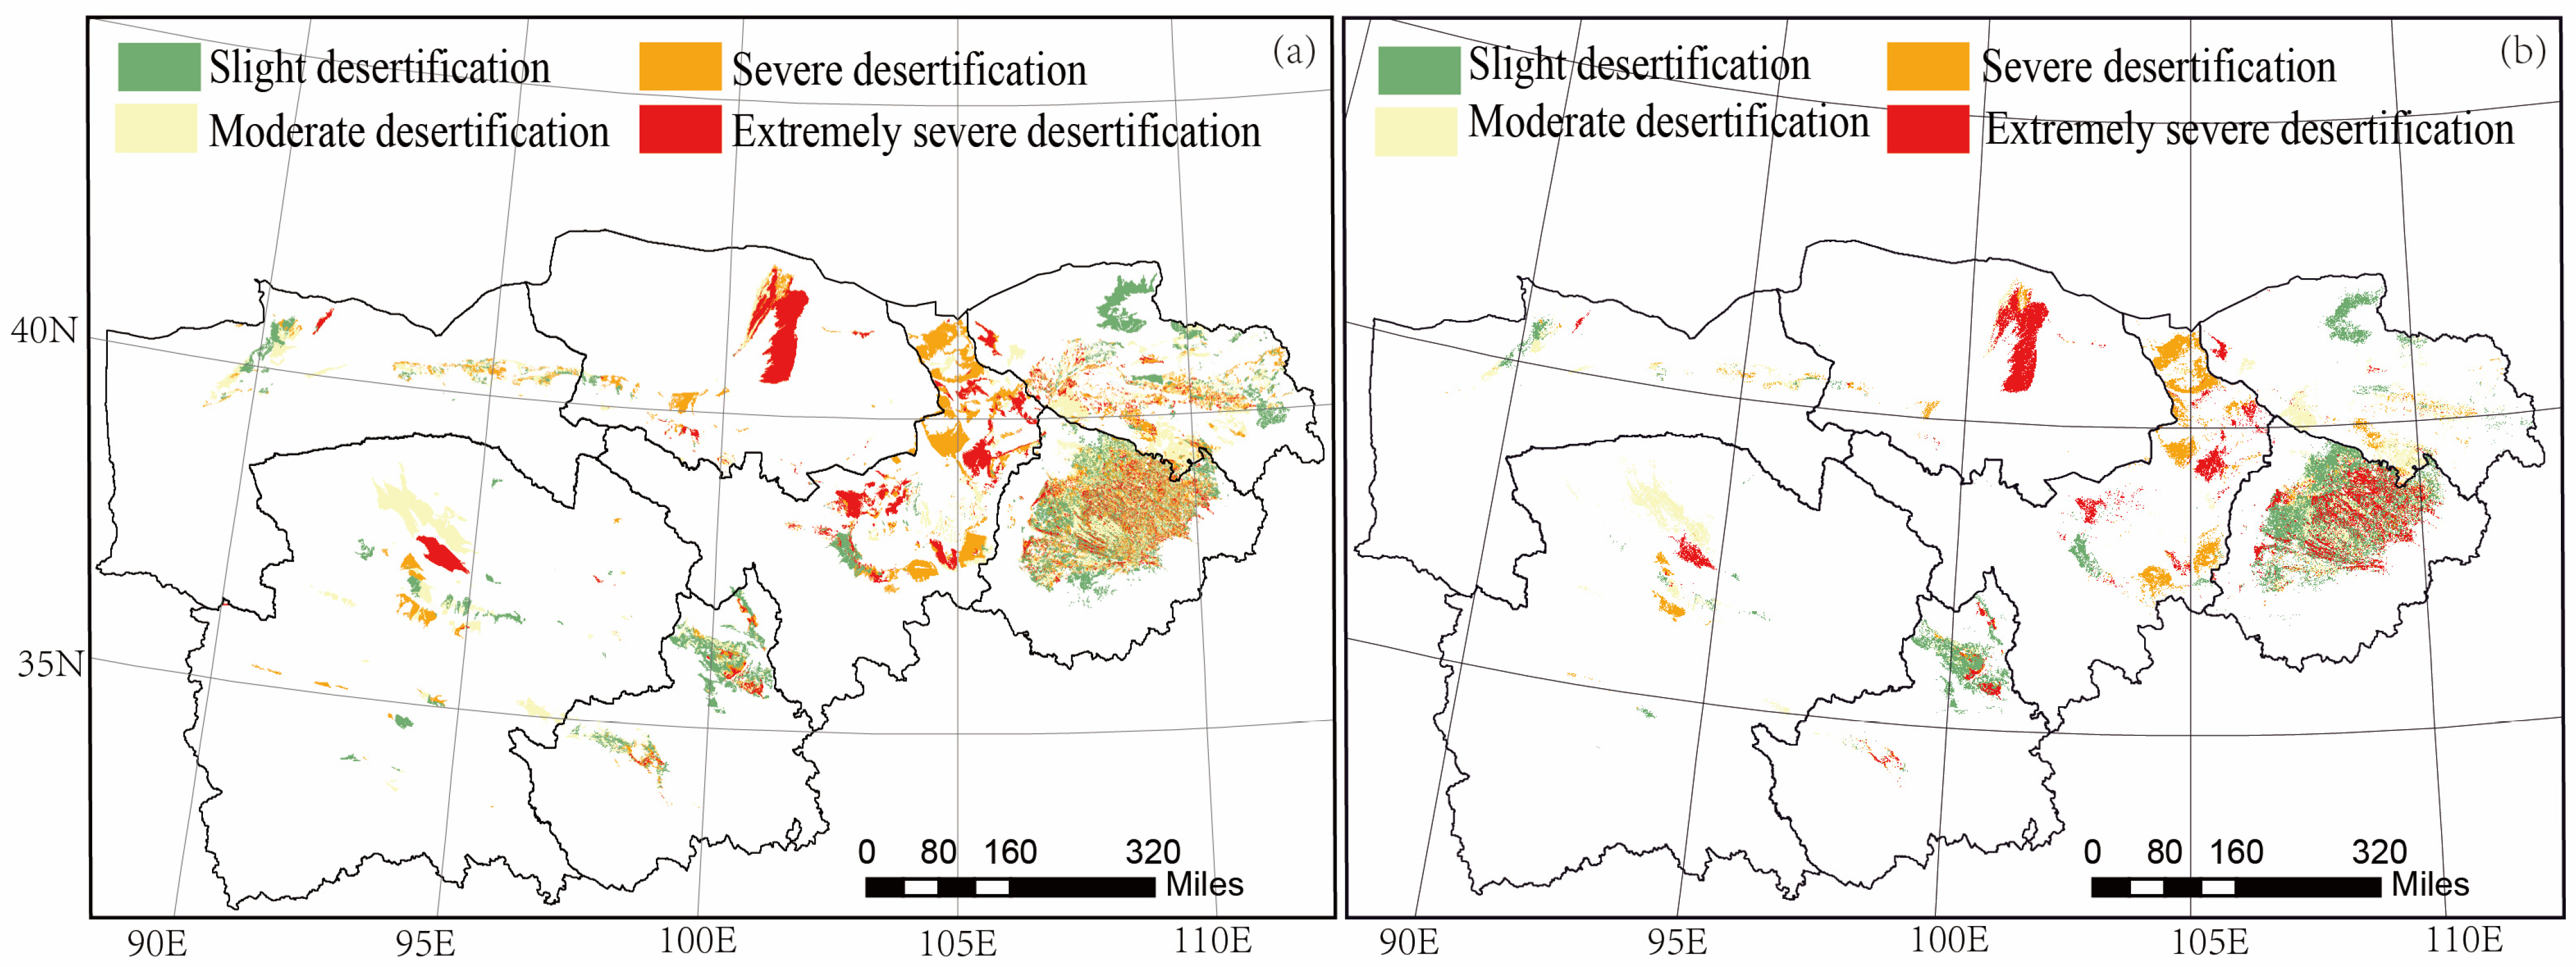
4.2. Validation of the Spatial Results of the Random Forest Classifier
4.3. Changes in the Desertification Area since 1995 in Northern China
5. Conclusions
- (1)
- The method’s average classification accuracy was 91.6% ± 5.8, and the average kappa coefficient was 0.68 ± 0.09. The random forest classifier results therefore provided a relatively accurate prediction of the distribution of desertified land and desertification severity.
- (2)
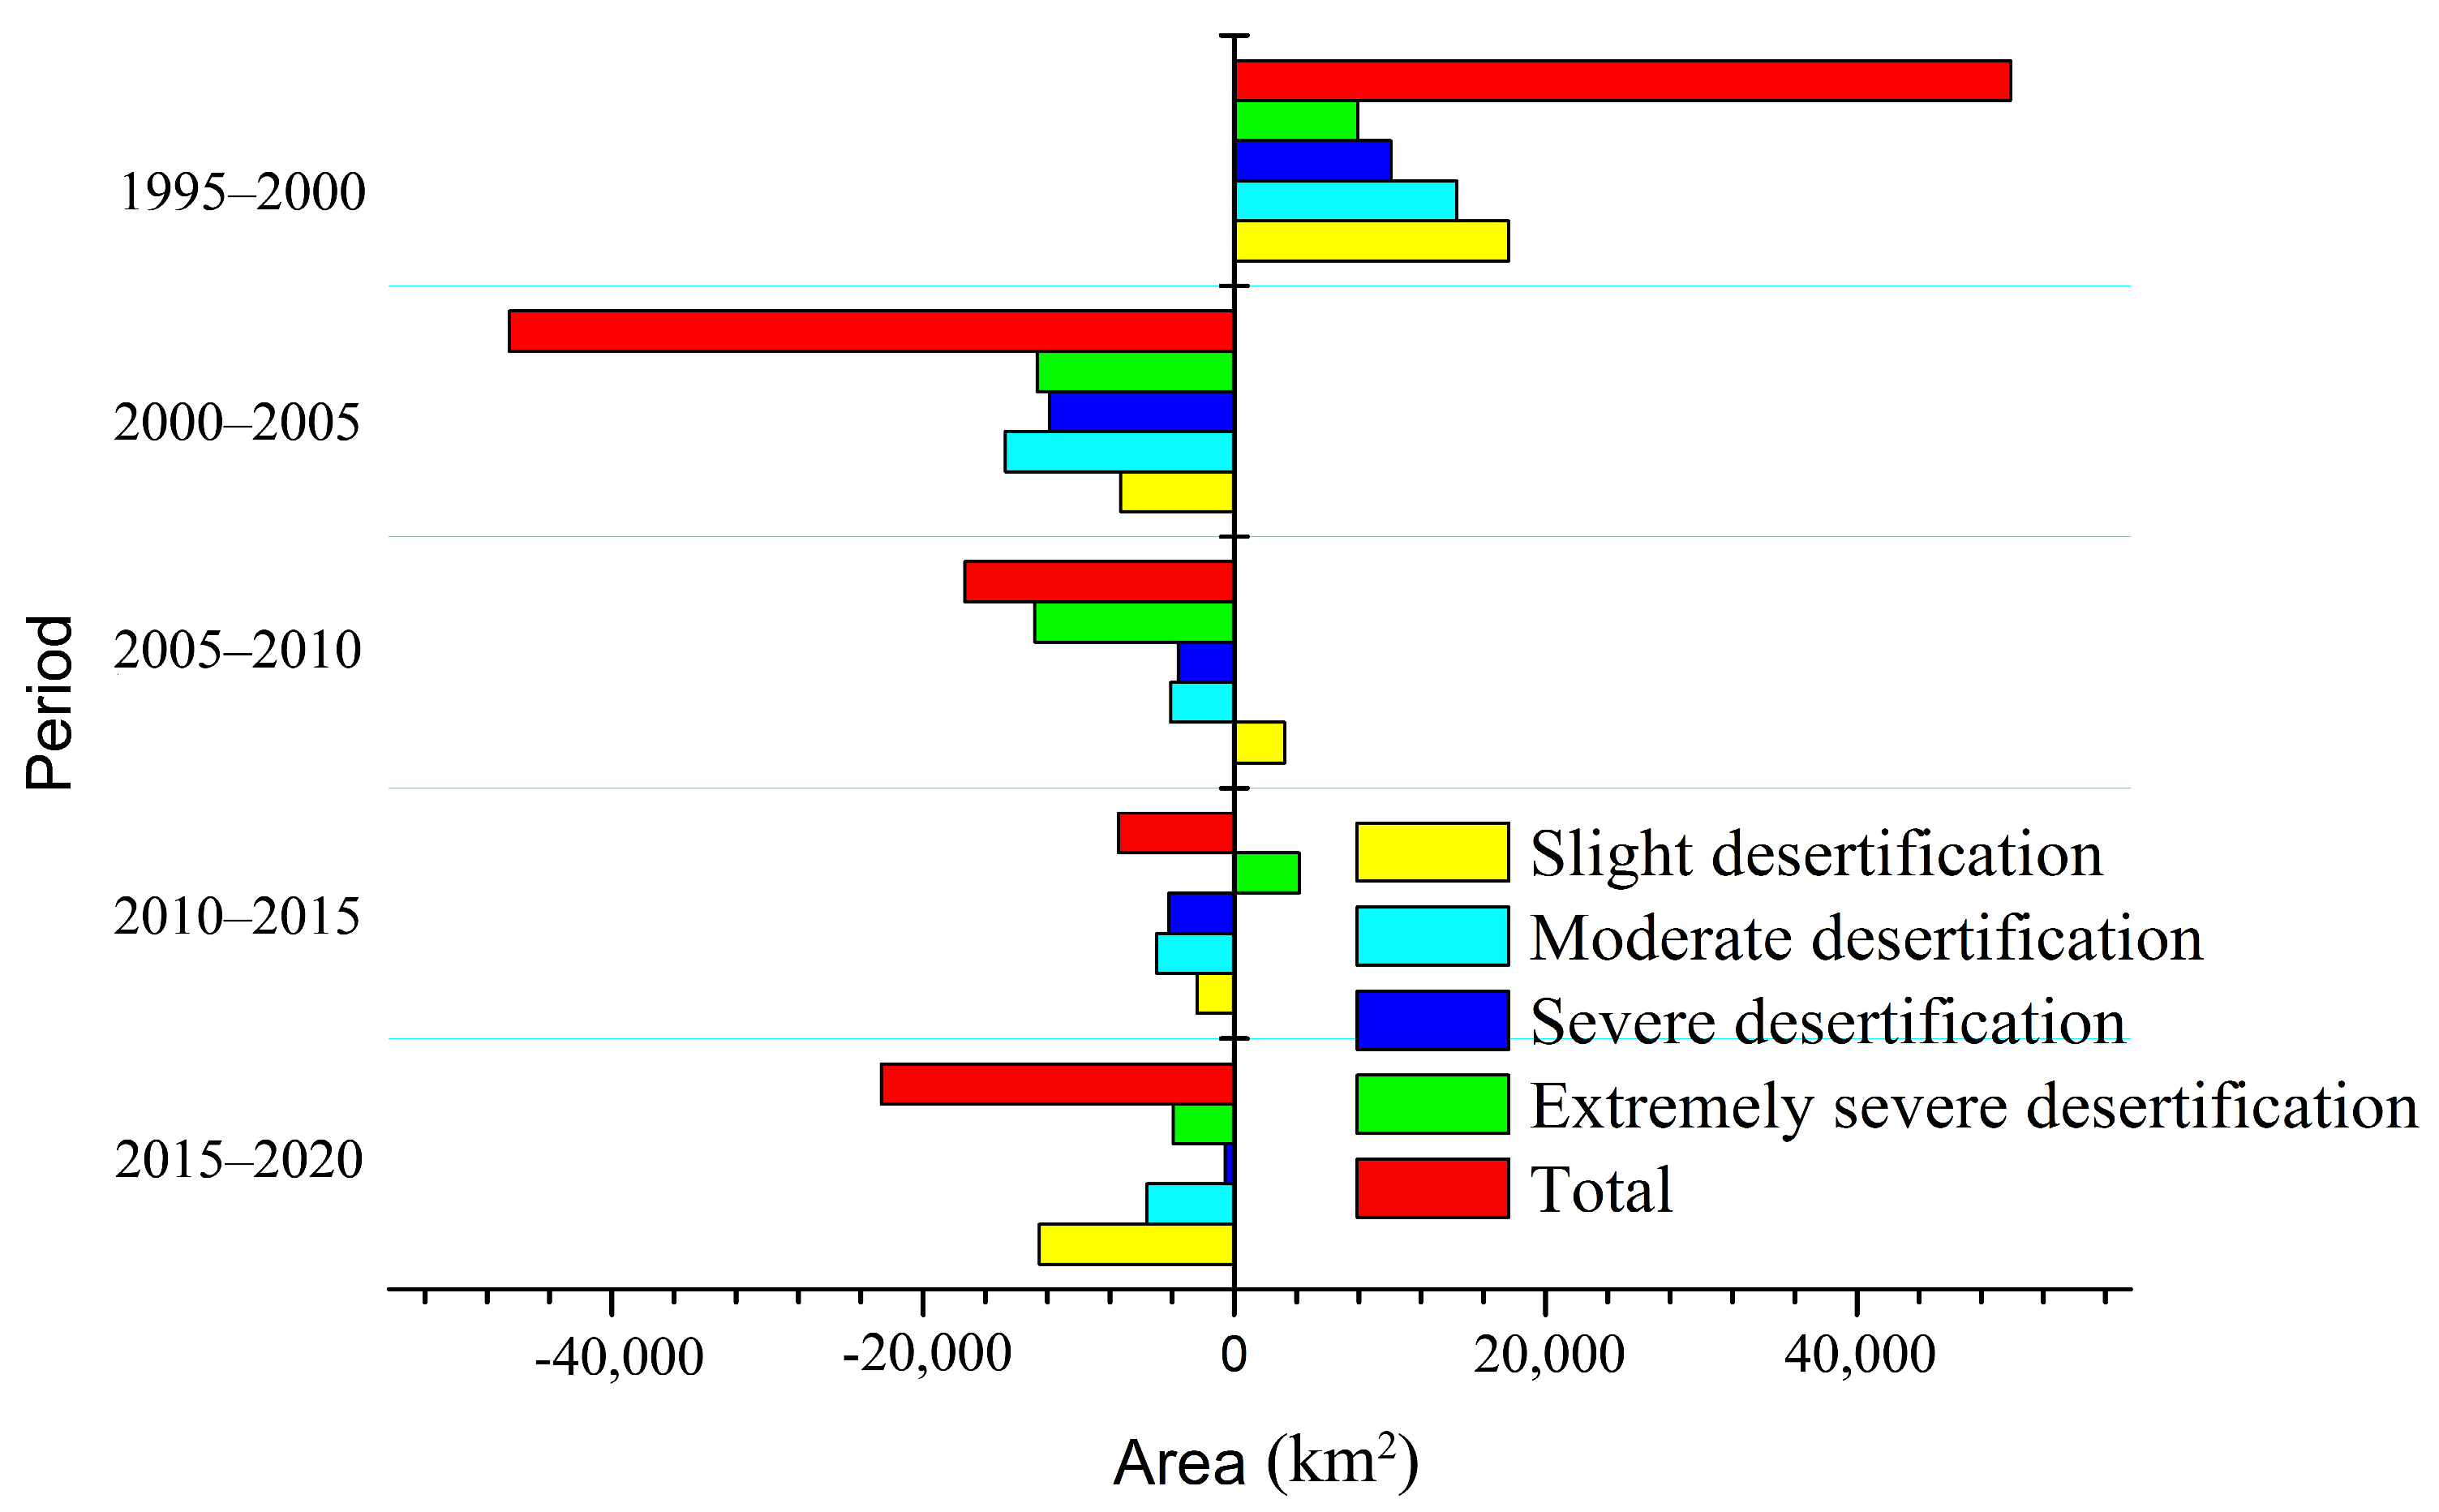
- From 1995 to 2000, the area of aeolian desertification increased at an average rate of 9977 km2 yr−1, and from 2000 to 2005, from 2005 to 2010, from 2010 to 2015, and from 2015 to 2020, the aeolian desertification decreased at an average rate of 2535, 3462, 1487, and 4537 km2 yr−1, respectively. From 1995 to 2000, the area with slight desertification increased rapidly and then decreased until 2020, with some fluctuation.
- (3)
- The areas of moderate, severe, and extremely severe desertification decreased from 2000 to 2020, with the small exception of the changing trend in extremely severe desertification during 2010 to 2015. Desertification increased from 1995 to 2000 and then decreased.
Author Contributions
Funding
Data Availability Statement
Acknowledgments
Conflicts of Interest
References
- UNCCD. United Nations: Convention to Combat Desertification in Those Countries Experiencing Serious Drought and/or Desertification, Particularly in Africa. In International Legal Materials; Cambridge University Press: Cambridge, UK, 1994; pp. 1328–1382. [Google Scholar]
- Zhu, Z.D.; Liu, S. The concept of desertification and the differentiation of its development. J. Desert Res. 1984, 4, 2–8. [Google Scholar]
- Zhu, Z.D. Concept, cause and control of desertification in China. Quat. Sci. 1998, 18, 145–155. [Google Scholar]
- Wang, T.; Zhu, Z.D. Study on sandy desertification in China—1. Definition of sandy desertification and its connotation. J. Desert Res. 2003, 23, 209–214. [Google Scholar]
- Guo, B.; Yang, F.; Fan, Y.; Zang, W. The dominant driving factors of rocky desertification and their variations in typical mountainous karst areas of southwest China in the context of global change. Catena 2023, 220, 106674. [Google Scholar] [CrossRef]
- Shao, W.; Wang, Q.; Guan, Q.; Zhang, J.; Yang, X.; Liu, Z. Environmental sensitivity assessment of land desertification in the Hexi Corridor, China. Catena 2023, 220, 106728. [Google Scholar] [CrossRef]
- Elnashar, A.; Zeng, H.; Wu, B.; Gebremicael, T.G.; Marie, K. Assessment of environmentally sensitive areas to desertification in the Blue Nile Basin driven by the MEDALUS-GEE framework. Sci. Total Environ. 2022, 815, 152925. [Google Scholar] [CrossRef]
- Feng, K.; Wang, T.; Liu, S.; Yan, C.; Kang, W.; Chen, X.; Guo, Z. Path analysis model to identify and analyse the causes of aeolian desertification in Mu Us Sandy Land, China. Ecol. Indic. 2021, 124, 107386. [Google Scholar] [CrossRef]
- Wang, T.; Song, X.; Yan, C.Z.; Li, S.; Xie, J.L. Remote sensing analysis on aeolian desertification trends in northern China during 1975–2010. J. Desert Res. 2011, 31, 1351–1356. [Google Scholar]
- Song, X.; Yang, G.; Yan, C.; Duan, H.; Liu, G.; Zhu, Y. Driving forces behind land use and cover change in the Qinghai-Tibetan Plateau: A case study of the source region of the Yellow River, Qinghai Province, China. Environ. Earth Sci. 2009, 59, 793–801. [Google Scholar] [CrossRef]
- Yan, C.; Song, X.; Zhou, Y.; Duan, H.; Li, S. Assessment of aeolian desertification trends from 1975’s to 2005’s in the watershed of the Longyangxia Reservoir in the upper reaches of China’s Yellow River. Geomorphology 2009, 112, 205–211. [Google Scholar] [CrossRef]
- Song, X.; Wang, T.; Xue, X.; Yan, C.; Li, S. Monitoring and analysis of aeolian desertification dynamics from 1975 to 2010 in the Heihe River Basin, northwestern China. Environ. Earth Sci. 2015, 74, 3123–3133. [Google Scholar] [CrossRef]
- Gao, J.; Liu, Y.S. Determination of land degradation causes in Tongyu County, Northeast China via land cover change detection. Int. J. Appl. Earth Obs. Geoinf. 2010, 12, 9–16. [Google Scholar] [CrossRef]
- Yang, X.; Ding, Z.; Fan, X.; Zhou, Z.; Ma, N. Processes and mechanisms of desertification in northern China during the last 30 years, with a special reference to the Hunshandake Sandy Land, eastern Inner Mongolia. Catena 2007, 71, 2–12. [Google Scholar] [CrossRef]
- Moumane, A.; Al Karkouri, J.; Benmansour, A.; El Ghazali, F.E.; Fico, J.; Karmaoui, A.; Batchi, M. Monitoring long-term land use, land cover change, and desertification in the Ternata oasis, Middle Draa Valley, Morocco. Remote Sens. Appl. Soc. Environ. 2022, 26, 100745. [Google Scholar] [CrossRef]
- Mao, X.; Zhao, P.; Wang, D. Nonsupervising digital classification and GIS in the dynamic monitoring of soil desertification application. J. Northwest For. Univ. 2005, 20, 6–9. [Google Scholar]
- Wang, J.; Dong, G.; Li, W.; Wang, L.; Tang, H. Primary study on the multi-layer remote sensing information extraction of desertification land types by using decision tree technology. J. Desert Res. 2000, 20, 12–16. [Google Scholar]
- Ma, J.H.; Cai, D.H.; Xiao, T. Qualified evaluating on the remote sensing of desertification—A case study of Erdos region. J. Lanzhou Univ. (Nat. Sci.) 2007, 43, 1–6. [Google Scholar]
- Qiao, P.L.; Zhang, J.X.; Lin, Z.J. An artificial neural network method for the information of desertification extraction. Acta Geod. Cartogr. Sin. 2004, 33, 58–62. [Google Scholar]
- Meng, X.; Gao, X.; Li, S.; Li, S.; Lei, J. Monitoring desertification in Mongolia based on Landsat images and Google Earth Engine from 1990 to 2020. Ecol. Indic. 2021, 129, 107908. [Google Scholar] [CrossRef]
- Abuzaid, A.S.; Abdelatif, A.D. Assessment of desertification using modified MEDALUS model in the north Nile Delta, Egypt. Geoderma 2022, 405, 115400. [Google Scholar] [CrossRef]
- Duan, H.; Wang, T.; Xue, X.; Yan, C. Dynamic monitoring of aeolian desertification based on multiple indicators in Horqin Sandy Land, China. Sci. Total Environ. 2019, 650, 2374–2388. [Google Scholar] [CrossRef]
- Bai, Z.; Han, L.; Jiang, X.; Liu, M.; Li, L.; Liu, H.; Lu, J. Spatiotemporal evolution of desertification based on integrated remote sensing indices in Duolun County, Inner Mongolia. Geoecol. Inform. 2022, 70, 101750. [Google Scholar]
- Breiman, L. Random forests. Mach. Learn. 2001, 45, 5–32. [Google Scholar] [CrossRef]
- Belgiu, M.; Drăguţ, L. Random forest in remote sensing: A review of applications and future directions. ISPRS J. Photogramm. Remote Sens. 2016, 114, 24–31. [Google Scholar] [CrossRef]
- Sun, Y.; Sun, Y.; Yao, S.; Akram, M.A.; Hu, W.; Dong, L.; Li, H.; Wei, M.; Gong, H.; Xie, S.; et al. Impact of climate change on plant species richness across drylands in China: From past to present and into the future. Ecol. Indic. 2021, 132, 108288. [Google Scholar] [CrossRef]
- Chan, J.C.-W.; Paelinckx, D. Evaluation of Random Forest and Adaboost tree-based ensemble classification and spectral band selection for ecotope mapping using airborne hyperspectral imagery. Remote Sens. Environ. 2008, 112, 2999–3011. [Google Scholar] [CrossRef]
- Wang, Z.; Gong, H.; Huang, M.; Gu, F.; Wei, J.; Guo, Q.; Song, W. A multimodel random forest ensemble method for an improved assessment of Chinese terrestrial vegetation carbon density. Methods Ecol. Evol. 2021, 14, 117–132. [Google Scholar] [CrossRef]
- Zhang, Y.; Tian, Y.; Li, Y.; Wang, D.; Tao, J.; Yang, Y.; Lin, J.; Zhang, Q.; Wu, L. Machine learning algorithm for estimating karst rocky desertification in a peak-cluster depression basin in southwest Guangxi, China. Sci. Rep. 2022, 12, 19121. [Google Scholar] [CrossRef]
- Ayala-Izurieta, J.E.; Márquez, C.O.; García, V.J.; Recalde-Moreno, C.G.; Rodríguez-Llerena, M.V.; Damián-Carrión, D.A. Land cover classification in an ecuadorian mountain geosystem using a random forest classifier, spectral vegetation indices, and ancillary geographic data. Geosciences 2017, 7, 34. [Google Scholar] [CrossRef]
- Kelsey, E.N.; Gunn, G.E.; Shiklomanov, N.I.; Engstrom, R.N.; Streletskiy, D.A. Land cover change in the lower Yenisei River using dense stacking of landsat imagery in Google Earth Engine. Remote Sens. 2018, 10, 1226. [Google Scholar] [CrossRef]
- Zeng, H.; Wu, B.; Wang, S.; Musakwa, W.; Tian, F.; Mashimbye, Z.E.; Poona, N.; Syndey, M. A synthesizing land-cover classification method based on Google Earth Engine: A case study in Nzhelele and Levhuvu Catchments, South Africa. Chin. Geogr. Sci. 2020, 30, 397–409. [Google Scholar] [CrossRef]
- Wang, Z.; Liu, K.; Peng, L.; Cao, J.; Sun, Y.; Qian, Y.; Shi, S. Analysis of mangrove annual changes in Guangdong Province during 1986–2018 based on Google Earth Engine. Trop. Geogr. 2020, 40, 881–892. [Google Scholar]
- Wang, T.; Wu, W.; Xue, X. Spatial-temporal changes of sandy desertified land during last 5 decades in Northern China. Acta Geogr. Sin. 2004, 59, 203–212. [Google Scholar]
- World Meteorological Organization. WMO Guidelines on the Calculation of Climate Normals; World Meteorological Organization: Geneva, Switzerland, 2017. [Google Scholar]
- Foody, G.M. Status of land cover classification accuracy assessment. Remote Sens. Environ. 2002, 80, 185–201. [Google Scholar] [CrossRef]
- Zhang, H.K.K.; Roy, D.P. Using the 500m MODIS land cover product to derive a consistent continental scale 30m Landsat land cover classification. Remote Sens. Environ. 2017, 197, 15–34. [Google Scholar] [CrossRef]
- Wang, X.; Song, J.; Xiao, Z.; Wang, J.; Hu, F. Desertification in the Mu Us Sandy Land in China: Response to climate change and human activity from 2000 to 2020. Geogr. Sustain. 2023, 3, 177–189. [Google Scholar] [CrossRef]
- Decuyper, M.; Chávez, R.O.; Čufar, K.; Estay, S.A.; Clevers, J.G.; Prislan, P.; Gričar, J.; Črepinšek, Z.; Merela, M.; de Luis, M.; et al. Spatio-temporal assessment of beech growth in relation to climate extremes in Slovenia-An integrated approach using remote sensing and tree-ring data. Agric. For. Meteorol. 2020, 287, 107925. [Google Scholar] [CrossRef]
- Shen, X.; Liu, B.; Henderson, M.; Wang, L.; Jiang, M.; Lu, X. Vegetation greening, extended growing seasons, and temperature feedbacks in warming temperate grasslands of China. J. Clim. 2022, 35, 5103–5117. [Google Scholar] [CrossRef]


| Name | Formula |
|---|---|
| NDVI | Landsat 8: NDVI = (B5 − B4)/(B5 + B4) Landsat 5, 7: NDVI = (B4 − B3)/(B4 + B3) |
| Albedo | Landsat 8: Albedo = 0.356 B2 + 0.130 B4 + 0.373 B5 + 0.085 B6 + 0.072 B7 – 0.0018 |
| MSAVI | Landsat 8: MSAVI = {2 B5 + 1 − sqrt [(2 B5 + 1)2 − 8 (B5 − B4)]}/2 Landsat 5, 7: MSAVI = {2 B4 + 1 − sqrt [(2 B4 + 1)2 − 8 (B4 − B3)]}/2 |
| TGSI | Landsat 8: TGSI = (B4 − B2)/(B4 + B3 + B2) Landsat 5, 7: TGSI = (B3 − B1)/(B3 + B2 + B1) |
| MNDWI | Landsat 8: MNDWI = (B3 − B6)/(B3 + B6) Landsat 5, 7: MNDWI = (B2 − B5)/(B2 + B5) |
| BSI | Landsat 8: BSI = 100 [(B6 + B4) − (B5 + B2)]/[(B6 + B4) + (B5 + B2)] +100 Landsat 5, 7: BSI = 100 [(B5 + B3) − (B4 + B1)]/[(B5 + B3) + (B4 + B1)] +100 |
| NDBI | Landsat 8: NDBI = (B6 − B5)/(B6 + B5) Landsat 5, 7: NDBI = (B5 − B4)/(B5 + B4) |
| Region | Accuracy (%) | Kappa | Region | Accuracy (%) | Kappa |
|---|---|---|---|---|---|
| Mu Us Sandy Land | 74.78 | 0.64 | Qaidam Basin | 97.33 | 0.71 |
| Kubuqi Desert | 87.35 | 0.63 | Source region of the Yellow River | 94.11 | 0.75 |
| Shiyanghe Basin | 93.39 | 0.75 | Kumutage Desert | 96.59 | 0.69 |
| Heihe River Basin | 98.11 | 0.83 | Middle of the Otindag Sandy Land | 87.99 | 0.69 |
| Hulunbuir Desert | 92.16 | 0.80 | Other parts of the Otindag Sandy Land | 89.78 | 0.59 |
| Junggar Basinand Tianshan Mountains | 90.87 | 0.67 | Southern part of the Horqin Sandy Land | 85.57 | 0.72 |
| Turpan–Hami Basin | 95.40 | 0.73 | Northern part of the Horqin Sandy Land | 92.41 | 0.54 |
| Southern Xinjiang | 94.04 | 0.70 | Songnen Sandy Land | 95.21 | 0.50 |
Disclaimer/Publisher’s Note: The statements, opinions and data contained in all publications are solely those of the individual author(s) and contributor(s) and not of MDPI and/or the editor(s). MDPI and/or the editor(s) disclaim responsibility for any injury to people or property resulting from any ideas, methods, instructions or products referred to in the content. |
© 2024 by the authors. Licensee MDPI, Basel, Switzerland. This article is an open access article distributed under the terms and conditions of the Creative Commons Attribution (CC BY) license (https://creativecommons.org/licenses/by/4.0/).
Share and Cite
Zhang, C.; Tan, N.; Li, J. Aeolian Desertification Dynamics from 1995 to 2020 in Northern China: Classification Using a Random Forest Machine Learning Algorithm Based on Google Earth Engine. Remote Sens. 2024, 16, 3100. https://doi.org/10.3390/rs16163100
Zhang C, Tan N, Li J. Aeolian Desertification Dynamics from 1995 to 2020 in Northern China: Classification Using a Random Forest Machine Learning Algorithm Based on Google Earth Engine. Remote Sensing. 2024; 16(16):3100. https://doi.org/10.3390/rs16163100
Chicago/Turabian StyleZhang, Caixia, Ningjing Tan, and Jinchang Li. 2024. "Aeolian Desertification Dynamics from 1995 to 2020 in Northern China: Classification Using a Random Forest Machine Learning Algorithm Based on Google Earth Engine" Remote Sensing 16, no. 16: 3100. https://doi.org/10.3390/rs16163100
APA StyleZhang, C., Tan, N., & Li, J. (2024). Aeolian Desertification Dynamics from 1995 to 2020 in Northern China: Classification Using a Random Forest Machine Learning Algorithm Based on Google Earth Engine. Remote Sensing, 16(16), 3100. https://doi.org/10.3390/rs16163100