Abstract
Afforestation is an important way to effectively reduce carbon emissions from human activities and increase carbon sinks in forest ecosystems. It also plays an important role in climate change mitigation. Currently, few studies have examined the spatiotemporal dynamics of future afforestation areas, which are crucial for assessing future carbon sequestration in forest ecosystems. In order to obtain the dynamic distribution of potential afforestation land over time under future climate change scenarios in China, we utilized the random forest method in this study to calculate weights for the selected influencing factors on potential afforestation land, such as natural vegetation attributes and environmental factors. The “weight hierarchy approach” was used to calculate the afforestation quality index of different regions in different 5-year intervals from 2021 to 2060 and extract high-quality potential afforestation lands in each period. By dynamically analyzing the distribution and quality of potential afforestation land from 2021 to 2060, we can identify optimal afforestation sites for each period and formulate a progressive afforestation plan. This approach allows for a more accurate application of the FCS model to evaluate the dynamic changes in the carbon sequestration capacity of newly afforested land from 2021 to 2060. The results indicate that the average potential afforestation land area will reach 75 Mha from 2021 to 2060. In the northern region, afforestation areas are mainly distributed on both sides of the “Hu Line”, while in the southern region, they are primarily distributed in the Yunnan–Guizhou Plateau and some coastal provinces. By 2060, the potential calculated cumulative carbon storage of newly afforested lands was 11.68 Pg C, with a peak carbon sequestration rate during 2056–2060 of 0.166 Pg C per year. Incorporating information on the spatiotemporal dynamics of vegetation succession, climate production potential, and vegetation resilience while quantifying the weights of each influencing factor can enhance the accuracy of predictions for potential afforestation lands. The conclusions of this study can provide a reference for the formulation of future afforestation plans and the assessment of their carbon sequestration capacity.
1. Introduction
Forest ecosystems, as significant carbon sinks, play a crucial role in combating climate change by capturing atmospheric carbon dioxide. This process provides both environmental and economic benefits, contributing to global temperature reduction [1]. The Chinese government has set an ambitious target to reach carbon neutrality by the year 2060, a critical step in curbing the worldwide rise in CO2 emissions [2], which is crucial in limiting the increase of CO2 on a global scale [3,4]. Nonetheless, realizing such an objective necessitates substantial initiatives in both reducing emissions and removing atmospheric CO2 [5,6]. The management of terrestrial carbon levels through afforestation, reforestation, and alterations in land use is a feasible approach [7]. Afforestation is widely recognized for its effectiveness in enhancing the land’s carbon storage capacity, a strategy that has received extensive international support [8,9,10]. In China’s blueprint for climate change mitigation, the expansion of forested regions and the optimization of their carbon sequestration potential are key strategies outlining ambitious goals for forest coverage [11,12,13,14]. Exploring the spatial dynamics of potential afforestation lands over a long time series and accurately evaluating their future carbon sequestration capacity can significantly contribute to achieving these objectives.
At present, most of the studies on potential afforestation lands use landscape ecology methods combined with historical data to identify suitable areas for afforestation [15,16,17]. However, due to the regional differences in topography, climate, and other relevant factors, it is difficult to apply these methods on a large or national scale to assess suitable afforestation lands. Current research determining large-scale suitable forest areas utilizes the methods of multi-factor comprehensive analysis [18], ecological zoning [19], machine learning [20], and dynamic global vegetation models [21]. In addition, spatiotemporal uncertainty in factors such as climate fluctuation and vegetation succession can have a significant impact on the prediction of potential afforestation areas and, therefore, should be incorporated into the analysis of potential areas for afforestation [22]. Xu [18] used the “minimum factor law” to comprehensively analyze terrain, climate conditions, traffic conditions, etc., and obtained a quality classification map of potential afforestation lands in China. However, the study did not consider the spatiotemporal dynamics of the influencing factors, such as climate conditions, nor the weighted influence of each influencing factor, which may impact the accuracy of the quality assessment of the potential afforestation land. In addition, the rapid development of industrialization and urbanization in China has caused a series of environmental problems, such as land degradation, resource scarcity, and ecological damage in many areas [23,24,25,26]. The previously constructed shelterbelts have been severely degraded due to water scarcity and desertification, which has greatly reduced the afforestation survival rates [14]. Therefore, the prediction research of potential afforestation land needs to incorporate climate factors and land use/land cover (LULC) data, both of which consider spatiotemporal dynamics and quantify the survival ability of vegetation in harsh environments. Subsequently, it is important to consider the influence weights of these factors to dynamically evaluate the distribution of potential afforestation land and its future quality level in order to improve the prediction accuracy for potential afforestation land on a nationwide scale.
Carbon sequestration in terrestrial ecosystems, especially forests, has significant environmental and economic impacts and has a negative feedback effect on global warming [1]. Recently, studies have evaluated the potential for carbon storage and carbon sequestration in China’s future afforestation strategies using model simulations and statistical methods [8,22,27]. Based on forest inventory data, Cheng et al. [8] calculated the biomass density of each sample using the tree species-scale age–biomass density equation and then determined the carbon density value of each sample to evaluate the national afforestation carbon storage. Cai et al. [27] randomly selected afforestation sites across the country, specified annual afforestation plans, and used the FCS model to evaluate afforestation carbon storage year by year. Xu et al. [22] considered different carbon storage calculation models corresponding to various tree species and used the MaxEnt model to evaluate different suitable tree species in different regions of China, thereby assessing afforestation carbon storage using different carbon storage calculation models. However, most studies have overlooked the dynamic changes in potential afforestation lands when evaluating the future afforestation carbon storage. They have often formulated annual afforestation plans by randomly selecting afforestation sites [27]. This approach may lead to the selection of sites with low afforestation quality, impacting the accuracy of future carbon sequestration assessments.
Therefore, this study aims to (1) explore the weights of selected influencing factors on potential afforestation lands and evaluate the spatial pattern and quality level of potential afforestation sites; (2) dynamically predict potential afforestation lands in combination with future climate conditions; (3) formulate afforestation plans based on the quality conditions and distribution pattern of potential afforestation sites to more accurately assess the dynamic changes of afforestation carbon sequestration capacity from 2021 to 2060.
2. Materials and Methods
2.1. Study Area
The research area covers the entirety of China, stretching approximately 5500 km from north to south and 5200 km from east to west, with a total area of roughly 9.6 million km². Characterized by a diverse topography that slopes from higher elevations in the west to lower in the east, the country’s vast mountainous and plateau regions contribute to a range of climates, including monsoon in the east, temperate continental in the northwest, and alpine on the Tibetan plateau. This climatic diversity, along with varying wetness levels—from humid to arid—greatly affects the success of tree planting initiatives. Considering land usability, this study focuses on grasslands below the tree line and sloping croplands (over 25°) as potential areas for afforestation, aiming to refine the research’s geographical focus and enhance its validity [18].
2.2. Data Sources
The geospatial data used in this paper include data from LULC products, topography, climate data, transportation, ecological geographic zoning, and administrative division data, as well as some vegetation-related datasets, such as vegetation resilience, forest cover data, and vegetation maps.
We utilized the International Geosphere Biosphere Programme Land Use Land Cover (IGBP LULC) projection data under the SSP245 scenario, available on Figshare (https://figshare.com/) (accessed on 28 April 2024). The dataset spans from 2015 to 2100 with a five-year time step. The land classification scheme is as specified by the IGBP, and the spatial resolution is 0.008333° (about 1 km near equator) in the geographic coordinate system (WGS84). Additionally, two types of land use change data were accessed from the publicly available 2020 global 30 m resolution surface cover remote sensing classification, including the GlobeLand30 and GLC_FCS30 land use change products.
Future temperature and precipitation data from 2020 to 2100 under the SSP245 scenario were accessed from the National Tibetan Plateau Data Center. The data were generated by downscaling using the Delta spatial downscaling scheme based on the global > 100 km climate model dataset released by the IPCC Coupled Model Intercomparison Project Phase 6 (CMIP6) and the global high-resolution climate dataset released by WorldClim.
The ecological–geographical zoning was provided by the National Earth System Science Data Center, and the global road network data were derived from OpenStreetMap’s dataset as of July 2021. Wind direction data were sourced from ERA5 reanalysis, which captured the 10 m elevation wind patterns and were accessible via the ECMWF portal. Elevation data were derived from the SRTM’s 30 m resolution DEM product. Utilized in ArcMap 10.2, slope gradients and aspects were calculated and correlated with winter wind data to identify the spatial distribution of sheltered slopes in the southwestern arid river valley. The timberline forms a prohibitive condition for the spatial distribution of potential afforestation lands, forming the upper limit of the mountain forest distribution. We utilized the timberline data from [18].
The vegetation cover resilience dataset was developed by referencing the MODIS MOD13A3 data spanning 2000 to 2020. It integrates annual NDVI values from nations along the “One Belt and One Road” initiative, undergoing a diagnostic process that assesses sensitivity and adaptability to produce a vegetation resilience index. The details are shown in Table 1. To ensure the relative accuracy of the results, we used ArcMap (10.2) to resample data with a resolution higher than 1 km by 1 km and re-output the data with a resolution lower than 1 km to a uniform resolution of 1 km using the kriging downscaling method [28].
Table 1.
Datasets and data sources.
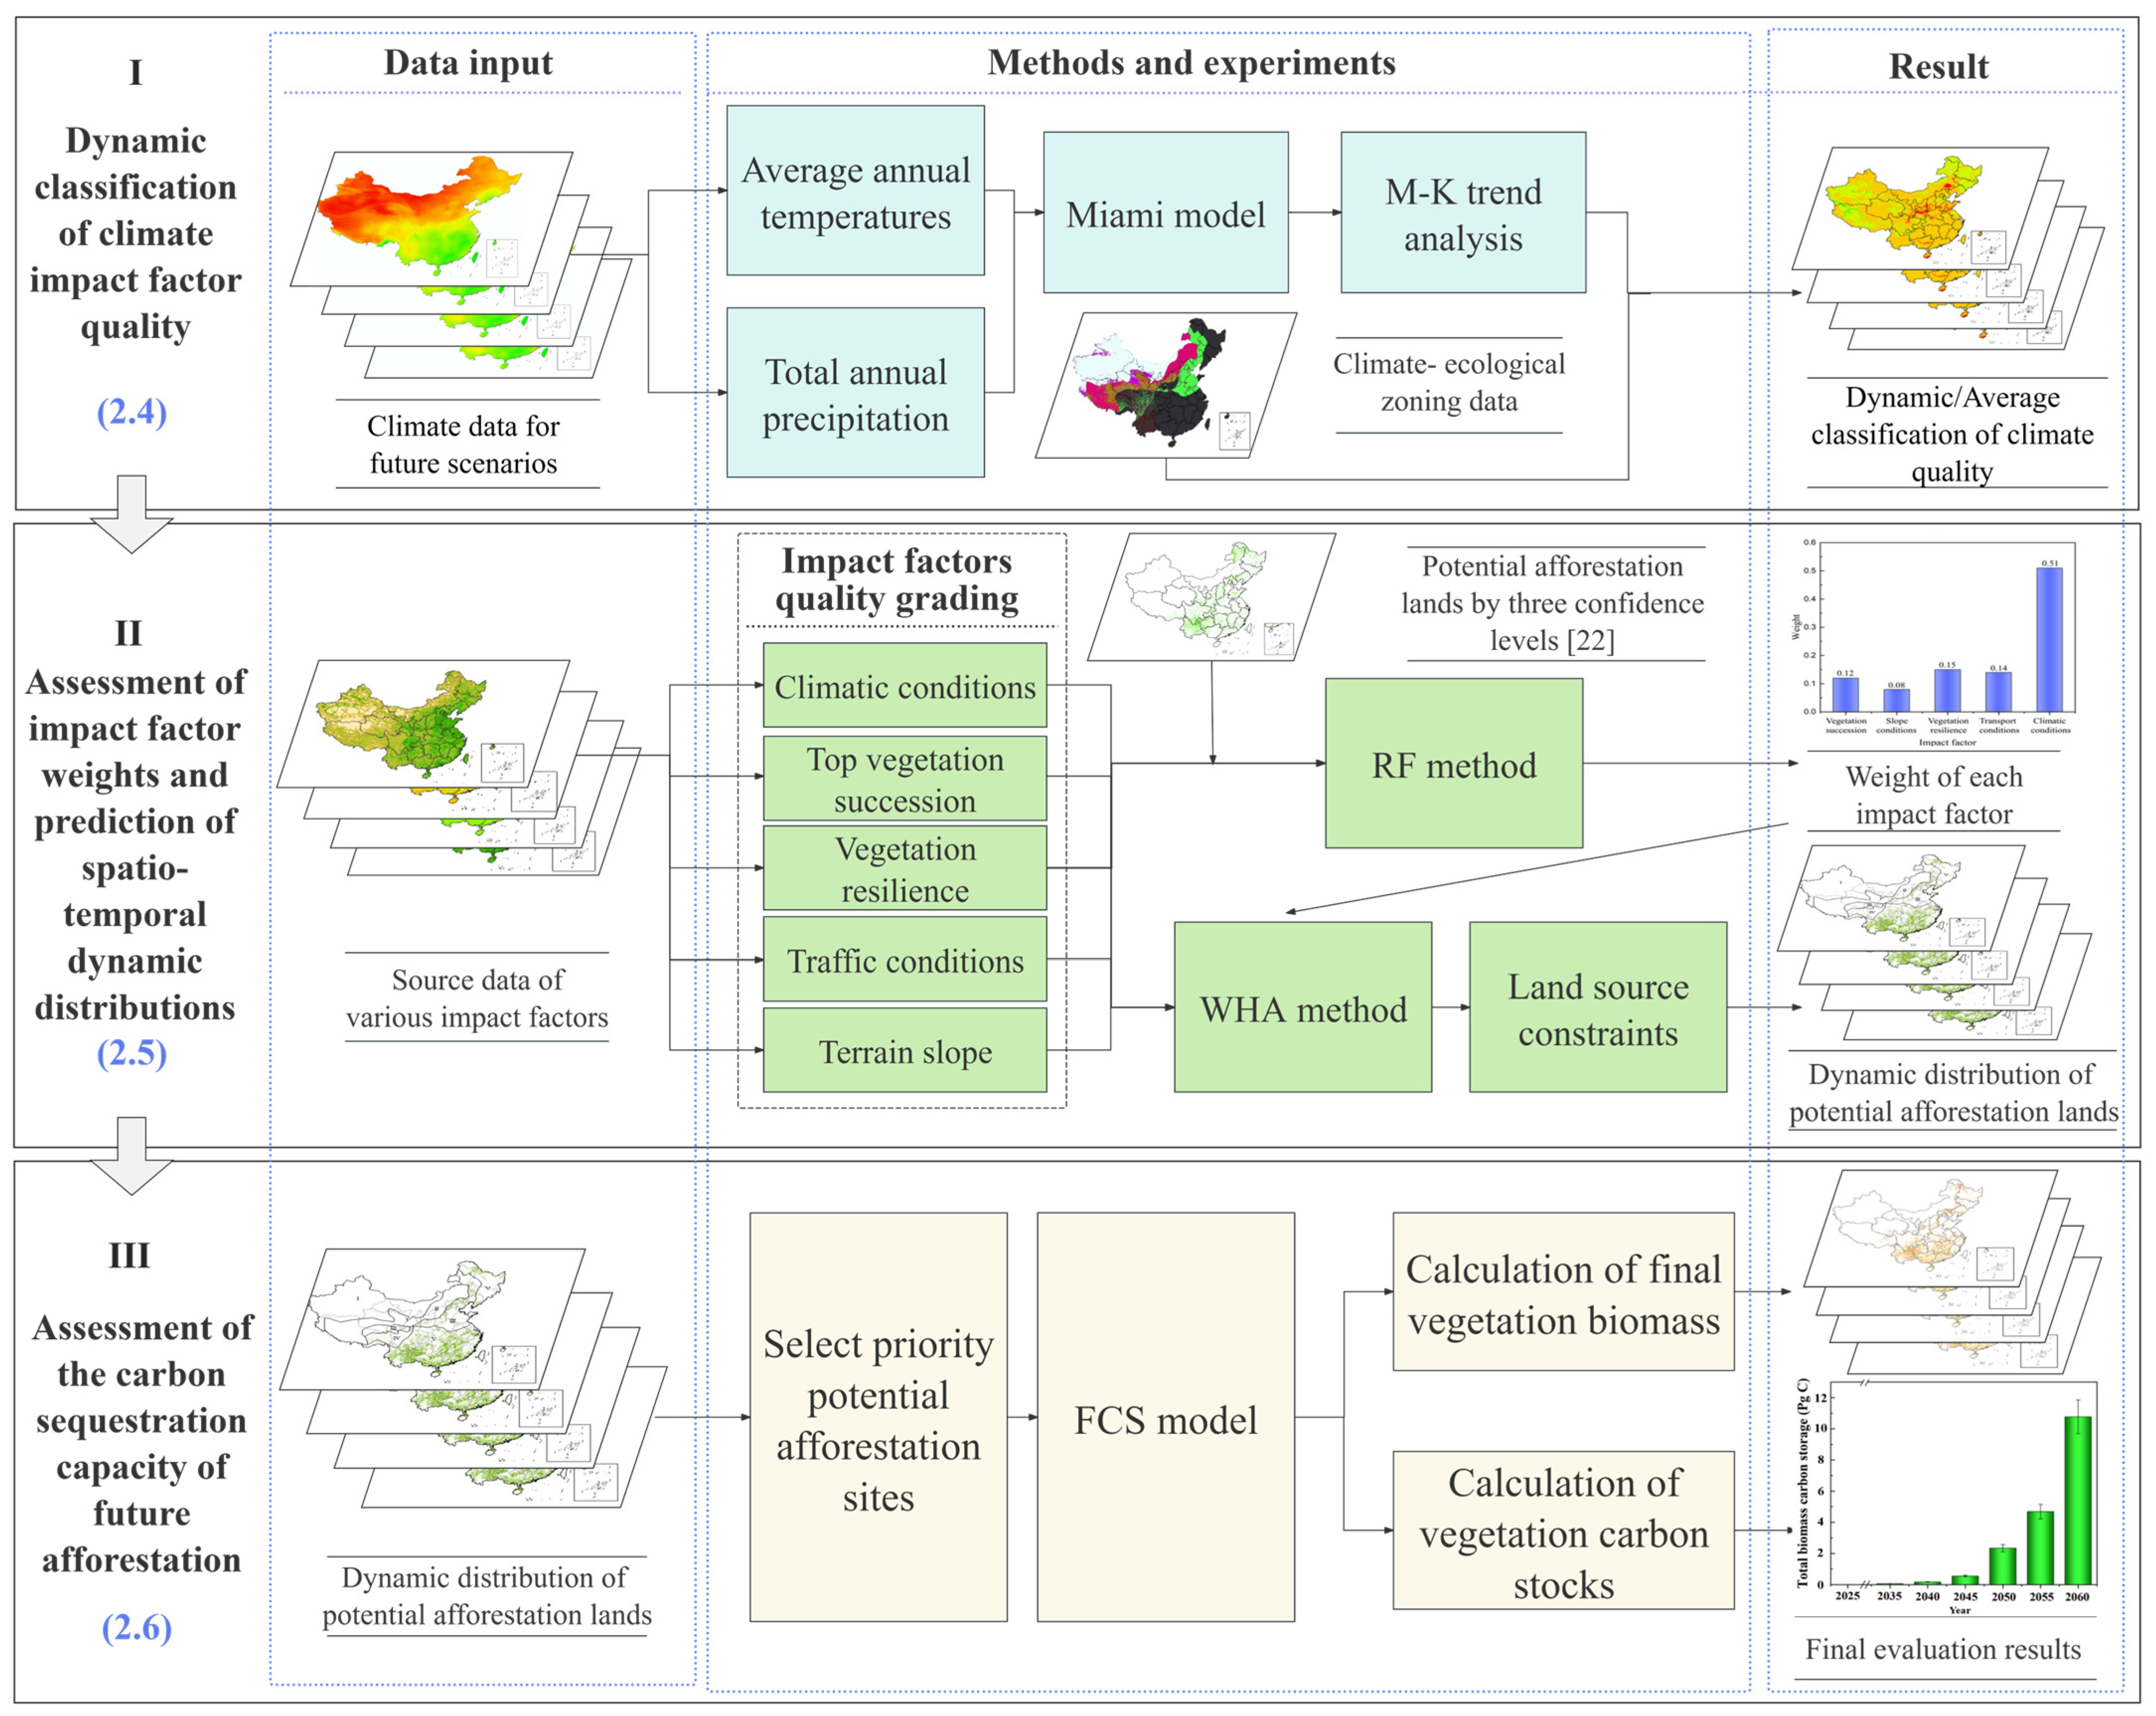
2.3. Summary of Technical Route
The technical process of this study consists of three parts: dynamic grading of the quality of climate impact factors, prediction of the dynamic distribution of high-quality potential afforestation lands, and assessment of the carbon sequestration capacity of future afforestation (Figure 1). Firstly, the Miami model was selected to calculate the climate production potential over these 40 years using future climate scenario datasets. Mann-Kendall non-parametric statistics were used to analyze the climate production potential 40-year average trend changes and 5-yearly specific trend changes. Using climate ecological zoning data, the average quality classification of climate impact factors over the 40 years from 2021 to 2060, as well as the dynamic quality classification every five years, were determined. Secondly, the weight of each quality classification factor was determined at three confidence levels using random forest (RF) machine learning algorithms for the potential afforestation lands. Subsequently, the “weight hierarchy approach” (WHA) was used to obtain the dynamic distribution maps of high-quality potential afforestation lands from 2021 to 2060. Thirdly, based on the distribution results of potential afforestation sites, an annual afforestation plan was formulated according to the progressive afforestation strategy, and the priority afforestation sites with the highest quality in each period were selected. We used the forest carbon sequestration (FCS) model to calculate the biomass of newly afforested vegetation in each 5-year period, and finally, the spatiotemporal evolution characteristics of vegetation biomass and carbon storage in newly afforested land over 40 years were evaluated.
Figure 1.
Technology roadmap.
2.4. Dynamic Classification of Climate Impact Factor Quality
Climate production potential, as a measure of the maximum productivity of vegetation under ideal meteorological conditions, provides a framework for analyzing the impact of climate change on vegetation growth [34]. We analyzed China’s eco-geographic zoning into five levels (with 5 being optimal productivity and 1 least). Humid, semi-humid, and arid areas were classified as 5, 2, and 1, respectively. Shady slopes and sunny slopes in semi-arid mountainous areas were designated as levels 4 and 3, respectively. The afforestation quality level of leeward slopes in the dry, hot river valleys of the southwestern Hengduan Mountains was reduced by two levels due to the impact of burning winds [18]. We assessed the year-by-year climate production potential of vegetation using the Miami model and analyzed the long-term trend of the climate production potential of vegetation in China between 2020 and 2060 using the Mann–Kendall non-parametric statistical method. On this basis, the quality level of climatic conditions will be raised by one level (to maximum level 5) for areas with a significant increase in vegetation production potential and lowered by one level accordingly for areas with a significant decrease in production potential (to a minimum level 1). The result was a quality grading map of climate impact factors (Figure 2a). The short-term trends within each five-year time period were calculated in the same way, and a qualitative grading of the dynamics of each time period was obtained.
Figure 2.
(a) Climatic conditions grading map. (b) Vegetation succession grading map. (c) Vegetation resilience grading map. (d) Topographic conditions grading map. (e) Transportation grading map. (f) Distribution of land sources derived from LUC data and timberline data (taking 2020 as an example).
The Miami model highlights temperature and moisture as key influencing factors for the growth and distribution of terrestrial vegetation [35,36]. The model determines the climate production potential by comparing the minimum of the light–temperature production potential and the precipitation production potential , providing a practical analytical tool for assessing the impact of climate on productivity. The core equations are as follows:
where ) and ) are functions of mean annual temperature and annual precipitation, respectively; is the mean annual temperature (°C); is the annual precipitation (mm); and 3000 is the value of a statistically derived parameter indicating the maximum dry matter production per unit of land area per year of natural vegetation.
The Mann–Kendall non-parametric statistical method is utilized to study trend changes in time series samples [37,38]. It has the benefits of reducing outlier interference, is not restricted to a set distribution, and is relatively easy to compute [39,40]. The main formula is as follows:
where is the cumulative variance of ; n is the total number of time series ; and is the number of equal data points in the first set. denotes a statistical series that follows a standard normal distribution, where its positive and negative values indicate increasing and decreasing trends, respectively; and when > 1.96, it indicates that it has passed a significance test with a 95% confidence level [39].
2.5. Predicting the Distribution Dynamics of High-Quality Potential Afforestation Lands
2.5.1. Classification of Factors Influencing Vegetation Succession
Community succession is a key process of plant community turnover in ecosystems and is critical for afforestation selection and ecological balance [40]. In afforestation practices, the top vegetation types of the region and their successional trends need to be considered in an integrated manner. In this study, we identified the natural top vegetation types in each region of China based on the descriptions in Vegetation of China [41] and Forests of China [42] and identified the dominant plants using a 1:1,000,000 vegetation map [33], which classified China’s top vegetation into 16 types, including forests, grasslands, shrubs, and deserts (Table A1).
The geographic distribution of top vegetation ecological niches has been predicted using climate data [40], describing the transformational response of transition zone plant communities due to extreme climate change [43]. Then, the random forest approach in machine learning [44] was utilized to predict the geographic distribution of climate ecological niches of the 16 vegetation types under current and future climate scenarios (Figure A1 and Figure A2). Based on these results, we further predicted the evolutionary trend of the top vegetation in each region in the coming decades and analyzed the succession of these vegetation types by classifying them into four major categories: forest, scrub, grassland, and desert (Table A1).
We classified the vegetation succession impact factor into five grades according to the direction and intensity of succession, where grades 1 to 5 indicate a gradual increase in quality, and areas with no succession occurring were designated as grade 3. Areas with positive succession toward forests were increased by one grade from grade 3, while areas with negative succession toward deserts were reduced by one grade accordingly. The detailed classification results are shown in Table A2. A quality grading map of vegetation succession impact factors was finally obtained (Figure 2b).
2.5.2. Quality Grading of Vegetation Resilience Impact Factors
In the field of afforestation, the resilience of vegetation, i.e., the ability of an ecosystem to recover from a disturbance, is a key indicator of afforestation success [45]. Therefore, a comprehensive assessment and quantification of the resilience of vegetation cover in each area is essential in order to prioritize the selection of areas with high resilience for afforestation. This strategy not only improves afforestation success but also optimizes resource allocation and avoids unnecessary waste of human and financial resources [46]. Currently, there are various methods for assessing vegetation resilience, mainly based on MODIS data products [46,47,48,49,50], such as the enhanced vegetation index (EVI), normalized difference vegetation index (NDVI), gross primary production (GPP), and leaf area index (LAI). Each of these data products has its own advantages and limitations. In this study, a data product of vegetation resilience with high credibility in China was screened through literature analysis, which generated a product of vegetation resilience levels by comprehensively assessing annual changes in vegetation through sensitivity and adaptive analysis [51]. After data processing, vegetation resilience was categorized into five levels, from low to high (Figure 2c).
2.5.3. Quality Grading of Other Impact Factors
Referring to the study by Xu [18], we assessed the quality of potential afforestation areas by quantifying three limiting factors that indirectly affect vegetation growth, namely topography, transportation, and climatic conditions. In terms of topography, grassland below the timberline and cropland with a slope higher than 25° were extracted based on future LULC data (Figure 2f), and the topographic conditions were divided into five levels according to the slope. The slope of 0–25° was the most suitable level for afforestation, which was set as level 5. The higher the slope, the lower the suitability (Figure 2d). The assessment of transportation conditions takes into account the impact of the distance to reach the nearest road on afforestation costs and subsequent manual care. Based on DEM data and OpenStreetMap road data, spatial analysis methods were used to calculate the distance to the nearest road, and the quantile method was used for classification. Among them, 0–1 km is level 5, indicating the most accessible area for afforestation, while level 1 is where path distance exceeds 10 km, indicating inaccessibility (Figure 2e). Climatic conditions were classified using the classification results derived in Section 2.4.
2.5.4. Calculation of Impact Weights for Each Factor
In the process of determining the weight of each factor, we first randomly sampled 10,000 sampling points based on the high-precision potential afforestation dataset for 2060 predicted by Xu et al. [22] using one dataset and two different methods: World Resource Center potential afforestation map, random forest model, and global vegetation model OCHIDEE. This dataset has been proven to be highly accurate. Based on the different confidence levels of the dataset, the afforestation levels of these sampling points were determined as target variables. Then, using the “Extract Values to Points” function of ArcMap (vision 10.2), the levels of the five influencing factors described in the previous section were extracted as feature variables. These target variables and feature variable data were trained and learned using the random forest model in machine learning [52]. The default parameter values of the random forest algorithm were used in the R caret package, and finally, the weights of the five factors on the afforestation quality level were determined.
2.5.5. Prediction of Potential Afforestation Land Distribution Based on a WHA
Based on the weight values of the above five factors and the quality level results of each factor, a “weight hierarchy approach” (WHA) was used to calculate the afforestation quality index of the grassland below the timberline and cropland with a slope higher than 25° (the potential afforestation lands) across the various regions in China [18]. The results were divided into five levels according to the natural break point method, corresponding to the five afforestation quality levels from low to high. The distribution area with the highest afforestation quality is limited by land availability to determine potential afforestation areas. Next, the annual afforestation impact factor levels for the 40 years from 2021 to 2060 were used to calculate the afforestation quality index of each region. These results were then adjusted based on future annual land use data to derive the distribution pattern of potential afforestation lands. Finally, the dynamic changes of the afforestation index in each region from 2021 to 2060 were projected over five-year intervals. The formula of WHA is as follows:
where denotes the afforestation quality index; denotes the quality level of the factor; denotes the characteristic weights of the factor.
After obtaining the afforestation quality indices for each region at different time periods, the areas with the highest afforestation quality (afforestation index greater than 4) were selected as high-quality potential afforestation sites and used as candidate areas for implementing afforestation planning. At present, China’s stated forest area milestones increase linearly over time, reflecting a gradual afforestation strategy with a fixed afforestation rate of 1.8 Mha per year [22]. Therefore, in this study, afforestation sites were selected with a total afforestation rate of 1.8 Mha per year in the determined high-quality potential afforestation areas, that is, afforestation plans were prioritized in areas with high afforestation quality indexes. The detailed site selection is shown in Figure A3.
2.6. Predicting the Dynamics of Future Afforestation Carbon Stocks in China under the Progressive Afforestation Strategy
2.6.1. Forest Vegetation Biomass Estimation Models
As the forest grows and develops, the forest biomass will progress towards a relatively stable state. The FCS model employs a logistic growth curve to establish the relationship between forest age and biomass and utilizes the double-pool theory to estimate soil carbon storage [53,54]. This model has been widely used to calculate forest vegetation carbon storage [27,53]. Cai et al. [27] constructed the model using carbon density data and forest age information from over 3300 forest samples and incorporated factors such as temperature, precipitation, and decomposition rates. The model was validated using data from 78 forest succession series in China. The results demonstrated that the FCS model can better simulate the spatial distribution pattern of carbon storage in China’s forest vegetation. The formula for the change of vegetation biomass with stand age can be simply defined as:
where is the biomass of forest vegetation (Mg ha−1); is the intrinsic growth rate, which represents the maximum growth rate when vegetative growth is not limited by the environment, nutrients, or disturbances; is the maximum vegetation biomass (Mg ha−1) in the mature forest scenario; and represents the fraction of the current biomass deficit relative to its saturation; and is the forest age (in years).
Next, the formula can be further expressed as:
where represents the initial vegetation biomass and, in this study, it was assumed that the afforestation biomass density in the first year was 0.1 t C ha−1 and was the first year of planting [27]. The vegetation biomass in mature forests is calculated using mean annual temperature (MAT) and mean annual precipitation (MAP):
where is the maximum vegetation biomass (Mg ha−1), MAT is the mean annual temperature (°C), and MAP is the mean annual precipitation (mm). is the intrinsic growth rate, which represents the maximum growth rate when vegetation growth is not limited by the environment and nutrients. In this paper, we chose a modified formula, shown to have higher accuracy, to calculate the intrinsic growth rate [55], which is as follows:
The future climate dataset, including annual precipitation (MAP, mm) and mean annual temperature (MAT, °C), were simulated by the EC-Earth3 climate model under the SSP245 scenario and are available at the National Tibetan Plateau Science Data Centre (https://data.tpdc.ac.cn/home) (accessed on 17 May 2024). The SSP245 scenario is a ‘middle of the road’ scenario, where socio-economic factors follow their historical trends without significant changes, and is more reasonable than the most optimistic SSP119 scenario and the most pessimistic SSP585 scenario.
2.6.2. Statistical Analysis
Based on the annual afforestation plan and future climate scenario dataset, the “Extract Multi Values to Points” function in ArcMap (10.2) was used to obtain the future annual climate data of each afforestation sampling point. The annual vegetation biomass of each afforestation point was calculated according to the vegetation biomass calculation formula (Equation (10)). Then, the vegetation carbon density was calculated using the conversion coefficient, which was set to 0.5 to convert vegetation biomass into vegetation carbon density [56,57].
In order to analyze the future carbon storage and carbon sequestration rate of afforestation, Equation (13) was used to calculate the total annual afforestation carbon sequestration, and Equation (14) was then used to calculate the vegetation carbon sequestration rate; the expressions are as follows:
where represents carbon storage, represents the carbon density corresponding to the pixel, represents the pixel size, represents the carbon sequestration rate, represents the eight 5-year time periods, and represents the change in carbon density within the time period.
3. Results
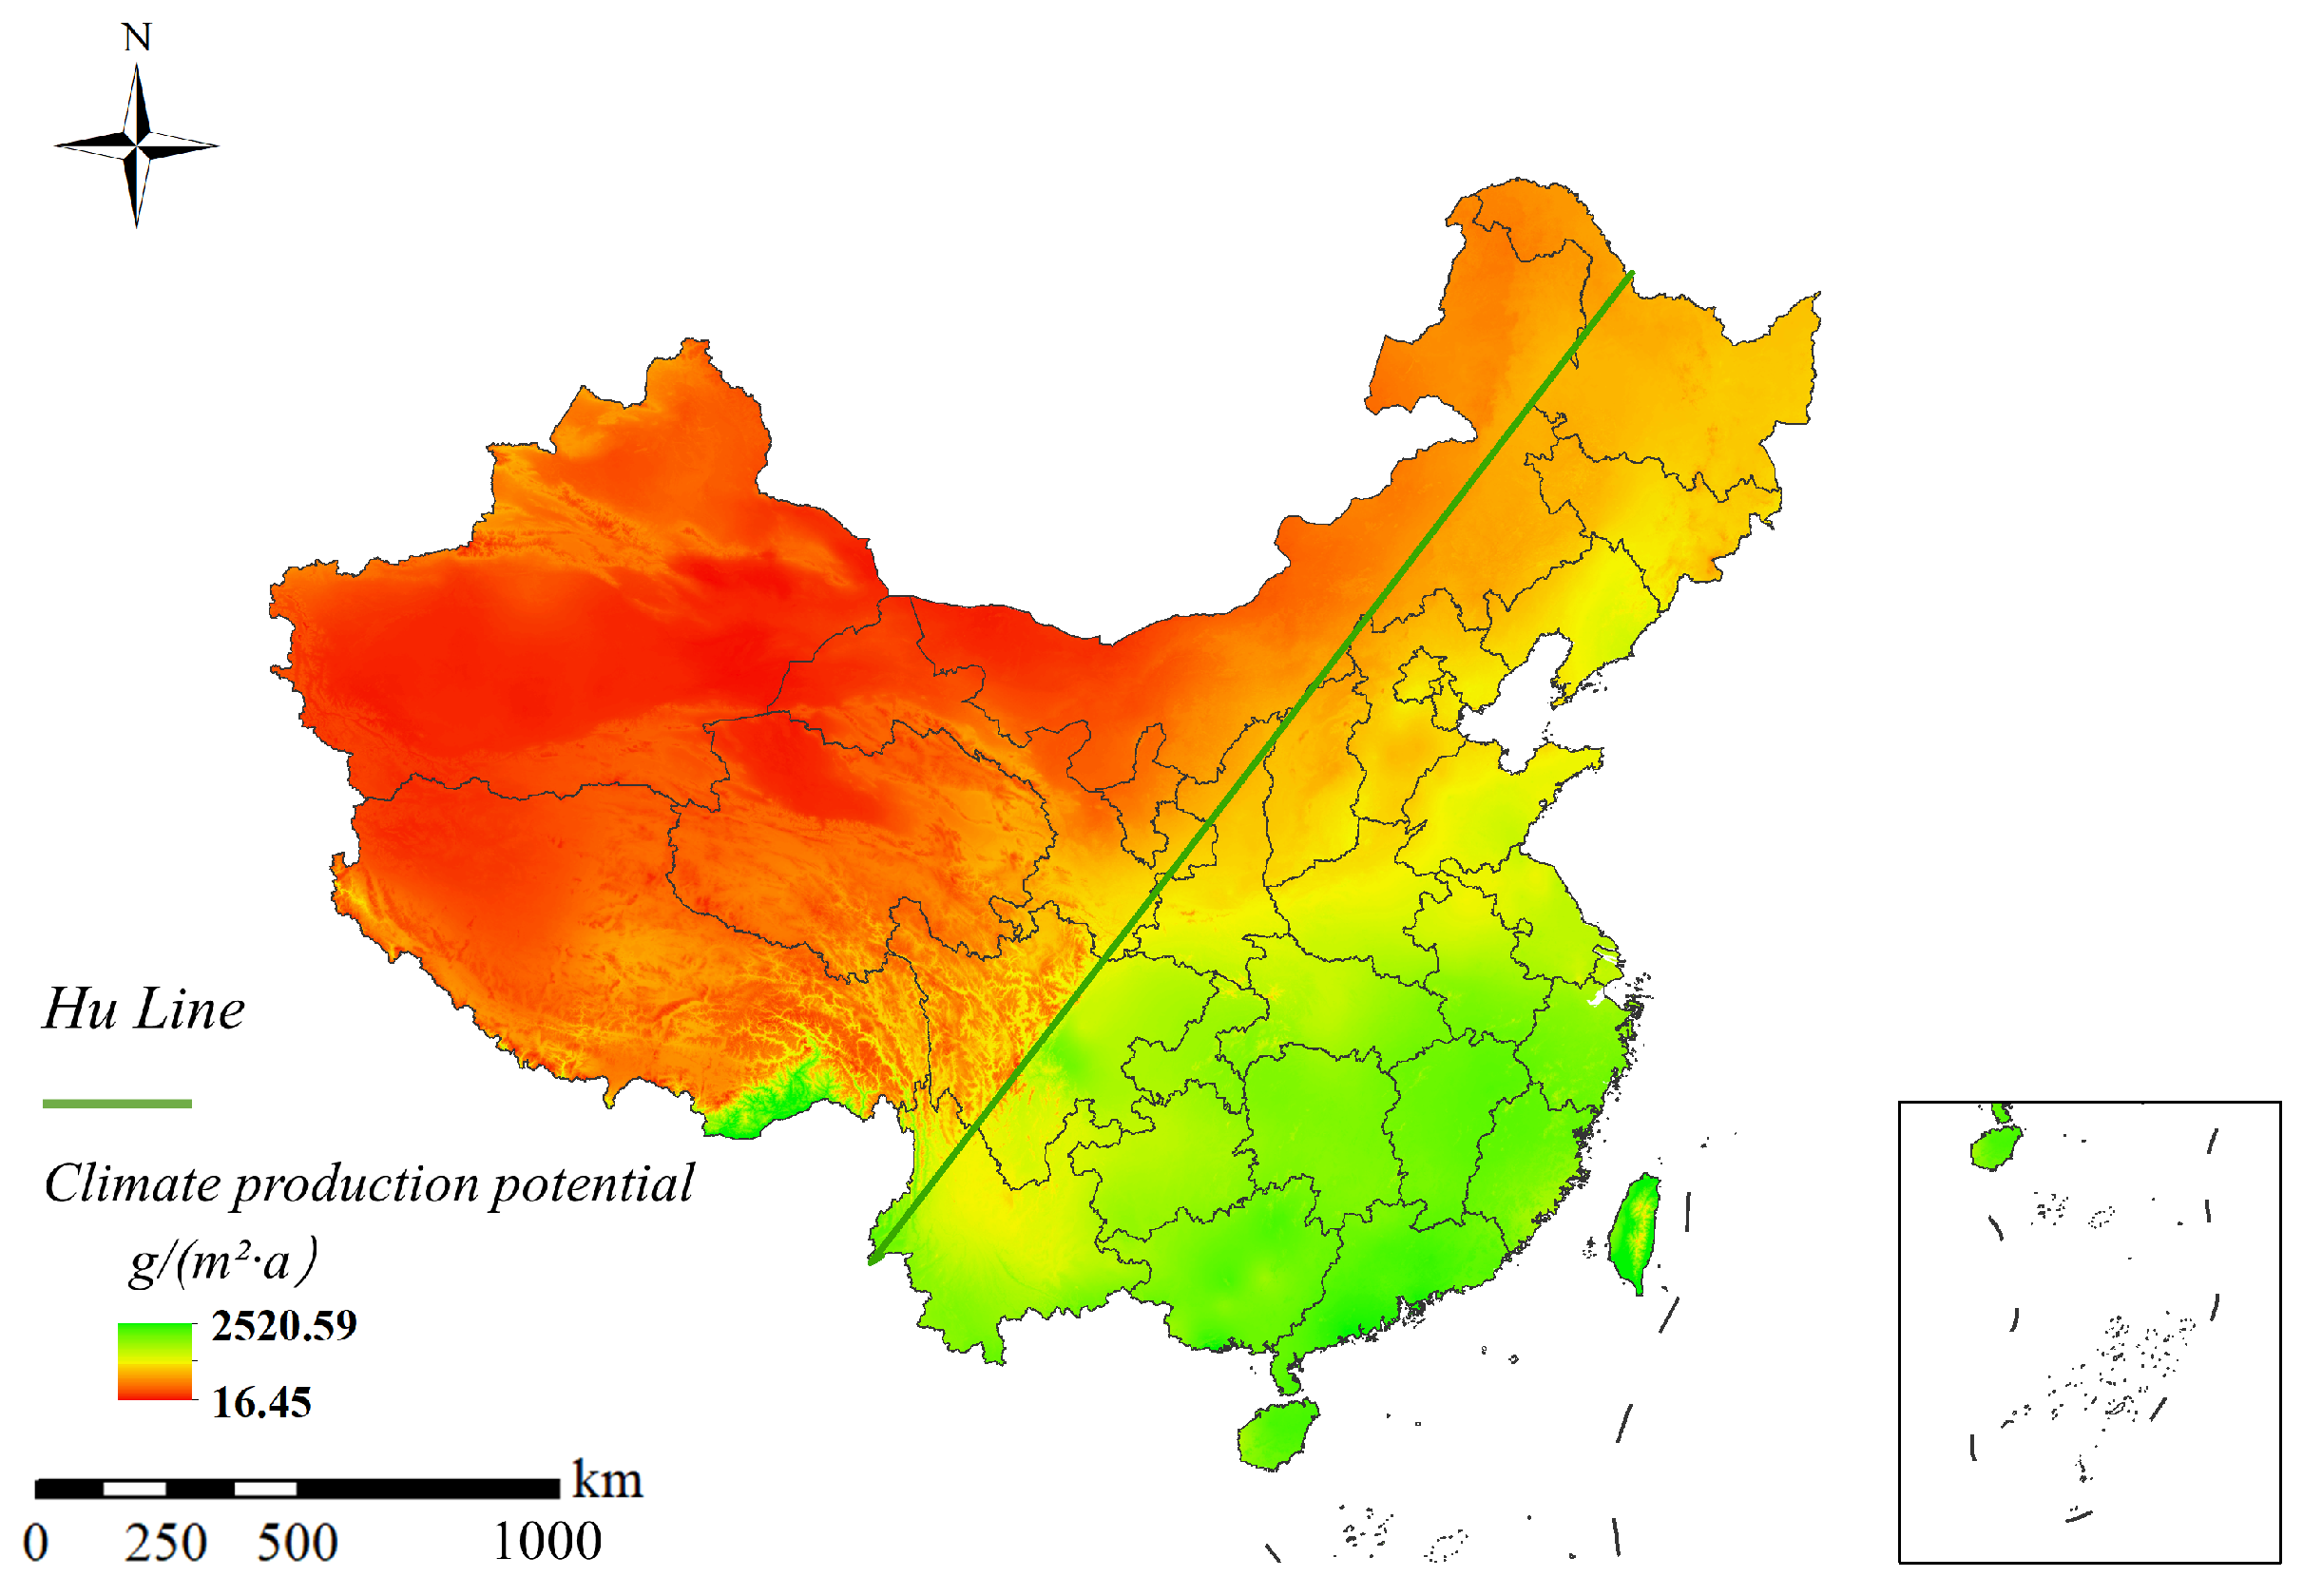
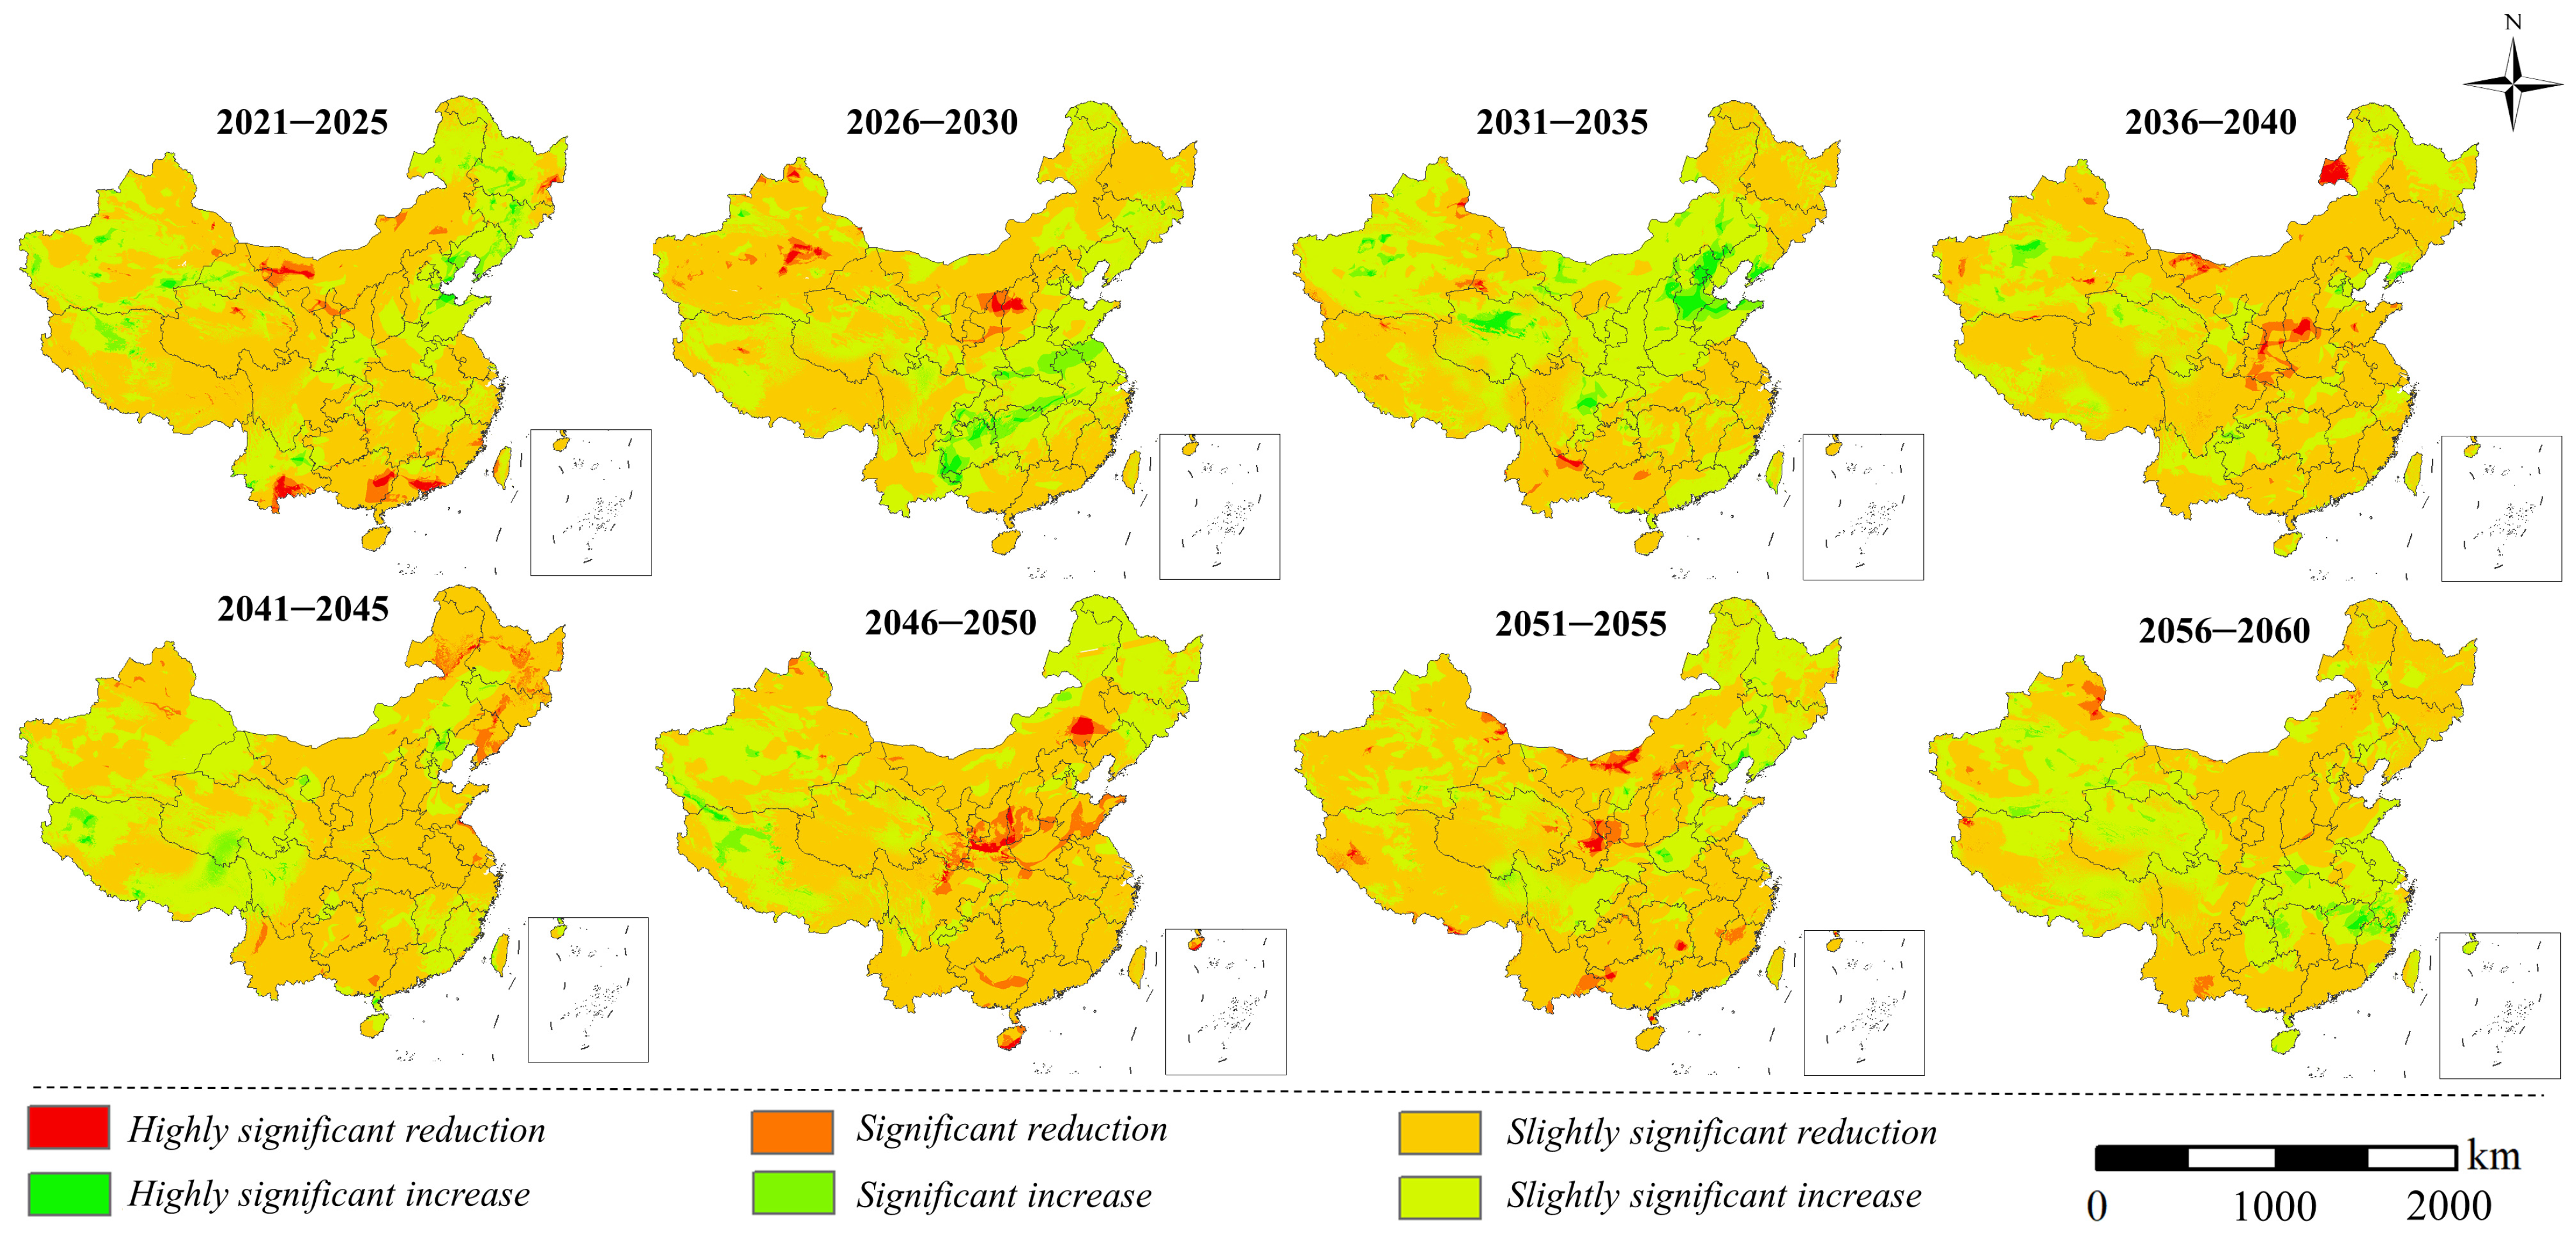
3.1. Climate Production Potential and Changing Trends from 2021 to 2060
The average level of national climate production potential in these 40 years is divided by the Hu Line (Heihe-Tengchong Line), with a general distribution trend showing higher levels in the southeast and lower levels in the northwest. The climate production potential values in most areas of the southeastern coastal provinces reach 2000 g/(m2·a). Although the climate production potential value in the northwest is relatively low, its area is large, and therefore, the amount of climate production potential cannot be ignored. It is worth noting that the Linzhi area in southeastern Tibet, although it is located west of the Hu Line, has a high climate production potential value (Figure 3). Additionally, the changes in climate production potential exhibit regional clustering. Areas with more drastic changes are generally located in the center, while areas with gradual changes are found at the periphery. For example, from 2021 to 2025, the climatic productivity of Yunnan, Guangxi, and southern Guangdong is predicted to decline to varying degrees, with a highly significant decline in the central areas and a slightly significant decline in the peripheral areas. From 2031 to 2035, the climatic productivity of Hebei Province shows an increasing trend, with a highly significant increase in the central areas and a slightly significant increase in the peripheral areas. The trends of climate production potential changes vary significantly across different regions and periods. The predicted climate production potential in southern regions such as Guizhou and Chongqing increased significantly from 2026 to 2030, while the climate production potential of Jiangsu–Zhejiang–Shanghai increased significantly from 2056 to 2060. In the northern regions, the climate production potential in the Beijing–Tianjin–Hebei and Qinghai regions increased significantly from 2031 to 2035. However, during the periods 2036–2040 and 2046–2050, the climate production potential of Shaanxi, Shanxi, Gansu, and other regions along the Yellow River decreased significantly. Most of the other regions had slightly significant trends. In general, under the high-emission scenario of SSP245, China’s climate production potential in these 40 years will show a downward trend, with the relatively worst climate condition period in 2046–2055 (Figure 4).
Figure 3.
Characteristics of the national average climate productivity distribution from 2021 to 2060.
Figure 4.
Distribution of the dynamics of climate productivity change by 5-year time period from 2021 to 2060.
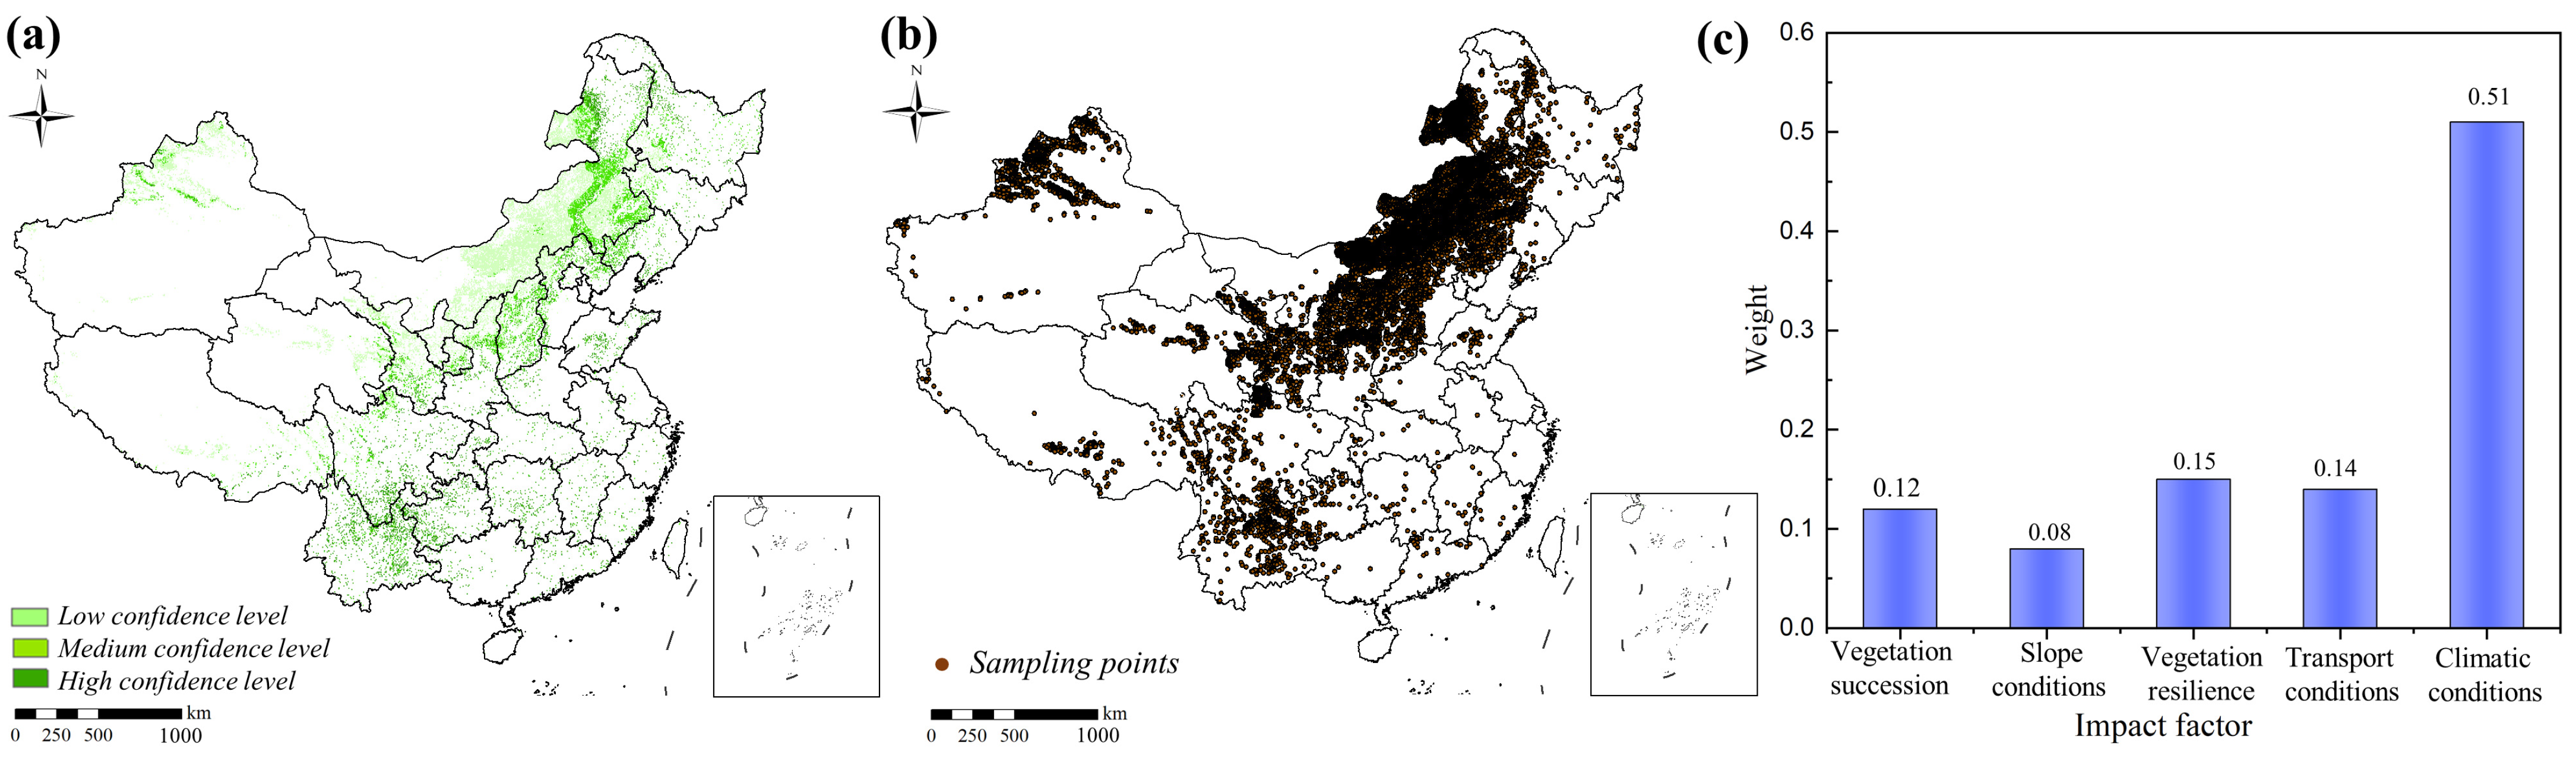
3.2. Factor Impact Weights
Using Xu et al.’s [22] potential afforestation dataset by 2060 with high, medium, and low confidence levels and restricting the source of afforestation land (Figure 5a), 10,000 sampling points in the potential afforestation land dataset by 2060 were randomly selected to determine the weights of each factor (Figure 5b). The five types of selected influencing factors were entered into the random forest model for factor importance analysis. After standardizing the data, the influence weights of each factor on the potential afforestation lands were determined. The results showed that the climate condition factor had the highest weighting, which was 0.51, and the slope condition factor had the lowest weighting, which was 0.08. The weights of the remaining factors of vegetation resilience, traffic condition, and vegetation succession were also of lower weighting than climate conditions with weight values of 0.15, 0.14, and 0.12, respectively (Figure 5c). This study determined the relative weight values of the selected factors rather than the absolute weight values. The weight analysis showed that the climate condition factor had a greater impact on the distribution of potential afforestation lands, reflecting the importance of dynamic assessment of afforestation areas based on future climate changes, and could further improve the estimation results of vegetation biomass and carbon storage in newly afforested land.
Figure 5.
(a) Distribution of potential afforestation sites with different levels of confidence from Xu et al. [22]. (b) Distribution map of the 10,000 selected sampling points. (c) Histogram of the weights of the impact factors.
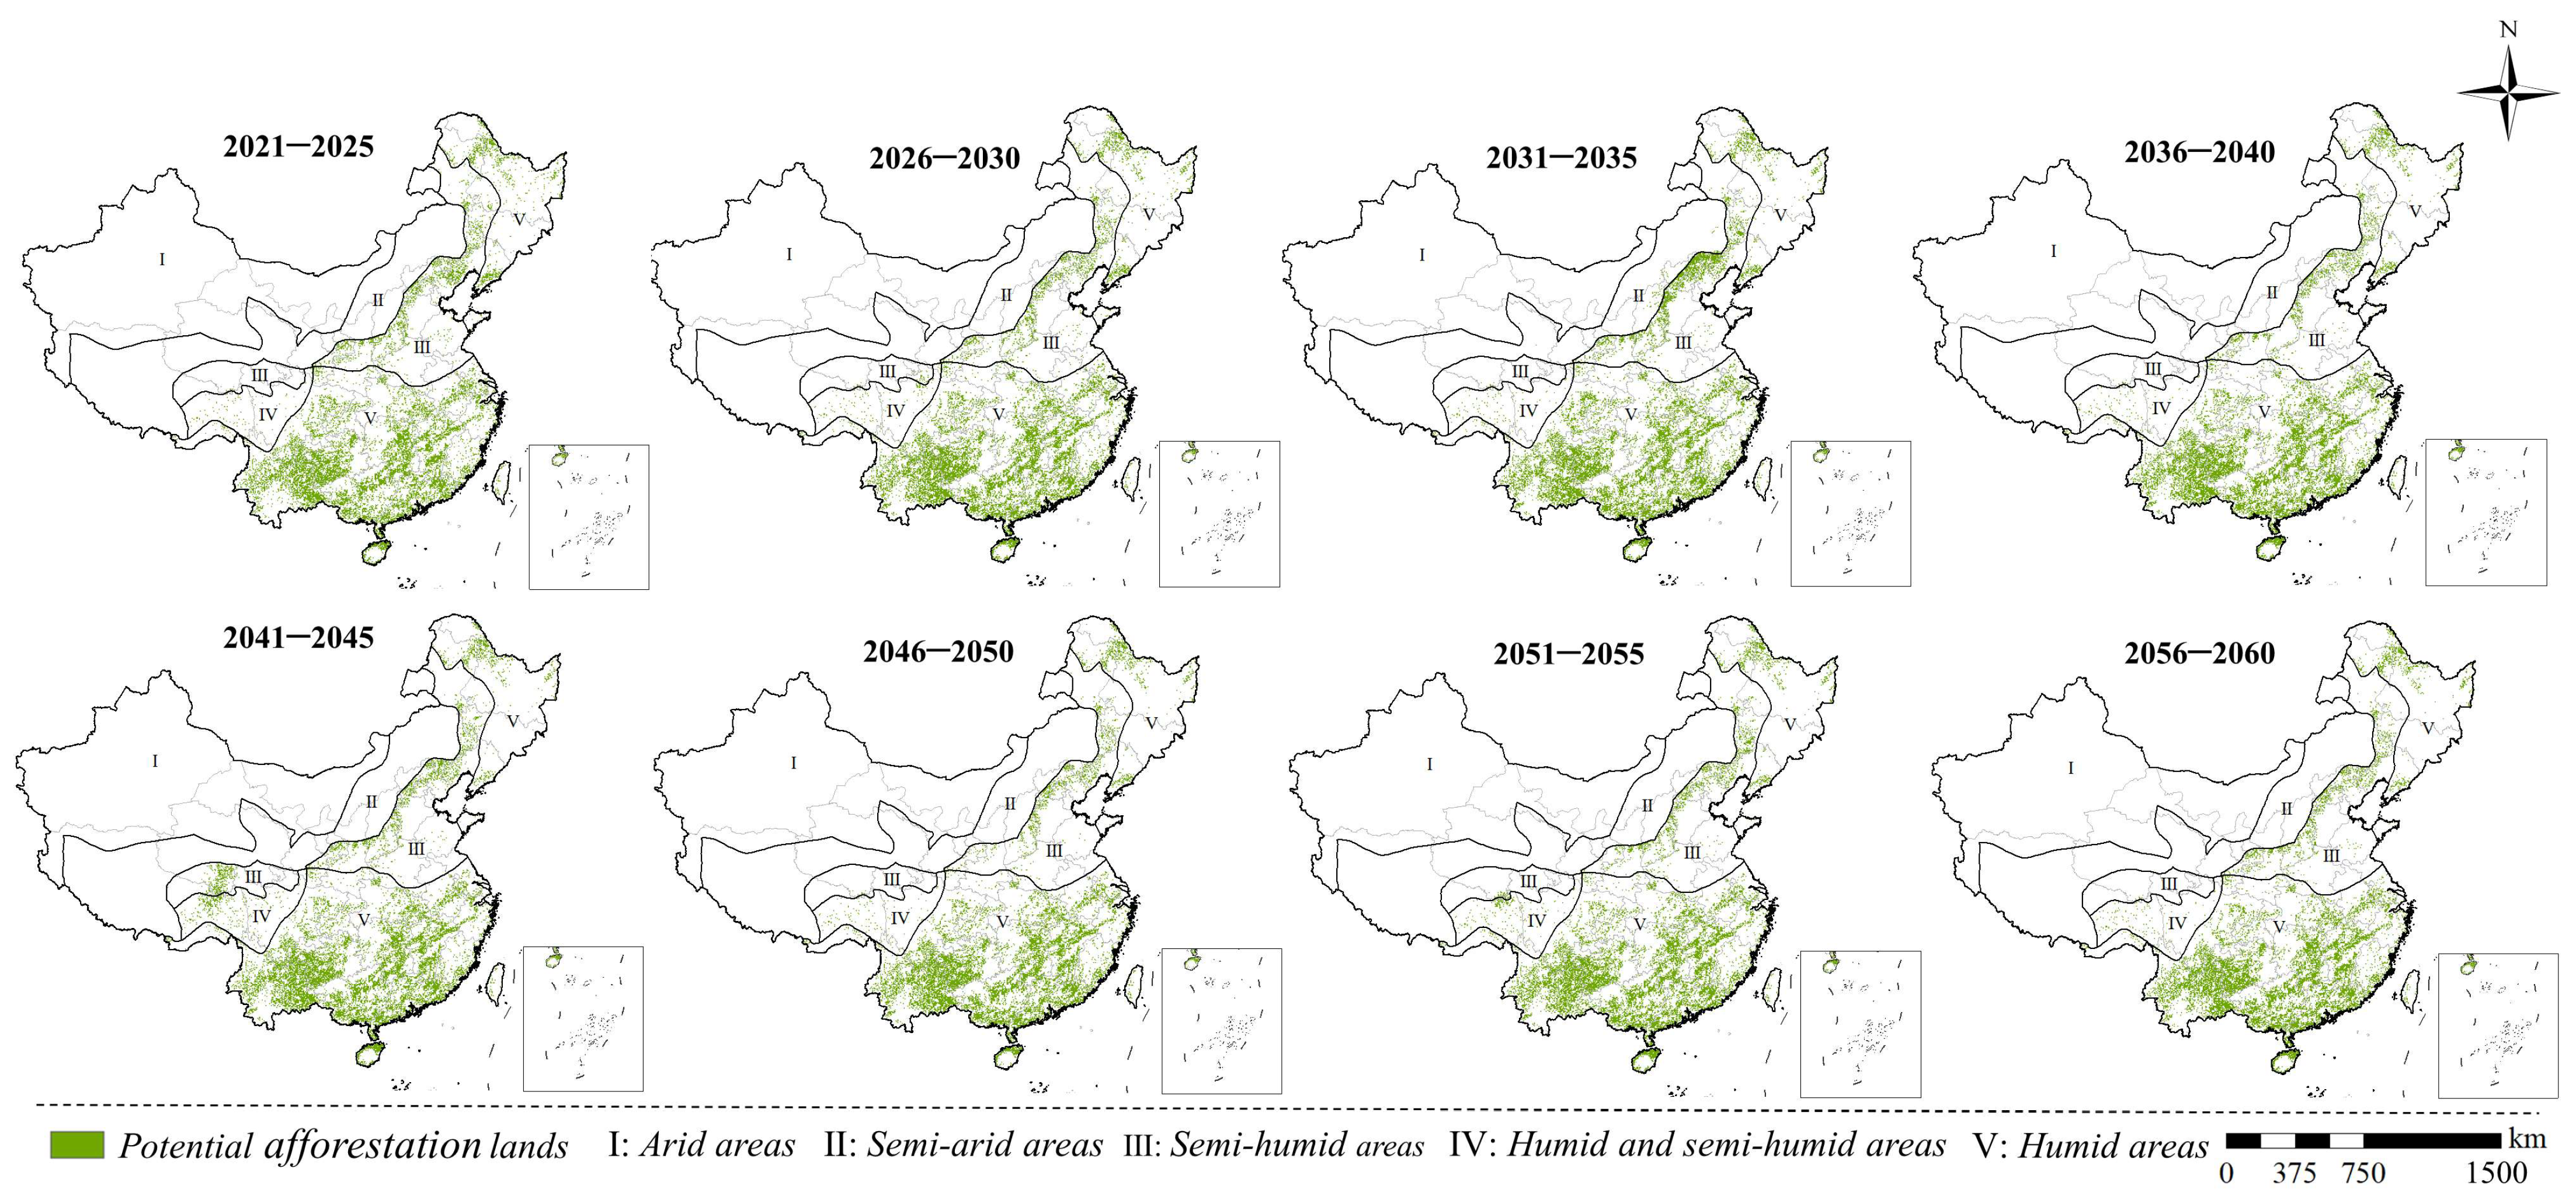
3.3. Dynamic Distribution Patterns of Potential Afforestation Land
The high-quality potential afforestation sites obtained by the WHA were selected as candidate areas for potential afforestation areas in this study. The dynamic distribution map of potential afforestation land shows that from 2021 to 2060, the overall distribution trend is relatively stable, and it is distributed in a “belt-like” manner along the Hu Line. In the north, it is concentrated in the northwest of Heilongjiang Province, the border between Shanxi and Hebei, and the border between Hebei and Inner Mongolia. In the south, it is concentrated in the southern part of Sichuan and the Yunnan–Guizhou Plateau in the northeast of Yunnan. Other regions had fragmented distribution patterns. However, there were significant temporal differences regionally. For example, between 2041 and 2055, there was a small amount of potential afforestation land at the border between Tibet and Sichuan. Additionally, from 2041 to 2060, the distribution area of potential afforestation lands along both sides of the Hu Line in the northern region had a decreasing trend compared with previous years (Figure 6). There is a certain amount of potential afforestation land distributed in some savannas in the southeast region. Most of the savannas in these areas evolved from rain-fed farmland according to future climate scenario data [29]. Related research has shown that appropriate afforestation can be carried out in savannas [58], so we have included them as potential afforestation sites. The distribution trend of potential afforestation lands in each eco-geographical zone was similar in the eight different time periods, and its distribution is generally located in humid areas and humid and semi-humid areas. Among them, the humid zone has the largest area, occupying more than 6 Mha across all time periods, accounting for about 85% of the total area of potential afforestation, while the arid zone accounts for only 0.3% on average. The distribution area of potential afforestation lands in humid areas and humid and semi-humid areas peaked during 2031–2035 (Figure 6 and Table A3).
Figure 6.
Dynamic distribution map of potential afforestation lands over 40 years in different eco-geographical zones.
Over the 40 years from 2021 to 2060, the average area for afforestation in China was estimated to be 75 Mha. In the north, the provinces with the most potential afforestation areas are Heilongjiang and Inner Mongolia, each exceeding 20,000 km2 in each 5-year period. In the south, the provinces with the most potential afforestation areas are Yunnan, Guangxi, Guizhou, Hunan, and Sichuan, with Yunnan having the largest potential afforestation area, exceeding 100,000 km2 in each period. Due to the restrictions on land area and urban development, the potential afforestation areas in provinces such as Beijing, Tianjin, and Shanghai are relatively small compared with other regions (Table 2). In general, most provinces have a peak potential afforestation area during 2031–2035, although the valley value is in the period of 2040–2050. According to the provincial data, the potential afforestation areas in Heilongjiang, Jilin, Liaoning, Hebei, and Gansu had a decreasing trend throughout, while other regions had fluctuating trends.
Table 2.
Modeled dynamic change in potential afforestation land in various provinces of China between 2021 and 2060.
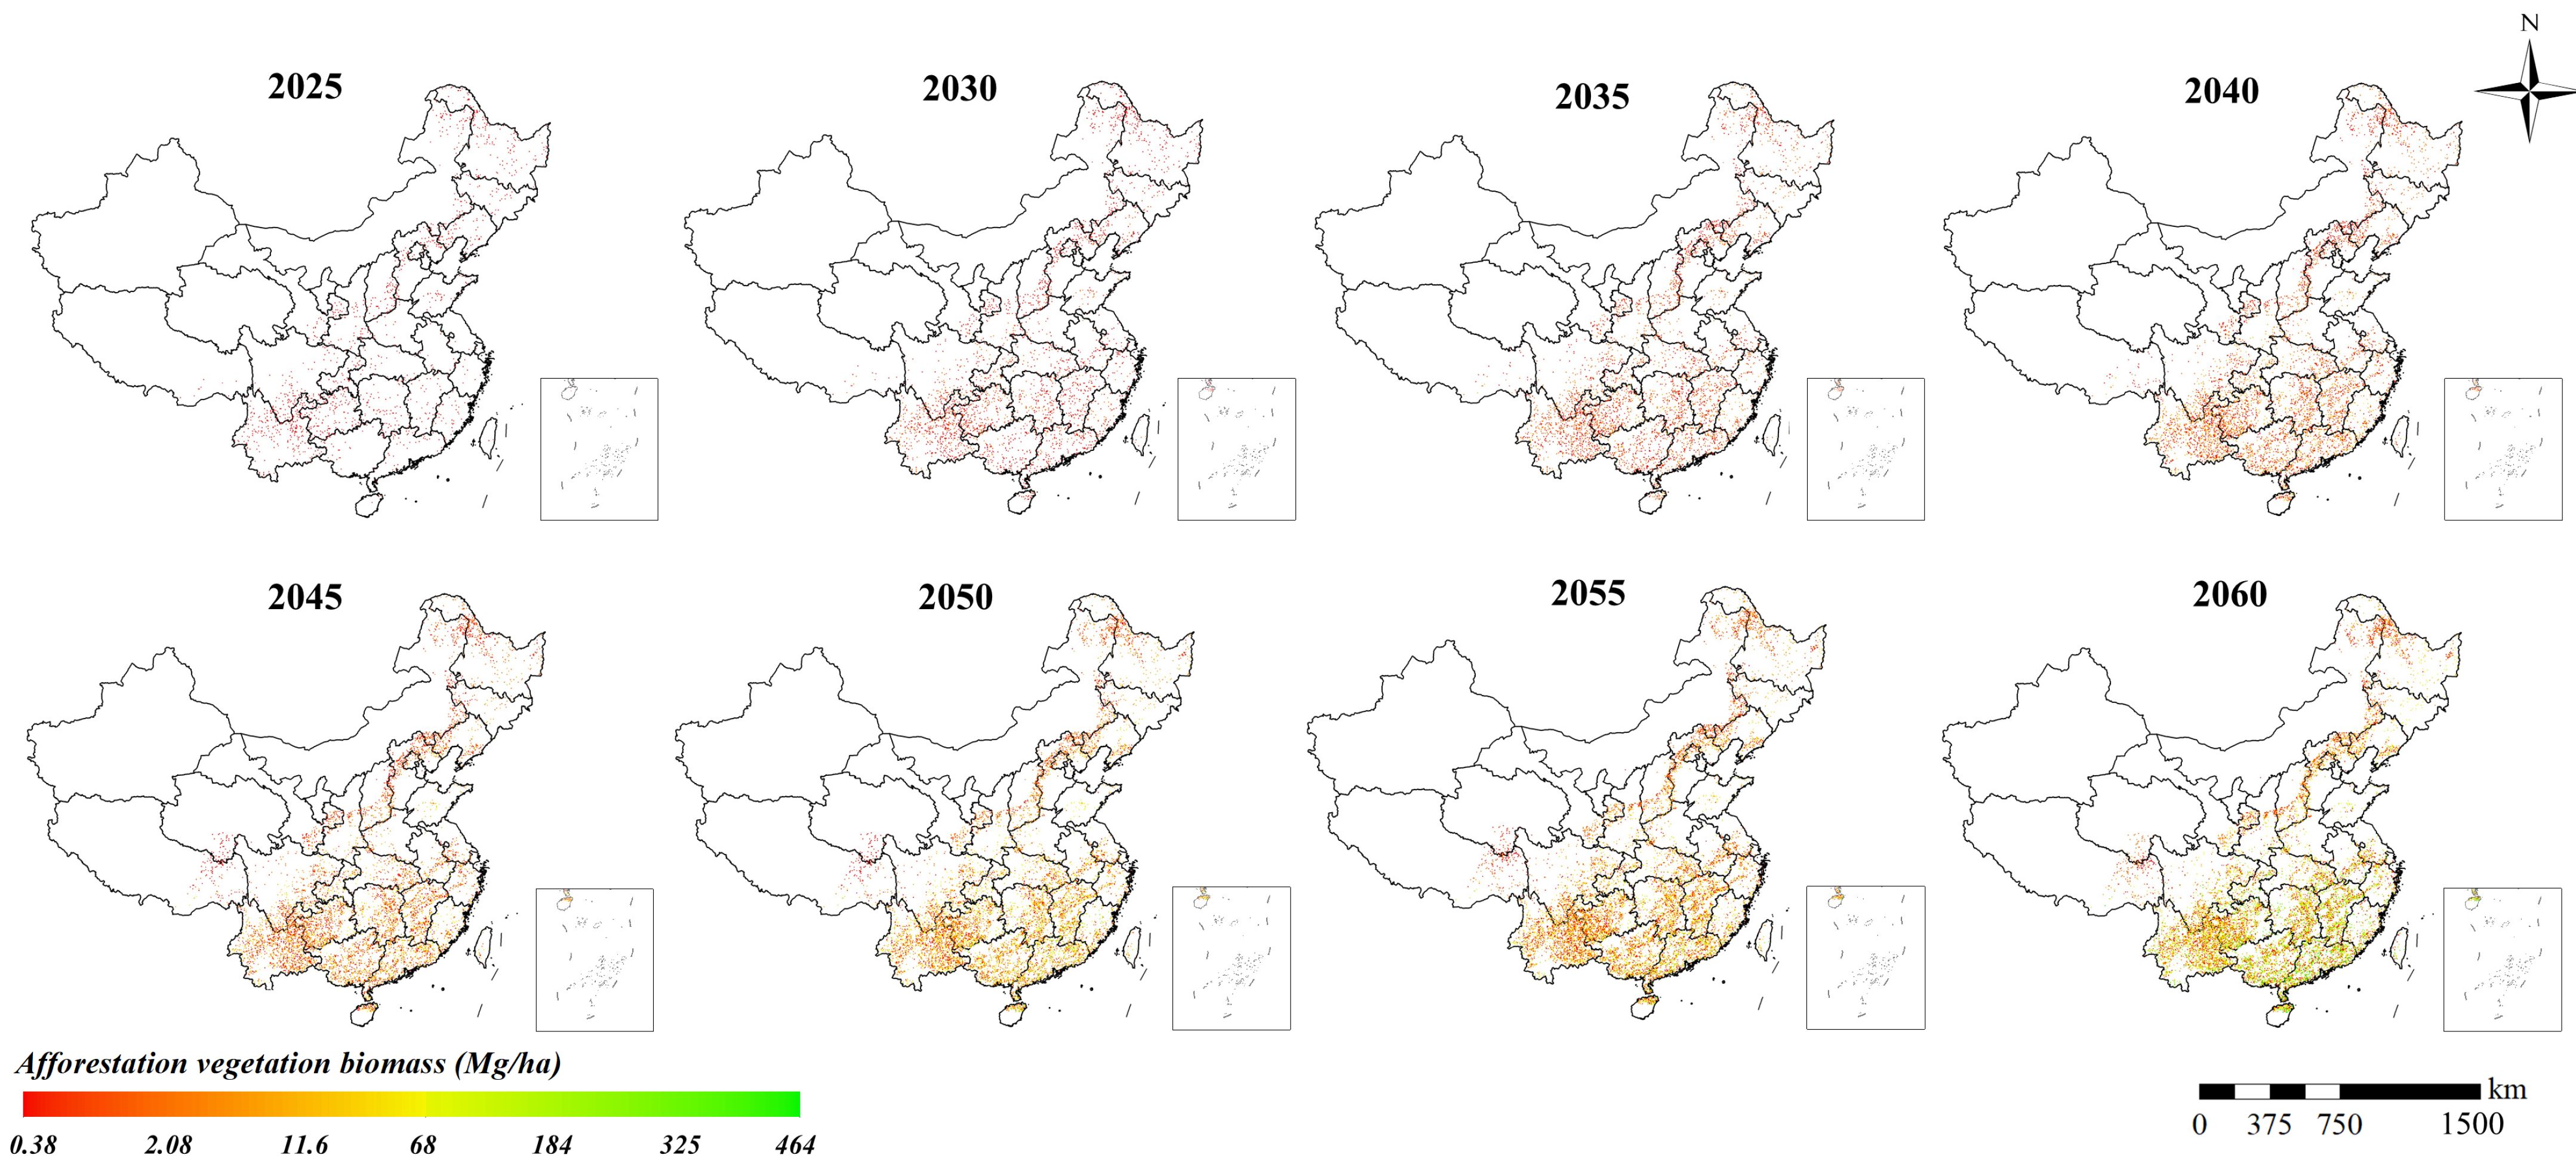
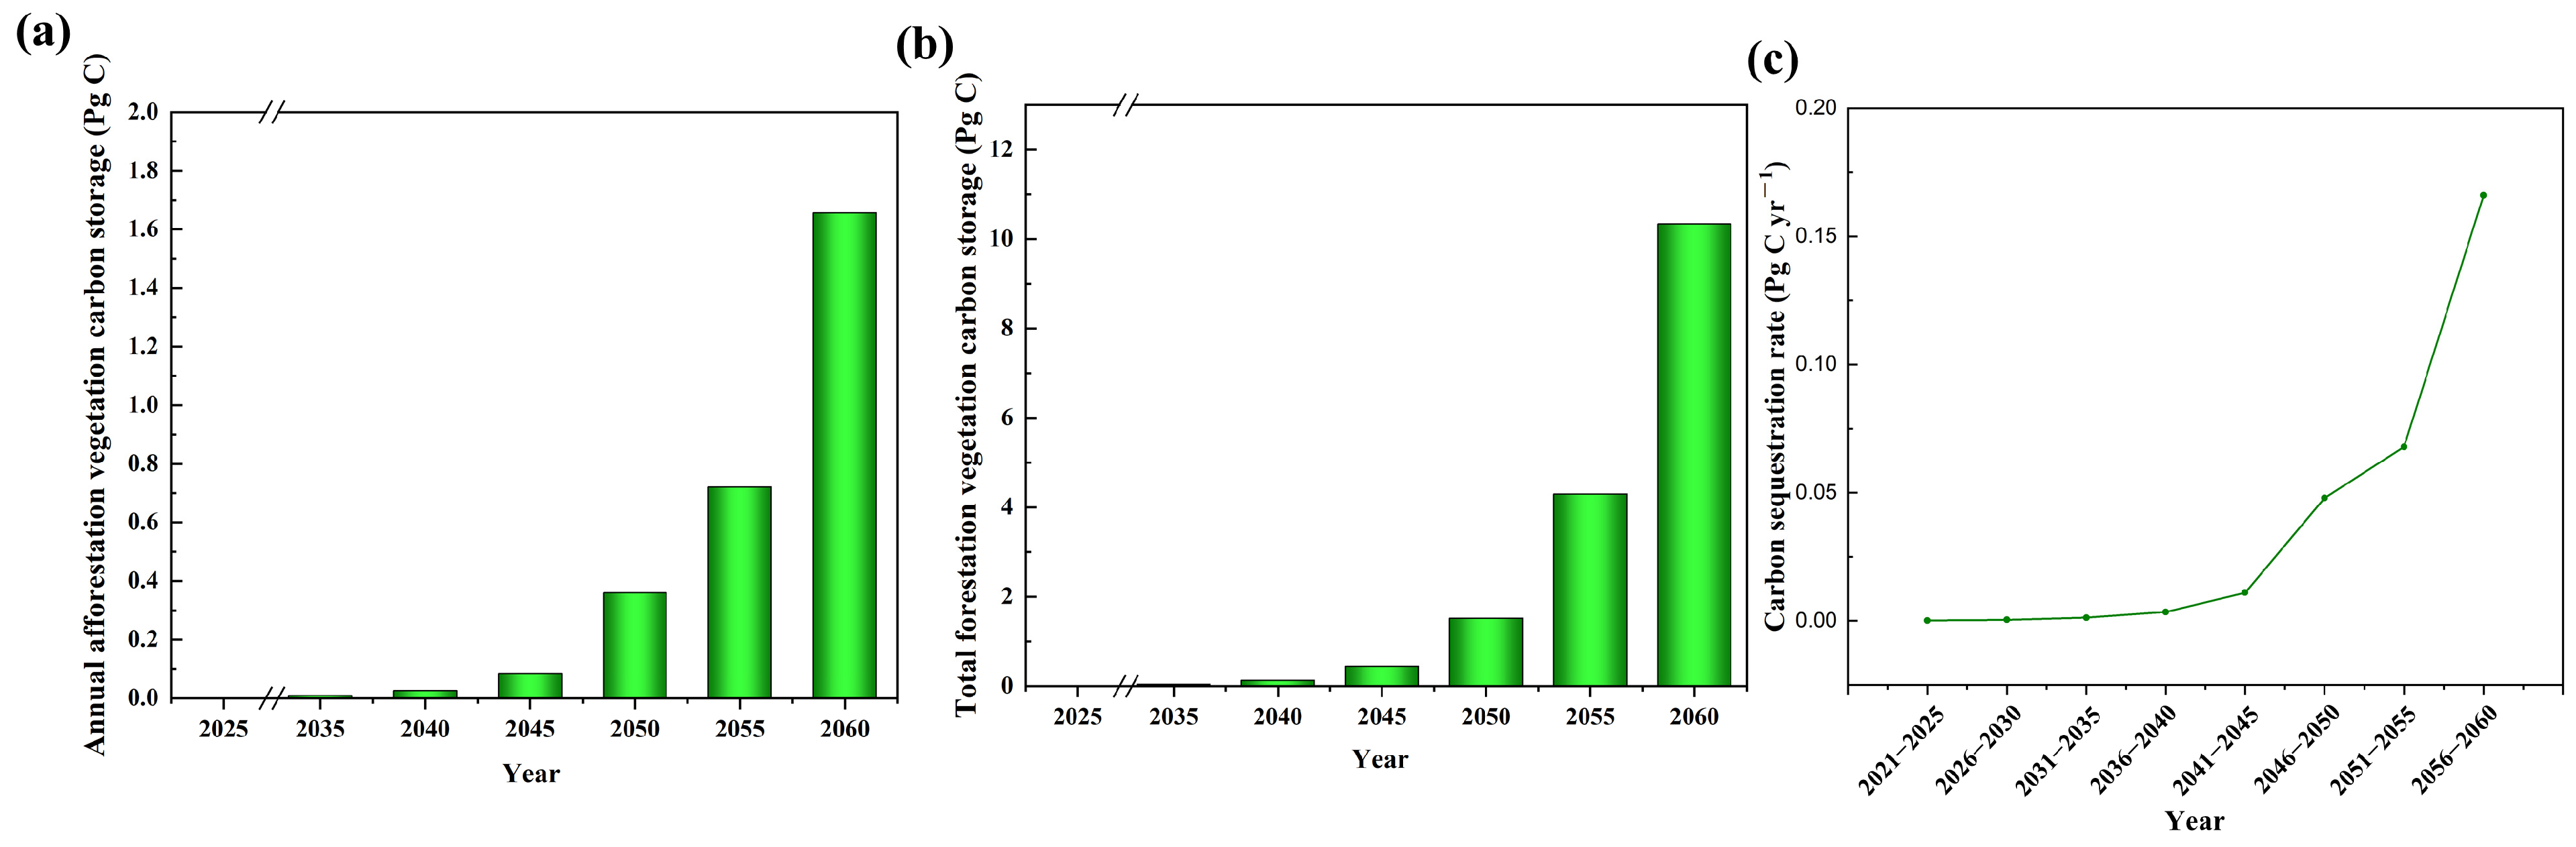
3.4. Future Afforestation Vegetation Biomass and Carbon Sequestration Capacity
Over the 40-year period, the afforestation vegetation biomass across China gradually increased with the increased afforestation area and forest age. The first batch of afforestation entered a rapid growth period after two or three decades, resulting in increasingly higher vegetation biomass (Figure 7). For example, between 2045 and 2060, the dynamic biomass prediction maps show that the biomass of afforestation land had a significant increasing trend (Figure 7). With an annual afforestation rate of 1.8 Mha, the afforestation area could reach 72 Mha by 2060, nearly exhausting the country’s potential afforestation area. By 2060, the afforestation vegetation biomass level will be at its greatest and could amount to 3.65 Pg. The average biomass and total biomass of afforestation vegetation were greater in the southern provinces compared to the northern provinces. Provinces such as Guangdong, Guangxi, Yunnan, Jiangxi, Hunan, and Guizhou have relatively high average biomass and total biomass of afforestation vegetation. Although provinces such as Taiwan, Hainan, and Fujian have high average biomass of afforested vegetation, the total biomass is relatively small due to the limited afforestation area (Table 3).
Figure 7.
Projections of the vegetation biomass dynamics from afforestation from 2021 to 2060.
Table 3.
The total and average afforestation vegetation biomass by province in 2060.
Overall, the carbon sequestration capacity of newly planted forests each year gradually increases, reaching a maximum of about 1.68 Pg C in 2060 (Figure 8a). The cumulative carbon storage in plantation forests will also gradually increase with the expansion of afforestation area and the increase in tree age, reaching 11.48 Pg C in 2060 (Figure 8b). The 5-yearly carbon sequestration rate gradually increased from 2021 to 2060. Prior to 2045, due to the relatively young tree age, the carbon sequestration rate increased relatively slowly, averaging around 0.003 Pg C yr−1. From 2046 to 2060, due to the increased forest age, the vegetation carbon sequestration capacity significantly increased, and the carbon sequestration rate entered a period of rapid growth. Although the increase in carbon sequestration rate slowed during 2051–2055, the rate during this period was still large, averaging around 0.067 Pg C yr−1. The carbon sequestration rate reached a maximum value of approximately 0.166 Pg C yr−1 during 2056–2060 (Figure 8c).
Figure 8.
Assessment of afforestation carbon sequestration capacity from 2021 to 2060. (a) Histogram of carbon stocks in afforested vegetation per year. (b) Cumulative histogram of carbon stocks in afforested vegetation. (c) Carbon stocks in afforested vegetation per five-year period.
3.5. Verification and Comparative Analysis Based on Previous Research Results
The results of Xu [18] showed that some potential afforestation land is distributed above the Hu Line, particularly in central and eastern Inner Mongolia (Figure 9a). In contrast, the distribution range of potential afforestation land in each period from 2021 to 2060 obtained in this study is primarily below the Hu Line, consistent with the results obtained by Xu et al. [22] (Figure 9b). Additionally, recent studies have shown that the distribution of potential afforestation land in China is unlikely to exceed the Hu Line [59], which, to some extent, reflects the accuracy and rationality of this study’s results. Furthermore, the density of potential afforestation land along the Yunnan–Guizhou Plateau obtained by Xu [18] is significantly lower than that of this study. This may be attributed to the WHA method used in this study, which comprehensively considers the weights of all influencing factors, whereas the “minimum factor law” method used by Xu [18] only considers the influence of the weakest factor in each region, resulting in a smaller potential afforestation area, with an area difference of about 11% (Table 4). In terms of the overall distribution trend of potential afforestation land, the results of this study in each period from 2021 to 2060 are closer to those of Xu et al. [22] (Figure 9b). The average area of potential afforestation in each period obtained in this study differs by about 4% from the results of Xu et al. [22] (Table 4). The carbon storage provided by newly planted forests by 2060 in this study is 11.48 Pg carbon, which is approximately 13% more than the result of Xu et al. [22]. In addition, due to differences in afforestation land prediction methods and afforestation site selection methods, the research by Cai et al. [27] showed that the carbon storage of newly planted forests was only 1.14 Pg carbon.
Figure 9.
(a) A distribution map of potential forestation land derived from Xu [18]. (b) A distribution map of potential forestation land from Xu et al. [22].
Table 4.
The potential afforestation lands area (unit: ×105 km2) and carbon storage of new afforestation by 2060 (unit: Pg C) in different studies.
3.6. Uncertainly Analyses
Considering that there may be errors in the land cover dataset, another published forest cover dataset for 2020 [32] and the forest cover distribution in two other 2020 land cover datasets [30,31] were used to improve the accuracy of the evaluation results. The total potential afforestation points from 2021 to 2060 in the afforestation land map under the progressive afforestation strategy (Figure A3) intersected with each of the other three forest cover datasets. The results showed that approximately 43 candidate afforestation points fell within the coverage of existing forests in these forest cover datasets each year, accounting for about 15% of the annual afforestation area (Figure A4, Figure A5 and Figure A6 and Table A4). Therefore, considering the differences between various land cover products, there may be a 15% uncertainty in the results of this study.
4. Discussion
4.1. The Temporal and Spatial Changes of Influencing Factors Are Highly Valuable for Predicting Afforestation Areas
This study quantified the weight of each factor on the prediction of potential afforestation land. The results showed that climate conditions, vegetation resilience, and top vegetation succession accounted for 78% of the relative factor influence. As important influencing factors for potential afforestation lands, these elements reflect the nature of the vegetation and span a long time period, enabling a more accurate capture of the dynamic evolution of afforestation areas. Using the spatiotemporal information of these factors, the quality levels of potential afforestation lands in various regions can be more accurately classified, thereby improving the prediction accuracy of future afforestation site distribution patterns. Previous studies have derived the distribution of potential future afforestation lands in China [18,22]; however, these studies considered influencing factors over a relatively short time period, lacked consideration of the nature of the vegetation itself, and the method of selecting potential forest sites was restrictive. In this study, we considered two new important factors—vegetation resilience and top vegetation succession, which reflect the nature of vegetation and span a longer time period. By combining these factors with the dynamically changing climatic influences over time, we aimed to achieve a more accurate distribution of potential forest land. At the same time, the specific influence weights of each factor were investigated, and a weight grading method was used to determine a more accurate quality grade of potential forested land in each region.
Vegetation ecosystems are inherently complex and dynamic and face increasingly severe threats from external factors, especially the increasing frequency of droughts and heat waves [60]. These challenges bring huge risks, especially in the initial stages of afforestation work, when saplings are not yet mature and are more susceptible to these adverse factors, resulting in low afforestation survival rates. In the afforestation process, vegetation resilience, which measures the ability of forest ecosystems to recover from disturbances, has become a key factor in determining the success or failure of afforestation [45]. Regions with strong vegetation resilience are more able to withstand environmental pressures, thereby ensuring the sustainability and success of afforestation work. Therefore, the formulation of afforestation strategies requires a comprehensive assessment and quantification of the vegetation recovery capacity in different regions, giving priority to regions with stronger recovery capacity. This would improve the efficiency of afforestation projects but also help protect the ecological environment and increase the resilience and sustainability of ecosystems.
In addition, the prediction of afforestation distribution also needs to consider the impact of vegetation succession in each region. In community succession, plant communities change over time and develop into the top layer of vegetation. These changes are closely related to environmental factors such as soil, hydrology, and climate. Afforestation is a method of artificial intervention in forest ecosystems. Therefore, if trees are planted contrary to the natural succession, it could lead to afforestation failure and could also damage the balance of local ecosystems [40].
Incorporating the two factors of succession and resilience can constrain and improve the accuracy of potential afforestation assessments. Compared to Xu [18] and Xu et al. [22], due to the incorporation of resilience and succession factors, this study identified reduced potential afforestation areas in some regions, such as Xinjiang, Sichuan, and Tibet. The “Master Plan for National Key Ecosystem Protection and Restoration Major Projects (2021–2035)” shows that these areas are ecologically sensitive and fragile, with low vegetation resilience [14], and are unsuitable for potential afforestation lands. This also indirectly indicates that the results of this study have improved the prediction accuracy and rationality of potential afforestation lands.
Additionally, previous research methods for evaluating the quality of potential afforestation lands, such as the “minimum factor law” [18], focused primarily on the single factor with the worst quality level. This approach overlooked the comprehensive effect of multiple factors and their respective weights, potentially resulting in the omission of some afforestation lands with higher overall quality. For example, Xu [18] estimated that the final potential afforestation land area was 66 Mha, whereas our study estimated an average area of 74 Mha, having combined the factor influence weights enabling the selection of areas with higher overall quality as potential afforestation lands. Therefore, compared with the constraints of the previous study, the results of this study focus on the comprehensive effect of factors improving reliability.
4.2. Dynamic Evaluation of Afforestation Lands Is Valuable in Formulating Afforestation Plans
At present, most studies predict the distribution of potential afforestation land in a fixed year [18,22] and pay less attention to the dynamic changes in afforestation areas. The factors affecting the distribution of potential afforestation areas change dynamically over time. Predictions of potential afforestation lands that do not account for the spatiotemporal changes in influencing factors may be biased in certain time periods, affecting the success of afforestation efforts. This study focuses on the dynamic changes in the distribution of potential afforestation land under a long time series so as to select high-quality potential afforestation lands in each period for afforestation activities.
In the early stages of afforestation, tree planting goes through an adaptation period, and tree transplantation goes through a transplant shock period, during which they are less resilient to environmental change. This period is important for trees to establish root systems and adapt to new environments [61]. The intensity of environmental disturbance and artificial care in subsequent years impacts the survival rate and future growth of the trees. For example, the climate production potential in Shaanxi and Shanxi provinces decreased sharply during 2046–2050, indicating that the climate conditions were relatively poor and the potential environmental disturbances were stronger during this period, resulting in a reduction in available afforestation lands. The estimated climate production potential at the junction of eastern Tibet and Sichuan Province increased sharply from 2041 to 2045, indicating favorable climate conditions with increased potential afforestation areas during this period (Figure 4 and Figure 6). Therefore, the distribution of potential afforestation lands varies dynamically over time, necessitating the exploration of different potential areas in various time periods to formulate and adjust progressive afforestation strategies.
In addition, it is a long process from planting to the rapid growth period, which provides a large carbon sink. Therefore, if the quality of the selected afforestation sites deteriorates during this time, it may impact the potential carbon sink. Selecting the distribution of future afforestation sites based on current conditions [18,22] may result in large uncertainty, especially if there is a significant disturbance in the afforestation environment. By predicting the dynamic distribution of future afforestation sites and prioritizing high-quality index areas for afforestation, the prediction accuracy of afforestation sites can be improved along with the success rate of afforestation.
4.3. Comparison of Prediction Methods for Potential Afforestation Lands
This study focuses on areas with a high afforestation quality index (afforestation index greater than 4) as the definition for candidate sites. Selecting high-quality potential afforestation sites can not only improve the survival rate of trees but also reduce the waste of manpower, material, and financial resources. Compared with other studies, the overall factor quality of potential afforestation sites obtained in this study is higher. Previous studies have suggested there are some afforestation areas in parts of southern Xinjiang, the Altay region in northern Xinjiang, and the Nyingchi region in Tibet [18,22]. However, we identified a few potential afforestation areas in these regions, despite the suitable climatic conditions, due to the low afforestation quality index and relatively poor factors for transportation and vegetation resilience.
Cai [27] used the FCS model to evaluate the carbon storage of potential afforestation sites. However, the study did not consider the quality of afforestation lands during the selection process, leading to a limited and randomly chosen afforestation area. Consequently, the predicted cumulative carbon storage by 2060 was only 1.14 Pg carbon [27], significantly lower than the 11.48 Pg carbon estimated in this study. The model used by Xu et al. [22] incorporated tree species parameters that were adapted for different tree species in different areas. The estimated afforestation cumulative carbon storage by 2060 was almost 10 Pg carbon [22]. However, the study did not consider the selection of high-quality potential afforestation sites in each period and randomly selected afforestation sites to predict and evaluate carbon storage. In this paper, the areas with the highest afforestation quality index in each period were selected and prioritized for afforestation. In theory, this method can achieve a higher tree survival rate, providing favorable climate production potential and carbon storage under the same conditions.
4.4. Limitations and Prospects
The vegetation biomass of different tree species varies with forest age. This study did not consider tree species differences in the process of calculating vegetation biomass. Future studies need to combine different suitable tree species in different regions to increase the accuracy of assessments of potential afforestation sites. In addition, afforestation can cause surface cooling and increased precipitation, which can further promote local climate change [62,63]. Afforestation may also have positive [64] or negative [65] effects on local biodiversity. Following gradual afforestation, these new sites may affect the quality level of influencing factors such as climate and vegetation succession in the original forest areas. Additionally, the timberline data used in this study were determined from the past 30 years’ temperature data to determine the future climate impact on the timberline range. These effects were not considered in this study, which could cause uncertainty in the assessment of potential afforestation sites and the calculation of carbon storage. Therefore, consideration of the detailed forest mechanisms could improve prediction accuracy to enhance the identification of potential afforestation sites and improve the assessment of carbon sequestration capacity. Additionally, due to the spatial resolution limitations of the dataset, the results of this study are constrained to a 1 km scale. Incorporating higher-resolution datasets to more accurately assess the distribution of potential afforestation sites is also a key direction for future research.
5. Conclusions
Based on datasets such as land use, eco-geographical zoning, topography, climate, transportation, climate production potential, vegetation succession, and vegetation restoration capacity, this study evaluated the quality and distribution of potential afforestation areas in China over the 40 years from 2021 to 2060, in 5-year periods, using a weighted classification method. High-quality potential afforestation lands were selected in each 5-year period for progressive afforestation, and the vegetation biomass of all new afforestation lands by 2060 was calculated, enabling evaluation of the carbon sequestration capacity of afforestation from 2021 to 2060.
The main conclusions are summarized as follows:
- (1)
- Incorporating the spatiotemporal dynamic information on vegetation succession, climate production potential, and vegetation resilience while quantifying the weights of each influencing factor can enhance the accuracy of predictions for potential afforestation lands.
- (2)
- The average potential afforestation area over the 40 years from 2021 to 2060 could reach 75 Mha. In the northern region, potential afforestation lands were mainly distributed on both sides of the “Hu Line”, while in the southern region, they were primarily located in the Yunnan–Guizhou Plateau and some coastal provinces.
- (3)
- Based on the dynamic distribution of potential afforestation lands and their quality conditions, a progressive afforestation plan can be formulated to more accurately assess future changes in the carbon sequestration capacity. The results indicate that by 2060, vegetation biomass can reach 3.647 Pg, the cumulative carbon storage of newly afforested land can reach 11.68 Pg carbon, and the maximum carbon sequestration rate could be 0.166 Pg C yr−1 during 2056–2060.
- (4)
- The conclusions of this study can serve as a valuable reference for the government in formulating afforestation policies and implementing afforestation practices. Future research should consider more comprehensive factors and detailed datasets and incorporate various computer-aided technologies to enhance the prediction accuracy of afforestation land distribution.
Author Contributions
Methodology, Z.Z. and Z.W.; validation, Z.Z. and S.Y.; investigation, Z.W.; writing—original draft, Z.Z.; writing—review & editing, Z.W. and X.Z.; visualization, Z.Z. and S.Y.; supervision, Z.W.; project administration, Z.W.; funding acquisition, Z.W. All authors have read and agreed to the published version of the manuscript.
Funding
This research was funded by the National Natural Science Foundation of China (Grant No. 42201518), Young Elite Scientists Sponsorship Program by BAST (No. BYESS2023005), the China Postdoctoral Science Foundation (No. 2023M740159), the Fundamental Research Funds for the Central Universities (BLX202107), Beijing Forestry University National Training Program of Innovation and Entrepreneurship for Undergraduates (202310022097) and supported by a grant from State Key Laboratory of Resources and Environmental Information System.
Data Availability Statement
The data used are primarily reflected in the article. Other relevant data are available from the corresponding author upon request.
Acknowledgments
We thank E.L. Cressey and Boyi Liang for their help in revising this manuscript.
Conflicts of Interest
The authors declare that they have no known competing financial interests or personal relationships that could have appeared to influence the work reported in this paper.
Appendix A
Figure A1.
Spatial distribution of top vegetation in the current baseline.
Figure A1.
Spatial distribution of top vegetation in the current baseline.

Figure A2.
Spatial distribution of top vegetation under future climates.
Figure A2.
Spatial distribution of top vegetation under future climates.

Figure A3.
Distribution of potential afforestation lands by time period and selection of priority sites for afforestation.
Figure A3.
Distribution of potential afforestation lands by time period and selection of priority sites for afforestation.

Figure A4.
Distribution map of overlapping and non-overlapping points between the total potential afforestation sites from 2021 to 2060 obtained in this study and existing forests in the forest cover dataset [32].
Figure A4.
Distribution map of overlapping and non-overlapping points between the total potential afforestation sites from 2021 to 2060 obtained in this study and existing forests in the forest cover dataset [32].

Figure A5.
Distribution map of overlapping and non-overlapping points between the total potential afforestation sites from 2021 to 2060 obtained in this study and existing forests in the GlobeLand30 dataset [30].
Figure A5.
Distribution map of overlapping and non-overlapping points between the total potential afforestation sites from 2021 to 2060 obtained in this study and existing forests in the GlobeLand30 dataset [30].

Figure A6.
Distribution map of overlapping and non-overlapping points between the total potential afforestation sites from 2021 to 2060 obtained in this study and existing forests in the GLC_FCS30 dataset [31].
Figure A6.
Distribution map of overlapping and non-overlapping points between the total potential afforestation sites from 2021 to 2060 obtained in this study and existing forests in the GLC_FCS30 dataset [31].

Table A1.
Top 16 vegetation types and classifications in China.
Table A1.
Top 16 vegetation types and classifications in China.
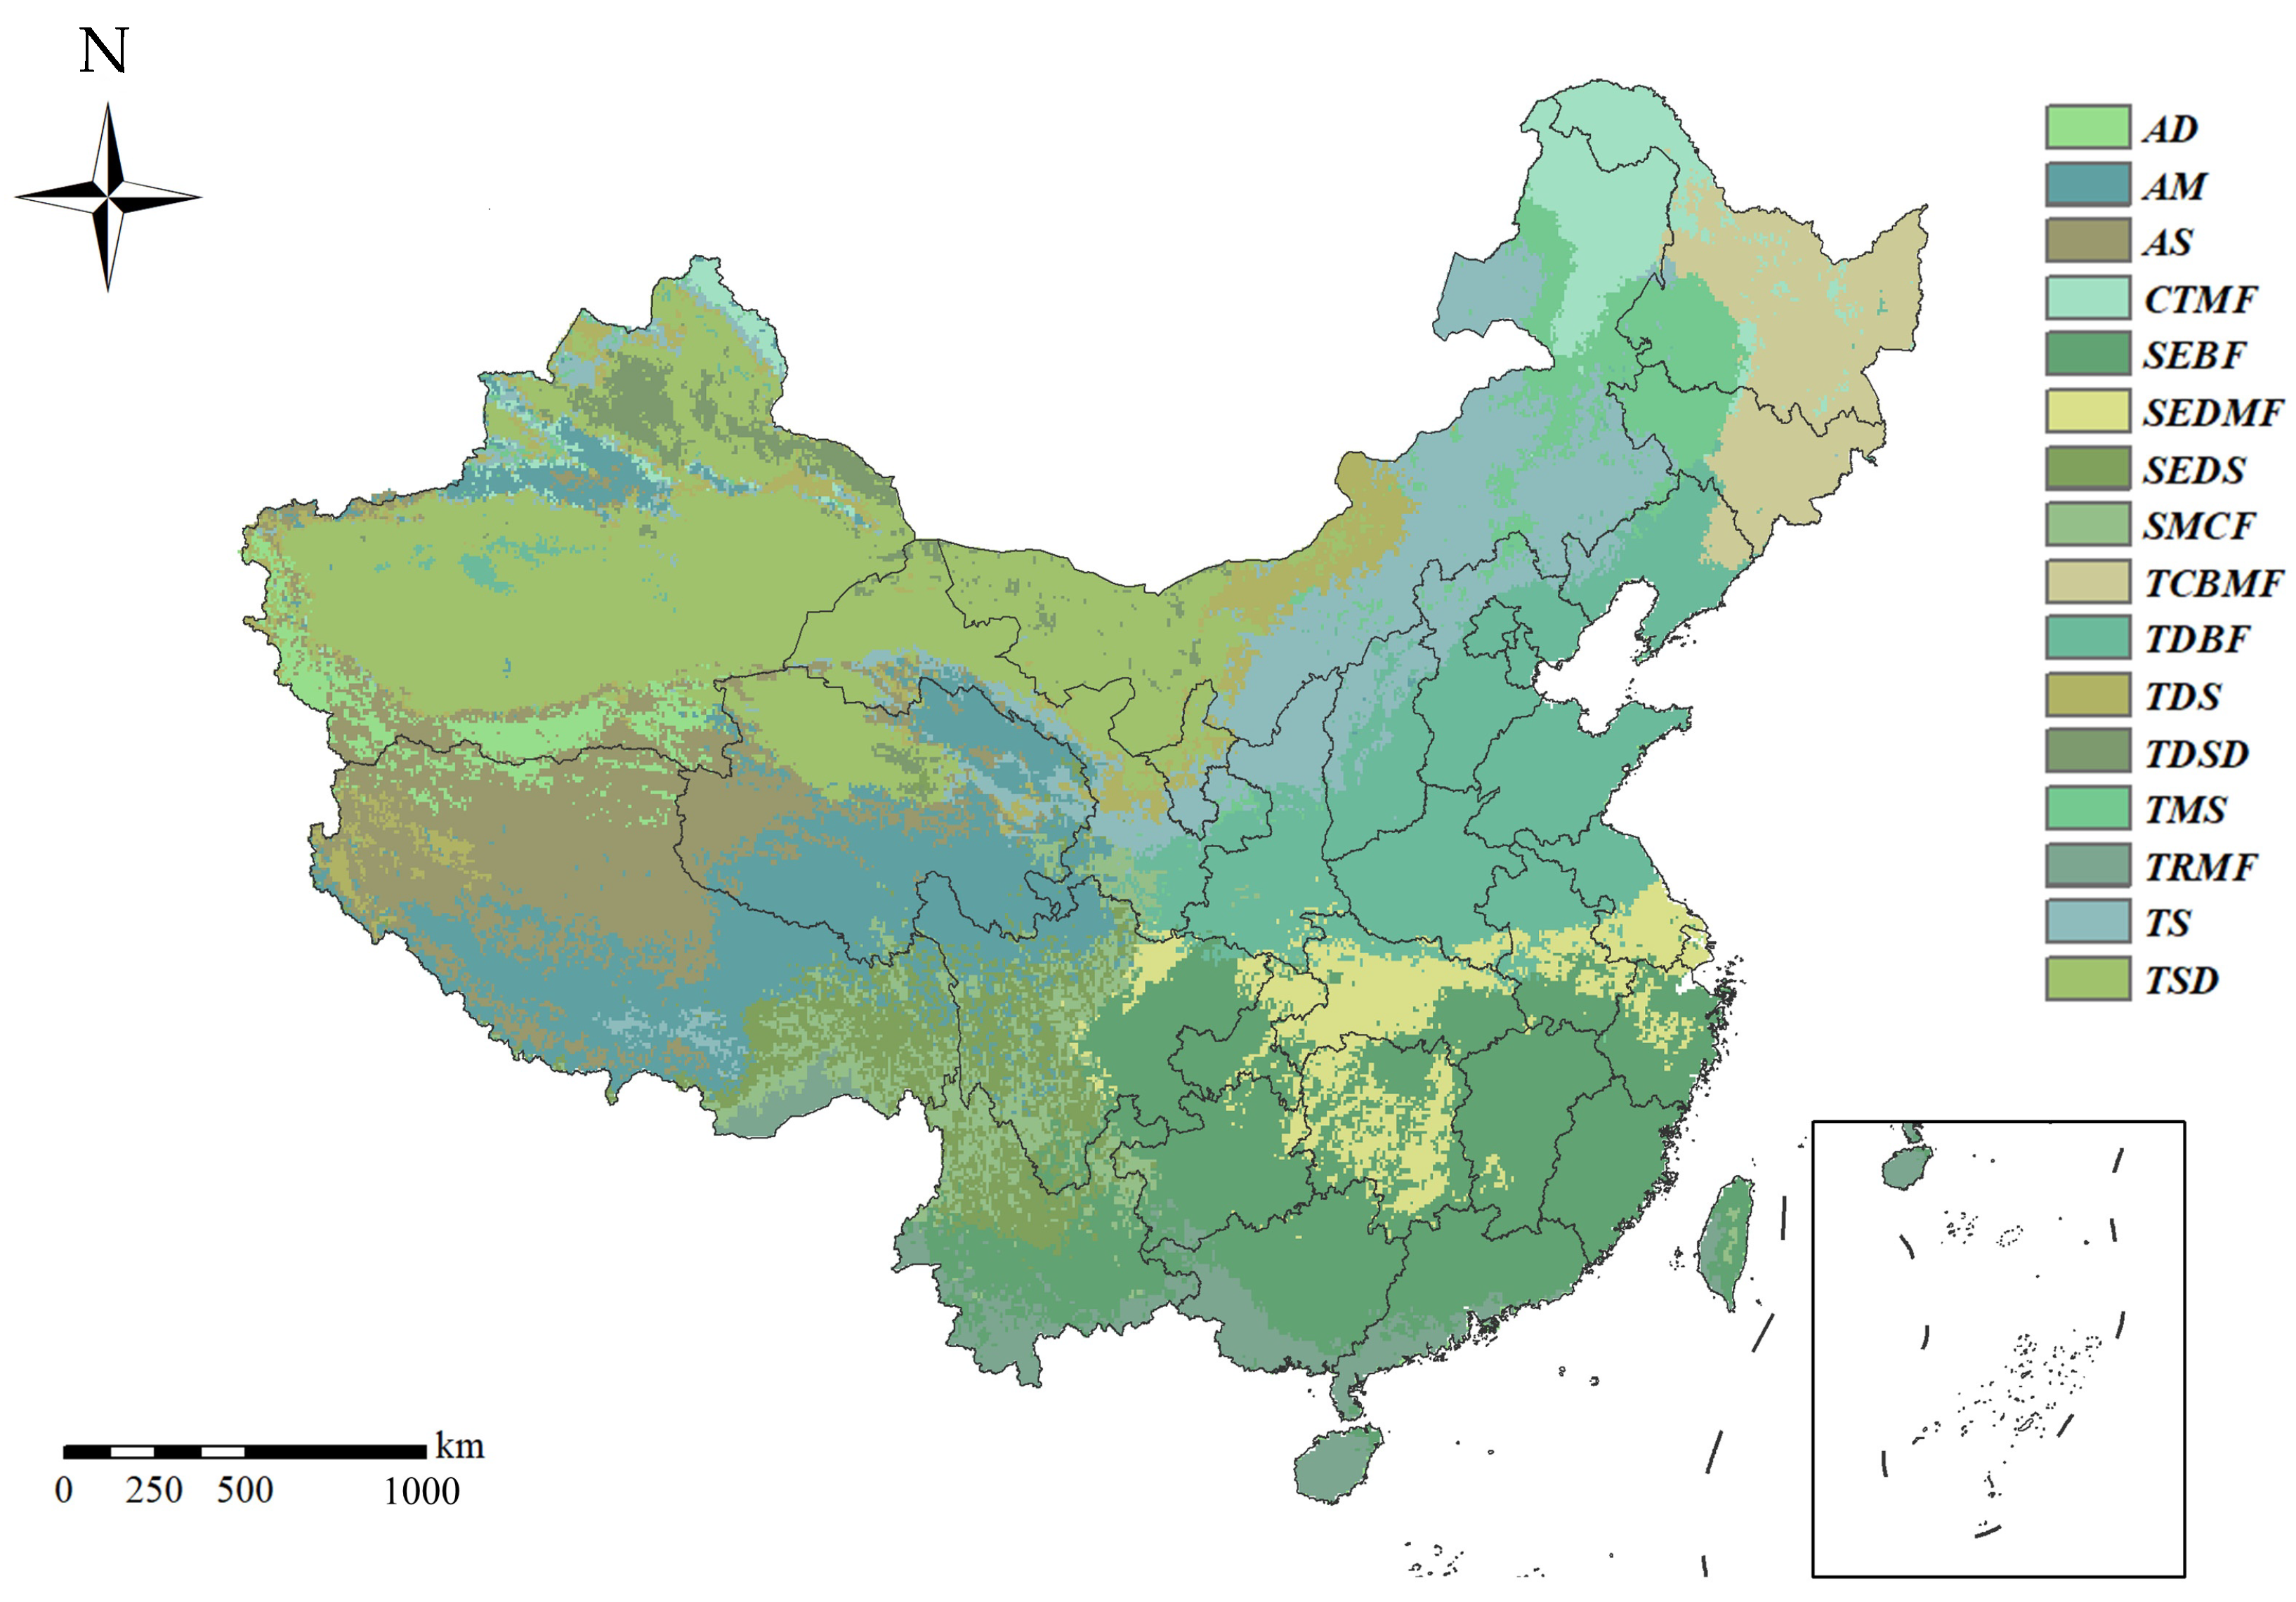
| Value | Vegetation Classification | Vegetation Type |
|---|---|---|
| 1 | desert | Alpine desert (AD) |
| 2 | grassland | Alpine meadow (AM) |
| 3 | grassland | Alpine steppe (AS) |
| 4 | forest | Cold-temperate and temperate mountainous coniferous forest (CTMF) |
| 5 | forest | Subtropical evergreen–broadleaf forest (SEBF) |
| 6 | forest | Subtropical evergreen and deciduous broadleaf mixed forest (SEDMF) |
| 7 | shrubland | Subalpine evergreen and deciduous shrub (SEDS) |
| 8 | forest | Subtropical mountainous cool coniferous forest (SMCF) |
| 9 | forest | Temperate coniferous–broadleaf mixed forest (TCBMF) |
| 10 | forest | Temperate deciduous–broadleaf forest (TDBF) |
| 11 | grassland | Temperate desert steppe (TDS) |
| 12 | desert | Temperate dwarf semi-arboreous desert (TDSD) |
| 13 | grassland | Temperate meadow steppe (TMS) |
| 14 | forest | Tropical rainforest and monsoon forest (TRMF) |
| 15 | grassland | Temperate typical steppe (TS) |
| 16 | desert | Temperate shrub desert and dwarf semi-shrub desert (TSD) |
Table A2.
Direction of various top vegetation successions and their quality classification.
Table A2.
Direction of various top vegetation successions and their quality classification.
| Value | Vegetation Shift | Level |
|---|---|---|
| 1 | unchanged forest type | 5 |
| 2 | conversion between forest types | 4 |
| 3 | forest to grassland | 3 |
| 4 | grassland to forest | 5 |
| 5 | unchanged grassland type | 3 |
| 6 | grassland to desert | 1 |
| 7 | unchanged desert type | 1 |
| 8 | forest to desert | 1 |
| 9 | desert to grassland | 2 |
| 10 | desert to forest | 5 |
| 11 | grassland to shrubland | 4 |
| 12 | shrubland to grassland | 3 |
| 13 | unchanged shrubland type | 5 |
| 14 | shrubland to desert | 1 |
| 15 | shrubland to forest | 5 |
| 16 | forest to shrubland | 5 |
Table A3.
Statistical table of dynamic changes in potential afforestation lands area in each ecological and geographical region of China in different periods from 2021 to 2060.
Table A3.
Statistical table of dynamic changes in potential afforestation lands area in each ecological and geographical region of China in different periods from 2021 to 2060.
| Period | Ecological and Geographical Divisions | Area (km²) | Period | Ecological and Geographical Divisions | Area (km²) |
|---|---|---|---|---|---|
| 2021–2025 | humid | 632,896 | 2041–2045 | humid | 645,184 |
| humid semi-humid | 102,272 | humid semi-humid | 108,928 | ||
| semi-humid | 6912 | semi-humid | 22,976 | ||
| semi-arid | 1152 | semi-arid | 1024 | ||
| arid | 320 | arid | 192 | ||
| 2026–2030 | humid | 660,672 | 2046–2050 | humid | 641,920 |
| humid semi-humid | 88,512 | humid semi-humid | 63,744 | ||
| semi-humid | 9600 | semi-humid | 8320 | ||
| semi-arid | 960 | semi-arid | 832 | ||
| arid | 192 | arid | 192 | ||
| 2031–2035 | humid | 650,688 | 2051–2055 | humid | 637,376 |
| humid semi-humid | 121,984 | humid semi-humid | 81,792 | ||
| semi-humid | 7744 | semi-humid | 14,656 | ||
| semi-arid | 6016 | semi-arid | 1024 | ||
| arid | 192 | arid | 192 | ||
| 2036–2040 | humid | 653,440 | 2056–2060 | humid | 645,120 |
| humid semi-humid | 75,712 | humid semi-humid | 80,768 | ||
| semi-humid | 8512 | semi-humid | 8640 | ||
| semi-arid | 1024 | semi-arid | 1088 | ||
| arid | 192 | arid | 256 |
Table A4.
Statistical table of overlapping points between existing forests in each dataset and potential afforestation points in this study.
Table A4.
Statistical table of overlapping points between existing forests in each dataset and potential afforestation points in this study.
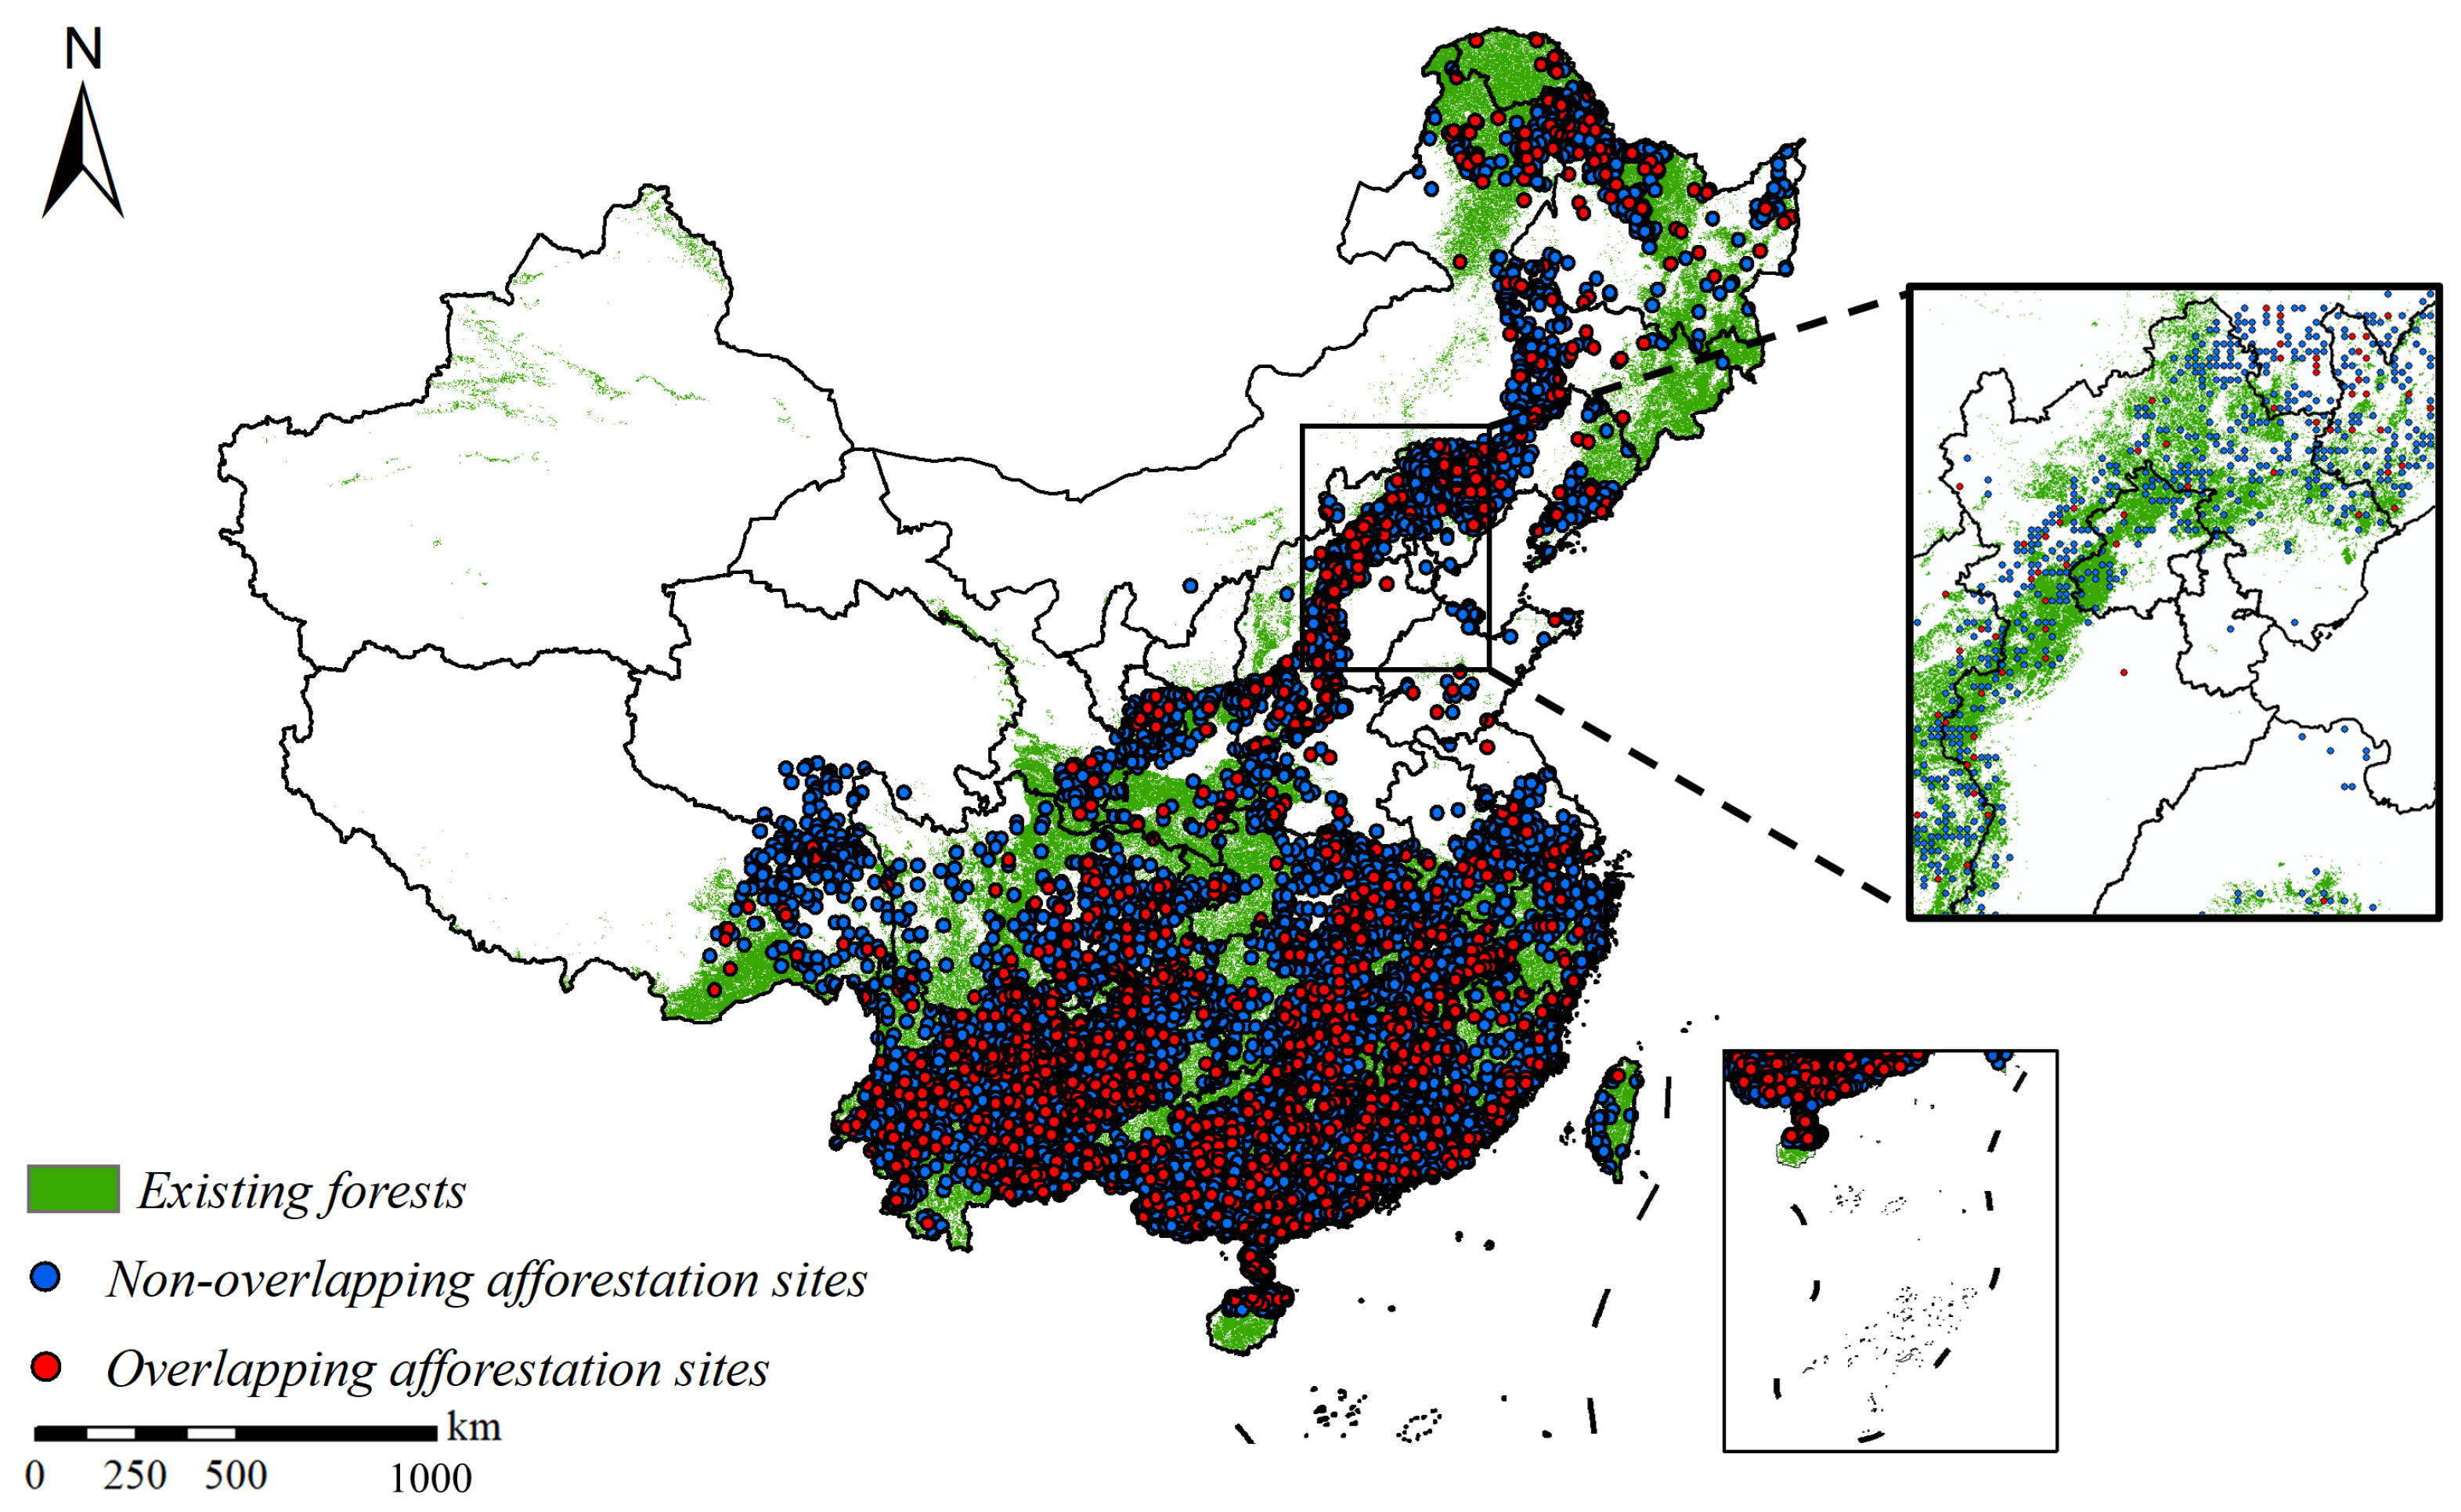
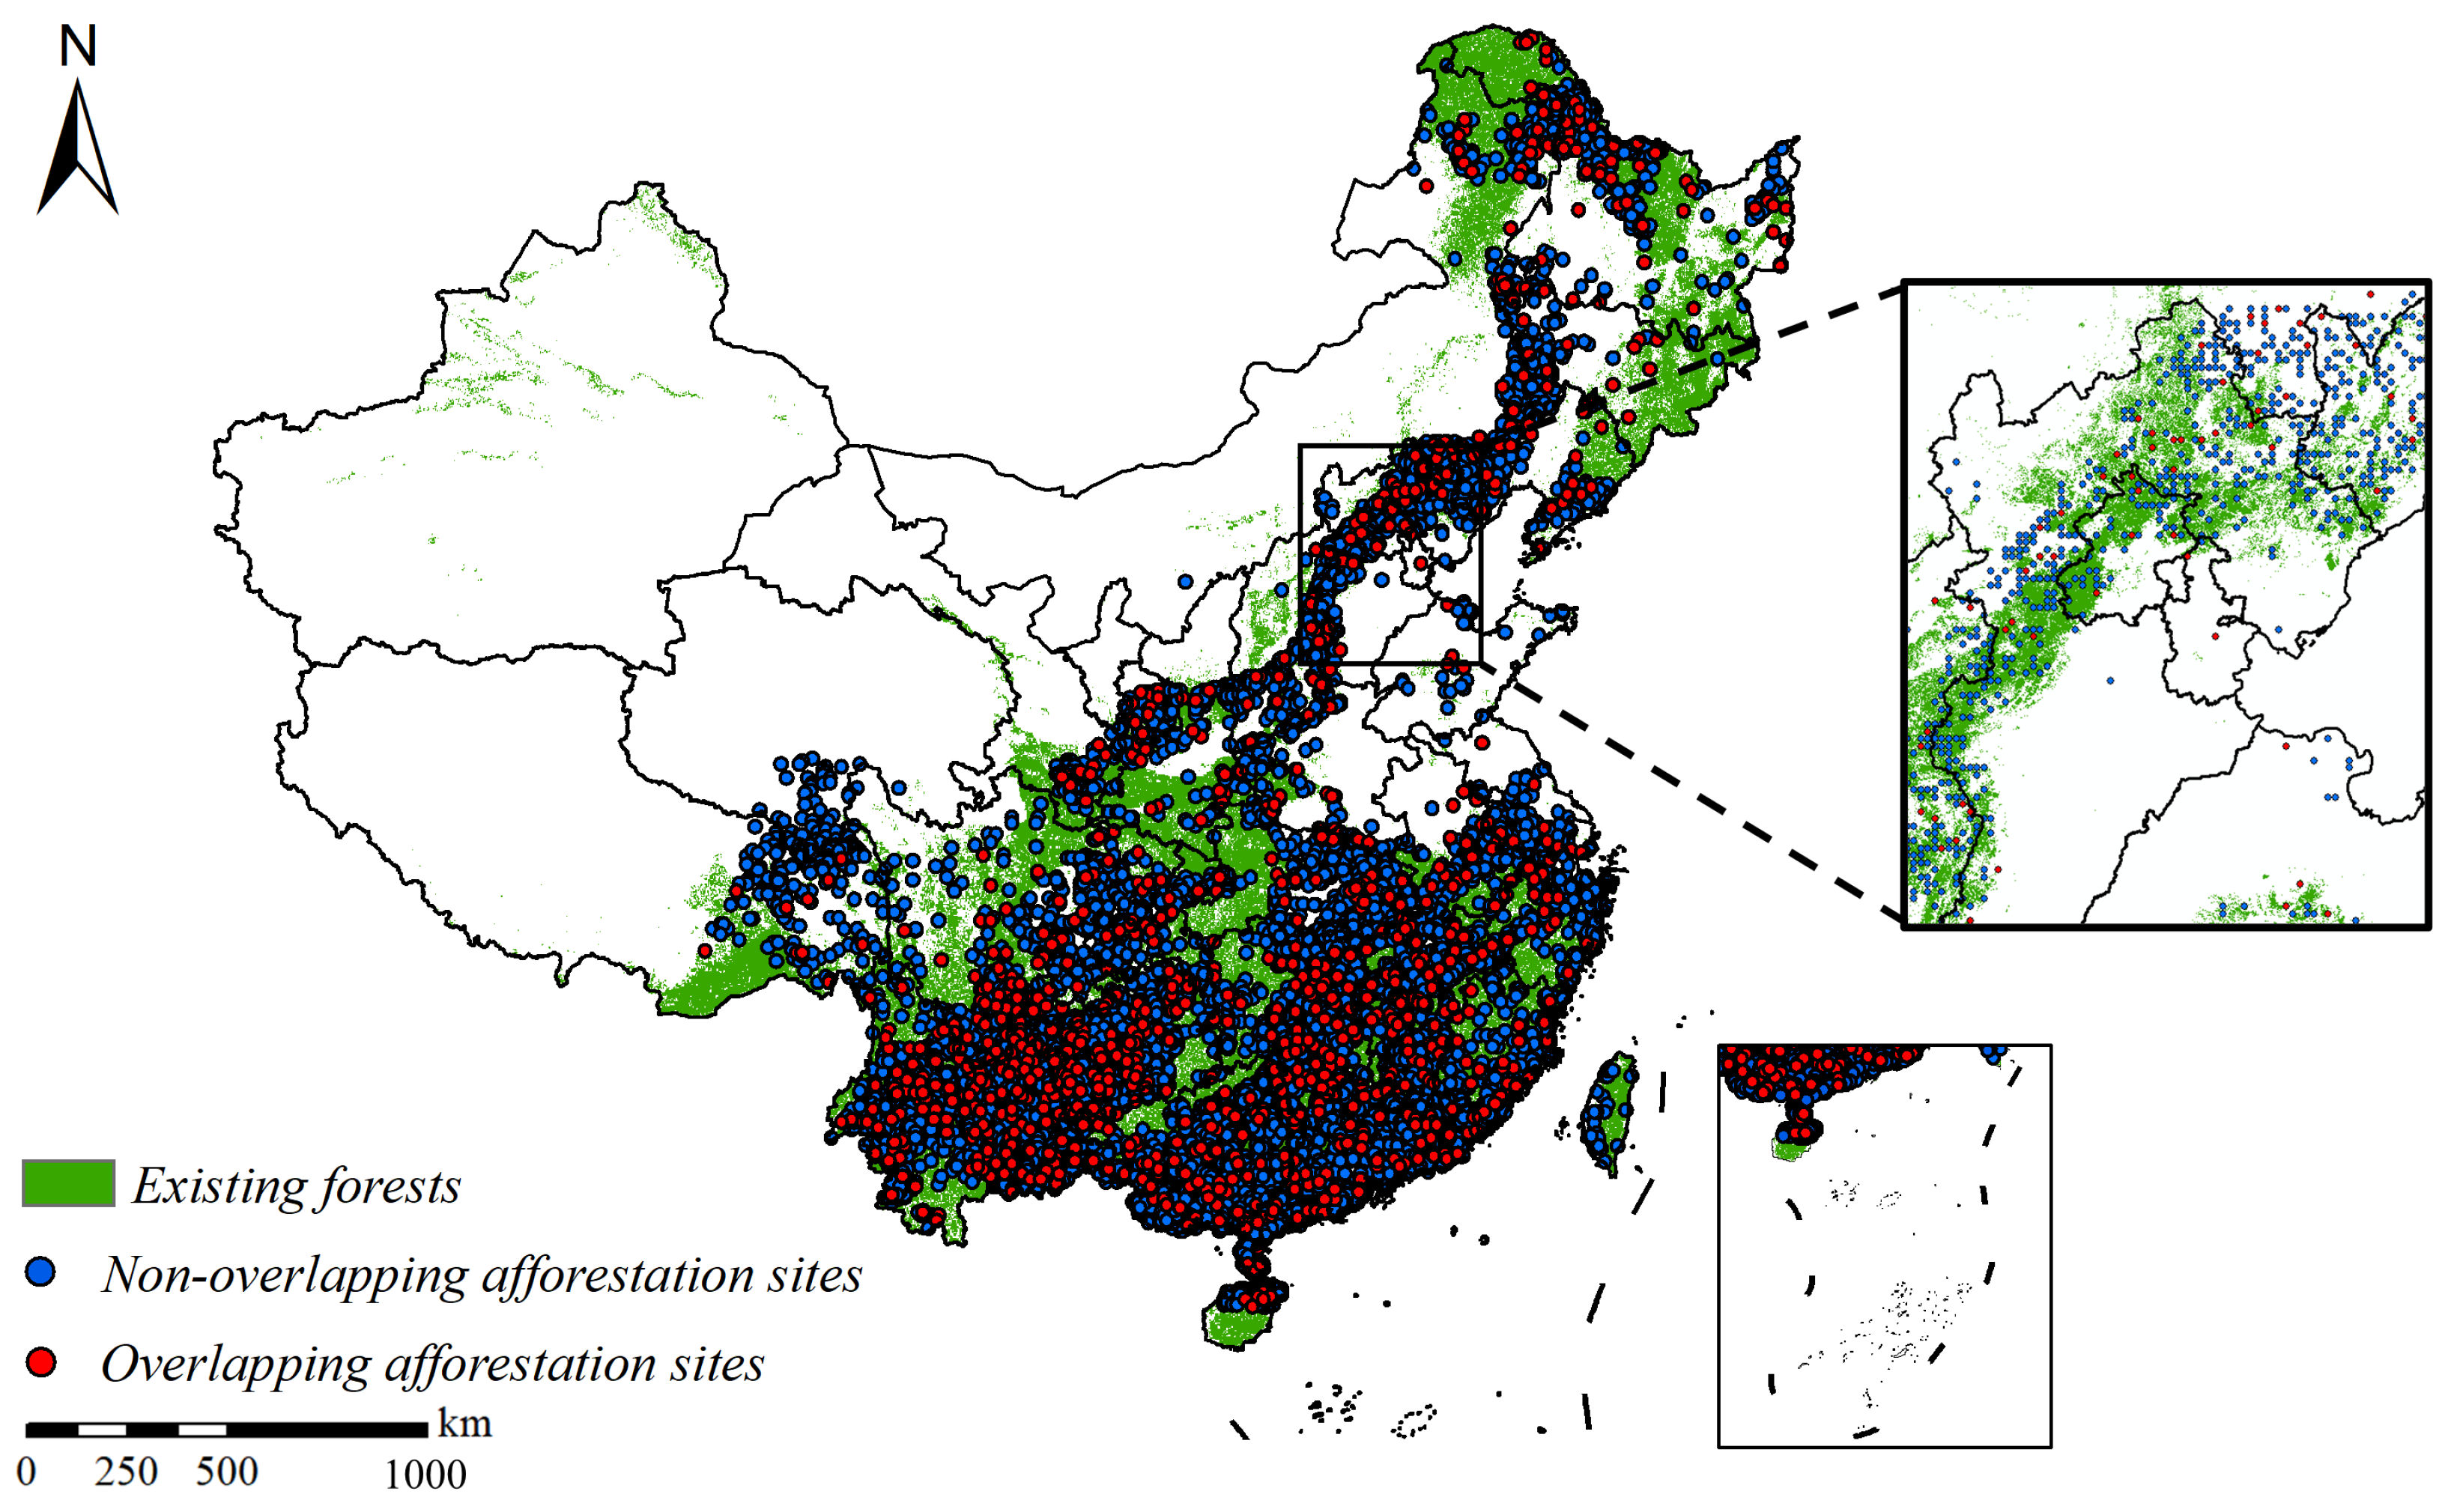
| Datasets | Total Overlap Points | Average Overlap Points Per Year | Total Non-Overlap Points | Average Non-Overlap Points Per Year |
|---|---|---|---|---|
| Forest cover dataset [32] | 2110 | 53 | 9090 | 227 |
| GlobeLand30 dataset [30] | 1568 | 39 | 9632 | 241 |
| GLC_FCS30 dataset [31] | 1482 | 37 | 9718 | 243 |
References
- Pan, Y.; Birdsey, R.A.; Fang, J.; Houghton, R.; Kauppi, P.E.; Kurz, W.A.; Phillips, O.L.; Shvidenko, A.; Lewis, S.L.; Canadell, J.G.; et al. A Large and Persistent Carbon Sink in the World’s Forests. Science 2011, 333, 988–993. [Google Scholar] [CrossRef]
- Chen, B.; Chen, F.; Ciais, P.; Zhang, H.; Lü, H.; Wang, T.; Chevallier, F.; Liu, Z.; Yuan, W.; Peters, W. Challenges to Achieve Carbon Neutrality of China by 2060: Status and Perspectives. Sci. Bull. 2022, 67, 2030–2035. [Google Scholar] [CrossRef]
- He, J.; Li, Z.; Zhang, X.; Wang, H.; Dong, W.; Chang, S.; Ou, X.; Guo, S.; Tian, Z.; Gu, A.; et al. Comprehensive Report on China’s Long-Term Low-Carbon Development Strategies and Pathways. Chin. J. Popul. Resour. Environ. 2020, 18, 263–295. [Google Scholar] [CrossRef]
- Meinshausen, M.; Lewis, J.; McGlade, C.; Gütschow, J.; Nicholls, Z.; Burdon, R.; Cozzi, L.; Hackmann, B. Realization of Paris Agreement Pledges May Limit Warming Just below 2 °C. Nature 2022, 604, 304–309. [Google Scholar] [CrossRef] [PubMed]
- Mo, L.; Zohner, C.M.; Reich, P.B.; Liang, J.; de Miguel, S.; Nabuurs, G.-J.; Renner, S.S.; van den Hoogen, J.; Araza, A.; Herold, M.; et al. Integrated Global Assessment of the Natural Forest Carbon Potential. Nature 2023, 624, 92–101. [Google Scholar] [CrossRef]
- Azam, A.; Rafiq, M.; Shafique, M.; Yuan, J. Mitigating Carbon Emissions in China: The Role of Clean Energy, Technological Innovation, and Political-Institutional Quality. Front. Environ. Sci. 2022, 10, 814439. [Google Scholar] [CrossRef]
- Law, B.E.; Harmon, M.E. Forest Sector Carbon Management, Measurement and Verification, and Discussion of Policy Related to Climate Change. Carbon Manag. 2011, 2, 73–84. [Google Scholar] [CrossRef]
- Cheng, K.; Yang, H.; Tao, S.; Su, Y.; Guan, H.; Ren, Y.; Hu, T.; Li, W.; Xu, G.; Chen, M.; et al. Carbon Storage through China’s Planted Forest Expansion. Nat. Commun. 2024, 15, 4106. [Google Scholar] [CrossRef]
- Nave, L.E.; Swanston, C.W.; Mishra, U.; Nadelhoffer, K.J. Afforestation Effects on Soil Carbon Storage in the United States: A Synthesis. Soil Sci. Soc. Am. J. 2013, 77, 1035–1047. [Google Scholar] [CrossRef]
- Tong, X.; Han, X.; Faqi, W.; Zhao, F.; Ren, C.; Li, J. Change in Carbon Storage in Soil Physical Fractions after Afforestation of Former Arable Land. Soil Sci. Soc. Am. J. 2016, 80, 1098–1106. [Google Scholar] [CrossRef]
- Lu, F.; Hu, H.; Sun, W.; Zhu, J.; Liu, G.; Zhou, W.; Zhang, Q.; Shi, P.; Liu, X.; Wu, X.; et al. Effects of National Ecological Restoration Projects on Carbon Sequestration in China from 2001 to 2010. Proc. Natl. Acad. Sci. USA 2018, 115, 4039–4044. [Google Scholar] [CrossRef] [PubMed]
- Piao, S.; Yue, C.; Ding, J.; Guo, Z. Perspectives on the Role of Terrestrial Ecosystems in the ‘Carbon Neutrality’ Strategy. Sci. China Earth Sci. 2022, 65, 1178–1186. [Google Scholar] [CrossRef]
- Yu, Z.; Ciais, P.; Piao, S.; Houghton, R.A.; Lu, C.; Tian, H.; Agathokleous, E.; Kattel, G.R.; Sitch, S.; Goll, D.; et al. Forest Expansion Dominates China’s Land Carbon Sink since 1980. Nat. Commun. 2022, 13, 5374. [Google Scholar] [CrossRef]
- National Development and Reform Commission; Ministry of Natural Resources of China. The Master Plan for Major Projects of National Important Ecosystem Protection and Restoration (2021–2035); National Development and Reform Commission and Ministry of Natural Resources of China: Beijing, China, 2020; pp. 10–11. [Google Scholar]
- Lü, D.; Lü, Y.; Gao, G.; Sun, S.; Wang, Y.; Fu, B. A Landscape Persistence-Based Methodological Framework for Assessing Ecological Stability. Environ. Sci. Ecotechnol. 2024, 17, 100300. [Google Scholar] [CrossRef]
- Tappeiner, U.; Leitinger, G.; Zariņa, A.; Bürgi, M. How to Consider History in Landscape Ecology: Patterns, Processes, and Pathways. Landsc. Ecol. 2021, 36, 2317–2328. [Google Scholar] [CrossRef]
- Tian, L.; Zhang, B.; Wang, X.; Chen, S.; Pan, B. Large-Scale Afforestation Over the Loess Plateau in China Contributes to the Local Warming Trend. Geophys. Res. Atmos. 2022, 127, e2021JD035730. [Google Scholar] [CrossRef]
- Xu, J. Estimation of the Spatial Distribution of Potential Forestation Land and Its Climatic Potential Productivity in China. ACTA Geogr. Sin. 2023, 78, 677. [Google Scholar] [CrossRef]
- World Resources Institute Data from “Atlas of Forest and Landscape Restoration Opportunities” 2021. Available online: https://www.wri.org/data/atlas-forest-and-landscape-restoration-opportunities (accessed on 28 May 2024).
- Bastin, J.-F.; Finegold, Y.; Garcia, C.; Mollicone, D.; Rezende, M.; Routh, D.; Zohner, C.M.; Crowther, T.W. The Global Tree Restoration Potential. Science 2019, 365, 76–79. [Google Scholar] [CrossRef] [PubMed]
- Baudena, M.; Dekker, S.C.; Van Bodegom, P.M.; Cuesta, B.; Higgins, S.I.; Lehsten, V.; Reick, C.H.; Rietkerk, M.; Scheiter, S.; Yin, Z.; et al. Forests, Savannas, and Grasslands: Bridging the Knowledge Gap between Ecology and Dynamic Global Vegetation Models. Biogeosciences 2015, 12, 1833–1848. [Google Scholar] [CrossRef]
- Xu, H.; Yue, C.; Zhang, Y.; Liu, D.; Piao, S. Forestation at the Right Time with the Right Species Can Generate Persistent Carbon Benefits in China. Proc. Natl. Acad. Sci. USA 2023, 120, e2304988120. [Google Scholar] [CrossRef]
- Batunacun; Wieland, R.; Lakes, T.; Hu, Y.; Nendel, C. Identifying Drivers of Land Degradation in Xilingol, China, between 1975 and 2015. Land Use Policy 2019, 83, 543–559. [Google Scholar] [CrossRef]
- Liu, Y.; Wang, L.; Long, H. Spatio-Temporal Analysis of Land-Use Conversion in the Eastern Coastal China during 1996–2005. J. Geogr. Sci. 2008, 18, 274–282. [Google Scholar] [CrossRef]
- Lyu, R.; Zhang, J.; Xu, M.; Li, J. Impacts of Urbanization on Ecosystem Services and Their Temporal Relations: A Case Study in Northern Ningxia, China. Land Use Policy 2018, 77, 163–173. [Google Scholar] [CrossRef]
- Xing, L.; Xue, M.; Hu, M. Dynamic Simulation and Assessment of the Coupling Coordination Degree of the Economy–Resource–Environment System: Case of Wuhan City in China. J. Environ. Manag. 2019, 230, 474–487. [Google Scholar] [CrossRef]
- Cai, W.; He, N.; Li, M.; Xu, L.; Wang, L.; Zhu, J.; Zeng, N.; Yan, P.; Si, G.; Zhang, X.; et al. Carbon Sequestration of Chinese Forests from 2010 to 2060: Spatiotemporal Dynamics and Its Regulatory Strategies. Sci. Bull. 2022, 67, 836–843. [Google Scholar] [CrossRef]
- Lucas, M.P.; Longman, R.J.; Giambelluca, T.W.; Frazier, A.G.; Mclean, J.; Cleveland, S.B.; Huang, Y.-F.; Lee, J. Optimizing Automated Kriging to Improve Spatial Interpolation of Monthly Rainfall over Complex Terrain. J. Hydrometeorol. 2022, 23, 561–572. [Google Scholar] [CrossRef]
- Hou, H. Global IGBP LULC Projection Dataset under Eight SSPs-RCPs 2022. Available online: https://figshare.com/articles/dataset/Global_IGBP_LULC_projection_dataset_under_eight_SSPs-RCPs/20088368 (accessed on 28 May 2024).
- Jun, C.; Ban, Y.; Li, S. Open Access to Earth Land-Cover Map. Nature 2014, 514, 434. [Google Scholar] [CrossRef] [PubMed]
- Zhang, X.; Mingchun, L.; Xidong, C.; Yuan, G.; Shuai, X.; Jun, M. GLC_FCS30: Global Land-Cover Product with Fine Classification System at 30 m Using Time-Series Landsat Imagery. Earth Syst. Sci. Data 2021, 13, 2753–2776. [Google Scholar] [CrossRef]
- Hou, R.; Meng, S.; Pang, Y. High-Precision Chinese Forest Cover Dataset Based on Multi-Source Land Cover Products 2023. Chinese Science Data 2023. Available online: https://www.scidb.cn/en/detail?dataSetId=6adb09e7cda942659d9de9ffcf8bb76e (accessed on 28 May 2024).
- Editorial Board of Vegetation Map of China, Chinese Academy of Sciences (EBVM). 1:1,000,000 Vegetation Distribution Map of China; Science Press: Beijing, China, 2001. [Google Scholar]
- Xu, X.; Zhang, D.; Zhang, Y.; Yao, S.; Zhang, J. Evaluating the Vegetation Restoration Potential Achievement of Ecological Projects: A Case Study of Yan’an, China. Land Use Policy 2020, 90, 104293. [Google Scholar] [CrossRef]
- Zhou, G.; Zheng, Y.; Luo, T.; Chen, S. NPP model of natural vegetation and its application in China. Sci. Silvae Sin. 1998, 34, 2. [Google Scholar]
- Li, Z.; Duan, C.; Jin, L.; Hu, X.; Li, B.; Yang, H. Spatial and Temporal Variability of Climatic Potential Productivity in Yunnan Province, China. Chin. J. Appl. Ecol. 2019, 30, 2181–2190. [Google Scholar] [CrossRef]
- Mann, H.B. Nonparametric Tests against Trend. Econometrica 1945, 13, 245. [Google Scholar] [CrossRef]
- N. L. J. Rank Correlation Methods. By Maurice G. Kendall, M.A. [Pp. Vii + 160. London: Charles Griffin and Co. Ltd., 42 Drury Lane, 1948. 18s.]. J. Inst. Actuar. 1949, 75, 140–141. [Google Scholar] [CrossRef]
- Shadmani, M.; Marofi, S.; Roknian, M. Trend Analysis in Reference Evapotranspiration Using Mann-Kendall and Spearman’s Rho Tests in Arid Regions of Iran. Water Resour. Manag. 2012, 26, 211–224. [Google Scholar] [CrossRef]
- Zhang, L.; Sun, P.; Huettmann, F.; Liu, S. Where Should China Practice Forestry in a Warming World? Glob. Chang. Biol. 2022, 28, 2461–2475. [Google Scholar] [CrossRef]
- Editorial Committee of Vegetation of China (ECVC). Vegetation of China; Science Press: Beijing, China, 1980. [Google Scholar]
- Wu, Z. Chinese Forests; Chinese Forestry Press: Beijing, China, 2001. [Google Scholar]
- Karavani, A.; Boer, M.M.; Baudena, M.; Colinas, C.; Díaz-Sierra, R.; Pemán, J.; de Luis, M.; Enríquez-de-Salamanca, Á.; Resco de Dios, V. Fire-Induced Deforestation in Drought-Prone Mediterranean Forests: Drivers and Unknowns from Leaves to Communities. Ecol. Monogr. 2018, 88, 141–169. [Google Scholar] [CrossRef]
- Liaw, A.; Wiener, M. Classification and Regression by randomForest. R News 2002, 2, 18–22. [Google Scholar]
- Liang, M.; Cao, R.; Di, K.; Han, D.; Hu, Z. Vegetation Resistance and Resilience to a Decade-long Dry Period in the Temperate Grasslands in China. Ecol. Evol. 2021, 11, 10582–10589. [Google Scholar] [CrossRef] [PubMed]
- Forzieri, G.; Dakos, V.; McDowell, N.G.; Ramdane, A.; Cescatti, A. Emerging Signals of Declining Forest Resilience under Climate Change. Nature 2022, 608, 534–539. [Google Scholar] [CrossRef]
- Abis, B.; Brovkin, V. Environmental Conditions for Alternative Tree-Cover States in High Latitudes. Biogeosciences 2017, 14, 511–527. [Google Scholar] [CrossRef]
- Ciemer, C.; Boers, N.; Hirota, M.; Kurths, J.; Müller-Hansen, F.; Oliveira, R.S.; Winkelmann, R. Higher Resilience to Climatic Disturbances in Tropical Vegetation Exposed to More Variable Rainfall. Nat. Geosci. 2019, 12, 174–179. [Google Scholar] [CrossRef]
- Hirota, M.; Holmgren, M.; van Nes, E.H.; Scheffer, M. Global Resilience of Tropical Forest and Savanna to Critical Transitions. Science 2011, 334, 232–235. [Google Scholar] [CrossRef] [PubMed]
- Scheffer, M.; Hirota, M.; Holmgren, M.; Van Nes, E.H.; Chapin, F.S. Thresholds for Boreal Biome Transitions. Proc. Natl. Acad. Sci. USA 2012, 109, 21384–21389. [Google Scholar] [CrossRef] [PubMed]
- Xu, X. Vegetation Cover Resilience Data Set for Countries along the Belt and Road (2000–2020). Natl. Tibet. Plateau Data Cent. 2022. [Google Scholar] [CrossRef]
- Li, X. Using “Random Forest” for Classification and Regression. Chin. Bull. Entomol. 2013, 50, 1190–1197. [Google Scholar]
- Xu, B.; Guo, Z.; Piao, S.; Fang, J. Biomass Carbon Stocks in China’s Forests between 2000 and 2050: A Prediction Based on Forest Biomass-Age Relationships. Sci. China Life Sci. 2010, 53, 776–783. [Google Scholar] [CrossRef]
- Yang, Y.; Luo, Y.; Finzi, A.C. Carbon and Nitrogen Dynamics during Forest Stand Development: A Global Synthesis. New Phytol. 2011, 190, 977–989. [Google Scholar] [CrossRef]
- He, N.; Wen, D.; Zhu, J.; Tang, X.; Xu, L.; Zhang, L.; Hu, H.; Huang, M.; Yu, G. Vegetation Carbon Sequestration in Chinese Forests from 2010 to 2050. Glob. Chang. Biol. 2016, 23, 1575–1584. [Google Scholar] [CrossRef]
- Yu, D.; Wang, X.; Yin, Y.; Zhan, J.; Lewis, B.J.; Tian, J.; Bao, Y.; Zhou, W.; Zhou, L.; Dai, L. Estimates of Forest Biomass Carbon Storage in Liaoning Province of Northeast China: A Review and Assessment. PLoS ONE 2014, 9, e89572. [Google Scholar] [CrossRef]
- Cook, R.L.; Binkley, D.; Mendes, J.C.T.; Stape, J.L. Soil Carbon Stocks and Forest Biomass Following Conversion of Pasture to Broadleaf and Conifer Plantations in Southeastern Brazil. For. Ecol. Manag. 2014, 324, 37–45. [Google Scholar] [CrossRef]
- Li, S.; Huang, X.; Tang, R.; Li, J.; Zhu, B.; Su, J. Soil Microbial Diversity and Network Complexity Sustain Ecosystem Multifunctionality Following Afforestation in a Dry-Hot Valley Savanna. Catena 2023, 231, 107329. [Google Scholar] [CrossRef]
- Liu, H. It Is Difficult for China’s Greening through Large-Scale afforestation to cross the Hu Line. Sci. China Earth Sci. 2019, 62, 1662–1664. [Google Scholar] [CrossRef]
- Smith, T.; Boers, N. Reliability of Vegetation Resilience Estimates Depends on Biomass Density. Nat. Ecol. Evol. 2023, 7, 1799–1808. [Google Scholar] [CrossRef]
- Watson, G. Tree Size Affects Root Regeneration and Top Growth After Transplanting. Arboric. Urban For. 1985, 11, 37–40. [Google Scholar] [CrossRef]
- Li, Y.; Piao, S.; Li, L.Z.X.; Chen, A.; Wang, X.; Ciais, P.; Huang, L.; Lian, X.; Peng, S.; Zeng, Z.; et al. Divergent Hydrological Response to Large-Scale Afforestation and Vegetation Greening in China. Sci. Adv. 2018, 4, eaar4182. [Google Scholar] [CrossRef] [PubMed]
- Peng, S.-S.; Piao, S.; Zeng, Z.; Ciais, P.; Zhou, L.; Li, L.Z.X.; Myneni, R.B.; Yin, Y.; Zeng, H. Afforestation in China Cools Local Land Surface Temperature. Proc. Natl. Acad. Sci. USA 2014, 111, 2915–2919. [Google Scholar] [CrossRef] [PubMed]
- Hua, F.; Bruijnzeel, L.A.; Meli, P.; Martin, P.A.; Zhang, J.; Nakagawa, S.; Miao, X.; Wang, W.; McEvoy, C.; Peña-Arancibia, J.L.; et al. The Biodiversity and Ecosystem Service Contributions and Trade-Offs of Forest Restoration Approaches. Science 2022, 376, 839–844. [Google Scholar] [CrossRef]
- Veldman, J.W.; Overbeck, G.E.; Negreiros, D.; Mahy, G.; Le Stradic, S.; Fernandes, G.W.; Durigan, G.; Buisson, E.; Putz, F.E.; Bond, W.J. Where Tree Planting and Forest Expansion Are Bad for Biodiversity and Ecosystem Services. BioScience 2015, 65, 1011–1018. [Google Scholar] [CrossRef]
Disclaimer/Publisher’s Note: The statements, opinions and data contained in all publications are solely those of the individual author(s) and contributor(s) and not of MDPI and/or the editor(s). MDPI and/or the editor(s) disclaim responsibility for any injury to people or property resulting from any ideas, methods, instructions or products referred to in the content. |
© 2024 by the authors. Licensee MDPI, Basel, Switzerland. This article is an open access article distributed under the terms and conditions of the Creative Commons Attribution (CC BY) license (https://creativecommons.org/licenses/by/4.0/).


