Article

Effect of Albedo Footprint Size on Relationships between Measured Albedo and Forest Attributes for Small Forest Plots

Faculty of Environmental Sciences and Natural Resource Management, Norwegian University of Life Sciences, P.O. Box 5003, 1432 Ås, Norway
*
Author to whom correspondence should be addressed.
Remote Sens. 2024, 16(16), 3085; https://doi.org/10.3390/rs16163085
Submission received: 13 June 2024 / Revised: 14 August 2024 / Accepted: 20 August 2024 / Published: 21 August 2024
(This article belongs to the Special Issue Remote Sensing of Solar Radiation Absorbed by Land Surfaces)

Abstract

:
The albedo of boreal forests depends on the properties of the forest and is a key parameter for understanding the climate impact of forest management practices at high northern latitudes. While high-resolution albedo retrievals from satellites remain challenging, unmanned aerial vehicles (UAVs) offer the ability to obtain albedo corresponding to the typical size of forest stands or even smaller areas, such as forest plots. Plots and pixels of sizes in the typical range of 200–400 m2 are used as the basic units in forest management in the Nordic countries. In this study, the aim was to evaluate the effect of the differences in the footprint size of the measured albedo and fixed-area forest plots on the relationship between albedo and forest attributes. This was performed by examining the correlation between albedo and field-measured forest attributes and metrics derived from airborne laser scanner data using linear regression models. The albedo was measured by a UAV above 400 m2, circular forest plots (n = 128) for seven different flight heights above the top of the canopy. The flight heights were chosen so the plots were always smaller than the footprint of the measured albedo, and the area of a forest plot constituted 30–90% of the measured albedo. The applied pyranometer aboard the UAV measured the albedo according to a cosine response across the footprint. We found the strongest correlation when there was the greatest correspondence between the spatial size of the albedo footprint and the size of the forest plots, i.e., when the target area constituted 80–90% of the measured albedo. The measured albedo of the plots in both regeneration forests and mature forests were highly sensitive (p-values ≤ 0.001) to the footprint size, with a mean albedo difference of 11% between the smallest and largest footprints. The mean albedo of regeneration forests was 33% larger than that of mature forests for footprint sizes corresponding to 90%. The study demonstrates the importance of corresponding spatial sizes of albedo measurements and the target areas subject to measurements.

1. Introduction

The albedo of the Earth’s surface determines the amount of the absorbed solar radiation in the shortwave broadband range. In vegetated regions, the albedo affects both biogeophysical, physiological, and biogeochemical processes through the control of radiation absorption [1,2,3]. Over the last decade, several studies have examined the relationship between boreal forest albedo, tree structure, and other forest characteristics. These relationships are particularly evident in the wintertime with the presence of snow, but they also exist during summer. The albedo of boreal forests has, for example, been found to decrease with increasing tree height [4,5], increasing biomass [6,7], increasing canopy cover [4,8], increasing age [8,9], and increasing/decreasing fractions of coniferous/deciduous tree species [4,10]. This knowledge is vital for climate mitigation policies of boreal forests. However, to inform practical forest management, it is required that the albedo is retrieved at a spatial scale similar to the typical size of boreal forest stands or high-resolution pixels due to the patchiness and fine spatial variability of many boreal forests.
Several albedo products are currently available. However, most of them have spatial resolutions ranging from approximately 0.25 to 20 km [11]. Of particular importance is the Moderate Resolution Imaging Spectroradiometer (MODIS) product. This product provides daily surface albedo at a grid resolution of 500 m [12]. A spatial resolution at this scale is meaningful for the purpose of global climate modeling, but the coarse resolution is a limiting factor in applications for which fine spatial albedo information is required [13]. Moderate resolution satellite imagery collected by, e.g., the Landsat 8 and Sentinel 2 satellite sensors enable the collection of fine spatial albedo information. However, the concurrent application of the bidirectional reflectance distribution function [14,15,16], which is required to account for the land surface’s anisotropic reflectance, is methodologically challenging and only directly operational for MODIS reflectance imagery. This means that there are no existing sources that regularly provide albedo information at spatial scales similar to the typical sizes of boreal forest plots and stands.
More recent studies have explored the usage of unmanned aerial vehicles (UAVs) to provide fine spatial albedo information for forest regions [17,18,19,20]. UAVs enable measurements with high-temporal resolutions in remote areas and over larger spatial extents, as opposed to fixed radiation towers. Additionally, UAV albedo offers “ground-truth” data. Such data are essential for validating the continuous development of moderate satellite albedo products and for improving satellite retrieval algorithms [21,22]. Intercomparisons of satellite albedo with radiation measurements are still few in numbers. A comparison of MODIS albedo with in situ measured albedo at 53 flux sites worldwide found a coefficient of determination of 0.82 [13]. The deviations were correlated with spatial heterogeneity. This demonstrates the limitations of coarse-resolution satellite albedo products over heterogeneous land surfaces and therefore the importance of using algorithms that account for the within-pixel surface heterogeneity of the satellite products. The use of UAV-mounted pyranometers can be useful to provide the albedo of the typical size of boreal forest stands or forest plots. However, this requires a careful consideration of the footprint size of the measured albedo in relation to the size of the forest area.
To improve the understanding of climate impact from forest management in boreal forests, detailed knowledge of the relationships between albedo and forest properties is needed. High-resolution albedo retrievals are required because of the typical fine spatial variability of boreal forest stands. However, to date, no study has highlighted the potential consequences of the non-corresponding spatial sizes of the albedo and target areas subject to the measurements. To address this, our study aimed to evaluate the effect of differences in the footprint size of the measured albedo and fixed-area forest plots on the relationship between albedo and forest attributes. This was performed by examining the correlation between albedo and field-measured forest attributes and metrics derived from airborne laser scanner (ALS) data. The albedo data consisted of UAV measurements for seven different footprint sizes for 128 plots of size 400 m2 in boreal forest stands in Norway. The plot size of 400 m2 was chosen as it corresponds to a typical size of ~200–400 m2 being used in regional [23] and nation-wide [24] forest mapping in the Nordic countries. The flight heights were chosen so the plots were always smaller than the footprint of the measured albedo. The plots constituted 30–90% of the measured albedo.

2. Materials and Methods

2.1. Study Area

This study was conducted in Våler Municipality (59°30’N, 10°55’E, 20–120 m above sea level), southeastern Norway, within a boreal forest area spanning approximately 850 ha (Figure 1). The dominant tree species are Norway spruce (Picea abies (L.) Karst) and Scots pine (Pinus sylvestris L.), but birch (Betula pubescens Ehrh.) is frequently found in mix with the confer species or as main species in smaller stands.
The study area, subject to scientific studies since 1995, has been a focal point for various research endeavors, particularly in developing methods for forest inventories using ALS data [25,26,27]. A total of 178 forest plots, distributed systematically according to a regular grid across the forested area, formed the core dataset for previous studies. For the current study, with field inventory conducted in 2022, a subsample of 128 plots (Figure 1) was selected to ensure representation across various forest conditions and feasibility for obtaining UAV albedo data.
Figure 1. (a) Location of the study area in southeastern Norway (black square); (b) the dots (n = 178) illustrate the systematic design of the forest plots from 1998 [26] and for which field data were collected in 2022. The colored dots (n = 128, excluding the black ones) constitute the material of the current study. Blue dots (n = 83) correspond to fixed-area forest plots with albedo measurements for all seven footprint sizes (see Section 2.4.2), while orange dots (n = 45) illustrate forest plots with albedo measurements for only some of the footprint sizes. The green areas are classified as forest according to the official N50 topographic map series.
Remotesensing 16 03085 g001

2.2. Field Data

The field data were collected on plots in two distinct forest types: regeneration forests and mature forests, for which different field protocols were applied. Regeneration forests were identified based on age and forest productivity (expressed by site index). The plots in mature forests were circular with a radius of 11.28 m (400 m2). For the regeneration plots, a sample of four circular sub-plots with radii of 3.57 m (40 m2) for recording of small trees were established within the 400 m2 plot (see [25]). Large individual trees were recorded for the entire 400 m2 plot, see details below. All plots were established during previous field campaigns, and the center points of the plots and sub-plots were precisely positioned using survey-grade global navigation satellite system receivers and differential post-processing using data from a base station. Among the 128 plots used in the current study (Figure 1), 86 plots were in mature forests, while 32 plots were in regeneration forests. In addition, 10 of the plots were a mix of both. Details on field measurements and calculations are presented in the following subsections. A summary of the data is provided in Table 1.

2.2.1. Tree Measurements

In the mature forest plots, all trees with a diameter at breast height (DBH) ≥ 4 cm were measured for DBH, and status (alive/dead), tree species, and distance and azimuth relative to the plot center were measured and recorded digitally. Height was measured for an average of 10 trees per plot using a Vertex V hypsometer (Vertex 5, Haglöf, Långsele, Sweden).
Within each of the four sub-plots in regeneration forests, trees with height ≥ 0.1 m were counted and measured for height in two distinct categories: all trees and tending trees. Tending trees comprised trees that would be retained after a precommercial thinning or tending. Species-wise counts (spruce, pine, deciduous) were performed for both categories of trees. While the counts were exhaustive for each sub-plot, height measurements were only taken on sample trees. Seed trees or larger trees retained for biodiversity purposes within the entire 400 m2 plot were even measured for DBH.

2.2.2. Estimation of Biomass and Volume

Several variables were calculated for the mature forest plots. Stand basal area was obtained by summing the individual tree basal areas from the DBH measurements and scaled to m2 ha−1. The number of stems per hectare was calculated from the number of calipered trees.
Volume per hectare was calculated using a ratio estimator with the height sample tree measurements. First, a standardized tree height was computed for all trees on the plot using stand height curves [28]. Second, a corresponding standardized volume (sv) was calculated using the species-wise volume models for spruce [29], pine [30], and deciduous species [31]. Third, field reference volumes (fv) were calculated for each height sample tree (i) using the field-measured tree height. Fourth, plot- and species-wise ratio estimators (kmj) for the proportional difference between fv and sv were obtained for each plot as
k m j = 1 n m j i = 1 n m j f v i m j s v i m j
where nmj is the number of height sample trees on plot m for species j. Finally, to obtain volume predictions ( v ^ ) for each tree (both caliper trees and height sample trees) on the plot, the appropriate k was multiplied to their respective sv, and total volume (V) per plot was obtained as the sum of all v ^ . Then, predicted single tree heights were obtained utilizing the above-mentioned volume models using measured DBH and v ^ as input and solving it for tree height. Above ground biomass (AGB) per hectare for each plot was obtained by predicting biomass for each single tree using models [32] with DBH and predicted height as input and then summing the single tree biomass predictions and scaling the sum to Mg ha−1.
For the regeneration forests, plot stem numbers per hectare and mean heights were calculated for both all trees and tending trees. AGB was predicted using the mean height of all trees as input in a biomass model [33] to obtain a mean tree biomass which was multiplied by the number of stems of all trees and scaled to Mg ha−1. If there were seed trees registered on the plot, AGB was predicted separately for seed trees [32] and added to the AGB of the smaller trees.

2.2.3. Estimation of Site Productivity

Forest site productivity refers to the wood production capacity, which typically relates to different types of understory vegetation [34]. Accordingly, we estimated site productivity as a proxy variable to assess the effect of different dominant understory vegetation on the albedo. The estimation was performed plot wise for mature forests only using prediction models developed by regressions analysis [35] based on the mean height and age of dominant trees, i.e., those trees identified with largest DBH belonging to the dominant tree species. Tree height and age were measured for the four and two dominant trees at each plot, respectively, in 2013. In 2022, heights were remeasured for the relocated dominant trees, while age was calculated based on the measurements from 2013.

2.2.4. Estimation of Complexity Indices

The size distribution of the trees in each plot was represented by the Gini index [36], which was calculated using individual tree basal area according to the formulation found in [37]. The species distribution was represented by the Shannon diversity index [38]. This was calculated both species-wise using the proportions of each species (spruce, pine, birch, aspen, willow, or other deciduous) and by species group (spruce, pine, deciduous) according to the formulation found in [37]. As a quantitative measure of the degree of aggregation or dispersion among the trees, the Clark–Evans aggregation index [39] was calculated based on the local coordinates of the trees on each plot. It was calculated from the vector of nearest neighbor distances and the size of the plot according to the formulation found in [40].

2.3. ALS Data

The ALS data were collected on 6 July 2022 using a fixed-wing aircraft with a Riegl VQ1560II-S scanner. Flight altitude for the current ALS data acquisition was 3500 m above ground level, pulse frequency for each channel were 500 kHz, scanning frequency 83 Hz, half scan angle 16°, and pulse density 2.2 m−2. Prior to calculating ALS forest metrics, echoes were normalized and overlapping zones between adjacent strips were discarded. For each plot, ALS canopy metrics were calculated based on first and single return echoes within a circular area of 400 m2 around the plot center. Height metrics describing the distribution of laser echoes, such as maximum height, height deciles (10–90%), standard deviation (Hstd), coefficient of variation, kurtosis, and skewness of the height distribution were calculated with a threshold height of 0.5 m, cf. [41]. Canopy density was expressed by the first echo cover index [42]. This metric served as a bias-corrected vertical canopy cover proxy.

2.4. UAV Albedo

2.4.1. UAV Platform

The UAV platform consisted of a DJI Matrice 300 RTK quadcopter with a DJI Controller Cendence connected to a DJI CrystalSky monitor. The UAV has an advanced flight controller system, consisting of a six directional sensing and positioning system and a first-person-view camera. With the real-time kinematic system enabled and fixed, the hovering accuracy was 0.10 m and 0.15 m in the horizontal and vertical directions, respectively. To measure the incoming and reflected shortwave radiation, an upward-looking pyranometer (SP 510 SS, Apogee Instruments, Logan, UT, USA) and downward-looking pyranometer (SP 610 SS, Apogee Instruments, USA) were mounted on the UAV (Figure 2). Both pyranometers are second-class (also known as class C) sensors, with a detector response time of 0.5 s and measures the radiation in a cosine response. The upward-looking pyranometer was mounted on top of the UAV by a special-built mounting bracket, while a three-axis gimbal (PIXY U, Gremsy, Ho Chi Minh City, Vietnam) was used to attach the downward-looking pyranometer to the UAV. The incoming shortwave radiation was measured over the whole uppermost hemispherical view in the spectral range of 385–2105 nm. The reflected radiation was measured over a 150° field of view in the spectral ranges of 295–2685 nm. The gimbal ensured an absolute horizontal leveling of the downward-looking pyranometer. Both pyranometers were connected to separate Bluetooth loggers (AT 100 microCache, Apogee, Logan, UT, USA), for which the sampling and logging frequencies were set to 1 Hz. The radiation data were downloaded via the Apogee Connect app.

2.4.2. Flight Description

Flights were organized and monitored using the DJI Pilot app (v4.0.1). This software facilitates preprogrammed autonomous mission flights that can be controlled manually at any time during the flight mission. For each forest plot, a flight mission was preprogrammed as a waypoint based on latitudinal and longitudinal position and with hovering height for seven different heights above the forest canopy. The latter was performed to allow for different footprint sizes of the measured albedo. Following the derivation of [19], it can be shown that the footprint of the measured albedo is controlled by the UAV flight height above the forest canopy ( h U A V ) for a fixed-area forest plot of radius r by
h U A V = r   t a n [ sin 1 (   f 100 × sin 75 ° ) ]
where 75° represents half of the field-of-view of the downward-looking pyranometer. f is defined as the proportion (%) a fixed-area forest plot constitutes of the measured albedo. In the current study, f ranged from 30 to 90%, as given in Table 2 and illustrated in Figure 3. The UAV hoovered for 1 min at each flight height, starting at the uppermost before descending to the next. This procedure ensured safe operation of the UAV and avoided potential collisions with any trees. The maximum height of the recorded tallest tree at each forest plot was used as the reference height to pre-program the UAV flight heights for each flight mission. Accordingly, we assumed uniform tree heights within the fixed-area forest plots. A footprint size corresponding to measured albedo of 100%, i.e., similar spatial sizes of measured albedo and the fixed-area forest plots, corresponded to flight height of only 3 m above the forest canopy. Since there was no guaranty that the reference tree height used to pre-program the UAV flight heights was the tallest tree for each forest plot (c.f., Section 2.2), albedo measurements corresponding to 100% of the fixed-area forest plots were omitted for safety reasons. However, if albedo was to be measured with an identical footprint size as the fixed-area forest plots, 90% of the reflected radiation would have come from only 22% of the centermost part of the forest plots.

2.4.3. Flight Campaign

Albedo data were collected during a field campaign in June–August 2022. To minimize the cosine response error of the pyranometers, the diurnal effect of the sun’s position, and the effect of clouds on the albedo [43], most flight missions were performed around solar noon on days with clear sky. However, due to the high northern latitude of the study site, both diurnal and seasonal variation of the solar zenith angle was unavoidable. The solar zenith angle varied between 36° and 64° during the field campaign, with a mean value of 48°. Some of the flight missions were interrupted manually due to warnings appearing on the DJI Pilot app (v4.0.1) caused by tall trees detected as potential obstacles. In some cases, the UAV pilot also visually detected trees that conflicted with the flight missions, and therefore, the preprogramed flight missions were manually interrupted.

2.4.4. Processing of UAV Data

Flight logs from the UAV and shortwave radiation data were collected on different logging systems. Since they were not synchronized, the radiation data were recorded continuously from start to end of a measurement day, without any segmentation for the different waypoints or UAV measurement heights. Accordingly, a segmentation process was performed to extract the relevant radiation observations. First, binary flight logs were downloaded from the UAV and decrypted using DJI’s software FlightReader (https://www.flightreader.com accessed on 20 October 2022). Second, each flight log was processed by (1) detecting potential observation periods for which the UAV velocity was below a certain threshold, by (2) filtering out observation periods shorter than 15 s, and by (3) filtering out observation periods with a high standard deviation of position. Third, KML files which contained the planned flight missions were compared to the processed flight logs. If a sequence of UAV positions were found to all be close to the waypoints’ latitudinal and longitudinal position and the ellipsoidal heights of the KLM file (horizontal position < 0.1 m), the measurement period was accepted. Finally, incoming and reflected shortwave radiation were extracted based on the date and time of the measurement period. If any errors occurred during the segmentation process, a manual inspection was conducted.
For each extracted 1 min measurement series of incoming and reflected radiation, the first 5 s of observations were removed. This was performed to allow for stabilization of the pyranometer measurements. Albedo data were then calculated for each plot and for each of the seven different footprint sizes by diving the median reflected radiation with the median incoming radiation. In this way, the influence of any outliers was reduced. Even though flight missions were performed during days with mostly stable atmospheric conditions and clear sky, a manual inspection of the albedo data revealed some shifting illumination conditions for some of the plots. Accordingly, for plots for which the standard deviation of the incoming shortwave radiation exceeded 100 Wm−2, a manual filtering was performed. The final dataset consisted of 773 albedo measures. A total of 83 of the 128 plots had albedo measurements for all seven footprint sizes (see also Figure 1).

2.5. Statistical Analysis

Linear regression models (LMs) were fitted for each of the different footprint sizes of measured albedo to assess the relationships between albedo and forest attributes (see, e.g., [8]). The LMs were fitted with the albedo as response variable and one forest attribute at a time as predictor variable using the R software [44]. The forest attributes included in the analysis were field-based volume, biomass, basal area, number of stems, mean height, and site productivity (see Section 2.2), and ALS-derived canopy density and height metrics (see Section 2.3). The models were fitted for (1) the whole dataset, (2) mature forests separately, and (3) regeneration forests separately. LMs based on field data were fitted for all species, with species-specific (spruce, pine, deciduous) predictors, and with the combination of site productivity- and species-specific predictors. For LMs with species-specific predictors, the proportion of each forest metric was used instead of the species-specific forest metric itself. When ALS data were used, only LMs for all species were fitted. The impact of complexity indices on the albedo was assessed by adding the complexity indices, one at a time, into models with basal area, volume, number of stems, and biomass as predictor variables.
The model performance of all LMs was evaluated based on the adjusted coefficient of determination ( R a 2 ) and the root mean square error (RMSE). R a 2 reduces the tendency of upward bias for small samples [45]. Thus, we minimized the chance that potential differences in R a 2 between the different footprint sizes were caused by different number of available observations (cf. Section 2.4.3 and Section 2.4.4). Additionally, by using R a 2 , we assured that potential differences between the different sets of LMs (i.e., when site productivity and complexity indices were included) were caused by the explanatory power and not the increase in additional explanatory variables.
Linear mixed effects models (LMMs) were applied with the restricted maximum likelihood (REML) [46] in the lme4 package [47] to assess the statistical significance of the footprint sizes. This was performed by including plot as random effect to account for the within-plot dependency among albedo observations. Separate models were fitted for mature forests and regeneration forests. We used the Satterthwaite approximation [48] for evaluating the significance of the fixed effect (i.e., the impact of different footprint sizes). This approximation has been found to be the most suitable with Type 1 error rates close to 0.05 when using REML in the LMMs, even for smaller samples [49].

3. Results

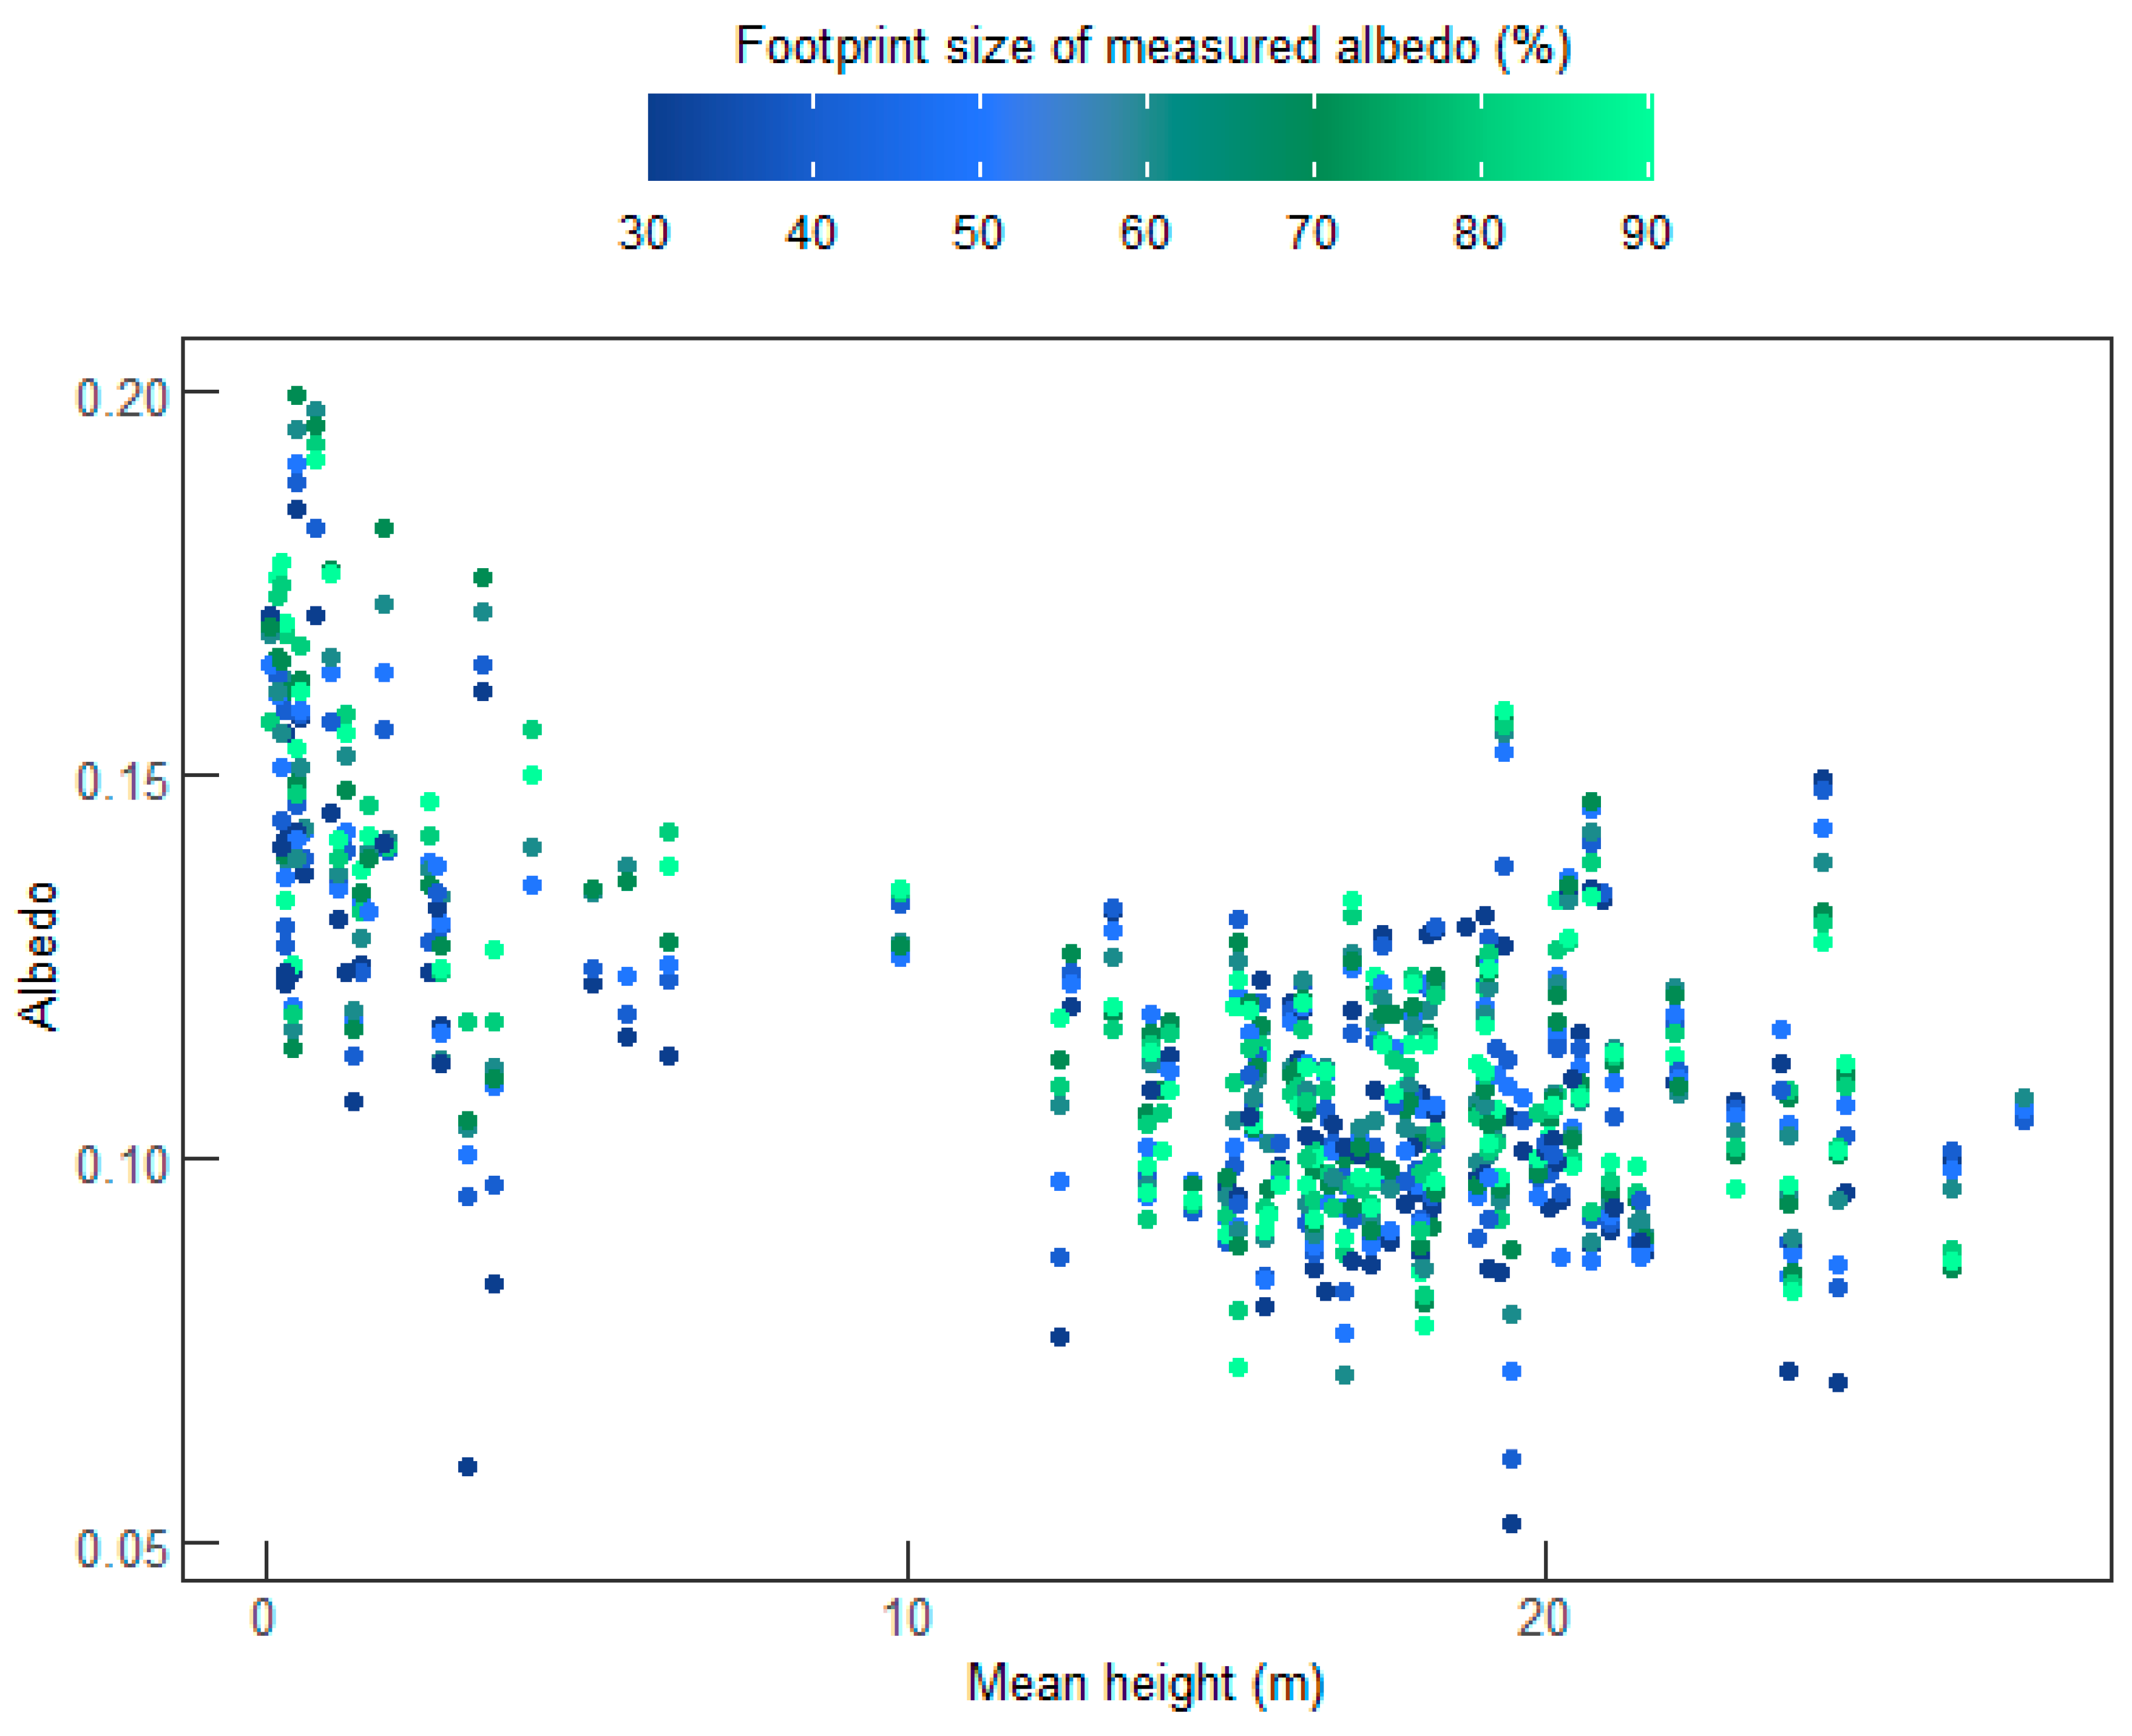
3.1. Impact of Footprint Size of Measured Albedo on Correlation with Field Measured Forest Attributes

Based on the whole dataset, i.e., both mature and regeneration forests, the correlation between species-specific forest attributes from the field data and albedo systematically increased when the deviation in spatial sizes between the fixed-area forest plot and the albedo footprint decreased (Figure 4). However, the improvement in R a 2 was found to be minimal for the number of stems per ha and decreased marginally by 0.01 for biomass when the size of the measured albedo footprint was changed from 80 to 90%. For LMs fitted for all species, the correlation between forest attributes from the field data and albedo was considerably weaker than for that of species-specific LMs (Figure 4). LMs fitted for mature forest only revealed a similar strong dependency on the footprint size for species-specific forest attributes from the field data (Table 3), which was found for the whole dataset. In the absence of species-specific information, there was no impact on the correlation between the albedo and forest attributes of mature forest for the different footprint sizes of the measured albedo (Table 3).
The spread of the measured albedo for different footprint sizes of the measured albedo against the mean height is shown in Figure 5. The mean difference in the albedo values between the smallest and largest albedo footprints was 9% for mature forests. For regeneration forests, the corresponding mean difference was 12%. However, there was no impact of footprint size of the measured albedo on the correlation between the albedo and forest attributes for regeneration forests. Moreover, there was no impact of species-specific information on the correlation between the albedo and forest attributes for regeneration forests. LMM fitted for regeneration forests revealed a statistically significant effect (p-value < 0.001) of the footprint size of the measured albedo. For mature forests, the corresponding p-value was 0.001. The mean albedo of regeneration forests was 33% and 22% larger than that of mature forests for footprint sizes corresponding to 90% and 30%, respectively.
The correlation between the albedo and forest attributes from the field data for LMs fitted for all species increased by ~0.1 when the Shannon diversity index was included in the modeling. The effect was only revealed when the plot area accounted for 80–90% of the footprint of the measured albedo. Apart from that, none of the complexity indices had any effect on R a 2 of the LMs.

3.2. Impact of Footprint Size of Measured Albedo on Correlation with Als-Derived Metrics

Maximum height, canopy density, and Hstd were the most strongly correlated with albedo among the ALS-derived metrics. The following results are therefore based on these metrics only. Furthermore, since no explicit species-specific information was available from the ALS data, the results reported here were based on all species. The correlation between the albedo and attributes from the ALS data systematically increased when the deviation in spatial sizes between the fixed-area forest plot and the albedo footprints decreased (Figure 6). However, the strongest correlation was found when the fixed-area forest plots constituted 80% of the footprint size of the measured albedo. LMs fitted for Hstd had a considerably smaller R a 2 and larger RMSE for all albedo footprint sizes than for maximum height and canopy density. Nevertheless, the albedo for all different footprint sizes were significantly correlated to Hstd (p-value < 0.001). Even though the maximum height and canopy density from ALS were not derived separately for spruce, pine, and deciduous tree species, the magnitude of R a 2 was similar to those found in the species-specific field data.

4. Discussion

The correlation between the albedo and biomass, volume, basal area, and number of stems for mature forests had an average increase of 0.33 when species-specific information was included (Table 3) in the modeling (for footprint sizes of measured albedo corresponding to 90%). This was in line with previous results [4], which found that tree species-specific information for volume, height, and basal area improved the correlation by almost 0.2 for Landsat albedo. The same study revealed that accounting for the understory composition by including the site fertility increased R a 2 by only 0.03 [4], which is similar to our results (Table 3). The impact of species-specific information on the performance of LMs illustrates the influence of tree species on boreal forest summertime albedo. This coincides well with previous findings [4,7,10]. Our results demonstrate that the relationship between forest attributes and albedo in mature forests is unaffected by the footprint sizes of the measured albedo if species-specific information is not included in the modeling.
The correlation between the albedo and forest attributes from the field data found for footprint sizes of 80% and 90% was systematically stronger than those found for MODIS albedo across European boreal forests [8], but was somewhat smaller than those found for Landsat albedo [4]. It should be emphasized that the relationship for Landsat albedo was assessed using more sophisticated models [4]. Additionally, this study found that the largest variation in albedo was related to the early stage of the forest succession [4]. From satellite retrievals, it has been shown that the boreal forest albedo has the sharpest decrease for small biomass values [6] when tree heights are < 10 m, and that albedo saturates for volume values around 200 m3 ha−1 [4]. Similar trends were found in our study (e.g., Figure 5).
There was no correlation between the species-specific forest attributes and albedo for regeneration forests. This was explained by the large albedo for young forests and was in line with former results [4,9,50]. Even though the correlation between the albedo and forest attributes of regeneration forests was unaffected by the footprint size, the LMM revealed a statistically significant effect of the footprint sizes of the measured albedo. We also found a larger relative difference in the albedo for regeneration forests than that of mature forests when comparing the smallest and largest footprint sizes. These findings were as expected.
Hstd is a height dispersion variable, for which forest plots with large Hstd consist of tall trees with canopy biological matter distributed across a large part of the vertical extent of the trees. Besides the spectral properties of needles, leaves, branches, stems, and understory vegetation, which are known to have a strong impact on boreal forest reflectance [51,52], the three-dimensional distribution of biological matter also impacts albedo. It has been shown that trees with a high degree of hierarchical clumped structures, such as spruce, increase the chances of photons being trapped within shoots and crowns [53]. For taller forests, with a more complex vertical distribution of the canopy elements over a large vertical extent of the trees, the probability of multiple internal reflection increases. This contributes to reducing the albedo by enhancing absorption of solar radiation. This effect was indicated in our study by the statistically significant influence of Hstd on the albedo.
The Shannon diversity index, which characterizes the tree species distribution, was found to impact the correlation between the albedo and forest attributes only for LMs without species-specific information. Apart from that, none of the complexity indices had any effect on the R a 2 of the LMs. Theoretically, the complexity of sunlit and shaded canopy elements increases for forest stands with a large variation of tree heights and canopy densities across the stand area. Accordingly, one should expect that the distribution of tree sizes and tree aggregation impact the albedo. However, we did not find any evidence of these effects in our study. To examine this further, a controlled study design with monospecific stands is probably required. It has been reported that the light environment (i.e., sunlit/shaded) had relatively small influence on reflectance properties for boreal tree species when based on spectral measurements for needles and leaves [52]. This might explain why the albedo reported in our study was unaffected by the tree aggregation and tree size distribution, although the measurement procedure in the referenced study was not similar to ours.
The maximum height of the tallest tree in each fixed-area forest plot was used as the reference height to pre-program the UAV flight heights in each flight mission. Thus, the different footprint sizes of the measured albedo were derived according to the maximum tree heights. This approach assumed uniform tree heights within the fixed-area forest plots, which was not the case. For those plots with one dominant tree or a few dominant trees with noticeably larger heights than the rest of the trees within the plot, the footprint sizes of the measured albedo were larger than those computed in Table 2. Accordingly, it should be expected that between-plot variability in the footprint sizes of the measured albedo was present in the data. The deviation between the actual footprint sizes and that computed in Table 2 had the largest impact on the smallest spatial sizes of the measured albedo, i.e., when the fixed-area forest plots constituted 90% of the measured albedo. This was due to the cosine response of the pyranometers. Additionally, the method to obtain the tallest tree within a fixed-area forest plot differed between mature and regeneration forests, which may have introduced additional between-plot variability in the analyzed footprint sizes. For a full analysis of potential differences in footprints between the different forest plots, further research should apply ground corrections to account for both differences in tree heights and topography. This will provide valuable information on how tree height variation affects the footprints of the measured albedo, and the degree to which the assumption of uniform, circular albedo footprints deviates from reality. Moreover, additional studies assessing the effect of the differences in the footprint size of the measured albedo and target areas of other spatial sizes and land surfaces than 400 m2 forest plots will be important for the further generalization and strengthening of our results.
Theoretically, even stronger relationships between the UAV albedo and the forest attributes should be expected if the fixed-area forest plots constituted 100% of the measured albedo. A few former studies have collected UAV albedo for forest regions, but none have examined the impact of different footprint sizes on the correlation with forest attributes. Nevertheless, a study measuring the albedo of seven forest plots, for which the forest plots constituted 95% of the measured albedo, discussed the potential bias in the observations due to the small footprint sizes of the measured albedo [10]. In this study, the pyranometer was located only 4 m above the forest canopy. If the albedo was to be measured with an identical footprint size as the fixed-area forest plots in our study, 90% of the reflected radiation would have come from only 22% of the centermost part of the forest plots. Additionally, for lower flight heights above the canopy, the chances of taller trees interfering the albedo by blocking the reflected radiation from smaller trees in the periphery of the forest plot would increase. Hence, the precision of the measured albedo is a tradeoff between the footprint size and weighted representation of the trees within the forest plot. Since no former studies have provided the type of data as presented here, there are no other results that might serve as basis for comparison. However, as revealed in our study, correlations between the forest attributes and albedo were notably strengthened when considering the spatial sizes of MODIS pixels and the area for which the forest attributes were aggregated [8]. Together with our results, this emphasizes the importance of awareness of the footprint size of the albedo when measured for fixed-area forest plots.

5. Conclusions

This study has demonstrated the impact of footprint size on relationships between the measured albedo and forest attributes for small forest plots. Accurate relationships between the albedo and forest attributes derived from field and/or ALS data are important for establishing links between forest management and its climate impact. Our results showed the strongest correlation between albedo and forest attributes when there was the greatest correspondence between the spatial size of the albedo footprint and the size of the forest plots, i.e., when the target area constituted 80–90% of the measured albedo. This demonstrates the importance of obtaining albedo with a spatial size corresponding to the target area of interest, which substantiates earlier findings stressing the relevance of improving the spatial resolution of satellite data for albedo retrievals. To develop and establish operational moderate-resolution satellite albedo products for forest management purposes, “ground-truth” albedo measurements are needed to assess their performance. Our dataset can serve this purpose. The demonstrated importance of the footprint size of the measured albedo for boreal forests will apply to all types of land surfaces where albedo is to be obtained.

Author Contributions

Conceptualization, E.N.R.; data curation, E.N.R., H.O.Ø. and O.M.B.; methodology, E.N.R.; formal analysis, E.N.R.; writing—original draft preparation, E.N.R.; writing—review and editing, H.O.Ø., O.M.B., E.N. and T.G.; supervision, T.G.; project administration, T.G.; resources, E.N. All authors have read and agreed to the published version of the manuscript.

Funding

This research was funded by the Research Council of Norway (Project #302701: “Climate Smart Forestry Norway”).

Data Availability Statement

The data are available from the corresponding author on reasonable request. The data are not publicly available due to the privacy of the private landowners.

Acknowledgments

We would like to thank Irmina Walker Ørka, who spent the summer as UAV pilot to collect the albedo data. Moreover, we are grateful to Bjørn-Eirik Roald for processing the UAV albedo data.

Conflicts of Interest

The authors declare no conflicts of interest. The funders had no role in the design of the study; in the collection, analyses, or interpretation of data; in the writing of the manuscript; or in the decision to publish the results.

References

  1. Wang, S.; Trishchenko, A.P.; Sun, X. Simulation of canopy radiation transfer and surface albedo in the EALCO model. Clim. Dyn. 2007, 29, 615–632. [Google Scholar] [CrossRef]
  2. Wang, S.; Grant, R.F.; Verseghy, D.L.; Black, T.A. Modelling carbon-coupled energy water dynamics of boreal forest in a general circulation model land surface scheme. Int. J. Climatol. 2002, 20, 1249–1265. [Google Scholar] [CrossRef]
  3. Shen, X.; Liu, Y.; Liu, B.; Zhang, J.; Wang, L.; Lu, X.; Jiang, M. Effect of shrub encroachment on land surface temperature in semi-arid areas of temperate regions of the Northern Hemisphere. Agric. For. Meteorol. 2022, 320, 108943. [Google Scholar] [CrossRef]
  4. Kuusinen, N.; Stenberg, P.; Korhonen, L.; Rautiainen, M.; Tomppo, E. Structural factors driving boreal forest albedo in Finland. Remote Sens. Environ. 2016, 175, 43–51. [Google Scholar] [CrossRef]
  5. Ramtvedt, E.N.; Bollandsås, O.M.; Næsset, E.; Gobakken, T. Relationships between single-tree mountain birch summertime albedo and vegetation properties. Agric. For. Meteorol. 2021, 307, 108470. [Google Scholar] [CrossRef]
  6. Lukeš, P.; Stenberg, P.; Rautiainen, M. Relationship between forest density and albedo in the boreal zone. Ecol. Modell. 2013, 261–262, 74–79. [Google Scholar] [CrossRef]
  7. Lukeš, P.; Rautiainen, M.; Manninen, T.; Stenberg, P.; Mõttus, M. Geographical gradients in boreal forest albedo and structure in Finland. Remote Sens. Environ. 2014, 152, 526–535. [Google Scholar] [CrossRef]
  8. Hovi, A.; Lindberg, E.; Lang, M.; Arumäe, T.; Peuhkurinen, J.; Sirparanta, S.; Pyankov, S.; Rautiainen, M. Seasonal dynamics of albedo across European boreal forests: Analysis of MODIS albedo and structural metrics from airborne LiDAR. Remote Sens. Environ. 2019, 224, 365–381. [Google Scholar] [CrossRef]
  9. Kuusinen, N.; Tomppo, E.; Shuai, Y.; Berninger, F. Effects of forest age on albedo in boreal forests estimated from MODIS and Landsat albedo retrievals. Remote Sens. Environ. 2014, 145, 145–153. [Google Scholar] [CrossRef]
  10. Kuusinen, N.; Lukeš, P.; Stenberg, P.; Levula, J.; Nikinmaa, E.; Berninger, F. Measured and modelled albedos in Finnish boreal forest stands of different species, structure and understory. Ecol. Modell. 2014, 284, 10–18. [Google Scholar] [CrossRef]
  11. Qu, Y.; Liang, S.; Liu, Q.; He, T.; Liu, S.; Li, X. Mapping surface broadband albedo from satellite observations: A review of literatures on algorithms and products. Remote Sens. 2015, 7, 990–1020. [Google Scholar] [CrossRef]
  12. Wang, Z.; Schaaf, C.B.; Sun, Q.; Shuai, Y.; Román, M.O. Capturing rapid land surface dynamics with Collection V006 MODIS BRDF/NBAR/Albedo (MCD43) products. Remote Sens. Environ. 2018, 207, 50–64. [Google Scholar] [CrossRef]
  13. Cescatti, A.; Marcolla, B.; Santhana Vannan, S.K.; Pan, J.Y.; Román, M.O.; Yang, X.; Ciais, P.; Cook, R.B.; Law, B.E.; Matteucci, G.; et al. Intercomparison of MODIS albedo retrievals and in situ measurements across the global FLUXNET network. Remote Sens. Environ. 2012, 121, 323–334. [Google Scholar] [CrossRef]
  14. Li, Z.; Erb, A.; Sun, Q.; Liu, Y.; Shuai, Y.; Wang, Z.; Boucher, P.; Schaaf, C. Preliminary assessment of 20-m surface albedo retrievals from sentinel-2A surface reflectance and MODIS/VIIRS surface anisotropy measures. Remote Sens. Environ. 2018, 217, 352–365. [Google Scholar] [CrossRef]
  15. Lin, X.; Wu, S.; Chen, B.; Lin, Z.; Yan, Z.; Chen, X.; Yin, G.; You, D.; Wen, J.; Liu, Q.; et al. Estimating 10-m land surface albedo from Sentinel-2 satellite observations using a direct estimation approach with Google Earth Engine. ISPRS J. Photo. Remote Sens. 2022, 194, 1–20. [Google Scholar] [CrossRef]
  16. Shuai, Y.; Masek, J.G.; Gao, F.; Schaaf, C.B. An algorithm for the retrieval of 30-m snow-free albedo from Landsat surface reflectance and MODIS BRDF. Remote Sens. Environ. 2011, 115, 2204–2216. [Google Scholar] [CrossRef]
  17. Canisius, F.; Wang, S.; Croft, H.; Leblanc, S.G.; Russell, H.A.; Chen, J.; Wang, R. A UAV-based sensor system for measuring land surface albedo: Tested over a boreal peatland ecosystem. Drones 2019, 3, 27. [Google Scholar] [CrossRef]
  18. Levy, C.; Burakowski, E.; Richardson, A. Novel Measurements of Fine-Scale Albedo: Using a Commercial Quadcopter to Measure Radiation Fluxes. Remote Sens. 2018, 10, 1303. [Google Scholar] [CrossRef]
  19. Ramtvedt, E.N.; Gobakken, T.; Næsset, E. Fine-Spatial Boreal–Alpine Single-Tree Albedo Measured by UAV: Experiences and Challenges. Remote Sens. 2022, 14, 1482. [Google Scholar] [CrossRef]
  20. Webster Cm Jonas, T. Influence of canopy shading and snow coverage on effective albedo in a snow-dominated evergreen needleleaf forest. Remote Sens. Environ. 2018, 214, 48–58. [Google Scholar] [CrossRef]
  21. Lellouch, G.; Carrer, D.; Vincent, C.; Pardé, M.C.; Frietas, S.; Trigo, I.F. Evaluation of two global land surface albedo datasets distributed by the copernicus climate change service and the EUMETSAT LSA-SAF. Remote Sens. 2020, 12, 1888. [Google Scholar] [CrossRef]
  22. Liang, S.; Fang, H.; Chen, M.; Shuey, C.J.; Walthall, C.; Daughtry, C.; Morisette, J.; Schaaf, C.; Strahler, A. Validating MODIS land surface reflectance and albedo products: Methods and preliminary results. Remote Sens. Environ. 2002, 83, 149–162. [Google Scholar] [CrossRef]
  23. Næsset, E. Accuracy of forest inventory using airborne laser-scanning: Evaluating the first Nordic full-scale operational project. Scand. J. For. Res. 2004, 19, 554–557. [Google Scholar] [CrossRef]
  24. Kangas, A.; Astrup, R.; Breidenbach, J.; Fridman, J.; Gobakken, T.; Korhonen, K.T.; Maltamo, M.; Nilsson, M.; Nord-Larsen, T.; Næsset, E.; et al. Remote sensing forest inventories in Nordic countries–roadmap for the future Scand. J. For. Res. 2018, 33, 397–412. [Google Scholar] [CrossRef]
  25. Næsset, E. Predicting forest stand characteristics with airborne scanning laser using a practical two-stage procedure and field data. Remote Sens. Environ. 2002, 80, 88–99. [Google Scholar] [CrossRef]
  26. Næsset, E.; Bjerknes, K.-O. Estimating tree heights and number of stems in young forest stands using airborne laser scanner data. Remote Sens. Environ. 2001, 78, 328–340. [Google Scholar] [CrossRef]
  27. Næsset, E.; Bollandsås, O.M.; Gobakken, T.; Gregoire, T.G.; Ståhl, G. Model-assisted estimation of change in forest biomass over an 11year period in a sample survey supported by airborne LiDAR: A case study with post-stratification to provide “activity data”. Remote Sens. Environ. 2013, 128, 299–314. [Google Scholar] [CrossRef]
  28. Fitje, A.; Vestjordet, E. Stand height curves and new tariff tables for Norway spruce. Meddelelser Nor. Inst. Skogforsk. 1977, 34, 23–68. [Google Scholar]
  29. Vestjordet, E. Functions and tables for volume of standing trees. Norway spruce. Meddelelser Nor. Skogforsøksvesen 1967, 22, 539–574. [Google Scholar]
  30. Brantseg, A. Volume functions and tables for Scots pine: South Norway. Meddelelser Nor. Skogforsøksvesen 1967, 22, 689–739. [Google Scholar]
  31. Braastad, H. Volume tables for birch. Meddelelser Nor. Skogforsøksvesen 1966, 21, 23–78. [Google Scholar]
  32. Marklund, L.G. Biomass functions for pine, spruce and birch in Sweden. Rapport. Swed. Univeristy Agric. Sci. 1988, 45, 1–73. [Google Scholar]
  33. Kolstad, A.L.; Austrheim, G.; Solberg, E.J.; Venete, A.M.; Woodin, S.J.; Speed, J.D. Cervid exclusion alters boreal forest properties with little cascading impacts on soils. Ecosystems 2018, 21, 1027–1041. [Google Scholar] [CrossRef]
  34. Nieppola, J.; Carleton, T. Relations between understorey vegetation, site productivity, and environmental factors in Pinus sylvestris L. stands in southern Finland. stands in southern Finland. Vegetatio 1991, 93, 57–72. [Google Scholar] [CrossRef]
  35. Sharma, R.P.; Brunner, A.; Eid, T.; Øyen, B.-H. Modelling dominant height growth from national forest inventory individual tree data with short time series and large age errors. For. Ecol. Manag. 2011, 262, 2162–2175. [Google Scholar] [CrossRef]
  36. Ceriani, L.; Verme, P. The origins of the Gini index: Extracts from Variabilità e Mutabilità (1912) by Corrado Gini. J. Econ. Inequal. 2012, 10, 421–443. [Google Scholar] [CrossRef]
  37. Lexerød, N.L.; Eid, T. An evaluation of different diameter diversity indices based on criteria related to forest management planning. For. Ecol. Manag. 2006, 222, 17–28. [Google Scholar] [CrossRef]
  38. Shannon, C.E. The mathematical theory of communication. In The Mathematical Theory of Communication; Shannon, C.E., Weaver, W., Eds.; University of Illinois Press: Urbana, IL, USA, 1948; pp. 29–125. [Google Scholar]
  39. Clark, P.J.; Evans, F.C. Distance to nearest neighbor as a measure of spatial relationships in populations. Ecology 1954, 35, 445–453. [Google Scholar] [CrossRef]
  40. Vorčák, J.; Merganič, J.; Saniga, M. Structural diversity change and regeneration processes of the Norway spruce natural forest in Babia hora NNR in relation to altitude. J. For. Sci. 2006, 52, 399–409. [Google Scholar] [CrossRef]
  41. Næsset, E. Estimating above-ground biomass in young forests with airborne laser scanning. Int. J. Remote Sens. 2011, 32, 473–501. [Google Scholar] [CrossRef]
  42. Korhonen, L.; Korpela, I.; Heiskanen, J.; Maltamo, M. Airborne discrete-return LIDAR data in the estimation of vertical canopy cover, angular canopy closure and leaf area index. Remote Sens. Environ. 2011, 115, 1065–1080. [Google Scholar] [CrossRef]
  43. Ramtvedt, E.N.; Næsset, E. A simple slope correction of horizontally measured albedo in sloping terrain. Agric. For. Meteorol. 2023, 339, 109547. [Google Scholar] [CrossRef]
  44. R Core Team. R: A Language and Environment for Statistcal Computing. 2023. Available online: https://www.r-project.org/ (accessed on 7 July 2023).
  45. Cramer, J.S. Mean variance of R2 in small moderate samples. J. Econom. 1987, 35, 253–266. [Google Scholar] [CrossRef]
  46. Patterson, H.D.; Thompson, R. Recovery of inter-block information when block sizes are unequal. Biometrika 1971, 58, 545–554. [Google Scholar] [CrossRef]
  47. Bates, D.; Mächler, M.; Bolker, B.; Walker, S. Fitting Linear Mixed-Effects Models Usinglme4. J. Stat. Softw. 2015, 67, 1–48. [Google Scholar] [CrossRef]
  48. Satterthwaite, F.E. Synthesis of variance. Psychometrika 1941, 6, 309–316. [Google Scholar] [CrossRef]
  49. Luke, S.G. Evaluating significance in linear mixed-effects models in R. Behav. Res. Methods 2017, 49, 1494–1502. [Google Scholar] [CrossRef] [PubMed]
  50. Kuusinen, N.; Tomppo, E.; Berninger, F. Linear unmixing of MODIS albedo composites to infer subpixel land cover type albedos. Int. J. Appl. Earth Obs. Geo. 2013, 23, 324–333. [Google Scholar] [CrossRef]
  51. Hovi, A.; Raitio, P.; Rautiainen, M. A spectral analysis of 25 boreal tree species. Silva Fenn. 2017, 51, 7753. [Google Scholar] [CrossRef]
  52. Hovi, A.; Rautiainen, M. Spectral composition of shortwave radiation transmitted by forest canopies. Trees 2020, 34, 1499–1506. [Google Scholar] [CrossRef]
  53. Rautiainen, M.; Stenberg, P. Application of photon recollision probability in coniferous canopy reflectance simulations. Remote Sens. Environ. 2005, 96, 98–107. [Google Scholar] [CrossRef]
Figure 2. Set-up of UAV platform with upward- and downward-looking pyranometers with their Bluetooth loggers (white devices).
Remotesensing 16 03085 g002
Figure 3. The seven different measured albedo footprints (white lines) determined according to the proportion (%) a fixed-area forest plot (white shading) constitutes of measured albedo. The innermost white line illustrates the albedo footprint when the fixed-area forest plot constitutes 90% of measured albedo, while the outermost white line illustrates the albedo footprint when the fixed-area forest plot constitutes 30% of measured albedo. The white lines are given for each 10% interval.
Remotesensing 16 03085 g003
Figure 4. Adjusted coefficient of determination ( R a 2 ) (upper panel) and RMSE (lower panel) for LMs of forest attributes and different footprint sizes of measured albedo (i.e., proportion (%) a fixed-area forest plot constitutes of measured albedo; see Figure 3 and Table 2 for definition). The LMs are based on field data from the whole dataset (both regeneration and mature forests).
Remotesensing 16 03085 g004aRemotesensing 16 03085 g004b
Figure 5. Spread of mean height against different footprint sizes of measured albedo (color grading) based on the whole dataset (both regeneration and mature forests). The footprint size of measured albedo corresponds to the proportions (%) a fixed-area (400 m2) forest plot constitutes of measured albedo (see Figure 3 and Table 2 for definition).
Remotesensing 16 03085 g005
Figure 6. Adjusted coefficient of determination ( R a 2 ) (upper panel) and RMSE (lower panel) for LMs of forest attributes and different footprint sizes of measured albedo (i.e., proportion (%) a fixed-area forest plot constitutes of measured albedo; see Figure 3 and Table 2 for definition). The LMs are based on ALS data from the whole dataset (both regeneration and mature forests).
Remotesensing 16 03085 g006
Table 1. Mean, range, and standard deviation (Std) of field-measured forest attributes for plots for which albedo was measured.
Field-Measured Forest AttributesMeanRangeStd
Biomass (Mg ha−1)117.50.0–380.492.0
Pine39.60.0–173.747.1
Spruce63.40.0–365.876.9
Deciduous14.40.0–203.127.4
Number of stems (ha−1)4428275–576318543
Mean height (m)14.20.0–27.57.7
Basal area (m2 ha−1) 132.35.0–52.98.7
Volume (m3 ha−1) 1290.340.6–695.3115.2
Site productivity 115.86.7–24.25.1
Gini index 10.470.23–0.720.09
Shannon diversity index 11.180.00–2.150.38
Clark–Evans aggregation index 11.050.71–1.420.16
1 Calculated for mature forest only.
Table 2. UAV flight heights above forest canopy ( h U A V in Equation (2)) with corresponding proportion (%) a fixed-area (400 m2) forest plot constitutes of measured albedo ( f in Equation (2)). The two rightmost columns show the actual radius ( r in Equation (2)) and area of the UAV albedo footprint, respectively.
Flight Height Above Forest Canopy (m)Proportion a Fixed-Area Forest Plot Constitutes of Measured Albedo (%)Radius of UAV Albedo Footprint (m)Area of UAV Albedo Footprint (ha)
6.49023.90.18
9.38034.70.38
12.37045.90.66
15.96059.31.11
20.55076.51.84
26.940100.43.17
37.330139.26.09
Table 3. Number of albedo observations (n) and mean adjusted R2 and RMSE for each of the seven footprint sizes of measured albedo. The modeling is based on field-derived variables (biomass, volume, basal area, and number of stems) for mature forests only. The reported statistics are from LMs fitted for all species, and for species-specific, and site productivity- and species-specific LMs.
Footprint Size of Measured Albedo (%) 1nAll SpeciesSpecies-SpecificSite Productivity- and Species-Specific
R a 2 RMSE R a 2 RMSE R a 2 RMSE
90660.020.0150.350.0120.390.011
80730.020.0130.270.0120.340.011
70780.000.0140.200.0130.270.012
60790.000.0140.240.0120.310.011
50810.000.0150.180.0140.220.013
40820.000.0150.130.0140.170.014
30820.000.0170.110.0160.130.015
1 Proportion (%) a fixed-area forest plot (400 m2) constitutes of measured albedo; see Figure 3 and Table 2 for definition.
Disclaimer/Publisher’s Note: The statements, opinions and data contained in all publications are solely those of the individual author(s) and contributor(s) and not of MDPI and/or the editor(s). MDPI and/or the editor(s) disclaim responsibility for any injury to people or property resulting from any ideas, methods, instructions or products referred to in the content.

