1. Introduction
Every year, around 20 million hectares of fertile land are subjected to degradation, and 70% of potentially productive drylands are at risk of desertification, with 18% of African arid regions already severely desertified [
1].
According to the United Nations Convention to Combat Desertification (UNCCD), land degradation is defined as “reduction or loss of the biological or economic productivity and complexity of rainfed cropland, irrigated cropland, or range, pasture, forest and woodlands resulting from land uses or from a process or combination of processes”. Since 1995, UNCCD has designated desertification as the specific process of degradation of land and loss of soil productivity occurring in arid, semi-arid, and dry sub-humid areas [
2,
3].
Soil degradation, instead, refers to the decline in soil quality and its biological, chemical, and physical components [
4,
5].
Both degradation and desertification can be caused by human activities, natural processes, or a combination of both, and they reduce the land and soil’s capacity to provide ecosystem services. These services are “
the benefits people obtain from ecosystems”, which are essential for ensuring conservation and sustainability [
6].
Therefore, land degradation is a complex phenomenon which includes geographical, ecological, climatical, and socio-economic aspects [
7]. It has serious environmental [
3] and socio-economic impacts, especially in developing countries [
1,
8]. The total economic cost of land degradation has been estimated to value USD 6.3–10.6 trillion annually [
9].
Monitoring degradation and desertification is urgently needed to prevent further deterioration [
10]. Despite degradation and desertification significance, there is still no common agreement on their definition and on the application of a standardized assessing methodology approved by the UNCCD. In the framework of the Sustainable Development Goals (SDGs), the need for an indicator to measure SDG 15 and its target, 15.3, has been recognized. This indicator is based on the analysis of three sub-indicators—land cover, land productivity, and carbon stocks—and follows the statistical principle “One Out, All Out”. Nevertheless, there is no explicit indication of how the sub-indicators should be calculated, while it is reported to refer to available products, maps, and databases with medium to coarse resolutions (from 300 m to 1 km) and to refer to national datasets. Other sources, such as Earth observation, are recommended when national level is missing or incomplete [
11].
Remote sensing, despite several limits and uncertainties [
12], has been recognized as a valuable tool for assessing degradation and desertification. It offers a robust, effective, and inexpensive approach to monitor vast areas over time, especially in countries where historical data are missing [
1]. Furthermore, it grants access to both time-series and near-real-time information, allowing for retrospective analysis and subsequent predictions [
13].
In the last decade, recent reviews have conducted bibliometric analyses of remote sensing applications and development for studying soil and land degradation and desertification. While these reviews offer valuable insights, they also present limitations, due to the validity of bibliometric indicators, which can shift attention from the research itself to the researcher. Moreover, the analyses have mainly focused on presenting the state of the art of research, including technological applications and thematic trends [
14,
15], with no further commentary. Other reviews have limited their analysis to a specific geographic context [
4,
12,
16] and land cover types [
17,
18]. In some cases, authors have explored land degradation or desertification definitions and concepts, but they lack comparative analysis of applications [
1].
Reviews often emphasize mapping and comparing current remote sensing research methods, techniques [
7,
16,
19], and parameters [
3,
13] about land degradation and desertification. However, most of them have concentrated narrowly on specific aspects, such as remote sensing-based variables [
13,
20] and their correlated techniques [
20]. When the evolution of technologies, indicators, and methods has been discussed, references to models are neglected [
3,
21]. Conversely, reviews that focus on technologies and related techniques and applications [
7,
19] often overlook their connection to indicators and models. Even analyses that include models typically limit themselves to one model [
22] in the case of land degradation, or two models for desertification [
21].
Regarding soil degradation, authors have provided examples of remote sensing contribution to detect direct or indirect indicators of degradation and some types of soil degradation. However, they lack a comprehensive overview of technologies, indicators, and models [
23,
24] or solely explore a single cause of soil degradation [
25]. Finally, most reviews have restricted their research scope to one or two of the three phenomena (land degradation, soil degradation, and desertification).
For these reasons, this review aims to review land degradation in a more comprehensive approach, also considering soil degradation and land desertification as correlated or alternative aspects of land degradation. Additionally, the paper is not limited to investigate only remote sensing evolution focusing solely on models and techniques or on indicators. Instead, it considers the three aspects—technology, indicators, and models—to be inevitably intertwined and reciprocally influenced. This approach is functional to assess the evolution of remote sensing approach for degradation and desertification studies, to identify current challenges and suggest future perspectives. Moreover, this comprehensive approach has been preferred to cope with the complexity of this phenomenon, requiring a multi-dimensional analysis of the processes which concur to determine degradation and desertification.
This review aims to unveil overall trends in remote sensing analysis of degradation and desertification and to analyse and compare the most recurrent applications in terms of technology, indexes, and models. This theoretical framework has the advantage of offering a uniform and more systematic outlook of the available approaches and methodologies in the scientific literature, and presents them in a structured way to facilitate their further employment. Based on this research, we argue that the full potential of remote sensing has not been fully exploited in terms of technologies and techniques, which subsequently impacts indexes and models.
2. Materials and Methods
This research has applied the approach of a scientific review (
Figure 1). First, the research question definition was aimed to investigate remote sensing applications for soil and land degradation and land desertification. To ensure consistency, a uniform definition of these concepts was necessary. Consequently, the official definitions provided in the Introduction were adopted. Throughout the paper, unless otherwise specified, the term “degradation” refers to both soil and land degradation. Regarding desertification, it has been referred to as “land desertification” with a focus on degradation occurring in arid or semi-arid contexts where agro-rural activities take place and, subsequently, on processes affecting rural lands.
Moreover, the research activity has been further circumscribed to rural areas, excluding forested, urban, and any other non-rural areas or land disconnected from agricultural or livestock activity, such as peatlands. This choice has been motivated by several reasons.
Firstly, in terms of definition, while forest degradation falls under the ecosystem services framework, it has proven challenging to operationalize. As a result, the distinction between forest degradation and deforestation often remains uncertain [
26]. In the context of climate change reporting, forest degradation is described by the Intergovernmental Panel on Climate Change (IPCC) as “
a direct human-induced long-term loss (persisting for X years or more) of at least Y% of forest carbon stocks [and forest values] since time T and not qualifying as deforestation or an elected activity under Article 3.4 of the Kyoto Protocol” [
27]. This definition underscores the importance of monitoring carbon stocks to assess forest degradation, yet presents methodological challenges when applying degradation and desertification concepts from rural areas to forests.
Secondly, while there has been a relevant scientific production about forests over the years (5% of identified articles between 2013 and 2023 refer to forest degradation or reforestation), as well as a limited scientific production on individual components of rural areas like arid and semi-arid regions (0.1%), grasslands (0.9%), and rangelands (0.2%), there has not been any scientific research among those analyzed treating rural areas as a comprehensive category. Such an approach would not only offer a broader perspective on degradation in rural contexts but also bridge the gap between farm-scale studies and those focused on specific land cover types.
Thirdly, this approach is further justified by the potential to more consistently compare degradation processes, technologies, indicators, and models across areas that due to their common usage can be classified as rural. Conversely, degradation processes occurring in non-rural areas, such as forests, may be subjected to different dynamics and causes, which require targeted technologies and methodologies. For example, forest degradation in some contexts is associated with carbon emissions rather than land cover change, whereas in rural areas, land cover may be crucial for modeling and monitoring degradation and desertification. Furthermore, this paper’s focus on remote sensing applications, particularly those using Earth observation methods, faces significant technological and methodological challenges when dealing with dense forest canopies [
28].
Once the research question to the areas of interest were defined, the Scopus and Web of Science databases were used to retrieve relevant papers (accessed on 4 March 2024). These electronic archives were selected for their extensiveness, reliability, and representativeness of the publication environment. Therefore, relevant keywords and Boolean operators were selected to filter unrelated papers out. The following query string parameters for title, abstract, and keywords were applied on the Scopus and Web of Science websites: (“land degradation” OR “soil degradation” OR “desertification”) AND (“remote sensing” OR “remote sensing technolog*” OR “satellit* imag*” OR “satellit* dat*” OR “earth observation” OR “sentinel” OR “sar” OR “synthetic aperture radar” OR “multispectral” OR hyperspectral” OR “landsat” OR “modis”). The research was further limited to articles published in English in scientific journals between 2012 and 2024 to ensure covering the research period of interest (2013–2023).
The investigation identified a total of 2146 results. From these articles, 25 reviews were excluded, resulting in a total of 2121 articles which were further filtered based on the research question and its application context, excluding all papers which were not investigating degradation and/or desertification, as well as all articles referred to non-rural areas. This activity resulted in a total of 278 articles which were effectively analyzed and compared.
Based on the research outcomes, this paper has been structured presenting the state of the art of scientific production on the topic in the last decade, then analyzing trends in terms of technology, indexes, and models. These results are then commented on in the Discussion Section.
3. Results
3.1. Overall Status and Trends
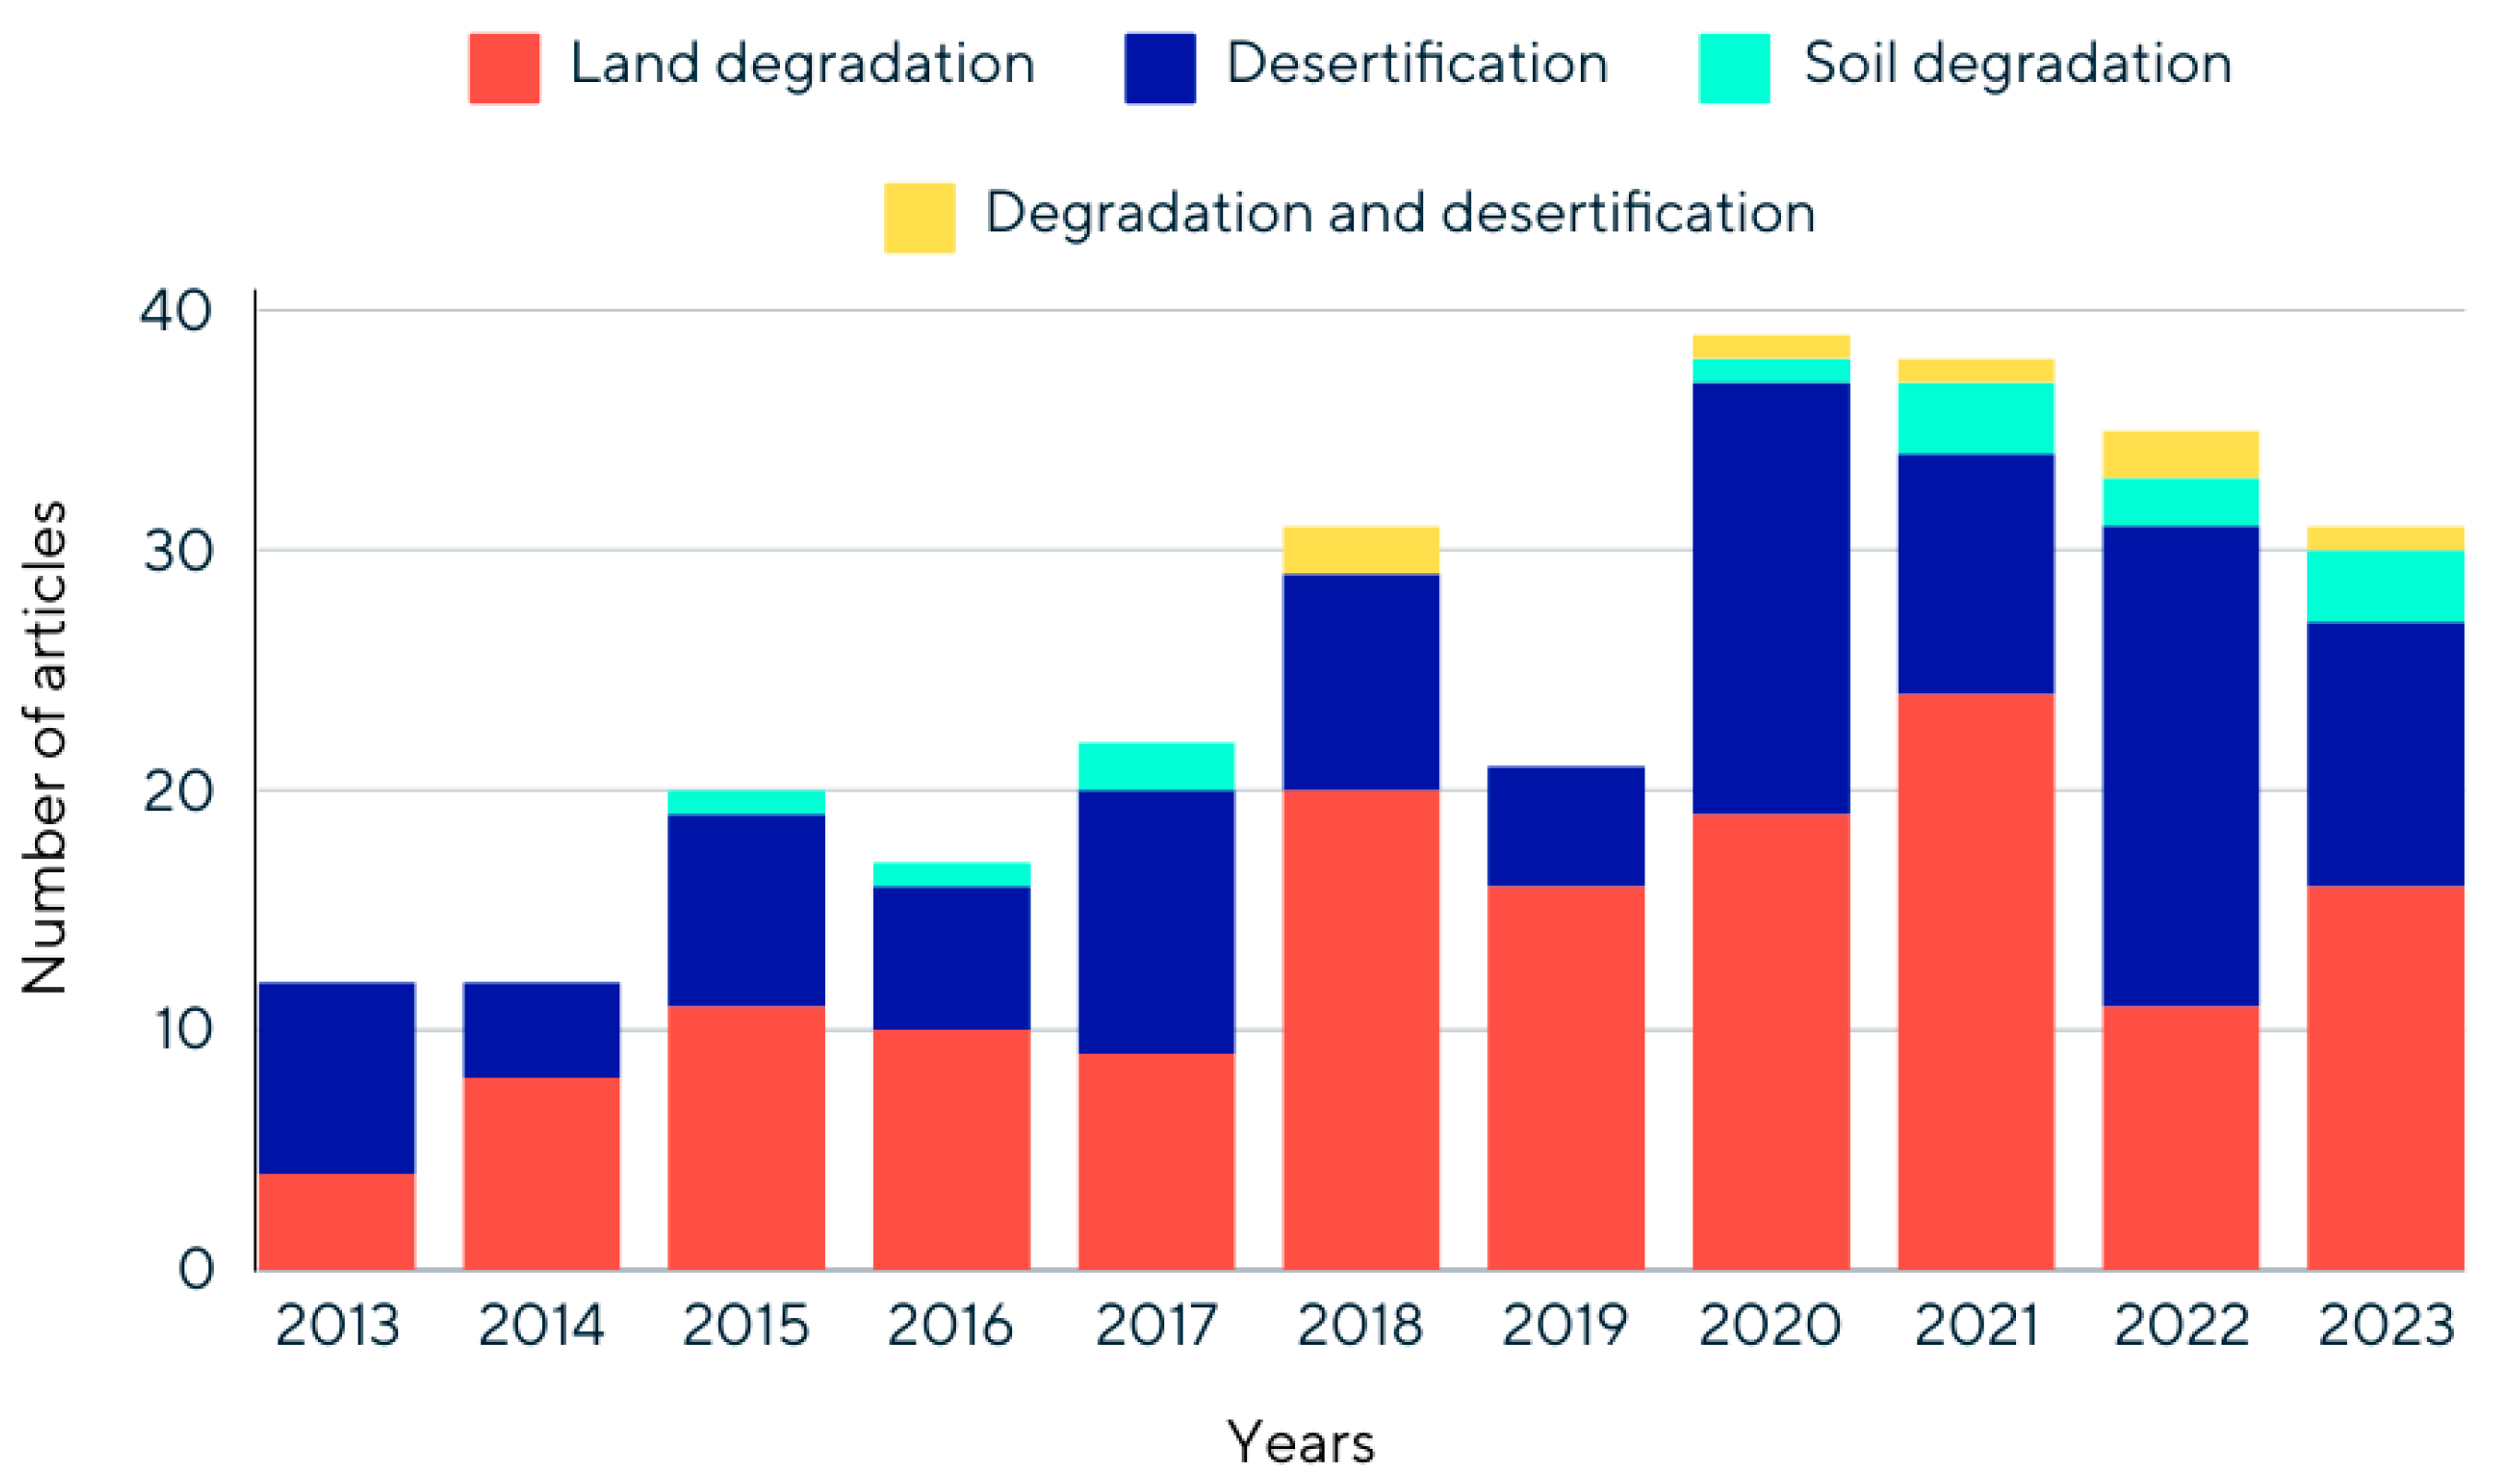
The time trend of scientific publications about degradation and desertification in rural areas during the reference period is reported in
Figure 2. Despite slight fluctuations, the results are aligned with the general growth tendency also reported in other reviews on land degradation [
14,
15] and desertification [
3], with an annual growth rate of 9% for the period 2013–2023. In terms of geographical distribution, China is confirmed to be the country with the highest number of case studies (72), followed by India (24), Brazil (16), Iran (15), and Russia (13).
Based on the results, more than half of the articles (53%) focus on land degradation. Articles falling under this topic discuss specific land uses (such as grassland, rangelands, croplands, pasture degradation), address specific aspects (e.g., vegetation degradation) and areas (such as landscape or ecosystem degradation), and explore different degradation sources (human-induced degradation/anthropogenic degradation). Additionally, articles using synonyms like “decline” or “browning” to refer to land degradation are also included in this category.
Desertification is the second most studied phenomenon (39%). These papers encompass studies referring to arid or semi-arid areas or specific biomes (especially grassland desertification). This category also covers cases where the circumlocutions “land degradation in arid and/or semi-arid” or simply “land degradation” are used interchangeably with desertification.
Among the two categories, a noticeable increase in case studies related to land degradation over the years compared to those focusing on desertification can be observed. Land degradation studies present a more geographically dispersed pattern, with a growing concern for the African continent since 2018. However, since 2017, there has been a renewed interest in desertification, particularly in China, with a peak observed from 2020 onward: in 2013, only three articles were published, but from 2020 to 2023, an average of ten articles per year were produced.
Regarding soil degradation, only a very small fraction of articles investigates this phenomenon (5%) with Russia standing out as the country where soil degradation has been studied the most (
Figure 2).
In terms of scale, as illustrated in
Figure 3, out every ten articles analyzed, about seven applied a regional perspective, reaching a peak between 2020–2022, two applied a local perspective, and only one applied a national scale. Since 2015, wider approaches (transnational, continental, and global) have been adopted with less frequent applications. These outcomes align with data on land cover: the selection of a broader scale has resulted in coarser land classification, with almost the totality of case studies addressing multiple land covers rather than specific environments. For instance, where a continental [
29], a transnational [
30], and a national [
31] approach have occurred, this has resulted in a comprehensive analysis of more than one land cover, such as grasslands, croplands, shrublands, and deserts.
When the scale is combined with data on topic categories (land degradation, desertification, soil degradation), it becomes evident that soil degradation studies have implemented a lower scale compared to those on land degradation and desertification. Additionally, national approaches have been employed five times more for land degradation than for desertification.
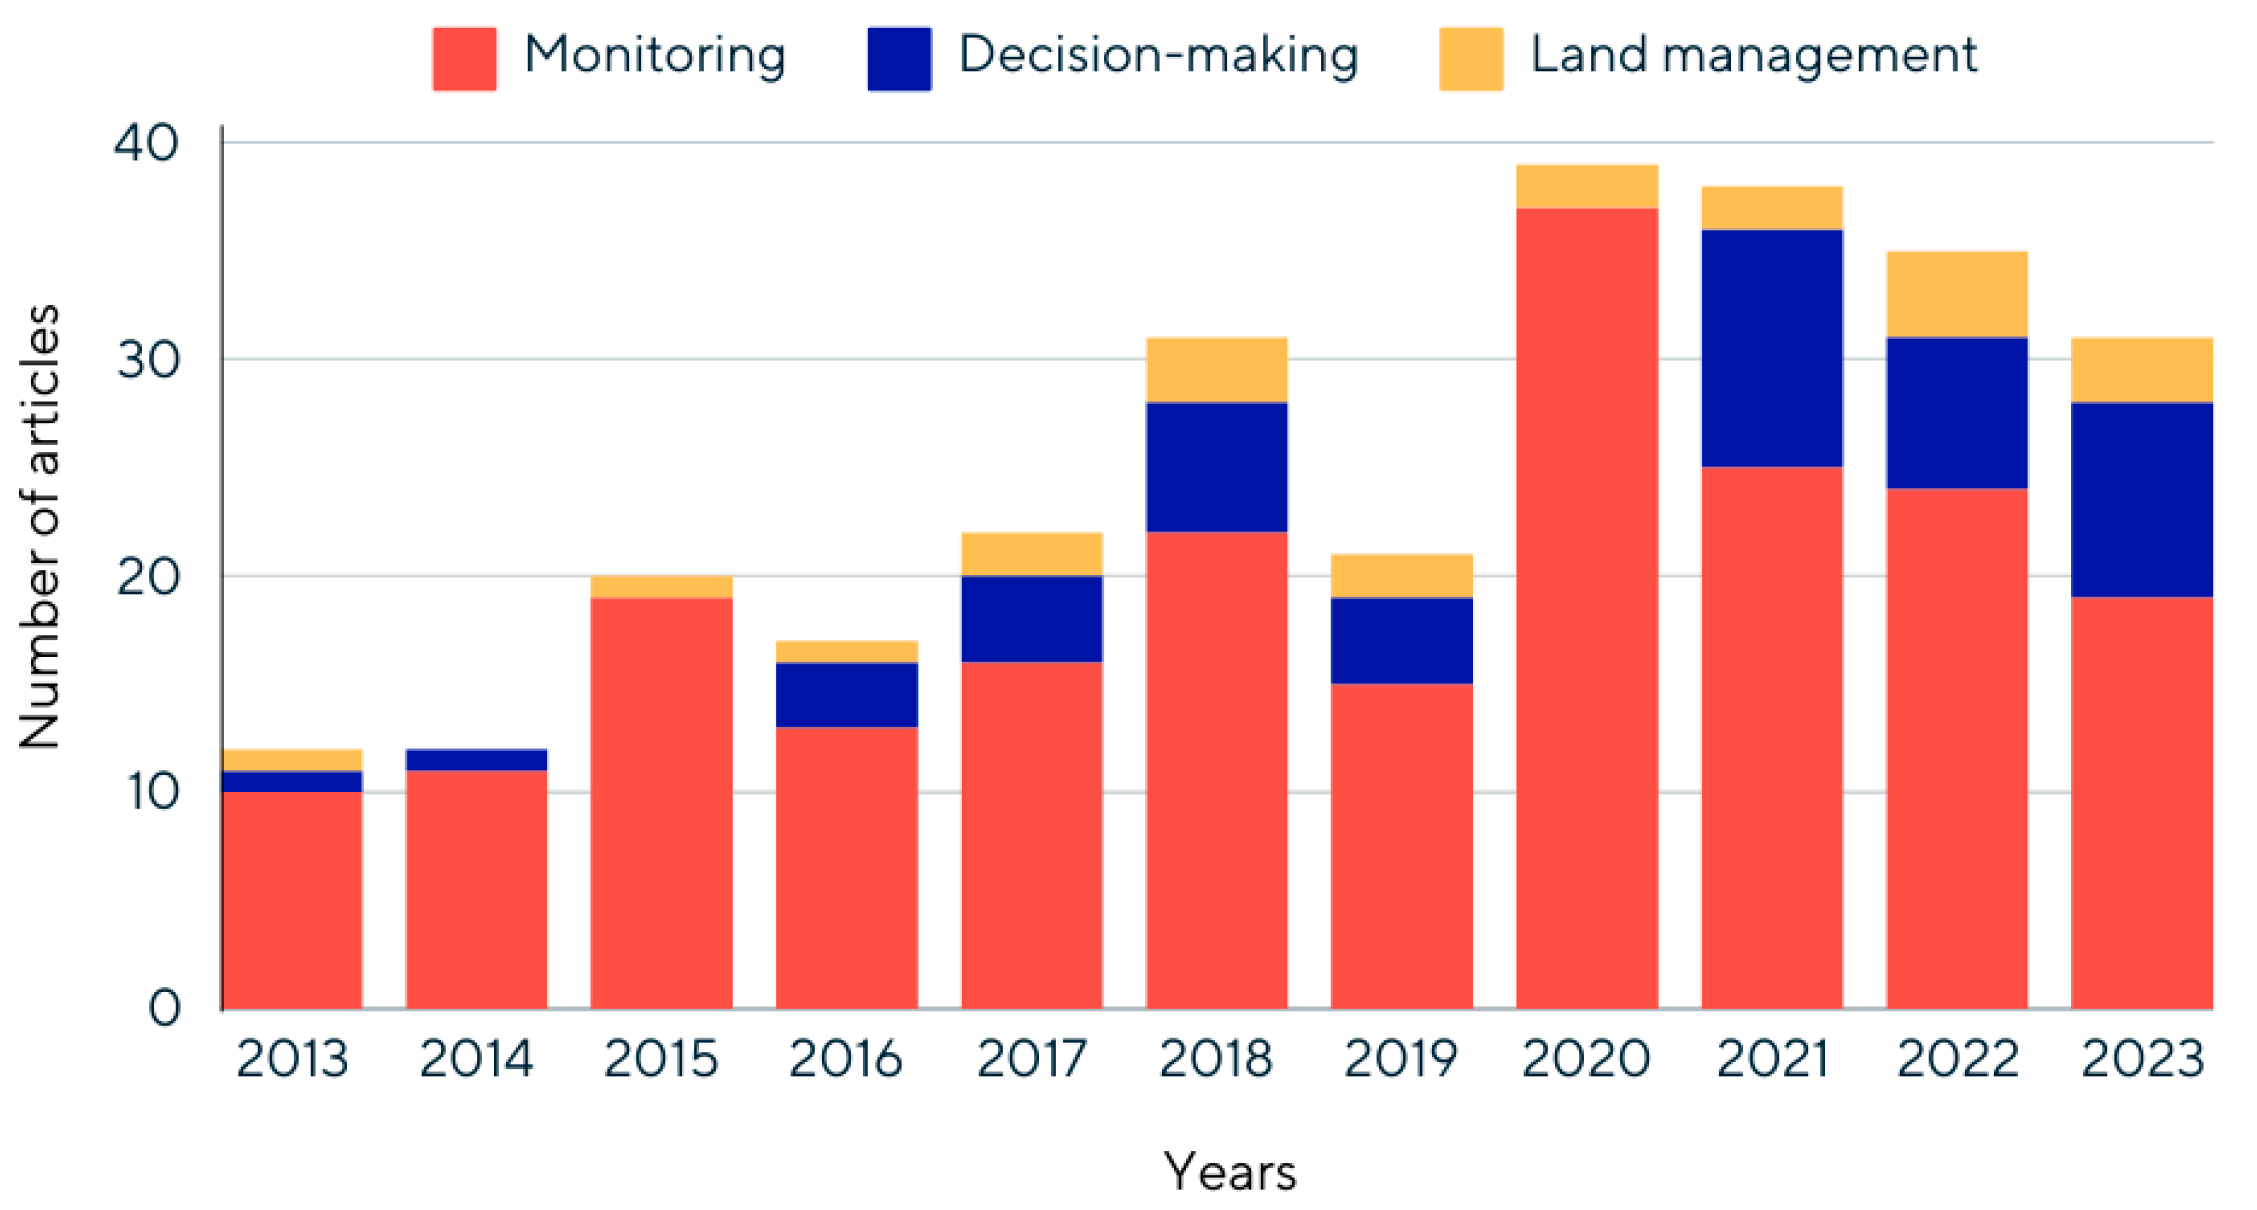
Regarding the applicability, three main categories have been identified: first, articles providing references for monitoring the phenomenon, followed by articles supporting policy making, and articles valuable for land management. While all articles are interested in investigating degradation and desertification, the final application of their results can differ. Therefore, articles that have proposed an approach to be replicated in similar contexts and addressing mainly the context of scientific research fall under the “Monitoring” category. Articles that have proposed an approach for mitigating and controlling degradation and desertification addressing not only researchers but also policy makers have been considered as belonging to the “Decision-making” category. Lastly, articles that have proposed an approach for improving the use of land and soil resources, and therefore maximizing its productivity, and addressing not only researchers and policy makers but also land managers have been included in the category “Land management”.
Figure 4 shows that the first application has generated the principal interest of researchers over years, while practical applications addressing land managers have remained low and relatively stable.
3.2. Technologies
Research on land degradation has relied on remote sensing technologies, with the dominance of satellites over other instruments, such as drones and Unmanned Aerial Vehicles (UAVs) which represent only 2.5% of the studies. Landsat is the most commonly used satellite (61%), followed by Moderate-resolution Imaging Spectroradiometer (MODIS) (35%), a key sensor aboard the Terra and Aqua satellites, Sentinel-2 (9%) and NOAA-AVHRR (National Oceanic and Atmospheric Administration—Advanced Very High-Resolution Radiometer) (7%) (
Figure 5). While Landsat and MODIS application has tended to increase over years (+75% and +250% respectively in the period 2013–2023), the use of NOAA-AVHRR and its datasets has declined after 2019, with Sentinel-2 gaining prominence (+50% in 2023 compared to 2018). Nevertheless, this increase of Sentinel-2 usage remains low compared to the other dominant satellites, and Sentinel-1 usage is even lower (less than 1%). This temporal trend is also reflected in the evolution of the spatial resolution, with most maps at a resolution of 30 m (49%). However, there has been a shift towards finer resolutions since 2016, with the emergence of articles presenting outputs with a resolution at 10 m (+300%) and lower than 1 km (+376%).
In terms of application, Landsat—alone or in combination with other satellites—has been applied to study all phenomena, especially at national, regional, and local levels. MODIS and its combinations have been preferred over others to research land degradation and desertification at broader scales (global, continental, transnational). Furthermore, the analysis has revealed that MODIS has not been applied in papers falling under the application category of “Land management”, particularly in desertification contexts, where Landsat has been preferred. This might be explained by the coarse resolution of MODIS (250 m) compared to Landsat (30 m), which presents significant challenges for extrapolating data for land resource management.
Moreover, Landsat has been commonly used for monitoring soil degradation, often joined with Sentinel-2 and/or high-resolution commercial satellites (e.g., QuickBird, WorldView, GeoEye-1, IKONOS). Another frequent combination of Landsat is with MODIS for studying both desertification and land degradation (32 articles), while its combination with Sentinel mainly appears rarely—only seven times—for land degradation monitoring at national or regional level. Sentinel alone, in fact, has been applied predominantly for land degradation monitoring purposes. Lastly, a few Landsat, MODIS, and Sentinel combinations appear for land degradation research, and do not cover land management applications.
Combining or fusing data from multiple sources has been considered a valuable approach to produce more consistent, accurate, and helpful information while also complementing advantages and disadvantages of integrated technologies. A significant approach consists of the fusion of SAR (Synthetic Aperture Radar) imagery with optical ones. SAR sensors, being active microwave sensors, are not affected by weather conditions, and due to the backscatter effect, they can recognize objects thanks to the characteristics of their surface, resulting in a rich image in terms of spatial information.
Optical sensors, instead, are passive components that require sunlight for object recognition. Moreover, based on their spectral resolution, optical satellites can be categorized as panchromatic, multispectral, and hyperspectral. Panchromatic sensors present a high spatial resolution but a low spectral resolution, which instead is higher in multispectral and hyperspectral sensors at the cost of lower spatial resolution and storage capacity. Due to their complementarity, the combination of SAR and optical data can offer a more complete image, with a balanced spatial and spectral resolution [
7]. Despite its relevance, few papers (13) have implemented data fusion, integrating mainly SPOT, ALOS, and Sentinel-1 (SAR) with Landsat, MODIS, Sentinel-2 (multispectral), and NOAA-AVHRR (hyperspectral) (
Figure 6).
3.3. Current Domains and Indexes
Remote-sensed indexes resulting from the analysis can be categorized into two domains: soil-related indexes and vegetation-related indexes.
Vegetation-related indexes (41) almost double soil-related ones (26), with the Normalized Difference Vegetation Index (NDVI) being the most common metric, implemented in over 170 articles. Alternatively, in arid and semi-arid areas, less sensitive indexes such as the Modified Soil Adjusted Vegetation Index (MSAVI) have been preferred to reduce the influence of vegetation canopy and soil background [
32]. Fractional Vegetation Coverage (FVC) and Leaf Area Index (LAI) follow the NDVI and the MSAVI, appearing in 15 and 8 articles respectively. FVC directly measures surface vegetation cover and indirectly monitors factors like soil erosion which are influenced by it [
33]. LAI, instead, observes the photosynthetic dynamics and its interaction with soil, especially bare soil [
34].
Vegetation indexes also indirectly assess soil degradation, since soil and vegetation influence reciprocally [
23], typically in combination with other soil-related indexes.
The most common indicator for soil is Land Surface Temperature (LST), which is sensitive to climatic conditions and land use change. For its direct connection with soil moisture and indirect connection with vegetation, it has been valuable to assess soil degradation [
35], desertification [
36], and land degradation, especially in arid and semi-arid environments [
37].
Albedo is another crucial measurement of surface reflectivity [
38]. On the one hand, it registers declines in vegetation cover that imply surface exposure and changes in its physical–chemical properties, such as moisture, texture, and roughness. On the other hand, albedo is inversely associated with vegetation cover and its replacement with bare soil. Its application has been frequent for monitoring land degradation and desertification dynamics [
39,
40].
Regarding less commonly used indexes, examples include the Optimized Soil Adjusted Vegetation Index (OSAVI) and the Red-Edge Optimized Soil-Adjusted Vegetation Index (RE-OSAVI) for vegetation analysis, as well as the Bare Soil Index (BSI) and the Salinity Monitoring Index (SMI) for soil analysis.
Since 2014, a trend has emerged to achieve robust and accurate information by combining multiple spatial indexes, ranging from one index to a maximum of eleven indexes with an average of six indexes investigating vegetation or soil properties. The one-index combination (42%) primarily deploys the NDVI, which is used in more than 70 research papers, or alternatively other vegetation indexes—FVC, Enhanced Vegetation Index (EVI), Soil-Adjusted Vegetation Index (SAVI)/MSAVI—and variables connected with primary production (NPP). The two-indexes aggregation (28%) unveils three trajectories: (i) two indexes of vegetation, such as NDVI-SAVI, NDVI-MSAVI, or NDVI-EVI; (ii) a combination composed by a vegetation index and albedo; and (iii) joining a vegetation index with LST. When three or more indexes are combined, a pattern comes out that merges albedo with both vegetation and soil indexes, creating either vegetation-led or soil-led combinations.
Regardless from the number of variables, all studies have integrated these indexes with auxiliary data.
3.3.1. Desertification, Land, and Soil Degradation Indexes
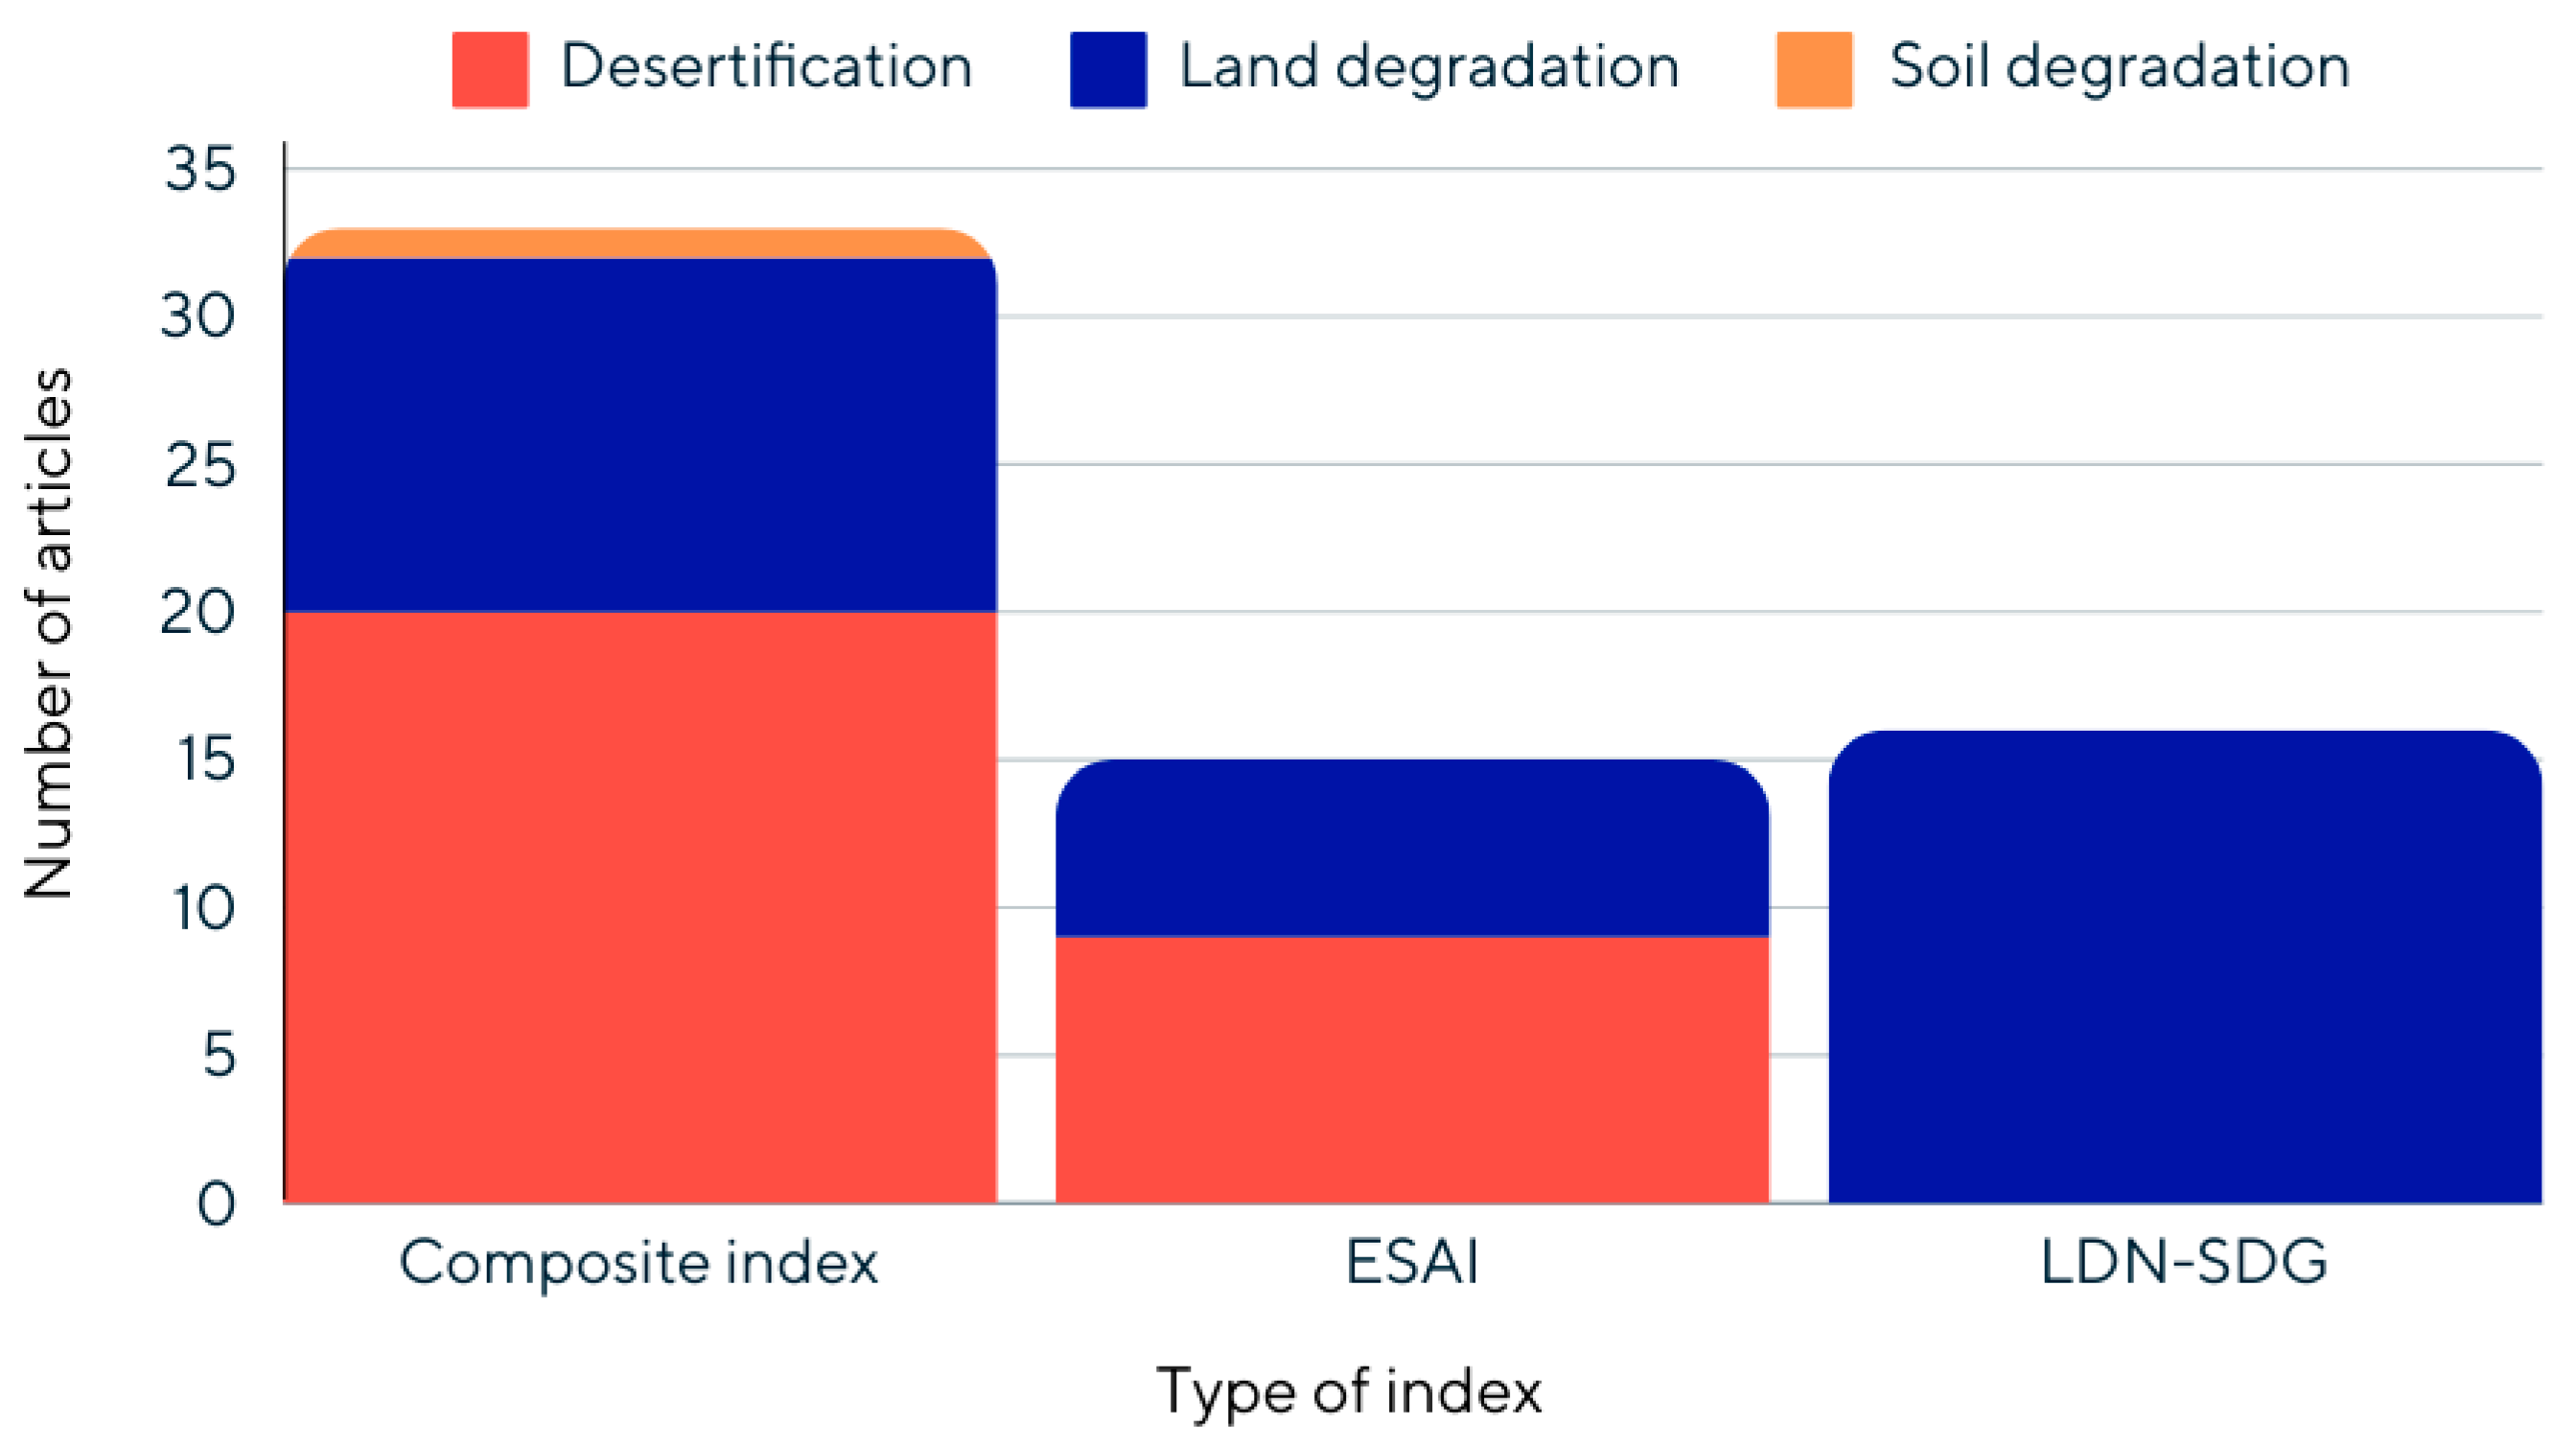
While the most common approach consists of merging multiple layers of maps, combining satellite indexes with auxiliary data, this has also resulted in several complex indicators. As reported in
Figure 7, this approach has been pursued especially to investigate desertification. Notable examples include the Desertification Difference Index (DDI) [
39], the Semi-Arid Steppe Desertification Index (SASDI) [
41], the Degree of Desertification Index (DDI) [
42,
43], and the Desertification Monitoring Index (DMI) [
44]. These indicators are based on MSAVI–albedo or NDVI–albedo features, and eventually completed with other variables [
45,
46]. In addition to this combination, an albedo–TGSI feature has been implemented in the Desertification Divided Index (DDI) that has proven effective for regions with extremely low vegetation coverage [
47].
The Desertification Sensitivity Index (DSI) [
48] incorporates NDVI with several background indexes for vegetation assessment, while Liu et al. [
49] have joined the Desertification Difference Index and the Desertification Grade Index (DGI). The Desertification Risk Index (DRI) has been used by Joseph et al. [
50], considering LST and NDVI dynamics, to better understand desertification within climate change context in northern Nigeria, resulting in an increase of 6% of the risk of severe desertification between 1984 and 2014.
For land degradation assessment, the Land Degradation Index (LDI) [
51] considers the relationship of the NDVI and albedo, while the Land Degradation Status Index (LDSI), combines FVC, NPP, albedo, and the Modified Temperature Vegetation Drought Index (MTVDI) [
52]. The combination of the NDVI and NPP has resulted instead in the Land Degradation and Development Index (LDDI) [
53] which, however, has resulted in some limitations due to saturation of vegetation cover.
A Comprehensive Land Degradation Index was then formulated by Ewunetu et al. [
54], grouping a biological—derived from SAVI—a physical, and a chemical degradation index. Lastly, the Land Degradation Vulnerability Index (LDVI) assesses the cumulative impact of environmental and socioeconomic parameters on land degradation at the village level in India, highlighting that at least 40% of the study area risks severe degradation [
55].
Regarding soil degradation, the Soil Degradation Index (SDI) has been designed by Nascimento et al. [
35], which combines LST with other soil, climatic, geomorphological, and land cover data from soil sampling analysis or from other sources, confirming that both organic matter (OM) and clay content are indicators of soil degradation.
Specific land cover conditions are assessed using tailored indexes like the Cropland Degradation Risk Index (CDRI) [
56], the Alpine Grassland Desertification Index (AGDI) [
57], the Evaluation Index (EI) [
58], and the Grassland Degradation Index (GDI) [
59].
3.3.2. Environmentally Sensitive Area Index and SDG 15.3.1 Indicator
The Environmentally Sensitive Area Index (ESAI) was developed by the EU-funded MEDALUS project to model desertification processes in the Mediterranean [
60], and since then has been updated for global application [
61] to capture the study area sensitivity either to land degradation or to desertification (
Figure 7). In Gabriele et al. [
62], for instance, in addition to the four traditional indexes—Climate Quality Index (CQI), Soil Quality Index (SQI), Vegetation Quality Index (VQI), and Management Quality Index (MQI)—the authors introduced two variables, a Landslide Risk Index and a Water Variability Index, to monitor geomorphology and water stress in Italy. Similarly, Wijitkosum [
63] combined three indicators, Geomorphological Quality Index (GQI), Land Quality Index (LQI), and Water Quality Index (WQI), to better capture critical factors specific to land degradation in Thailand, discovering that more than 50% of the area is vulnerable to severe or moderate degradation. The same approach was followed in [
64], including a Demographic Index (DI) or a Socio-economic Quality Index (SosQI) [
65] to assess the sensitivity of the islands of Cyprus and Lesvos to demographic pressure. Mohamed [
66] further modified the traditional approach by incorporating an Erosion Quality Index (EQI) to account for the significant impact of water and wind erosion in the North Sinai Peninsula, revealing that more than 80% of the area is at risk of desertification.
ESAI modifications also involve its sub-indicators. For instance, Imbrenda et al. [
67] have integrated two variables: one to evaluate landscape structure and one to measure soil compaction caused by heavy farm traffic in Italy. In [
46,
68], the MEDALUS methodology was improved by changing the sub-indicators composition to consider specificities of Chinese and Moroccan landscapes.
Since 2019, other researchers have opted for another approach aligned with the SDGs framework, and more specifically with the indicator 15.3.1, which measures “the proportion of land that is degraded over total land area” as an indication of Land Degradation Neutrality (LDN). This indicator is expressed with three sub-indicators: land cover and land cover change, land productivity, and carbon stocks above and below ground. Studies such as [
69,
70] have adopted a mixed approach, which combines multiple sources and quantitative and qualitative data, implementing the NDVI as a proxy of the total above ground NPP. In the first case, the LDN approach was implemented for the creation of a decision support system (DSS) for Ecuador, whose classification was then compared with experts’ opinions, who validated that 64% of the area is extremely degraded. In the second case, tier 2 methodology (based on national measurement in Botswana) demonstrated a better estimation performance than tier 1 (based on default datasets).
Conversely, Kiani-Harchegani and Sadeghi [
71] implemented the NPP product from MODIS, while Zhao et al. [
72] advocated for using FVC due to its high correlation with NPP and ease of estimation compared to NPP. Other applications have benefitted from the Trends.Earth open-source tool to compute the SDG 15.3.1 indicator, though it has limitations due to input data [
73,
74].
3.4. Models and Methods
Several remote-sensing models have been identified to study land degradation, desertification, and soil degradation. The most recurrent ones focus on change detection of vegetation, land use, and land cover change and albedo–vegetation relationship (
Table 1). It is worth mentioning that all models described below together represent 70.5% of the considered articles, indicating that a unique approach is missing. This is even more applicable for soil degradation, where soil attributes usually detected through soil sampling campaigns or images from commercial satellites with high spatial resolution are combined with vegetation maps through the application of parametric methods (linear regression) or nonparametric ones (machine learning-based methods).
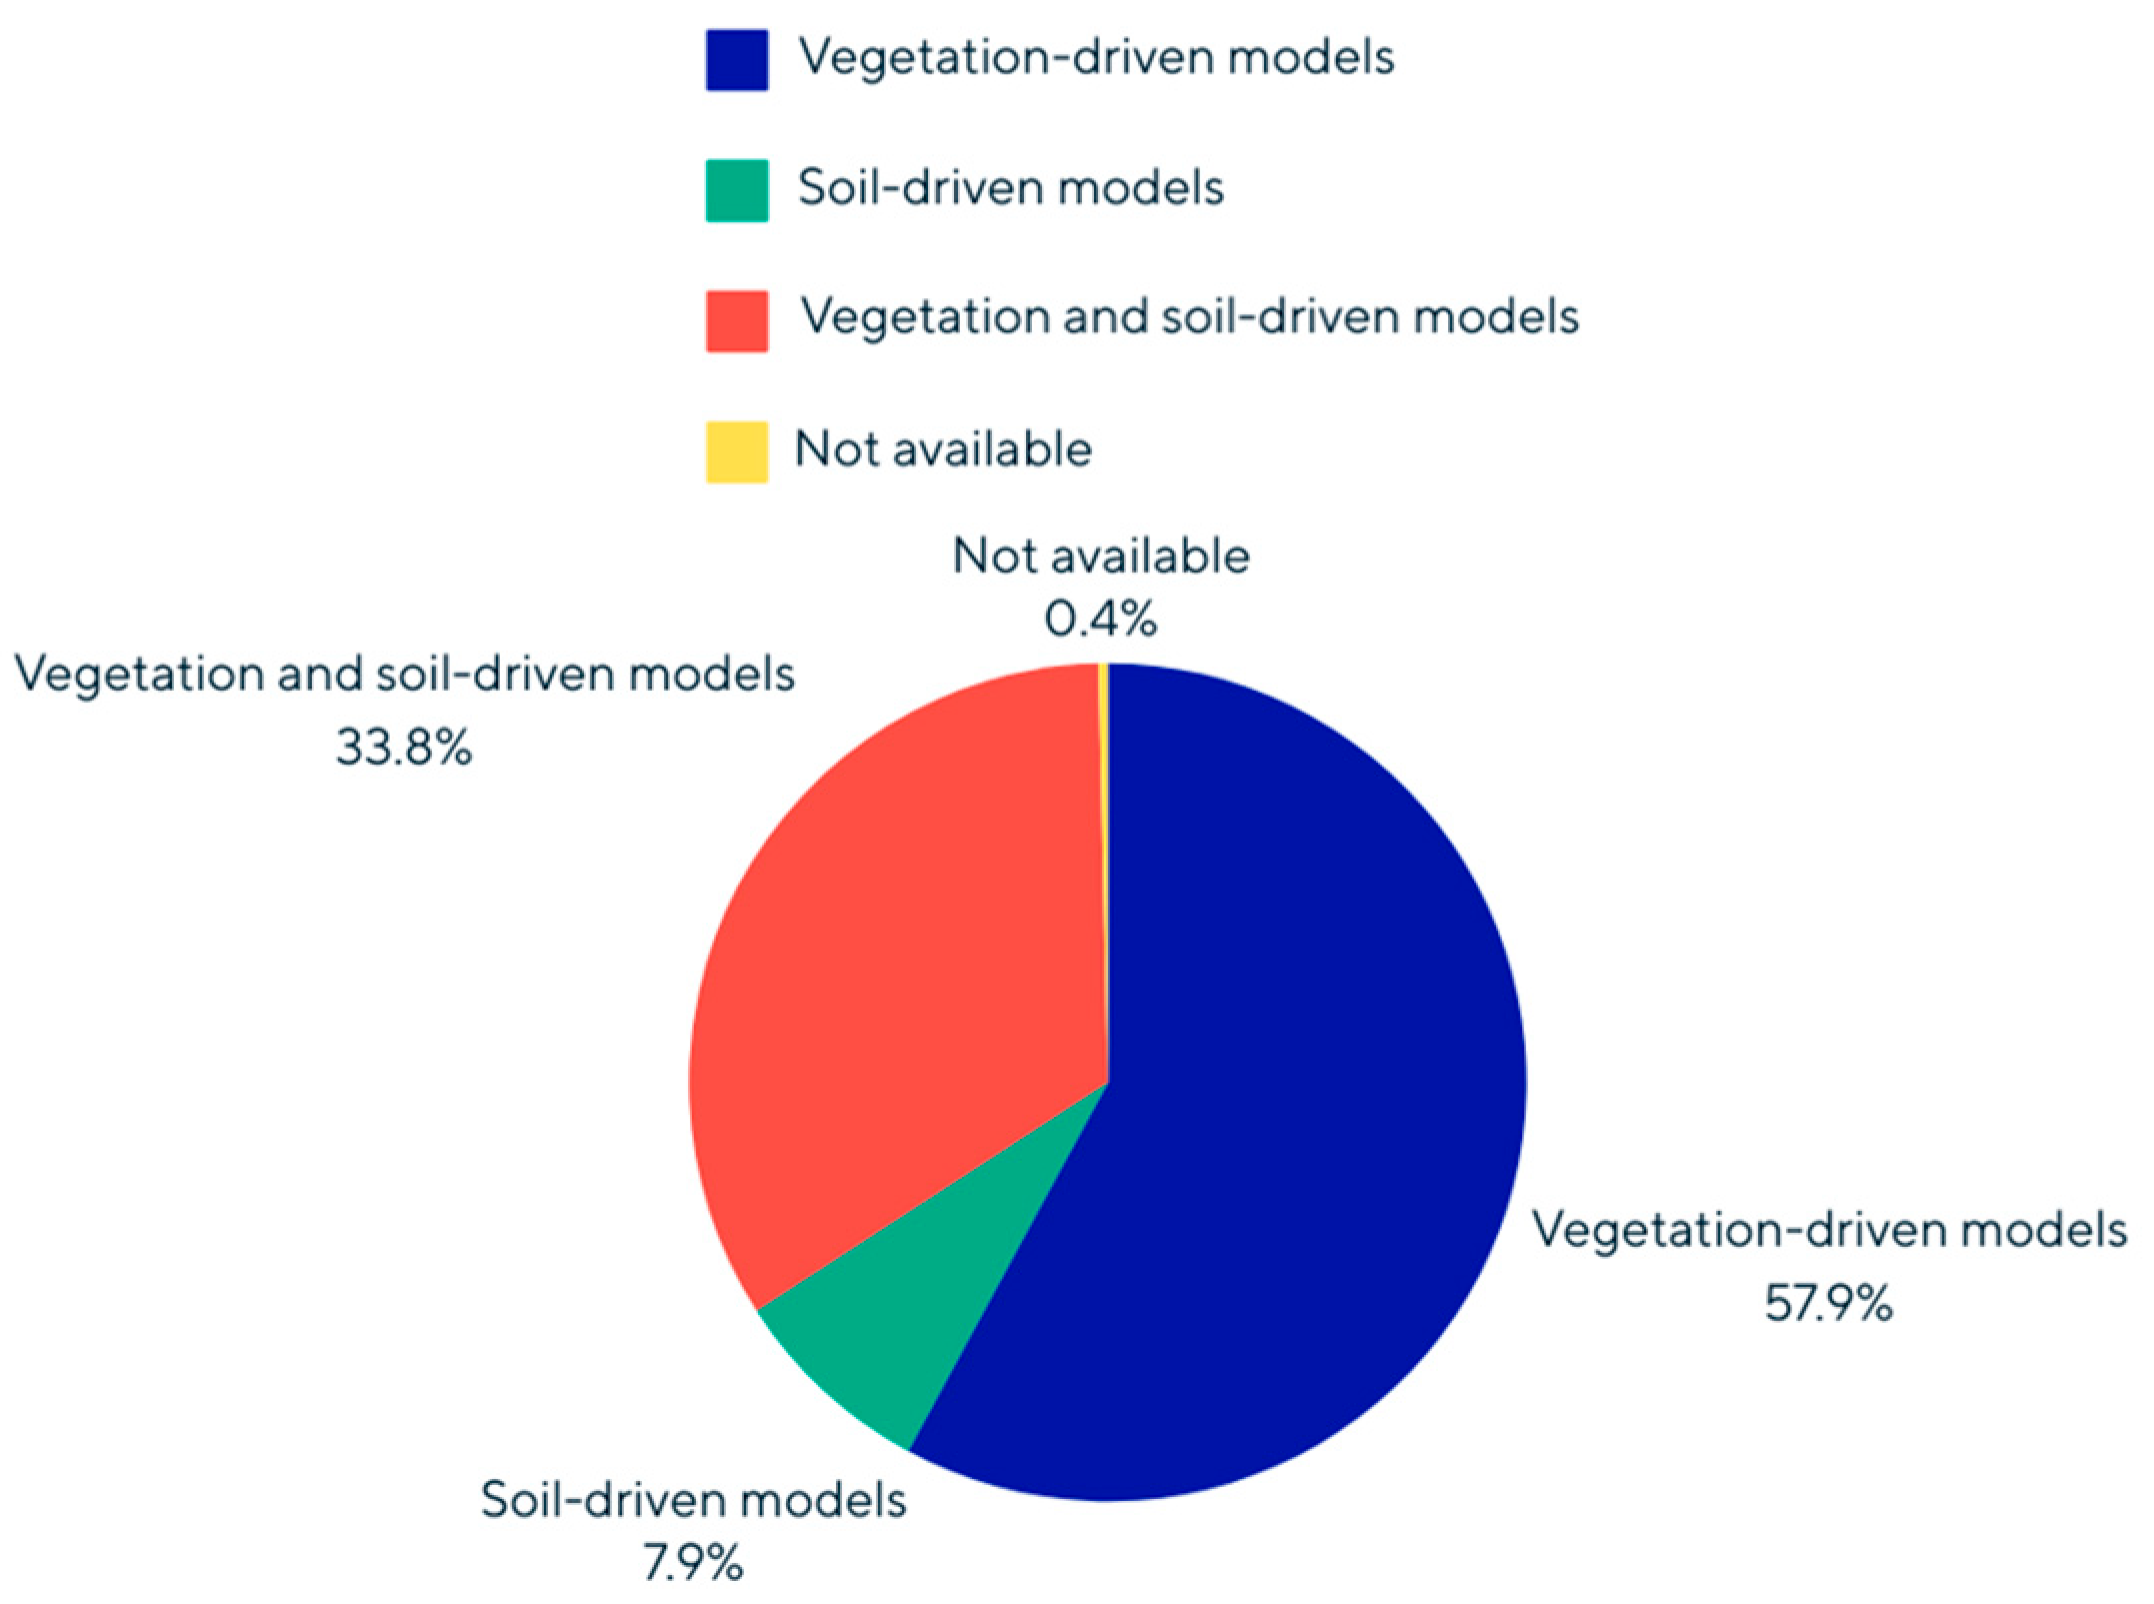
Moreover, models have been classified according to their driver: models that have focused more on vegetation aspects have been considered as “vegetation-driven”, while models that have focused more on soil aspects have been considered as “soil-driven”. Based on the results, more than half of the considered models are vegetation-driven (57.9%) and only a limited number of articles apply a soil-driven approach (7.9%) (
Figure 8). Nevertheless, researches that combine approaches based on vegetation and soil have increased by 50% in the last ten years.
All models have been classified based on their application as: risk models, monitoring models, driving factors detection models, and prediction models. In the category “Other different models” we have included approaches that are difficult to categorize since they propose a no-model analysis based on the integration of remote sensing and spatial analysis specifically tailored to the case study, as well as less commonly used models, such as case studies on water erosion, and models with limited applicability in rural areas, like wind erosion models. For example, the Erosion Potential Model (EPM), also known as the Gavrilovic Method, has been applied less frequently in the analyzed articles compared to the Universal Soil Loss Equation (USLE) and the Revised Universal Soil Loss Equation (RUSLE). The EPM method assesses soil loss by considering various factors that contribute to erosion, including soil properties, topography, climate, and land use. It is particularly useful in areas with limited data and where no previous research on erosion has been conducted [
75]. Nevertheless, in some cases, it has underperformed in comparison to other models [
76,
77]. As far as wind erosion, this is particularly common in dryland and desert ecosystems, predominantly in Asia [
78,
79], Africa [
80], and parts of Europe [
81]. Given these specific environments, models like the Wind Erosion Equation (WEQ) and the Revised Wind Erosion Equation (RWEQ)—two empirical models that consider several erosion factors (climate, vegetation, surface [
78,
82])—or the Index of Land Susceptibility To Wind Erosion (ILSWE)—which considers wind speed, soil surface susceptibility and sparse vegetation as indicators of erosion [
80]—have not been widely discussed.
3.4.1. Risk Models
Degradation risk models identify areas susceptible to land degradation or desertification. This is the case of MEditerranean Desertification And Land USe (MEDALUS), Land Degradation Neutrality, and Risk Assessment of Land Degradation (RALDE).
MEDALUS and Land Degradation Neutrality are covered in
Section 3.3.2. The RALDE model, designed by Masoudi et al. [
83,
84], has been applied in two Iranian provinces: Fars and Khuzestan. The model considers the arithmetic mean of several parameters to generate four maps of degradation. The potential map combines natural and human factors. The trend map is used to assess degradation speed and rate and considers both the percentage of vegetation reduction (based on NDVI changes from MODIS) and the land use changes in the reference period (based on national available database). The current state of degradation is retrieved from the ratio between current production and potential production, represented respectively by the maximum and potential NDVI. The map is then compared with results from the ground. Lastly, the potential risk map comprehends three different scenarios, yet the third one (the potential risk is lower than the degradation trend) has been applied.
With regard to soil degradation, it is worth mentioning the Soil Risk of Degradation Model developed by Gadal et al. [
85] to model the risk of soil degradation along Lake Chad (Cameroon). Following a multiple-indexes approach, they combined four vegetation indexes and nine soil indexes to monitor the condition of vegetation and soil. Following a regression analysis, correlation between single indexes and the new image composed by the combination of vegetation and soil indexes is explored. A Principal Component Analysis (PCA) is then performed to identify the most relevant factors for soil degradation, and four exposition levels are developed to classify the area. The model achieved an overall accuracy of 54.3%, and a kappa coefficient of 40.49%.
This multi-indexes approach has also been applied in Egypt: several indexes related to vegetation (NDVI, EVI, SAVI, MSAVI, Vegetation Condition Index (VCI), and Vegetation Health Index (VHI)), soil (the Normalized Difference Moisture Index (NDMI)), weather (Temperature Condition Index (TCI)), and anthropogenic activity (Normalized Difference Built-up Index (NDBI)) have been combined with other data expressing different soil characteristics such as topography, land use, and soil profiles retrieved from field data. In this way, a soil degradation map and a trend analysis has been implemented through the application of PCA. Based on the results, half of the study region has been recognized to be subjected to moderate or strong risk [
86].
3.4.2. Monitoring Models
Monitoring models encompass several approaches able to assess the spatio-temporal distribution of decline. This category is the most consistent one, and includes the following frameworks: Carnegie–Ames–Stanford Approach (CASA), Local NPP Scaling (LNS), Rain Use Efficiency (RUE), RESidual TREND (RESTREND), Land Use Land Cover (LULC) change, Universal Soil Loss Equation (USLE), Revised Universal Soil Loss Equation (RUSLE), vegetation-based models, vegetation–albedo models, and multiple-indexes models.
NPP-Based Models
CASA and LNS are based on NPP estimation, considering productivity decline as an indicator of land degradation and desertification. In CASA, land degradation and desertification are described considering the difference between actual and potential NPP which corresponds to Human Appropriation of NPP (HNPP). Therefore, the model is valuable to detect changes caused by climate change and human activities.
NPP can be determined in different ways: in [
87], it was computed from FVC, then calculated and validated with GLASS FVC product. The aboveground NPP (ANPP) was calculated applying the CASA model and validated with MODIS NPP product, while the Thornthwaite memorial model was used to compute the potential NPP (PNPP) to detect the predominance of severe and moderate desertification between 2000–2018 in the Hexi corridor (China).
Sun et al. [
88] proposed an “improved” CASA model for Zhenglanqi drylands (China). PNPP comes from AGB, and is then converted into NPP using the harvest method. ANPP, instead, is retrieved from NDVI fusing high and medium resolution data of MODIS and Landsat. Although this choice resulted in higher resolution (30 m) and in a better adaptation of the model to the study area (R
2 = 0.79 and RMSE = 29.1 gC/m
2), the method presents estimation errors.
The LNS model aims to identify non-degraded reference sites by dividing the study area into homogeneous land capability classes (LCCs), assuming that all pixels in the same class have the same productivity in case of no degradation. This maximum production is used as an estimator of non-degraded NPP and of the difference between potential and estimated NPP (LNS). In [
89], the condition of the Heihe River Basin (China) was assessed. LCCs were created from the NDVI, following the results of ANOVA to compare LCCs from the NDVI and LCCs from environmental variables. NPP for this model was retrieved from MODIS.
NPP is also valuable for the application of RUE and RESTREND models. RUE represents the ratio between aboveground NPP (ANPP) and rainfall, and can isolate rainfall influence over productivity in land degradation assessment.
In Sahel [
90], for instance, ΣNDVI is used as a proxy for ANPP. The results suggest two main aspects: (i) RUE observations do not depend on the amount of rainfall and (ii) when the amount of rainfall increases and the RUE seems to decrease, this does not necessarily mean that the land is degrading [
67].
RESTREND is based on the strong NDVI correlation with precipitation in arid and semi-arid regions and has been used to detect human-induced land degradation. It employes a linear regression between accumulated NDVI and precipitation in the growing season, and the difference between estimated and observed NDVI value is computed as vegetation–precipitation relationship (VPR) residual. The VPR residual trend is then estimated through linear trend analysis, and a negative trend indicates the occurrence of land degradation [
91]. RESTREND has been applied in Egypt combining EVI from MODIS VI product as a proxy for vegetation cover with precipitation, Digital Elevation Model (DEM), Perpendicular Vegetation Index (PVI), and LULC maps from Landsat images. Based on this approach, about 37% of the study area degraded in the period between 2001–2016 [
92].
Chen et al. [
91] have suggested an “improved” RESTREND, corrected by the inclusion of phenology (P-RESTREND) to monitor the Songnen grasslands in China during 2000–2015. The Normalized Difference Water Index (NDWI) time-series describe the phenological cycle and determine the growing season. Comparing RESTREND and P-RESTREND, the second has proved a better performance in distinguishing precipitation and human-induced degradation than the first one.
Land Use Land Cover Change Model
One of the most applied approaches consist of the assessment of land use classification changes, identifying those that negatively impact on land productivity, usually associated with lower levels of land, water, and vegetation.
In [
93], for instance, spatio-temporal changes of LULC have been observed to monitor desertification trends in Nigeria. Landsat images from 1990, 2000, and 2015 have been classified, achieving high level of accuracy when compared with ground truth data (average overall accuracy = 93% and average Kappa coefficient = 0.93).
LULC maps have also been prepared by Prokop [
94] for monitoring degradation in India, in the Meghalaya Plateau, retrieving images from: (
i) single satellites (Google Earth, IRS-1D, Corona), (
ii) their fusion for 2017, 1998, and 1965, respectively, and (iii) field observations, in combination with the Digital Surface Model (DSM) from ALOS-P. The results indicate that three transitions affecting grasslands and croplands between 1965 and 2017 have led to land degradation. Specifically, the appearance of built-up areas and bare lands associated with mineral extraction have represented the most impactful transitions in the study area, resulting in human-pressure as the main responsible for the degradation of the area.
USLE and RUSLE Model
Since land degradation and soil degradation are often associated with soil erosion, another approach has promoted the monitoring of erosion processes, implementing USLE and RUSLE. Both consider different risk factors: rainfall-runoff erosivity, soil erodibility, slope length, slope steepness, cover management, and supporting practices.
This model has been applied in the Indian district of Chamrajanagar [
95], where data from remote sensing sources, including soil salinity indexes the Salinity Index (SI) and the Normalized Difference Salinity Index (NDSI), have been integrated with terrain data, physical-chemical-biological features of the soil from samples, and data on precipitations and human activities to become part of the USLE/RUSLE equations. The outcome has been reclassified according to the GLASOD (Global Assessment of Soil Degradation) classification resulting in biological degradation, water erosion, and loss of topsoil being the most extensive phenomena occupying 32.56% and 22.57% of the total surface, respectively.
Cerretelli et al. [
96] have monitored land degradation in Ethiopia considering two ecosystem services, soil retention and nutrient retention, comparing two datasets, a “global” (250 m of resolution) and a “hybrid” (30 m of resolution) dataset. For the soil retention model, USLE/RUSLE estimate the average annual soil loss, while for nitrogen retention, the InVEST tool has been implemented. In terms of soil erosion modeling, similar results have been achieved by the two datasets, since both share same sources. Regarding nutrient retention, the hybrid model has detected higher estimates compared to the global one because of the different land use classification level.
The model has been also applied for assessing soil degradation in Czech Republic, where a three-level scale (national, cadastral, and field level) has been followed [
97]. The research has underlined that almost half of the arable land is affected by erosion, resulting in soil degradation of agricultural lands.
Vegetation-Based Models
The last monitoring model is based on vegetation observations: one approach considers vegetation changes, while another one, based on RUE and RESTREND experience, considers the correlation between vegetation and precipitation, and the last one considers the relationship between vegetation and albedo.
The first approach has been applied especially in areas with dense vegetation cover like in Brazil: Vieira et al. [
98] have applied a classification and regression tree (CART) to predict land degradation in MATOBIPA during 2018, implementing NDVI-derived indices from Landsat. This model has been also applied to assess desertification dynamics [
99,
100] and soil degradation [
101].
For the correlation between vegetation and precipitation, Fokeng and Fogwe [
102] have observed vegetation degradation changes from annual-series of the NDVI in the Southern Bui Plateau (Cameroon) for over 30 years (1984–2021), applying Ordinary Least Square (OLS) regression and Pearson’s Product Correlation of the NDVI with the Rainfall Anomaly Index (RAI) to distinguish between natural and human-induced degradation.
The final approach considers different vegetation indexes and their relationship with albedo to monitor degraded areas.
In [
29], for instance, the combination of the NDVI and albedo into the Land Degradation Index (LDI) was empowered by a back-propagation artificial neural network (BP-ANN) algorithm that relates degradation classes with LDI. The predicted degrees of land degradation were then compared to a field survey, reaching an overall prediction accuracy of 91.2%.
Twenty years of desertification have also been assessed in Mongolia with this approach by Meng et al. [
103]. Landsat images have been analysed to retrieve MSAVI and Albedo. Several methods were used and compared to classify the area into four desertification levels, with the Maximum Entropy method showing the highest accuracy (0.96).
Multiple-Indexes Models
This approach consists of combining several indexes using different parametric and nonparametric methods to identify the combination that better describes desertification in the specific area.
Regarding parametric methods, the most common approach consists of applying feature space approaches: Wei et al. [
47] compared Landsat albedo–NDVI, albedo–MSAVI, and albedo–Topsoil Grain Size Index (TGSI), achieving an overall classification accuracy for all the three models above 80%.
Regarding nonparametric methods, in [
33], for instance, the accuracy of the single indexes selected to monitor desertification in the China–Mongolia–Russia Economic Zone—FVC, MSAVI, Albedo, LST and Temperature Vegetation Dryness Index (TVDI)—were assessed, as well as their combinations’ accuracy, with the combination FVC + Albedo + LST reaching the highest accuracy level (80.56%). In terms of models, the albedo–NDVI model, logistical regression model, CART, and random forest (RF) model were compared for their estimation capacity with a desertification map of in China. CART resulted in the most representative model, accounting for an overall accuracy of 80.56%, and contributing to identify spatio-temporal trends and the intensity of the process.
Multiple-indexes models have been also applied for soil degradation monitoring, as in the case of the Soil Degradation Index presented in
Section 3.3.1 and developed by Nascimento et al. [
35,
104].
3.4.3. Driving Factors Detection Models
These models implement several techniques to determine the main driving factors of degradation and desertification. The most common are CASA, RESTREND, Geodetector-based models, regression-based models, and multicriteria analysis models.
CASA and RESTREND have been presented in Section NPP-Based Models, to distinguish between human and climatic factors.
The Geodetector is a spatial ANOVA used to determine explanatory variables of the study area. It has been widely applied, especially in desertification contexts.
Several factors like temperature, precipitation, wind speed, sunshine hours, relative humidity, Gross Domestic Product (GDP), and population have been considered to analyze the Hexi corridor (China), where it has been shown that climatic aspects (humidity, wind speed, and precipitation) had a higher influence (q value above 0.35) than human ones, and that factor interaction enhanced this process (q value above 0.60) [
77].
Similar aspects have been considered by Guo et al. [
36] to determine the influences of human and climatic factors in the Yellow River region (China): natural aspects (temperature, precipitation) dominated before 2005, while after 2005, anthropogenic ones (land use, GDP, and population) have become dominant and particularly relevant when observing the combination of the two factors (q value between 0.50 and 0.70).
Regarding regression analysis, a multiple regression analysis has been applied for example in Inner Mongolia between NPP and climate factors, considering also the adoption of partial correlation coefficients to identify single influences determined by the two driving forces. In this case study, human activities have been the main contributor to degradation (68.6% of impact on vegetation trend) but also the main leverage of regeneration (59.9%) [
88].
Chen et al. [
105] have employed a multiple stepwise regression to identify land degradation’s drivers and identify areas affected by climatic factors, anthropogenic factors, or both factors in Pakistan. Based on multiple regression between the NDVI and time and precipitation, the authors have identified that climate-driven degradation is dominant (36.26%).
Multicriteria analysis techniques have been implemented to appoint weights to the different factors: this is the case of analytical hierarchy process (AHP) and fuzzy-based AHP (FAHP) that define the power of sub-indicators in multi-indexes approaches and determine the components of these indicators [
54,
63].
Lastly, it is worth mentioning that driving factors identification can also be performed applying parametric and nonparametric method. One example of parametric approach is shown by Yu et al. [
89], who, following the quantification and trends of LULC changes, implemented PCA and a correlation analysis to environmental and socioeconomic data to assess the driving forces of degradation in the Three Rivers Headwaters Region of China. Three principal components were identified with a cumulative contribution rate of 86.6%: socio-economic development, climatic conditions and population growth, and environmental protection activities. As a final step, a correlation between these driving forces and the land uses in the interested areas was performed, employing Spearman’s rank correlation coefficient, a nonparametric rank statistic that measures a monotone association when Pearson’s correlation coefficient cannot be adopted because of data distribution [
106], to measure the trend of the correlation.
Regarding nonparametric methods, Meng et al. [
103] applied RF to assess the contribution of environmental factors in Mongolia desertification, with precipitation being the most influential feature (value = 0.25).
3.4.4. Prediction Models
Prediction models are designed to forecast future trends in land degradation and desertification. While no specific model has been identified through the analysis, the most common approach involves the use of machine-learning techniques. As a result, these models can be classified as nonparametric.
For example, in Iraq (Al-Muthanna province) [
107], desertification predictions for 2028 have been determined using a 3D convolutional neural network (3D CNN) and cellular automata (CA) techniques. The model incorporated time-series of land cover with desertification indicators related to geology, soil type, distance from waterways, elevation, population density, and vegetation. The 3D CNN model has been used firstly to predict desertification in 2008 and 2018. After validation, the model has been employed to predict 2028 trend, achieving a good performance (overall accuracy above 0.90). Results indicate that desertification has increased over years, affecting 50.8% of the study area in 2008, with projections suggesting it will reach 54.1% by 2028, considering the variables mentioned and the absence of desertification policies.
The CA technique has been applied also by Falaki et al. [
93] in the case study presented in Section Land Use Land Cover Change Model to predict changes in the desertification process in Nigeria, revealing a projected 7% increase in desertification by 2030.
Nzuza et al. [
34] applied the RF technique to predict land degradation in winter and summer using Sentinel-2 images. Environmental variables (geology, precipitation, slope, aspect, albedo, altitude) and vegetation indexes were retrieved, with bare soil used as predictor of degradation. The winter and summer maps were then combined into a pooled map, which has been demonstrated to have higher prediction accuracy than seasonal and desegregated analysis.
It is worth noting also that parametric models can be employed for predicting land degradation. In Iraq (Nineveh province), for instance, the Weighted Overlay Index Model (WOIM) has been used to combine the different model layers (precipitation, temperature, soil type, topography, land cover, vegetation, urbanization). The model was validated considering data from 2001 and 2014 (accuracy of 0.873), and it has been applied to predict vegetation degradation in 2027. The analysis has unveiled that the NDVI has decreased since 1985, with an average value of 0.136. After an improvement between 2001 and 2014 (average NDVI of 0.197), a new phase of vegetation degradation is expected by 2027, with a projected 22.8% decrease in average NDVI [
108].
4. Discussion
Earth observation represents an invaluable support for studying environmental processes and climate change since it offers several advantages in terms of costs, accessibility, accuracy, spatial and temporal coverage, and spectral and temporal resolution compared to statistical datasets or other remote sensing technologies. All these aspects have contributed to its wide application in monitoring land degradation, soil degradation, and land desertification. It has been observed that some satellites have been more preferred in performing this task, like Landsat and MODIS. Both have been widely applied not only in degradation and desertification research, but for all studies that concern physical, chemical, and biological conditions, as indicated by Zhao et al. [
109]. In their review, they constructed a Remote Sensing Impact Factor (RSIF) to quantify satellites’ current and future impacts on research. Based on their findings, they have confirmed the trends that have been reported in this paper, with Landsat and MODIS dominance, followed by a slow rise of Sentinel and a gradual decline of NOAA-AVHRR.
The success of Landsat and MODIS is connected to several aspects: on the one hand, both have offered improved spectral, temporal, and spatial resolution. On the other hand, they provide a lot of analysis-ready data (ARD) or products which can be directly used by researchers, such as surface reflectance (SR) from Landsat and NPP from MODIS, which have also been encountered during our research on degradation and desertification. Their technological advancement, their open-access (Landsat since 2008) and their supportive resources have contributed to the replacement of NOAA-AVHRR [
109].
At the same time, these success factors also seem to limit the affirmation of Sentinel missions. Compared to Landsat and MODIS, Sentinel-1 and Sentinel-2, the two most applied missions for vegetation studies and the only ones which have been encountered in our research, offer higher revisit time (the minimum revisit time of Sentinel-1 and Sentinel-2 is 6 and 5 days, respectively, while Landsat TM is 16 days), higher spatial resolution (for both Sentinels the minimum is 10 m, for Landsat is 30 m, and for MODIS 250 m) [
110] and a good spectral resolution (Sentinel-2 has 13 bands which cover visible NIR and SWIR in the spectrum, Landsat-8 has only 8 bands in the visible and thermic infrared spectrum, and MODIS has 36 spectral bands from optical to infrared) [
111].
Therefore, one should have expected Sentinels, especially Sentinel-2, to gradually replace both Landsat and MODIS in several applications. Why they have not could be explained by several factors.
Firstly, for Earth observation and more specifically for degradation and desertification studies, time-series are crucial to identify temporal trends and, subsequently, to predict future ones. In our case, for instance, the average time period of scientific publication is 20 years, with some cases where more than five decades of data have been considered [
94,
112]. However, Sentinel data, being a young mission, cannot provide data older than 2014, while Landsat and MODIS go back to the 1970s (with coarser spatial resolution) and 2000, respectively [
19].
Another aspect is related to the complexity of Sentinels’ use as single satellite and in combination. Sentinel-2, which has been mainly applied to vegetation monitoring [
85,
113], but also to LULC studies [
114] and albedo and soil texture [
40] in the framework of land degradation, soil degradation, and land desertification assessment, results in a complex analysis of spatio-temporal characteristics especially over vast areas where, because of the scale, data inhomogeneity is reported [
115]. Furthermore, the difficulties in in-depth interpretation, which requires specific expertise on the matter, may have discouraged researchers, who, instead, have preferred ready-to-use products from MODIS and Landsat, as in some cases presented in the previous paragraphs. The complexity of interpretation is even more evident in the case of Sentinel-1, which has found a very limited application in degradation and desertification studies since it requires several processing techniques and expertise to reduce the measurement’s noise and avoid loss of significant data [
115,
116]. This may also have negatively impacted the application of data fusion techniques. The combination of SAR (Sentinel-1) and optical data (Sentinel-2) presents a promising contribution since they both compensate for reciprocal limits of the two technologies. SAR is not affected by cloud and illumination and can solve time-series fragmentation of optical sensors, while optical data can support in SAR images interpretation and noise-reduction [
117]. Additionally, deep learning techniques could facilitate their combination. Nevertheless, data fusion of SAR and optical images in degradation and desertification study is still very limited, risking missing relevant information which could contribute to improve the accuracy of results, refine the spatial-level of research in this domain, and discover new applications [
7]. This is even more applicable for Sentinel-3 data, which has not been applied in any of the reviewed articles; however, its thermal-infrared band could contribute through data fusion to improve LST measurements and, therefore, evapotranspiration estimation [
118,
119].
Technological possibilities and constraints given by available satellites have resulted in the indexes and models described above.
Regarding remote-sensing indexes, results have confirmed that vegetation indexes, and the NDVI above all, are the primary approach for studying degradation and desertification [
18,
25]. Their wide application is linked to their accessibility both in terms of robustness and easiness of calculation and in terms of ready-to-use products such as the GIMMS libraries [
120], and MODIS [
92] and GLASS products [
29]. Furthermore, they provide valuable information not only on vegetation phenology and photosynthetic processes, but also on other aspects, becoming a valuable proxy for other parameters like productivity [
8].
Despite several attempts to improve the representativeness of vegetation indexes for degradation and desertification applications through the development of adjusted and modified indexes and/or through the combination with other auxiliary data [
21] such as terrain data, meteorological data, and LULC maps, the complexity of the phenomena investigated in this study seems to require a more structured and comprehensive representation, a finer accuracy, and more robustness than the one offered by vegetation indexes [
20,
22,
121]. This becomes even more evident when monitoring soil degradation: while remote-sensing is able to estimate direct proxies such as soil surface roughness and texture and indirect proxies such as vegetation cover and LULC on a large scale, some other crucial direct proxies like organic matter and other physicochemical variables can only be acquired through in situ observation and laboratory measurements. However, this should not discourage recognition of the valuable contribution of remote sensing in monitoring soil degradation [
25] since field data provide reference for threshold definition and results validation, just as for any other remote sensing variable [
23].
Therefore, the need to better comprehend degradation and desertification processes and to overcome oversimplification of the application of single vegetation-based models could explain the creation of multi-indexes models [
3,
122,
123,
124]. As in the aforementioned case studies, vegetation-driven models may achieve remarkable results, yet in other cases fail to provide robust results, requiring the creation of ad hoc indexes that also assess other factors, such as environmental and human ones [
18]. Moreover, focusing solely on vegetation indexes could lead to an incomplete analysis of the phenomenon, while multiple variables could better capture the evolution of degradation and desertification over time [
3] and over different scales [
20], its multiple causes and effects [
124], overcome technological and disciplinary limitations of a single index, and better meet information needs of different stakeholders [
122]. This is particularly evident when investigating soil degradation. Although technological limitations of remote sensing may not be completely resolved by combining multiple indexes, the integration of different variables can at least help mitigate the lack of data when field observations are unavailable [
23].
From our research, we have discovered that there is any unique model for degradation and desertification and each of the proposed method attempts to describe the specific context with the available indicators and metrics, trying to compensate at their best between accuracy and simplicity. This seems to explain the extensive application of vegetation-based models over soil-based and mixed ones. The former stand out for easiness of application, despite being extremely affected by vegetation density and meteorological factors [
19]. Furthermore, vegetation indexes are a measure of vegetation status rather than a direct indicator of degradation and desertification and, therefore, their application should be integrated in a broader and more comprehensive analysis of the factors that contribute to degradation dynamics [
20].
This trade-off between accuracy and simplicity is also valid for NPP-based models. They are characterized by a simple estimation process with few input parameters, focusing on NPP, recognized by UNCCD as a key indicator of degradation and desertification and sensitive to climatic and human factors [
125]. Nevertheless, since NPP cannot be directly measured, this has resulted in methodological assumptions that impact on the model’s application and validity. As a result, NPP-based approach, especially when derived from the NDVI which is slightly positive for bare soils, could result in misrepresentative value of the real condition (e.g., other factors which better describe the variation are missing [
88,
126]) and, therefore, in estimation and interpretation errors of degradation and desertification [
122].
As far as degradation and desertification classification models, they also have found a vast application thanks to supervised or unsupervised techniques because of the good level of accuracy achieved. However, they are also limited by external influences on the study areas, especially in arid and semi-arid ones, and they may pose serious challenges in terms of model construction and human intervention [
19].
Therefore, an attempt to solve models’ limitations and inaccuracies is represented by several strategies such as the creation of complex indicators and the application of machine-learning techniques [
18,
19]. The former approach has the advantage of presenting a general framework that could be fitted to the study area, and directly or indirectly include both human and climatic factors, as in the MEDALUS and SDG 15.3 indexes. However, because of their complexness, these composite indicators are then affected by input data heterogeneity, quality, and availability [
22,
61], especially for soil degradation analysis [
24]. Regarding machine-learning techniques, based on our results, parametric approaches (especially regression and correlation analysis) dominate the research on degradation and desertification (54%) compared to nonparametric ones (21%) and mixed ones (23%). Machine-learning techniques (mainly random forest, decision tree, and neural networks) have the great advantage of fitting non-linear relationships and improving accuracy estimation, yet they also require a vast amount of data for training, which could again affect their performance, especially when high-quality and quantity of input data are missing [
18].
5. Conclusions
Land degradation and desertification are urgent issues demanding tempestive action to minimize their environmental and socio-economic impact.
Nevertheless, a standardized methodology for assessing degradation and desertification is missing. In this framework, remote sensing emerges as a powerful tool to evaluate land and soil conditions using targeted indexes and models.
This research has analyzed and compared the scientific productions from the last decade to define the most common technologies, indexes, and models applicable to degradation and desertification studies.
The findings have revealed a general increase in the number of articles over the last decade, with China leading in the number of case studies. The dominance of established satellites like Landsat and MODIS is due to available time-series and data products, despite the existence of newer, higher-resolution options like Sentinel missions. While convenient, these established options have limitations in terms of accuracy and resolution. Resolution limitations restrict research to broader scales, hindering local-scale analysis, which is particularly relevant for soil degradation studies. The restricted scale due to technology also limits practical applications, as evidenced by the scarcity of research focused on land management and DSS.
The easy availability of vegetation indexes led to their widespread use, even in soil degradation studies, due to the indirect connection between vegetation and soil health. It is crucial to remember that vegetation indexes primarily reflect vegetation conditions and can be influenced by other factors like precipitation, leading to misinterpretations. The dominance of vegetation indexes has translated to a prevalence of vegetation-based models for desertification and degradation studies. These models, however, might not fully capture the complexity of the phenomenon. To better understand degradation complexity, a shift towards multi-indexes models that consider various contributing factors is recommended.
While degradation and desertification modelling is inherently site-specific, this review offers a structured overview of existing tools and approaches to encourage further research and application, addressing current gaps. However, two limitations of this study can be highlighted: on the one hand, it focuses on spectral indexes and models derived from them, excluding research utilizing spectral bands and direct spectral analysis. On the other hand, because of its focus on direct applicability of technologies, indexes, and models, it has excluded non-rural ecosystems such as forests from the scope of the research. It may be worth further investigating and comparing them in a similar analysis in the future.


