1. Introduction
Remote sensing object detection technology plays a crucial role in both civilian and military applications, finding use in scenarios such as search and rescue operations [
1], military reconnaissance, and intelligence gathering [
2,
3]. However, due to the aerial perspective often used in remote sensing image capture, objects often exhibit arbitrary orientations, dense distributions, and difficulties in feature extraction. These factors pose significant challenges in achieving high-precision object detection tasks. In recent years, to address these challenges, the use of oriented bounding box annotations, as opposed to traditional horizontal bounding boxes, has emerged as the mainstream trend in oriented object detection research.
Remote sensing image object detection methods can be broadly categorized into anchor-based and anchor-free approaches. Anchor-based object detection includes both single-stage and two-stage detection methods. Single-stage algorithms, such as the YOLO series [
4] and RetinaNet [
5], typically perform object localization and classification tasks simultaneously within a single network, resulting in faster detection speeds. Nonetheless, when applied to oriented object detection in remote sensing imagery, these methods encounter hurdles pertaining to localization precision, efficacy in feature extraction, and complexities arising from background interference. Scholars have endeavored to surmount these obstacles through innovative research. For example, R3Det [
6] was designed to counter the sensitivity challenges in detecting objects with extreme aspect ratios by employing a coarse-to-fine progressive regression strategy. It initiates detection using horizontal anchor boxes to swiftly enhance recall, followed by a refinement phase that leverages oriented anchor boxes to adeptly manage densely packed scenes. Yang et al. introduced the H2RBox [
7] method, which pivots on horizontal bounding box annotations for oriented object detection. This technique mitigates the limitations of traditional methods by minimizing the number of preset anchors, embracing a dynamic anchor learning strategy, and integrating a polar attention module to distill key features specific to the task. Furthermore, AO2-DETR [
8] adeptly manages objects with diverse rotations and scales by generating oriented proposals, refining them, and employing a rotation-aware set matching loss function.
Two-stage algorithms, such as Faster R-CNN [
9] and Mask R-CNN [
10], typically first generate candidate regions and then refine these regions for classification and localization. Although two-stage algorithms have an advantage in accuracy, they also face unique challenges in oriented object detection, including generating oriented candidate regions, extracting and aligning features of oriented objects, efficiency decline due to multi-step processing, handling complex backgrounds, and the precision of bounding box angle regression. To address these challenges, Xie et al. proposed Oriented R-CNN [
11], which introduces an Oriented Region Proposal Network (Oriented RPN) to directly generate high-quality oriented proposals from images, and further refines these proposals for oriented object detection. Han proposed ReDet [
12], which integrates rotation-equivariant networks to achieve rotation-equivariant feature extraction, effectively encoding rotational information. Additionally, ReDet employs a rotation-invariant RoI Align method to adaptively extract rotation-invariant features from the rotation-equivariant features. Ming et al. proposed the CFC-Net [
13] framework, which uses a Polarized Attention Module (PAM) for key feature extraction and a Rotated Anchor Refinement Module (R-ARM) for optimizing oriented anchors and dynamic anchor learning. This approach addresses the challenges of target detection in remote sensing images, such as scale, aspect ratio, and arbitrary orientation variations. To tackle the difficulties of small object detection and the limitations of preset anchors in aerial image object detection, Liang et al. proposed the DEA-Net [
14]. This method introduces a Dynamic Enhanced Anchor (DEA) module and a sample discriminator to achieve high-quality candidate box generation and positive sample selection for small objects.
Anchor-free object detection methods in remote sensing images face challenges such as the complexity of representing and locating oriented objects, discontinuities at angular boundaries, handling densely packed target areas, and interference from complex backgrounds. To address the common issues of non-axis-aligned objects, arbitrary orientations, and complex backgrounds in aerial images, Oriented RepPoints [
15] uses adaptive point representation and oriented transformation functions, along with learning strategies tailored to non-axis-aligned characteristics, effectively tackling the challenges in oriented object detection. G-Rep [
16] converts objects (whether based on point sets, quadrilateral bounding boxes, or oriented bounding boxes) into Gaussian distributions, and uses the Maximum Likelihood Estimation algorithm to optimize the parameters of the Gaussian distribution. This approach resolves issues of boundary discontinuity, rectangularity, representation ambiguity, and discrete points encountered with oriented objects. CornerNet [
17] transforms the object detection task into identifying two key points (the top-left and bottom-right corners) that form the bounding box. By using a single convolutional neural network to directly predict these corner points, CornerNet introduces corner pooling to help the network better focus on the edges of objects, improving the accuracy of corner point predictions. Once these key points are detected, the network can connect them to form oriented bounding boxes that enclose the objects.
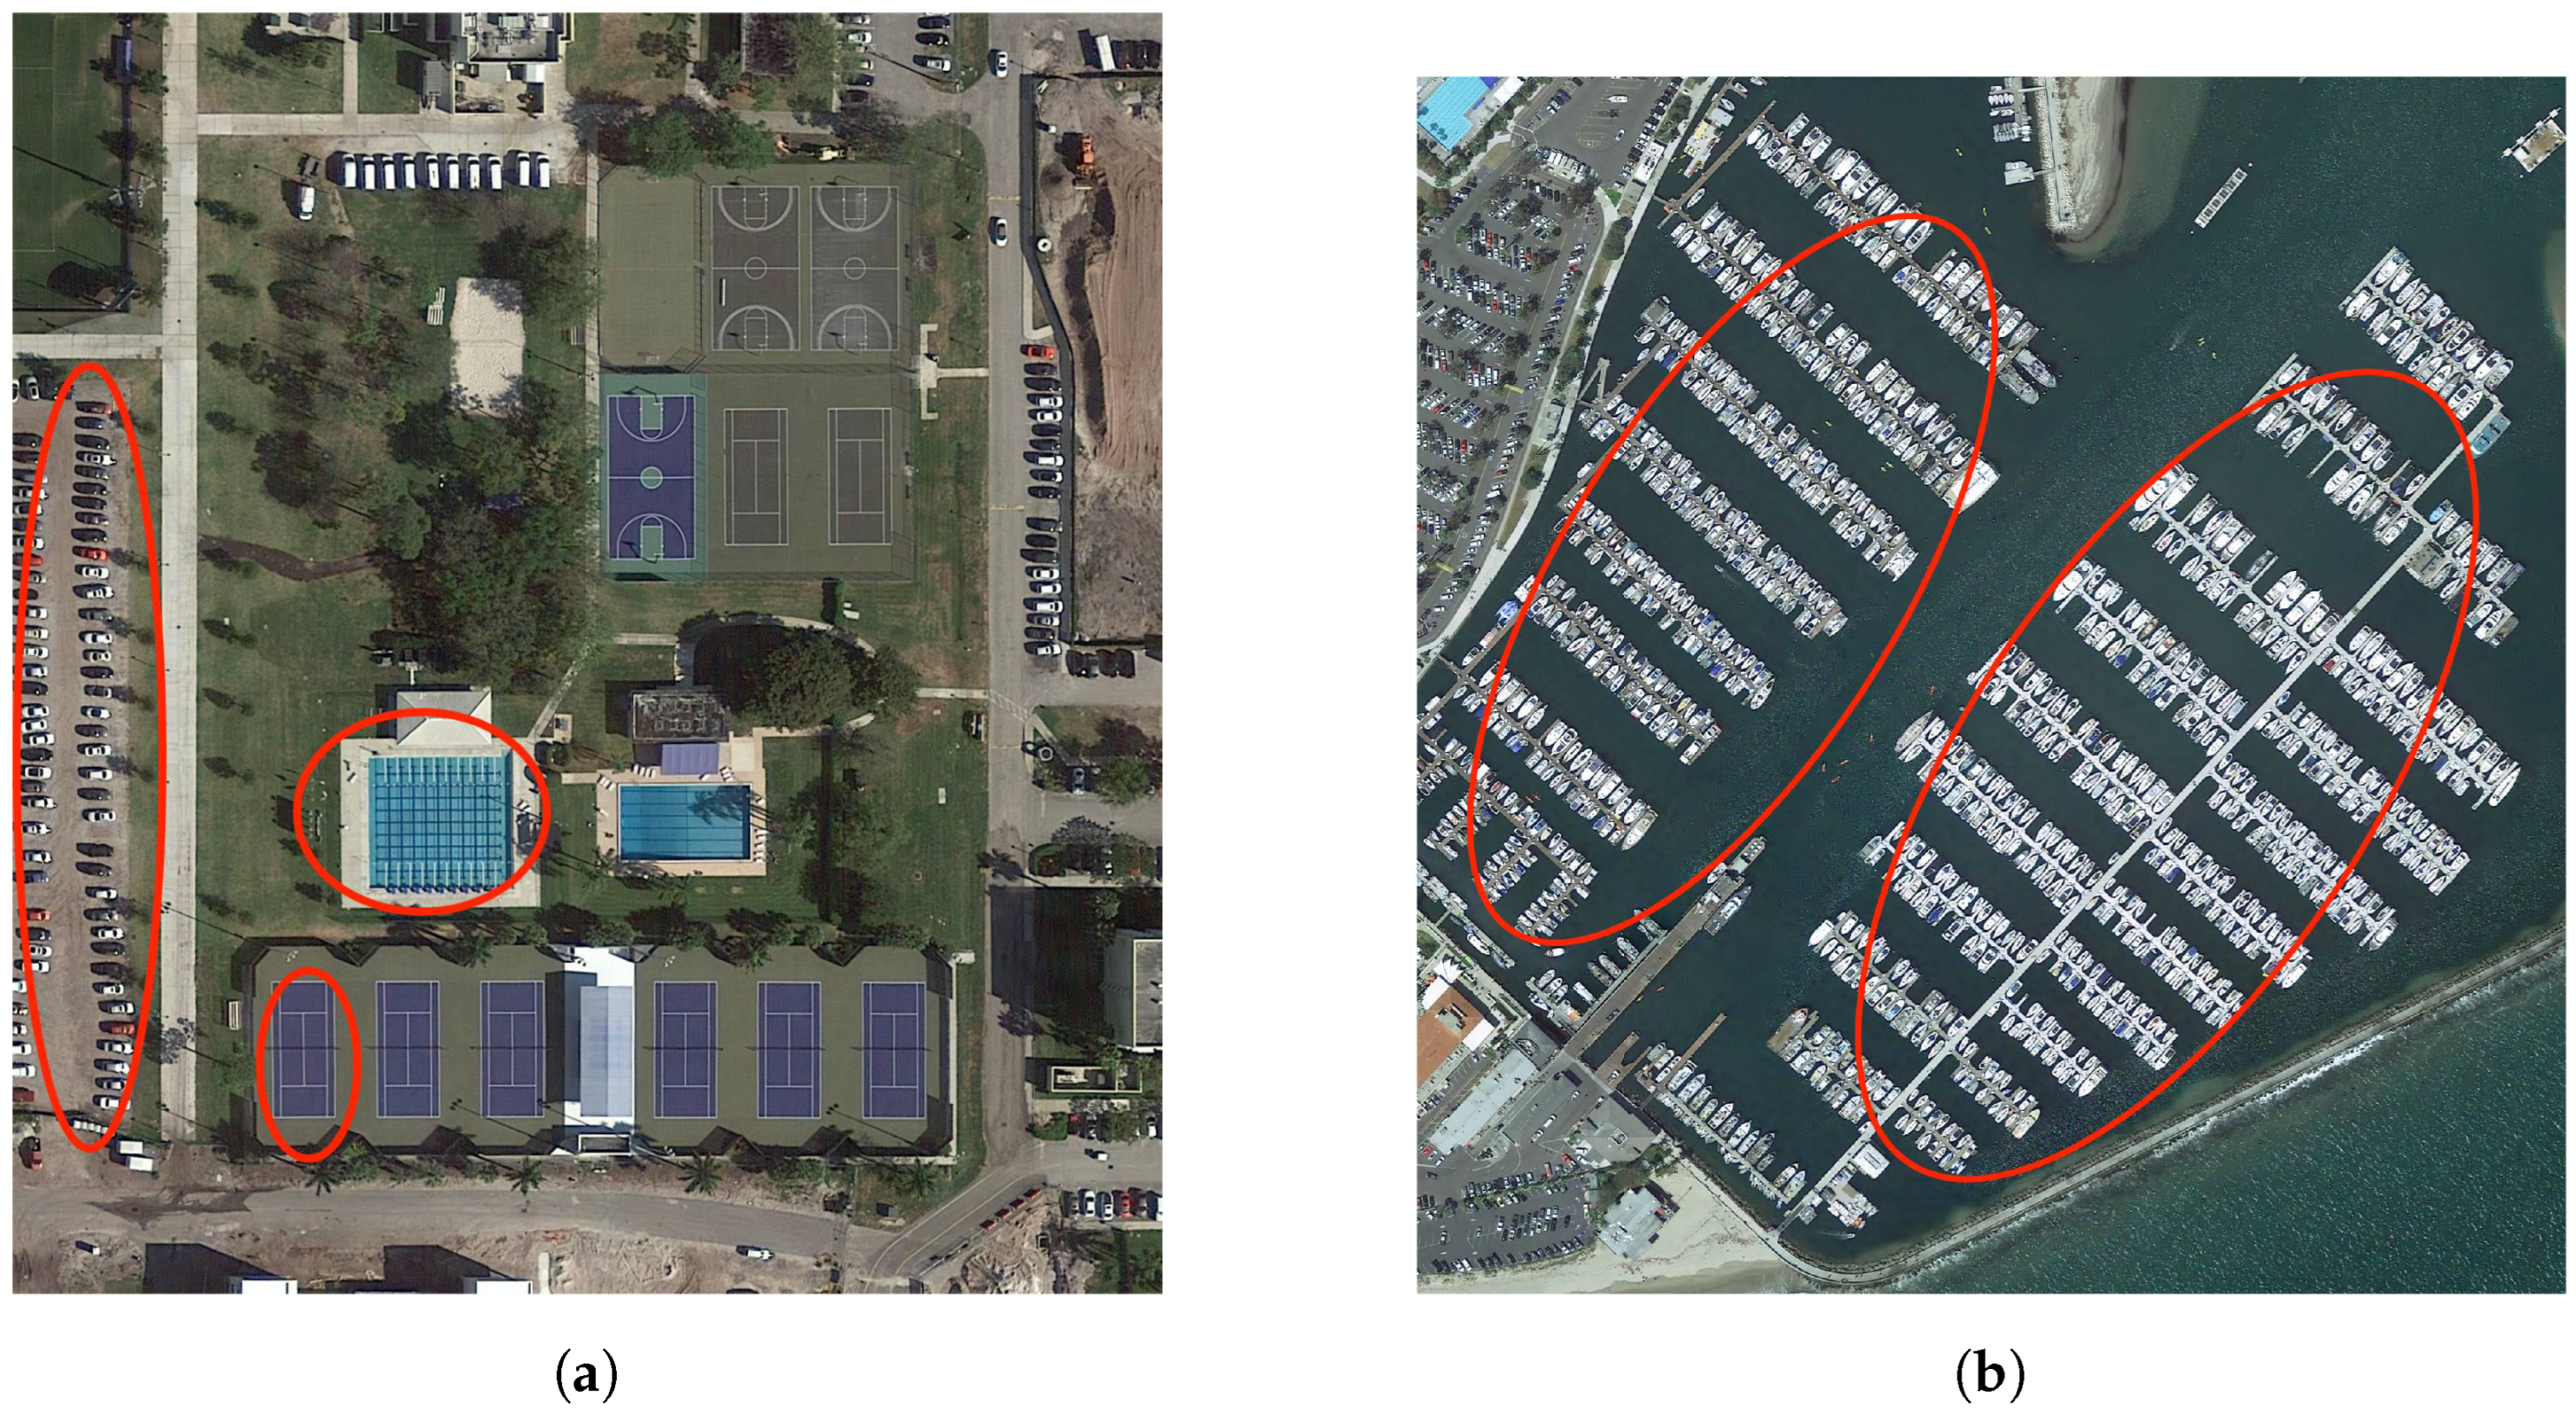
Although significant progress has been made in detecting objects in arbitrary orientations in remote sensing images, research on dynamic feature extraction in designing backbone feature extraction networks remains relatively insufficient. In real-world scenarios of remote sensing images, there is often a notable difference in the sizes of objects. For instance, in the scene shown in
Figure 1a, there are obvious scale differences between swimming pools, tennis courts, and small vehicles. If the backbone network can capture rich contextual information of objects with different scales, it would help the model better understand the spatial distribution and scale variations of the objects. Therefore, when handling objects of various scales in remote sensing images, the backbone feature extraction network needs to dynamically acquire contextual information and adjust the receptive field of the convolutional network according to the size of the objects. This dynamic feature extraction approach can more effectively handle objects with significant scale differences in remote sensing images, providing strong support for high-precision object detection. Secondly, as shown in
Figure 1b, in densely distributed object detection scenarios, most existing oriented object detection methods are anchor-based and use angle distance loss to optimize angle parameters. However, this type of loss function primarily focuses on reducing angle loss while neglecting the close association with the overall IoU. This leads to insensitivity to objects with high aspect ratios. Additionally, although IoU loss based on rotation angles can better evaluate the overlap of oriented boxes, it has shortcomings in gradient optimization, particularly when two bounding boxes have many intersection points (such as when they are completely overlapping or edge overlapping). In such cases, the calculation of SkewIoU is non-differentiable, which limits training efficiency and prediction accuracy [
18]. This constrains the improvement of the model’s prediction accuracy.
This paper introduces the Adaptive Spatial Information Perception Network (ASIPNet), an innovative approach designed to tackle the challenges of object detection in remote sensing imagery. ASIPNet is not only adept at capturing rich contextual information of targets across various scales but also at enhancing the detection accuracy of targets with high aspect ratios. The main contributions of this paper are as follows:
Adaptive Spatial Information Perception Module (ASIPM): We have developed a plug-and-play ASIPM that broadens the receptive field through the strategic overlay of large convolutional kernels. This design enables the acquisition of comprehensive spatial background information. By dynamically adjusting the size of the convolutional receptive fields via distinct branches, the module achieves adaptive spatial perception, enhancing the utilization of background information and improving detection accuracy.
KFIoU-based Regression Method: Addressing the limitations of existing methods, which use angle distance loss and show limited correlation with the overall Intersection over Union (IoU) metric, we propose a novel regression method for oriented bounding boxes based on the KFIoU loss. This approach simulates the calculation of SkewIoU using a Gaussian distribution, effectively mitigating the issues of gradient explosion and non-differentiability associated with certain SkewIoU calculations, and thus, accelerating the convergence of oriented object detection.
ASIPNet for Oriented Object Detection: We introduce ASIPNet, a state-of-the-art network for oriented object detection that effectively tackles the problem of low detection accuracy in complex backgrounds and densely packed object scenarios. This network not only significantly improves the detection accuracy of objects in remote sensing images but also achieves optimization in complex detection scenarios by reducing the parameter count.
3. Method
3.1. The Overall Architecture of ASIPNet
In the realm of object detection, anchor-free detection algorithms have emerged as a significant advancement by discarding the traditional reliance on anchor points, reducing the computational complexity of models and the number of hyperparameters, which in turn enhances overall model performance. Recently, anchor-free techniques have shifted towards identifying key points for object detection, aiming to alleviate computational load and streamline model design. YOLOv8 stands out as an exemplary single-stage, anchor-free model within the YOLO series, demonstrating exceptional performance in object detection tasks. Owing to its merits, we have chosen the competitive single-stage, anchor-free, and oriented object detection model YOLOv8OBB as our baseline. The backbone of YOLOv8 utilizes CSPDarkNet53 for feature extraction from images, employs a PAN-FPN structure for feature fusion, and culminates in three detection heads that output feature maps of varying sizes, capturing multi-scale image information effectively.
The overall architecture of the ASIPNet network proposed in this paper is shown in
Figure 2. Addressing the issue of insufficient capability to extract multi-scale object features in complex backgrounds, we innovatively design the plug-and-play ASIPM module to replace the convolution modules of the backbone network, enhancing feature extraction capability. When calculating ProbIoU for oriented object detection, Gaussian distribution distance metrics can lead to gradient explosions. To address this issue, we introduce the KFIoU loss function, which approximates SkewIoU in the loss function instead of the ProbIoU method. Through these key improvements, the proposed ASIPNet not only enhances the feature extraction capability of multi-scale information in complex backgrounds but also effectively avoids the gradient explosion issues that can occur in oriented object detection.
3.2. ASIPM
In remote sensing images, the scale differences of some objects can be significant, requiring different receptive fields for objects of various sizes. In complex remote sensing image backgrounds, a dynamic receptive field is crucial. Dilated convolution introduces a new parameter called the dilation rate, which primarily defines the distance between values when the convolution kernel processes data and can provide a larger receptive field under the same computational load. Group convolution divides the input feature map into multiple groups and performs convolution operations simultaneously in the respective groups. Each group uses an independent convolution kernel for computation, and all groups are finally combined to form the output feature map. Compared to standard convolution, group convolution reduces the number of parameters and introduces a certain degree of feature interaction. Depthwise separable convolution, which follows group convolution, overlays a pointwise convolution to achieve channel fusion. This reduces computational load while maintaining feature representation capabilities comparable to standard convolution. Therefore, in the proposed ASIPM module, we combine three modules: dilated convolution, group convolution, and depthwise separable convolution.
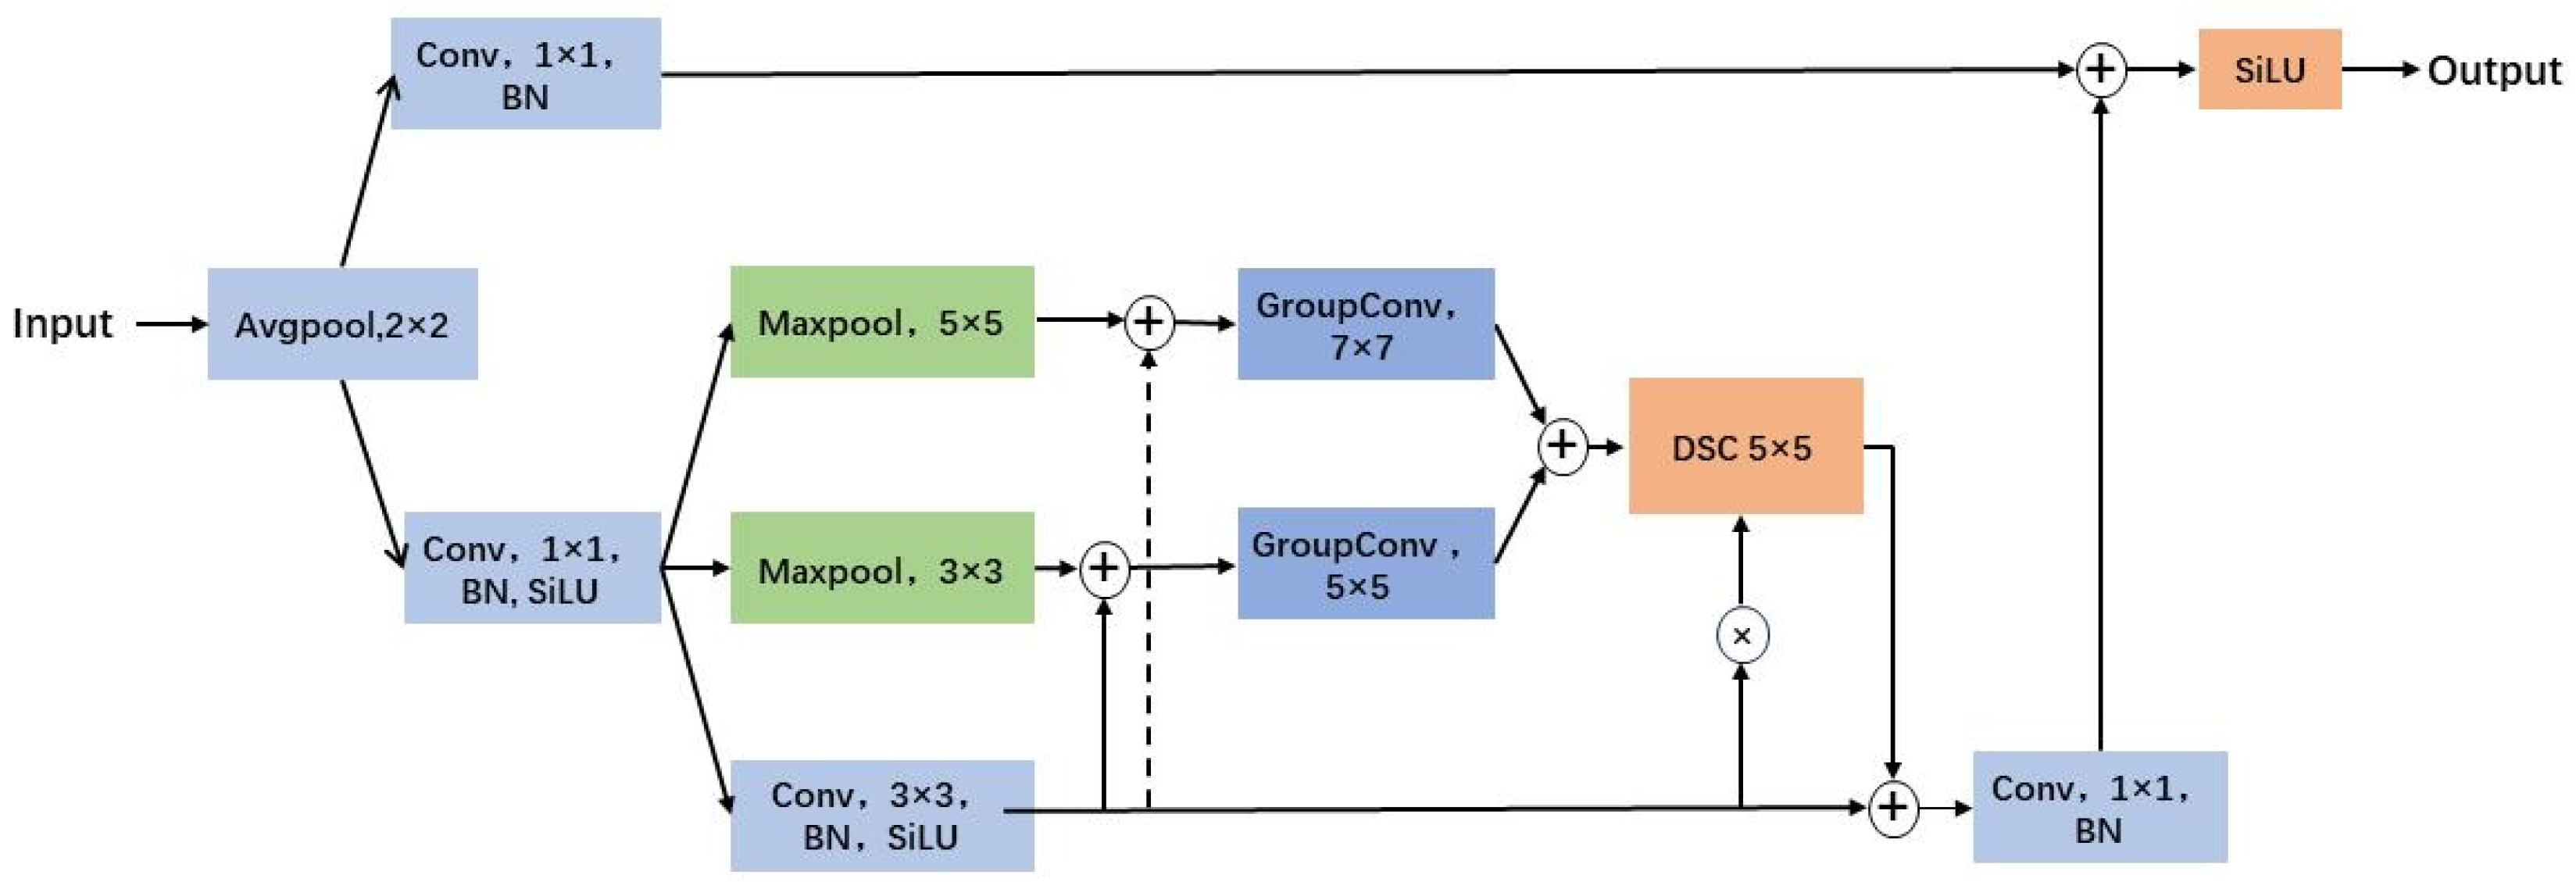
As shown in
Figure 3, for the input feature I, we first perform average pooling on the feature map. This helps reduce feature variations and fluctuations, decreases the model’s overfitting to the training data, and improves the model’s generalization ability. The formula can be expressed as
The representation of the output feature after average pooling is denoted as
, where
() represents average pooling and k represents the kernel size, with k set to 2 in Equation (
1).
Then, along the channel dimension, the feature is split into two parts. Each part undergoes channel reduction using 1 × 1 convolutions. In contrast to traditional residual blocks, we designed a three-branch architecture. The first branch is the traditional residual block branch, which can be represented as
The residual feature representation is denoted as
, where
() represents convolution with a kernel size k, followed by normalization and SiLU activation operation. In Equation (
2), k takes values 3 and 1, respectively. Chunk() indicates splitting the feature map along the channel dimension.
The latter two branches achieve feature extraction using larger receptive field convolution kernels. Initially, features undergo downsampling through global max pooling with kernel sizes of 3 and 5, followed by feature extraction using 5 × 5 grouped convolution and 7 × 7 grouped convolution with a dilation rate of 3. The latter two branches can be expressed as
The features after grouped convolution are represented as
,
.
() denotes grouped convolution,
() denotes max pooling, and k and d respectively indicate the kernel size and dilation rate. ⊕ signifies element-wise addition of feature maps. In Equation (
3), k is set to 5 and d is set to 1 for
(); k is set to 5 for
(); and k is set to 1 for
(). In Equation (
4), k is set to 7 and d is set to 3 for
(); k is set to 5 for
(); and k is set to 1 for
().
The element-wise addition operation of feature maps enhances important features between the two feature maps while reducing noise. The aforementioned dual-branch with dynamic receptive fields is fused via element-wise addition and then inputted into a depth-wise separable convolution module. This output further undergoes element-wise multiplication with the traditional residual block branch to highlight common features. Finally, adding a residual connection achieves enhanced features through the three-branch approach. This can be expressed as
The enhanced features through the three-branch approach are denoted as
, where
() represents a standard depth-wise separable convolution block including normalization and activation functions, and ⊙ signifies element-wise multiplication between feature maps. In Equation (
5), k for
() is set to 5, and d for
() is set to 5. The element-wise multiplication of feature maps can enhance common features and suppress unimportant features. ASIPM utilizes a multi-branch structure where each branch corresponds to convolution layers with different receptive field sizes. Finally, our network fuses the features extracted by adaptive receptive field convolution kernels and improves feature representation in scenes with significant object scale differences through element-wise multiplication with residual connections. We also conducted visual analysis on the designed model, as shown in
Figure 4. It is evident from the feature maps that the ASIPM module performs better in feature extraction.
3.3. KFIoU
Oriented object detection is more complex compared to horizontal object detection, especially when it comes to locating objects and separating them from the background in arbitrary orientations. Traditional SkewIoU loss evaluates the overlap of oriented boxes effectively, but it poses challenges for gradient optimization. Particularly when two bounding boxes have many intersection points (such as complete overlap or edge overlap), SkewIoU loss calculation becomes non-differentiable, limiting training efficiency and prediction accuracy.
Based on the Gaussian model and Gaussian product, KFIoU [
18] designed an efficient SkewIoU approximate loss that avoids operations not implemented in deep learning frameworks (such as edge intersections and vertex sorting) and is fully differentiable. KFIoU loss effectively handles non-overlapping scenarios, which is crucial for optimizing detector performance by ensuring gradient information remains effective throughout the training process. In contrast to oriented detector losses based on Gaussian models (like GWD and KLD losses), KFIoU loss does not require manual specification of distribution distance metrics and associated hyperparameter adjustments, reducing the burden of hyperparameter tuning. By simulating the SkewIoU mechanism through the product of Gaussian distributions and demonstrating trend consistency with SkewIoU loss within a certain pixel deviation range (up to a maximum deviation range of nine pixels), KFIoU contributes to resolving consistency issues between metrics and loss functions, further enhancing model performance. For very thin and elongated objects, when the object’s size along one axis is extremely small, misalignment between the ground truth bounding box and the predicted bounding box in the baseline model’s ProbIoU with Bhattacharyya distance (
) can lead to large gradients in the parameters w or h. This instability during training can affect the convergence of the detection box. Therefore, we replaced ProbIoU in the baseline model with KFIoU, which does not construct the loss function based on distribution distance metrics, but instead simulates the calculation process of SkewIoU using Gaussian distributions. This approach achieves better detection performance for oriented objects without the need for hyperparameter tuning. The Bhattacharyya coefficient (
) is calculated based on the probability density functions p(x) and q(x) of the ground truth bounding box and the predicted bounding box, as shown in Formula (6).
When and only when two distributions are exactly the same,
= 1. Based on
, the Bhattacharyya distance (
) between different distributions can be obtained, as shown in Formula (7).
KFIoU still adopts Gaussian modeling, and the specific steps are illustrated in
Figure 5.
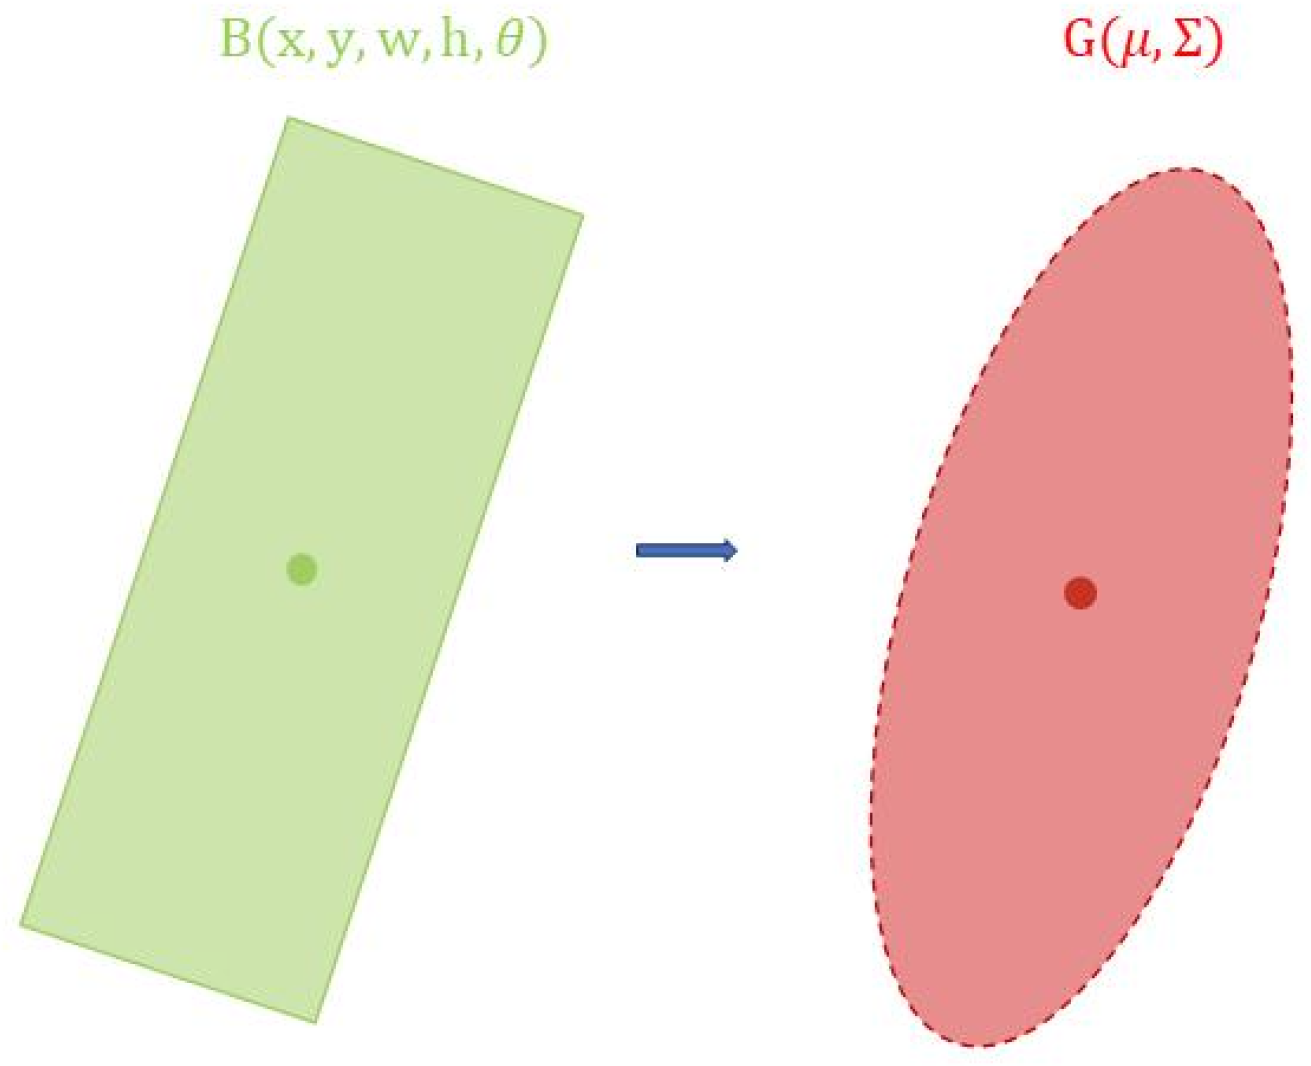
First, we use a two-dimensional, orinented Gaussian distribution to represent an object, as shown in
Figure 6. Specifically, this involves using mean vectors
and covariance matrices
to transform any oriented bounding box into a two-dimensional Gaussian distribution, as formulated in Equations (8) and (9).
Then we introduce the center point loss
to bring the center of the Gaussian distribution of the predicted bounding box closer to the ground truth bounding box, as depicted in Step 2 of
Figure 5. The formula is given by Equation (
10).
Then we multiply the two Gaussian distributions to obtain the Gaussian distribution of the intersection area, as shown in Step 3 of
Figure 5. The formula is given by Equation (
11).
,
.
Finally, we convert the three Gaussian distributions back into oriented rectangles to compute the approximate oriented IoU, as shown in Step 4 of
Figure 5. The formula is given by Equation (
12).
4. Experiments
4.1. Datasets
In this paper, we use the DOTAv1 [
33] and DIOR-R [
34] datasets for experiments. These two datasets are widely used in the field of remote sensing image object detection, and they are both multi-class datasets.
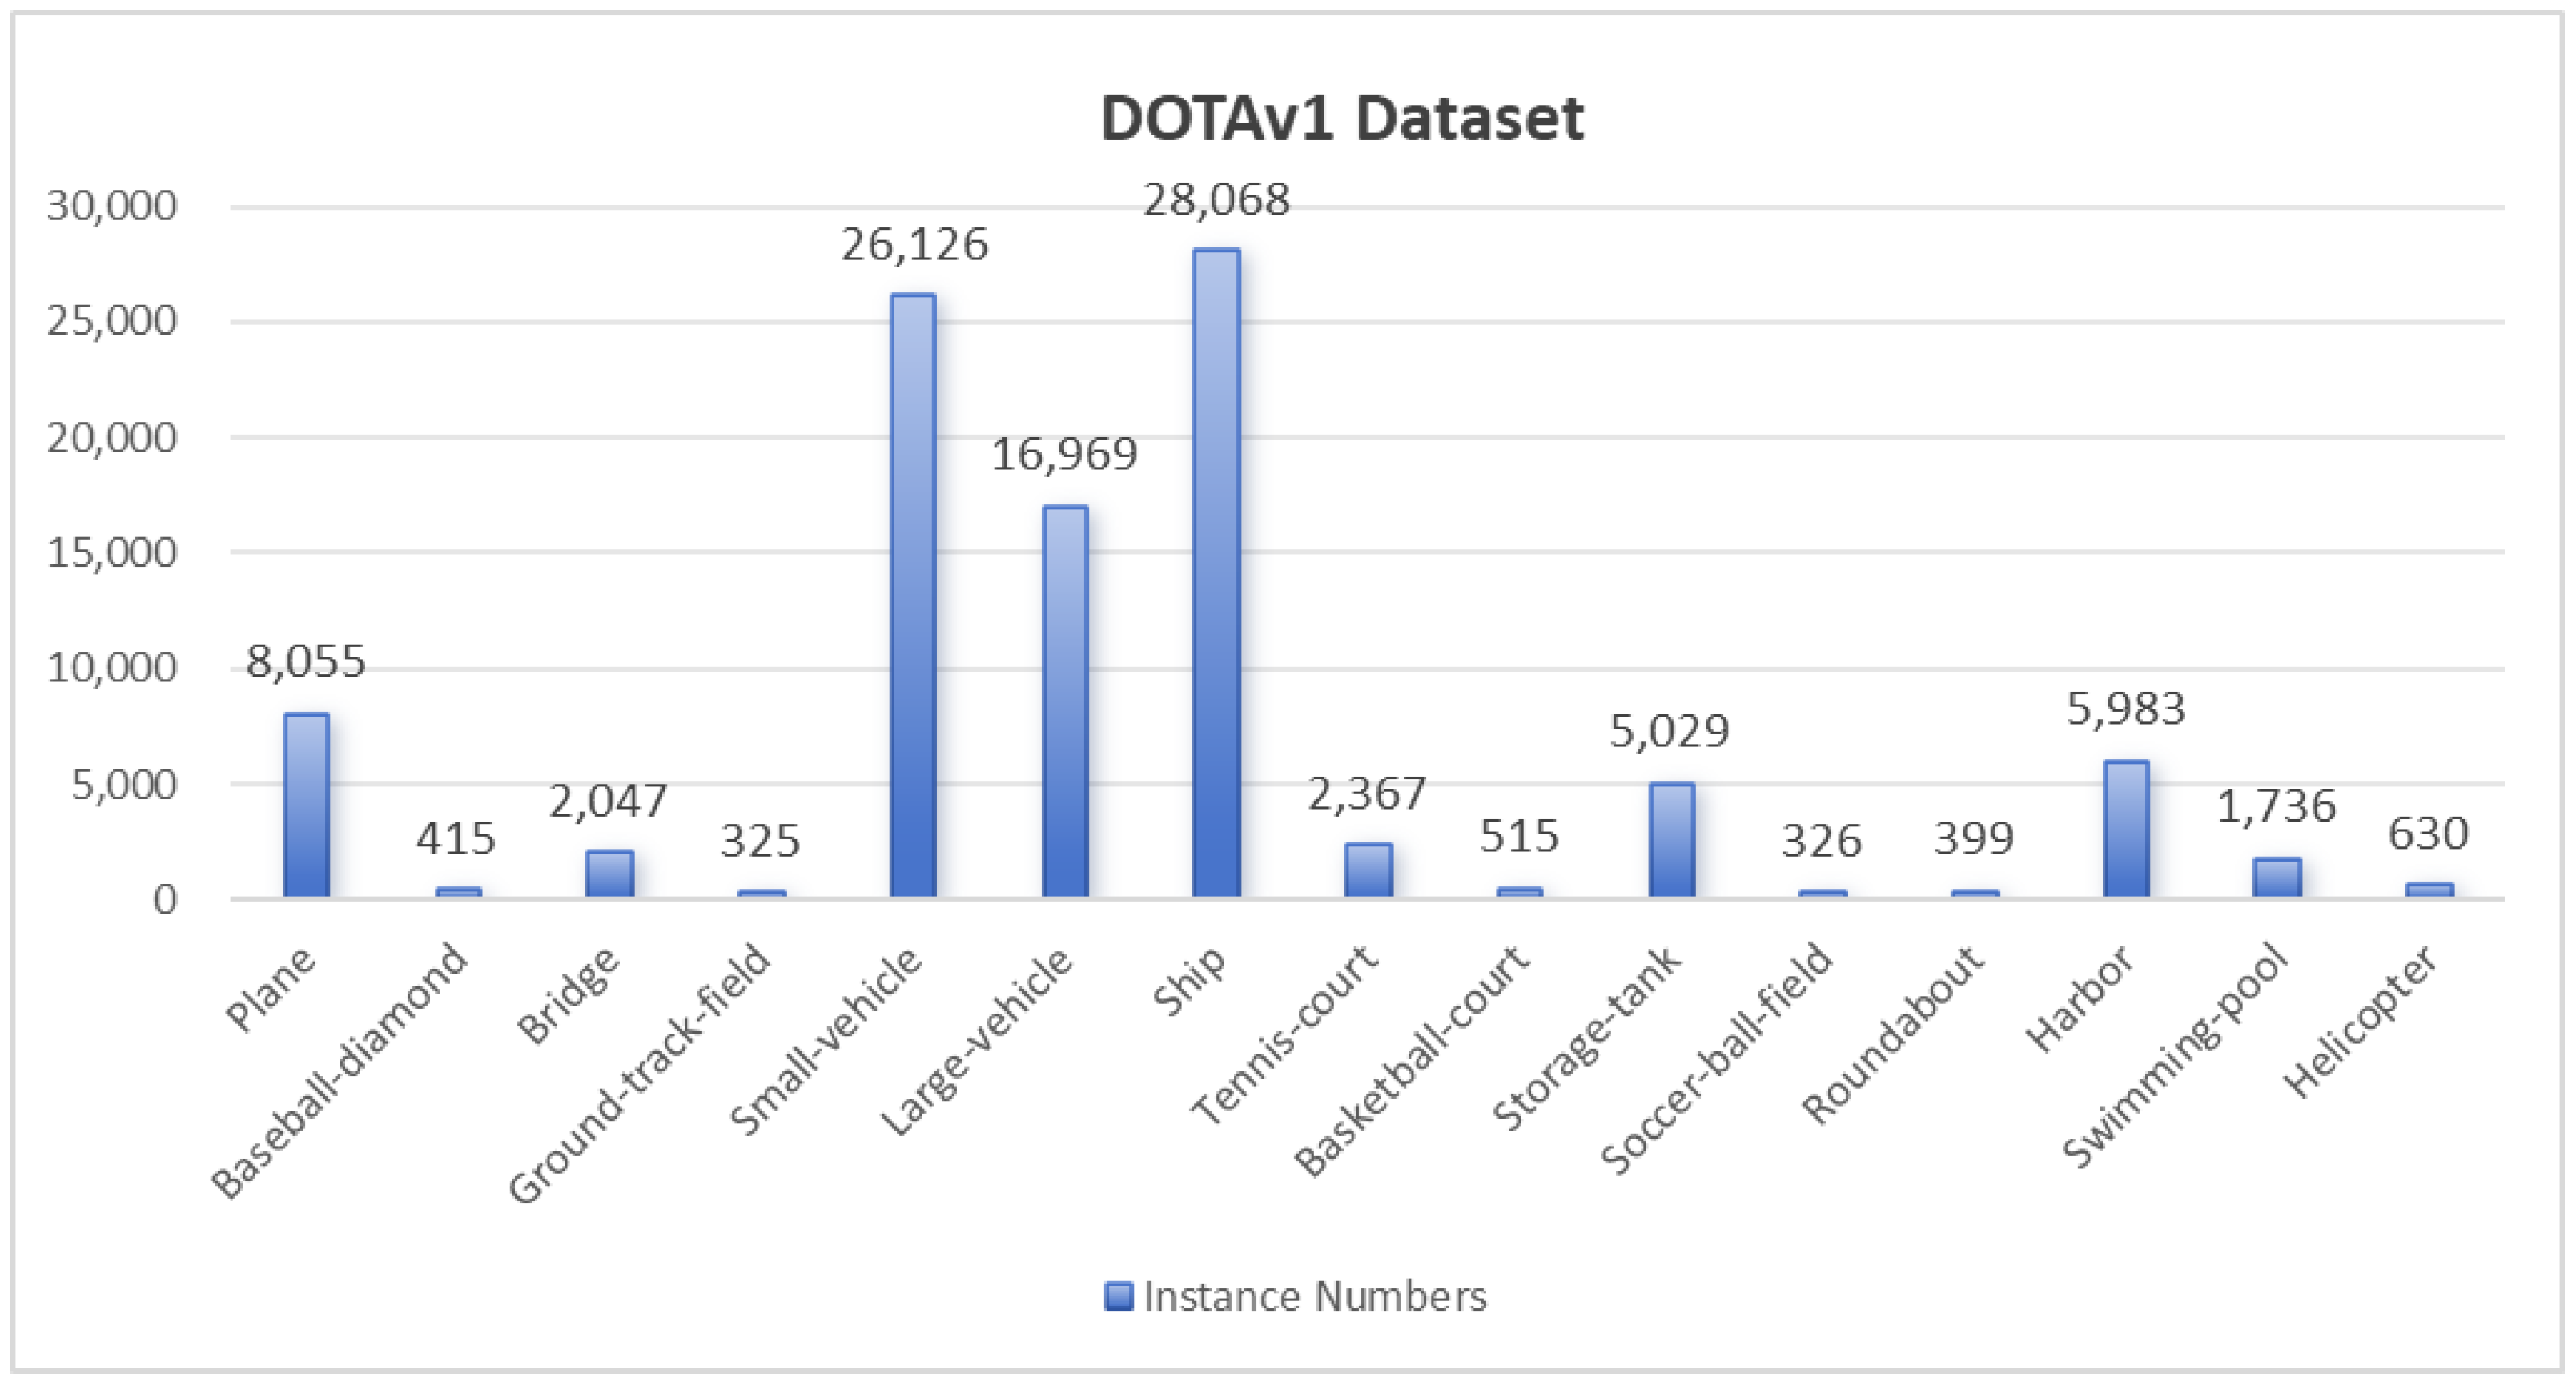
The DOTAv1 dataset comprises 2806 aerial images annotated with 15 categories and 400,000 oriented object instances. The category includes: airplane (PL), baseball diamond (BD), bridge (BR), ground track field (GTF), small vehicle (SV), large vehicle (LV), ship (SH), tennis court (TC), basketball court (BC), storage tank (ST), soccer ball field (SBF), roundabout (RA), harbor (HA), swimming pool (SP), and Helicopter(HC). The number of instances per category in the training set is shown in
Figure 7.
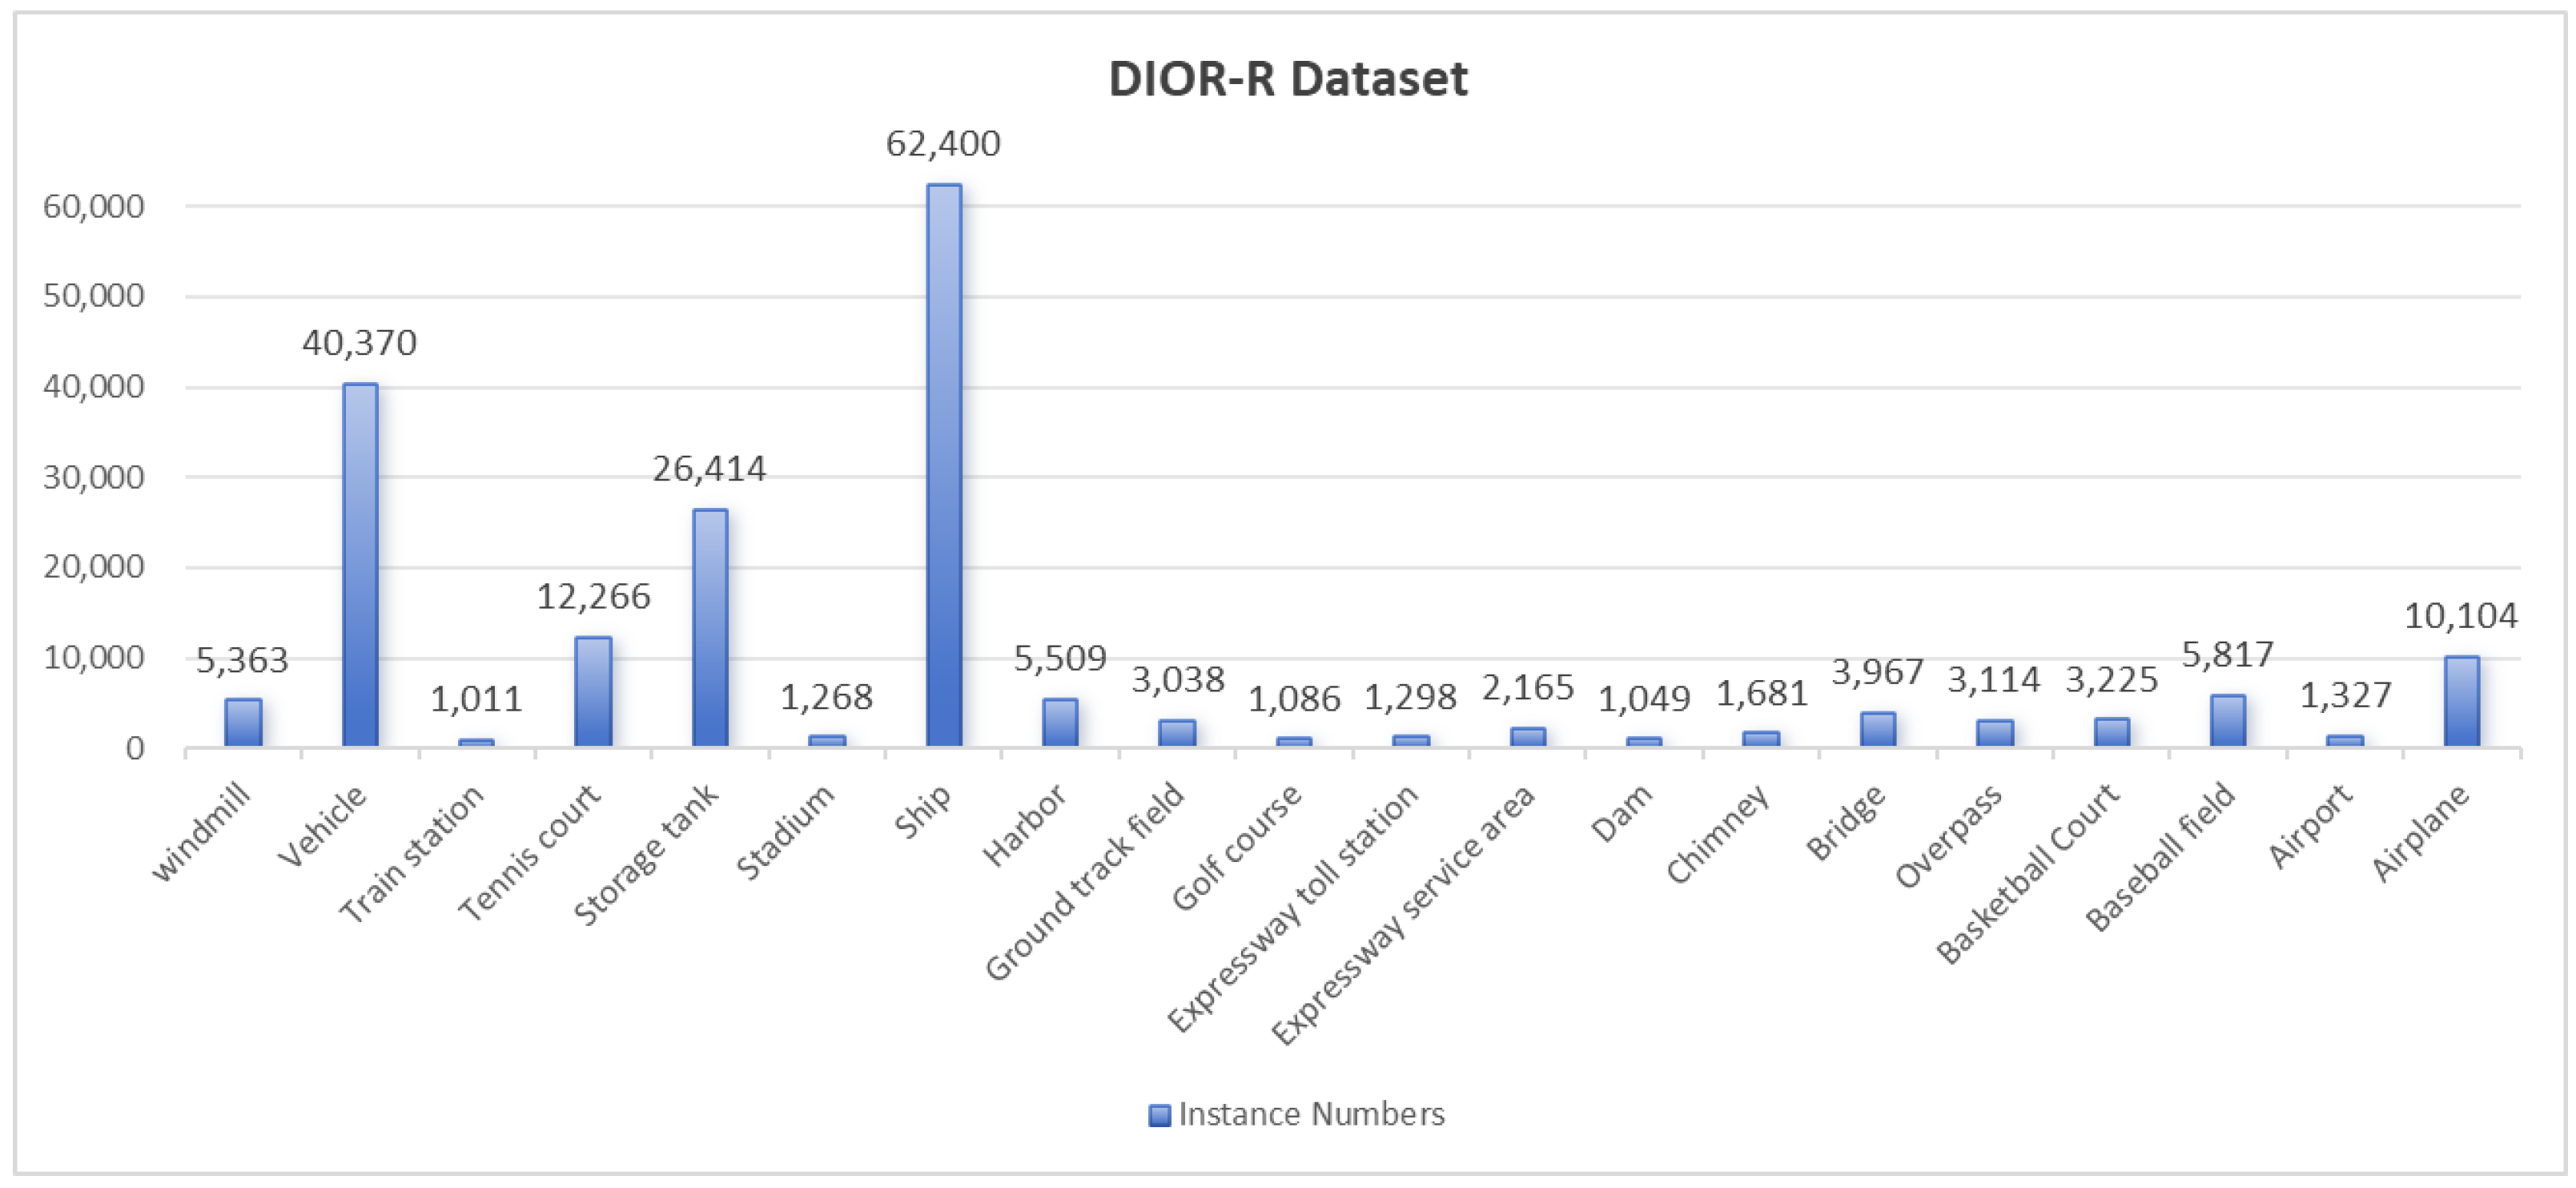
DIOR-R is an extension of the DIOR dataset, consisting of 23,463 high-resolution optical remote sensing images sized at 800 × 800 pixels. It includes 192,472 instances of oriented bounding boxes across 20 object categories. The categories are: airplane (APL), airport (APO), baseball field (BF), basketball court (BC), bridge (BR), chimney (CH), dam (DAM), expressway service area (ESA), expressway toll station (ETS), golf course (GF), ground track field (GTF), harbor (HA), overpass (OP), ship (SH), stadium (STA), storage tank (STO), tennis court (TC), train station (TS), vehicle (VE), and windmill (WM). The number of instances per category is illustrated in
Figure 8.
4.2. Implementation Details
The experimental setup in this study used Ubuntu 22.04 LTS as the operating system, an Intel(R) Core(TM) i9-9900K CPU, NVIDIA GeForce RTX 2080Ti GPU with 11 GB VRAM. PyTorch framework version is 2.2.1, and CUDA version is 11.8. To ensure fairness and comparability of model performance, all comparative and ablation experiments in the study were conducted without using any pretrained weights. The training batch size was set to 8, the number of epochs to 100, SGD was used as the optimizer, momentum is set to 0.937, the initial learning rate is 0.01, and the weight decay is 0.0005.
The image size of the DOTAv1 dataset is extensive: from 800 × 800 to 4000 × 4000 pixels. For the sake of fairness, we adopt the same dataset processing method as other mainstream methods [
19,
21]. We crop the raw images into 1024 × 1024 patches with a stride of 824, which means the pixel overlap between two adjacent patches is 200. Following the common practice, we use both the training set and the validation set for training, and the testing set for testing. The mean average precision and the average precision of each category are obtained by submitting the testing results to the official evaluation server of the DOTA dataset.
For the DIOR-R dataset, we used the original image size of 800 × 800 without any processing. During training, we trained on the DIOR-R training set and validation set, and finally tested on the DIOR-R test set.
4.3. Evaluation Metrics
This paper focuses on studying precision (P), recall (R), floating point operations (FLOPs), Mean Average Precision (mAP), frames per second (FPS) and model size as performance metrics for the algorithm. The specific formulas for precision and recall are shown in Equations (13) and (14).
where TP represents the number of true positive samples correctly detected by the algorithm, FP is the number of negative samples incorrectly identified as positive, and FN is the number of positive samples incorrectly identified as negative by the algorithm. The P-R curve is plotted based on the values of P and R, and the AP value is obtained by integrating the curve, representing the detection accuracy of a single class in the dataset. The specific calculation formula is shown in the Equation (
15).
For multi-class object detection, the mAP (mean Average Precision) is obtained by averaging the sum of AP values for each class. The calculation formula is shown in the Equation (
16).
mAP0.5 refers to the AP value at an IoU threshold of 0.5. For each IoU threshold ranging from 0.5 to 0.95 with an increment of 0.05, AP values are calculated and then averaged to obtain mAP0.5:0.95. The calculation formula is shown in Equation (
17).
n represents the number of detected categories. By using mAP0.5 and mAP0.5:0.95, we evaluate the model’s ability to accurately detect objects in remote sensing images at different IoU thresholds. Additionally, the performance of the proposed model is described in terms of parameter count and GFLOPs. GFLOPs represent the computational complexity required by the model, serving as a measure of its complexity. Params reflect the number of parameters contained in the model.
4.4. Comparison with State-of-the-Art Methods
In this paper, we conducted a series of comparative experiments to evaluate the performance of our proposed ASIPNet against other state-of-the-art methods in the task of object detection in remote sensing images.
4.4.1. Comparison Results on DOTAv1 Dataset
We conducted a comprehensive evaluation of our method on the DOTAv1 dataset, benchmarking it against current leading approaches in the field. As detailed in
Table 1, our proposed method demonstrated superior detection performance, achieving an mAP of 76.00%. This represents a notable enhancement of 2.5% over the baseline YOLOv8 model. When juxtaposed with anchor-free methodologies, our technique exhibited a slight yet significant mAP improvement of 0.03% over the Oriented RepPoints, which utilizes the R-50-FPN backbone architecture.
In the context of single-stage anchor-based methods, our approach demonstrated a marked superiority, with a specific mAP increase of 1.08% compared to the SASM method. However, there remains a discernible accuracy gap when compared to transformer-based models, such as AO2-DETR. When pitted against two-stage anchor-based methods, our method proved to be even more competitive, surpassing the majority of existing solutions. Notably, our algorithm realized mAP improvements of 7.95%, 7.42%, and 0.13% over Faster R-CNN-O, RoI Transformer, and Oriented R-CNN, respectively. Despite these advancements, a minor discrepancy of 0.25% and a more substantial difference of 1.35% persist when compared to the ReDet and ARC methods, indicating room for further optimization. To comprehensively illustrate the performance of our proposed ASIPNet model compared to the YOLO series on the DOTAv1 dataset,
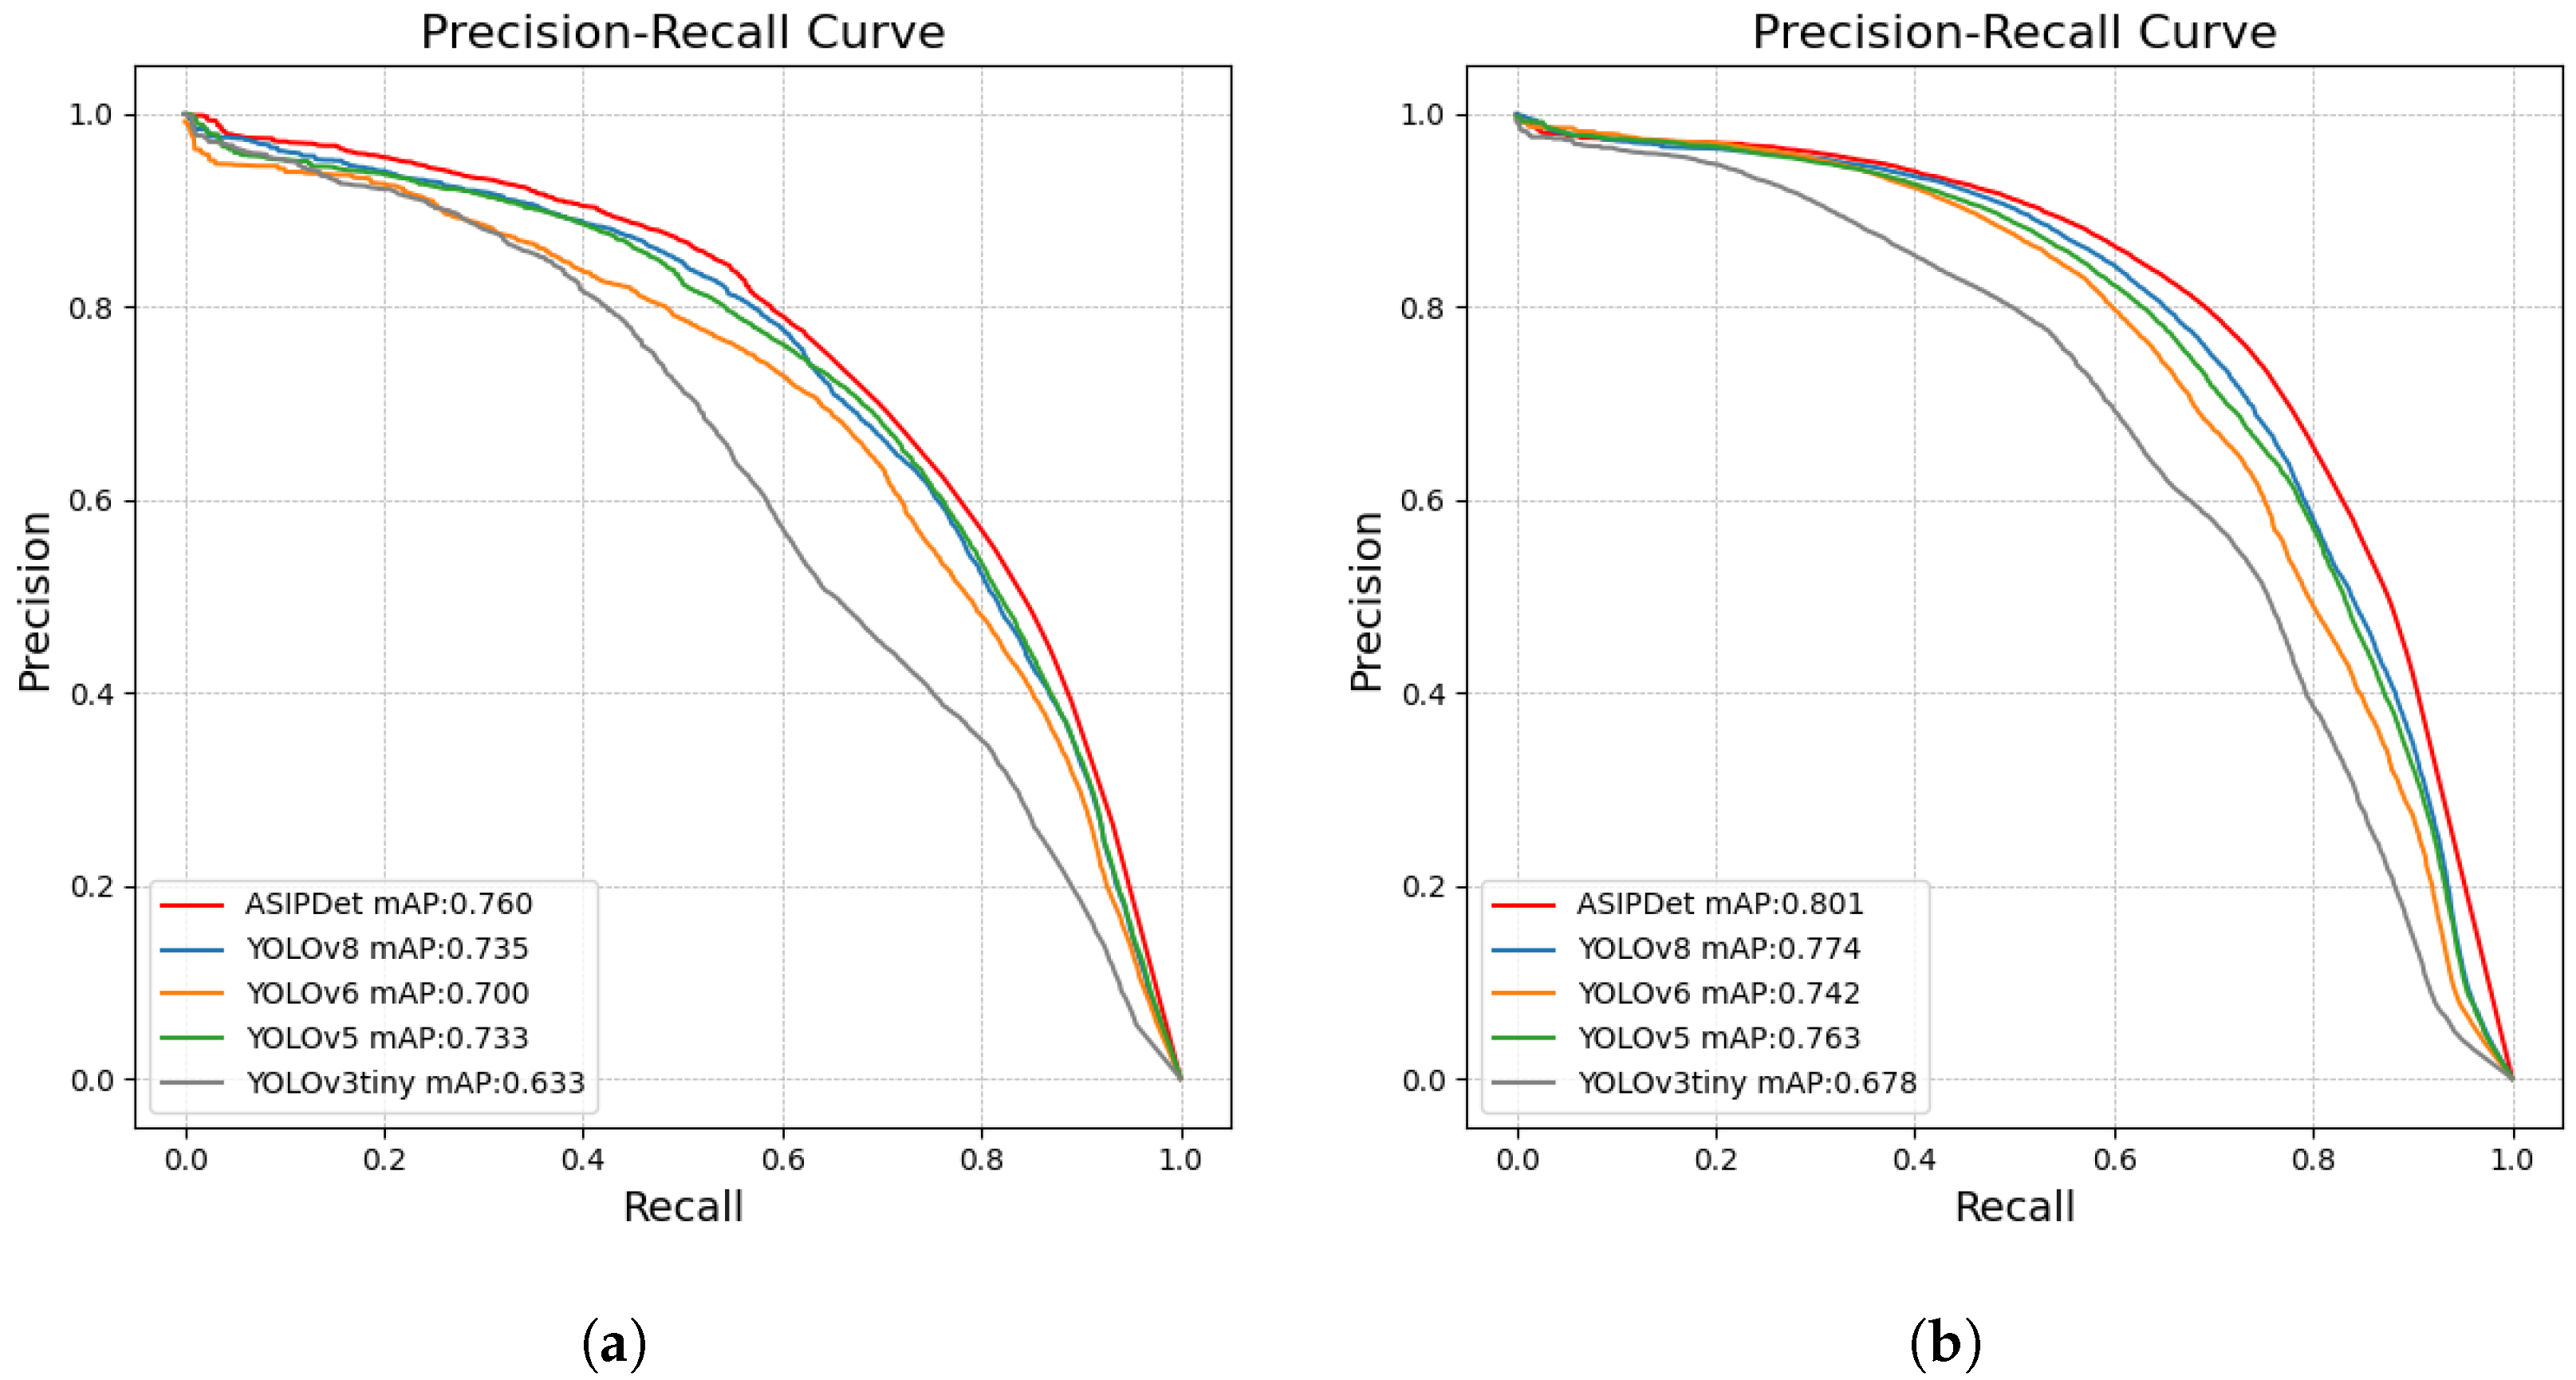
Figure 9a shows the PR curve comparison of various YOLO algorithms: YOLOv3-tiny, YOLOv5s, YOLOv6, and YOLOv8s. From the figure, it can be observed that the PR curve of the ASIPNet model demonstrates its ability to maintain high precision at various recall levels. Particularly in the high recall region, ASIPNet maintains a high level of accuracy, with mAP50 being 2.5% higher than the baseline model YOLOv8s, indicating its effective ability to identify positive classes while maintaining a low false positive rate.
In
Table 2, we also show the comparison of our model with yolov8s and yolov8m in terms of precision, recall, FPS, number of parameters, and FLOPs. It can be found that compared with yolov8s, yolov8m has an increase of 1.3% in mAP50, but the number of model parameters has increased by 15.0 M, the amount of computation has increased by 51.9 GFLOPs, and the FPS has decreased by 27. Our method is based on yolov8s. While the number of parameters and computation has decreased, the mAP50 value has increased by 2.5%, even surpassing yolov8m by 1.2%, which reflects the advantages of our model. However, it also sacrifices a certain detection speed.
4.4.2. Comparison Results on DIOR-R Dataset
Similarly, we evaluated our method on the DIOR-R dataset, as shown in
Table 3, which includes the AP values for each category and the mAP considering all categories on the DIOR-R dataset. From
Table 3, it can be observed that ASIPNet achieved an mAP of 80.1%, which is the highest among all models compared, demonstrating superior performance in object detection tasks. Analyzing the AP values for each category, our method showed the best performance in categories such as APO, BF, BC, BR, CH, DAM, ESA, GF, HA, OP, TC, TS, and VE. Compared to models like Faster R-CNN-O, Gliding Vertex, ASDet, RoI Transformer, Oriented R-CNN, AOPG, DODet, PIIDet-101, and YOLOv8s, our ASIPNet consistently outperformed them in terms of mAP. Particularly in detecting small objects, ASIPNet’s advantage was more pronounced, highlighting its capability in handling small objects.
Finally, we compared ASIPNet with other YOLO series algorithms using PR curves, as shown in
Figure 9b. ASIPNet demonstrated the highest precision among all compared models, especially maintaining high accuracy in the high recall region. Its mAP50 score was 2.7% higher than the baseline model YOLOv8s, indicating ASIPNet’s high reliability in practical applications.
4.5. Ablation Experiment
In our pursuit to validate the effectiveness of the proposed improvements in this study, we utilized YOLOv8s as the benchmark and conducted ablation experiments on the DOTAv1 dataset with rotated annotations. These experiments were designed to rigorously test the contributions of our novel modules.
4.5.1. Effectiveness Analysis of the Improved Modules on the YOLOv8s Benchmark Model
Firstly, we conducted ablation experiments for each improvement in the network. From the results of the ablation experiments in
Table 4, it can be seen that both proposed improvements effectively enhance detection accuracy. Firstly, replacing CBS module at the backbone with the plug-and-play ASIPM module in YOLOv8s increased mAP50 by 2.2%. Using KFIoU instead of ProbIoU improved mAP50 by 0.4% compared to the original algorithm. Incorporating both methods, ASIPNet achieved a 2.5% higher mAP compared to the base model, with precision increasing by 0.6%, recall by 0.7%, and a reduction of 1.6M parameters. This indicates that the improved algorithm not only reduces parameter count but also enhances the capability of detecting oriented objects in remote sensing images. This not only demonstrates the effectiveness of each component of our model but also validates the overall effectiveness of the improved network.
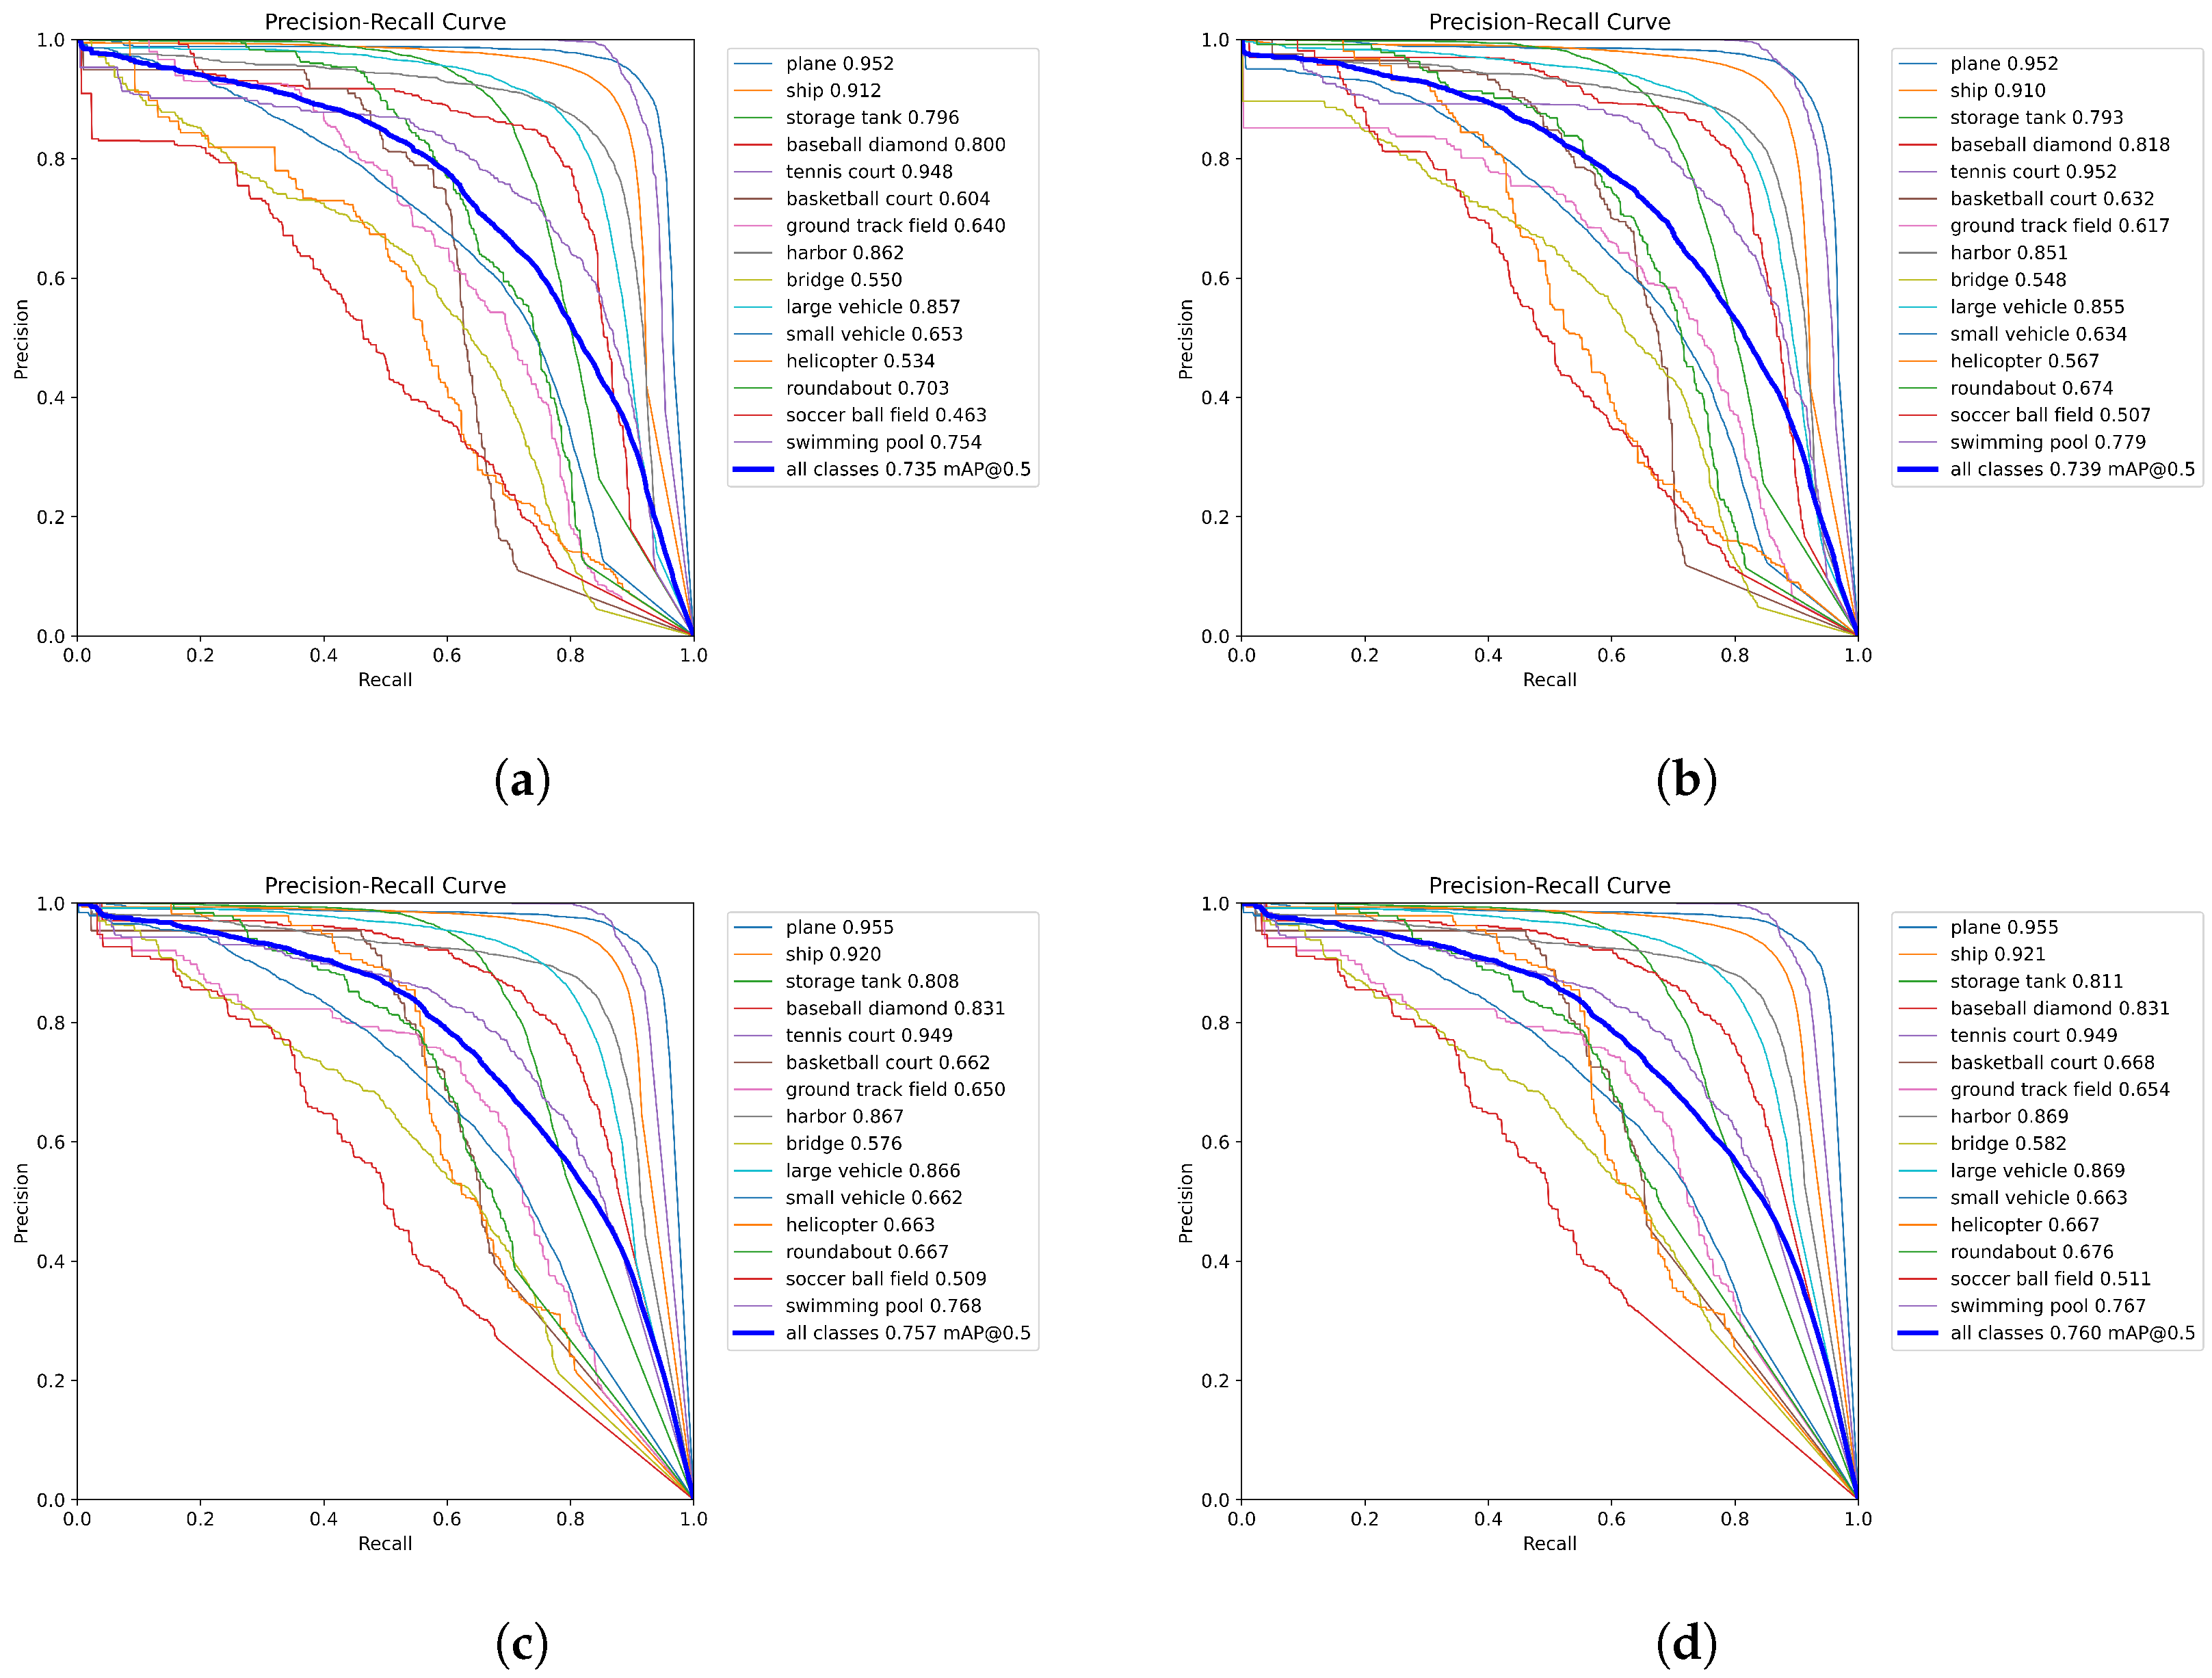
Figure 10 illustrates the impact of different modules on the performance of the image classification model.
Figure 10a shows the Precision-Recall (PR) curve of the baseline model, which, while providing foundational classification capabilities, does not perform optimally when faced with complex categories. With the introduction of the KFIoU module, as depicted in
Figure 10b, the model’s precision improves notably for several categories, such as baseball diamonds, tennis courts, and basketball courts. Furthermore, as shown in
Figure 10c, the addition of the ASIPM module further boosts the precision, indicating that ASIPM effectively enhances the model’s feature extraction and learning capabilities, further optimizing its classification performance. Finally,
Figure 10d presents the PR curve of the baseline model augmented with both KFIoU and ASIPM. Through comparative analysis, it is evident that our proposed approach significantly increases the model’s precision across multiple recall levels, not only demonstrating the synergistic effect of the KFIoU and ASIPM modules but also showcasing a substantial improvement in the model’s overall performance.
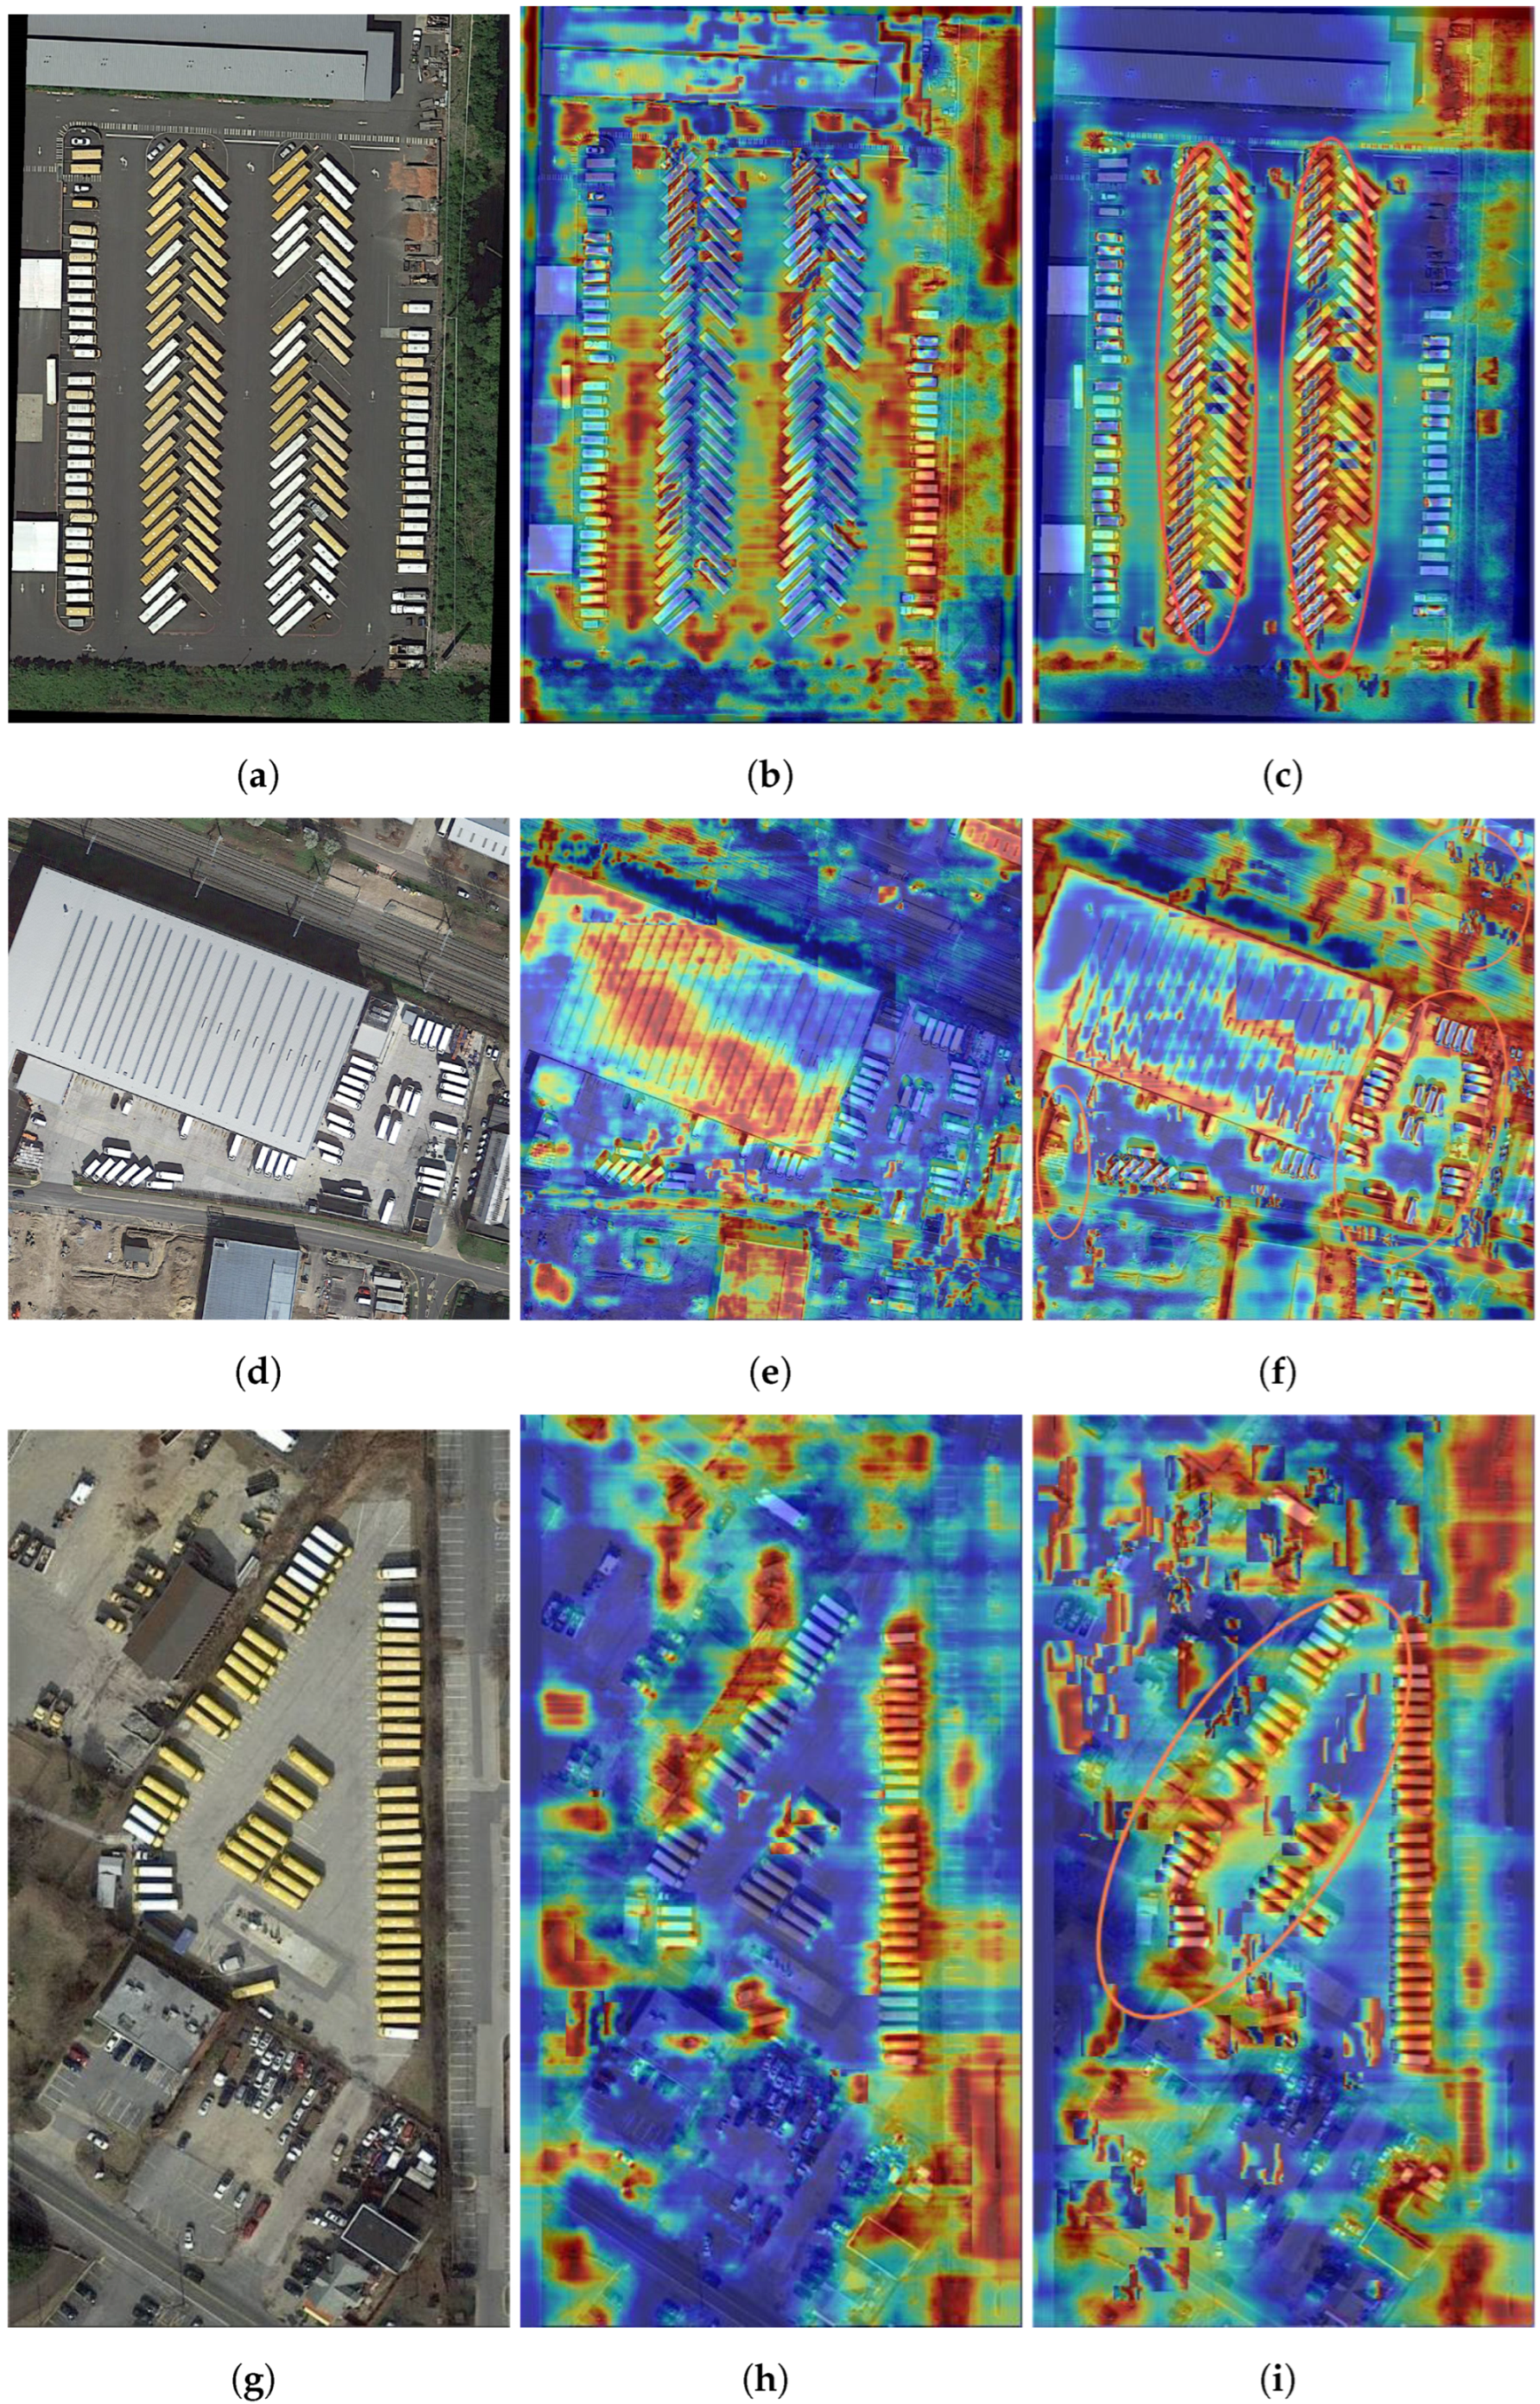
Furthermore, we conducted visual analysis comparing our method with the baseline network. As shown in
Figure 11, through comparing the performance of heatmaps, we found that our ASIPNet network concentrates warmer regions near small objects, demonstrating its strong capability to capture features of these subtle and easily overlooked objects. This means the network not only effectively distinguishes these small objects from their complex backgrounds but also reduces the likelihood of false positives and negatives while maintaining high sensitivity. This capability is crucial in remote sensing image detection. As depicted in
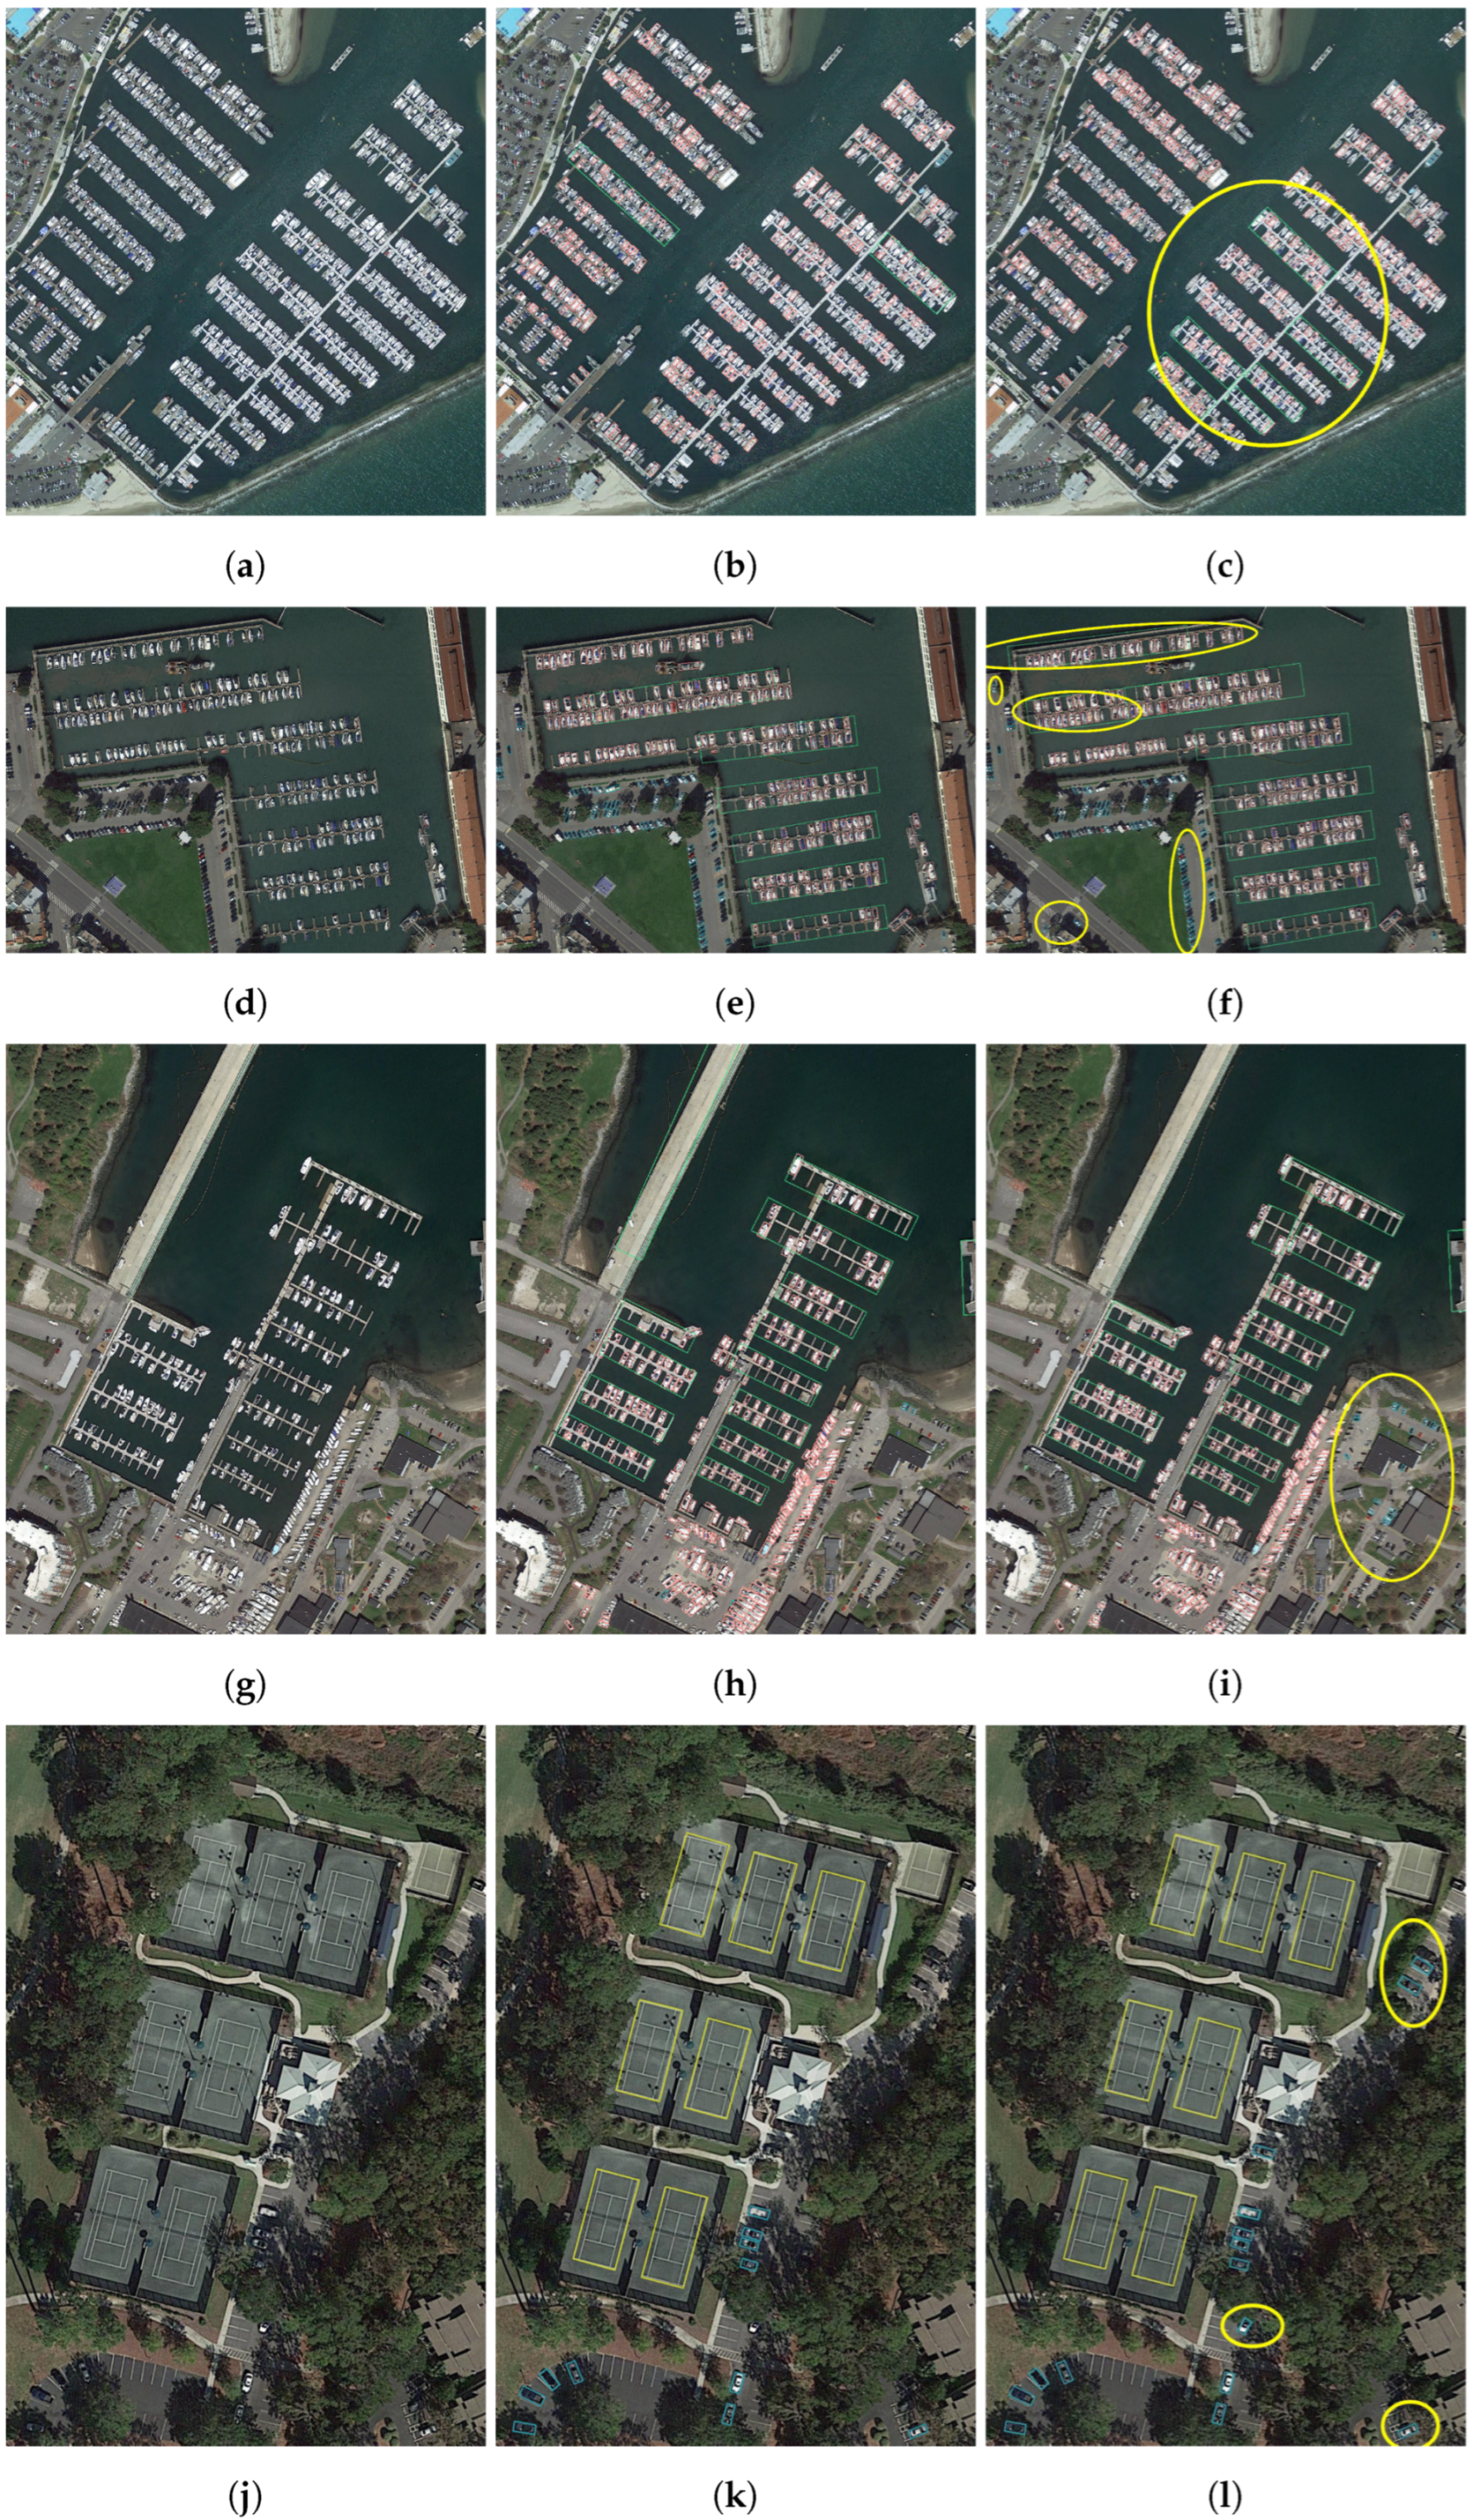
Figure 12, by comparing the detection effects in the yellow circled regions, our method significantly reduces instances of missed and false detections of small objects in multi-scale and densely distributed object detection scenarios. Additionally, our method better locates object angles and positional information, improves object bounding, and enhances detection performance in certain categories compared to the baseline model.
4.5.2. Ablation Experiments of the ASIPM
To verify the effectiveness of the added plug-and-play ASIPM, we conducted ablation experiments separately on the backbone network’s P3, P4, and P5 layers.
As shown in
Table 5, integrating our designed plug-and-play ASIPM module into the backbone network’s P3, P4, and P5 layers significantly improves the network’s mAP metric, contrasting sharply with its performance without ASIPM. Specifically, when we replaced the basic convolution module of the P3 layer with the ASIPM module, the mAP value increased by 0.9%; when we replaced the basic convolution modules of the P3 and P4 layers with the ASIPM module, the mAP value increased by 1.6%; when we replaced the basic convolution modules of the P3, P4, and P5 layers with the ASIPM module, the mAP value increased by 2.2%. The core logic behind this enhancement lies in the fact that as the network depth increases, subtle features of small objects are often prone to loss, yet these features may be crucial for accurate detection. ASIPM, as a plug-and-play module, not only effectively filters out shallow-level noise interference but more importantly acts as a bridge, efficiently transmitting rich low-level small target feature information to deeper layers of the network. This effectively addresses the traditional network’s issue of information decay when dealing with small objects, significantly enhancing the model’s detection accuracy and stability.
As shown in
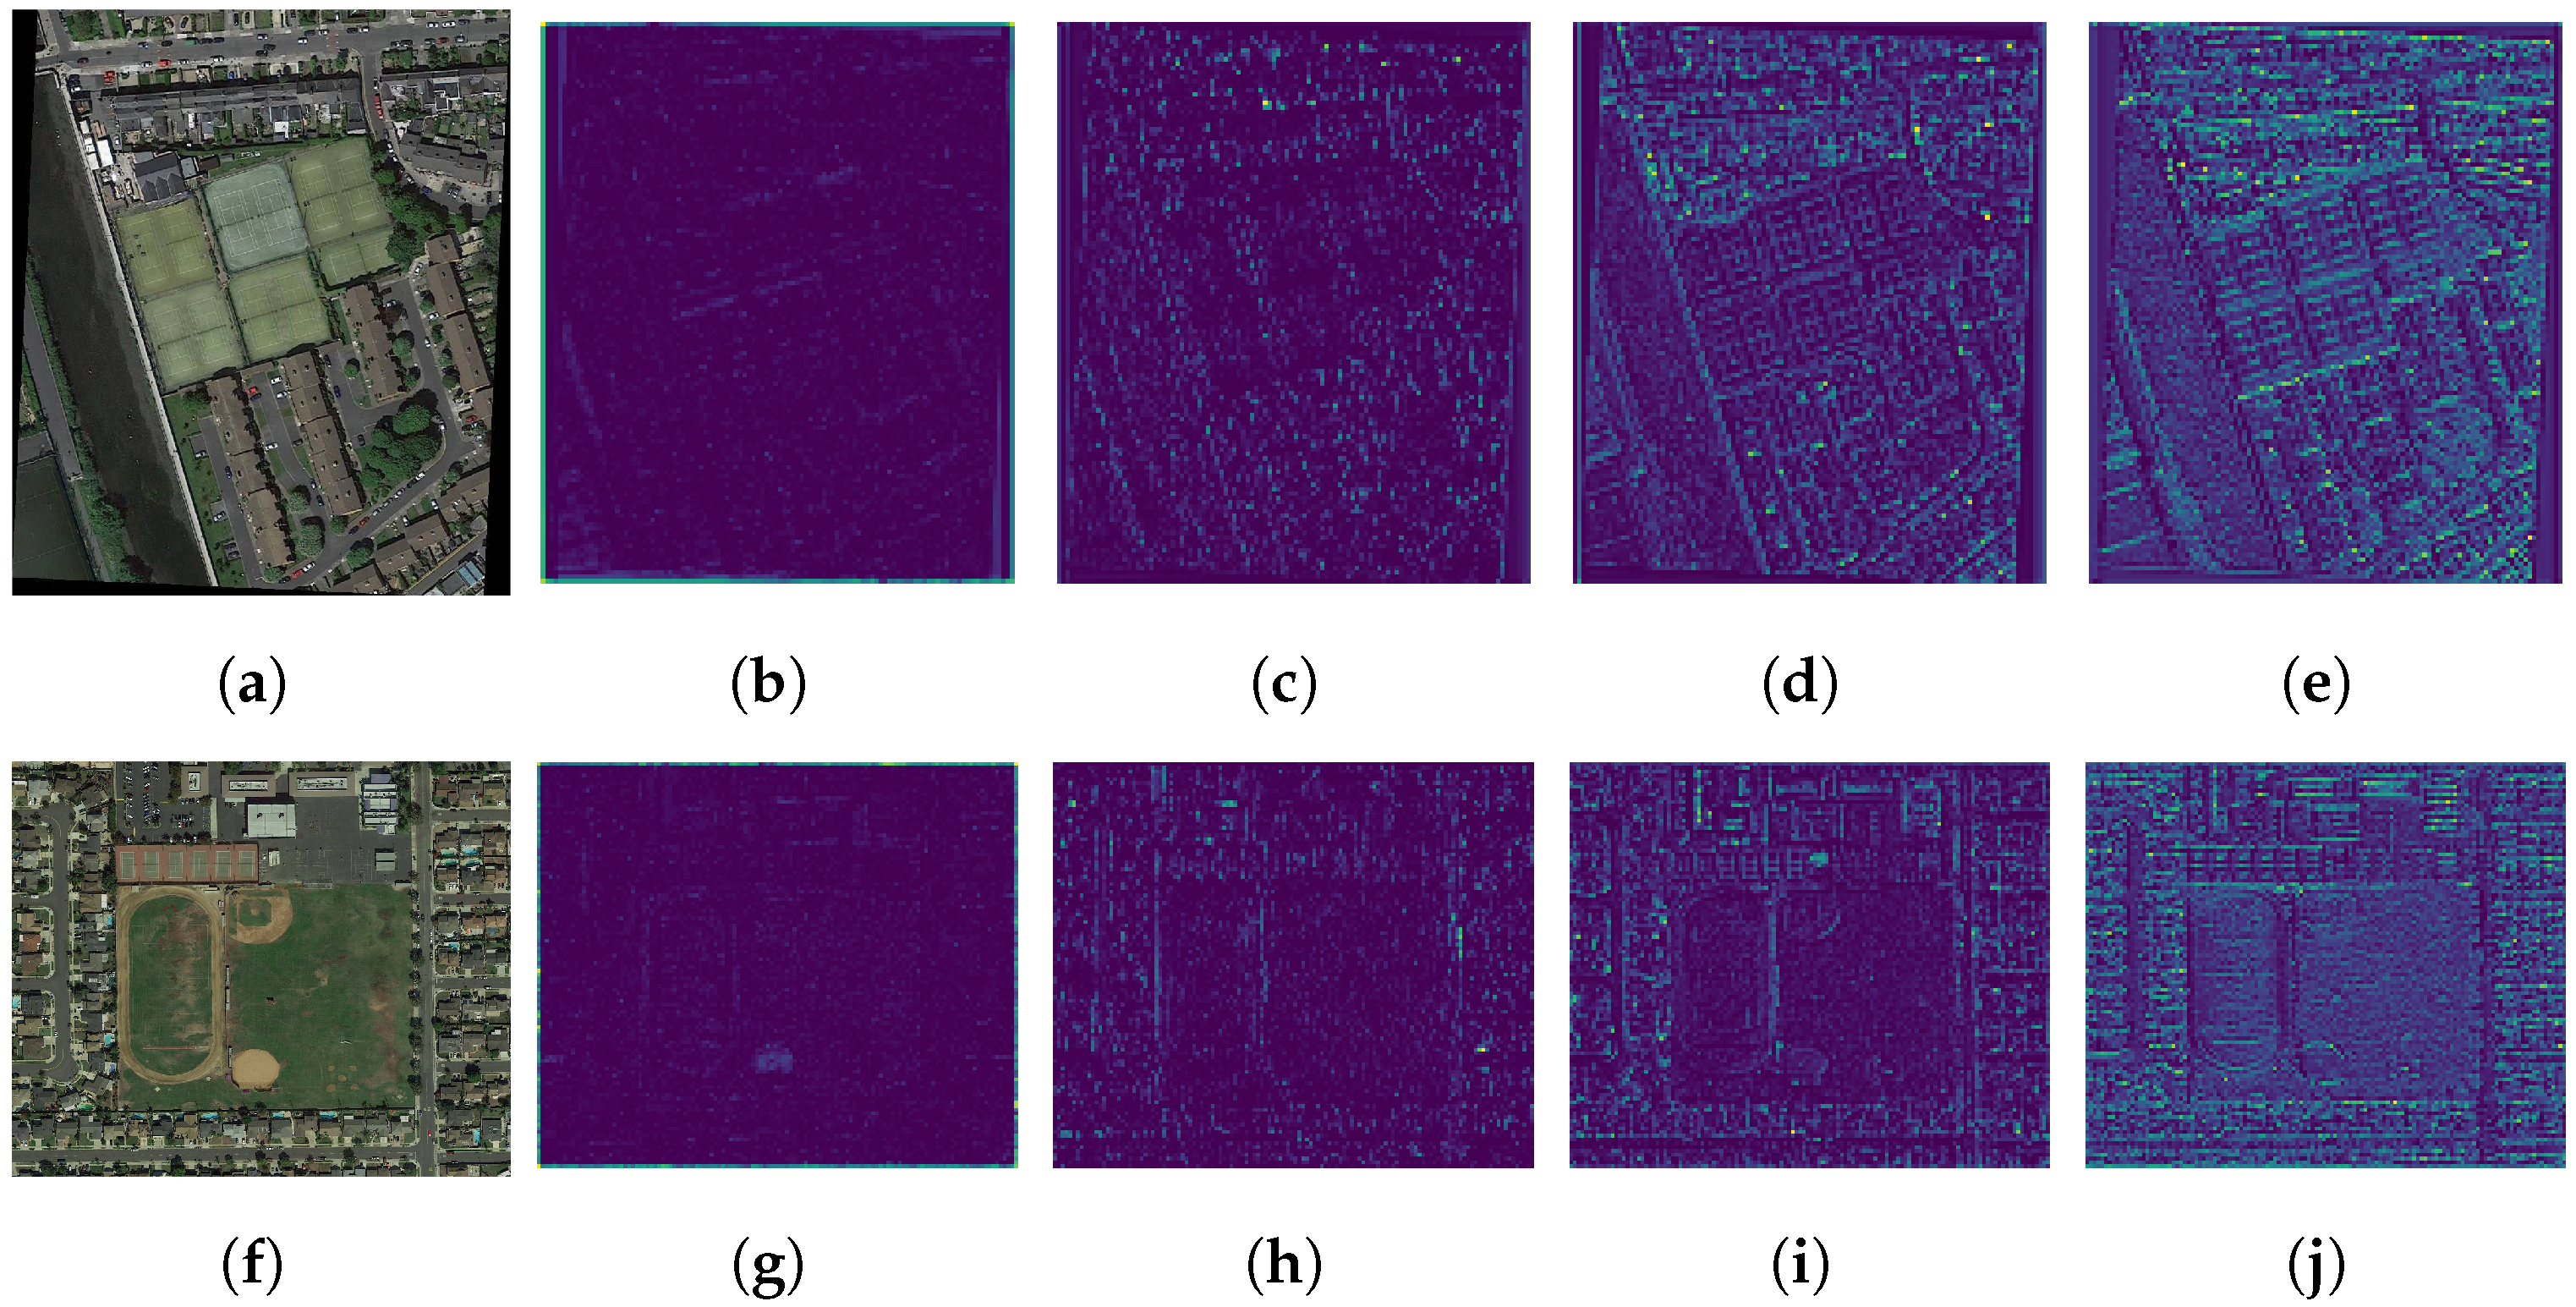
Figure 13, we further validate this from a visual perspective. As the ASIPM module gradually replaces the basic convolution modules in the backbone network, the feature maps become clearer. This demonstrates a significant reduction in noise signals and showcases the network’s ability to extract more discriminative feature information in complex visual scenes. Each pixel accurately maps key structures and details from the input image, ensuring that even the features of tiny objects are adequately preserved and enhanced in deeper network layers. Such progress is directly attributed to the dual action of ASIPM: on one hand, it acts as a precise filter, effectively removing shallow-level noise; on the other hand, it ensures that critical feature information is transmitted from shallow to deep network layers.
5. Conclusions
In the field of remote sensing image object detection, facing challenges such as large variations in object feature sizes, complex background environments, and orientation-aware, we propose an Adaptive Spatial Information Perception Network (ASIPNet). ASIPNet introduces a plug-and-play Adaptive Spatial Information Perception Module (ASIPM), significantly expanding the network’s receptive field. By leveraging background information from remote sensing images, it enhances the capability to extract features. Additionally, by utilizing KFIoU, ASIPNet effectively avoids the issue of gradient explosion during training using ProbIoU based on Gaussian distribution metrics, accelerating the convergence of oriented bounding boxes. Finally, experimental validation on the authoritative DOTAv1 and DIOR-R datasets demonstrates that ASIPNet achieves mAP50 scores of 76.0% and 80.1%, respectively, surpassing many SOTA methods. Furthermore, ablation experiments on ASIPNet indicate the effectiveness of the ASIPM module and KFIoU in oriented object detection. These experimental results not only confirm the outstanding performance of ASIPNet in improving detection accuracy but also highlight its advantages in reducing parameter count. We also found that our model did not perform as well as other models in several categories. In future research, we will continue to explore more effective model architectures and strategies to help our model gain a deeper understanding of the features of each object category, further improving the performance of our model.
