Abstract
To meet the requirement of autonomous driving development, high-quality point cloud generation of the environment has become the focus of 4D mmWave radar development. On the basis of mass producibility and physical verifiability, a design method for improving the quality and density of point cloud imagery is proposed in this paper, including antenna design, array design, and the dynamic detection method. The utilization of apertures is promoted through antenna design and sparse MIMO array optimization using the genetic algorithm (GA). The hybrid strategy for complex point clouds is adopted using the proposed dynamic CFAR algorithm, which enables dynamic adjustment of the threshold by discriminating and calculating different scanning regions. The effectiveness of the proposed method is verified by simulations and practical experiments. Aiming at system manufacture, analysis methods for the ambiguity function (AF) and shooting and bouncing rays (SBR) tracing are introduced, and an mmWave radar system is realized based on the proposed method, with its performance proven by practical experiments.
1. Introduction
With the advantages of compact size, cost-effectiveness, all-weather adaptation, velocity-measuring capability, and long detection range, etc., millimeter wave (mmWave) radar has always been extensively employed in the applications of autonomous driving [1,2,3,4]. The emerging high-resolution, four-dimensional imaging radar (4D radar), as the main competitive product of next-generation 77 GHz automotive millimeter wave radar, can provide high-quality 4D point clouds in the range, azimuth, elevation, and time dimensions [5,6], i.e., three dimensions in the space domain and one dimension of the velocity information. Taking advantage of multiple-input, multiple-output (MIMO) array design technologies, 4D mmWave radar has the ability to produce an overall array with a radiation pattern. The usage of multiple antennas is optimized in terms of accuracy, angular resolution, and the signal-to-noise ratio (SNR), which no doubt enhances the performance of object detection. The condition of the MIMO approach is that the chosen waveform must be uncorrelated, which means the received signals can be separated. The most commonly proposed research on MIMO waveform design can be simply classified into the following three technologies: time division multiplexing (TDM) [7,8], frequency division multiplexing (FDM) [9,10], and code division multiplexing (CDM) [11,12].
Enterprises involved in the 4D mmWave radar industry range from conventional suppliers, like Bosch, NXP, and ZF, to a host of burgeoning tech companies, such as Arbe, Huawei, and Oculii, and even original equipment manufacturers (OEMs) like Tesla. For example, three types of 4D mmWave radar products are shown in Figure 1, including the products.

Figure 1.
The 4D mmWave radar products from (a) NXP; (b) Tesla; and (c) Arbe.
NXP is depicted in Figure 1a, Tesla is depicted in Figure 1b, and Arbe is depicted in Figure 1c, respectively. For fairness and comprehensiveness, these products are selected from the most typical 4D mmWave radars from the supplier, the OEM, and the advanced R&D provider, respectively. It is important to note that the uniform design of these products has practical significance for their processing, manufacturing, and usage, as scattered and irregular array elements will not be able to fit into the feeder design and the placement and layout of RF chips.
The methodologies used to achieve further improvement in the imagery performance can be categorized into hardware-based and software-based approaches, including (1) increasing the number of TR channels by cascading mmWave radar chips or integrating more antennas onto a single chip and (2) increasing the angular resolution by virtually expanding the aperture of antennas through software design [13] or improving processing algorithms, such as traditional algorithms like FFT and CFAR [14,15] and learning-based algorithms [16,17].
From the hardware aspect, more antennas introduced mean higher SNR and more freedom for the direction of arrival (DOA) angular estimator. Many DOA estimators have been studied in the last tens of years, such as the FFT-based estimator [18], MUSIC-based estimator [19], and ESPRIT-based estimator [20]. However, MUSIC, ESPRIT, and their improvements are the leading parametric methods that require a priori condition of the signal number, resulting in extensive computational costs [21]. Especially when the assumed number of signals is incorrect, these methods will fail to achieve the expected efficacy. Since the FFT-based method involves less computation and can be easily deployed in uniform linear array (ULA) applications without requiring priori, it is considered a major estimator in real products.
The FFT-based DOA strategy is adopted in our work, which determines the direction for improving the MIMO array. This means that an improved MIMO array should consider antenna deployment to satisfy the FFT operation, which requires a uniform or quasi-uniform linear array.
Regarding the analysis mentioned above, we make our best efforts to improve 4D mmWave radar imagery. In this paper, our work focuses on the aspects of radio frequency (RF) hardware design while considering the aperture utilization, beam quality, SNR, and detection software, including the dynamic CFAR and the adaptive detection threshold varying with environmental change. In summary, the key considerations used for improving imagery are increasing antenna performance and enhancing the flexibility of the MIMO array. Manufacturability is also an important factor considered in our work, which is very different from other research that has only concerned the novelty of the proposed method.
Due to its high resolution and better environmental perception capabilities, 4D mmWave radar can compensate for the shortcomings of cameras in automotive applications. Therefore, point cloud improvement for 4D mmWave radar is an important point for practice. At the same time, in order to realize target perception, the MIMO array technique is introduced to achieve better imaging resolution and detection performance. The Tesla 4D mmWave radar utilizes 48 virtual channels to form a virtual array of small size, particularly in the vertical direction. The radar design scheme proposed in this paper has the ability to integrate more antennas to form a larger virtual array, achieving better horizontal resolution while maintaining the same horizontal resolution as the Arbe system. However, Arbe 4D mmWave radar uses six cascaded chips, which is more than our design in this paper, resulting in a higher cost. Furthermore, the antenna design scheme proposed in this paper is optimized, designed, and easy to deploy with manufacturability.
Thus, a point cloud improvement method for 4D mmWave radar imagery is proposed with four aspects in this paper. In brief, the following are four major contributions that we have made:
- (1)
- To achieve higher horizontal resolution, improved beam-forming performance, and better manufacturability, the genetic algorithm (GA) is employed to deploy the MIMO antenna array, obtaining an optimized layout in constrained space.
- (2)
- To achieve higher SNR and cover the performance of the whole array design in beam width, main lobe width, and sidelobe level (SLL), the antenna element of the MIMO array is carefully designed.
- (3)
- Assuming a non-uniform distribution of the environment clutter, an optimized peak spectrum search criterion is proposed along with the dynamic CFAR algorithm.
- (4)
- Focused on system manufacturing, the methods for analyzing the ambiguity function (AF) and the shooting and bouncing rays (SBR) tracing are introduced, and an mmWave radar system is realized based on the proposed method; its performance has been validated through practical experiments.
The rest of this paper is organized as follows: Section 2 describes the basic principles of the 4D mmWave radar imagery, focusing on the signal processing. In Section 3, a point cloud improvement method for 4D mmWave radar imagery is studied, including the antenna design, array design, and peak spectrum optimization. Section 4 presents the experiment results, including the simulation and the self-developed radar system, which verify the effectiveness of the proposed method. Section 5 gives the conclusion of this paper.
2. Basic Theory of the 4D MmWave Radar Imagery
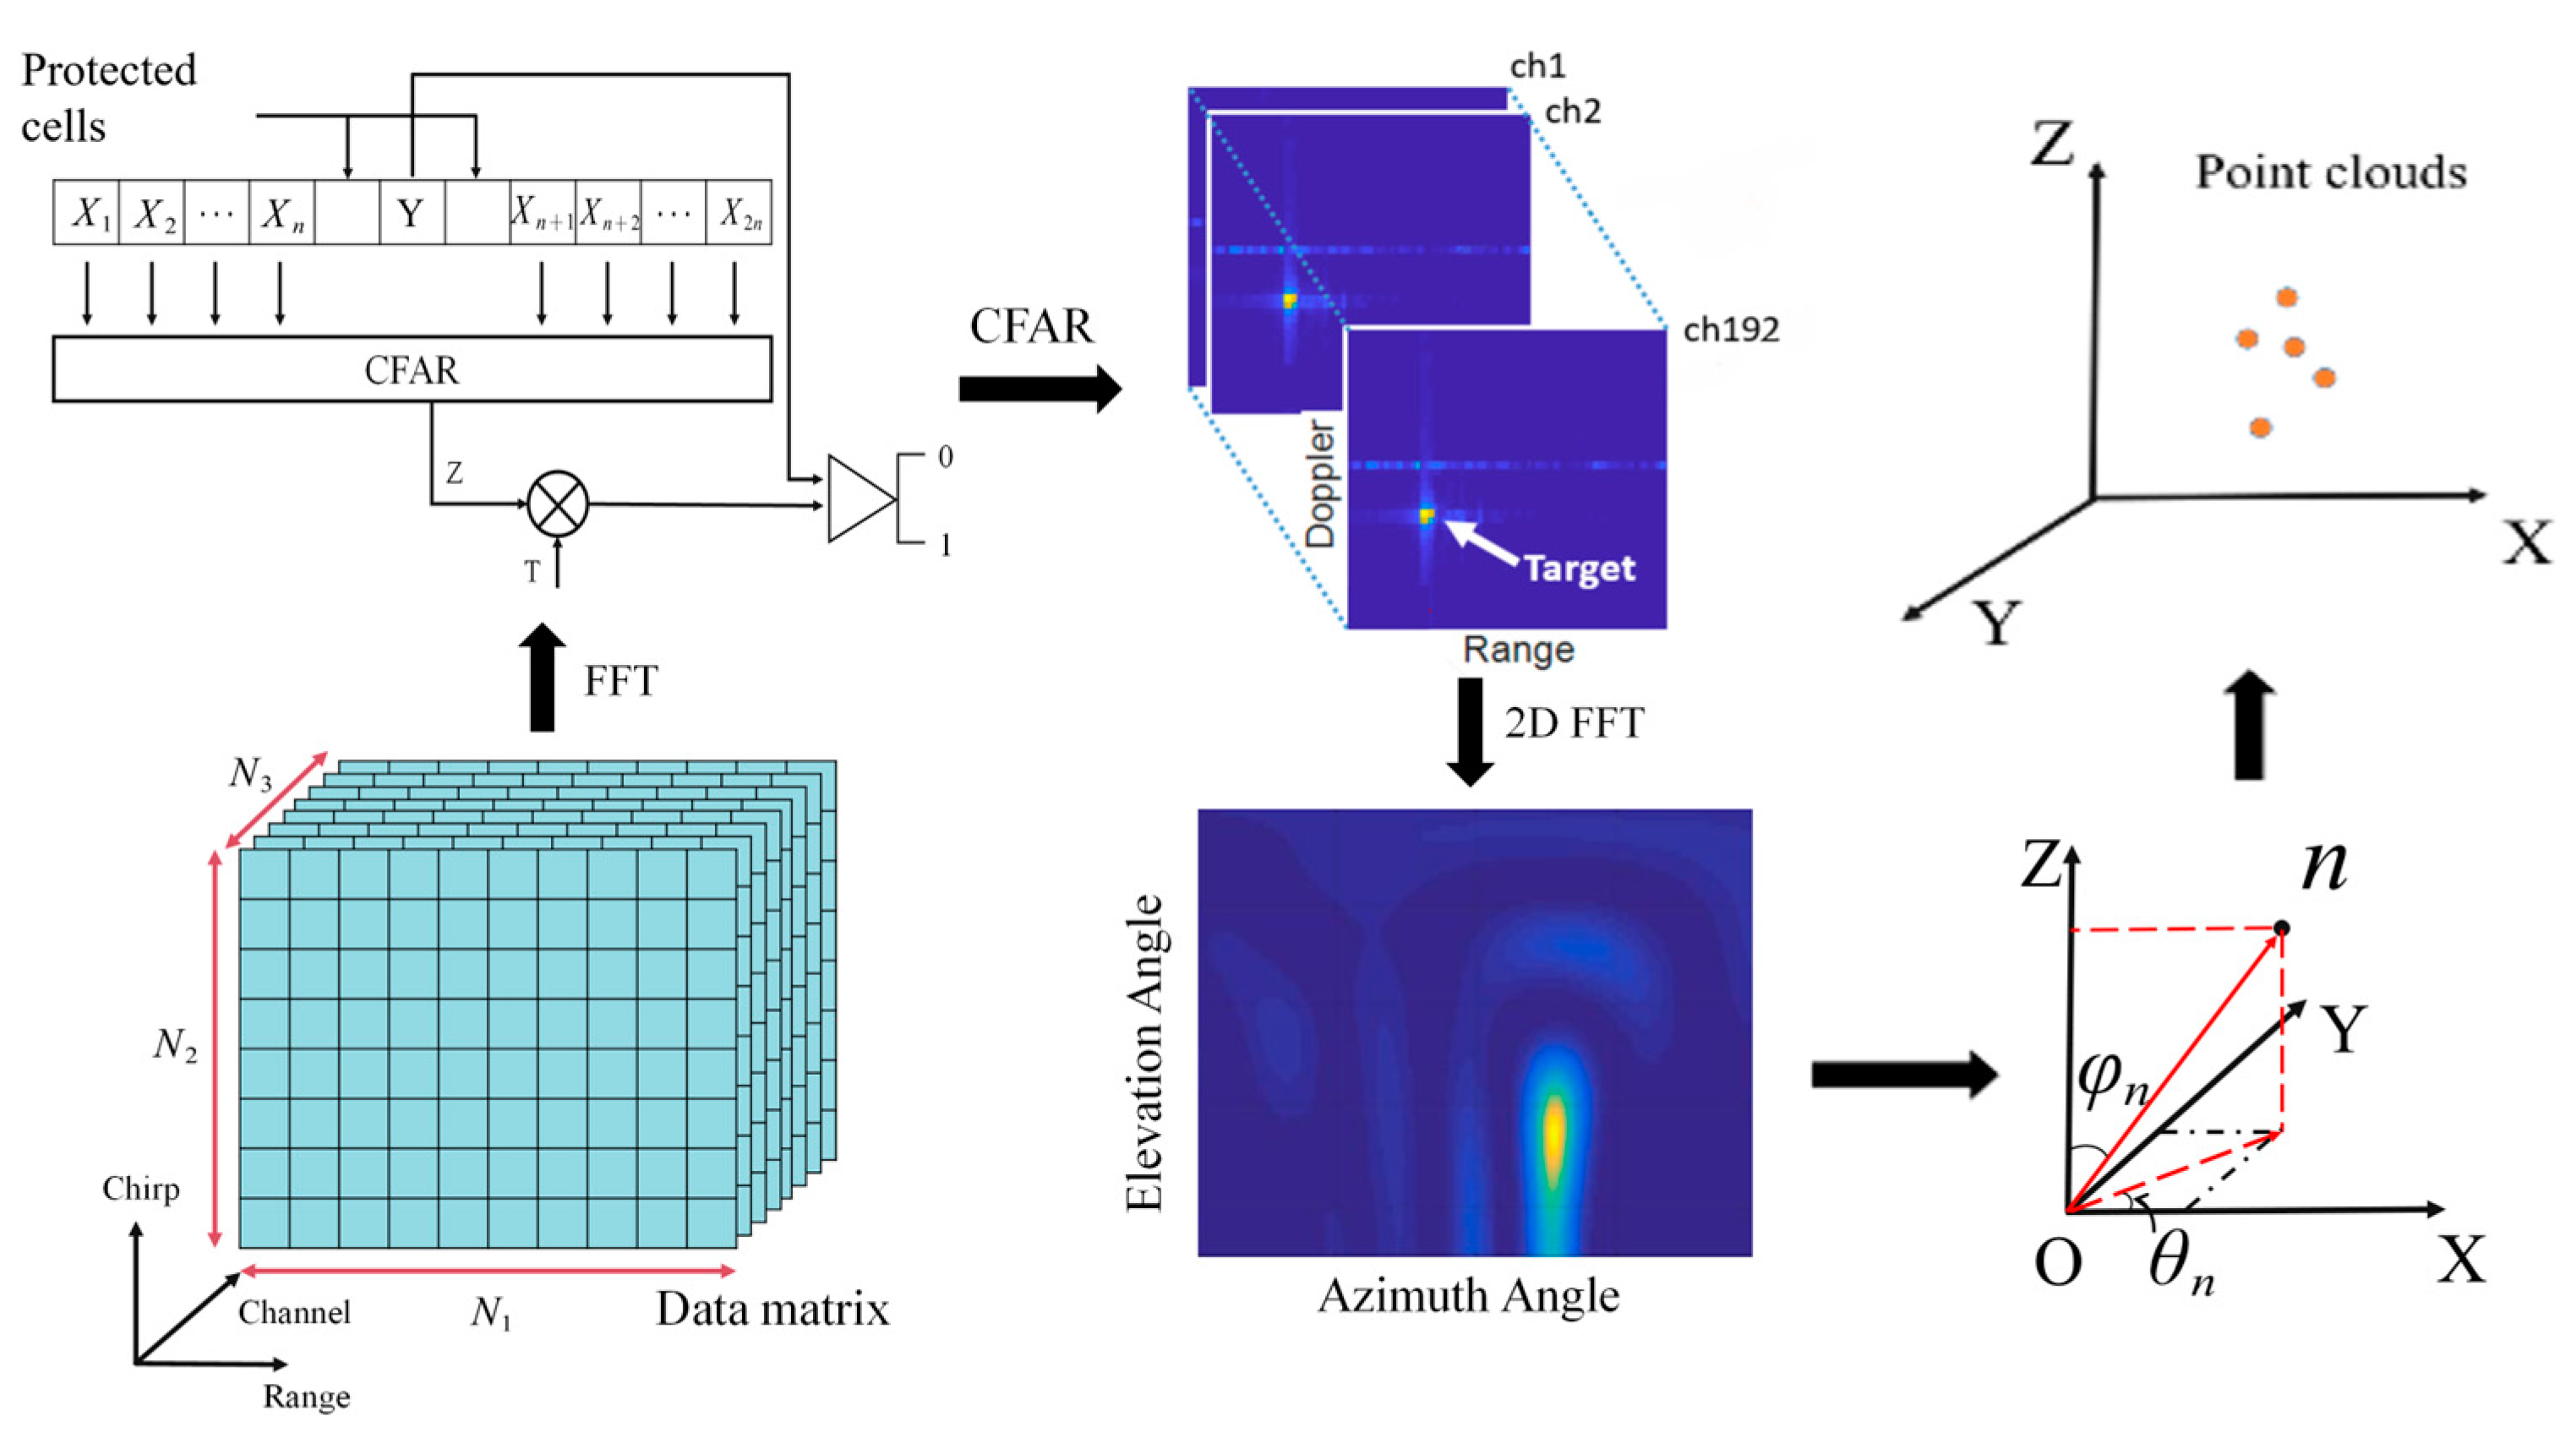
The mmWave radar point cloud imagery diagram is shown in Figure 2.
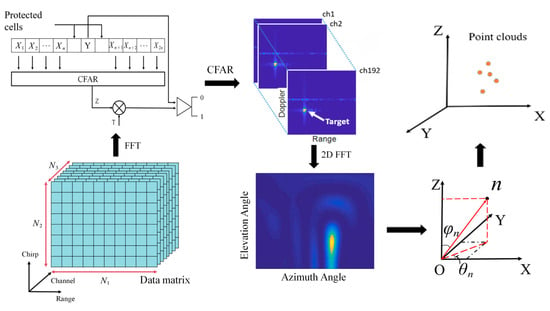
Figure 2.
The mmWave radar point cloud imagery diagram.
First, a 2D FFT is performed on the recorded echo data to obtain the Range-Doppler Map (RDM) of the detected target. Secondly, the generated RDMs from different transceiver channels are summed to improve the SNR, and the CFAR detection is performed to obtain the target position in the RDM. Third, the azimuth and elevation angles are estimated using a DOA estimator, typically the FFT-based method. Finally, the 4D point cloud of the target is generated by converting the detected range, velocity, azimuth angle, and elevation angle from spherical coordinates into Cartesian coordinates.
2.1. RDM Generation
Generally, the 4D mmWave radar emits a modulated waveform with a wideband signal to acquire the echo power or energy from the target reflection, since the wideband signal carries more information according to the information basic theory. The commonly used waveforms are continuous wave (CW), pulse continuous wave (Pulse CW), frequency modulated continuous wave (FMCW), and stepped frequency continuous wave (SFCW) in TDM mode, as well as orthogonal frequency–division multiplexing (OFDM) in FDM or CDM mode. Considering the emitted signal is modulated using one of these waveforms, the echo signal can be written as follows [22]:
where is a complex scalar, whose magnitude represents attenuation due to antenna gain, path loss, and the radar cross section (RCS) of the target, and is the additive noise. is the emitted signal waveform and is the time delay of the signal being emitted, reflected from the target, and received by the radar system. Specifically, a single FMCW signal has the representation form at carrier frequency, which can be written as follows:
where is the carrier frequency, and is the frequency modulation slope.
The information of the first dimension, i.e., range, of 4D mmWave radar can be extracted using the matched filter , which maximizes the SNR at the output. Thus, the filtered signal is the correlation of , and and the time delay, which implies the range information, is the peaks of the filtered signal.
Then, the estimated range can be obtained using , where is the speed of light.
Suppose the emitted waveform is designed as FMCW, the receiver output with samples per pulse and consecutive pulses can be written as follows:
where represents the range from target to radar; is the Doppler shift caused by target movement; is the sampling frequency; is the chirp duration; is the fast time index; and is the slow time index.
The beat frequency can be obtained using FFT along the fast time dimension, which is coupled with the Doppler frequency . Then, the range gate can be determined as = . The second FFT along the slow time dimension can be applied to estimate the Doppler shift, which indicates the target velocity with , where is the wavelength.
After the previous two FFTs on the echo signal, an RDM can be obtained, representing the range and velocity information. Then, target detection can be carried out with the RDM using a detector.
2.2. FFT-Based DOA Estimation
The location of a target is often described in terms of a spherical coordinate system in mmWave radar sensing, denoted as , where denotes the azimuthal angle and denotes the elevation angle. The values of are always estimated through a DOA estimator, such as an FFT-based estimator, a MUSIC-based estimator, or an ESPRIT-based estimator. As mentioned above, since the FFT-based method has less computation and can be easily applied in ULA without a priori, it is the preferred estimator in real applications.
For simplicity, take the 2D problem as an example, and suppose is the range and angle of the th target in spherical coordinates with velocity . With the far-field approximation, the delay time from a transmitter located at the origin to the th target and back to the receiver located at can be written as follows:
where is the spacing between adjacent antenna elements in the linear array deployment.
After rearranging, the receiver output described in three dimensions can be written as follows:
where is the total number of detected targets.
Since a new dimension is introduced, the target DOA can be estimated, which is implied by the term , by applying another FFT along the antenna elements dimension, which are linearly located in space. Here, the FFT-based estimator is used to obtain .
Similarly, can also be estimated through a fourth FFT when solving the 3D problem. In fact, 2D angle estimation of and can be performed separately or jointly.
2.3. Radar Point Cloud Generation
Since the parameters of 4D mmWave radar detection, including , , , and , are correctly extracted, the target can be easily represented in terms of the spherical coordinates, which are . However, these parameters are always converted into Cartesian coordinates for a more intuitive visual effect. Consequently, the final 4D information for each target at the same detection point can be expressed as follows [23]:
where , , and denote the forward, horizontal, and elevation range of the th target from the radar. represents the velocity of the th target.
The visual representations of these generated points in Cartesian coordinates are rendered in a 3D user interface (UI) supported by one of the graphics engines, such as the point cloud library (PCL) [24]. The final visualized points are drawn in 3D and colored with indices of the point’s velocity. The point sets from one frame or multiple frames are called a point cloud, which is similar to the Lidar output but with velocity information.
3. The Point Cloud Improvement Method
The basic theory of 4D mmWave radar imagery is adopted in real products, such as the single-chip radar. In this paper, the AWR2243 chip with three TXs and four RXs is considered as the major RF component [25]. The four-chip cascade design is adopted, and the final array has 12 TXs and 16 RXs, forming a total of 192 TR channels. The antenna design, array design, and CFAR modification are proposed, which can be used in other designs of the 4D mmWave radar since the improvement principles are built upon the basic theory.
The overall consideration is to achieve higher SNR, better resolution, and more robust target points through the antenna design, array design, and CFAR modification. Then, the details are given in the following contents.
3.1. Array Design
The goal of the MIMO array design is to achieve higher resolution in the horizontal direction, better beam-forming (BF) performance, and better manufacturability. To ensure phase-coherent accumulation in BF mode, the antenna locations are constrained to multiples of λ/2 and then optimized using a genetic algorithm (GA) [26].
More antennas are deployed in the horizontal direction to achieve higher azimuthal resolution. In contrast, fewer antennas are deployed in a vertical direction. Then, a uniform distribution is adopted since it can achieve approximate performance of the minimum-redundancy array (MRA) to achieve maximum resolution using a small number of antennas [27].
In [28], the maximum sidelobe level is proven to be a critical constraint, as exceeding it will cause the array configuration to generate ambiguities in DOA estimation. Thus, the azimuthal resolution is optimized with a GA to determine the antenna locations in the horizontal direction and with the designed constraints written as follows:
where represents the beam pattern of the MIMO array; represents the sidelobe level of the beam pattern; and and represent the horizontal and vertical positions of the th antenna, respectively. is the angular resolution in azimuthal direction calculated using the Rayleigh criterion that is defined as , where is the aperture length of the virtual array in dimension [29].
The beam pattern of the MIMO array can be written as the function of and , and it yields the following:
where is the wave number.
The goal of Equation (8) is to minimize the SLL of the array beam pattern, which can be synthesized by the responses of the virtual antennas calculated using phase center approximation theory, i.e.,
where and are the numbers of TX and RX antennas, respectively.
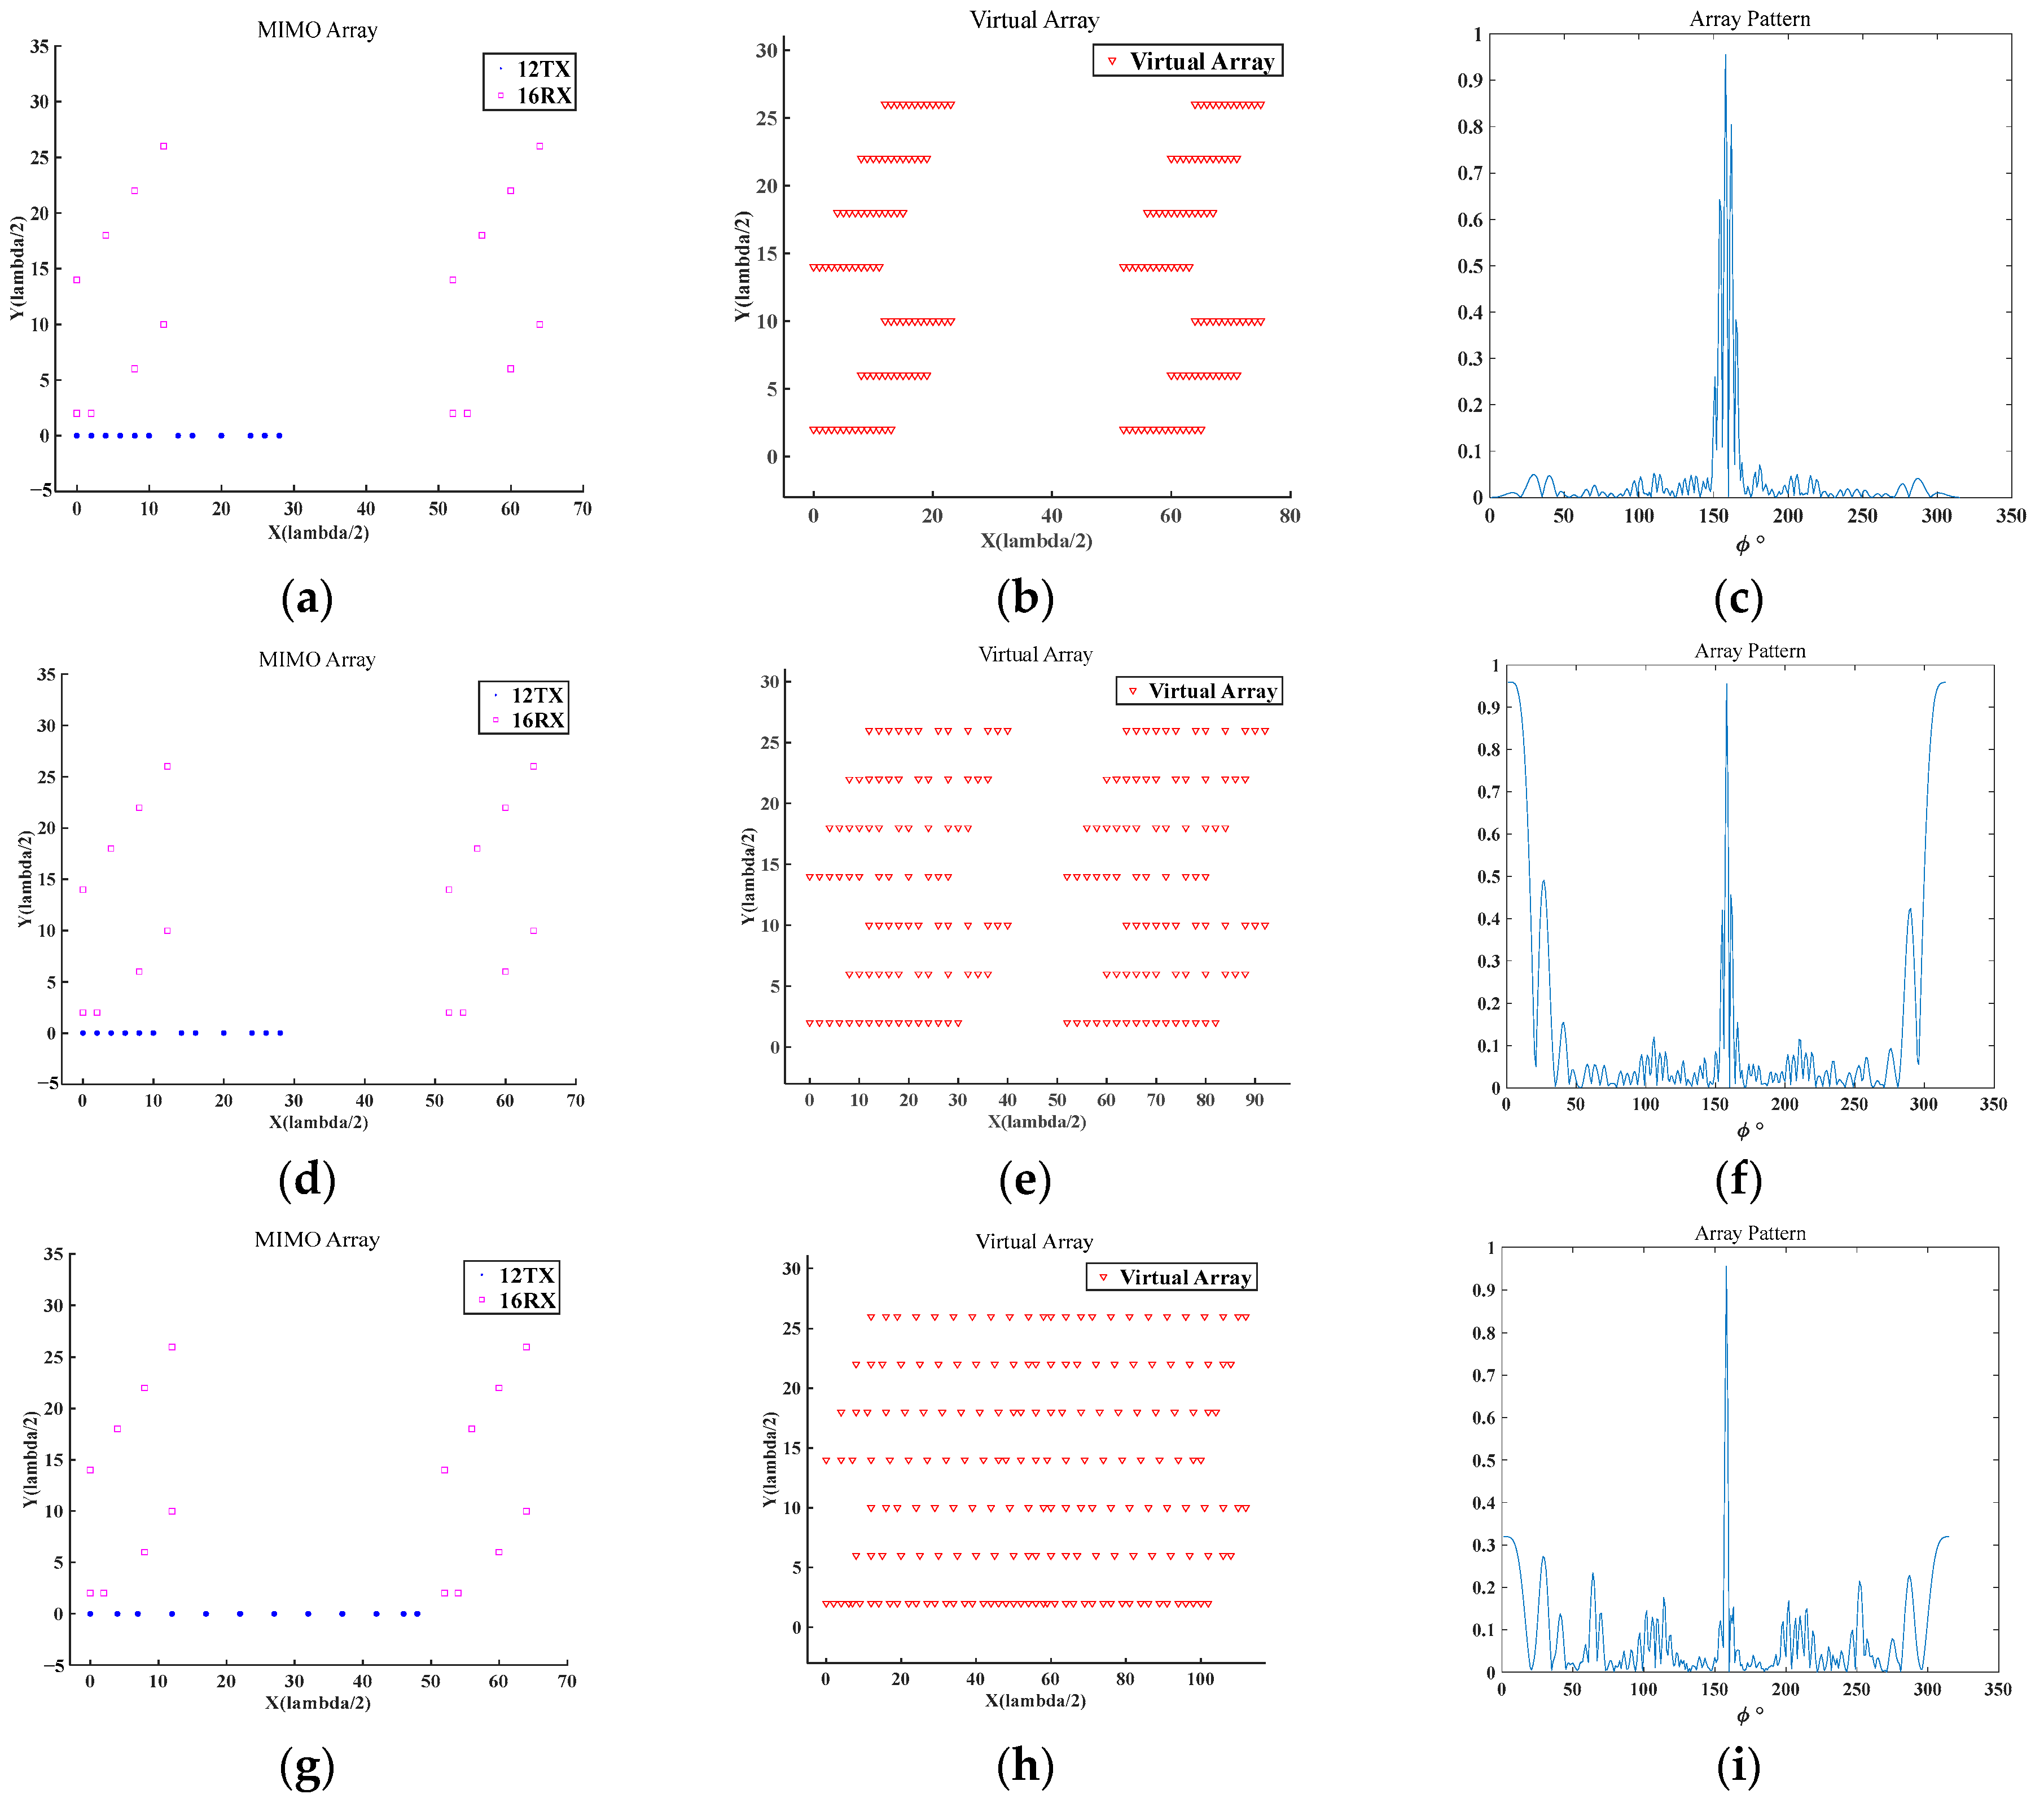
Part of the GA optimization results are given in Figure 3, showing the antenna positions of the first and final generations. The locations of the RX antennas are established and locked using a ladder array design. Then, the positions of TX antennas, located in the bottom row of the array, are optimized iteratively to form different generations.
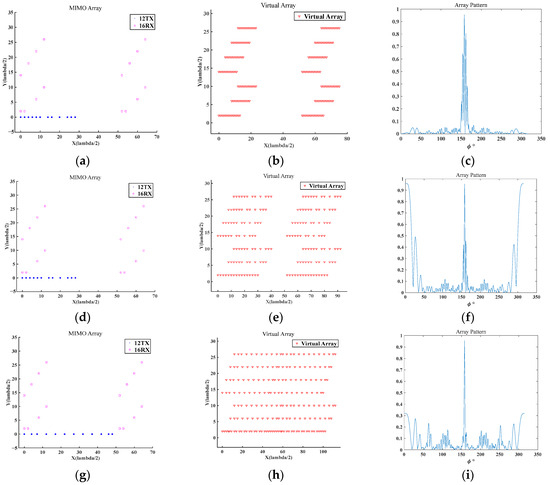
Figure 3.
Part of the GA optimization results: (a) The antenna positions of the first generation; (b) the virtual antenna positions of the first generation; (c) the array pattern of the first generation; (d) the antenna positions of the 15th generation; (e) the virtual antenna positions of the 15th generation; (f) the array pattern of the 15th generation; (g) the antenna positions of the final generation; (h) the virtual antenna positions of the final generation; and (i) the array pattern of the final generation.
Finally, comparisons of the zoomed array patterns and AF maps are given in Figure 4. The zoomed array patterns are shown in Figure 4a–c, and the AF maps are shown in Figure 4d–f, corresponding to the first, the 15th, and the final generations, respectively. The final angular resolution reaches approximately one degree. At this time, the array configuration reaches a stable state while meeting the requirements of narrow main beamwidth and low sidelobes, demonstrating excellent radiation pattern and energy focusing ability.


Figure 4.
Comparisons of the zoomed array patterns and AF maps: (a) zoomed array pattern of the first generation; (b) zoomed array pattern of the 15th generation; (c) zoomed array pattern of the final generation; (d) AF map of the first generation; (e) AF map of the 15th generation; and (f) AF map of the final generation.
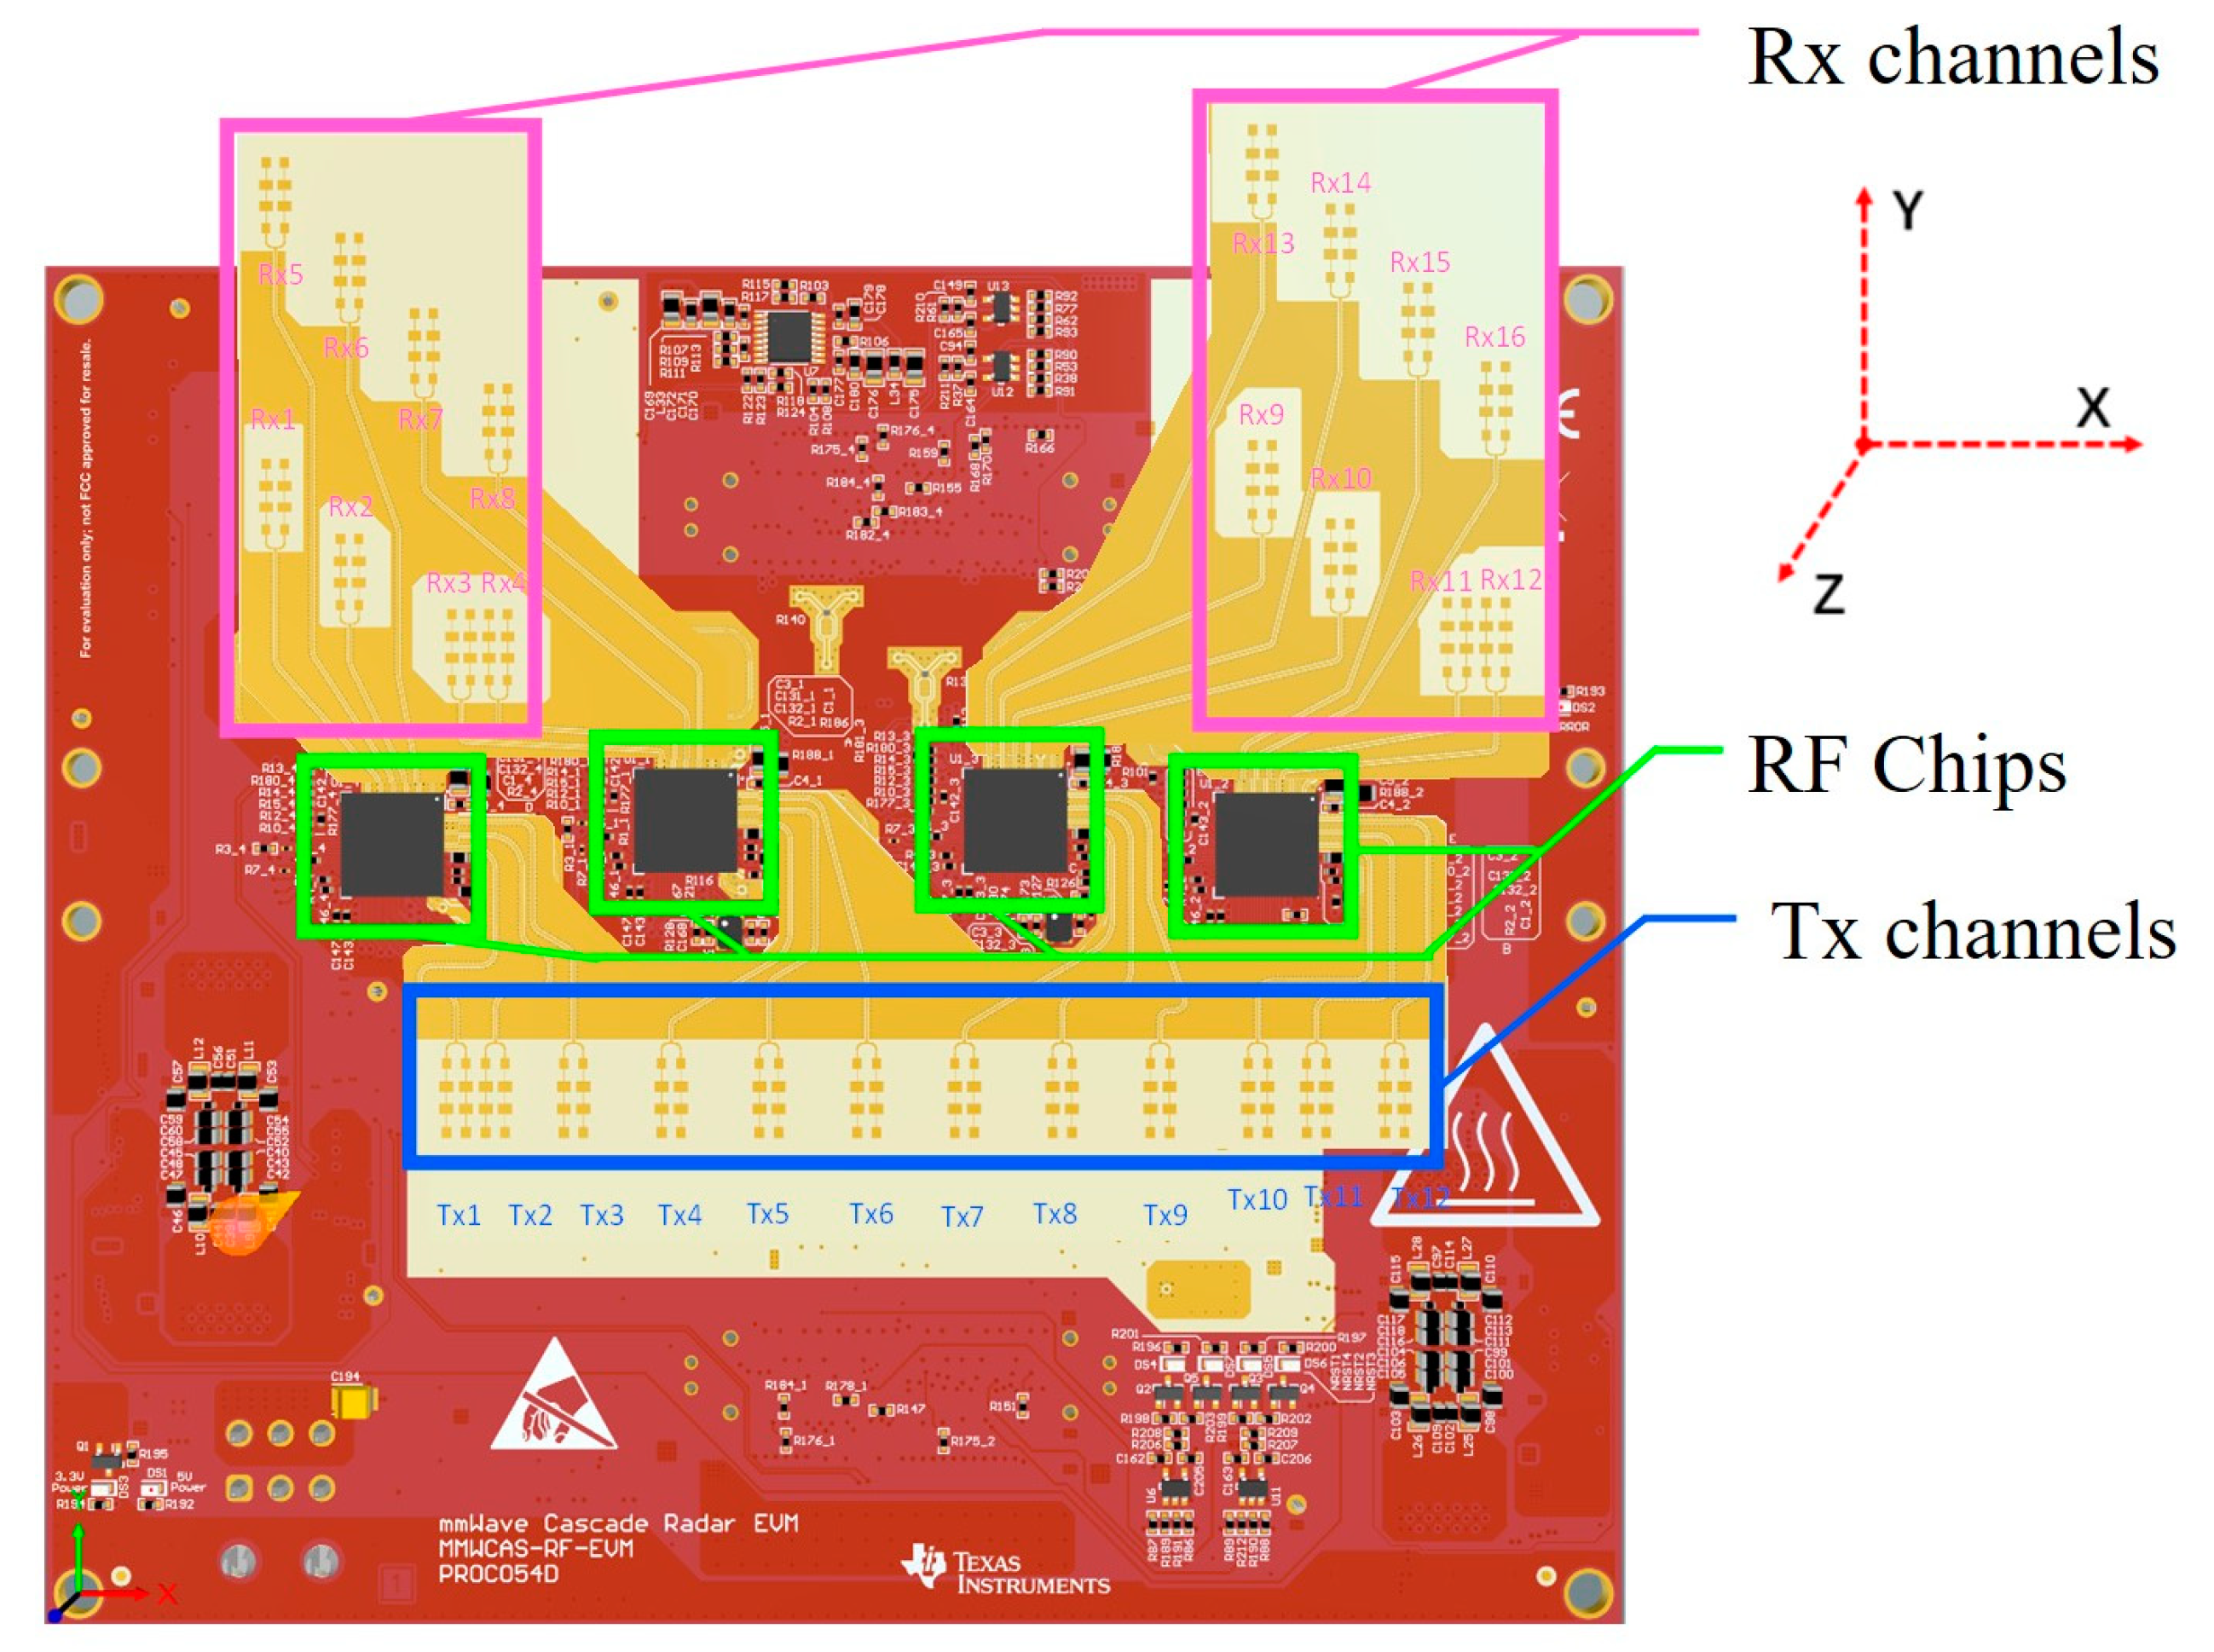
The physical positions of the TX and RX antennas are also depicted in Figure 5. The steps shown in Figure 5 represent a scheme for forming an approximately uniform quasi-planar array. Due to the high integration of the mmWave chip, the antenna array usually needs to be deployed on a multi-layer printed circuit board (PCB) along with several other electronic components. This means the antenna layout inevitably needs to compromise with other critical circuit structures.
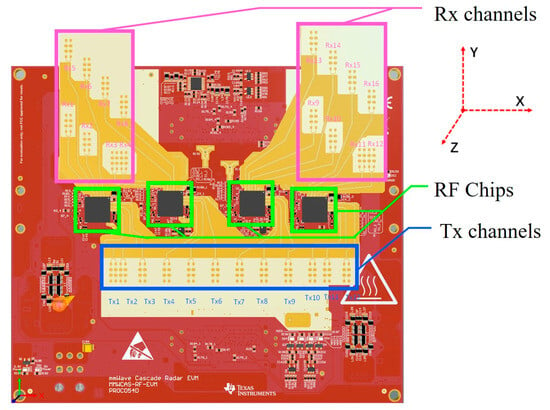
Figure 5.
Physical antenna positions of the PCB.
Thus, achieving an ideal 2D-MIMO planar array is always difficult. However, the stepped layout provides greater flexibility in array design and serves as an adaptive option for MIMO array design, which is an adaptive option to the MIMO array design. Therefore, some studies on MIMO array deployment provide alternative methods for locating the antennas linearly [30]. In contrast, more antennas are used to improve the system resolution with simple stacking and cascading [31,32]. The stepped array is a convenient choice for deploying the feeders, as it avoids crossing or overlapping with parallel arrangements. Another consideration is that the feeders need to be equal in length, which is minimized by designing with the 0.15 dB/cm propagation loss. This is also the reason we chose the stepped layout of the RX antennas in the vertical direction.
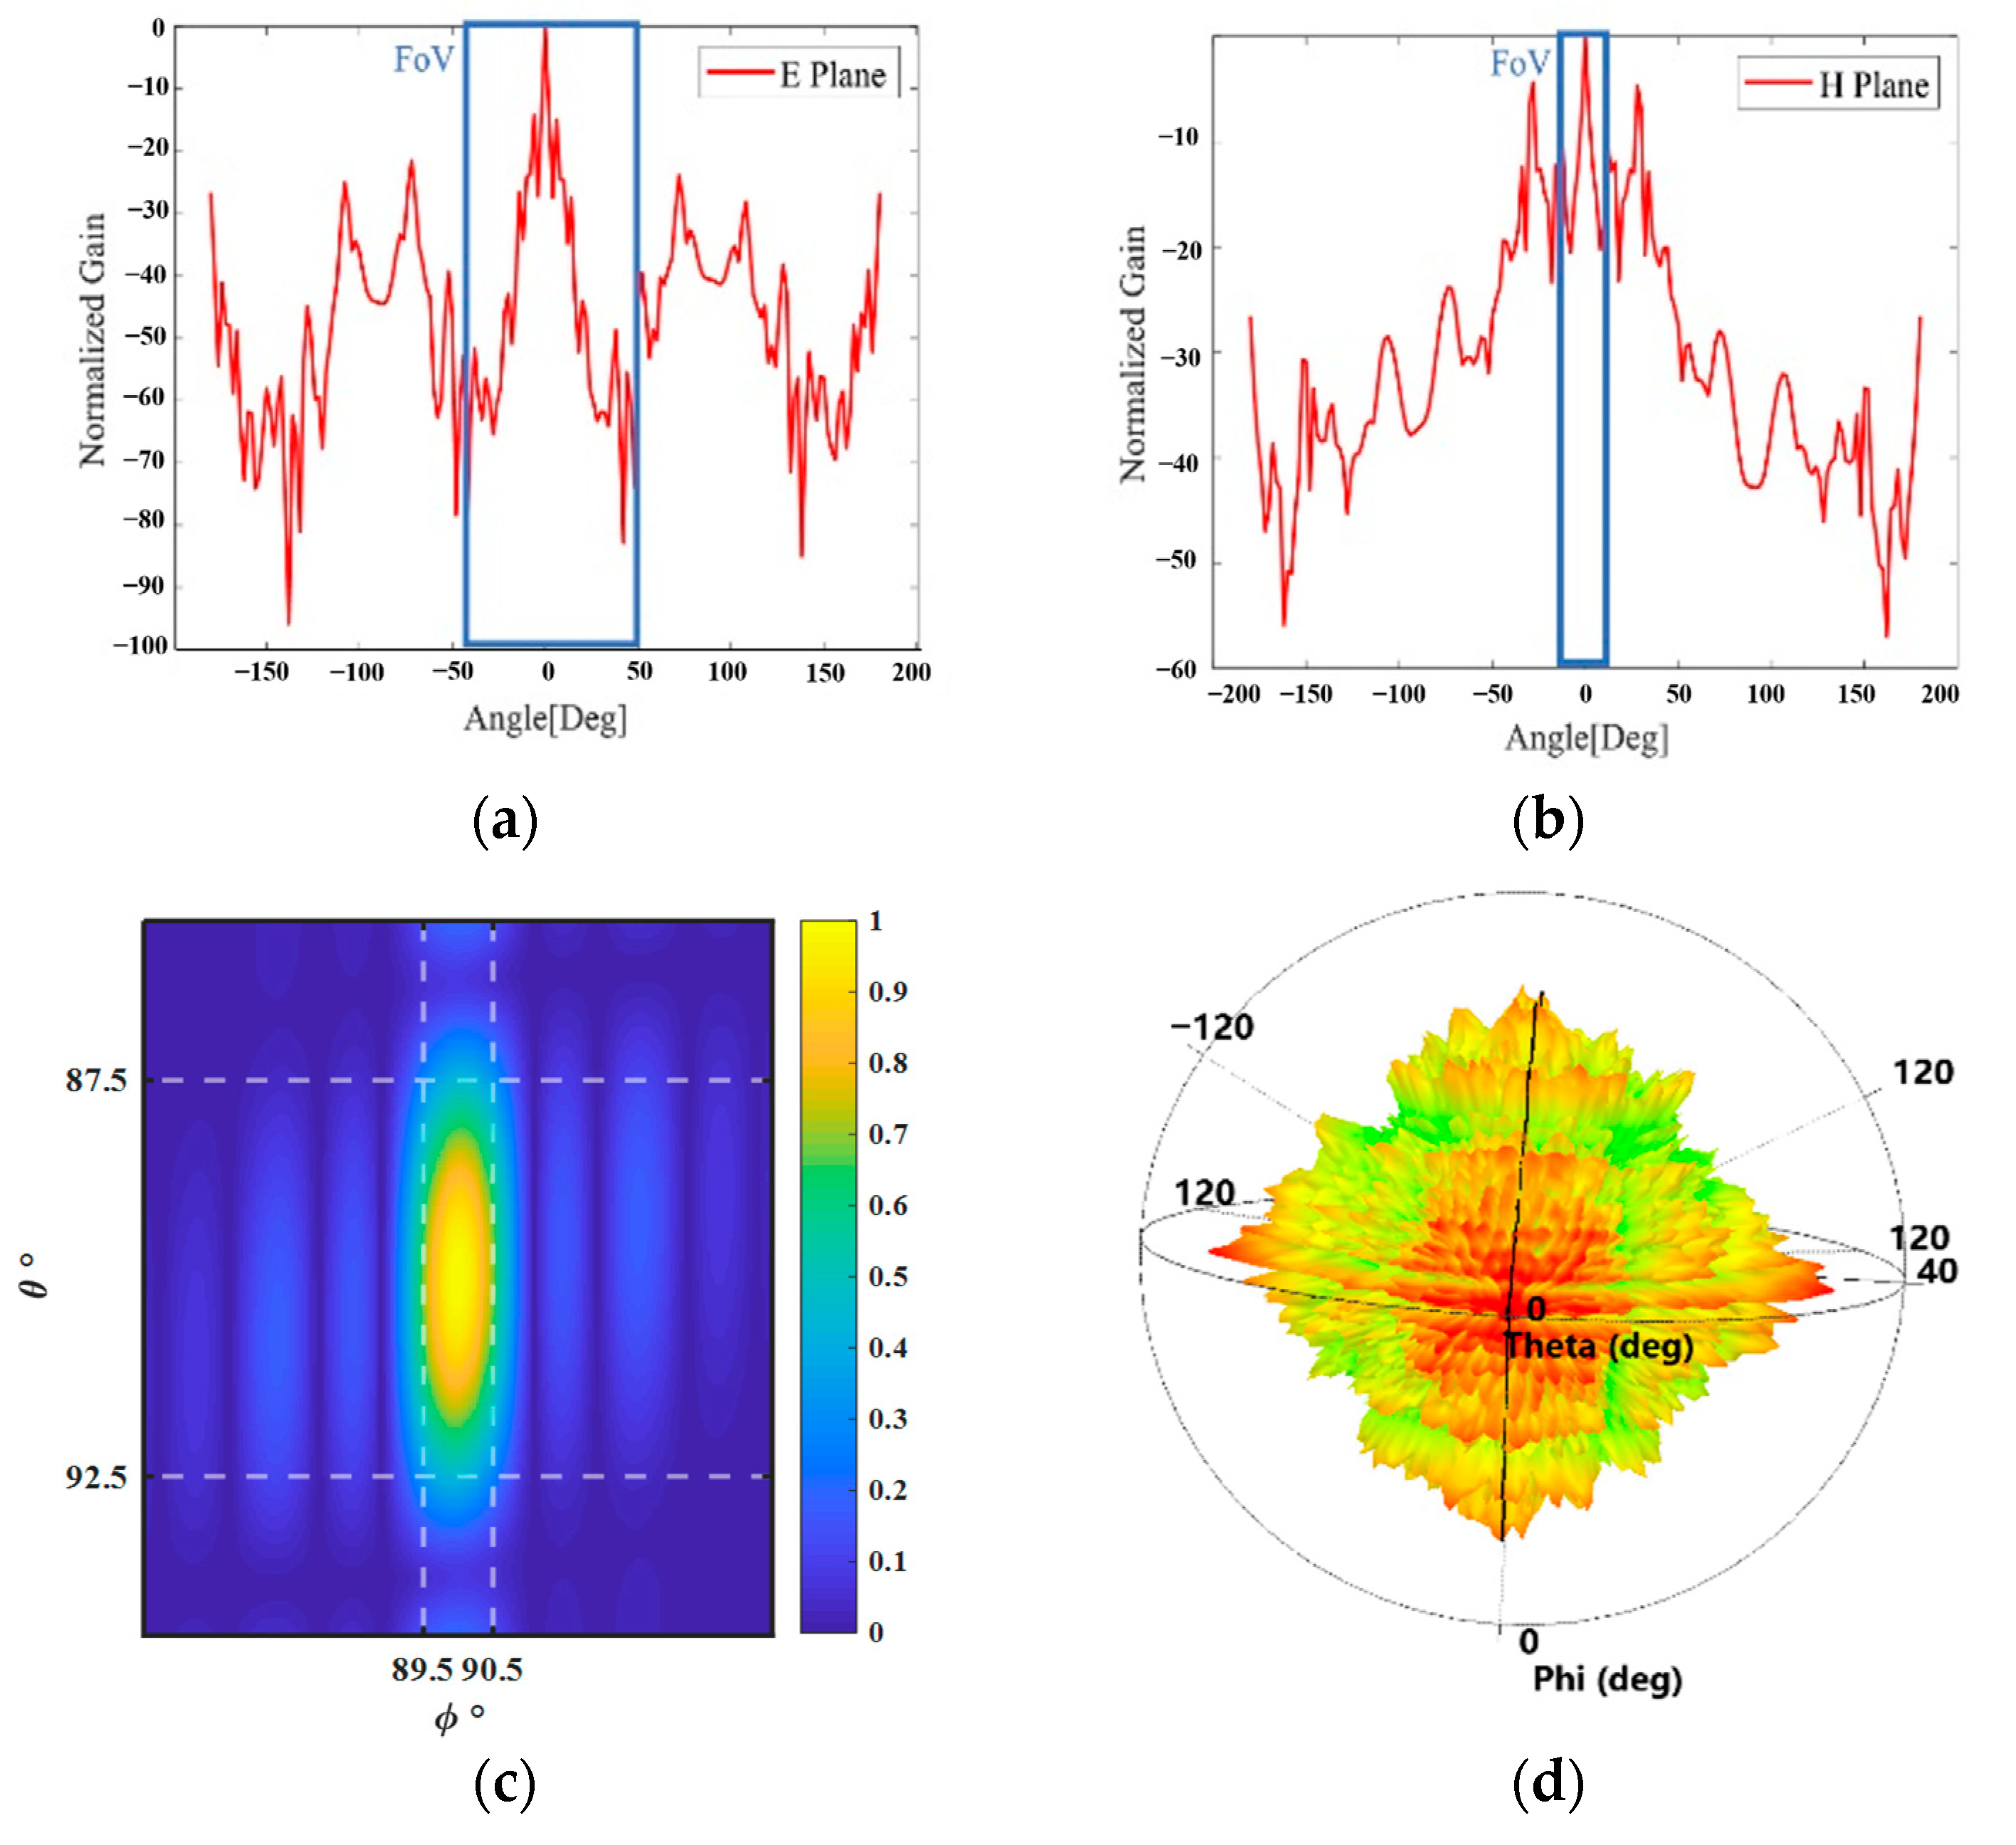
Sequentially, the gain in the E plane and H plane, AF map, and beam pattern of the designed array are shown in Figure 6a, Figure 6b, Figure 6c and Figure 6d, respectively. The designed field-of-view (FoV) of the antenna is 100 degrees in the E plane (horizontal) and 30 degrees in the H plane (vertical).
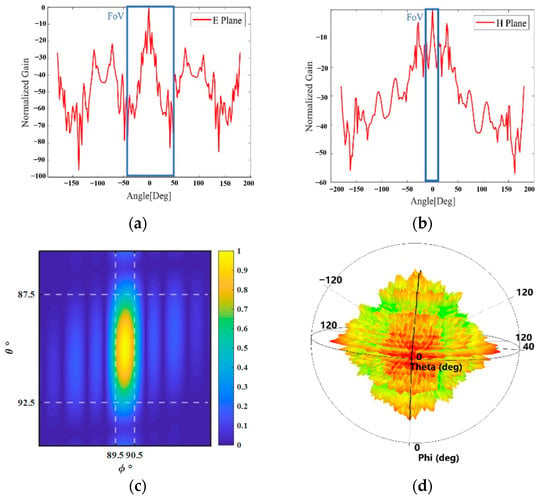
Figure 6.
The designed array with: (a) Realized gain in E plane; (b) H plane; (c) AF map; and (d) beam pattern.
According to the results shown in Figure 6, the designed parameters of the antenna array are given in Table 1.

Table 1.
Designed parameters of the antenna array.
3.2. Antenna Design
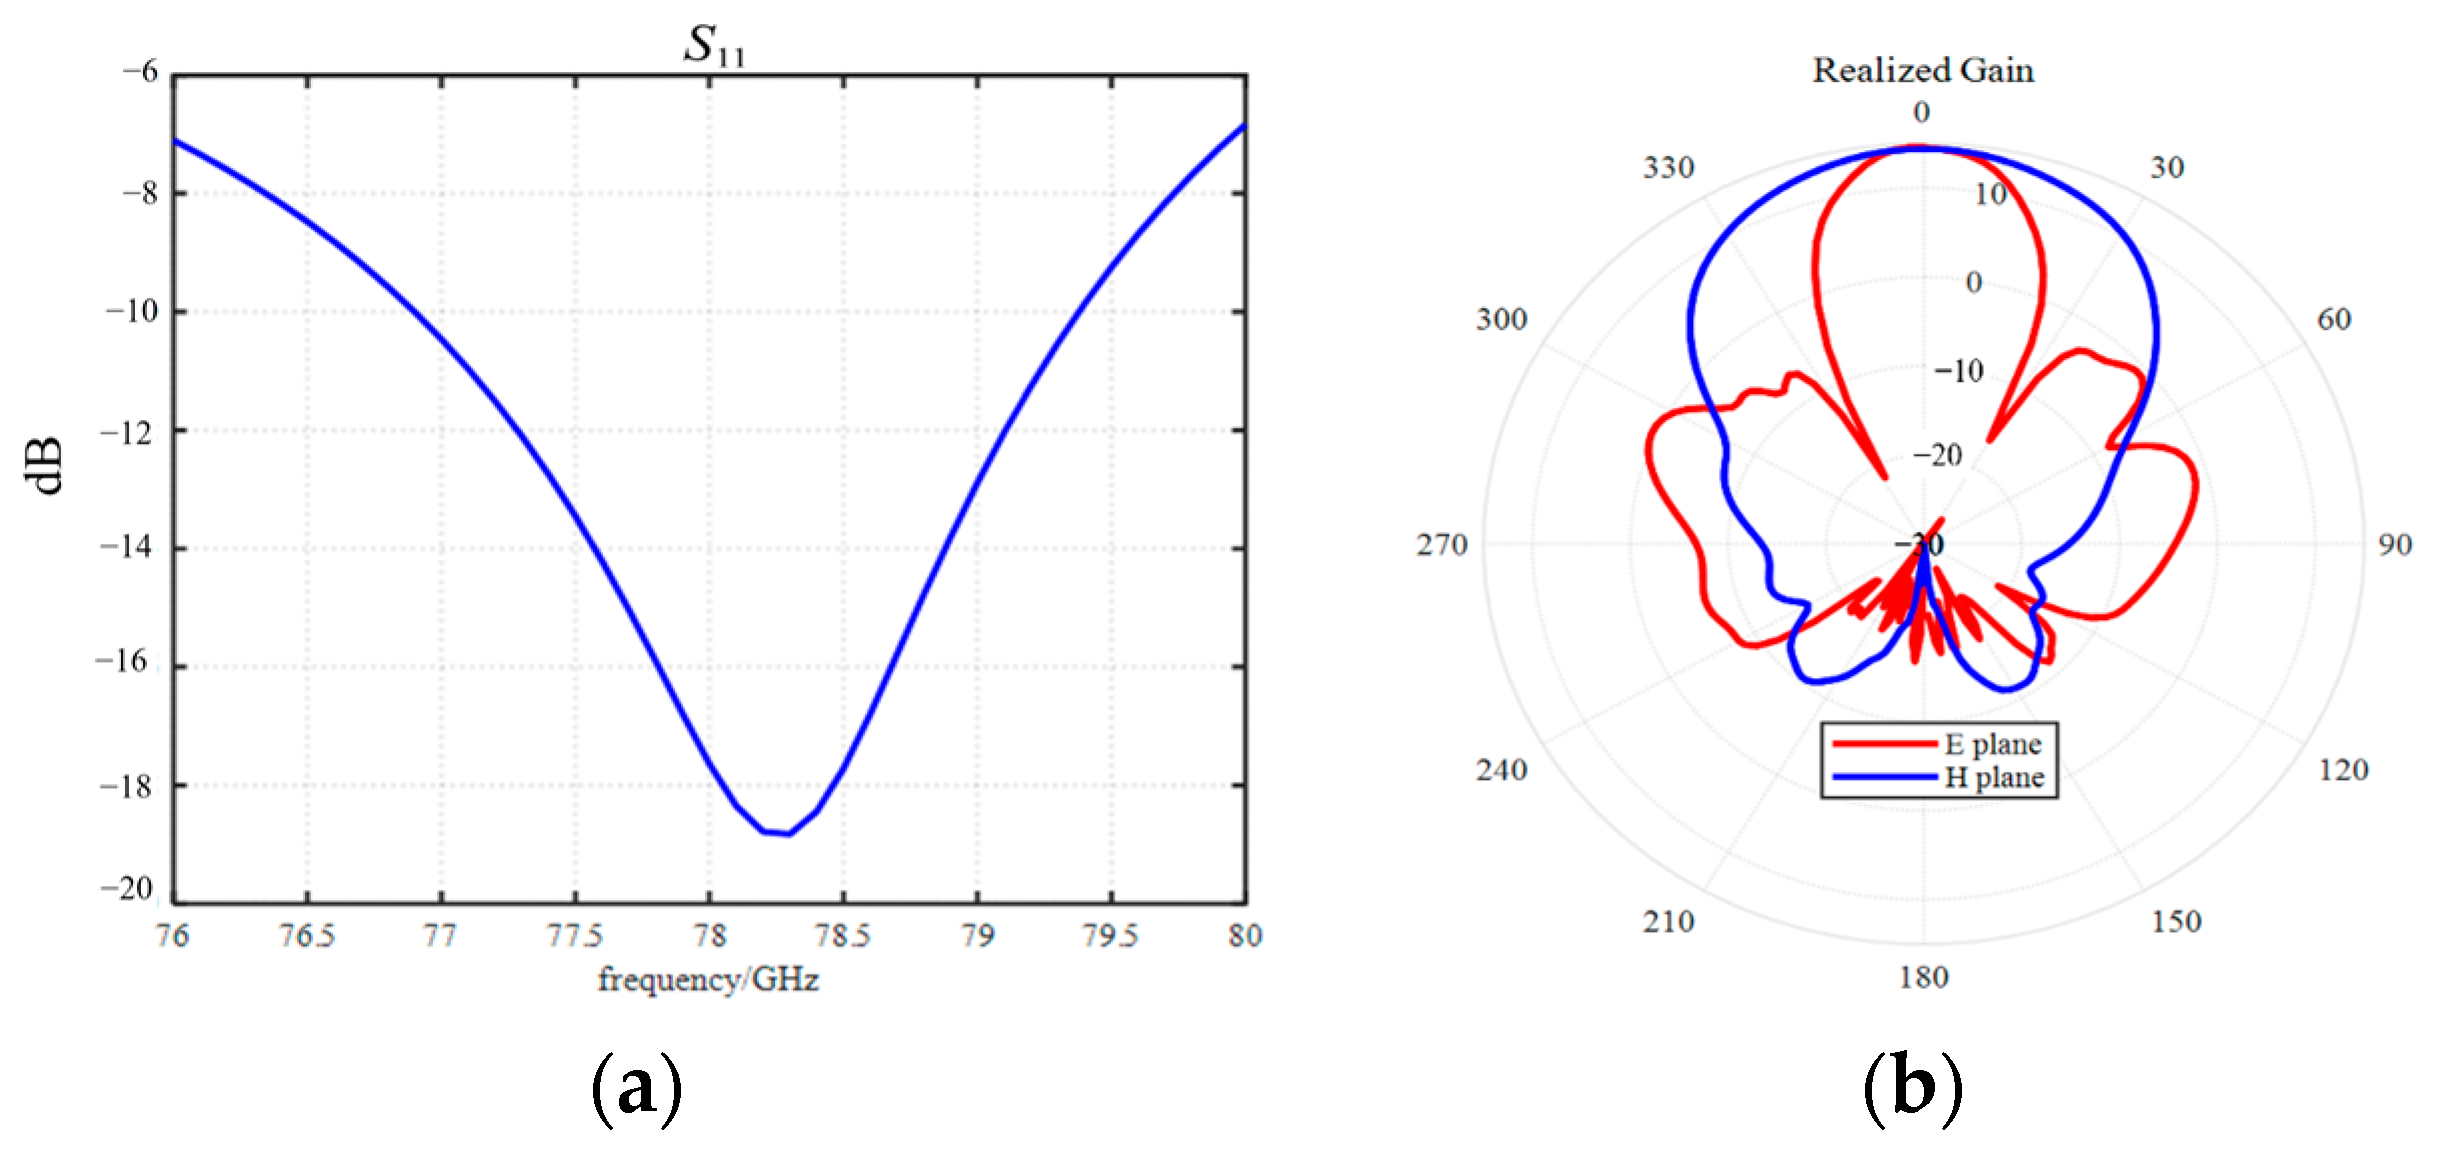
To further improve the performance of the MIMO array, this paper adopts the microstrip antenna, which is commonly used in autonomous driving. The beam pattern is meticulously designed to achieve higher SNR and cover the performance of the entire array design in beam width, main lobe width, and SLL. The microstrip antenna is designed with substrate material Rogers 3003 with the thickness 0.127 mm. The thickness of the copper layer on the surface is 0.035 mm. The technique of electroless nickel immersion gold (ENIG) is adopted to process the copper layer. The antenna has the center frequency response at 77.8 GHz and bandwidth from 76.4 GHz to 79.1 GHz. Lower phase noise can be obtained when 76~78 GHz bands are used.
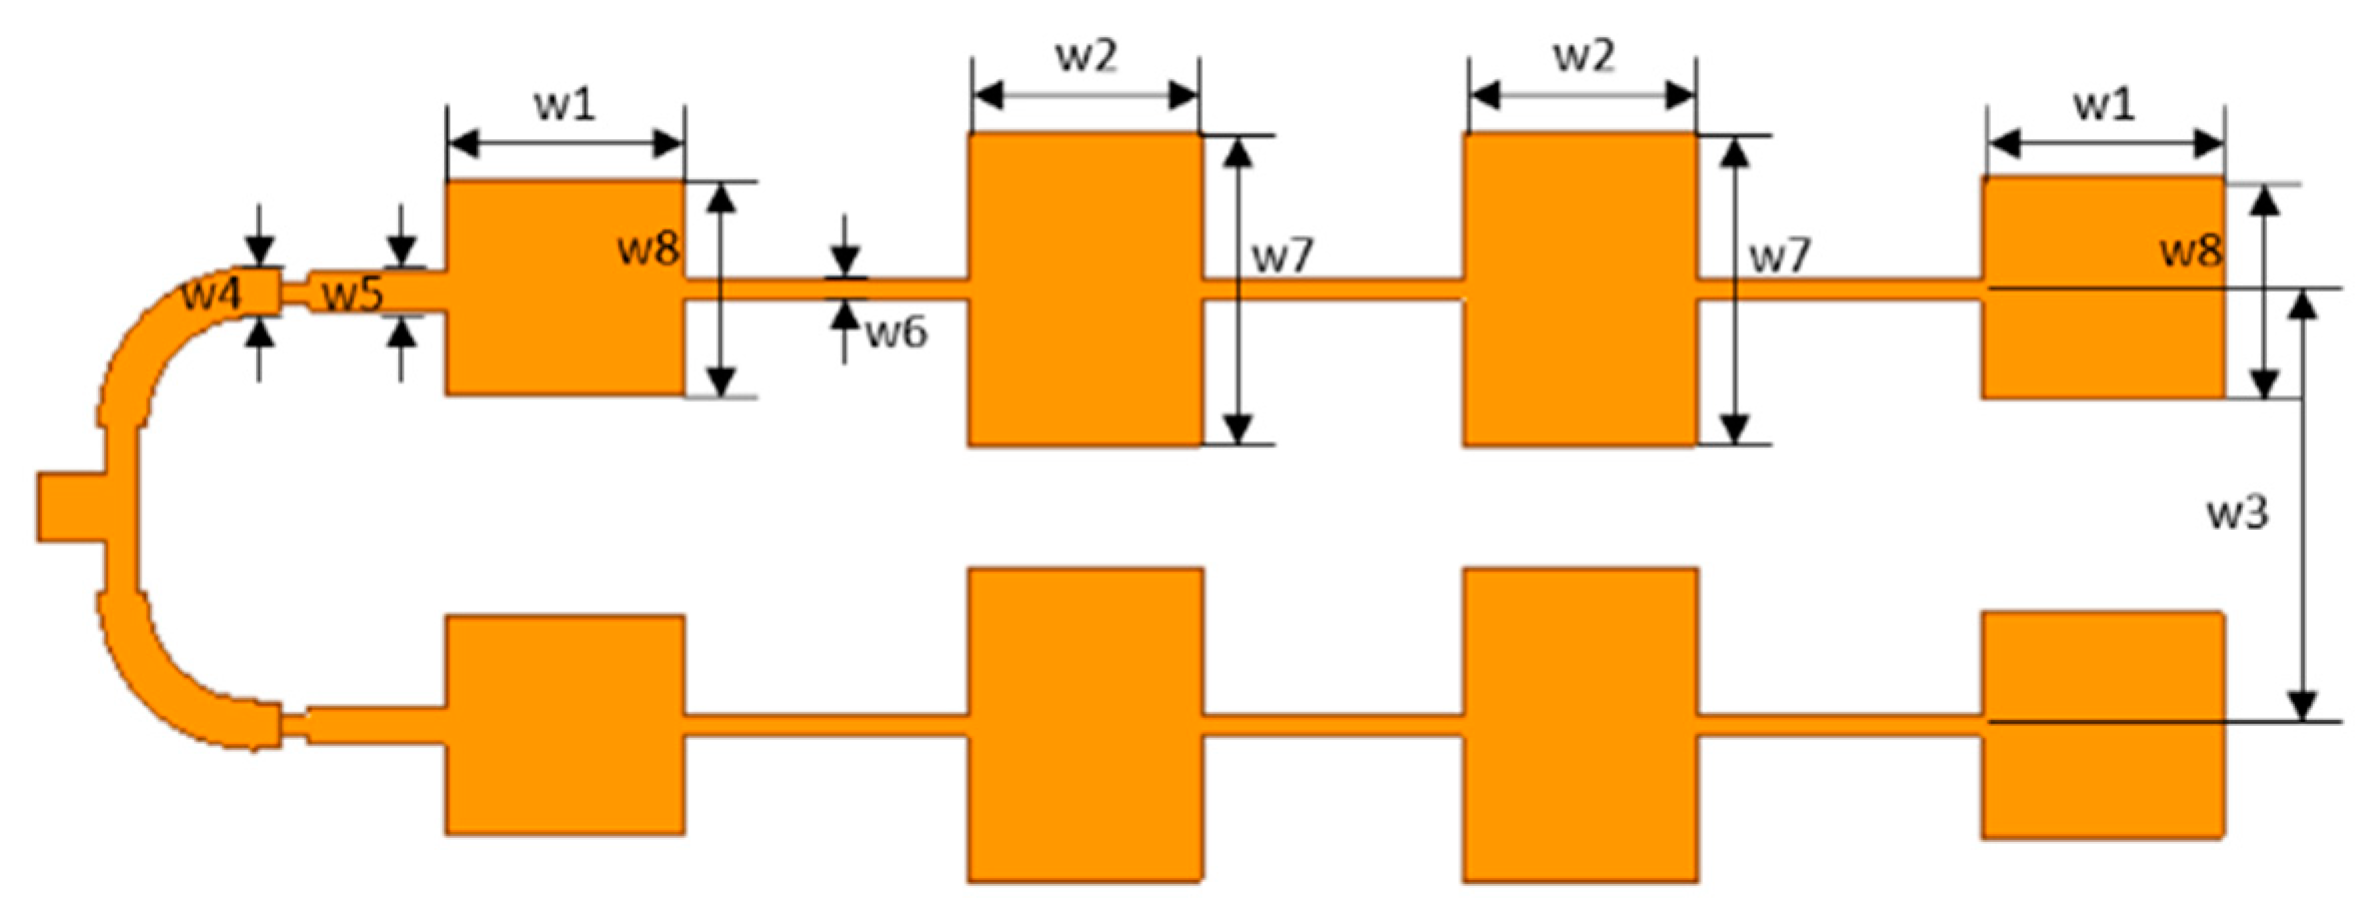
To improve the main lobe level and achieve beamwidth of the FoV, a double U-shaped series-fed microstrip antenna is designed and adjusted according to Dolph–Chebyshev synthesis as shown in Figure 7, and the detailed parameters are listed in Table 2. The characteristics of the designed antennas are shown in Figure 8 with the -parameter and gain.
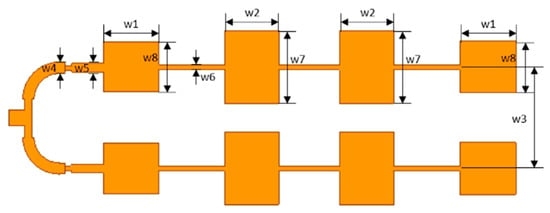
Figure 7.
Diagram of a 77 GHz microstrip antenna.

Table 2.
Designed parameters of the microstrip antenna.
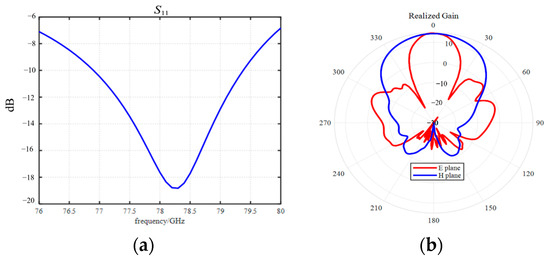
Figure 8.
Simulation results of: (a) -parameter and (b) realized gain.
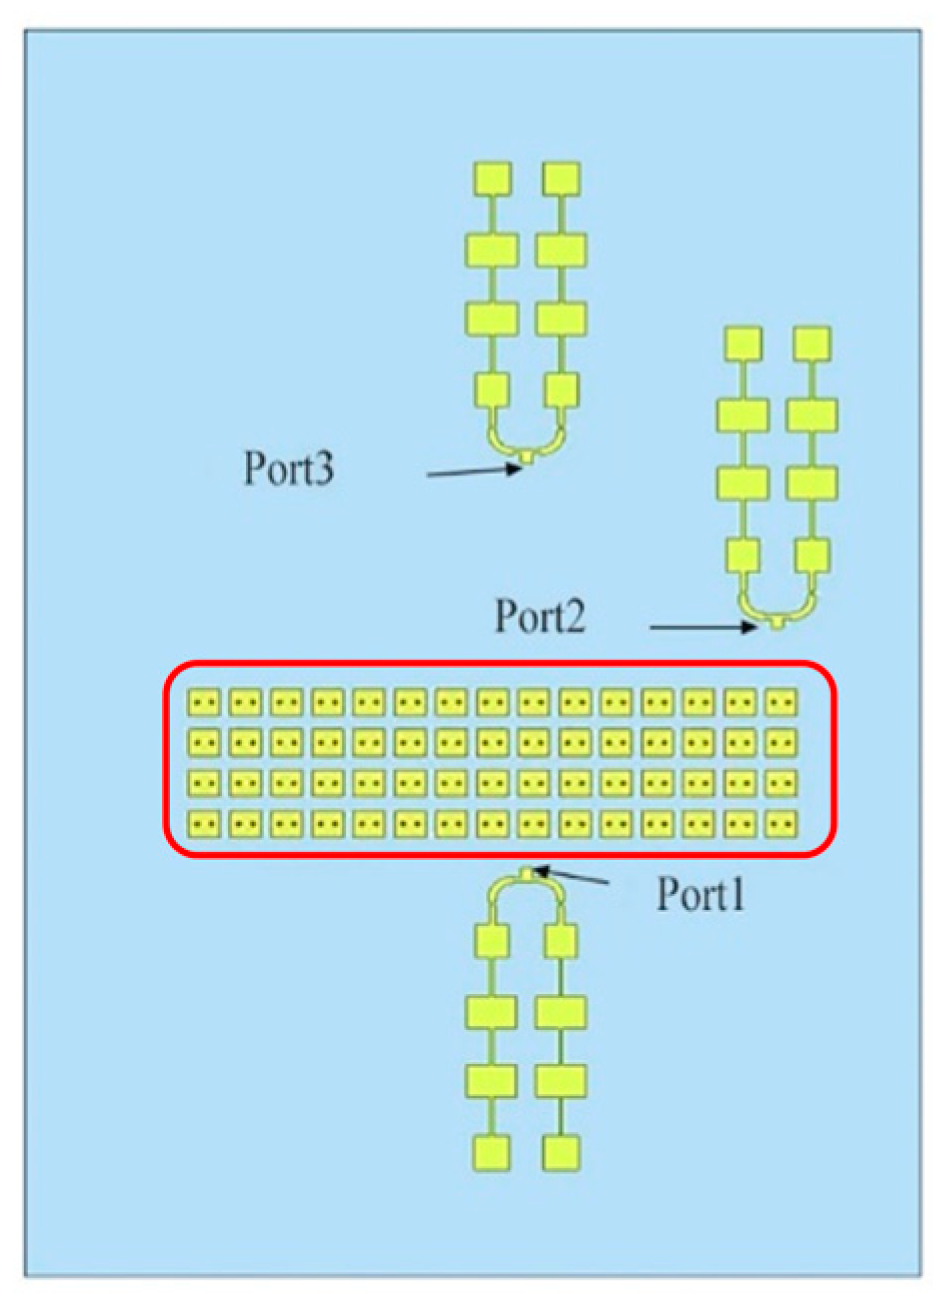
Moreover, the electromagnetic band gap (EBG) structure is introduced in the design of the antennas at closer distances to avoid the coupling effect; that is, several rows of rectangular EBG structures are placed between the antenna units with small spaces, as shown in Figure 9.
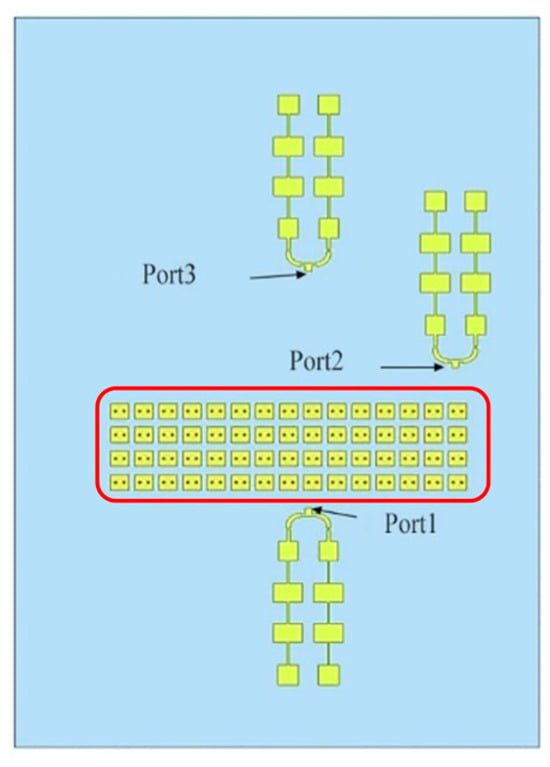
Figure 9.
The EBG structures on the board.
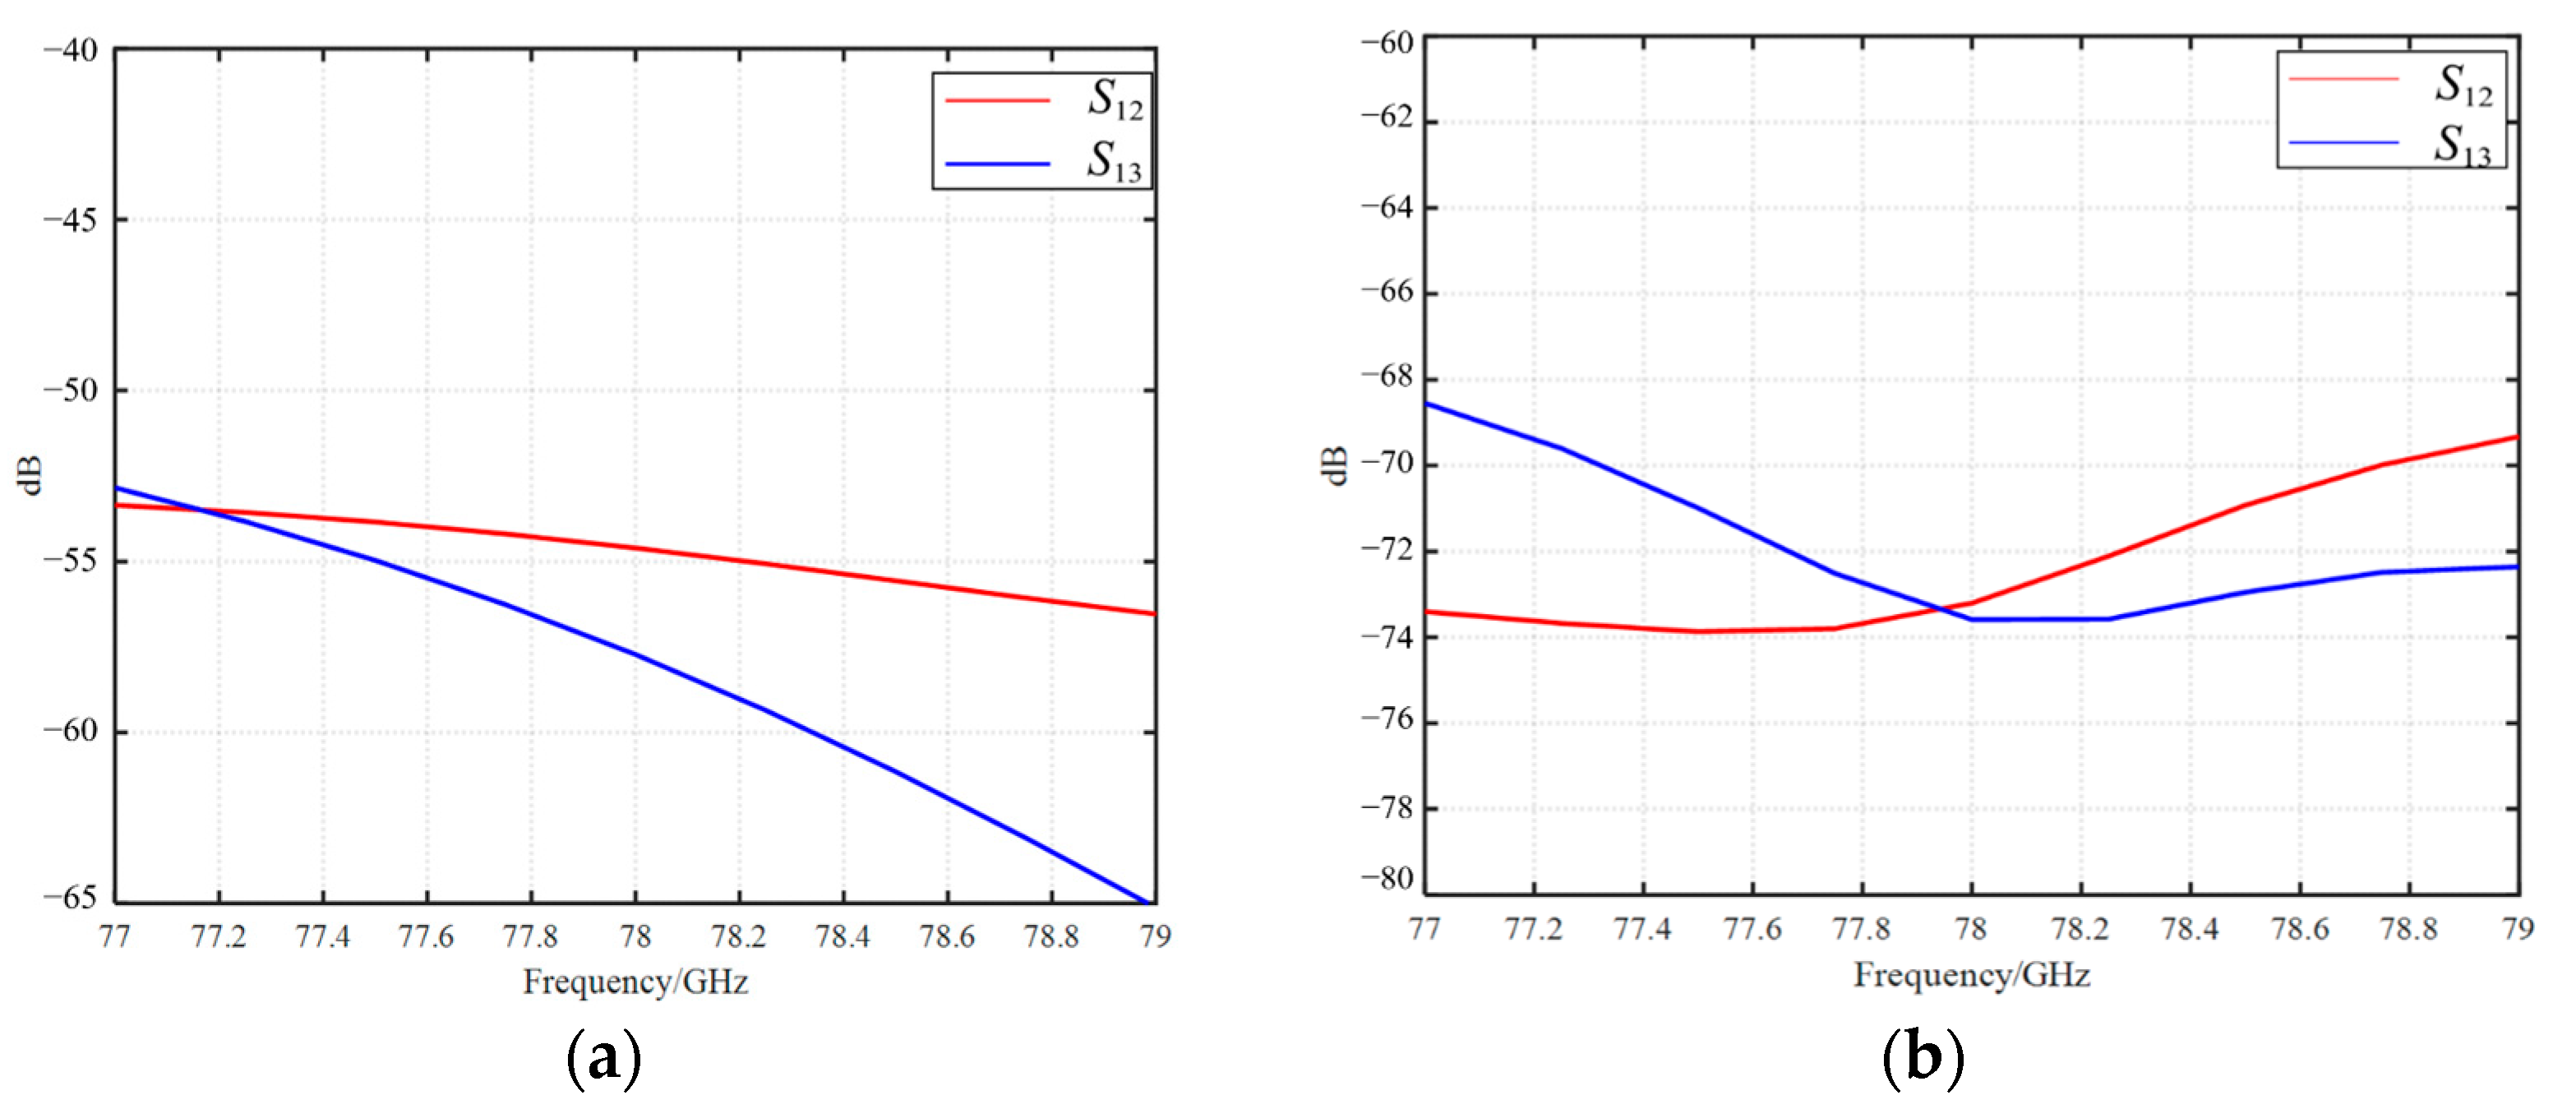
The coupling level is effectively suppressed using the EBG structures, which can be seen from Figure 10. The parameters and are given with EBG in Figure 10a and without EBG in Figure 10b, where represents the coupling level between antenna 1 and . It can be seen that the EBG structure brings more than 15 dB isolation improvement.
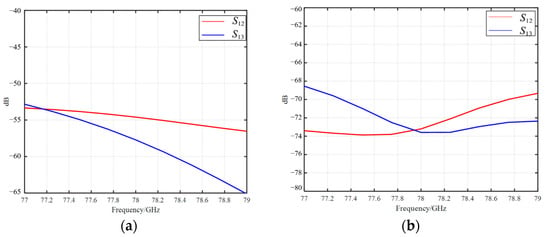
Figure 10.
Comparison of antenna coupling level: (a) with EBG and (b) without EBG.
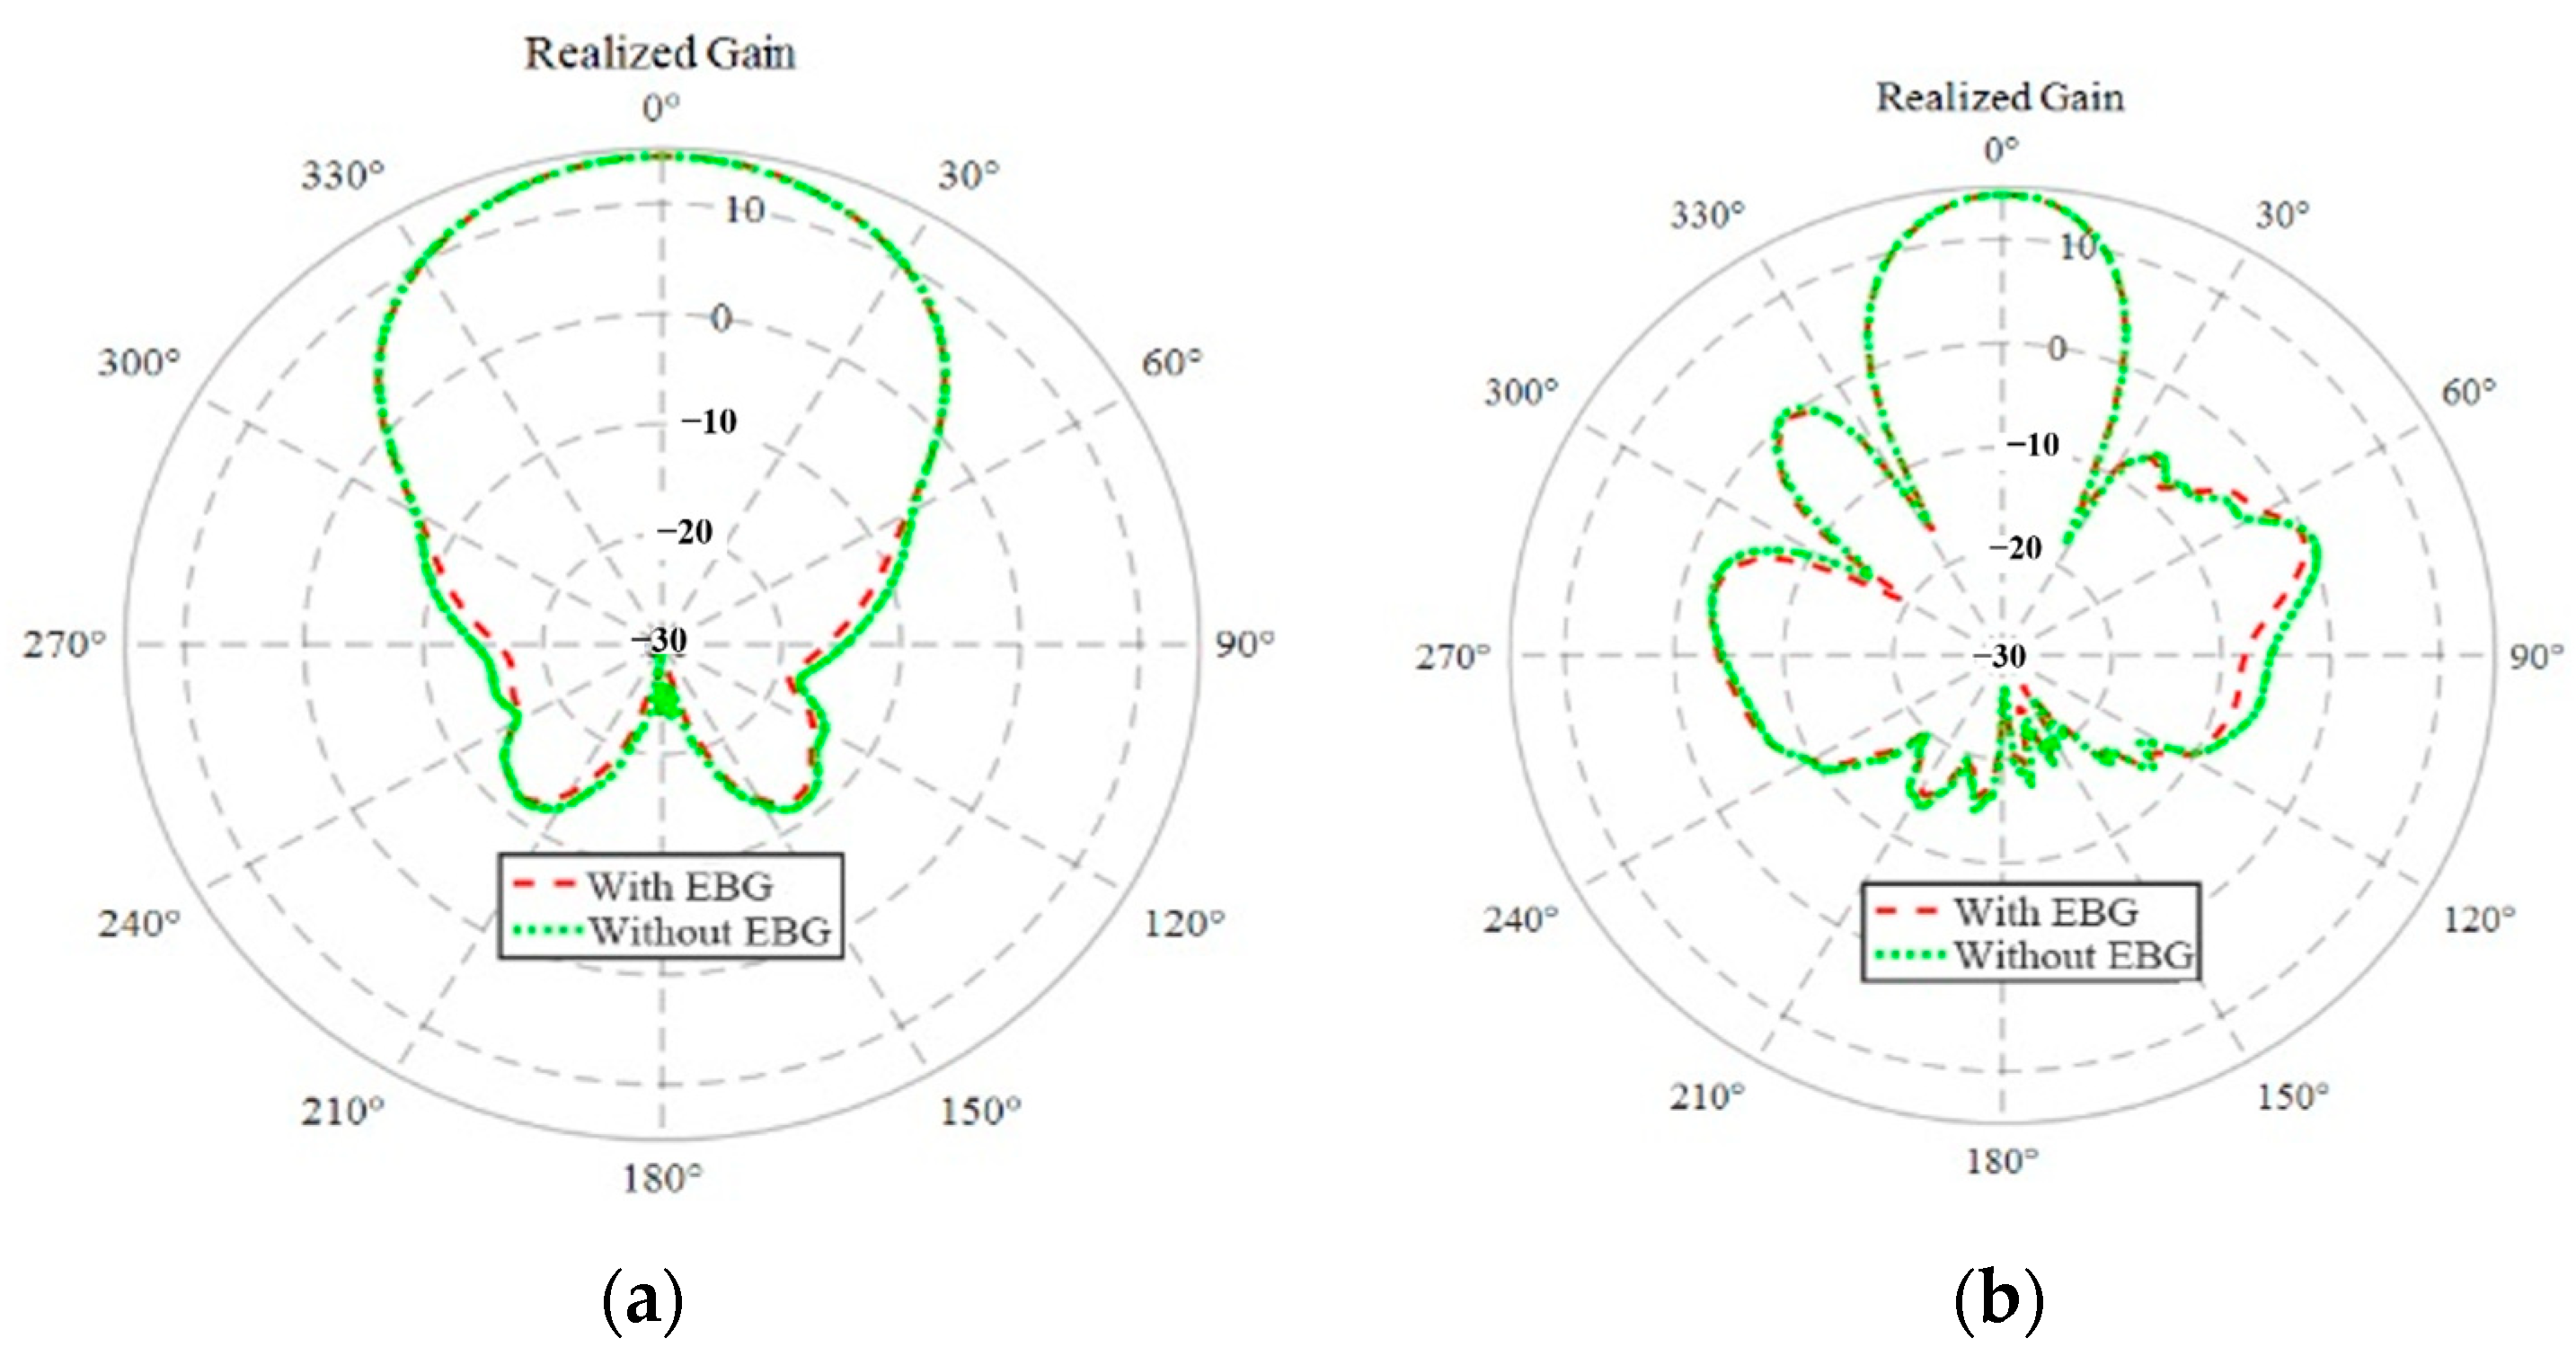
The antenna gains with EBG and without EBG are also analyzed in Figure 11. It can be seen that the EBG structure has little influence on the antenna pattern. Moreover, when the TDM waveform is adopted, the mutual coupling effect will be further reduced. The EBG structure is considered for the antenna design area that does not meet the isolation requirement.
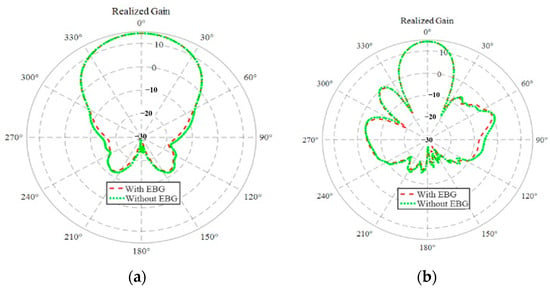
Figure 11.
Comparison of antenna realized gain: (a) with EBG and (b) without EBG.
3.3. Dynamic CFAR
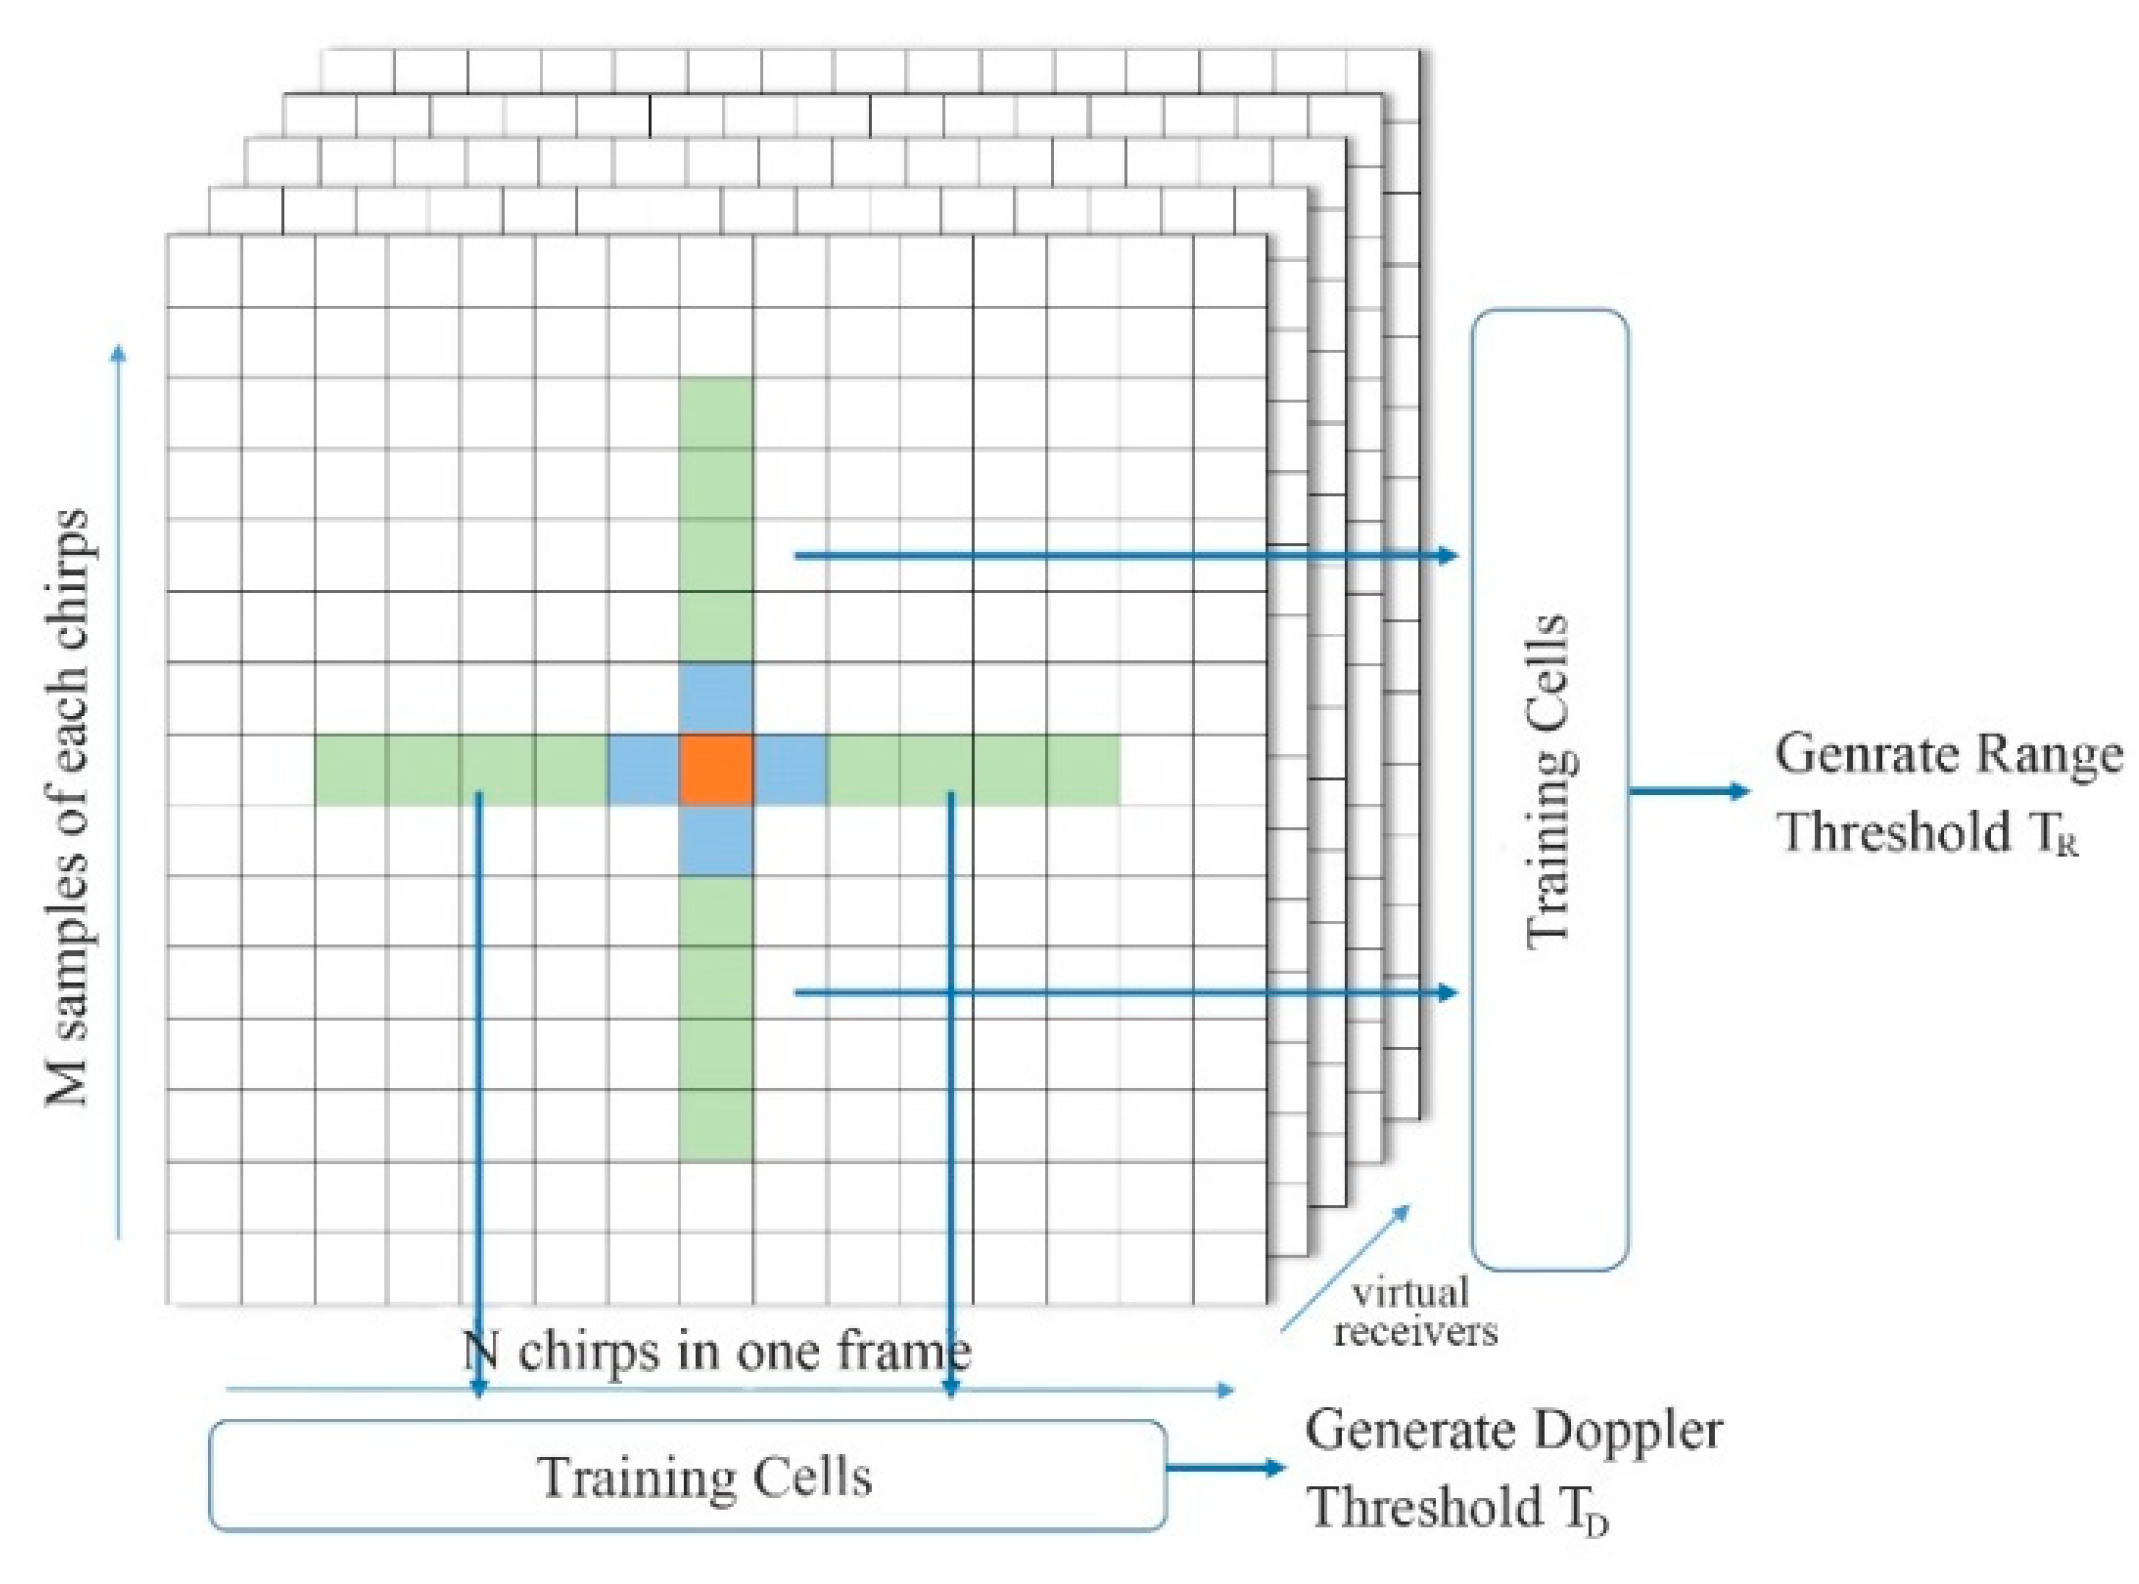
To further improve the quality of the point cloud, a better CFAR detector is always needed. The basic mechanism of target detection in RDMs is the judgment of target existence using the CFAR method, which is shown in Figure 12. The training cells and guard cells are marked with green and blue, which represent the background clutter and target signals, respectively. When the number of training cells is small, the threshold fluctuates rapidly. On the contrary, when the number of training cells is large, the threshold cannot represent the background clutter level properly.
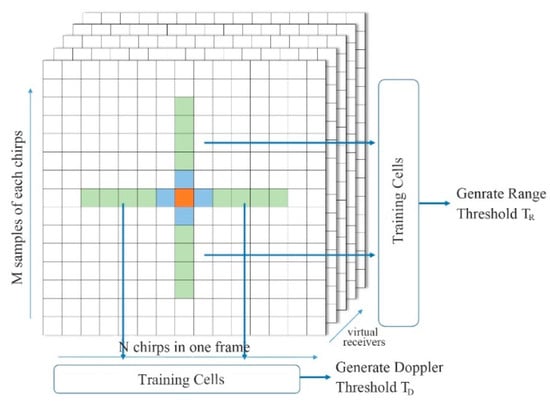
Figure 12.
Sampling points under detection in RD maps.
The decision thresholds and are calculated in range and Doppler dimensions, with the judgment written as follows:
In general, the number of guard cells should be larger than the target signal to provide the exact clutter sampling. However, the specific parameters should be adjusted in practical applications according to this strategy.
However, the target with weak reflection usually cannot be detected when the training cells appear high power, bringing the accuracy decrease in the spatial target detection. Therefore, the key point is to determine an adequate edge and threshold for the detection.
In the case of 2D target detection, CFAR with fixed parameters is always difficult to achieve more accurate performance when the environment is complicated with non-uniformly distributed clutter. Thus, it is necessary to distinguish objects in different environmental clutters to perform sensitive detection and capture the detailed characteristics of the target accurately.
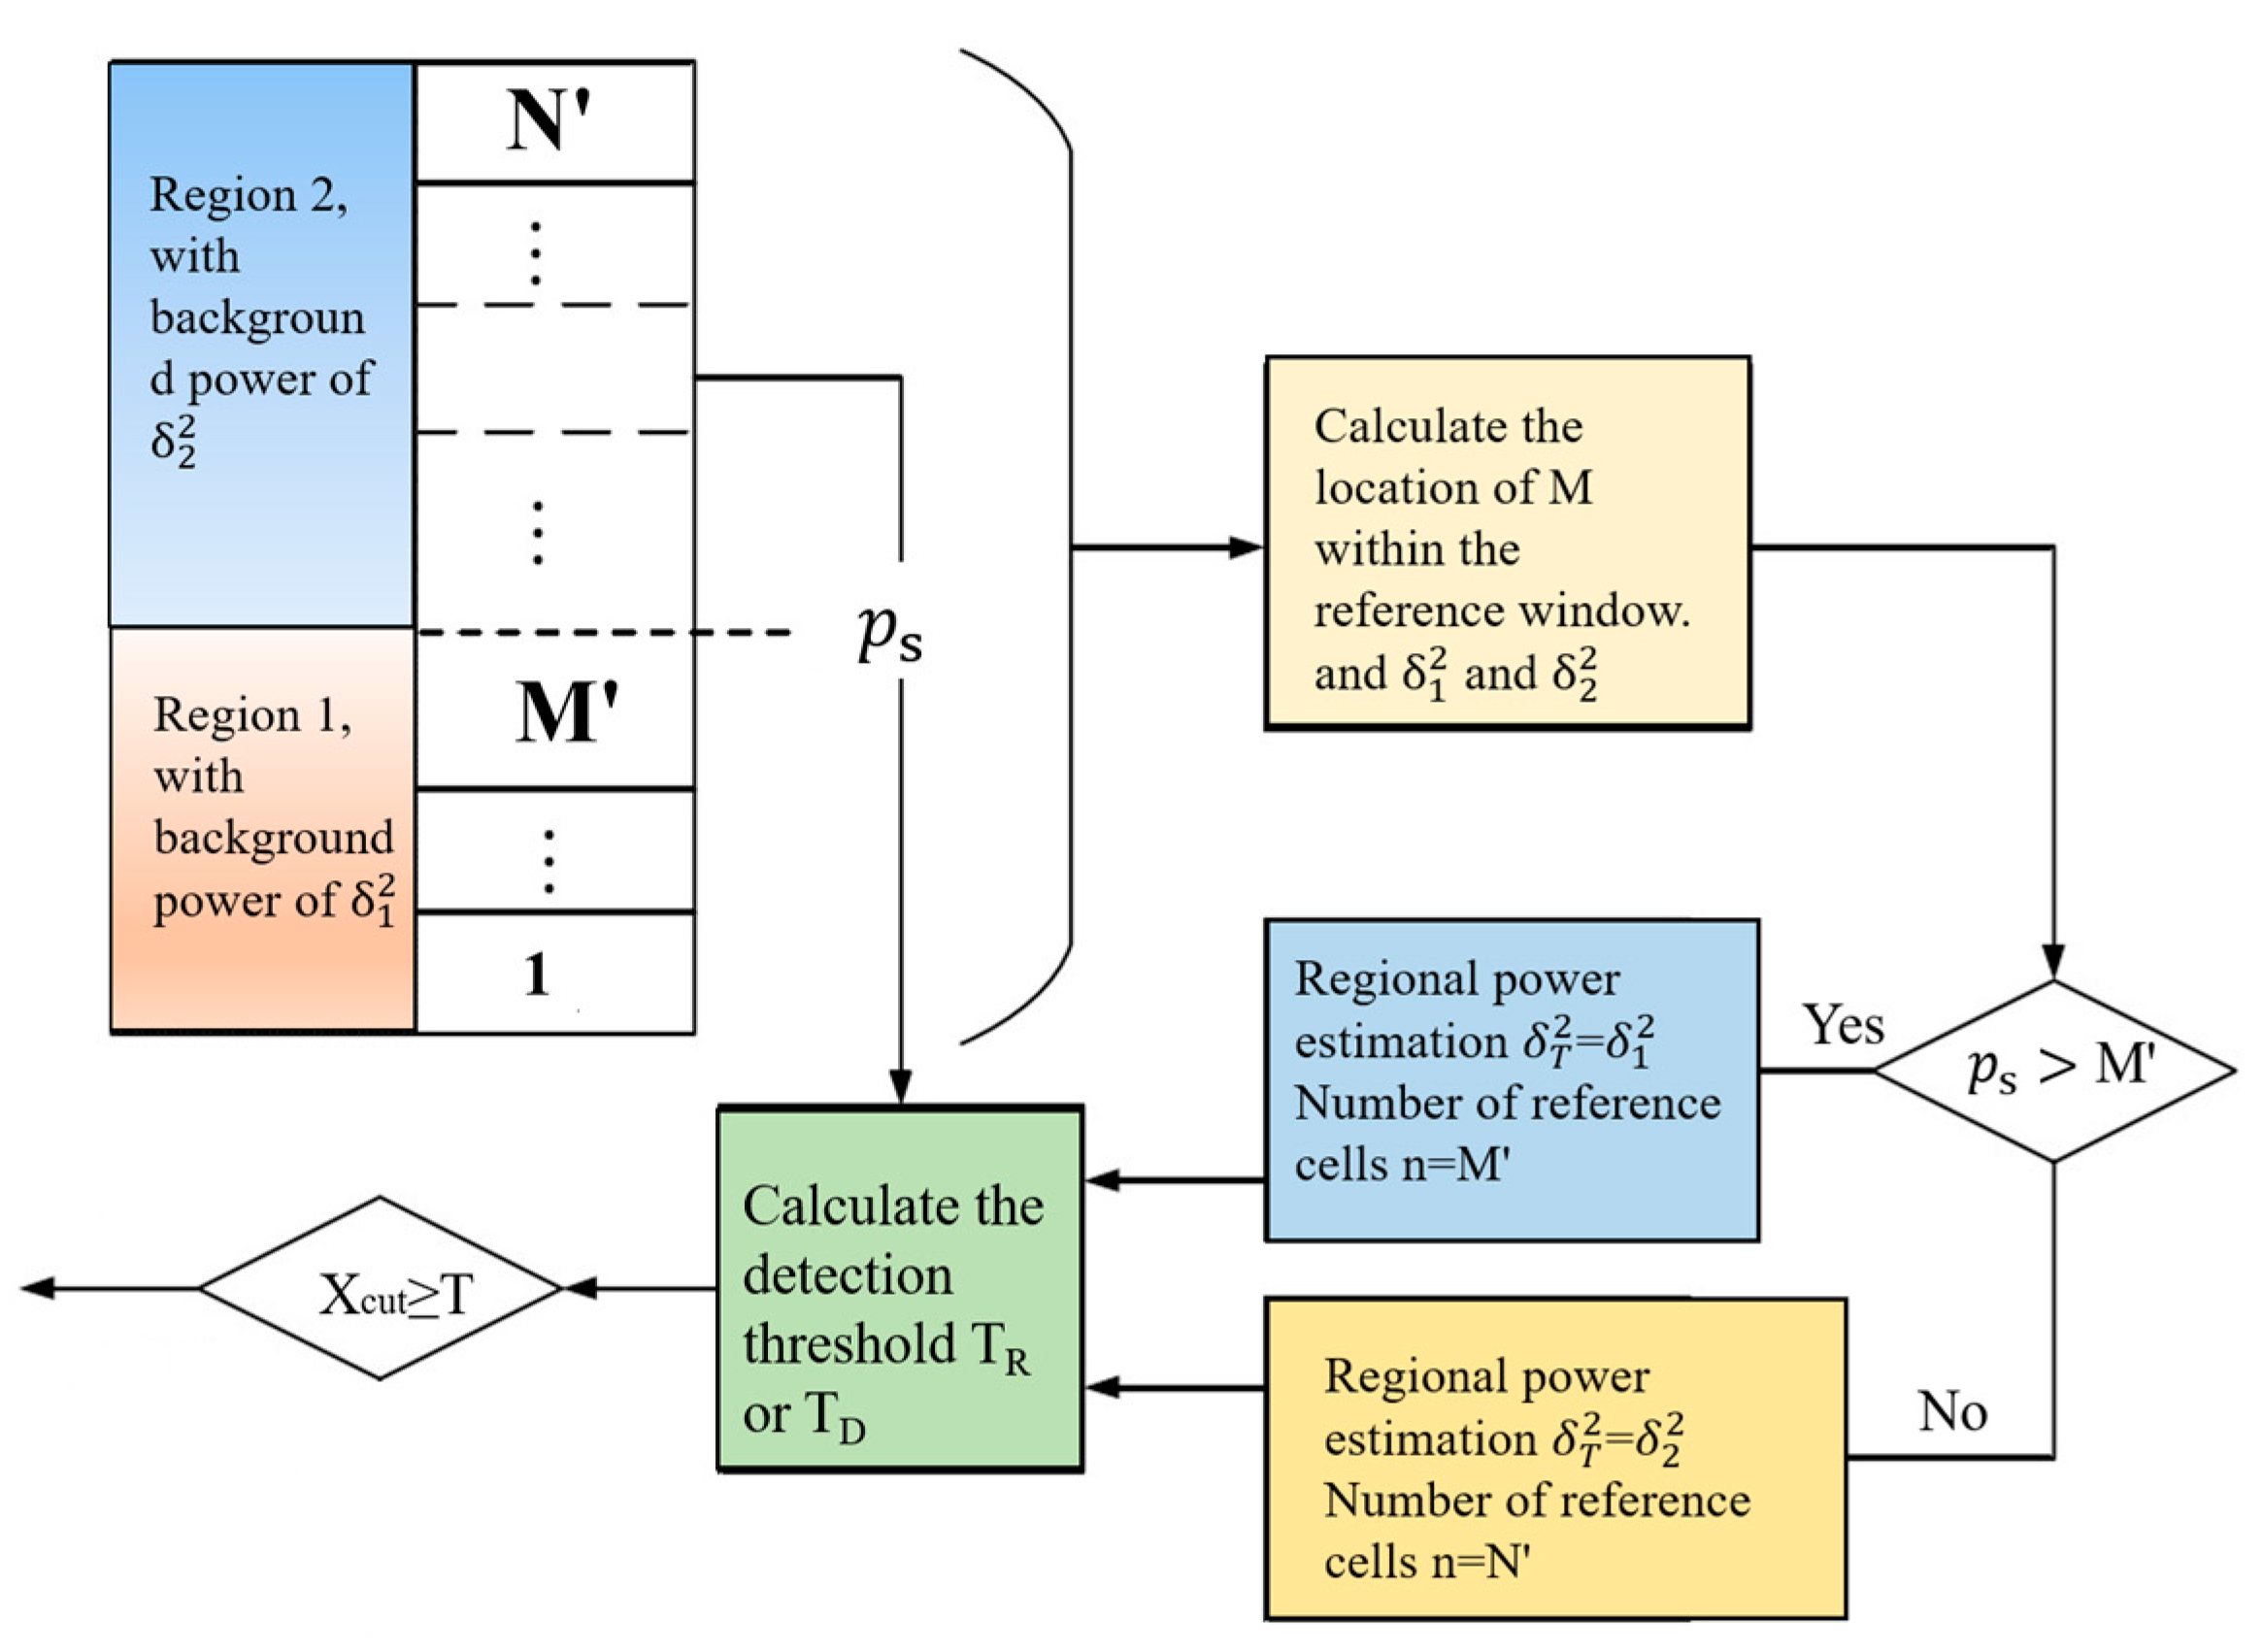
The dynamic CFAR can be used in uniformly distributed clutter environments or complicated environments with non-uniformly distributed clutter. In the case of a complicated environment, the edge areas are identified with reference to the reference window. Then, the location region of the CUT is judged as either a strong or weak clutter region. Finally, two detectors are introduced to perform target detection, and the results of both areas are merged. The detailed diagram is shown in Figure 13. The CUT is located in region 1, and the parameters of region 1 are used to calculate the detection threshold, which are the variance of the clutter power and the length , when the variance of the clutter power and the length present the parameters of region 2.
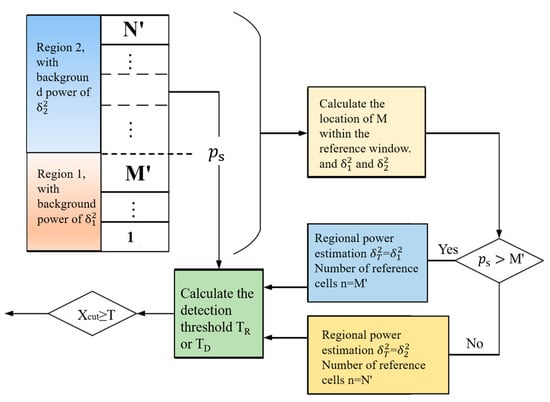
Figure 13.
The diagram of the proposed dynamic CFAR.
The maximum likelihood estimation method is used to determine the clutter edge position, which can be described as follows:
where are the sampling points of the RD map, and is the hypothesis of the clutter distribution.
With taking logarithms on both sides of (12), the maximum likelihood estimation of the threshold can be written as follows:
Abbreviate for and find the gradient on both sides of (13), using the following expression:
The estimates of and can be obtained as follows:
Then, the expression of can be arranged and rewritten as follows:
Ignoring the constants and the split position of areas 1 and 2 can be optimized and written as follows:
After determining the split location of regions 1 and 2, the SOCA-CFAR algorithm is introduced to detect the target existence. Based on the point cloud imagery process described above, the proposed method to estimate the boundaries of non-uniform regions using dynamic thresholds for different regions is considered to improve the point cloud accuracy.
4. Experiments
4.1. Target Detectability
To verify the proposed method for the antenna and MIMO array design, two-point targets, which are metal balls, are detected by simulation experiments. The SBR tracing method is used in this experiment. The SBR technology utilizes the equivalence theorem to approximate electrical and magnetic sources at the surface rather than using full-wave simulation. It enables accurate and efficient simulation of electrically large-scale problems. The scattering field contribution of the defined platform geometry is calculated using unidirectional coupling. The coupling between near-field pattern, far-field pattern, and antenna (S-parameter) is calculated efficiently in the presence of electromagnetic geometry [33]. The SBR process has been integrated into the HFSS software V2024 and can be easily called [34].
The simulation analysis of the designed array is shown in Figure 14. To deploy the simulation geometry, as shown in Figure 14a, the mmWave radar is positioned at one end of the road and elevated at a certain height from the road plane. At the other end of the road, two reflective objects, such as metal pellets, are placed. In the previous section of the antenna design, the antenna pattern was computed using the EM simulator. By importing the radiation characteristics of each antenna according to the actual array positions and solving the EM field distribution over the entire range of the mmWave radar detection using the SBR tracing method, the EM characteristics of the detected targets can be obtained as shown in Figure 14b,c.

Figure 14.
Simulation analysis of the designed MIMO array with: (a) SBR tracing geometry and reflection distributions of two objects; (b) horizontal direction; and (c) vertical direction.
The angular resolutions are one degree and five degrees in the horizontal direction and vertical direction, respectively, as shown by the SBR tracing analysis. This is consistent with the AF analysis in the previous section of the antenna design and indicates the detection performance of the MIMO array.
Using the parameters of the array and antenna designed in this paper, the radiation characteristics are combined with the SBR simulator to verify the detectability of the target. After the processing of the target echo signals, the reflection intensities with spatial distribution can be obtained. The numerical analysis shows that the designed MIMO array can distinguish the reflectors with high resolution, which implies high accuracy in DOA estimation, making it possible to generate high-quality point clouds using the designed antenna array. The simulation results of SBR technology and ambiguity function show that different analysis methods are used, but close resolution calculation results are formed, and accuracy can be cross-verified, which is also the method adopted in this article.
4.2. Three-Dimensional Spatial Resolutions
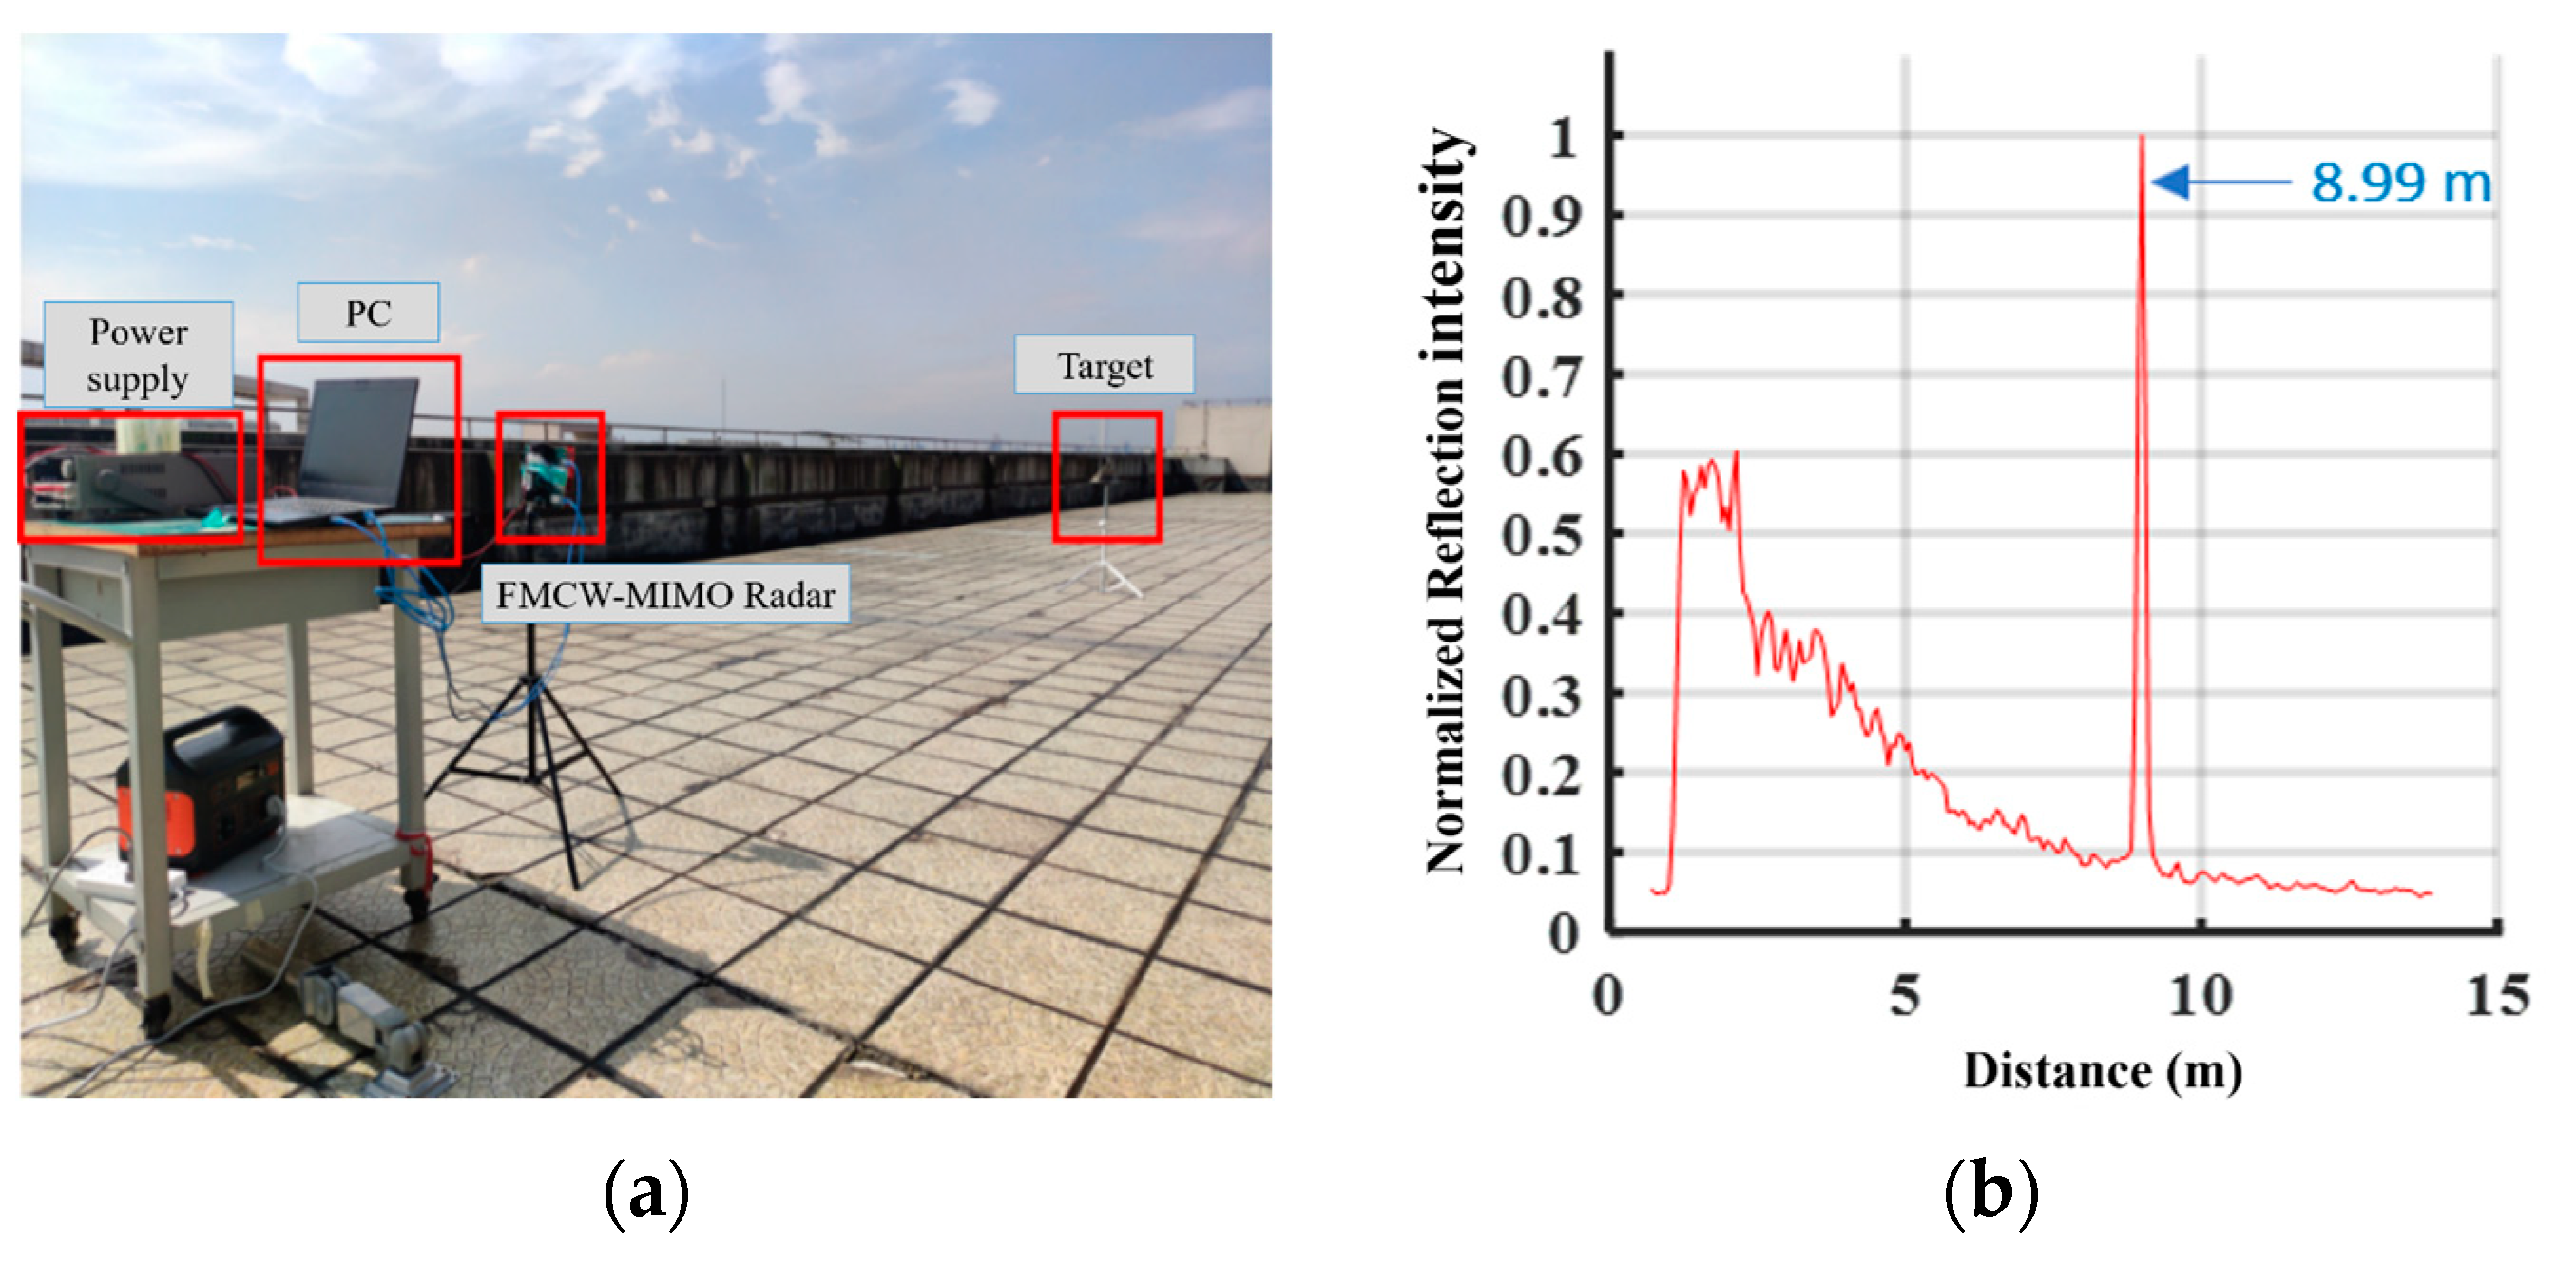
Since the velocity accuracy of the mmWave just depends on the parameters of pulse repetition frequency (PRF) and chirp number per frame, the 3D spatial resolutions in range, azimuth, and elevation are analyzed. The range resolution analysis is performed, and the result is shown in Figure 15. The designed range of the target is ~9 m, and the measured profile shows a peak value at a distance of 8.99 m with a high SNR.
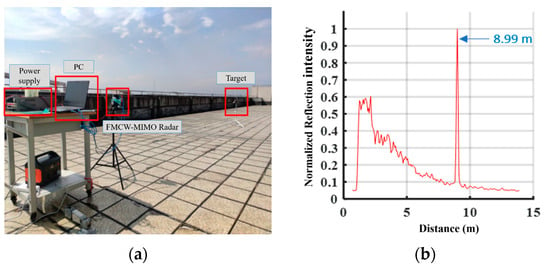
Figure 15.
Range resolution analysis with: (a) the experiment scenario deployment and (b) the measured range profile of the target.
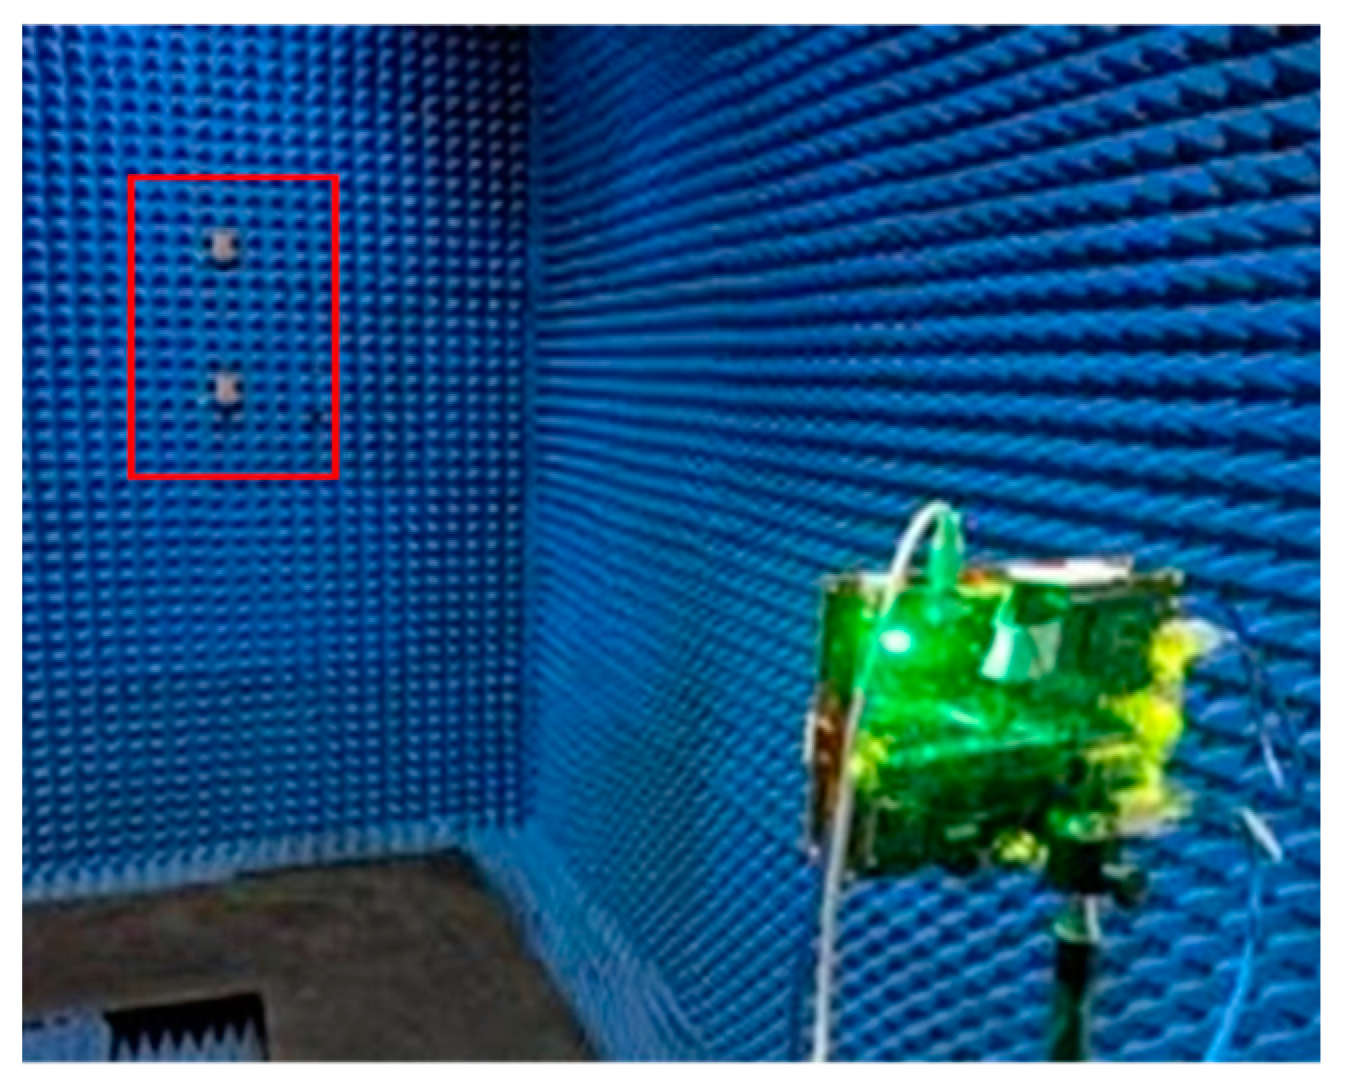
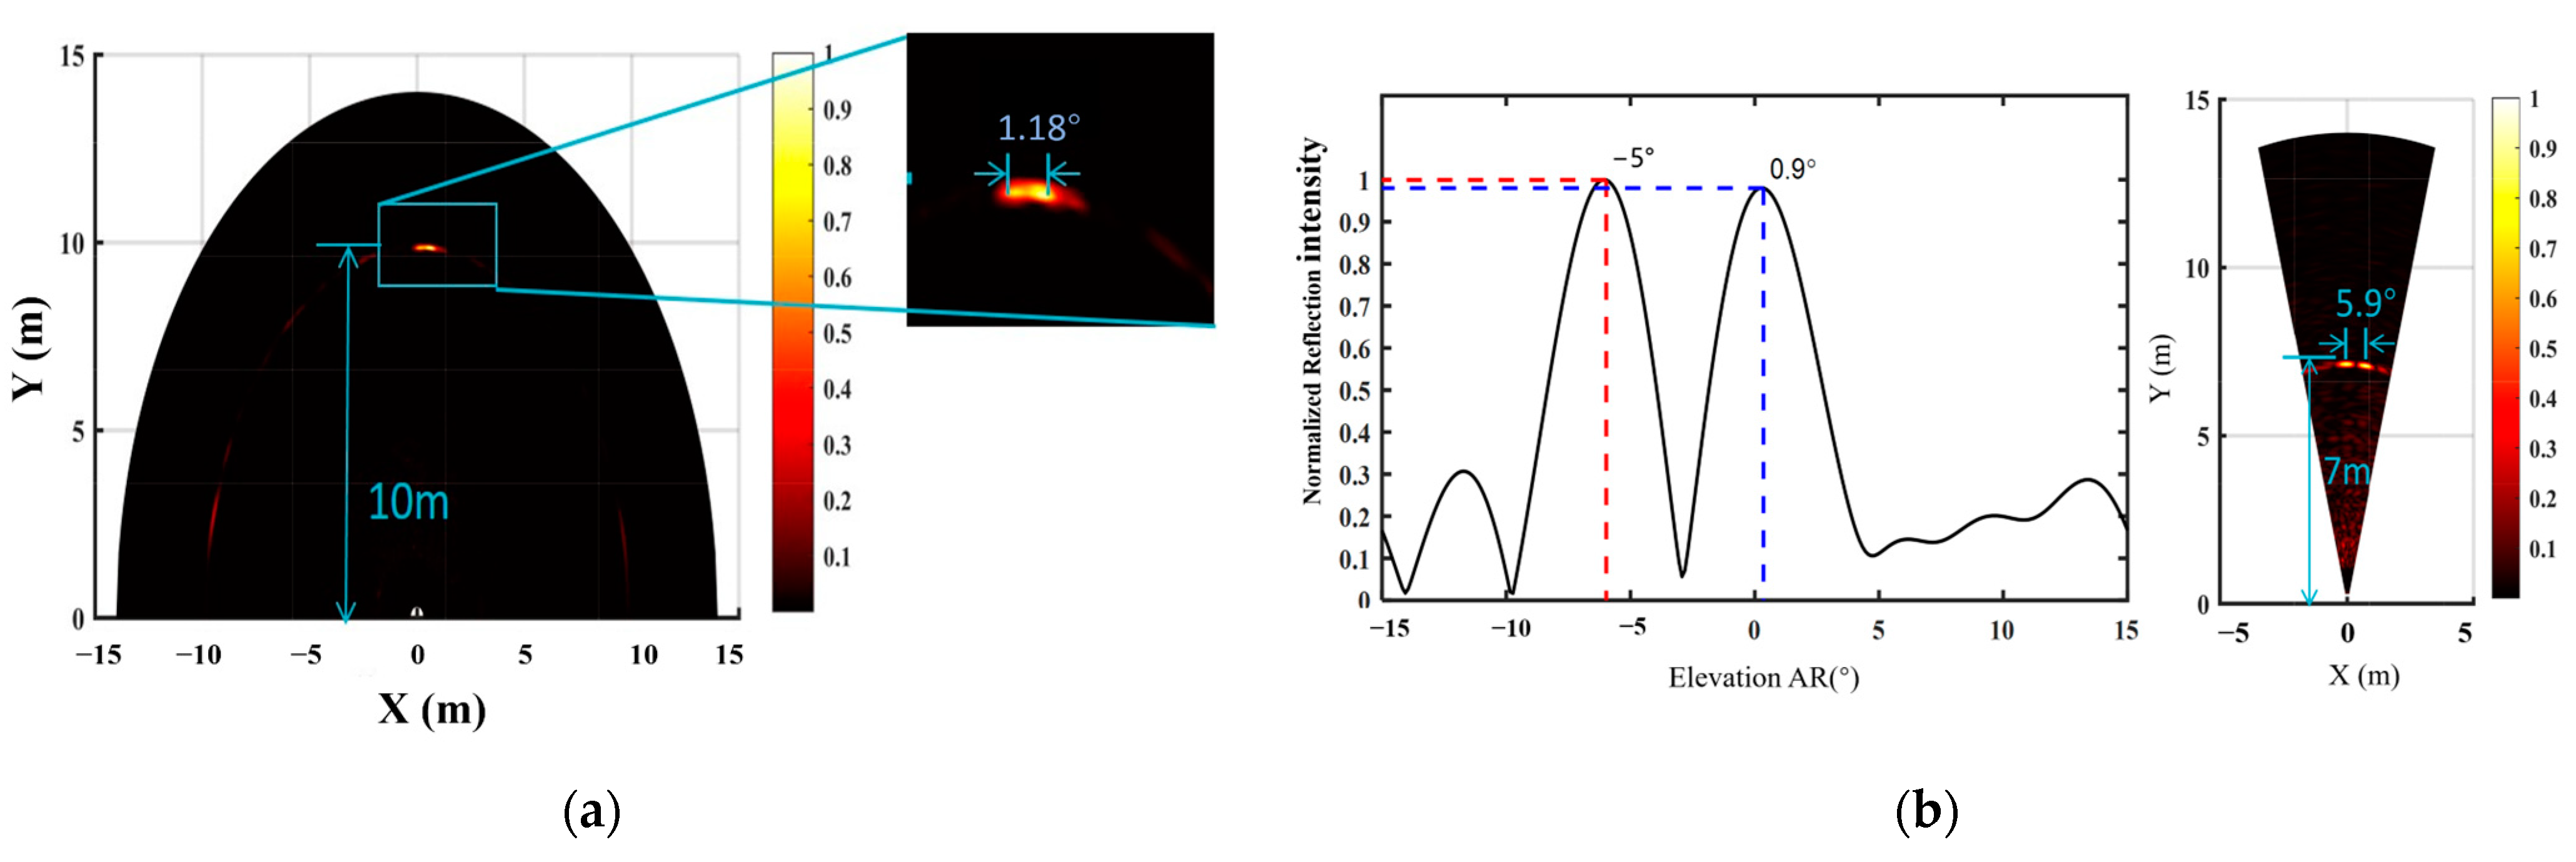
The angular resolutions in azimuth and elevation are tested in the anechoic chamber, as shown in Figure 16. Two metal objects located in the FoV of the mmWave radar act as point targets, which are placed in vertical or horizontal direction depending on the resolution test in azimuth or elevation. Figure 17a shows the measurement of the two targets with angular resolution 1.18 degrees in azimuth. Figure 17b shows the measurement of the two targets with angular resolution 5.9 degrees in azimuth. When conducting angular resolution testing, we found that the smaller the area of the tested target, the higher the reflectivity, and the better the accuracy of resolution judgment. Good beam quality will also create better echo verification effects. Therefore, further optimization of radiation characteristics and reduction in beam loss, such as using waveguide slot antennas, will enhance echo quality and produce better point cloud imaging effects.
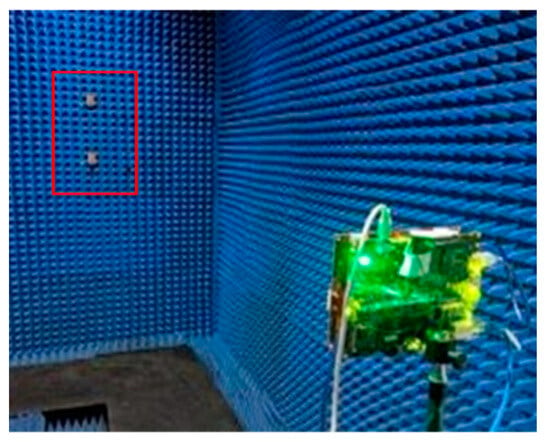
Figure 16.
The experiment setup for deployment with two point targets.
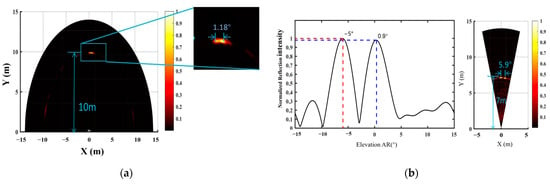
Figure 17.
Angular resolutions test with resolutions: (a) in azimuth and (b) in elevation.
4.3. Detection in Complex Environments
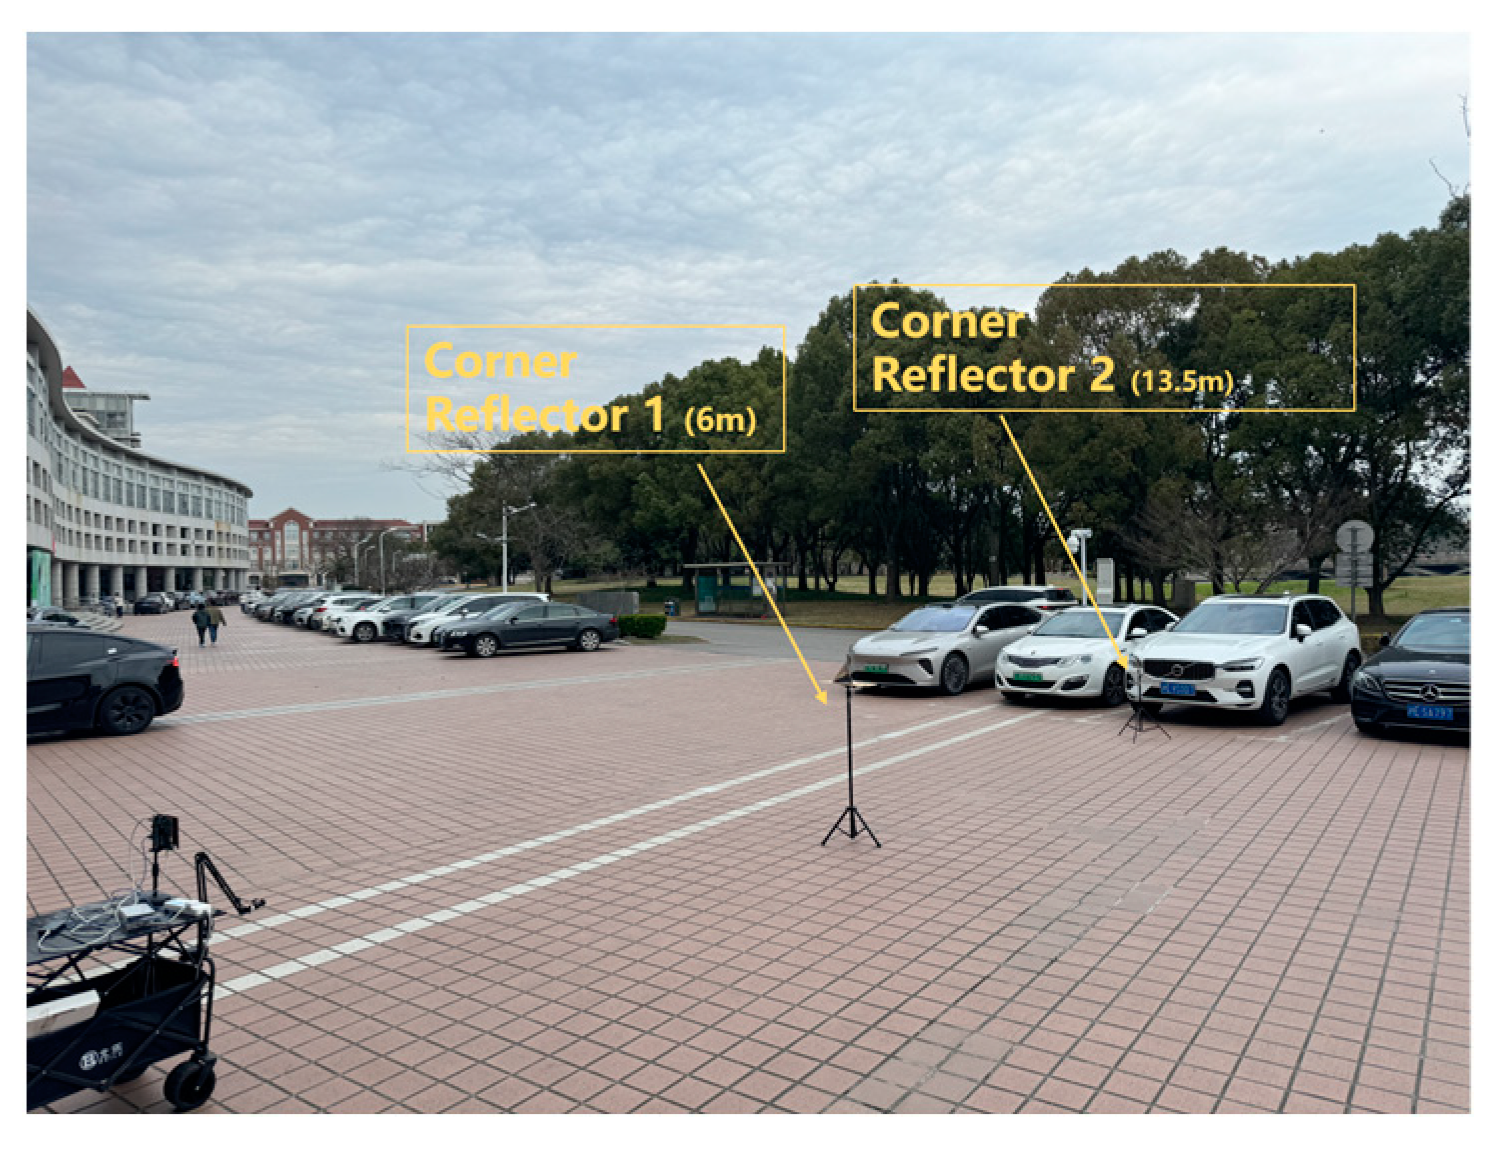
Using the designed antenna, the target detection performance in a complex environment is tested. The experiment scenario is set up as shown in Figure 18.
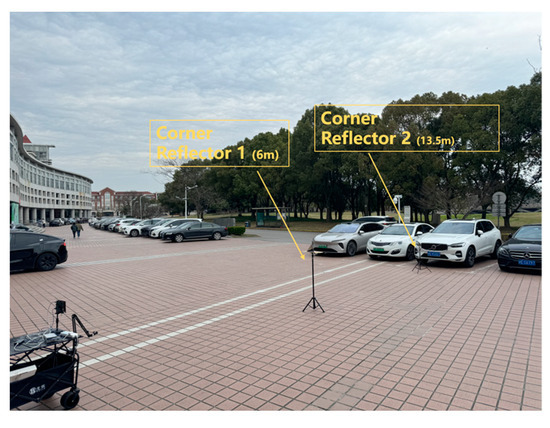
Figure 18.
The experiment scenario deployment with weak target.
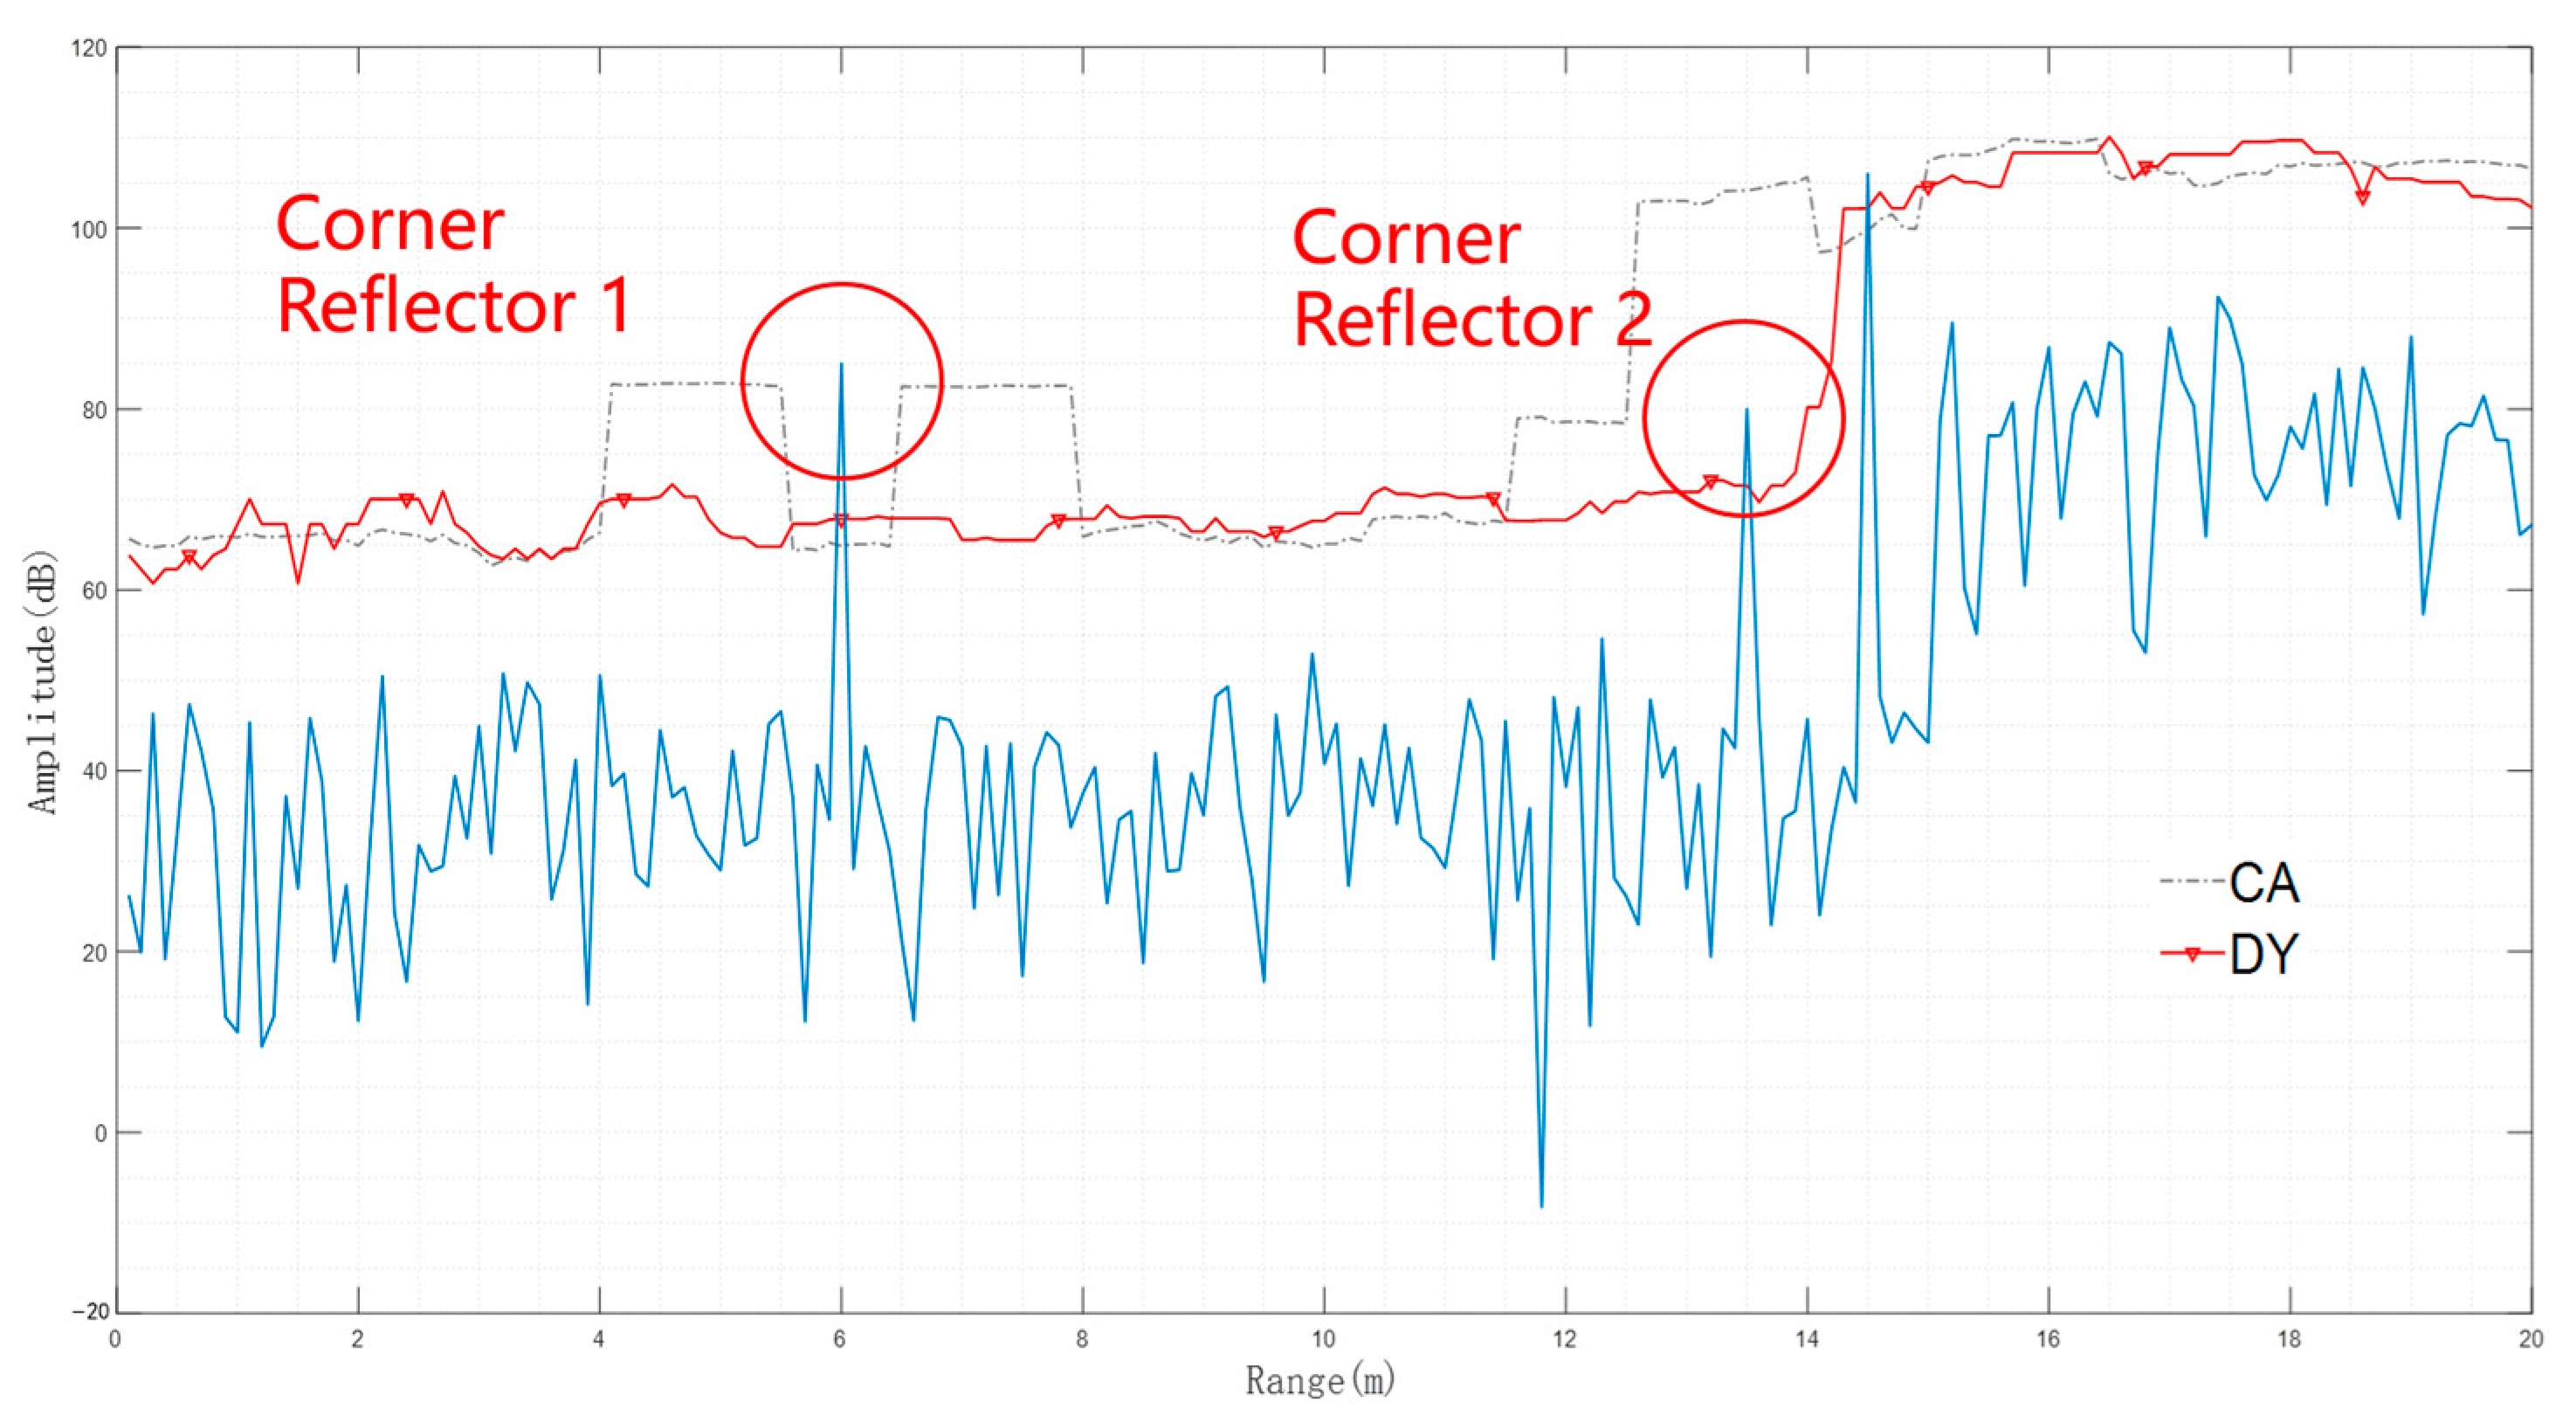
The corresponding threshold is selected according to the length of the reference cells, as shown in Figure 19, where the corner reflector can be detected using the dynamic CFAR proposed in this paper. The number of training and guard cells on the left and right sides were selected to be 16 and 8, respectively. However, the number of training cells can be reduced in long-distance detection to avoid extra computation, where the resolution cell is larger.
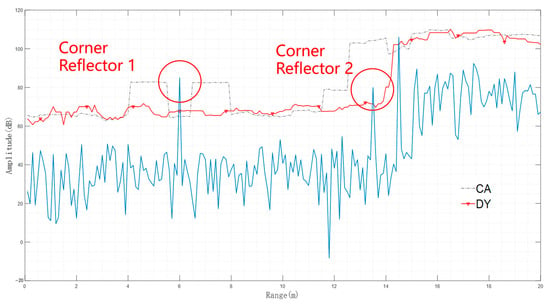
Figure 19.
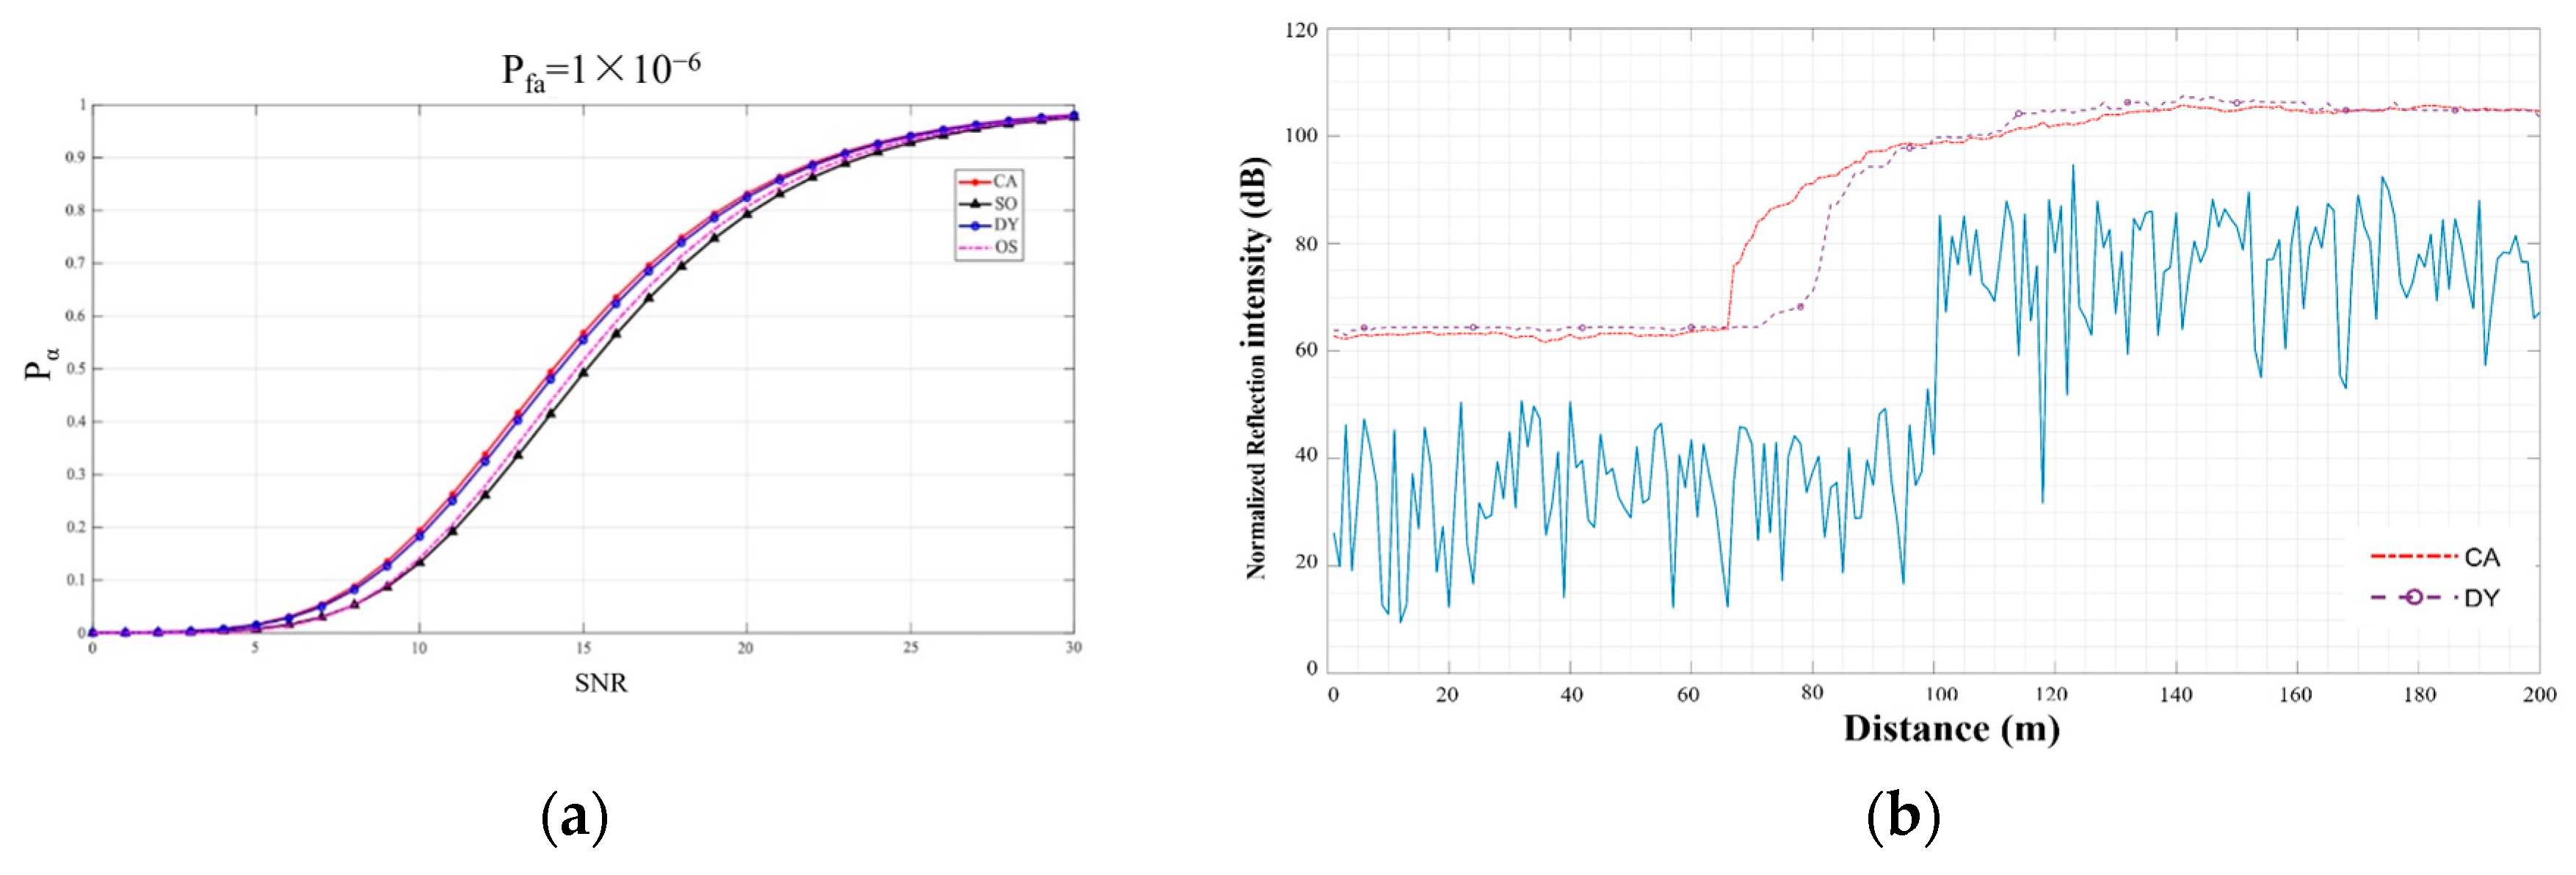
The detection performance of traditional CFAR (CA) and dynamic CFAR (DY) proposed in this paper.
According to the basic theory of dynamic CFAR mentioned earlier, the detection performance is increased in the case of complex environments with strong and weak clutter regions, which can be distinguished by the proposed method. When more point cloud information is acquired, the target can be detected more accurately.
Furthermore, we conducted SNR and threshold curve comparisons of clutter edges on different detectors based on CFAR, as shown in Figure 20. Although the detection curve of DY-CFAR is lower than that of CA-CFAR, the constant false alarm loss is within an acceptable range and is higher than the detection curves of GO-CFAR and OS-CFAR methods. It can be concluded that DY-CFAR outperforms these methods in a uniform environment, maintaining detection performance, as also demonstrated by the experimental results shown in Figure 20a. From Figure 20b, it can be seen that the transition zone of CA-CFAR at the edge of clutter is relatively long, and DY-CFAR can quickly adapt to changes in background power compared to CA-CFAR. Thus, accurately calculating the detection threshold will greatly shorten the length of the transition zone at the edge of clutter, reducing the occurrence of false alarms and missed detections in the clutter-edge environments.
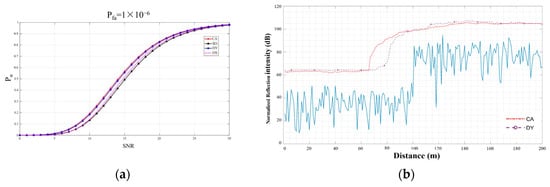
Figure 20.
Comparisons of: (a) detection performances and (b) threshold curves of clutter edge.
4.4. The Performance of Point Cloud Generation
Based on the antenna design, array design, and the proposed dynamic CFAR algorithm, the radar prototype is tested on point cloud imagery.
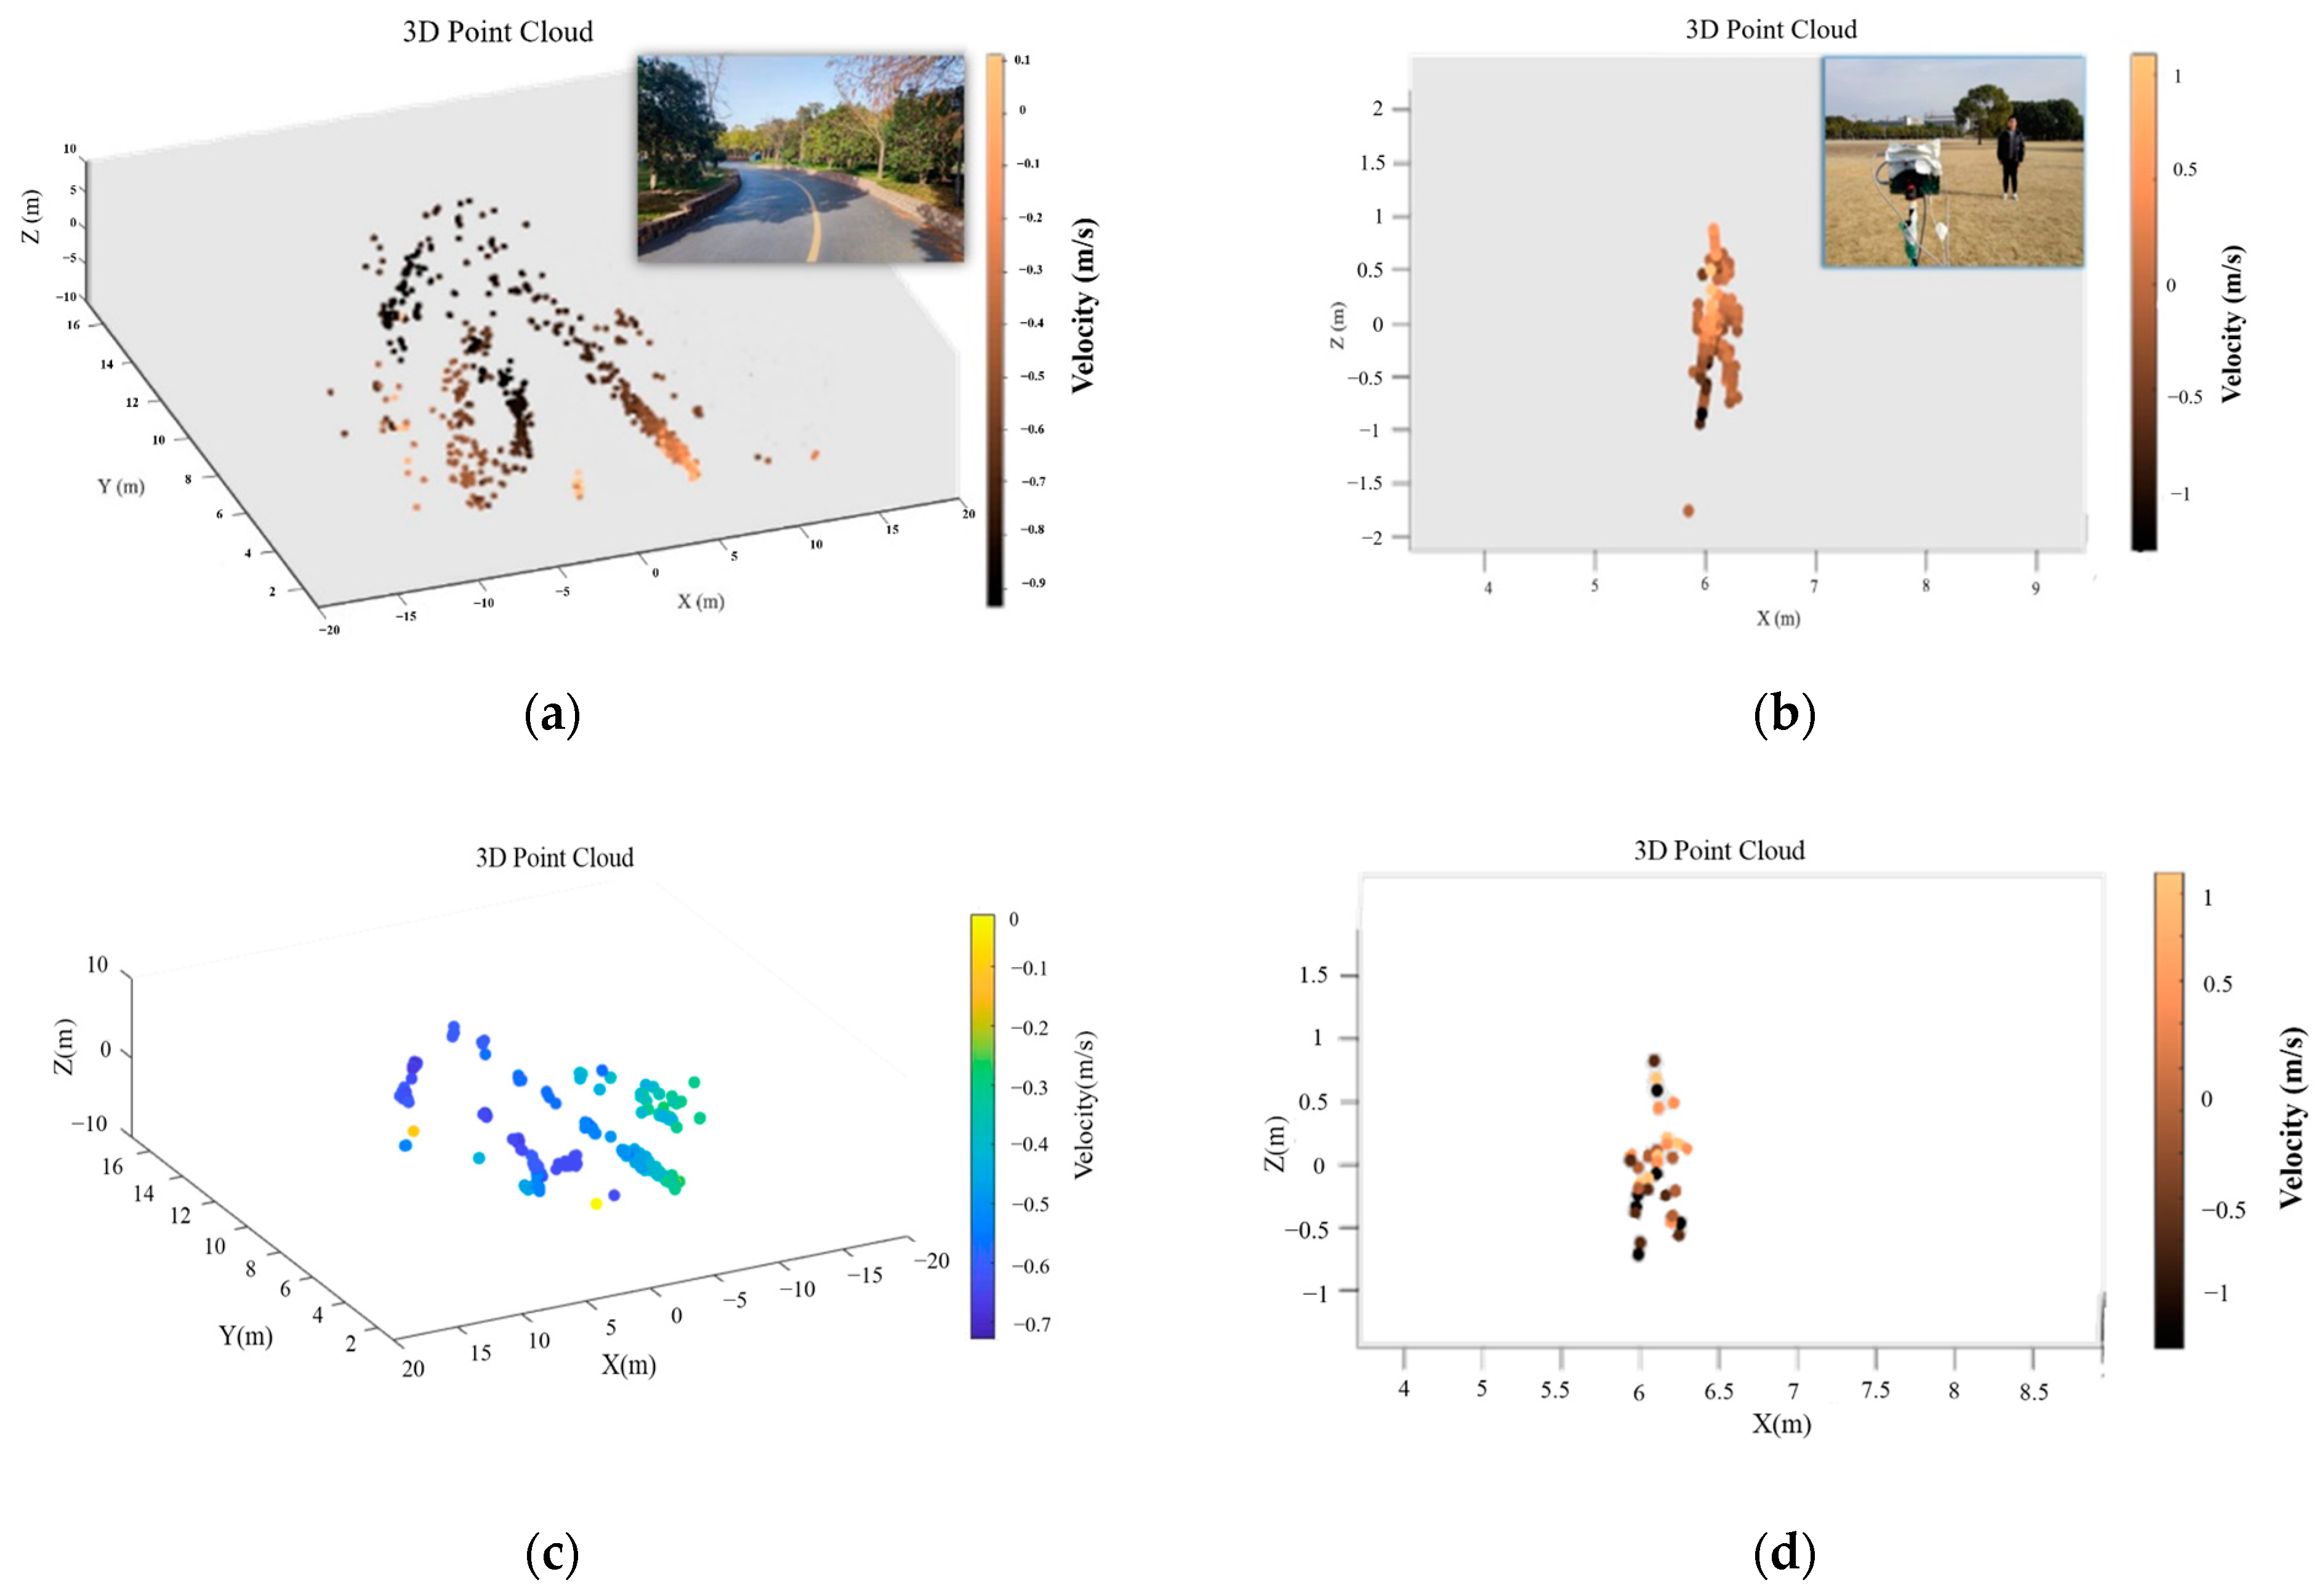
The improvement of the point cloud is verified in this section through the following two imagery cases: roadside imagery and stationary pedestrian imagery. The results of the roadside imagery experiment are shown in Figure 21a. The numbers of TR channels are the same, i.e., 192 TR channels formed by 12 TXs and 16 RXs, in the two compared methods, which are the original and the proposed for fairness. The original method does not include any optimization in the array design and uses only a linear uniform array in the horizontal direction, without the dynamic CFAR usage for comparison. The detailed analysis is listed in Test No. 1 of Table 3. The height accuracy improves by about 60% using the proposed method. The point cloud density improves by about 57%. The increased accuracy is just one aspect of the overall improvement. The distribution and contour of the target are clearer, providing high-quality images for target recognition and environmental perception.
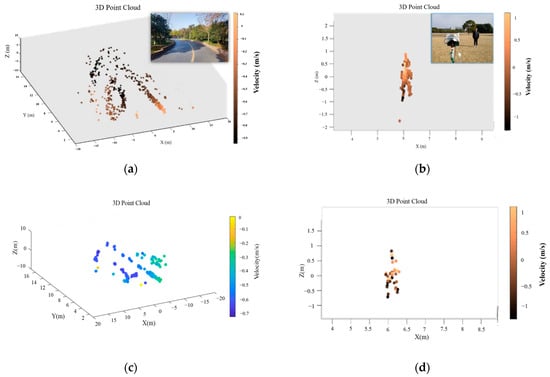
Figure 21.
(a) Road detection using dynamic CFAR; (b) pedestrian detection using dynamic CFAR; (c) road detection using traditional CFAR; (d) pedestrian detection using traditional CFAR.

Table 3.
Comparison of pedestrian imagery performance.
Another case is the stationary pedestrian imagery shown in Figure 21b. It can be seen from the actual measurement that the point cloud generated using the proposed method has significant improvements in contour accuracy, with about 21%, 64%, and 146% of point density increases in height, width, and total density, respectively, as calculated from the experiment records in Test No. 2 of Table 3. As can be seen from Figure 21, the radar point cloud density is significantly improved, and the scene details are maintained using the proposed dynamic CFAR method. This indicates the imagery quality of point clouds is enhanced, which will extend the application scope in potential scenarios such as environment mapping and target detection. Generally, the time consumption is nearly the same as that of the normal 4D imagery process using the modified dynamic CFAR, which does not affect the real-time performance.
5. Conclusions
A point cloud improvement method for high-precision 4D mmWave radar with optimized MIMO array and antenna design, together with the dynamic CFAR algorithm, is proposed in this paper. The SLL, AF, and resolution are considered in the design of the MIMO array deployment using the GA. The dynamic CFAR enables dynamic adjustment of the judgment threshold by discriminating and calculating different scanning regions. Using the FFT-based DOA algorithm, the designed radar system achieves higher resolution and generates more point clouds. To validate the method, we conducted experimental tests on different targets, such as road scenes and portraits. The results show that the improved point cloud imagery method achieves a 50% improvement in accuracy and a 57% improvement in density using the same RF channels and detection parameters. Without using prior parameters, the horizontal angular resolution can reach about one degree, which is comparable to advanced research. However, the manufacturing and physical testing have been fully implemented in this paper. Compared to similar radar systems using the same processing chains, our work can generate higher-quality point clouds and is practical over a wider range, showing reference values in the design of 4D mmWave radar imagery.
Author Contributions
Methodology, Q.W.; software, W.L.; validation, X.L. and K.L.; writing—review and editing, Q.W., H.P. and J.M. All authors have read and agreed to the published version of the manuscript.
Funding
This research received no external funding.
Data Availability Statement
The original contributions presented in the study are included in the article, further inquiries can be directed to the corresponding author.
Conflicts of Interest
The authors declare no conflicts of interest.
References
- Jiang, M.; Xu, G.; Pei, H.; Feng, Z.; Ma, S.; Zhang, H.; Hong, W. 4D High-resolution imagery of point clouds for automotive MmWave radar. IEEE Trans. Intell. Transp. Syst. 2023, 25, 998–1012. [Google Scholar] [CrossRef]
- Ciattaglia, G.; De Santis, A.; Disha, D.; Spinsante, S.; Castellini, P.; Gambi, E. Performance Evaluation of Vibrational Measurements through mmWave Automotive Radars. Remote Sens. 2020, 13, 98. [Google Scholar] [CrossRef]
- Yurduseven, O.; Fromenteze, T.; Decroze, C.; Fusco, V.F. Frequency-diverse computational automotive radar technique for debris detection. IEEE Sens. J. 2020, 20, 13167–13177. [Google Scholar] [CrossRef]
- Tebaldini, S.; Manzoni, M.; Tagliaferri, D.; Rizzi, M.; Monti-Guarnieri, A.V.; Prati, C.M.; Spagnolini, U.; Nicoli, M.; Russo, I.; Mazzucco, C. Sensing the Urban Environment by Automotive SAR Imaging: Potentials and Challenges. Remote Sens. 2022, 14, 3602. [Google Scholar] [CrossRef]
- Engels, F.; Heidenreich, P.; Wintermantel, M.; Stäcker, L.; Al Kadi, M.; Zoubir, A.M. Automotive radar signal processing: Research directions and practical challenges. IEEE J. Sel. Top. Signal Process. 2021, 15, 865–878. [Google Scholar] [CrossRef]
- Zong, M.; Zhu, Z.; Wang, H. A Simulation Method for Millimeter-wave Radar Sensing in Traffic Intersection Based on Bidirectional Analytical Ray Tracing Algorithm. IEEE Sens. J. 2023, 23, 14276–14284. [Google Scholar] [CrossRef]
- Li, X.; Wang, X.; Yang, Q.; Fu, S. Signal processing for TDM MIMO FMCW millimeter-wave radar sensors. IEEE Access 2021, 9, 167959–167971. [Google Scholar] [CrossRef]
- Jiang, M.; Xu, G.; Pei, H.; Zhang, H.; Guo, K. High-resolution automotive radar point cloud imaging and processing. In Proceedings of the 2022 Photonics & Electromagnetics Research Symposium (PIERS), Hangzhou, China, 25–29 April 2022; pp. 624–632. [Google Scholar]
- Cohen, D.; Cohen, D.; Eldar, Y.C. High resolution FDMA MIMO radar. IEEE Trans. Aerosp. Electron. Syst. 2019, 56, 2806–2822. [Google Scholar] [CrossRef]
- Zhang, B.; Xu, G.; Zhou, R.; Zhang, H.; Hong, W. Multi-channel back-projection algorithm for mmwave automotive MIMO SAR imaging with Doppler-division multiplexing. IEEE J. Sel. Top. Signal Process. 2022, 17, 445–457. [Google Scholar] [CrossRef]
- Sit, Y.L.; Li, G.; Manchala, S.; Afrasiabi, H.; Sturm, C.; Lubbert, U. BPSK-based MIMO FMCW automotive-radar concept for 3D position measurement. In Proceedings of the 2018 15th European Radar Conference (EuRAD), Madrid, Spain, 26–28 September 2018; pp. 289–292. [Google Scholar]
- Solodky, G.; Longman, O.; Villeval, S.; Bilik, I. CDMA-MIMO radar with the tansec waveform. IEEE Trans. Aerosp. Electron. Syst. 2020, 57, 76–89. [Google Scholar] [CrossRef]
- Wu, Z.; Zhang, L.; Liu, H. Generalized three-dimensional imaging algorithms for synthetic aperture radar with metamaterial apertures-based antenna. IEEE Access 2019, 7, 59716–59727. [Google Scholar] [CrossRef]
- Wei, Z.; Li, B.; Feng, T.; Tao, Y.; Zhao, C. Area-based cfar target detection for automotive millimeter-wave radar. IEEE Trans. Veh. Technol. 2022, 72, 2891–2906. [Google Scholar] [CrossRef]
- Wang, J. CFAR-based interference mitigation for FMCW automotive radar systems. IEEE Trans. Intell. Transp. Syst. 2021, 23, 12229–12238. [Google Scholar] [CrossRef]
- Yang, Z.; Zhou, H.; Tian, Y.; Zhao, J. Improved CFAR detection and direction finding on time–frequency plane with high-frequency radar. IEEE Geosci. Remote Sens. Lett. 2021, 19, 1–5. [Google Scholar] [CrossRef]
- Lu, G.; He, Z.; Zhang, S.; Huang, Y.; Zhong, Y.; Li, Z.; Han, Y. A Novel Method for Improving Point Cloud Accuracy in Automotive Radar Object Recognition. IEEE Access 2023, 11, 78538–78548. [Google Scholar] [CrossRef]
- Wen, H.; Zhang, J.; Meng, Z.; Guo, S.; Li, F.; Yang, Y. Harmonic estimation using symmetrical interpolation FFT based on triangular self-convolution window. IEEE Trans. Ind. Inf. 2014, 11, 16–26. [Google Scholar] [CrossRef]
- Odendaal, J.; Barnard, E.; Pistorius, C. Two-dimensional superresolution radar imaging using the MUSIC algorithm. IEEE Trans. Antennas Propag. 1994, 42, 1386–1391. [Google Scholar] [CrossRef]
- Roy, R.; Kailath, T. ESPRIT-estimation of signal parameters via rotational invariance techniques. IEEE Trans. Acoust. Speech Signal Process. 1989, 37, 984–995. [Google Scholar] [CrossRef]
- Chen, W.; Li, Y.; Li, S.; Zhang, F.; Wang, K. Efficient FFT based multi source DOA estimation for ULA. In Proceedings of the 2021 IEEE 6th International Conference on Signal and Image Processing (ICSIP), Nanjing, China, 22–24 October 2021; pp. 739–743. [Google Scholar]
- Patole, S.M.; Torlak, M.; Wang, D.; Ali, M. Automotive radars: A review of signal processing techniques. IEEE Signal Process Mag. 2017, 34, 22–35. [Google Scholar] [CrossRef]
- Karimian-Sichani, N.; Alaee-Kerahroodi, M.; Mysore Rama Rao, B.S.; Mehrshahi, E.; Ghorashi, S.A. Antenna Array and Waveform Design for 4-D-Imaging mmWave MIMO Radar Sensors. IEEE Trans. Aerosp. Electron. Syst. 2024, 60, 1848–1864. [Google Scholar] [CrossRef]
- Rusu, R.B.; Cousins, S. 3d is here: Point cloud library (pcl). In Proceedings of the 2011 IEEE International Conference on Robotics and Automation, Shanghai, China, 9–13 May 2011; pp. 1–4. [Google Scholar]
- Vishnubhatla, A. Automotive Radar Using awr2243 Booster Pack; International Association of Online Engineering: Wien, Austria, 2020. [Google Scholar]
- Huang, Y.; Ma, L.; Yu, X.; Zhang, H.; Li, J.; Xi, X. MIMO Antenna Array Design Based on Genetic Algorithm. In Proceedings of the 2021 IEEE 4th International Conference on Electronic Information and Communication Technology (ICEICT), Xi’an, China, 18–20 August 2021; pp. 406–409. [Google Scholar]
- Moffet, A. Minimum-redundancy linear arrays. IEEE Trans. Antennas Propag. 1968, 16, 172–175. [Google Scholar] [CrossRef]
- Lange, O.; Yang, B. Antenna geometry optimization for 2D direction-of-arrival estimation for radar imaging. In Proceedings of the 2011 International ITG Workshop on Smart Antennas, Aachen, Germany, 24–25 February 2011; pp. 1–8. [Google Scholar]
- Di Serio, A.; Hügler, P.; Roos, F.; Waldschmidt, C. 2-D MIMO radar: A method for array performance assessment and design of a planar antenna array. IEEE Trans. Antennas Propag. 2020, 68, 4604–4616. [Google Scholar] [CrossRef]
- Kwiatkowski, P.; Orth, A.; Piotrowsky, L.; Pohl, N. A 77–81 GHz FMCW MIMO Radar with Linear Virtual Array Enabling 3D Target Localization by Use of Frequency-Steered TX Antennas. In Proceedings of the 2022 19th European Radar Conference (EuRAD), Berlin, Germany, 28–30 September 2022; pp. 221–224. [Google Scholar]
- Li, Y.; Wang, Y.; Chen, H. Efficient Implementation for SBL-Based Coherent Distributed mmWave Radar Imaging. Remote Sens. 2023, 15, 1054. [Google Scholar] [CrossRef]
- Han, K.; Hong, S. High-resolution phased-subarray MIMO radar with grating lobe cancellation technique. IEEE Trans. Microw. Theory Tech. 2022, 70, 2775–2785. [Google Scholar] [CrossRef]
- Chipengo, U. High Fidelity Physics-Based Simulation of a 512-Channel 4D-Radar Sensor for Automotive Applications. IEEE Access 2023, 11, 15242–15251. [Google Scholar] [CrossRef]
- Ansys Inc. Ansys HFSS 15.0 Online Help System. 2024. Available online: http://www.mweda.com/hfss/hfss15/index.html (accessed on 20 July 2024).
Disclaimer/Publisher’s Note: The statements, opinions and data contained in all publications are solely those of the individual author(s) and contributor(s) and not of MDPI and/or the editor(s). MDPI and/or the editor(s) disclaim responsibility for any injury to people or property resulting from any ideas, methods, instructions or products referred to in the content. |
© 2024 by the authors. Licensee MDPI, Basel, Switzerland. This article is an open access article distributed under the terms and conditions of the Creative Commons Attribution (CC BY) license (https://creativecommons.org/licenses/by/4.0/).


