Abstract
Monitoring areas susceptible to desertification contributes to the strategic development of regions located in environments of extreme hydric and social vulnerability. Therefore, the objective of this study is to evaluate the process of soil degradation in the Desertification Nucleus of Cabrobó (DNC) over the past three decades using remote sensing techniques. This study used primary climatic data from TerraClimate, geospatial data of land use and land cover (LULC), and vegetation indices (SAVI and LAI) via Google Earth Engine (GEE) from Landsat 5/TM and 8/OLI satellites, and established the aridity index (AI) from 1992 to 2022. The results indicated 10 predominant LULC classes with native vegetation suppression, particularly in agriculture and urbanization. SAVI ranged from −0.84 to 0.90, with high values influenced by La Niña episodes and increased rainfall; conversely, El Niño episodes worsened the rainfall regime in the DNC region. Based on the Standardized Precipitation Index (SPI), it was possible to correlate normal and severe drought events in the DNC with years under the influence of El Niño and La Niña phases. In summary, the AI images indicated that the DNC remained semi-arid and that the transition to an arid region is a cyclical and low-frequency phenomenon, occurring in specific periods and directly influenced by El Niño and La Niña phenomena. The Mann–Kendall analysis showed no increasing trend in AI, with a Tau of −0.01 and a p-value of 0.97. During the analyzed period, there was an increase in Non-Vegetated Areas, which showed a growing trend with a Tau of 0.42 in the Mann–Kendall analysis, representing exposed soil areas. Annual meteorological conditions remained within the climatic pattern of the region, with annual averages of precipitation and actual evapotranspiration (ETa) close to 450 mm and an average temperature of 24 °C, showing changes only during El Niño and La Niña events, and did not show significant increasing or decreasing trends in the Mann–Kendall analysis.
1. Introduction
Climate change occurring on Earth is influenced by anthropogenic action and modes of climate variability, which in turn cause alterations in climate, disasters, and natural catastrophes [1,2,3]. In this context, biomes will suffer unprecedented damage due to climate changes [4,5], particularly in areas considered highly susceptible to desertification (e.g., arid and semi-arid regions), with low moisture content, high temperatures, elevated atmospheric demand, and frequent droughts [6]. Desertified areas result from the interaction between climate and land degradation. Such degradation is defined as the deterioration of land and soil cover as a consequence of anthropogenic and natural actions [7,8,9].
These soil and climate conditions can be observed in various regions of the Brazilian semi-arid region, from areas with a lesser degree of environmental deterioration to locations with advanced desertification processes. The Desertification Nucleus of Cabrobó (DNC) in Pernambuco (PE), Northeast Brazil (NEB), like most semi-arid areas, experiences limited and uneven rainfall distribution, with the majority of rainfall occurring in a few months of the year and periods of drought [10]. These factors, combined with inadequate planning of natural resource use, can intensify desertification cores [11].
Desertification has been an environmental issue in the interior of Northeast Brazil (NEB) for decades. Desertification reduces water availability, increases food insecurity, and heightens social vulnerability. Land management has been previously described as the main factor contributing to desertification susceptibility under the IPCC scenario (RCP8.5) using climate modeling, with a +19.62% increase in high susceptibility projected for 2035–2045 [12]. Additionally, intensive agricultural production has recently exacerbated desertification in the NEB, as observed through NDVI data from Landsat 5 and 8 satellites via the Google Earth Engine (GEE) platform [13]. More recently, based on the aridity index (AI) projections from the Coupled Model Intercomparison Project (specifically, CMIP6), a significant increase in semi-arid areas prone to desertification is projected by 2100 [14].
Furthermore, studies conducted in the DNC have analyzed ecological changes over the past twenty years using the Vegetation Health Index based on CHIRPS (Climate Hazards Center InfraRed Precipitation with Station data), MODIS sensor data, and MapBiomas, concluding that extreme drought events may have influenced soil degradation, with a significant increase in recent years [15]. Other studies, for instance, based on soil conditions using gneiss weathering pedogenesis (felsic rocks) [16] and hydro-meteorological conditions through Sea Surface Temperature Anomaly (SSTA) and its correlation with DNC rainfall variability, showed a reduction in precipitation in the region from positive SSTA, thereby influencing vegetation development [17].
Moreover, characterizing the degradation processes of desertified areas is crucial. This involves employing indices and technologies associated with remote sensing (RS) to identify local situations and making the region economically sustainable [18,19]. To achieve this, indices and technologies associated with remote sensing (RS) are used to identify local situations and even monitor complex processes such as carbon dioxide (CO2) exchange and the growth of any type of vegetation [20]. One of the most commonly used indices in the scientific literature is the Soil-Adjusted Vegetation Index (SAVI), effective in monitoring plant biomass and capable of constructing seasonal and temporal profiles of the vegetation of interest by incorporating the soil factor into the results [21]. The Standardized Precipitation Index (SPI) is also widely used for drought monitoring in agricultural areas, water resources, and environmental studies [15,22], and for classifying areas susceptible to desertification. The aridity index (AI), proposed by Thornthwaite [23], has undergone some modifications to adapt to the studied approaches [7,9,24]. Transitioning to Brazil’s context, the AI has facilitated the classification of semi-arid and dry subhumid zones. These classifications range from 0.20 to 0.65, categorized between moderate and high susceptibility to desertification, and a third classification was also established for surrounding areas, which although not climatically prone, share similar characteristics, such as drought and the presence of typical semi-arid vegetation [7].
In light of this, correlating climatic indices with remote sensing techniques can contribute to understanding the degradative stage of regions at risk of desertification and determining strategies capable of mitigating problems related to the degradation of potentially arable areas. Thus, this study aimed to (i) assess soil degradation processes in the DNC over the last three decades using remote sensing techniques; (ii) investigate the spatiotemporal dynamics of vegetation, precipitation, evapotranspiration, temperature, and aridity in the DNC; and (iii) identify how these factors interact over time and their influence on vegetation and local climate.
2. Materials and Methods
2.1. Characterization of the Desertification Nucleus of Cabrobó
The DNC (Figure 1) comprises five municipalities in the state of Pernambuco (PE), (i) Cabrobó, (ii) Floresta, (iii) Carnaubeira da Penha, (iv) Belém do São Francisco, and (v) Itacuruba, located in the mesoregion of São Francisco, phytogeographic region of Sertão Central, and within the geo-environmental unit of the Sertaneja depression [25]. The predominant soil class in the region is Planosols, and the vegetation is hyperxerophilous caatinga, woody, deciduous, with low to medium stature, with cacti and bromeliads found in the lower stratum [26]. The climate of the region is classified as ‘BSwh’ according to the Köppen classification, with the highest rainfall occurring between January and April, which are also the months with the highest temperatures throughout the year [27]. The region has an average annual temperature of 25 °C, average rainfall of 468 mm. year−1 (below the 642.1 mm. year−1 observed in other studies with surface data), resulting in an atmospheric demand close to 1490 mm. year−1 (Figure 2).
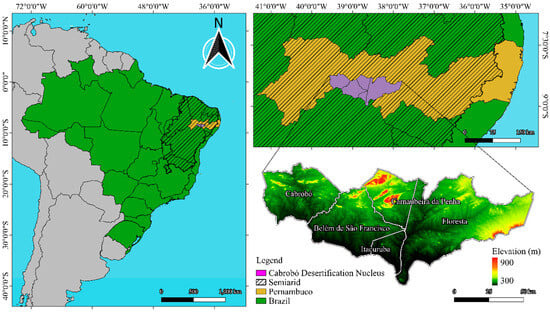
Figure 1.
Desertification Nucleus of Cabrobó in Pernambuco, Brazil, with its corresponding elevation (meters).
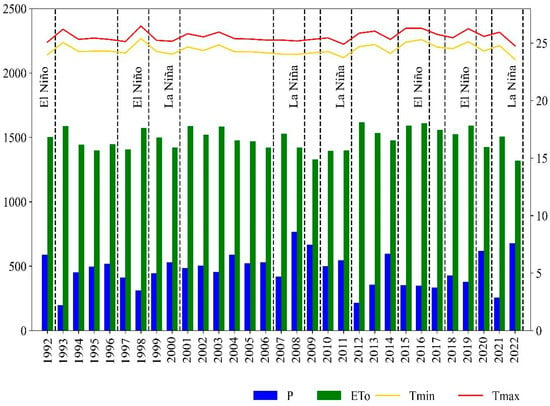
Figure 2.
Annual distribution of rainfall (P) (mm), potential evapotranspiration (ETo) (mm), minimum (Tmin) and maximum (Tmax) air temperature (°C), and occurrence of extreme El Niño and La Niña events (strong to very strong) in the DNC in Pernambuco, Brazil, from 1992 to 2022.
In Figure 2, the phases of the El Niño–Southern Oscillation (ENSO) climate variability mode are displayed based on the Oceanic Niño Index (ONI), which identifies El Niño events (warm phase), La Niña events (cold phase), and neutral phases of ENSO in the Tropical Pacific Ocean. This index has been applied in other studies for NEB [28,29,30]. According to the National Oceanic and Atmospheric Administration (NOAA) [31], for an event to be categorized as weak, moderate, strong, or very strong, the ONI must have a value equal to or greater than the threshold for at least 3 consecutive periods of 3 months of Sea Surface Temperature (SST) exceeding 0.5 °C. Thus, within the study period, the following corresponded to El Niño episodes: 1997–1998, 2015–2016, 2018–2019 (very strong); 1991–1992 (strong); 1994–1995, 2002–2003, 2009–2010 (moderate); 2004–2005, 2006–2007, 2014–2015 (weak); and La Niña: 1998–1999, 1999–2000, 2007–2008, 2010–2011, 2021–2022 (strong); 1995–1996, 2011–2012, 2020–2021 (moderate); 2000–2001, 2005–2006, 2008–2009, 2016, 2017–2018 (weak).
2.2. Geospatial Data from MapBiomas Brazil and Landsat 5/TM and 8/OLI
In this study, raster images of LULC (land use and land cover) obtained from the MapBiomas Brazil platform were used, featuring 40 specific classes offered by the platform’s collection 8.0, with LULC maps created for the period from 1992 to 2022. MapBiomas raster data were downloaded via Google Earth Engine (GEE). From this, areas of Temporary Crops, Urbanized Areas, Perennial Crops, Forest Formation, Non-Vegetated Areas, Water Bodies, Shrubland, Pasture, Mosaic of Uses, and Savanna Formation were quantified, which were the classes used in this study. The analysis also included measuring the classes in terms of area (in hectares), thus allowing for quantification and Mann–Kendall trend analysis of territorial transformations during the studied period. The MapBiomas LULC raster images are produced with images from the Landsat-5/TM and 8/OLI satellites, with a spatial resolution of 30 m.
For the calculation of the Soil-Adjusted Vegetation Index (SAVI), we obtained an average of 19 images per year, totaling an average of 570 images over 30 years. These images were processed to generate the SAVI, which details changes in vegetation [32]. The methodology adopted for creating the SAVI maps was executed using the Google Earth Engine (https://earthengine.google.com/, accessed on 8 December 2023) cloud platform. A filter in GEE was used to select images with less than 20% cloud cover, and an annual average SAVI was calculated using these 19 images for each year.
2.3. SAVI
The annual SAVI calculations were based on the multispectral bands of surface reflectance. SAVI is capable of monitoring and assessing changes in land cover and land use, including aspects of vegetation biomass, drought conditions, and agricultural productivity [33,34,35]. The uniqueness of SAVI lies in its correction and calibration capabilities, adapted to the specific characteristics and effects of the soil. In order to mitigate the effects of soil exposure, SAVI was adjusted to the most appropriate adjustment factor (L), aiming to minimize the impacts of soil moisture [36], as per Equation (1).
where L is the soil adjustment factor. NIR and RED are the Near Infrared and Red bands, respectively. The variation in the soil adjustment constant (L) ranges from 0 to 1; for areas with low vegetation density, L will be equal to 1.0; for intermediate vegetation density, L is 0.5; and for high vegetation density, L is equal to 0.25. Therefore, in this study, L = 0.25 was adopted, corresponding to the vegetation cover of the Caatinga biome [34,37,38,39].
2.4. TerraClimate Data
The climate patterns and fluctuations in the DNC region were evaluated using TerraClimate data. This dataset provides information on climatic conditions with a spatial resolution of 4 km (equivalent to 1/24°). The data were obtained from the ClimateEngine platform (http://climateengine.org/, accessed on 15 December 2023), which provides geographically referenced point information. The raster images acquired from TerraClimate for the DNC had a total of 404 pixels, with each pixel representing 4 km2, for each year. Each image’s dataset was converted from raster to point vector format using QGIS version 3.30. Subsequently, interpolation was performed using the IDW (Inverse Distance Weighted) method to fill gaps between points with estimated values, thereby producing a new raster file for the area.
For the climate analysis of the DNC, TerraClimate data for annual accumulated rainfall (P, mm), maximum and minimum annual temperatures (Tmax and Tmin, °C), and actual evapotranspiration (ETa, mm) were used. A total of 31 raster images of maximum average temperature and 31 raster images of minimum average temperature were employed. The two temperature raster images for each year, one containing the averages of the annual maximum temperatures and the other containing the averages of the annual minimum temperatures, were used to calculate the annual average temperature for each year. These raster images were processed using the “Raster Calculator” function available in QGIS version 3.30, where the raster of maximum temperatures was added to the raster of minimum temperatures and divided by 2 to obtain annual average temperature values distributed throughout the Desertification Nucleus of Cabrobó.
To analyze rainfall and drought patterns in the DNC, the Standardized Precipitation Index (SPI) was employed. The SPI rasters were obtained through TerraClimate, which provides pre-calculated SPI raster files ready for use. The SPI standardizes rainfall data for a specific region and period, enabling comparisons between locations and times, followed by normalization of seasonal variations [40]. The SPI indicates whether a period is wet (positive values) or dry (negative values) compared to normal, according to the classification presented in Table 1.

Table 1.
SPI categorization.
The calculation of SPI employs only rainfall values [28], and the formulation of SPI is based on the Gamma Probability Density Function (PDF):
where α is the shape parameter (α > 0); β is the scale parameter (β > 0), which is determined using the maximum likelihood method; x is the amount of rainfall that can vary according to α and β; Γ(α) is the gamma function. The assigned values are normalized and transformed into a normal distribution (i.e., mean zero and variance one) [42].
2.5. Aridity Index (AI)
The AI assesses the susceptibility of a region to desertification [6]. The AI is relevant in arid and semi-arid areas and provides specific information about the climatology of a region, as highlighted by Santos et al. [7]. The calculation of AI is based on precipitation (P) relative to reference evapotranspiration (ETo) to determine the degree of aridity of an area:
The annual accumulated values of P and ETo were obtained directly from the ClimateEngine platform, with the files subjected to interpolation procedures and subsequently processed using the “Raster Calculator” available in QGIS version 3.30, in order to obtain the AI for the area. The precipitation raster was divided by the ETo raster in the QGIS raster calculator, resulting in the generation of AI.
The aridity index (AI) is an established method endorsed by the World Meteorological Organization (WMO) as it uses data from meteorological stations to assess susceptibility to desertification. This method is recommended for regions with low data collection density, as indicated in the WMO Bulletin [43].
The AI consists of five categories, (i) hyperarid, (ii) arid, (iii) semi-arid, (iv) dry subhumid, and v) humid subhumid, as proposed by the United Nations Convention to Combat Desertification (UNCCD) [44] (Table 2).

Table 2.
Climatic classification and desertification susceptibility levels according to AI.
2.6. Statistical Analysis
For validation of the TerraClimate data, the following metrics were used: coefficient of determination (R2), Pearson correlation coefficient (r), and the root mean square error (RMSE). The rainfall information originated from the meteorological stations of the National Institute of Meteorology-INMET, Cabrobó (8°30′14″S, 39°18′55″W, 342.74 m above sea level) and Floresta (8°35′56″S, 38°35′03″W, 327.42 m above sea level). The correlation graphs were generated using data from only two pixels over the years. These pixels correspond to the locations of the meteorological stations. All available monthly data within the study period from the meteorological stations were utilized and correlated with the corresponding pixels for the same months.
The raster data of SAVI, precipitation, ETa, temperature, SPI, and AI were extracted and stored in XLSX format using QGIS software version 3.30. Subsequently, these data were organized into an Excel spreadsheet to facilitate their manipulation and analysis. Later, boxplot graphs were created using Python programming to visualize the distribution of the mentioned variables. For the boxplot graphs of the climate variables, all the pixels from the raster image of the area were used, totaling 404 pixels of 4 km for each climate variable.
We computed the annual average of the climatic variables, SAVI, and LULC classes. This average is calculated considering the data from all pixels of the raster images. We had 31 raster images, one for each year, and each resulted in an annual average. The Mann–Kendall statistical analysis was performed using these annual averages.
3. Results and Discussion
3.1. Geospatial Data from MapBiomas Brazil
For the DNC, 10 predominant LULC classes were observed via MapBiomas (Figure 3): (1) Temporary Crops; (2) Urbanized Area; (3) Perennial Crops; (4) Forest Formation; (5) Non-Vegetated Areas; (6) Water Bodies; (7) Shrubland; (8) Pasture; (9) Mosaic of Uses; and (10) Savanna Formation. The vegetative formations and Water Bodies here can be verified by the occurrence of the classes “Forest Formation”, “Savanna Formation”, and “Water Bodies”, describing the predominant vegetation conditions of hyperxerophytic caatinga, with four of the five municipalities being influenced by the São Francisco River [45]. The DNC areas have been modified by anthropic actions, notably agriculture and urbanization, which have increased significantly, described by the classes of “Temporary Crops”, “Perennial Crops”, “Pasture”, and “Mosaic of Uses”, as seen similarly in other studies [46].
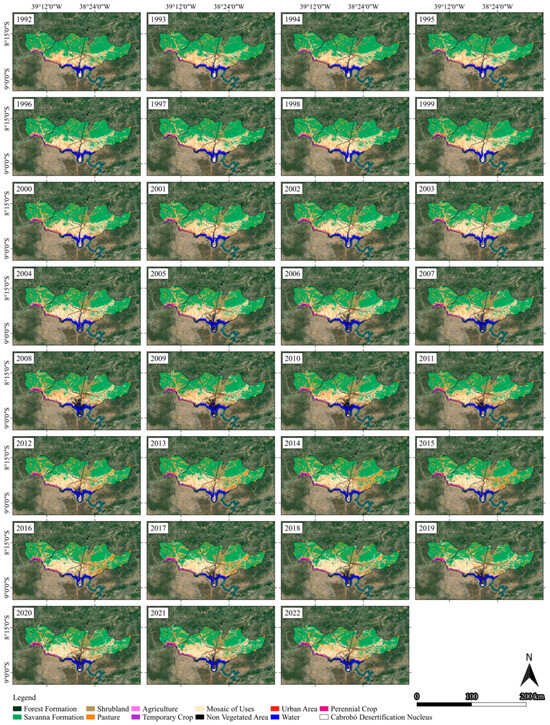
Figure 3.
Spatial–temporal distribution of LULC classes in the DNC, Pernambuco, Brazil, from 1992 to 2022.
The areas of Forest Formation, Pasture, and other forms of vegetation showed significant changes according to the Mann–Kendall statistical analysis. These changes are related to deforestation, reforestation, agricultural practices, and climate change [47,48]. The Savanna Formation areas exhibited a significant decreasing trend, with a Tau of −0.81. This class includes the Caatinga biome, which is predominant in the region, highlighting a reduction in native vegetation. Temporary crops showed an increase between 1992 and 2022, and Perennial Crops also grew over the years, with Tau values of 0.64 and 0.99, respectively. The mosaic of land use increased its area by 53,567 hectares, a significant increase according to the Mann–Kendall statistical analysis. The sum of the classes “Temporary crops”, “Perennial crops”, and “Mosaic of land use” represented an area of 169,177 hectares in 1992, increasing to 232,686 hectares in 2022, which corresponds to approximately 20% and 27%, respectively, of the total area of 866,863 hectares in the DNC. This growth in Temporary Crops, Perennial Crops, and land use mosaic classes suggests a significant shift in the agricultural landscape over the decades. There was a steady increase in Urbanized Areas between 1992 and 2022, reflecting the ongoing process of urbanization. Although there was an increase in Forest Formation between 1992 and 2001, there was a decrease between 2002 and 2015. According to the Mann–Kendall statistical analysis, there is a decreasing trend in forests, although small. Non-Vegetated Areas showed a significant increasing trend according to the Mann–Kendall statistical analysis, with a Tau of 0.42 (Figure 4).
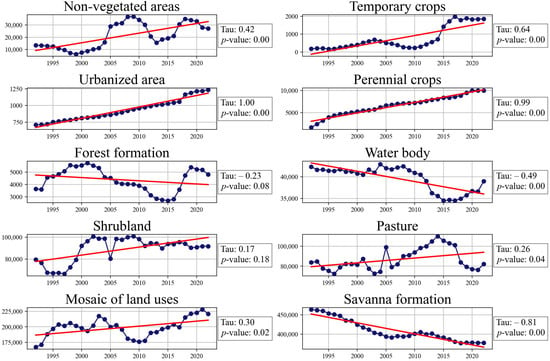
Figure 4.
Trend of land use and land cover (LULC) classes according to the Mann–Kendall statistical analysis for the DNC (1992–2022).
The Shrubland class shows a slight growth trend; this class represents shrub vegetation with sparse grass cover and more exposed soil. The “Non-Vegetated Area” and “Shrubland” classes represented 11% of the total area in 1992 and increased to 14% in 2022. Even though some classes are small compared to the total area of 866,863 hectares, there is a significant trend of growth or decrease according to the Mann–Kendall analysis. These trends should be considered for future planning as they could become a more significant issue in the future.
Although classified as non-forest vegetation by MapBiomas, the vegetation categorized as “Shrubland” exhibits a lower degree of soil cover. Photovisual analysis identified that “Shrubland” areas appeared in locations previously occupied by agricultural activities, indicating a loss of soil cover. This class, along with the significant increase in Non-Vegetated Areas, can be adopted as an indicator of deterioration in the DNC. Previously, Sampaio et al. [49] stated that, in such cases, there was a limitation on plant growth, with reduced establishment of many tall species and a predominance of herbaceous vegetation in the “Shrubland” class. These areas are often used for animal grazing, with excessive stocking rates degrading the soil to the point of leaving it bare and without a seed bank, thus preventing natural recovery.
In Figure 5, besides indicating soil cover loss, there is evidence of potential water and wind erosion in a watershed tributary to the São Francisco River [50]. Perez-Marin et al. [26] evaluated the conditions of vegetation and soil degradation, followed by the reduction in their productive capacity, which were observed through their varied formations, such as point, linear, and areolar patterns, as well as in other specific zones within the DNC. In these environments, erosion processes involve surface horizon abrasion and the formation of moderately deep gullies, especially in colluvial accumulations at the foot of hills and river terraces, and where small-scale mass movements occur, aspects that are not readily observable in the aerial images evaluated here.
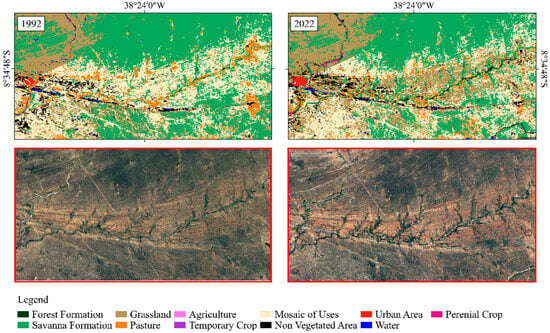
Figure 5.
Indicators of degradation from abrupt changes in LULC between 1992 and 2022, in specific areas of the DNC, Pernambuco, Brazil.
3.2. SAVI
The SAVI values ranged from −0.84 to 0.90 (Figure 6). In 2011 and 2022, high values occurred in the studied area, due to La Niña events that took place in those years, characterized by higher rainfall regimes. The years 2002, 2010, and 2014 were marked by El Niño events, categorized as weak to moderate, according to ONI [31], and showed high SAVI values. This can be attributed to the conditions resulting from the previous years, again La Niña years, except for 2013, considered normal. The influence of these climatic events extended to the following years, reflecting on vegetation. In the years 1994, 1995, 1997, 1998, 2004, 2005, 2015, and 2016, lower SAVI values were recorded. These results are supported by the climatic events that occurred during these periods, being years of very strong, strong, and moderate El Niño, characterized by lower precipitation and higher temperatures [28,29,30,51]. Such conditions had negative effects on vegetation.
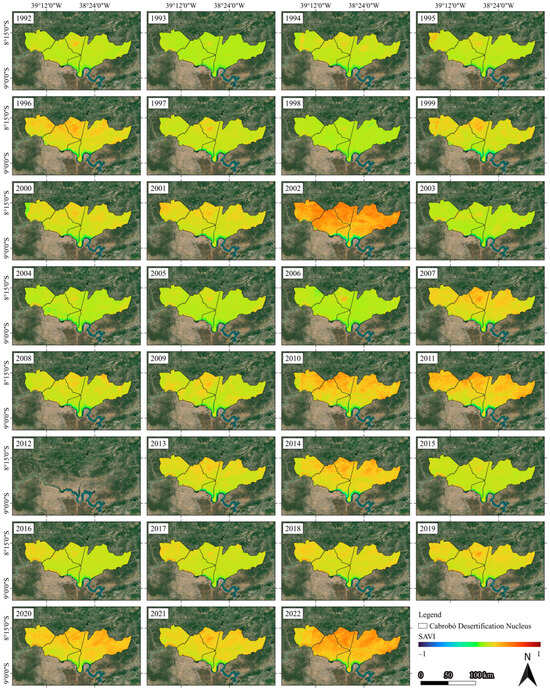
Figure 6.
Temporal and spatial variation in SAVI, from 1992 to 2022, in the DNC, Pernambuco, Brazil.
Based on the SAVI, one can infer about the Leaf Area Index (LAI), as LAI follows a logarithmic function based on SAVI, as proposed by Allen et al. [52]. Based on the maximum SAVI values, we assessed the variability in the maximum LAI over the years. Similar to SAVI, LAI showed considerable variations from year to year, especially in the years 1992, 2002, 2004, 2014, 2018, and 2021. From 2018 to 2022, SAVI indicated that LAI has remained in the range of 2.72 to 4.44, characterizing sparse vegetation [53]. This was consistent with the rainfall data in these years, except for 2021, which had lower rainfall. However, even with this condition, 2021 could be indicated as the year with the highest LAI among the recent years of the evaluated period, which may be justified by the heavy rains in 2020, causing an increase in vegetation growth and, consequently, a higher LAI. Zhen et al. [53] studied LAI in an area of dense vegetation and found LAI values above four, in contrast to Shao et al. [54] who studied corn crops and found LAI values similar to those found in this study. Based on this, the predominant vegetation in the region is not dense, which is consistent with the Brazilian semi-arid region.
Another aspect concerns the severe drought that affected the entire NEB region starting in 2012, as studies on the impacts of this drought persisted in the subsequent years [29,30,51,55]. Based on the findings of this study and others cited in the scientific literature [56,57], it is possible to observe the effects of this drought period until mid-2017.
3.3. Data from Orbital Sensors (TerraClimate)
3.3.1. Validation of TerraClimate Data
The precipitation, reference evapotranspiration, and mean temperature data were validated to create thematic maps of the primary values and secondary indices (SPI, ETa, and AI) (Figure 7).
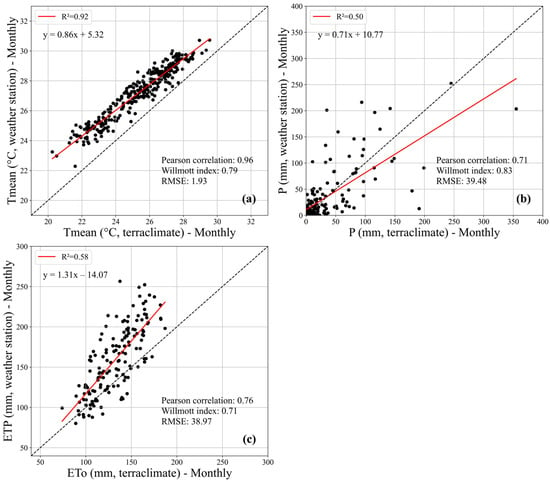
Figure 7.
Correlation between monthly observed data from surface stations in the municipalities of Cabrobó and Floresta, Pernambuco, and data from the orbital sensor TerraClimate for (a) mean air temperature, (b) precipitation, and (c) reference evapotranspiration values. The monthly data measured by the weather station were correlated with the pixel data from the same location as the weather station.
The precipitation data provided by the TerraClimate model overestimated the values from the INMET meteorological stations, showing a coefficient of determination of R2 = 0.50, a value close to that found by Filgueiras et al. [58], in a study comparing and calibrating climatological variables from TerraClimate over the Brazilian territory, where an R2 of 0.53 was found for the precipitation variable. In this study, as well as in the one carried out by Filgueiras et al. [58], a greater density of points near zero was observed for the precipitation variable graph, indicating a higher number of days without rainfall events. Reference evapotranspiration data showed better correlation with potential evapotranspiration obtained at the stations, with R2 = 0.58, where reference evapotranspiration was lower than potential evapotranspiration. Regarding mean temperature, the correlation was strong and positive (Pearson coefficient (r) = 0.96), with values similar to those found in the stations.
It is important to highlight that automatic meteorological stations collect hourly data (INMET) and generate monthly data from them, whereas TerraClimate only provides monthly data. TerraClimate products are based on resampling data obtained through dynamic downscaling, incorporating information from various databases. These products are used in numerous studies for calibration, comparison, and validation [39,58,59,60].
3.3.2. Space–Time Analysis of Precipitation for the DNC
Figure 8 displays the spatiotemporal distribution of annual rainfall accumulation within the DNC. Spatially, precipitation values tended to be higher for the higher-altitude region and at lower latitudes within the DNC, such as in the municipality of Carnaubeira da Penha, which, as seen in Figure 1, is where a large part of the higher-altitude zones are concentrated and is located in the upper region of the map. For the Brazilian semi-arid region, some authors emphasize the influence of different atmospheric systems on the spatial distribution of rainfall. In this sense, it describes what occurs in the case of the DNC, the displacement of air masses from adjacent regions to the north triggering rainfall in the upper part, which, when encountering orographic impediments, tends to reduce intensity in the lower part of the DNC. In this regard, Moura et al. [61] highlighted the action of three main systems in the NEB: the Intertropical Convergence Zone (ITCZ), responsible for precipitation in the central–northern region between February and May, due to its action over the Atlantic Ocean; Frontal Systems or Cold Fronts (CFs), primarily linked to the central–southern region of the Northeast and causing rainfall from November to January; and finally, the Upper-Level Cyclonic Vortices (ULCVs), which occur more frequently in January.
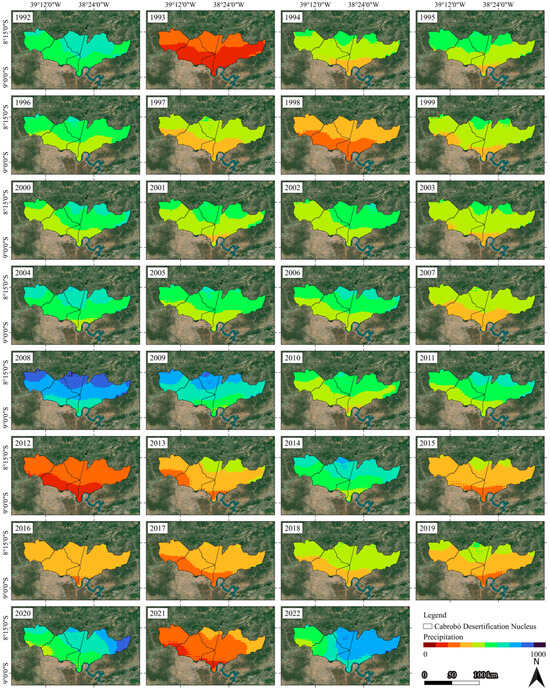
Figure 8.
Spatial–temporal variation in annual precipitation accumulation (mm), from 1992 to 2022, in the DNC, Pernambuco, Brazil.
The temporal variations assessed between 1992 and 2022 demonstrate that there were 16 rainy years (Figure 9), those that exceeded the climatological average of the region (468 mm), namely 1992 (589.11 mm), 1995 (495.3 mm), 1996 (518.85 mm), 2000 (528.92 mm), 2001 (484.62 mm), 2002 (505.12 mm), 2004 (588.13 mm), 2005 (523.06 mm), 2006 (531.48 mm), 2008 (765.91 mm), 2009 (665.18 mm), 2010 (499.78 mm), 2011 (546.65 mm), 2014 (597.54 mm), 2020 (617.22 mm), and 2022 (677.48 mm) (Figure 2). Most of the mentioned years correspond to ENSO (El Niño and La Niña) events, specifically La Niña episodes, which in turn are responsible for a considerable increase in rainfall in the Brazilian Northeast region [51,56].
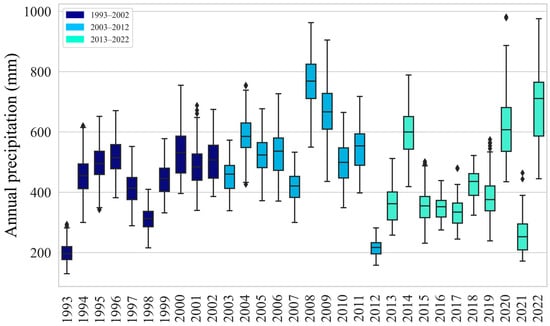
Figure 9.
Variation in annual precipitation over three decades in the DNC, Pernambuco. Each box represents the data dispersion, where the central line indicates the median. The boxes cover the interquartile range (IQR) of the data, while the lines outside the boxes show the extreme values.
From 2012 onwards, with the exception of 2014, 2020, and 2022, there was a significant decrease in rainfall, dropping below 400 mm annually (Figure 9). Low precipitation rates in most years are common in semi-arid regions worldwide, but their spatial variation within the DNC contributes to reduced soil moisture in less incident areas, allowing for less vegetation development, as evidenced by the reduction in actual evapotranspiration in these areas. Consequently, the recurrent occurrence of drier periods since 2012 contributes to the intensification of degradation processes in the DNC, as seen through land use and cover, where these areas exhibit a higher degree of Shrubland and Non-Vegetated Areas.
3.3.3. SPI
In the DNC, Pernambuco, the relationship between SPI and years of extreme events, especially El Niño, is observed, as it is known that drought intensifies in the Northeast due to this event [17,25]. The years when El Niño occurred in the strong or very strong categories were 1992, 1997, 1998, 2015, 2016, 2018, and 2019 (Figure 2). As shown in Figure 10, which presents the spatiotemporal variation in SPI from 1992 to 2022, according to the SPI, there were events from normal to severely dry, except for 1992, which was moderately wet. However, severe drought is observed in the following year, indicating remnants of the 1992 event and an intensification of drought in the subsequent year. The years with La Niña in the strong category were 1998, 1999, 2000, 2007, 2008, 2010, 2011, 2021, and 2022 (Figure 2), and the SPI in these years ranged from normal to severely wet conditions, with the exceptions of 1998, when a strong El Niño also occurred, and 2021.
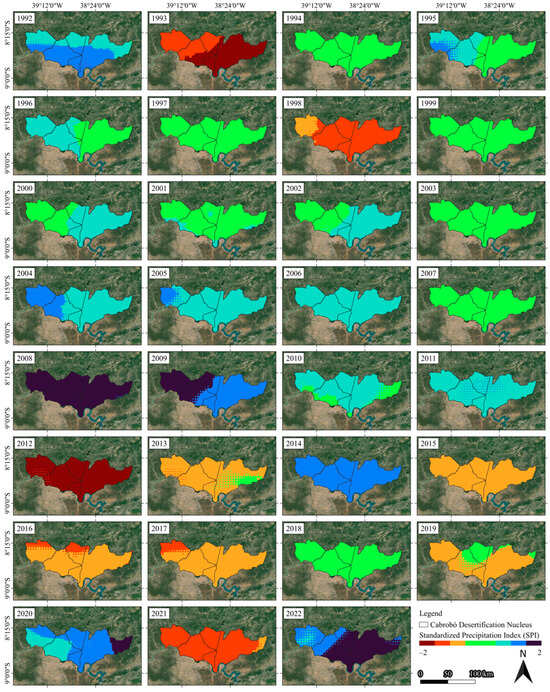
Figure 10.
Temporal–spatial variation in the Standardized Precipitation Index (SPI), from 1992 to 2022, in the DNC, Pernambuco, Brazil.
When we divide the data into three decades and compare them, a decrease in the SPI is observed in the last decade (Figure 11). There is a trend of SPI below −0.5 in the last decade, which occurred only three times in the first two evaluated decades. Droughts were highlighted in the years 2012, 2013, 2017, and 2021, according to Brito et al. [62], in a study where they used the 12-month SPI and the Vegetation Health Index (VHI) to assess drought events that occurred between 1981 and 2016, with emphasis on the drought from 2011 to 2016, in the Northeast semi-arid region; the results show that the most severe and prolonged drought occurred in this period from 2011 to 2016, corroborating with the data obtained here.
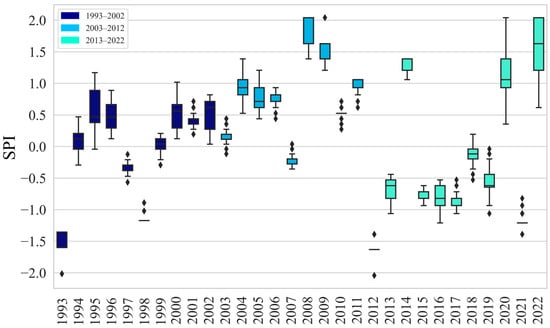
Figure 11.
Variation in SPI over three decades in the DNC, Pernambuco. Each box represents the dispersion of the data, where the central line indicates the median. The boxes cover the interquartile range (IQR) of the data, while the lines outside the boxes show the extreme values.
3.3.4. Actual Evapotranspiration (ETa)
Evapotranspiration consists of the sum of water evaporation from the soil with plant transpiration. In this regard, ETa exhibits a pattern that can be observed across all years, where more intense evapotranspiration is noted in the upper parts of the maps (Figure 12). Analysis of the land use and land cover (LULC) maps (Figure 3) revealed that areas with higher evapotranspiration corresponded to denser vegetation compared to the lower parts, which showed sparser vegetation and exposed soil. This observation is supported by the Soil-Adjusted Vegetation Index (SAVI), which also shows higher values in this region of the map, indicating vegetation with a larger leaf area, as demonstrated earlier.
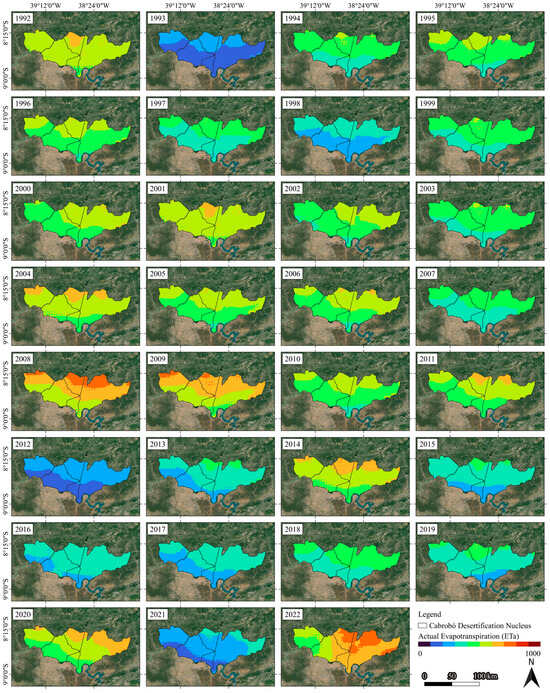
Figure 12.
Spatial–temporal variation in ETa (mm), from 1992 to 2022, in the DNC, Pernambuco, Brazil.
Another relevant factor, recurring in the other discussed variables, is the influence of extreme weather events on ETa. In the years 1993, 1998, 2012, 2013, 2015, 2016, 2017, and 2021, evapotranspiration was reduced (Figure 13), and in these years, there was less precipitation (Figure 9). The decrease in precipitation in the years 1993 and 1998 is possibly related to the occurrence of strong El Niño events either in that specific year or in the preceding year. With this reduction in precipitation, there was lower soil moisture, resulting in less water storage and consequently lower evapotranspiration, as less water was evaporated from the soil or transpired by the vegetation.
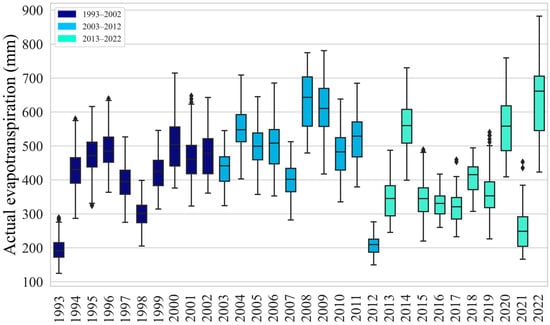
Figure 13.
Variation in annual actual evapotranspiration over three decades in the DNC, Pernambuco. Each box represents the data dispersion, where the central line indicates the median. The boxes cover the interquartile range (IQR) of the data, while the lines outside the boxes show the extreme values.
3.3.5. Average Air Temperature
It is worth noting that there were no significant variations in temperature during the study period, with an average of 25 °C. This average is consistent with the Brazilian semi-arid region and aligns with values observed by other authors [45]. Based on the presented maps (Figure 14), we can infer a relationship between altitude and temperature, with lower temperatures highlighted in higher-altitude areas. Silva et al. [45], when examining air temperature trends in the NEB region, observed this pattern, identifying an inverse relationship between altitude and air temperature.
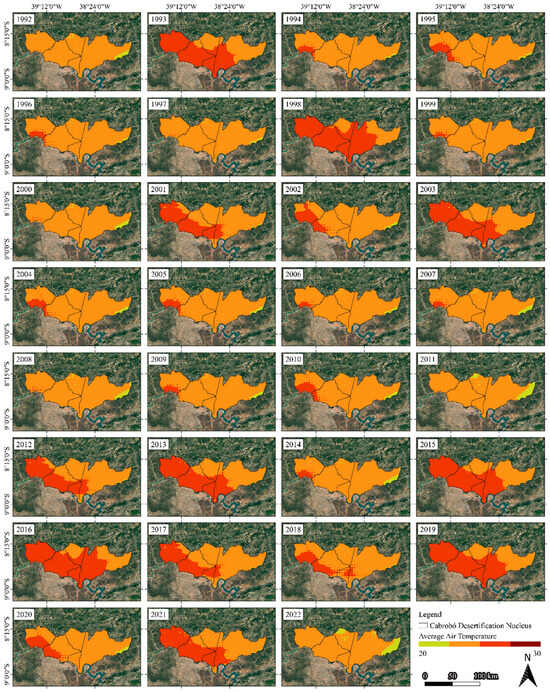
Figure 14.
Space–time variation in mean temperature (°C), from 1992 to 2022, in the DNC, Pernambuco, Brazil.
In recent years, there has been a slight increase in temperature, which has remained slightly higher since 2012, except for 2022, when there was a decrease (Figure 15). However, it is important to consider that this decline occurred in a year of strong La Niña, which may have influenced the previously established pattern. This increase in global temperature is a recurrent phenomenon in research and may be associated with various factors, such as climate change or influences on a more localized scale. This temperature rise in recent years has already been identified by other studies conducted in the NEB region [63,64,65,66].
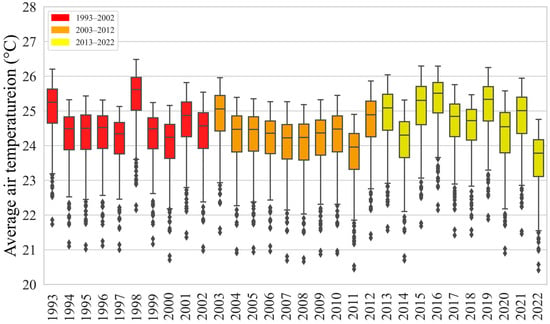
Figure 15.
Variation in annual air temperature (°C) over three decades in the DNC, Pernambuco. Each box represents the dispersion of data, where the central line indicates the median. The boxes cover the interquartile range (IQR) of the data, while the lines outside the boxes show the extreme values.
3.3.6. Aridity Index (AI)
The results of AI are depicted in Figure 16, which exposes not only aridity but also the susceptibility of a particular region to desertification. The spatial patterns of AI in the years 1993, 1998, 2012, 2013, 2015, 2016, 2017, 2019, and 2021 indicate a prevalence of arid conditions and very high susceptibility to desertification. In 1993 and 2012, the DNC demonstrated this climatic condition across 100% of its territory. The influence of El Niño and La Niña was present in some years of this study. El Niño occurred in 1992, 1997, 1998, 2015, 2016, 2018, and 2016, influencing the reduction in rainfall and, consequently, the increase in AI and susceptibility to desertification [67,68]. In the other years, when the arid classification did not cover the entire area, the southern and western regions of the nucleus were always under such extreme conditions.
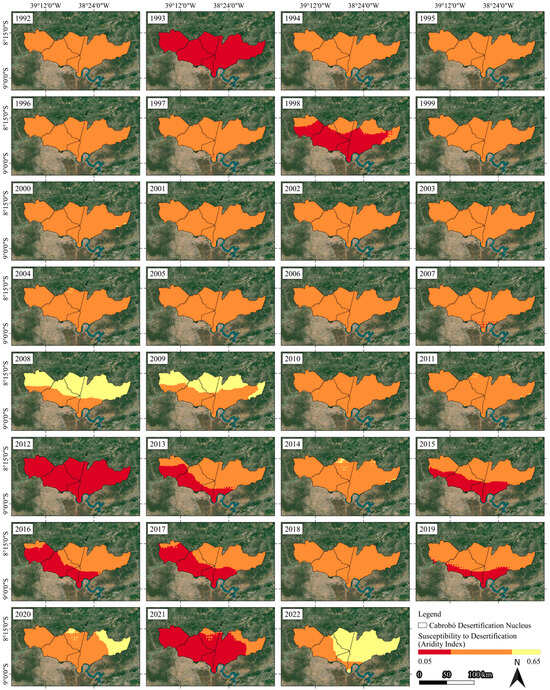
Figure 16.
Temporal and spatial variation of the aridity index (AI), from 1992 to 2022, in the DNC, Pernambuco, Brazil.
The years 2008, 2009, 2020, and 2022 presented mainly moderate susceptibility areas, particularly in the northern and eastern regions. It is worth noting that at no point during the evaluated years were all three conditions present simultaneously. The most common behavior involves two climate classifications, with the northern region consistently experiencing higher susceptibility conditions. Moraes et al. [14], forecasting future trends for AI in Brazil, observed a tendency for increased desertification susceptibility in the Northeast region of Brazil in the coming decades. They noted that the emergence of areas where the desertification process is accelerated is influenced by climatic characteristics, soil conditions, activities such as extensive livestock farming, unsustainable agricultural practices, mining, and deforestation.
Overall, the DNC was classified as semi-arid and highly susceptible to desertification (0.21 < AI < 0.50). Between 2021 and 2022, according to the AI, the change was abrupt, with a very extreme situation in most of the region (0.05 to 0.20) to a more moderate one (0.51 < AI < 0.65) in 2022 (Figure 17). Spinoni et al. [69] reported the transition of areas in the state of Pernambuco from a subhumid dry climate to semi-arid, increasing its vulnerability to desertification. Climatologically, susceptibility to desertification is not considered a progressive phenomenon, as years with extreme climatic events do not occur in long uninterrupted periods.
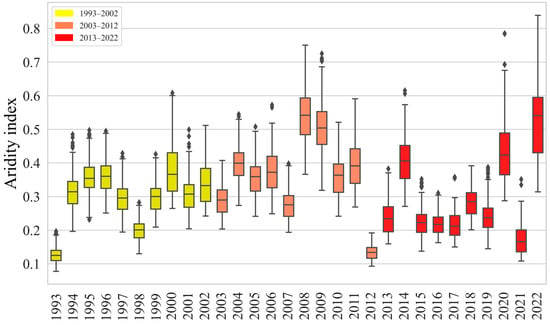
Figure 17.
Variation in aridity index over three decades in the DNC, Pernambuco. Each box represents the data dispersion, where the central line indicates the median. The boxes encompass the interquartile range (IQR) of the data, while the lines outside the boxes show the extreme values.
The spatiotemporal variability in the AI seen in Figure 16 is directly associated with the climatic variability found in the central region of Pernambuco, mainly due to the elevated temperature and evapotranspiration, as well as irregular precipitation events throughout the year [70,71]. The correlation between precipitation and AI showed that in years where annual accumulated rainfall exceeded 600 mm, there was no very high susceptibility to desertification (Figure 8 and Figure 16). The increase in drought events along with high temperatures is affecting regions worldwide, with changes in classifications from semi-arid to arid areas [68]. These changes not only affect meteorological classification but also cause damage to the soil, promoting degradation through the deterioration of vegetation cover, and forest fires, resulting from extreme heatwaves in regions with low humidity [5,72,73].
The Mann–Kendall trend analysis for the variables annual precipitation, ETa, mean temperature, SPI, and AI corroborates the discussions within this study about the climatic conditions in the DNC (Figure 18). There is no significant trend of increase or decrease in the averages of the evaluated climatic conditions; changes in these conditions occur due to the El Niño and La Niña phenomena, which are cyclical and recurring events [70,71]. The SAVI is the only variable that shows a significant upward trend, again reflecting the influence of El Niño and La Niña events. For instance, in 2022, which was a year with higher rainfall, the SAVI responded positively to this condition.
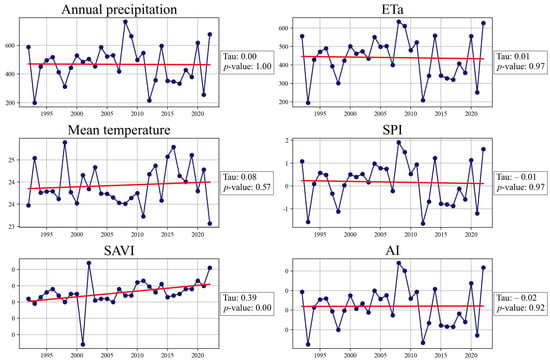
Figure 18.
Trends of the variables annual precipitation, ETa, mean temperature, SPI, SAVI, and AI, according to the Mann–Kendall statistical analysis for the DNC (1992–2022).
4. Conclusions
The assessments of land use and land cover changes in the Desertification Nucleus of Cabrobó (DNC) over the 30 years evaluated highlight significant trends of change in land use and land cover (LULC), with the replacement of natural formations by areas al-located for agriculture and, subsequently, by unvegetated areas or areas with limited vegetation development, such as shrublands. Continuous monitoring of LULC changes is crucial, given the significant trend of growth in these areas identified in this study. This monitoring is essential to ensure that these transformations do not escalate into more serious issues in the future.
The Soil-Adjusted Vegetation Index (SAVI) varies over the years and can demonstrate the influence of precipitation and climatic events on vegetation, especially changes in land use and land cover. Years with higher rainfall also showed higher SAVI. Future research may attempt to explore other vegetation indices with the aim of assessing vegetation behavior at different times of the year.
In terms of precipitation, rainfall followed a climatological pattern typical of the semi-arid region, and due to extreme ENSO events, droughts intensified from 2012 onwards, as demonstrated by the Standardized Precipitation Index (SPI), which may have contributed to the desertification process in recent decades.
Evapotranspiration in the DNC is influenced by soil moisture, with years of higher precipitation values resulting in higher ETa. Additionally, the denser and more developed vegetation in the northern part of the DNC map contributes to increased ETa values.
The average air temperature in the DNC showed no temporal variability, maintaining typical patterns of the semi-arid region.
The aridity index classified the Desertification Nucleus of Cabrobó as semi-arid. Over the 30 evaluated years, the spatiotemporal variability of the climatic classification remained normalized for most of the period, indicating that the desertification core is not becoming arid but rather maintaining semi-arid characteristics.
Author Contributions
Conceptualization, J.L.P.d.S., F.B.d.S.J., J.P.A.d.S.S., A.C.d.S.A., J.L.B.d.S. and M.V.d.S.; methodology, J.L.P.d.S., F.B.d.S.J., J.P.A.d.S.S., T.G.F.d.S., J.F.d.O.-J. and G.d.N.A.J.; software, J.L.P.d.S., F.B.d.S.J., J.P.A.d.S.S. and M.V.d.S.; validation, J.L.P.d.S., F.B.d.S.J. and J.P.A.d.S.S.; formal analysis, J.L.P.d.S., F.B.d.S.J., J.P.A.d.S.S., C.H.S. and M.V.d.S.; investigation, J.L.P.d.S., F.B.d.S.J. and J.P.A.d.S.S.; resources, M.V.d.S.; data curation, J.F.d.O.-J.; writing—original draft preparation, J.L.P.d.S., F.B.d.S.J., J.P.A.d.S.S., A.C.d.S.A., T.G.F.d.S., C.H.S., J.L.B.d.S., J.L.M.P.d.L. and M.V.d.S.; writing—review and editing, J.L.P.d.S., F.B.d.S.J., J.P.A.d.S.S., A.C.d.S.A., T.G.F.d.S., J.F.d.O.-J., G.d.N.A.J., C.H.S., J.L.B.d.S., J.L.M.P.d.L. and M.V.d.S.; visualization, J.L.P.d.S., F.B.d.S.J., J.P.A.d.S.S., A.C.d.S.A., G.d.N.A.J. and M.V.d.S.; supervision, A.C.d.S.A., T.G.F.d.S., J.F.d.O.-J., J.L.M.P.d.L. and M.V.d.S.; project administration, A.C.d.S.A., J.L.B.d.S. and M.V.d.S.; funding acquisition, J.L.M.P.d.L. and M.V.d.S. All authors have read and agreed to the published version of the manuscript.
Funding
This research received no external funding.
Data Availability Statement
The original contributions presented in the study are included in the article, further inquiries can be directed to the corresponding author/s.
Acknowledgments
We acknowledge the Programa de Pós-Graduação em Agronomia (PPGA) and the Laboratório de Irrigação e Agrometeorologia (LIA) of the Universidade Federal de Alagoas (UFAL) for supporting the development of this research; the Coordenação de Aperfeiçoamento de Pessoal de Nível Superior (CAPES-Finance Code 001); and the PDPG Strategic Partnerships in the States III program, for funding the Postdoctoral fellowship.
Conflicts of Interest
The authors declare no conflicts of interest.
Abbreviations
| DNC | Desertification Nucleus of Cabrobó |
| ENSO | El Niño–Southern Oscillation |
| ETa | actual evapotranspiration |
| ETo | potential evapotranspiration |
| GEE | Google Earth Engine |
| INMET | National Institute of Meteorology |
| IQR | interquartile range |
| ITCZ | Intertropical Convergence Zone |
| LAI | Leaf Area Index |
| LULC | land use and land cover |
| NEB | Northeast Brazil |
| NOAA | National Oceanic and Atmospheric Administration |
| ONI | Oceanic Niño Index |
| PR2 | precipitationcoefficient of determination |
| RMSE | root mean square error |
| SAVI | Soil-Adjusted Vegetation Index |
| SPI | Standardized Precipitation Index |
| SST | Sea Surface Temperature |
| SSTA | Sea Surface Temperature Anomaly |
| ULCVs | Upper-Level Cyclonic Vortices |
| UNCCD | United Nations Convention to Combat Desertification |
| VHI | Vegetation Health Index |
References
- Thornton, P.K.; Ericksen, P.J.; Herrero, M.; Challinor, A.J. Climate Variability and Vulnerability to Climate Change: A Review. Glob. Chang. Biol. S 2014, 20, 3313–3328. [Google Scholar] [CrossRef] [PubMed]
- Gustafson, E.J.; Miranda, B.R.; Shvidenko, A.Z.; Sturtevant, B.R. Simulating Growth and Competition on Wet and Waterlogged Soils in a Forest Landscape Model. Front. Ecol. Evol. 2020, 8, 598775. [Google Scholar] [CrossRef]
- Singh, R.; Ram, K.; Yadav, C.; Siddiqui, A.R. Climate Change, Disaster and Adaptations: Human Responses to Ecological Changes. In Climate Change, Disaster and Adaptations; Springer: Cham, Switzerland, 2022; pp. 121–130. [Google Scholar]
- Boiffin, J.; Munson, A.D. Three Large Fire Years Threaten Resilience of Closed Crown Black Spruce Forests in Eastern Canada. Ecosphere 2013, 4, 1–20. [Google Scholar] [CrossRef]
- de Oliveira-Júnior, J.F.; Mendes, D.; Szabo, S.; Singh, S.K.; Jamjareegulgarn, P.; Cardoso, K.R.A.; Bertalan, L.; da Silva, M.V.; da Rosa Ferraz Jardim, A.M.; da Silva, J.L.B.; et al. Impact of the El Niño on Fire Dynamics on the African Continent. Earth Syst. Environ. 2024, 8, 45–61. [Google Scholar] [CrossRef]
- dos Santos, J.C.; Lyra, G.B.; Abreu, M.C.; de Oliveira-Júnior, J.F.; Bohn, L.; Cunha-Zeri, G.; Zeri, M. Aridity Indices to Assess Desertification Susceptibility: A Methodological Approach Using Gridded Climate Data and Cartographic Modeling. Nat. Hazards 2022, 111, 2531–2558. [Google Scholar] [CrossRef]
- dos Santos, T.S. Projeção Da Suscetibilidade a Desertificação Em Pernambuco Utilizando o Modelo HADGEM-ES (Projection of Susceptibility to Desertification in Pernambuco Using the HADGEM-ES Model). Rev. Bras. Geogr. Física 2017, 10, 1170. [Google Scholar] [CrossRef][Green Version]
- Zolotokrylin, A.N. Global Warming, Desertification/Degradation, and Droughts in Arid Regions. Izv. Ross. Akad. Nauk. Seriya Geogr. 2019, 3–13. [Google Scholar] [CrossRef]
- Bohn, L.; Lyra, G.B.; Oliveira-Júnior, J.F.; Zeri, M.; Cunha-Zeri, G. Desertification Susceptibility over Rio de Janeiro, Brazil, Based on Aridity Indices and Geoprocessing. Int. J. Climatol. 2021, 41, E2600–E2614. [Google Scholar] [CrossRef]
- Nóbrega, R.S.; Farias, R.F.D.L.; Santos, C.A.C.D. Variabilidade Temporal e Espacial Da Precipitação Pluviométrica Em Pernambuco Através de Índices de Extremos Climáticos. Rev. Bras. Meteorol. 2015, 30, 171–180. [Google Scholar] [CrossRef]
- Soares, D.B.; Nóbrega, R.S.; Mota Filho, F.D.O. Sobre o Processo de Desertificação. Rev. Bras. Geogr. Física 2011, 4, 174–188. [Google Scholar] [CrossRef]
- Vieira, R.M.D.S.P.; Tomasella, J.; Barbosa, A.A.; Martins, M.A.; Rodriguez, D.A.; Rezende, F.S.D.; Carriello, F.; Santana, M.D.O. Desertification Risk Assessment in Northeast Brazil: Current Trends and Future Scenarios. Land Degrad. Dev. 2021, 32, 224–240. [Google Scholar] [CrossRef]
- Moura, M.M.; Walter, L.S.; Lins, T.R.D.S.; Araujo, E.C.G.; da Cunha Neto, E.M.; Santana, G.M.; Brasil, I.D.S.; Silva, T.C. Temporal Analysis of Desertification Vulnerability in Northeast Brazil Using Google Earth Engine. Trans. GIS 2022, 26, 2041–2055. [Google Scholar] [CrossRef]
- Moraes, J.B.; Wanderley, H.S.; Delgado, R.C. Areas Susceptible to Desertification in Brazil and Projected Climate Change Scenarios. Nat. Hazards 2022, 116, 1463–1483. [Google Scholar] [CrossRef]
- de Oliveira Júnior, J.G.; Lopes, P.M.O.; Nascimento, C.R.; Moura, G.B.D.A.; de Oliveira Júnior, J.F. Space-Temporal Detection of Environmental Changes in the Brazilian Semiarid through Google Earth Engine and GIS. J. S. Am. Earth Sci. 2023, 127, 104403. [Google Scholar] [CrossRef]
- Neves, L.V.D.M.W.; de Sousa, J.E.S.; dos Santos, J.C.B.; de Araújo Filho, J.C.; Corrêa, M.M.; Sousa, M.G.; Fracetto, F.J.C.; Fracetto, G.G.M.; Araujo, J.K.S.; Freire, G.A.P.; et al. Weathering of Gneiss Saprolites and Formation of Planosols under Semiarid Climate (NE Brazil). J. S. Am. Earth Sci. 2023, 123, 104206. [Google Scholar] [CrossRef]
- de Lucena, J.A.; Nóbrega, R.S.; de Albuquerque, L.S. Anomalias de Temperatura Da Superfície Do Mar e a Variabilidade Pluviométrica No Núcleo de Desertificação de Cabrobó/PE. Rev. Geogr. 2017, 34, 239–256. [Google Scholar] [CrossRef]
- Feng, K.; Wang, T.; Liu, S.; Yan, C.; Kang, W.; Chen, X.; Guo, Z. Path Analysis Model to Identify and Analyse the Causes of Aeolian Desertification in Mu Us Sandy Land, China. Ecol. Indic. 2021, 124, 107386. [Google Scholar] [CrossRef]
- Liu, Q.; Zhang, Q.; Yan, Y.; Zhang, X.; Niu, J.; Svenning, J.-C. Ecological Restoration Is the Dominant Driver of the Recent Reversal of Desertification in the Mu Us Desert (China). J. Clean. Prod. 2020, 268, 122241. [Google Scholar] [CrossRef]
- Costa, G.B.; Mendes, K.R.; Viana, L.B.; Almeida, G.V.; Mutti, P.R.; e Silva, C.M.S.; Bezerra, B.G.; Marques, T.V.; Ferreira, R.R.; Oliveira, C.P.; et al. Seasonal Ecosystem Productivity in a Seasonally Dry Tropical Forest (Caatinga) Using Flux Tower Measurements and Remote Sensing Data. Remote Sens. 2022, 14, 3955. [Google Scholar] [CrossRef]
- Caetano, R.; Bastos Silva, T.; Ribeiro de Castro, D.; Silva Benfica, N. Uso de Índices Espectrais Na Caracterização Da Cobertura Vegetal Em Região de Caatinga Do Semiárido Baiano. Rev. Geociências Do Nordeste 2022, 8, 28–43. [Google Scholar] [CrossRef]
- Pande, C.B.; Al-Ansari, N.; Kushwaha, N.L.; Srivastava, A.; Noor, R.; Kumar, M.; Moharir, K.N.; Elbeltagi, A. Forecasting of SPI and Meteorological Drought Based on the Artificial Neural Network and M5P Model Tree. Land 2022, 11, 2040. [Google Scholar] [CrossRef]
- Thornthwaite, C.W. An Approach toward a Rational Classification of Climate. Geogr. Rev. 1948, 38, 55. [Google Scholar] [CrossRef]
- de Gois, G.; de Souza, J.L.; da Silva, P.R.T.; de Oliveira-Júnior, J.F. Caracterização Da Desertificação No Estado de Alagoas Utilizando Variáveis Climáticas. Rev. Bras. Meteorol. 2005, 20, 301–314. [Google Scholar]
- de Lucena, J.A.; Nóbrega, R.S.; Wanderley, L.S.D.A. Aspectos Temporais, Espaciais e Rítmicos Da Variabilidade Pluviométrica No Núcleo de Desertificação de Cabrobó/PE. Rev. Bras. Geogr. Física 2017, 10, 1784–1801. [Google Scholar] [CrossRef][Green Version]
- Perez-Marin, A.M.; Cavalcante, A.D.M.B.; Medeiros, S.S.; Tinôco, L.D.M.; Salcedo, I.H. Núcleos de Desertificação No Semiárido Brasileiro: Ocorrência Natural Ou Antrópica? Parcer. Estratégicas 2012, 17, 87–106. [Google Scholar]
- Dubreuil, V.; Fante, K.P.; Planchon, O.; Sant’Anna Neto, J.L. Climate Change Evidence in Brazil from Köppen’s Climate Annual Types Frequency. Int. J. Climatol. 2019, 39, 1446–1456. [Google Scholar] [CrossRef]
- Lyra, G.B.; Oliveira-Júnior, J.F.; Gois, G.; Cunha-Zeri, G.; Zeri, M. Rainfall Variability over Alagoas under the Influences of SST Anomalies. Meteorol. Atmos. Phys. 2017, 129, 157–171. [Google Scholar] [CrossRef]
- Costa, M.D.S.; Oliveira-Júnior, J.F.D.; Santos, P.J.D.; Correia Filho, W.L.F.; Gois, G.D.; Blanco, C.J.C.; Teodoro, P.E.; Silva Junior, C.A.D.; Santiago, D.D.B.; Souza, E.D.O.; et al. Rainfall Extremes and Drought in Northeast Brazil and Its Relationship with El Niño–Southern Oscillation. Int. J. Climatol. 2021, 41, E2111–E2135. [Google Scholar] [CrossRef]
- Abreu, M.C.; de Souza Fraga, M.; Lyra, G.B.; de Oliveira Junior, J.F.; de Jesús Villar-Hernández, B.; de Souza, A.; Zeri, M. Long-term Trend Analysis in Annual, Seasonal and Monthly Rainfall in East Northeast of Brazil and the Influence of Modes of Climate Variability. Int. J. Climatol. 2023, 43, 7463–7480. [Google Scholar] [CrossRef]
- NOAA Cold & Warm Episodes by Season. Available online: https://origin.cpc.ncep.noaa.gov/products/analysis_monitoring/ensostuff/ONI_v5.php (accessed on 14 September 2023).
- Eid, A.N.M.; Olatubara, C.O.; Ewemoje, T.A.; El-Hennawy, M.T.; Farouk, H. Inland Wetland Time-Series Digital Change Detection Based on SAVI and NDWI Indecies: Wadi El-Rayan Lakes, Egypt. Remote Sens. Appl. 2020, 19, 100347. [Google Scholar] [CrossRef]
- Nagy, A.; Szabó, A.; Adeniyi, O.D.; Tamás, J. Wheat Yield Forecasting for the Tisza River Catchment Using Landsat 8 NDVI and SAVI Time Series and Reported Crop Statistics. Agronomy 2021, 11, 652. [Google Scholar] [CrossRef]
- Silva, M.D.; Pandorfi, H.; Lopes, P.M.O.; Silva, J.D.; Almeida, G.L.P.; Silva, D.D.O.; Santos, A.D.; Rodrigues, J.D.M.; Batista, P.H.D.; Jardim, A.M.R.F. Pilot Monitoring of Caatinga Spatial-Temporal Dynamics through the Action of Agriculture and Livestock in the Brazilian Semiarid. Remote Sens. Appl. 2020, 19, 100353. [Google Scholar] [CrossRef]
- West, H.; Quinn, N.; Horswell, M. Remote Sensing for Drought Monitoring & Impact Assessment: Progress, Past Challenges and Future Opportunities. Remote Sens. Environ. 2019, 232, 111291. [Google Scholar] [CrossRef]
- Huete, A.; Didan, K.; Miura, T.; Rodriguez, E.P.; Gao, X.; Ferreira, L.G. Overview of the Radiometric and Biophysical Performance of the MODIS Vegetation Indices. Remote Sens. Environ. 2002, 83, 195–213. [Google Scholar] [CrossRef]
- da Silva, J.L.B.; de Albuquerque Moura, G.B.; da Silva, M.V.; Lopes, P.M.O.; de Souza Guedes, R.V.; de França e Silva, Ê.F.; Ortiz, P.F.S.; de Moraes Rodrigues, J.A. Changes in the Water Resources, Soil Use and Spatial Dynamics of Caatinga Vegetation Cover over Semiarid Region of the Brazilian Northeast. Remote Sens. Appl. 2020, 20, 100372. [Google Scholar] [CrossRef]
- Silva, C.O.F.; Jandreice Magnoni, P.H.; Lilla Manzione, R. Orbital Remote Sensing for Evapotranspiration Modeling: Theoretical Overview and Applications in Cloud Computing. Rev. Bras. Eng. Biossistemas 2021, 15, 425–468. [Google Scholar] [CrossRef]
- da Silva, M.V.; Pandorfi, H.; de Oliveira-Junior, J.F.; da Silva, J.L.B.; de Almeida, G.L.P.; de Assunção Montenegro, A.A.; Mesquita, M.; Ferreira, M.B.; Santana, T.C.; Marinho, G.T.B.; et al. Remote Sensing Techniques via Google Earth Engine for Land Degradation Assessment in the Brazilian Semiarid Region, Brazil. J. S. Am. Earth Sci. 2022, 120, 104061. [Google Scholar] [CrossRef]
- Liu, C.; Yang, C.; Yang, Q.; Wang, J. Spatiotemporal Drought Analysis by the Standardized Precipitation Index (SPI) and Standardized Precipitation Evapotranspiration Index (SPEI) in Sichuan Province, China. Sci. Rep. 2021, 11, 1280. [Google Scholar] [CrossRef] [PubMed]
- Lloyd-Hughes, B.; Saunders, M.A. A Drought Climatology for Europe. Int. J. Climatol. 2002, 22, 1571–1592. [Google Scholar] [CrossRef]
- Mckee, T.B.; Doesken, N.J.; Kleist, J. The Relationship of Drought Frequency and Duration to Time Scales. In Proceedings of the 8th Conference on Applied Climatology, Anaheim, CA, USA, 17–22 January 1993; pp. 17–22. [Google Scholar]
- Bekiashev, K.A.; Serebriakov, V.V. World Meteorological Organization (WMO). In International Marine Organizations: Essays on Structure and Activities; Springer: Berlin/Heidelberg, Germany, 1981; pp. 540–552. [Google Scholar]
- Middleton, N.J.; Thomas, D.S.G. World Atlas of Desertification, 1st ed.; Edward Arnold: Sevenoaks, UK, 1992; Volume 1, ISBN 0340555122. [Google Scholar]
- Silva, B.F.; dos Santos Rodrigues, R.Z.; Heiskanen, J.; Abera, T.A.; Gasparetto, S.C.; Biase, A.G.; Ballester, M.V.R.; de Moura, Y.M.; de Stefano Piedade, S.M.; de Oliveira Silva, A.K.; et al. Evaluating the Temporal Patterns of Land Use and Precipitation under Desertification in the Semi-Arid Region of Brazil. Ecol. Inf. 2023, 77, 102192. [Google Scholar] [CrossRef]
- Baeza, S.; Vélez-Martin, E.; De Abelleyra, D.; Banchero, S.; Gallego, F.; Schirmbeck, J.; Veron, S.; Vallejos, M.; Weber, E.; Oyarzabal, M.; et al. Two Decades of Land Cover Mapping in the Río de La Plata Grassland Region: The MapBiomas Pampa Initiative. Remote Sens. Appl. 2022, 28, 100834. [Google Scholar] [CrossRef]
- Ge, W.; Deng, L.; Wang, F.; Han, J. Quantifying the Contributions of Human Activities and Climate Change to Vegetation Net Primary Productivity Dynamics in China from 2001 to 2016. Sci. Total Environ. 2021, 773, 145648. [Google Scholar] [CrossRef] [PubMed]
- Caballero, C.B.; Ruhoff, A.; Biggs, T. Land Use and Land Cover Changes and Their Impacts on Surface-Atmosphere Interactions in Brazil: A Systematic Review. Sci. Total Environ. 2022, 808, 152134. [Google Scholar] [CrossRef] [PubMed]
- Sampaio, Y.D.S.B.; Vital, T.; Araújo, M.S.B.; Sampaio, G.R. Desertificação No Brasil: Conceitos, Núcleos e Tecnologias de Recuperação e Convivência; Ed. Universitária da UFPE: Recife, Brazil, 2003; Volume 1. [Google Scholar]
- Bettencourt, P.; Fernandes, P.A.; Fulgêncio, C.; Canas, Â.; Wasserman, J.C. Prospective Scenarios for Water Sustainability in the São Francisco River Basin. Sustain. Water Resour. Manag. 2023, 9, 81. [Google Scholar] [CrossRef]
- Marengo, J.A.; Torres, R.R.; Alves, L.M. Drought in Northeast Brazil—Past, Present, and Future. Theor. Appl. Clim. 2017, 129, 1189–1200. [Google Scholar] [CrossRef]
- Allen, R.G.; Tasumi, M.; Trezza, R.; Waters, R.; Bastiaanssen, W. SEBAL (Surface Energy Balance Algorithms for Land). Adv. Train. Users Man. Ida. Implement. Version 2002, 1, 97. [Google Scholar]
- Zhen, Z.; Chen, S.; Yin, T.; Chavanon, E.; Lauret, N.; Guilleux, J.; Henke, M.; Qin, W.; Cao, L.; Li, J.; et al. Using the Negative Soil Adjustment Factor of Soil Adjusted Vegetation Index (SAVI) to Resist Saturation Effects and Estimate Leaf Area Index (LAI) in Dense Vegetation Areas. Sensors 2021, 21, 2115. [Google Scholar] [CrossRef]
- Shao, G.; Han, W.; Zhang, H.; Liu, S.; Wang, Y.; Zhang, L.; Cui, X. Mapping Maize Crop Coefficient Kc Using Random Forest Algorithm Based on Leaf Area Index and UAV-Based Multispectral Vegetation Indices. Agric. Water Manag. 2021, 252, 106906. [Google Scholar] [CrossRef]
- Marengo, J.A.; Alves, L.M.; Alvala, R.C.; Cunha, A.P.; Brito, S.; Moraes, O.L. Climatic Characteristics of the 2010-2016 Drought in the Semiarid Northeast Brazil Region. An. Acad. Bras. Ciências 2018, 90, 1973–1985. [Google Scholar] [CrossRef]
- Correia Filho, W.L.F.; De Oliveira-Júnior, J.F.; De Barros Santiago, D.; De Bodas Terassi, P.M.; Teodoro, P.E.; De Gois, G.; Blanco, C.J.C.; De Almeida Souza, P.H.; da Silva Costa, M.; Gomes, H.B.; et al. Rainfall Variability in the Brazilian Northeast Biomes and Their Interactions with Meteorological Systems and ENSO via CHELSA Product. Big Earth Data 2019, 3, 315–337. [Google Scholar] [CrossRef]
- Bezerra, A.C.; Silva, J.L.B.D.; Silva, D.A.D.O.; Nascimento, C.R.; Ribeiro, E.P.; Galvincio, J.D.; Silva, M.V.D.; Oliveira, H.F.E.D.; Mesquita, M.; Oliveira-Júnior, J.F.D.; et al. Seasonality of Biophysical Parameters in Extreme Years of Precipitation in Pernambuco: Relations, Regionalities, and Variability. Atmosphere 2023, 14, 1712. [Google Scholar] [CrossRef]
- Filgueiras, R.; Venancio, L.P.; Aleman, C.C.; da Cunha, F.F. Comparison and Calibration of Terraclimate Climatological Variables over the Brazilian Territory. J. S. Am. Earth Sci. 2022, 117, 103882. [Google Scholar] [CrossRef]
- Andrade, J.M.; Ribeiro Neto, A.; Bezerra, U.A.; Moraes, A.C.C.; Montenegro, S.M.G.L. A Comprehensive Assessment of Precipitation Products: Temporal and Spatial Analyses over Terrestrial Biomes in Northeastern Brazil. Remote Sens. Appl. 2022, 28, 100842. [Google Scholar] [CrossRef]
- da Silva, J.B.A.; de Almeida, G.L.P.; da Silva, M.V.; de Oliveira-Junior, J.F.; Pandorfi, H.; de Sousa, A.M.O.; Marinho, G.T.B.; Giongo, P.R.; Ferreira, M.B.; de Sousa, J.S.; et al. Characterization of Water Status and Vegetation cover Change in a Watershed in Northeastern Brazil. J. S. Am. Earth Sci. 2023, 130, 104546. [Google Scholar] [CrossRef]
- De Moura, M.S.B.; Sobrinho, J.E.; da Silva, T.G.F. Aspectos Metereológico Do Semiárido Brasileiro. In Tecnologias de Convivência Com O Semiárido Brasileiro; Embrapa: Brasilia, Brazil, 2019; Volume 1, pp. 85–104. [Google Scholar]
- Brito, S.S.B.; Cunha, A.P.M.A.; Cunningham, C.C.; Alvalá, R.C.; Marengo, J.A.; Carvalho, M.A. Frequency, Duration and Severity of Drought in the Semiarid Northeast Brazil Region. Int. J. Climatol. 2018, 38, 517–529. [Google Scholar] [CrossRef]
- Marengo, J.A. O Futuro Clima Do Brasil. Rev. USP 2014, 103, 25–32. [Google Scholar] [CrossRef]
- de Queiroz, D.B.; Cavalcante, A.D.M.B.; Lima, P.V.P.S.; da Silva, E.M. Tecnologias Sociais Na Redução Da Vulnerabilidade Às Mudanças Climáticas Nos Municípios Do Ceará, Brasil. Rev. Bras. Meteorol. 2022, 37, 261–268. [Google Scholar] [CrossRef]
- Wanderley, H.S.; de Carvalho, A.L.; Fernandes, R.C.; de Souza, J.L. Mudança No Regime Temporal Da Temperatura Do Ar e Precipitação Pluviométrica Na Região de Rio Largo, Alagoas. Rev. Bras. Geogr. Física 2014, 7, 662–667. [Google Scholar] [CrossRef]
- Dantas, L.G.; dos Santos, C.A.C.; de Olinda, R.A. Tendências Anuais e Sazonais Nos Extremos de Temperatura Do Ar e Precipitação Em Campina Grande—Pb. Rev. Bras. Meteorol. 2015, 30, 423–434. [Google Scholar] [CrossRef]
- Gomes, A.R.D.S.; Braga, V.B.; Alves, J.M.B.; Silva, E.M.D.; Gomes, C.R.D.S.; Gomes, M.R.D.S. Análise de Estresse Vegetativo, Associado Às Variáveis Climáticas No Nordeste Do Brasil e Nos Municípios Do Ceará (Fortaleza, Jaguaruana e Campos Sales). Rev. Bras. Meteorol. 2020, 35, 493–504. [Google Scholar] [CrossRef]
- Yavaşlı, D.D.; Erlat, E. Climate Model Projections of Aridity Patterns in Türkiye: A Comprehensive Analysis Using CMIP6 Models and Three Aridity Indices. Int. J. Climatol. 2023, 43, 6207–6224. [Google Scholar] [CrossRef]
- Spinoni, J.; Vogt, J.; Naumann, G.; Carrao, H.; Barbosa, P. Towards Identifying Areas at Climatological Risk of Desertification Using the Köppen-Geiger Classification and FAO Aridity Index. Int. J. Climatol. 2015, 35, 2210–2222. [Google Scholar] [CrossRef]
- da Silva, M.V.; Pandorfi, H.; Jardim, A.M.D.R.F.; de Oliveira-Júnior, J.F.; da Divincula, J.S.; Giongo, P.R.; da Silva, T.G.F.; de Almeida, G.L.P.; de Albuquerque Moura, G.B.; Lopes, P.M.O. Spatial Modeling of Rainfall Patterns and Groundwater on the Coast of Northeastern Brazil. Urban Clim. 2021, 38, 100911. [Google Scholar] [CrossRef]
- Brito Júnior, V.D.M.; de Magalhães, H.F.; Albuquerque, U.P. Perception of Health Risks in Contexts of Extreme Climate Change in Semiarid Northeastern Brazil: An Analysis of the Role of Socioeconomic Variables. J. Ethnobiol. Ethnomed. 2023, 19, 24. [Google Scholar] [CrossRef] [PubMed]
- Huang, J.; Ji, M.; Xie, Y.; Wang, S.; He, Y.; Ran, J. Global Semi-Arid Climate Change over Last 60 Years. Clim. Dyn. 2016, 46, 1131–1150. [Google Scholar] [CrossRef]
- Shi, H.; Tian, H.; Lange, S.; Yang, J.; Pan, S.; Fu, B.; Reyer, C.P.O. Terrestrial Biodiversity Threatened by Increasing Global Aridity Velocity under High-Level Warming. Proc. Natl. Acad. Sci. USA 2021, 118, e2015552118. [Google Scholar] [CrossRef]
Disclaimer/Publisher’s Note: The statements, opinions and data contained in all publications are solely those of the individual author(s) and contributor(s) and not of MDPI and/or the editor(s). MDPI and/or the editor(s) disclaim responsibility for any injury to people or property resulting from any ideas, methods, instructions or products referred to in the content. |
© 2024 by the authors. Licensee MDPI, Basel, Switzerland. This article is an open access article distributed under the terms and conditions of the Creative Commons Attribution (CC BY) license (https://creativecommons.org/licenses/by/4.0/).