Article

Comparing Three Freeze-Thaw Schemes Using C-Band Radar Data in Southeastern New Hampshire, USA

1
Department of Civil and Environmental Engineering, University of New Hampshire, Durham, NH 03824, USA
2
Earth Systems Research Center, Institute for the Study of Earth, Oceans, and Space, University of New Hampshire, Durham, NH 03824, USA
3
USDA ARS Hydrology and Remote Sensing Laboratory, Beltsville, MD 20705, USA
*
Author to whom correspondence should be addressed.
Remote Sens. 2024, 16(15), 2784; https://doi.org/10.3390/rs16152784
Submission received: 4 June 2024 / Revised: 9 July 2024 / Accepted: 24 July 2024 / Published: 30 July 2024
(This article belongs to the Section Earth Observation Data)

Abstract

:
Soil freeze-thaw (FT) cycles over agricultural lands are of great importance due to their vital role in controlling soil moisture distribution, nutrient availability, health of microbial communities, and water partitioning during flood events. Active microwave sensors such as C-band Sentinel-1 synthetic aperture radar (SAR) can serve as powerful tools to detect field-scale soil FT state. Using Sentinel-1 SAR observations, this study compares the performance of two FT detection approaches, a commonly used seasonal threshold approach (STA) and a computationally inexpensive general threshold approach (GTA) at an agricultural field in New Hampshire, US. It also explores the applicability of an interferometric coherence approach (ICA) for FT detection. STA and GTA achieved 85% and 78% accuracy, respectively, using VH polarization. We find a marginal degradation in the performance of STA (82%) and GTA (76%) when employing VV-polarized data. While there was approximately a 6 percentage point difference between STA’s and GTA‘s overall accuracy, we recommend GTA for FT detection using SAR images at sub-field-scale over extended regions because of its higher computational efficiency. Our analysis shows that interferometric coherence is not suitable for detecting FT transitions under mild and highly dynamic winter conditions. We hypothesize that the relatively mild winter conditions and therefore the subtle FT transitions are not able to significantly reduce the correlation between the phase values. Also, the ephemeral nature of snowpack in our study area, further compounded by frequent rainfall, could cause decorrelation of SAR images even in the absence of a FT transition. We conclude that despite Sentinel-1’s ~80% mapping accuracy at a mid-latitude site, understanding the cause of misclassification remains challenging, even when detailed ground data are readily available and employed in error attribution efforts.

1. Introduction

Soil freeze/thaw (FT) processes play a critical role in controlling vital components of the Earth’s system such as energy, water, and nutrition cycles [1,2]. Soil FT status also contributes to the risk of flooding and consequently erosion because the hydraulic conductivity of frozen soil is up to 10 6 lower than unfrozen soil [3]. Over agricultural landscapes, FT processes control soil nutrient availability and microbial communities’ health [4,5,6,7]. The combination of these impacts makes soil FT a critical process for crop production, highlighting the need for monitoring FT dynamics across agricultural landscapes.
FT processes are highly dynamic and depend on the spatial heterogeneity of topography, soil properties, vegetation and various snow characteristics [8,9]. Due to the global climate observing system’s (GCOS) requirements for essential climate variables (ECV), a spatial resolution of less than 1 km is ideal to explain the dynamics of FT cycles taking place at the land-atmosphere interface surface [10]. Furthermore, sub-field-scale resolutions are needed for agricultural applications to provide actionable information to stakeholders on their field management decisions [11].
While passive microwave remote sensing imagery can observe FT state [12,13,14,15], it is unable to observe spatial heterogeneity of FT processes at sub-field-scales due to their inherent coarse spatial resolution (ranging from 9 km to 36 km). Active microwave instruments (‘radar’) produce field-scale observations that meet the GCOS ECV spatial resolution requirements. In addition to sub-field-scale resolutions, radar instruments also allow for all-weather and night-or-day observations. Currently, several high-resolution SAR instruments are available for FT mapping including Radarsat-2 [16] and Sentinel-1 [17] in C-band (~5 GHz), and TerraSAR-X [18] and COSMO-SkyMed [19] in X-band (~10 GHz). However, only the data collected by Sentinel-1 is freely available to users worldwide.
Several methods have been employed to detect soil FT state using radar data. The underlying premise is that radar cross sections (RCS) will be considerably smaller during frozen than thawed conditions due to a lower dielectric constant of frozen soil [20]. The temporal change detection approach (TCA) is a common approach for detecting FT and comes in various forms. One form of TCA uses a thawed reference value to determine the RCS difference between observation at time t and thawed condition. The magnitude of the RCS difference then informs the frozen or thawed state of the soil. Baghdadi et al. [21] compared Sentinel-1 backscatter at time t with the immediate backscatter that was acquired prior to time t under non-frozen conditions. They found a decrease of approximately 3.5 dB and 5 dB in Sentinel-1 VV and VH backscatters, respectively, and used these thresholds to map frozen/thawed surfaces over agricultural landscapes. The main disadvantage of this TCA method is its sensitivity to the non-frozen reference RCS value. A high rate of false freeze detection results if irregularly high backscatter values during non-frozen days (due to irrigation or precipitation) are used as the reference value [22]. Other variants of this approach have been suggested to mitigate the impacts of the non-frozen reference values on the performance [22,23]. However, the complexity of such improved methods increases the computational cost. For example, Fayad et al. [22] first found the maximum backscatter acquired within 15 days before time t. Then, they used the mean of the last three selected maximum backscatters as a reference value. All these extra steps can potentially reduce the impacts of irregularly high reference values but demand higher computational capacity over large domains.
Another temporal change detection method is the seasonal threshold approach (STA), which was originally developed in the passive microwave sensing community [24]. This approach compares soil backscatter signals to the signals acquired during reference frozen and thawed seasons at each pixel individually. It assumes that high variations in backscatter coefficients’ temporal dynamics are related to changes in the dielectric constant induced by a soil FT state change. An advantage of STA is that it can improve the consistency of classifications because it uses specific frozen and thawed threshold values for each grid cell. Therefore, it can indirectly account for natural landscape variability (e.g., surface roughness and vegetation height) that may be found within a single land cover land use (LCLU) class. However, this approach is well suited for passive microwave sensing images whose grid spacing is on the order of 10 s of kilometers. It becomes computationally less efficient when the same process must be replicated over radar images with grids on the order of 10 s of meters. Despite its computational disadvantage, various forms of this approach have been applied to radar data for field-scale studies [23,25,26].
Another means for ground FT detection by radar is to use interferometric coherence. Interferometric coherence is a measure of the consistency or stability of phase differences between two radar signals [27]. Zhou et al. [28] related phase correlation between two consecutive images to change in soil FT state. They estimated the onset time of FT cycles over a continuous permafrost zone and reported less than one Sentinel-1 revisit cycle difference between the estimated time of FT onset and the observed times. Apart from their study and to the best of our knowledge, the interferometric coherence approach (ICA) has not been widely assessed for FT detection specifically at mid-latitude regions experiencing relatively mild, highly dynamic winter conditions including frequent FT cycling and ephemeral snow cover.
Given the need to monitor FT processes at sub-field-scale resolution for agricultural management applications at mid-latitude regions, the challenge is to establish an effective, robust, and computationally efficient framework to detect ground surface FT states using radar observations at spatial scales of 100 m or less. The first objective of this study is to test a general threshold approach (GTA) for FT detection using Sentinel-1 SAR images. GTA has lower computational demand than the approaches utilized in the much coarser passive microwave remote sensing grids (e.g., STA) because it employs a single threshold on radar backscatters. If GTA can provide performance comparable to STA, its simplicity makes it a preferable approach for FT detection at sub-field scale. The additional goal is to assess the suitability of ICA for FT change detection over a landscape with highly dynamic winter conditions. It should be noted that this study targets the FT processes that occur in the topmost layer of the ground, considering the penetration depth of C-band signals and the use of air temperature observations for validation.

2. Methodology

2.1. Study Area

The University of New Hampshire’s Thompson Farm Research Station, situated in southeast New Hampshire, United States (coordinates: 43.10892°N, 70.94853°W, 35 m above sea level), served as the location for this study (Figure 1). This research station is a focal point for a comprehensive examination of the cold season processes in the presence of shallow ephemeral snowpack [29,30,31], making it an ideal and well-established locale for conducting in-depth studies on freeze-thaw processes.
Thompson Farm spans an area of 0.83 square kilometers and has relatively gentle topography, with elevations ranging from 18 to 36 m above sea level. The farm is classified as pasture/hey (class 81) in the National Land Cover Database (NLCD) (Figure A1). It is managed for pasture grass before the winter season (May-August) with no tile drainage or irrigation system on the farm. There is minimal surface disturbance after mid-September with no snow removal during wintertime. The growing season begins in early May and ends around mid-September. The agricultural field is surrounded by mixed forests. Forest comprises mainly northern red oak (Quercus rubra), white pine (Pinus strobus), shagbark hickory (Carya ovata), red maple (Acer rubrum), and white oak (Quercus alba). Along the edges, berry-producing shrubs can often be found. Soil is classified as silt loam, sandy loam, and loamy sand in the National Cooperative Soil Survey (Figure A1).
The winter climate at Thompson Farm is characterized by a cold climate, with an average winter air temperature of −3.0 °C, rainfall of 10.2 cm, and total snowfall of 114 cm. Snowpack is classified as ephemeral by the 22-year MODIS snow cover classification of Johnston et al. [32]. Snow cover duration ranges from a week to over a month with snow depth varying from trace amounts up to 94 cm, and typical snow density ranging from 100 to 400 kg/m3.

2.2. SAR Data

The Radiometrically Terrain Corrected (RTC) Sentinel-1 products, generated and distributed by Alaska Satellite Facility (ASF), were used in this study. To obtain the RTCs, the Sentinel-1 images in Interferometric Wide Swath (IW) beam mode and ascending direction were first filtered to the study area and time period. Subsequently, ASF was tasked to apply radiometric terrain correction on the L1 Single Look Complex (SLC) images to reduce the combination effect of viewing geometry and terrain, ionospheric impacts, and radio frequency interference. An Enhanced Lee 7 × 7 filter was also applied to reduce speckle noise [33,34]. When outputting the RTCs from ASF, the 30-m pixel spacing was selected because it better aligns with the native resolution of the GLO-30 Copernicus DEM used by ASF for RTC processing. Details about the ASF’s workflow for per-processing, terrain and radiometric correction, and geocoding can be found in the ASF’s RTC product guide [35]. The analyses of seasonal threshold and general threshold approaches were conducted on both VV and VH polarized data in linear power units, which were then converted to Decibel (dB) values for visualization purposes.
ASF also offers Interferometric Synthetic Aperture Radar (InSAR) Sentinel-1 products on demand for VV polarized SLC images. In this study, we leveraged their Vertex short baseline subsets (SBAS) tool to obtain interferograms over the study area, which provides amplitude, coherence, and phase data at approximately 80 m grid spacing (20 × 4 looks). This study only used the interferometric coherence data calculated from SLC images in IW mode, ascending pass, and VV polarization from the same satellite path.
The study site is covered by two different Sentinel-1 paths (135 and 62). The incident angle ranges from 40.78° to 40.80° and 34.38° to 34.39° over the study area for Paths 135 and 62, respectively. The images from these paths were assessed separately because image pairs used to obtain interferometric coherence need to be from the same orbital paths and rows (i.e., short baseline which means nearly identical incidence angles and viewing geometry) [36]. The study period included three winters of 2020, 2021, and 2022 when each winter began in early September and extended through the end of April. The time period between September and April captures both early and late-season FT processes while limiting the impact of vegetation growth and land management activities such as plowing and tilling on the backscatter signature of the surface. During the three study winters, 56 SLC images were acquired on Path 135, and 60 on Path 62 in total.

2.3. RCS and Coherence Product Alignments

RCS grid spacing was 30 m whereas the coherence product was produced on a different grid of about 80 m spacing. For the sake of consistency, the RTC and coherence images were aligned to the coherence pixels by calculating the mean values of gamma-0 powers for RTC pixels whose centers are located in coherence pixels (Figure 2).
Radar backscatter from pixels with a significant portion of their area covered by high trees can pose challenges due to the sensitivity of the signals to the structure, density, and moisture content of vegetation, which can introduce noise and distortions in the signal. This study analyzed coherence pixels that have at least 60% of their area within the study area boundary, narrowing down the analysis to ten pixels from Path 135, and nine pixels from Path 62 (Figure 2). This selection criterion ensured that the coherence pixels used for analysis were predominantly located within the pasture, not the forest.

2.4. FT Reference Data

Hourly air temperature observations at 6 pm local time, coincident with Sentinel-1 overpass in ascending direction, were used to assess FT retrievals from Sentinel-1 RCS values. The air temperatures were measured at NH Durham 2 SSW station, located at Thompson Farm. The station is part of the U.S. Climate Reference Network (USCRN), developed and maintained by the National Oceanic and Atmospheric Administration (NOAA). Three Thermometrics Corporation PT1000 platinum resistance thermometers positioned at a height of 1.5 m above the ground surface measure air temperature every 10 s. The hourly data were obtained from the USCRN website. A threshold Tth,air was used to define soil state from the air temperature observations as:
T a i r T t h , a i r   :   F r o z e n   T a i r > T t h , a i r   :   T h a w e d
A Tth,air of 0 °C was used for the main analysis of this study. However, it has been shown that the soil FT process is a progression rather than a binary process [37,38,39]. Therefore, to investigate our targeted approach, GTA, and to test for measurement errors and biases such as freezing point depression and differences between air and soil temperatures, we also classified surface FT states only considering values outside of ±1, ±2, ±3, ±4 and ±5 °C range. This also allowed us to study the tradeoff between classification performance and exclusion of observations taken at temperatures close to the freeze-thaw transition.

2.5. Ancillary Data

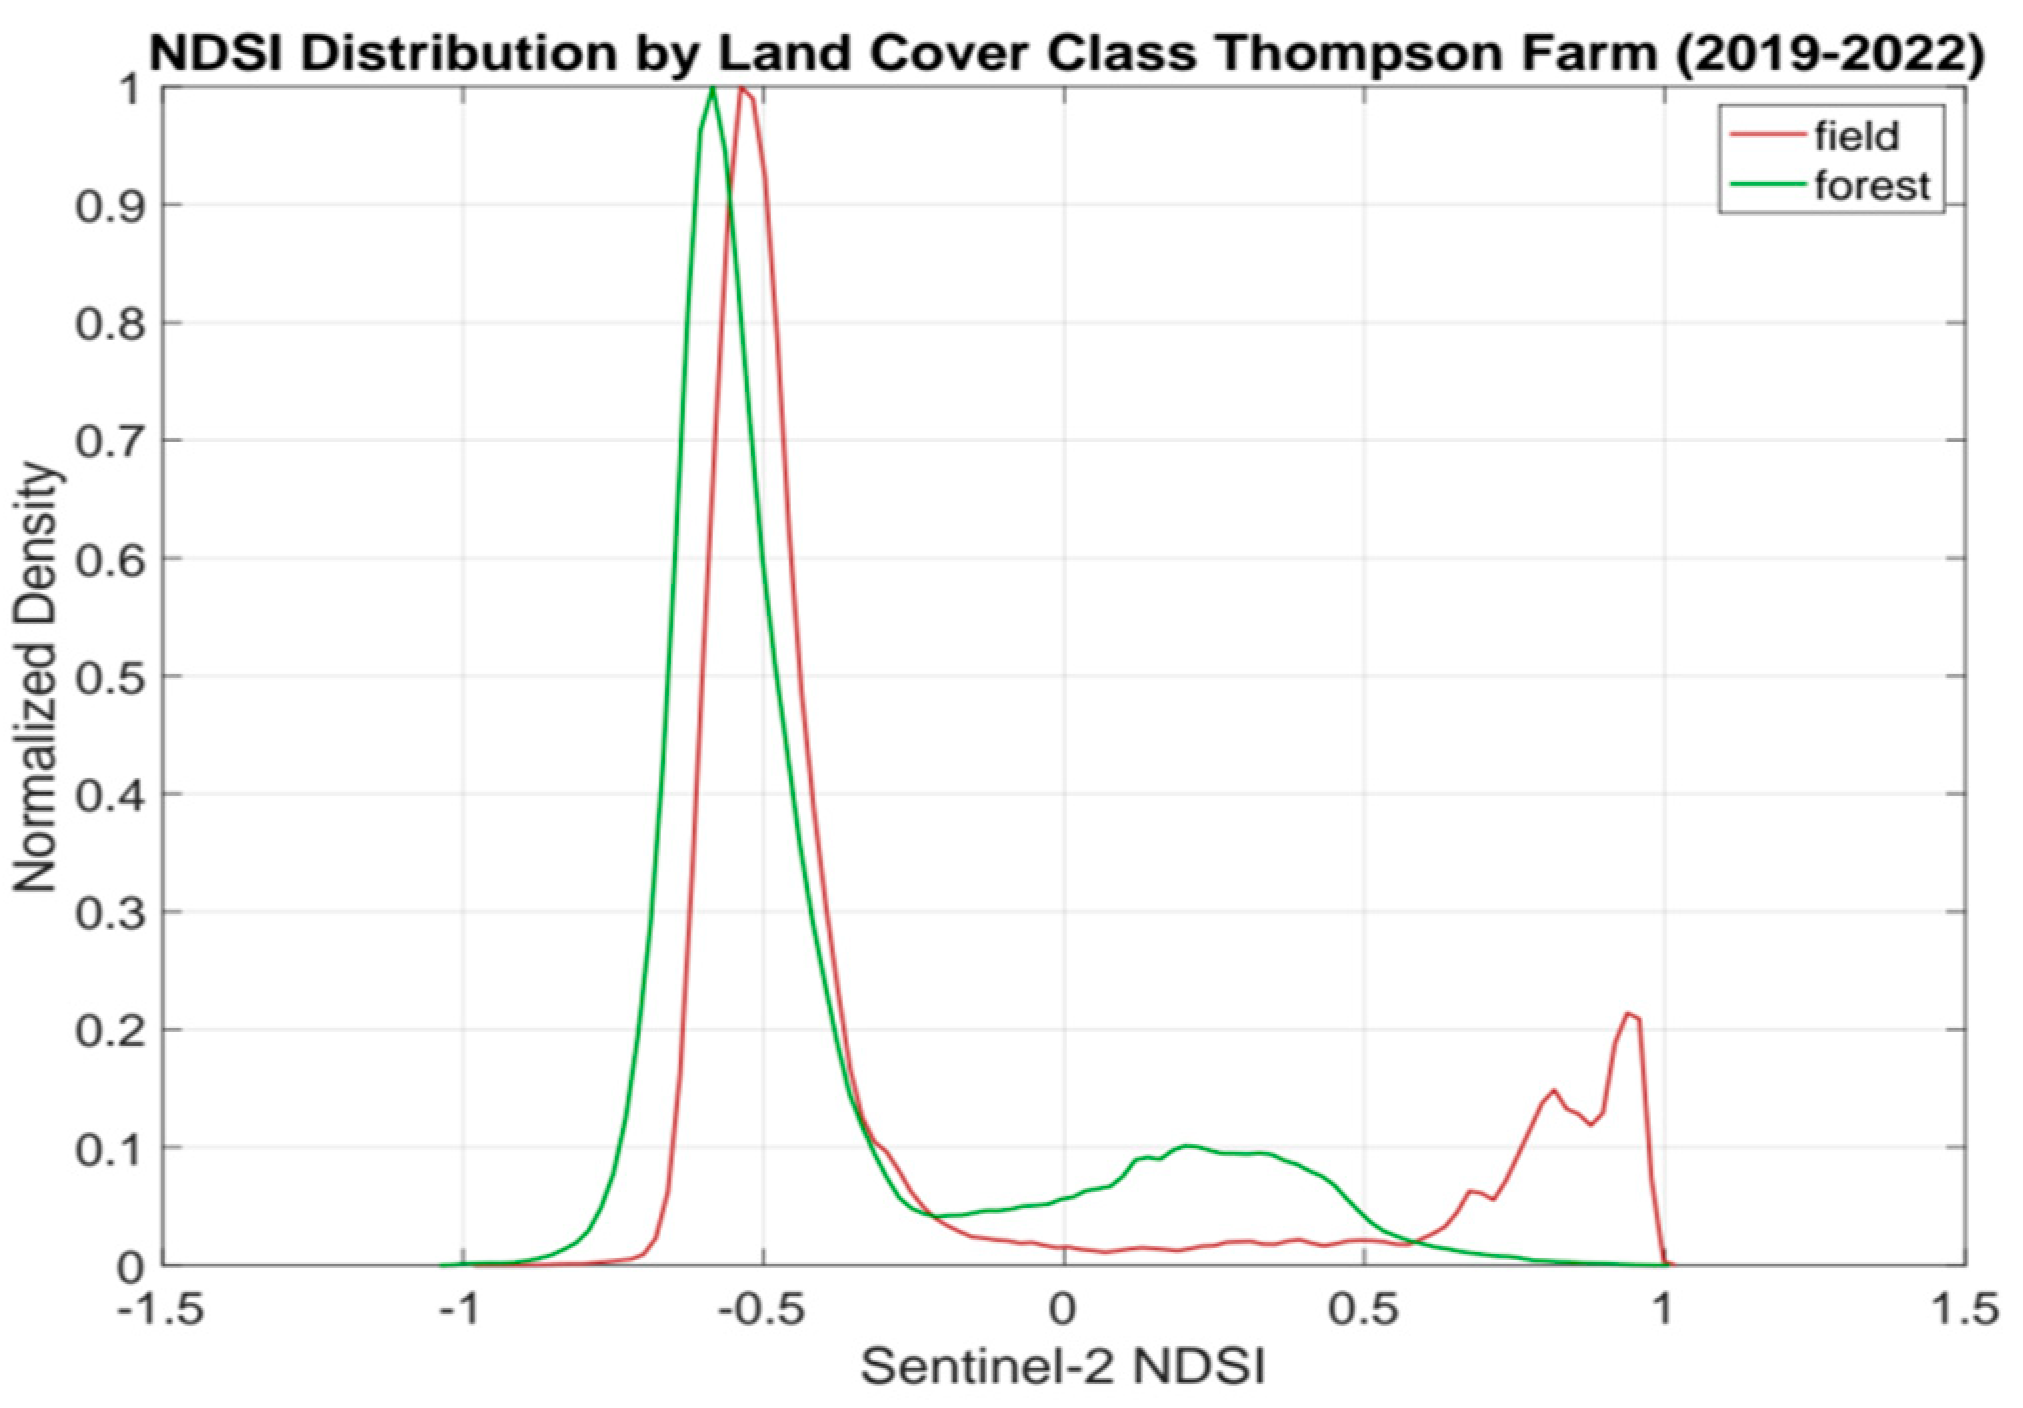
To gain a better understanding of the impact of meteorological conditions on surface backscatters, hourly precipitation data and snow cover observations were used in this study. The precipitation was measured at the USCRN station using a T-200B Geonor precipitation gauge. Snow cover estimates were produced at 10-m resolution using the Harmonized Sentinel-2 (S2) Level-2A products from the S2 Multispectral Instrument. All S2 observations over Thompson Farm from 2019 to 2022 were considered for 560 total overpasses, 248 of which were cloud-free. The normalized difference snow index (NDSI), used widely to detect snow in remotely sensed imagery [40,41], was then calculated in Google Earth Engine as normalized differences of S2 band 3 (green, 560 nm) and S2 band 11 (SWIR, 1610 nm). Pixels with NDSI greater than the threshold were defined as snow-covered while values below the threshold were set as snow-free. The reference values 0.1 (forest) and 0.4 (field) were estimated from the literature [42,43,44] and verified by examining the time series of NDSI at Thompson Farm over the study period (Figure A2). A weighted NDSI threshold value was computed based on the proportions of forest (pforest) and field (pfield) within each 10 m S2 pixel using the following equation:
N D S I t h r e s h o l d = 0.1 p f o r e s t + 0.4 p f i e l d
The produced 10 m binary snow cover maps were then used to summarize the snow cover fraction (SCF) for each path’s coherence pixels by calculating the proportion of snow-covered pixels.
We also employed meter-scale resolution ancillary data to improve our ability to explain/attribute susceptibility to misclassifications at each RCS/coherence pixel. UAS flights equipped with optical and lidar instruments provided additional information on topography, vegetation height, and insolation for each 80 m pixel (Figure 1). A 1 m resolution digital elevation model (DEM) obtained from lidar observations was used to calculate the mean DEM (DEM-MEAN) and standard deviation of DEM (DEM-STDV) over the selected coherence pixels. The canopy height model (CHM) was calculated as the difference between the digital terrain model and the digital surface model at a 1 m spatial resolution. CHM-MEAN is the mean of CHM for each coherence pixel. The TopoToolbox software package (version 2) shadow function in MATLAB (version 2023a) [45] was used in combination with the National Renewable Energy Laboratory’s (NREL) Solar Position Algorithm [46] to produce shading estimates at 15-min intervals using the UAS lidar-derived DSM. The total sun hours variable (TSH), the daily average of unshaded sun hours during the winter, was calculated at a 1 m spatial resolution and these values were averaged over an 80 m coherence pixel (TSH-MEAN).

2.6. FT Detection Approaches

Three approaches, a seasonal threshold (Section 2.6.1), a general threshold (Section 2.6.2), and a coherence-based (Section 2.6.3), were employed to detect FT changes over the study area using the Sentinel-1 SAR data. The outcome of the first two approaches is a dimensionless binary state variable that assigns a frozen or thawed state to each grid cell for each acquisition date. The outcome of the third approach is a correlation value between two subsequent Sentinel-1 observations which could imply the onset of an FT state change. Results were compared to the FT observations based on the air temperature data.

2.6.1. Seasonal Threshold Approach

The seasonal threshold approach (STA) applied in this study is similar to the SMAP baseline algorithm for FT detection [47]. This algorithm analyzes the temporal evolution of the SAR signal, comparing it to the signals acquired during reference frozen and thawed seasons. The seasonal threshold algorithm assumes that substantial variations in the dielectric constant between frozen and thawed conditions exert a more pronounced influence on the temporal dynamics of landscape backscatter than other factors contributing to its temporal variability. The main difference in the implementation of STA for this study versus that used for SMAP is that this study does not use summertime data for the thaw reference. Instead, the thaw reference was obtained based on shoulder season SAR data preceding frozen conditions and where air temperature is considerably warmer than freezing (>+5 °C). The rationale is that active radar data is not sensitive to physical temperature, but rather the physical state of water. This is in contrast to passive microwave instruments such as SMAP, where physical temperature also plays an important role given that the detected brightness temperature values are the product of emissivity and physical temperature. The STA approach is particularly effective in situations where observations occur infrequently over time, as it leverages the characteristic changes in backscatter associated with freeze-thaw transitions [24,48]. For each pixel i, a seasonal scale factor ( Δ i t ) is defined as:
Δ i t = γ i 0 t γ i , f r 0 γ i , t h 0 γ i , f r 0
where γ i 0 t is the radiometric terrain corrected backscatter power of pixel i at time t. γ i , f r 0 and γ i , t h 0 are backscatter measurements corresponding to the frozen and thawed reference states, respectively. γ i , f r 0 was defined as the mean of the five lowest backscatter observations at pixel i during the months of January and February over the entire study period. The mean of the five highest backscatter observations at pixel i during September over the entire study period was used as the thaw reference γ i , t h 0 for that pixel with the condition that no precipitation happened 24 h prior to the acquisition. Soil state is then classified using threshold level T as:
Δ i t T   :   F r o z e n Δ i t > T   :   T h a w e d
where T is a threshold value that depends on landscape characteristics and sensor configuration and can be optimized. A higher threshold value assigns a greater weight to frozen conditions, whereas a lower threshold value assigns a greater weight to thawed conditions. The T threshold, commonly set at 0.5 (as utilized in the SMAP baseline), can be optimized for each pixel to better capture its distinctive surface characteristics. Therefore, a range of T values (0.4, 0.45, 0.5, 0.55, 0.6) was tested to determine the optimal threshold with the highest average Kappa value for each individual pixel. The process involved conducting leave-one-out cross-validation, where one winter of data was set aside as a validation set in each iteration. The cross-validation was performed separately for each pixel, enabling the optimization of the threshold specific to each individual pixel. This approach ensured that the threshold selection process was tailored to the unique characteristics of each pixel. The algorithm was iteratively executed for each polarization-path combination.

2.6.2. General Threshold Approach

The objective of the General Threshold Approach (GTA) is to establish a single threshold that can effectively distinguish between different soil states across the entire study area. The GTA differs from STA by having a single threshold on RCS values as compared to STA’s threshold on the seasonal factors which differ by pixel. For each combination of polarization and satellite path, the backscatter observations for all selected pixels within the region of interest and throughout the entire study period were used together. Multiple candidate thresholds were then evaluated to identify the optimal threshold that yields the highest performance for FT classification. By systematically exploring a range of thresholds, the aim is to pinpoint the threshold that best discriminates between the different soil states. For a threshold ( γ t h 0 ) within the defined range, frozen/thawed state of pixel i at time t was defined as:
γ i 0 t γ t h 0   :   F r o z e n γ i 0 t > γ t h 0   :   T h a w e d
where γ i 0 t is the radiometric terrain corrected backscatter power of pixel i at time t. Utilizing the leave-one-out cross-validation method, the analysis involved excluding one pixel for all three winters from the dataset at each iteration to use its data for validation purposes. The Cohen’s Kappa value was then calculated based on the validation pixel. The average Kappa for each threshold was determined as the mean of all Kappa values calculated iteratively over the left-out pixels. Subsequently, the threshold associated with the highest average Kappa value was selected for freeze-thaw classification.

2.6.3. Interferometric Coherence Approach

The FT retrieval approaches discussed above focus solely on the amplitude of backscatter of the radar signal. However, the similarity of the signal phases at the time of two SAR acquisitions, the interferometric coherence, could also be potentially useful for FT detection. Interferometric coherence is essentially a measure of the degree of the phase correlation between two consecutive images which enables the detection of changes in their scattering characteristics [27]. This approach dates back decades and has its roots in topographic mapping and deformation studies but has more recently found increased adoption in other sectors such as infrastructure [49,50,51] and agriculture [52,53,54]. It also has shown promises for mapping relative soil moisture content [27,55,56,57,58,59] and snow [60,61,62]. Coherence ( ρ ) is defined as
ρ = E S 1 S 2 * E S 1 S 1 E S 2 S 2
where S1 and S2 are the complex values of SLC images 1 and 2. E(.) is the expectation operator. * represents the complex conjugation. The coherence values range from 0 to 1, where 0 represents completely non-coherent or random scattering behavior, and 1 indicates perfect correlation or highly stable scattering properties. Higher coherence values indicate surfaces that have remained relatively unchanged between the acquisition dates, while lower coherence values suggest areas with significant temporal changes or decorrelation.
Because interferometric coherence quantifies consistency between two SAR images, it can potentially be used to only detect a transition in FT state (either from frozen to thawed or from thawed to frozen) rather than the exact FT state of ground surface. In this study, we investigated the association of coherence values with FT transitions and assessed the hypothesis that FT transitions could cause decorrelation (low coherence) between a pair of images.

2.7. Performance Metrics

To assess the performance of each method, the retrieved soil states from the Sentinel-1 SAR images and the soil states established by the ground truth dataset (in-situ air temperature observations) were compared. A true freeze retrieval indicates consensus between the SAR images and the in-situ observational dataset regarding the frozen state, while a true thaw retrieval denotes agreement on the thawed state. Conversely, a false thaw retrieval and false freeze retrieval arise when the soil state obtained from the radar backscatters inaccurately indicates thaw or freeze, respectively, in contrast to the corresponding in-situ data.
Two metrics, overall accuracy and Cohen’s Kappa value, were calculated to evaluate the performance of the methods by counting the instances in which both datasets concurred on the soil state, as well as the occurrences of disagreement. The overall accuracy is calculated as
A c c u r a c y = N T F + N T T N 100
where N T F , N T T and N are the number of true freeze retrievals, the number of true thaw retrievals, and the total number of observations, respectively.
Cohen’s Kappa coefficient is a more robust measure than a simple percent agreement such as overall accuracy because it considers the potential for chance agreement [63,64]. The Kappa coefficient ranges from −1.0 to 1.0, where negative values signify poor agreement, and a value of 1.0 indicates perfect agreement. It is calculated as:
K a p p a = p o p e 1 p e
where po, the relative observed agreement, and pe, the hypothetical probability of chance agreement, are calculated as:
p o = N T F + N T T N
p e = p Y p N
where pY and pN, respectively, are the expected probability of random agreement and disagreement, given by:
p Y = N T F + N F F N T F + N F T N 2
p N = N T T + N F T N T T + N F F N 2
where N F F and N F T are the number of false freeze retrievals and the number of false thaw retrievals, respectively.
In addition to the overall accuracy and Kappa value, four ratios, as defined in Equations (13)–(16), were employed to provide a more comprehensive understanding of the overall performance and reliability of FT retrievals from the SAR data. These ratios offer insight into the effectiveness of radar images and the retrieval approach in correctly identifying specific events from the total number of actual occurrences. For instance, the true freeze ratio quantifies the capability of radar backscatter and the retrieval approach in accurately detecting freeze events among all the observed freeze events.
T r u e   F r e e z e   R a t i o = N T F N T F + N F T
F a l s e   T h a w   R a t i o = N F T N T F + N F T
T r u e   T h a w   R a t i o = N T T N T T + N F F
F a l s e   F r e e z e   R a t i o = N F F N T T + N F F

3. Results

3.1. RCS Time-Series

Figure 3 and Figure 4 present the time series for ascending acquisition of VV and VH polarized backscatter coefficients, respectively, for both Paths 135 and 62, alongside the coincident in-situ air temperature measurements over Thompson farm for the three winters 2020–2022. In the graphs, the horizontal lines represent the thresholds employed to determine the freeze/thaw state. Over the study period, VV polarized radar cross sections from both paths demonstrated a range of −13 dB to −8 dB, while VH RCS values varied between −22 dB and −14 dB. In general, muted backscatter coefficients tended to coincide with freezing events, whereas higher backscatter values were predominantly observed during thawed days. This temporal evolution was consistent across the pixels covering the study area, despite the spatial variability in RCS values and the magnitude of their changes over time.
The magnitude of RCS values across the interest area varied temporally, while the spatial pattern tended to be consistent over time. For both satellite paths, the month of January stood out as the month in which VH backscatters had the highest spatial variability across the Thompson Farm. In the case of VV polarization, the highest difference among the pixels’ backscatters did not have a consistent pattern. In 2020 and 2021, the variation among VV backscatters peaked in the middle of the cold season (December, January, and February), while in 2022, the highest variation was observed in either April or May. Regardless of the polarization, backscatter coefficients decreased with increasing distance from the forest edges.
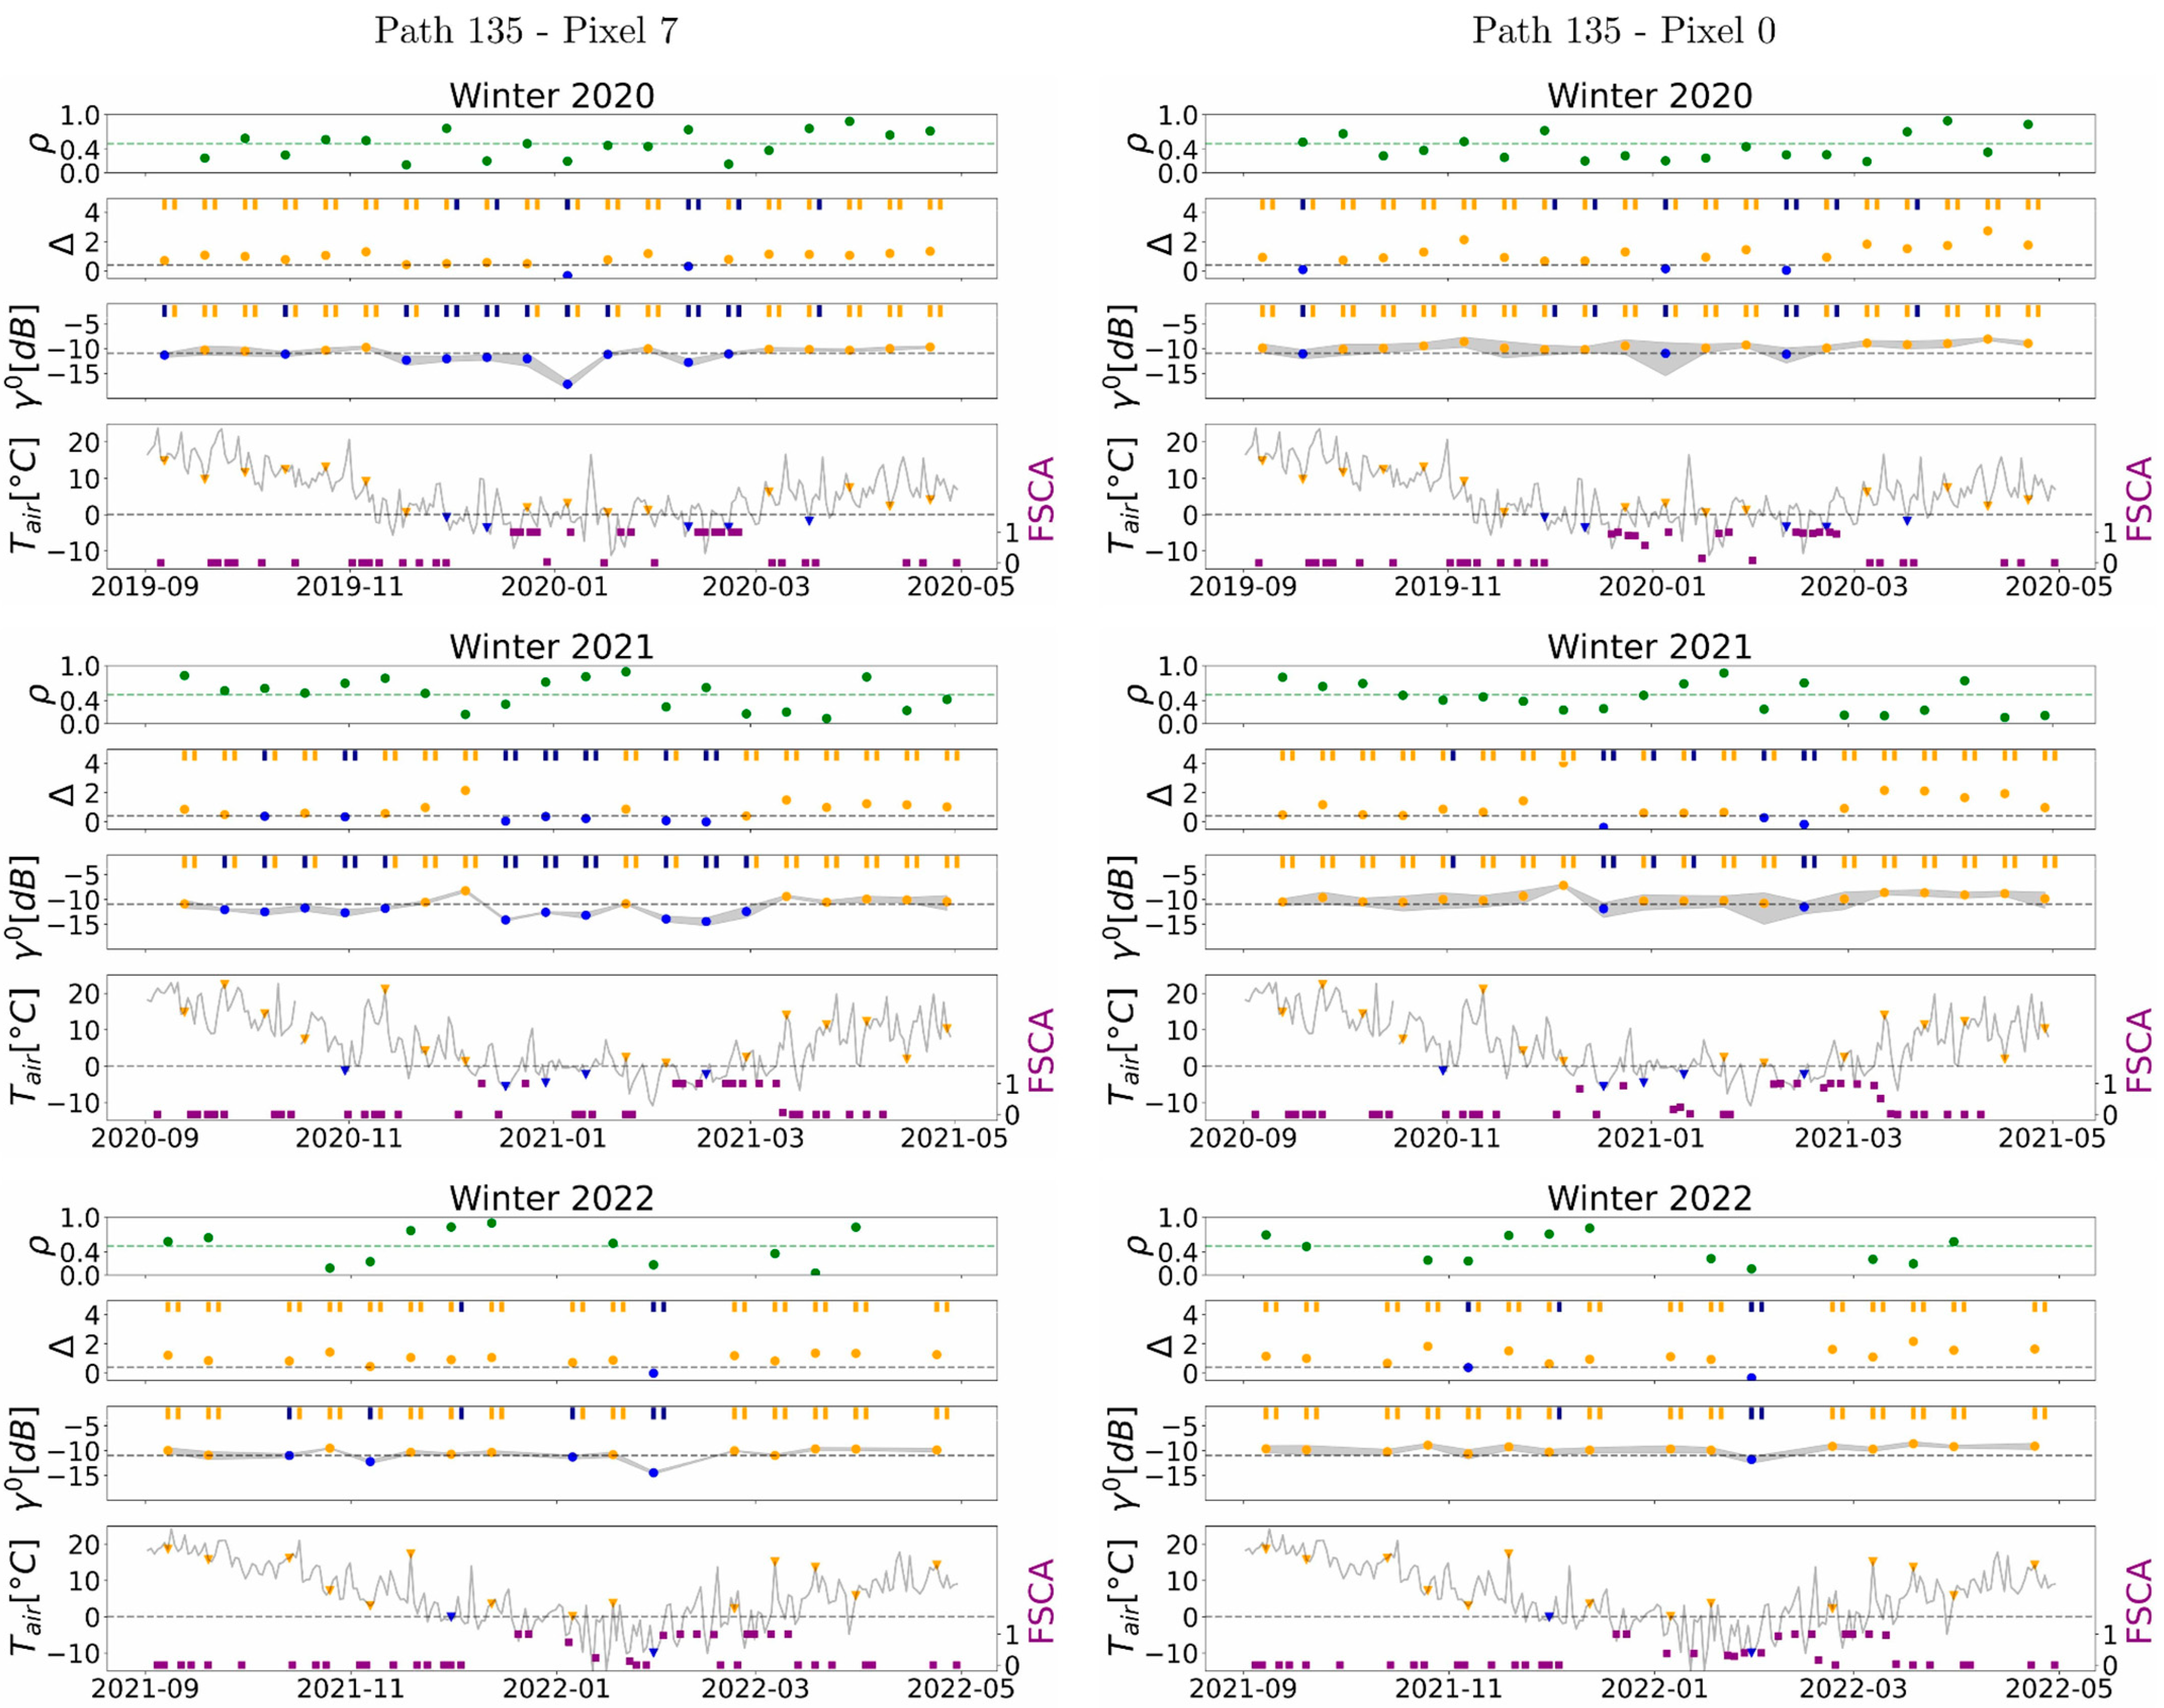
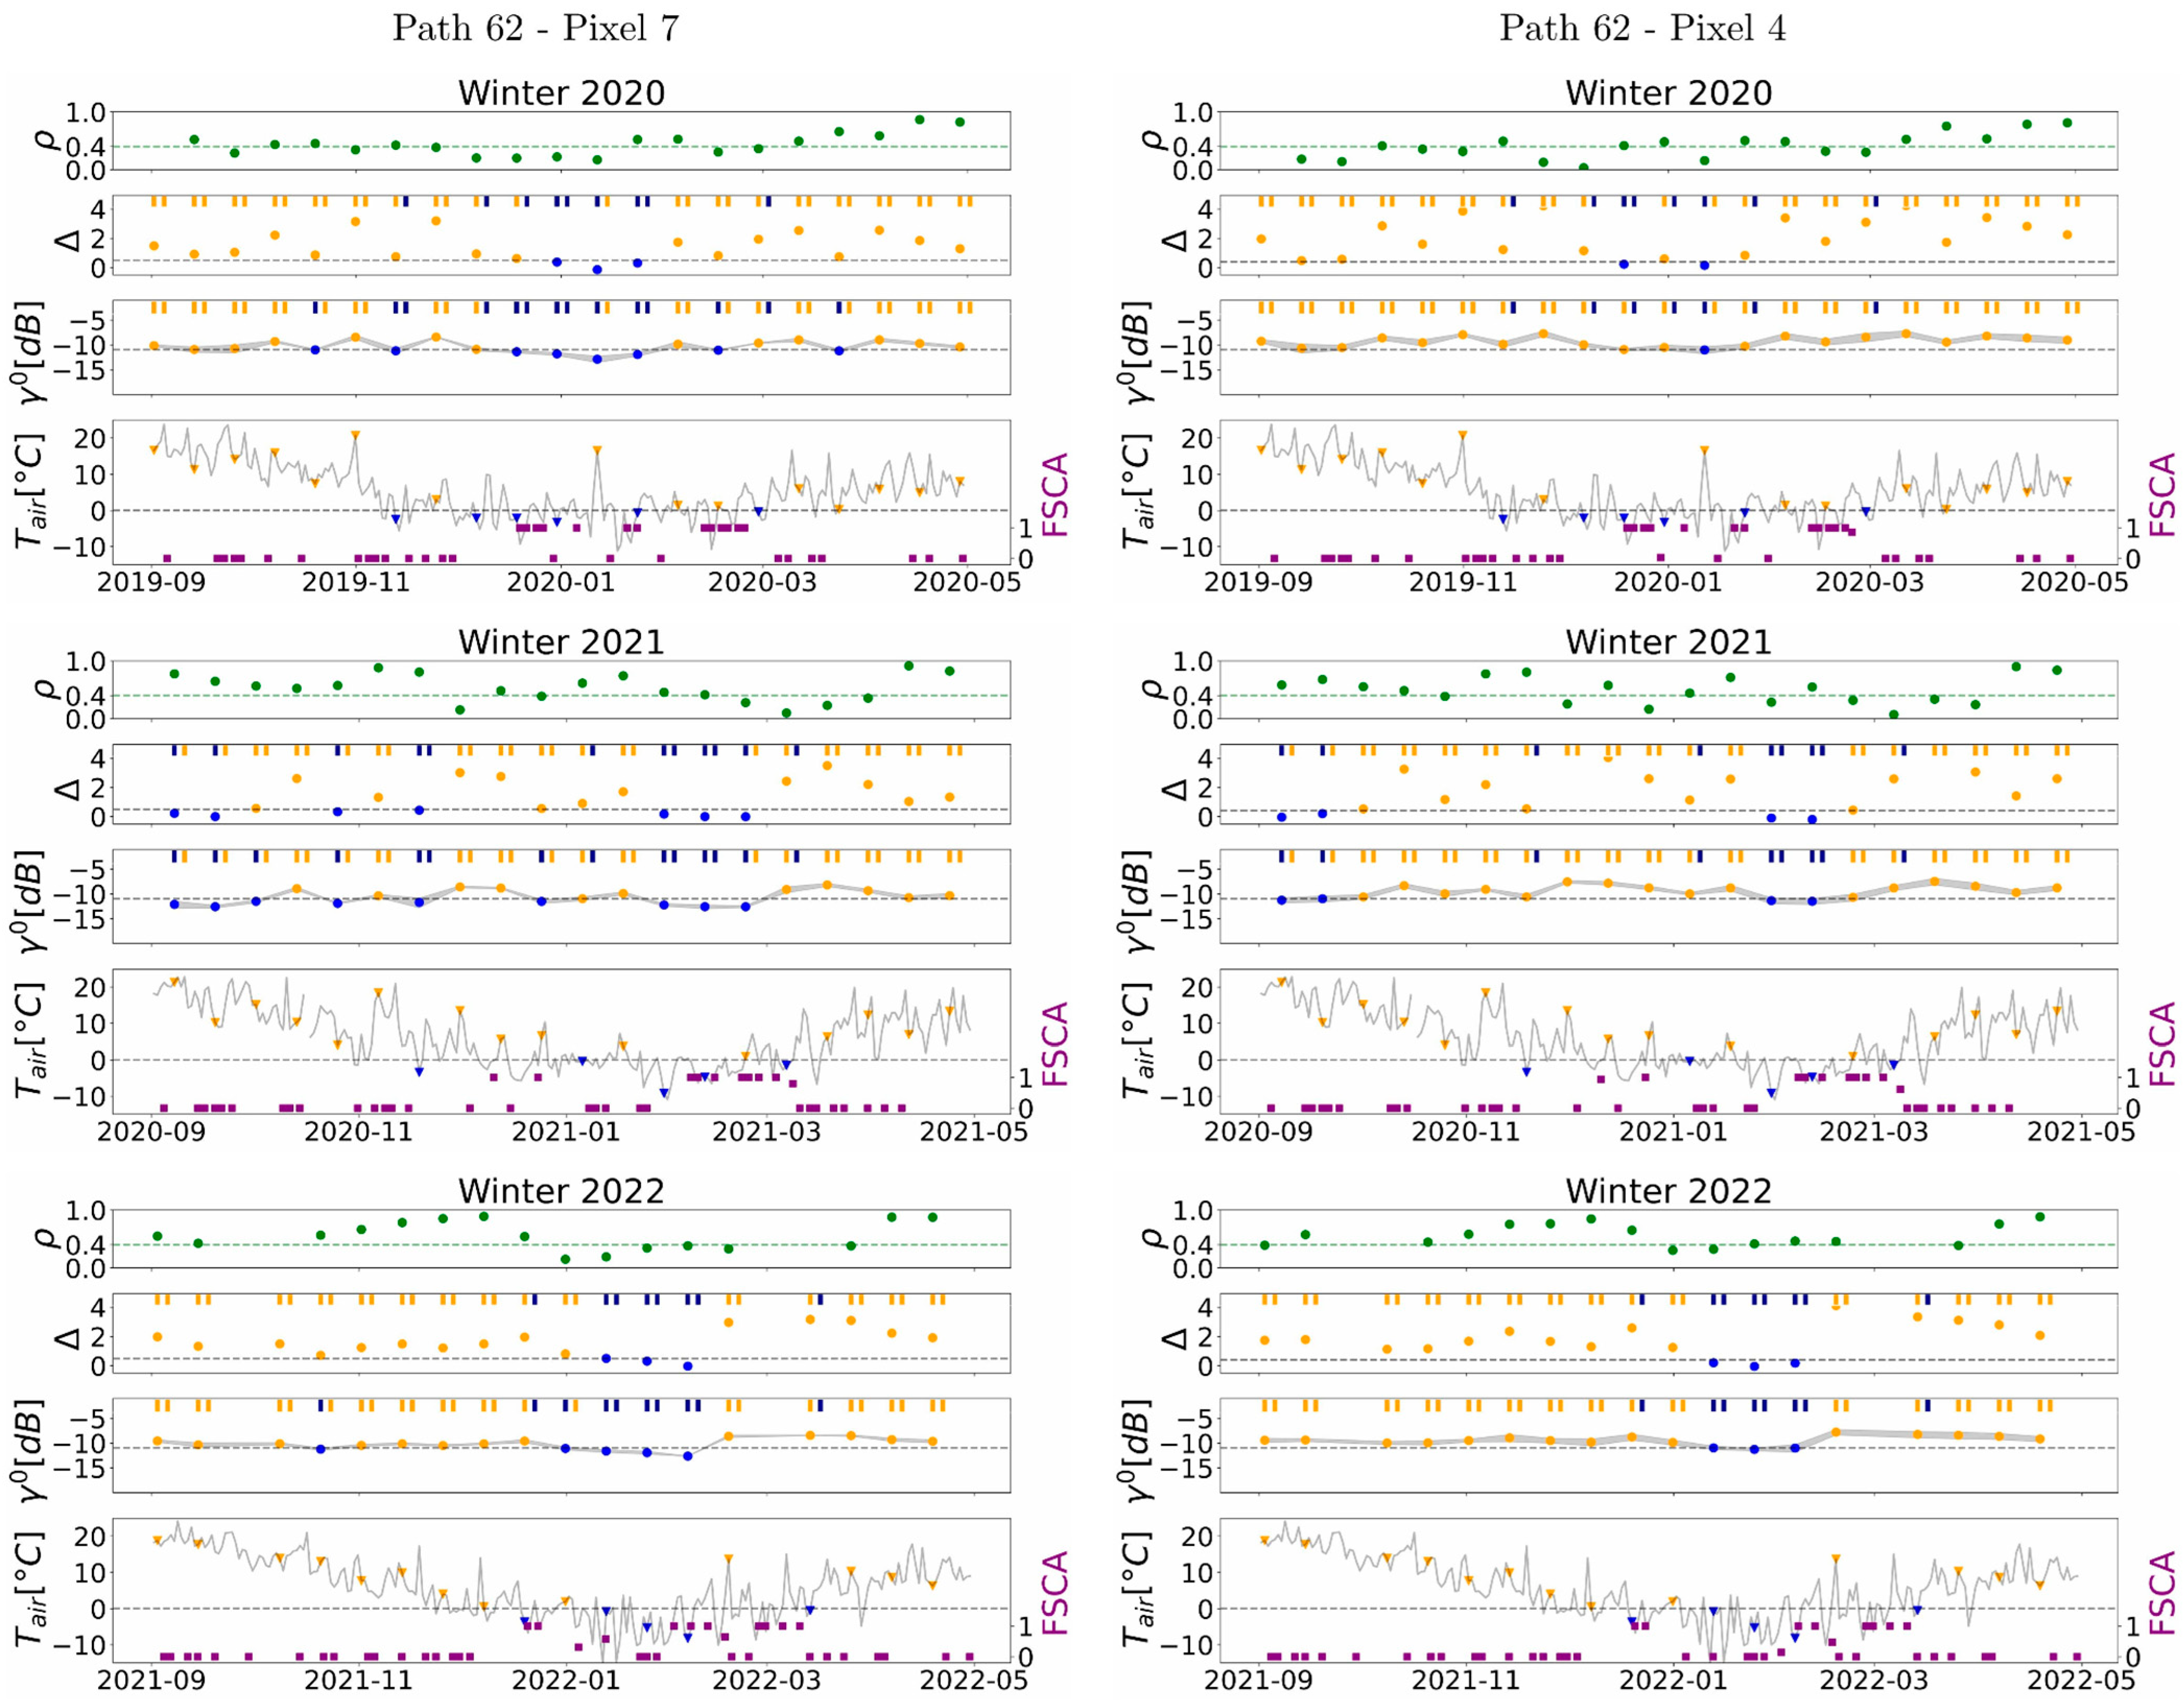
Figure 5 and Figure 6 show coherence, seasonal scale factor, backscatter coefficients, and their corresponding thresholds at two representative pixels: one with unmixed vegetation (pasture) and the other with mixed vegetation (pasture and forest) for Paths 135 and 62, respectively. Specifically, for Path 135, pixels 7 and 0 were chosen to represent the unmixed and mixed vegetation pixels, respectively. For Path 62, pixels 7 and 4 were selected. The time series data of these pixels show that the radar backscatters at mixed pixels generally exhibited elevated values compared to those of unmixed pixels. Furthermore, they displayed higher variability on each acquisition day. The spatial variation in backscatter coefficients was more prominent (higher standard deviation) in the mixed pixel of Path 135 compared to that of Path 62, primarily due to a higher proportion of its area being covered with hardwood vegetation. Also, the variability within the mixed pixel of Path 135 had more changes over time, whereas the unmixed pixels exhibited a more consistent variability.
Lower values of seasonal scale factors were generally associated with freezing events (Figure 5 and Figure 6). Also, the seasonal scale factors exhibited a higher temporal variability over the cold season at mixed pixels of both paths. While at unmixed pixels, the seasonal scale factors did not exceed 2.5, they peaked at 3.7 at mixed pixels. No notable differences were observed between temporal variability of coherence values at mixed and unmixed pixels.

3.2. Seasonal Threshold Approach

Figure 7 depicts the STA accuracy, along with the optimal threshold (T in Equation (4)) selected for each pixel across the Thompson farm for VV and VH measurements of Sentinel-1 Paths 135 and 62. Path 135’s VH signals typically provided the highest accuracy. Path 135’s mean overall accuracy for the study area is 83.4% for VV signals and 87.4% for VH signals. For Path 135’s VH backscatters, the individual pixel accuracy ranged from 83.3% (pixel 6) to 91% (pixel 1), respectively. For Path 135’s VV measurements, the individual pixel accuracies of FT retrievals were all lower than the VH values, but the degradation differed among pixels. Additionally, the best and worst performing locations differed between VV and VH. Path 62 had lower accuracies than Path 135 with a mean overall accuracy of 81.3% for VV measurements and 83.4% for VH measurements. Using VV backscatters of Path 62, the STA accuracy ranged from 75.6% (pixel 4) to 87.2% (pixel 3). For all but pixels 0 and 3, VH measurements performed better with accuracies ranging from 78.4% (pixel 0) to 86.9% (pixel 8). The FT detection performance differences between VV and VH were more notable for Path 135 in comparison to Path 62, particularly for pixels 0–4.
The optimal threshold for the STA was 0.4 for most of Path 135’s pixels (six out of 10 pixels) when VV backscatters were used. For the same path and polarization, only two pixels’ optimal thresholds matched the typical default value of 0.5. For VH measurements from Path 135, a threshold of 0.45 was most frequently selected as the optimal threshold (four pixels). Along Path 62, the optimal thresholds tended to be higher. Values greater than 0.5 were frequently indicated for both VV and VH signals. The commonly used threshold of 0.5 was optimal for FT retrievals at only two pixels and one pixel from the VV and VH signals, respectively. Although this threshold was not selected as optimal for the majority of the pixels, it exhibited an overall accuracy that was, on average, only 3% less than the performance of the optimal thresholds.
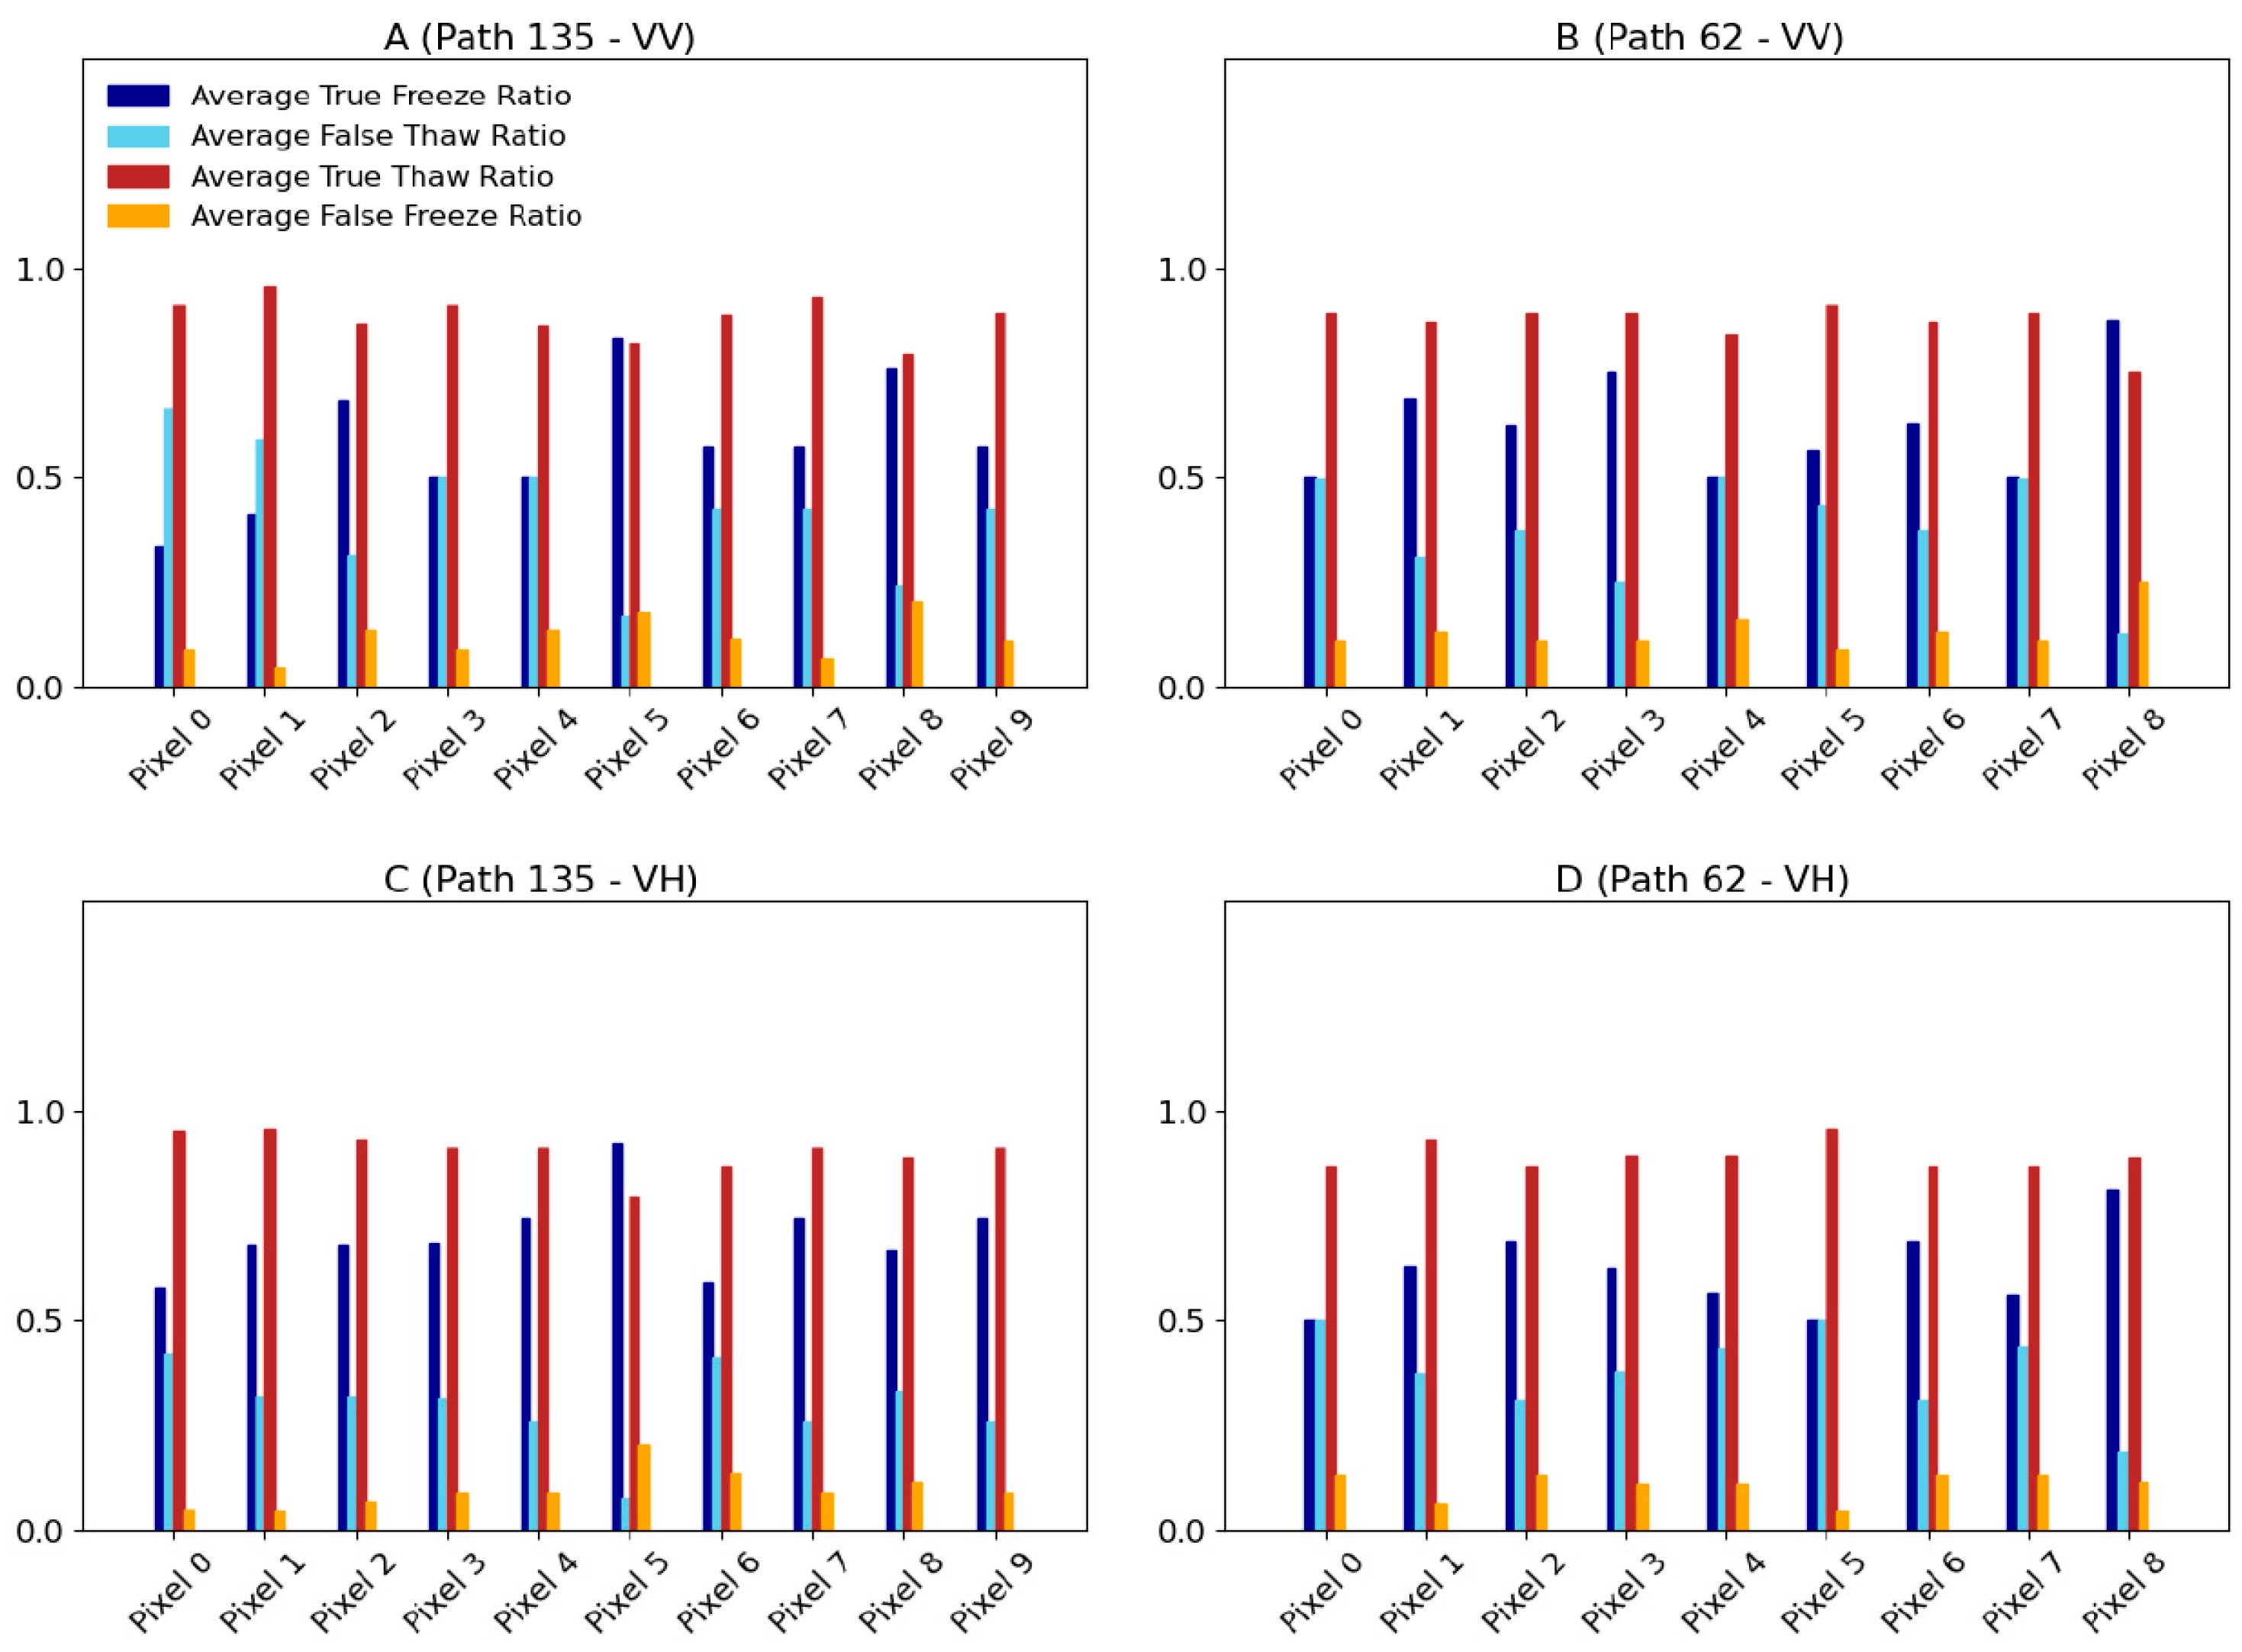
Overall, the STA was more successful at retrieving observed thaw events as compared to frozen events (Figure A3). For Path 135’s VV and VH measurements, 88% and 90% of all thaw events were accurately detected, respectively, on average across the study area. Averaged over the studied pixels of Path 135, the freeze detection percentages dropped to only 57% for VV signals and 70% for VH signals. These low ratios of true freeze retrieval imply that many observed freeze events were not retrieved. Over Path 62, the seasonal approach had similar performance, characterized by high ratios of correct thaw retrievals (on average, 0.87 for VV signals and 0.89 for VH signals) and low ratios of correct freeze retrievals (on average, 0.63 for VV signals and 0.62 for VH signals).
The ratios of correctly retrieved thaw states were relatively consistent across the study area for both paths and polarizations (Figure A3). Along Path 135, the thaw ratios ranged from 0.8 (pixel 8) to 0.96 (pixel 1), indicating a robust performance in detecting the actual thaw events across Thompson farm. Path 62’s performance was slightly lower than Path 135 with ratios between 0.75 (pixel 8) and 0.91 (pixel 5). Applied to VH measurements, these ratios showed variation between 0.8 (pixel 5) and 0.96 (pixel 1) for Path 135, and 0.87 (pixel 0) and 0.96 (pixel 5) for Path 62, further highlighting the consistency of the seasonal approach in accurately detecting thaw states. In contrast, there was a considerable variability in ratios of true freeze retrieval over the study area. The ratios of correctly retrieved freeze events from VV measurements ranged from 0.33 (pixel 0) to 0.83 (pixel 5) along path 135, and 0.5 (pixel 4) to 0.87 (pixel 8) along Path 62. The use of VH measurements improved freeze detection for Path 135, but no change in performance was evident for Path 62.
Overall, the STA approach performed well with VH modestly outperforming VV signals. For both polarizations, thawed events were better detected than frozen events. The optimal thresholds were generally lower and higher than the typical threshold of 0.5 for Path 135’s and Path 62’s pixels, respectively.

3.3. General Threshold Approach

Table 1 summarizes the performance metrics of the GTA for the selected thresholds for Paths 135 and 62 when the FT threshold for in-situ air temperatures was set to 0 °C. Complete details of all tested thresholds are provided in Table A1. The highest Kappa values were achieved when thresholds of 0.075 (−11.25 dB) and 0.085 (−10.69 dB) were applied on VV polarized backscatter measurements of Path 135 and 62, respectively (Table A1). However, the threshold of 0.08 (−10.97 dB) was selected for both paths for further analysis to keep the threshold consistent over both paths. The overall accuracy for the threshold of 0.08 (−10.97 dB) was 74.5% for Path 135 and 78.0% for Path 62. With this threshold, on average, 55% of all freezing days and 84% of all thawed days were detected successfully. Although higher thresholds improved GTA’s ability to retrieve observed freeze events, they resulted in more erroneous false freeze retrievals. In the case of VH measurements, thresholds of 0.0175 (−17.57 dB) and 0.02 (−16.99 dB) had the highest kappa values for Paths 135 and 62, respectively. Again, for the sake of simplicity and consistency, a threshold of 0.02 (−16.99 dB) was selected for both paths, leading to overall accuracies of 77.3% and 78.9%. The 0.02 (−16.99 dB) threshold enabled us to approximately detect 74% of the freezing days and 80% of the thawed days, on average.
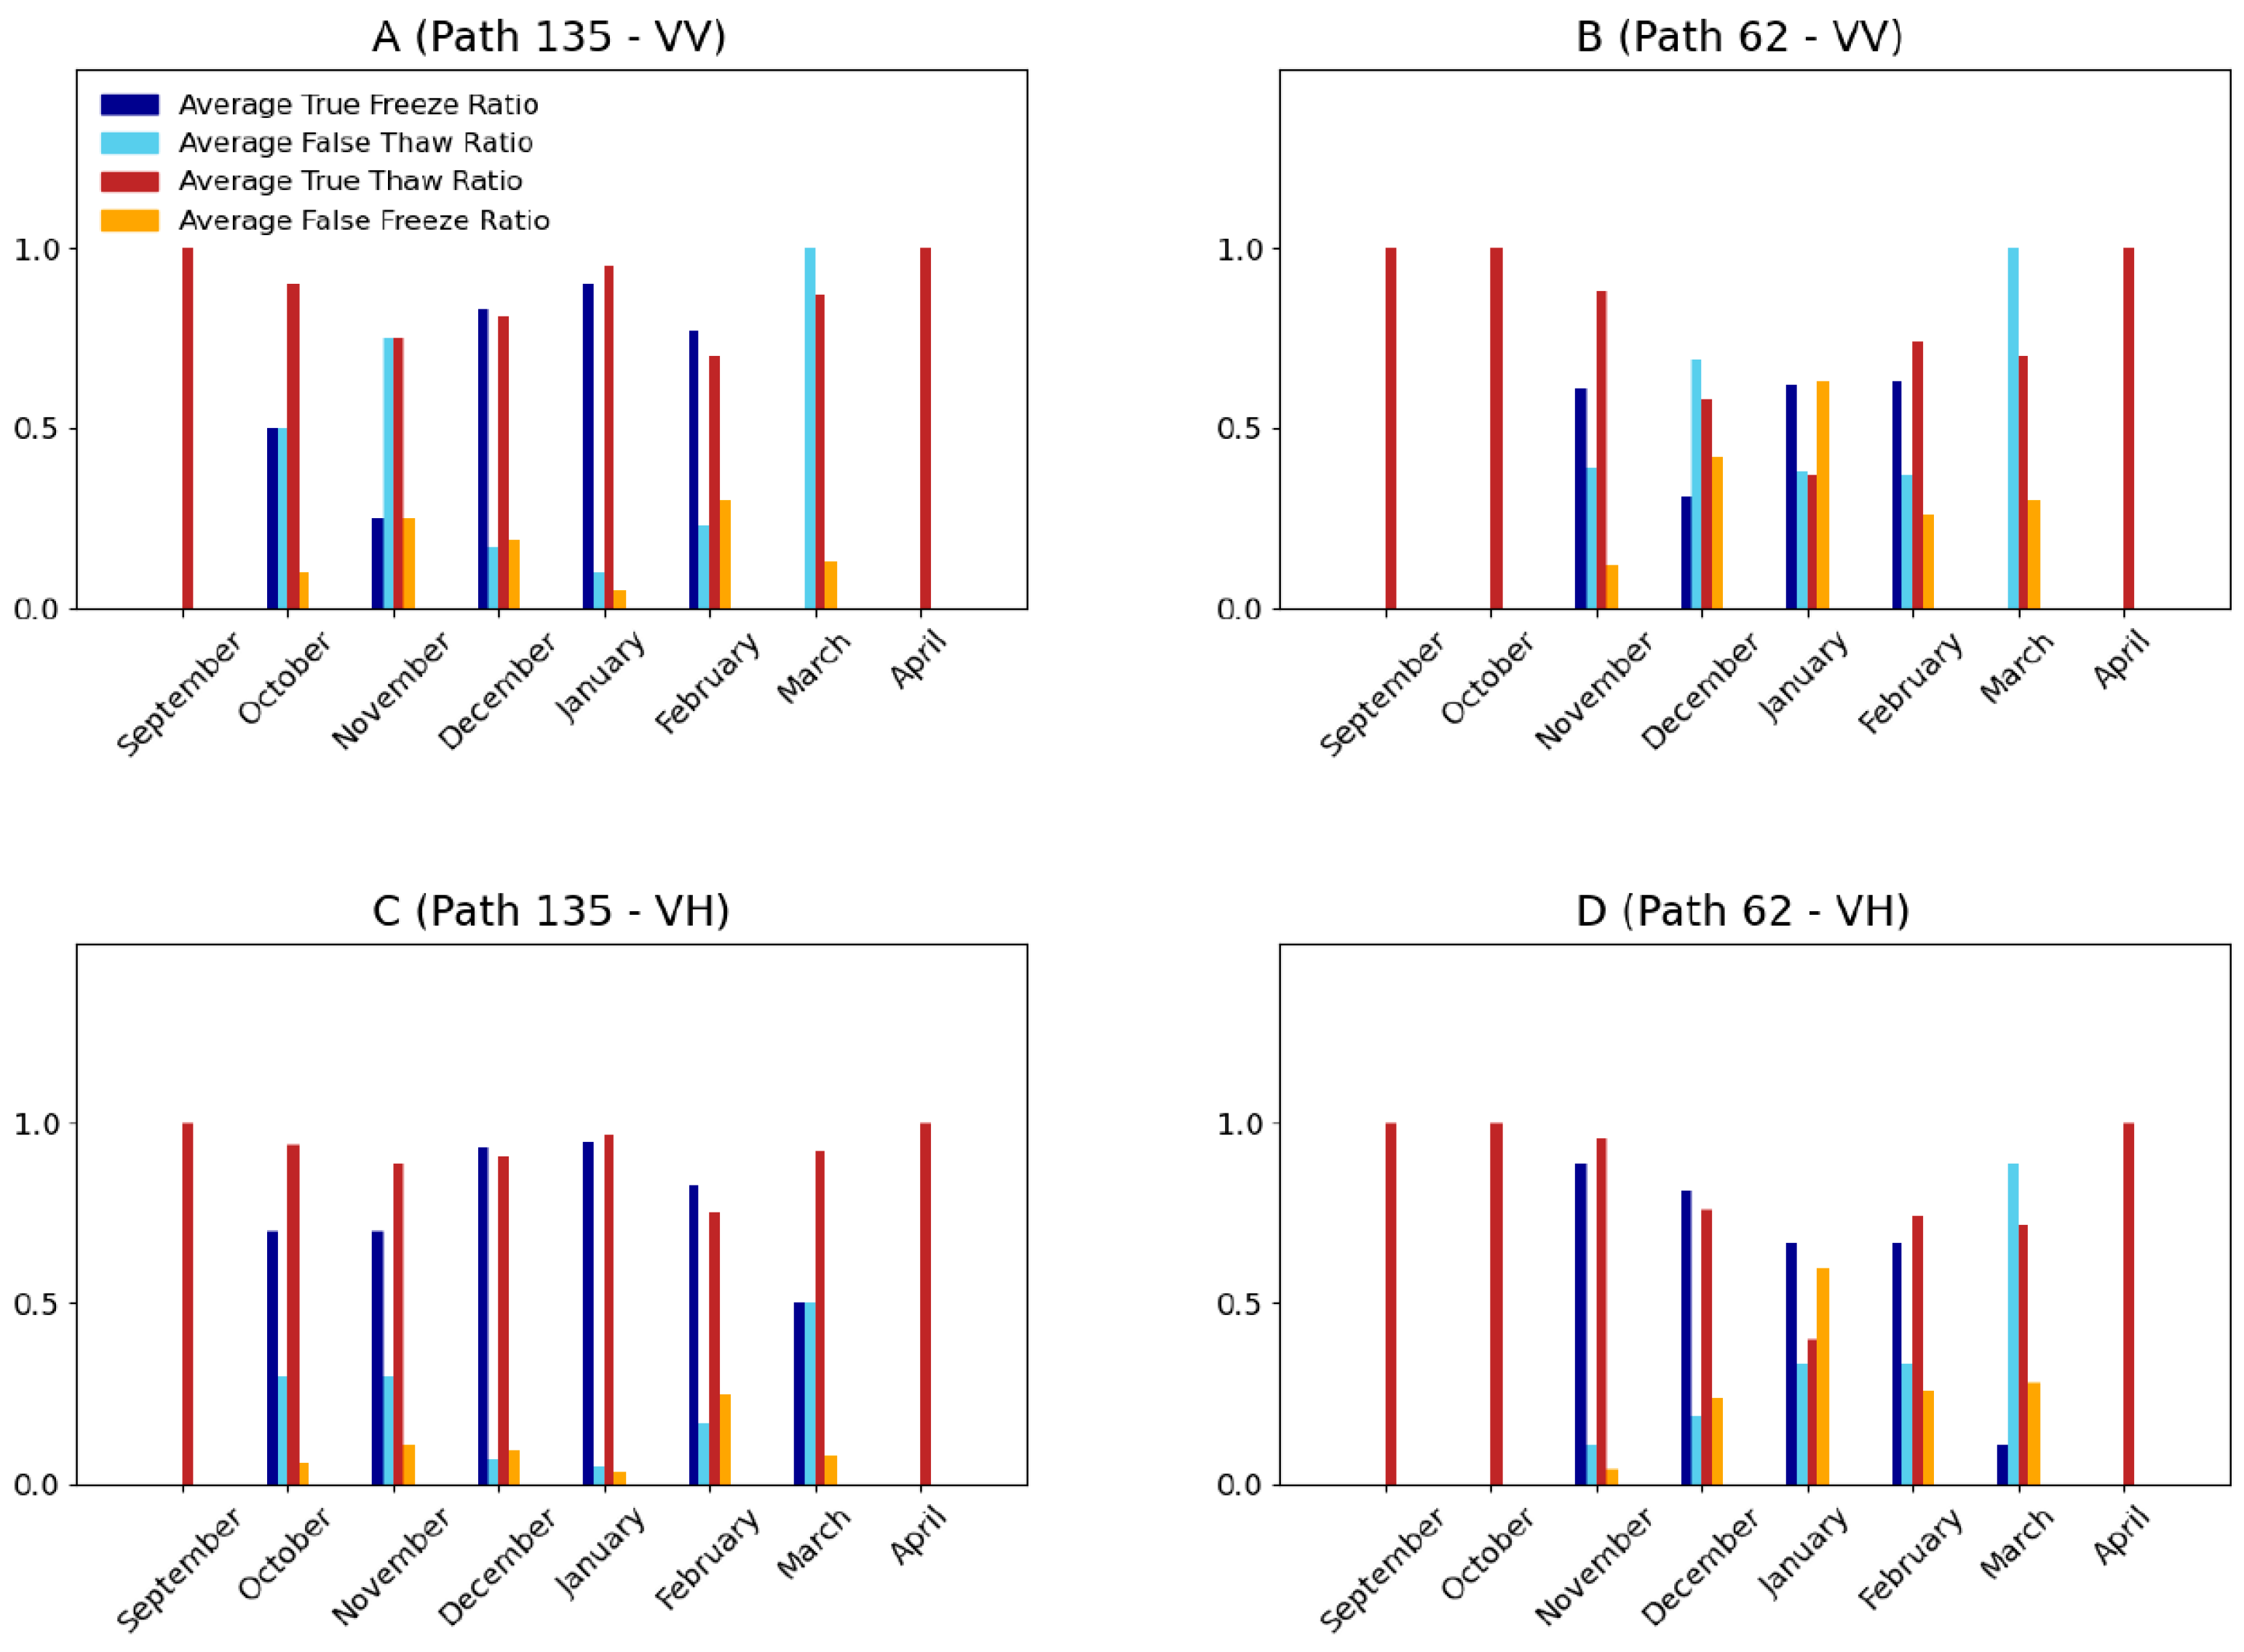
In general, the GTA reliably detected more than 85% of thawed states at the beginning of the cold season, months of October and November (Figure A4). During these months, VH and VV measurements for each path exhibited similar behavior in terms of correct thaw detection. The false freeze retrievals, particularly from Path 62, were higher during the mid-winter period (January and February), accounting for an average of approximately 35% of the thawed events. During the initial months of the cold season, October and November, VH backscatters were able to successfully identify more than 75% of freeze events. This rate notably declined for VV polarized signals, yielding an average freeze retrieval rate of 45%, on average for both paths. In the middle of the winter, a high ratio of true freeze retrieval to false thaw retrieval was achieved, except for VV signals from Path 62 in December. During December, January, and February, VV backscatters from Path 135 reliably captured over 80% of freeze events, while VV observations from Path 62 were less successful, particularly in December when the true freeze retrievals accounted for only 32% of freeze events in this month. Over these cold months, the number of correctly retrieved frozen days from VH data was, on average, more than 12 times higher than the number of undetected frozen days for Path 135 signals. This ratio was smaller for VH signals of Path 62, especially in January and February when nearly one-third of frozen days were erroneously retrieved as thawed.
During the transition from winter to spring in March, the false thaw retrievals equaled or surpassed the correctly detected frozen days. In March, none of the freezing events were detected by VV backscatters. Although VH signals also demonstrated poor performance, they successfully retrieved approximately 30% of freeze events, averaged over both paths. The monthly analysis indicated that VH outperformed VV signals in freeze detection. However, for thaw retrieval, the disparity in performance between VH and VV signals diminished.
Overall, GTA demonstrated higher performance when applied to VH measurements, leading to an overall average accuracy of 78%. It was generally more successful at detecting observed thaw events in shoulder periods. In contrast, its true freeze ratios were greater than the true thaw ratios in the middle of winter.

3.4. Impact of Air Temperature Threshold on FT Classification Accuracy

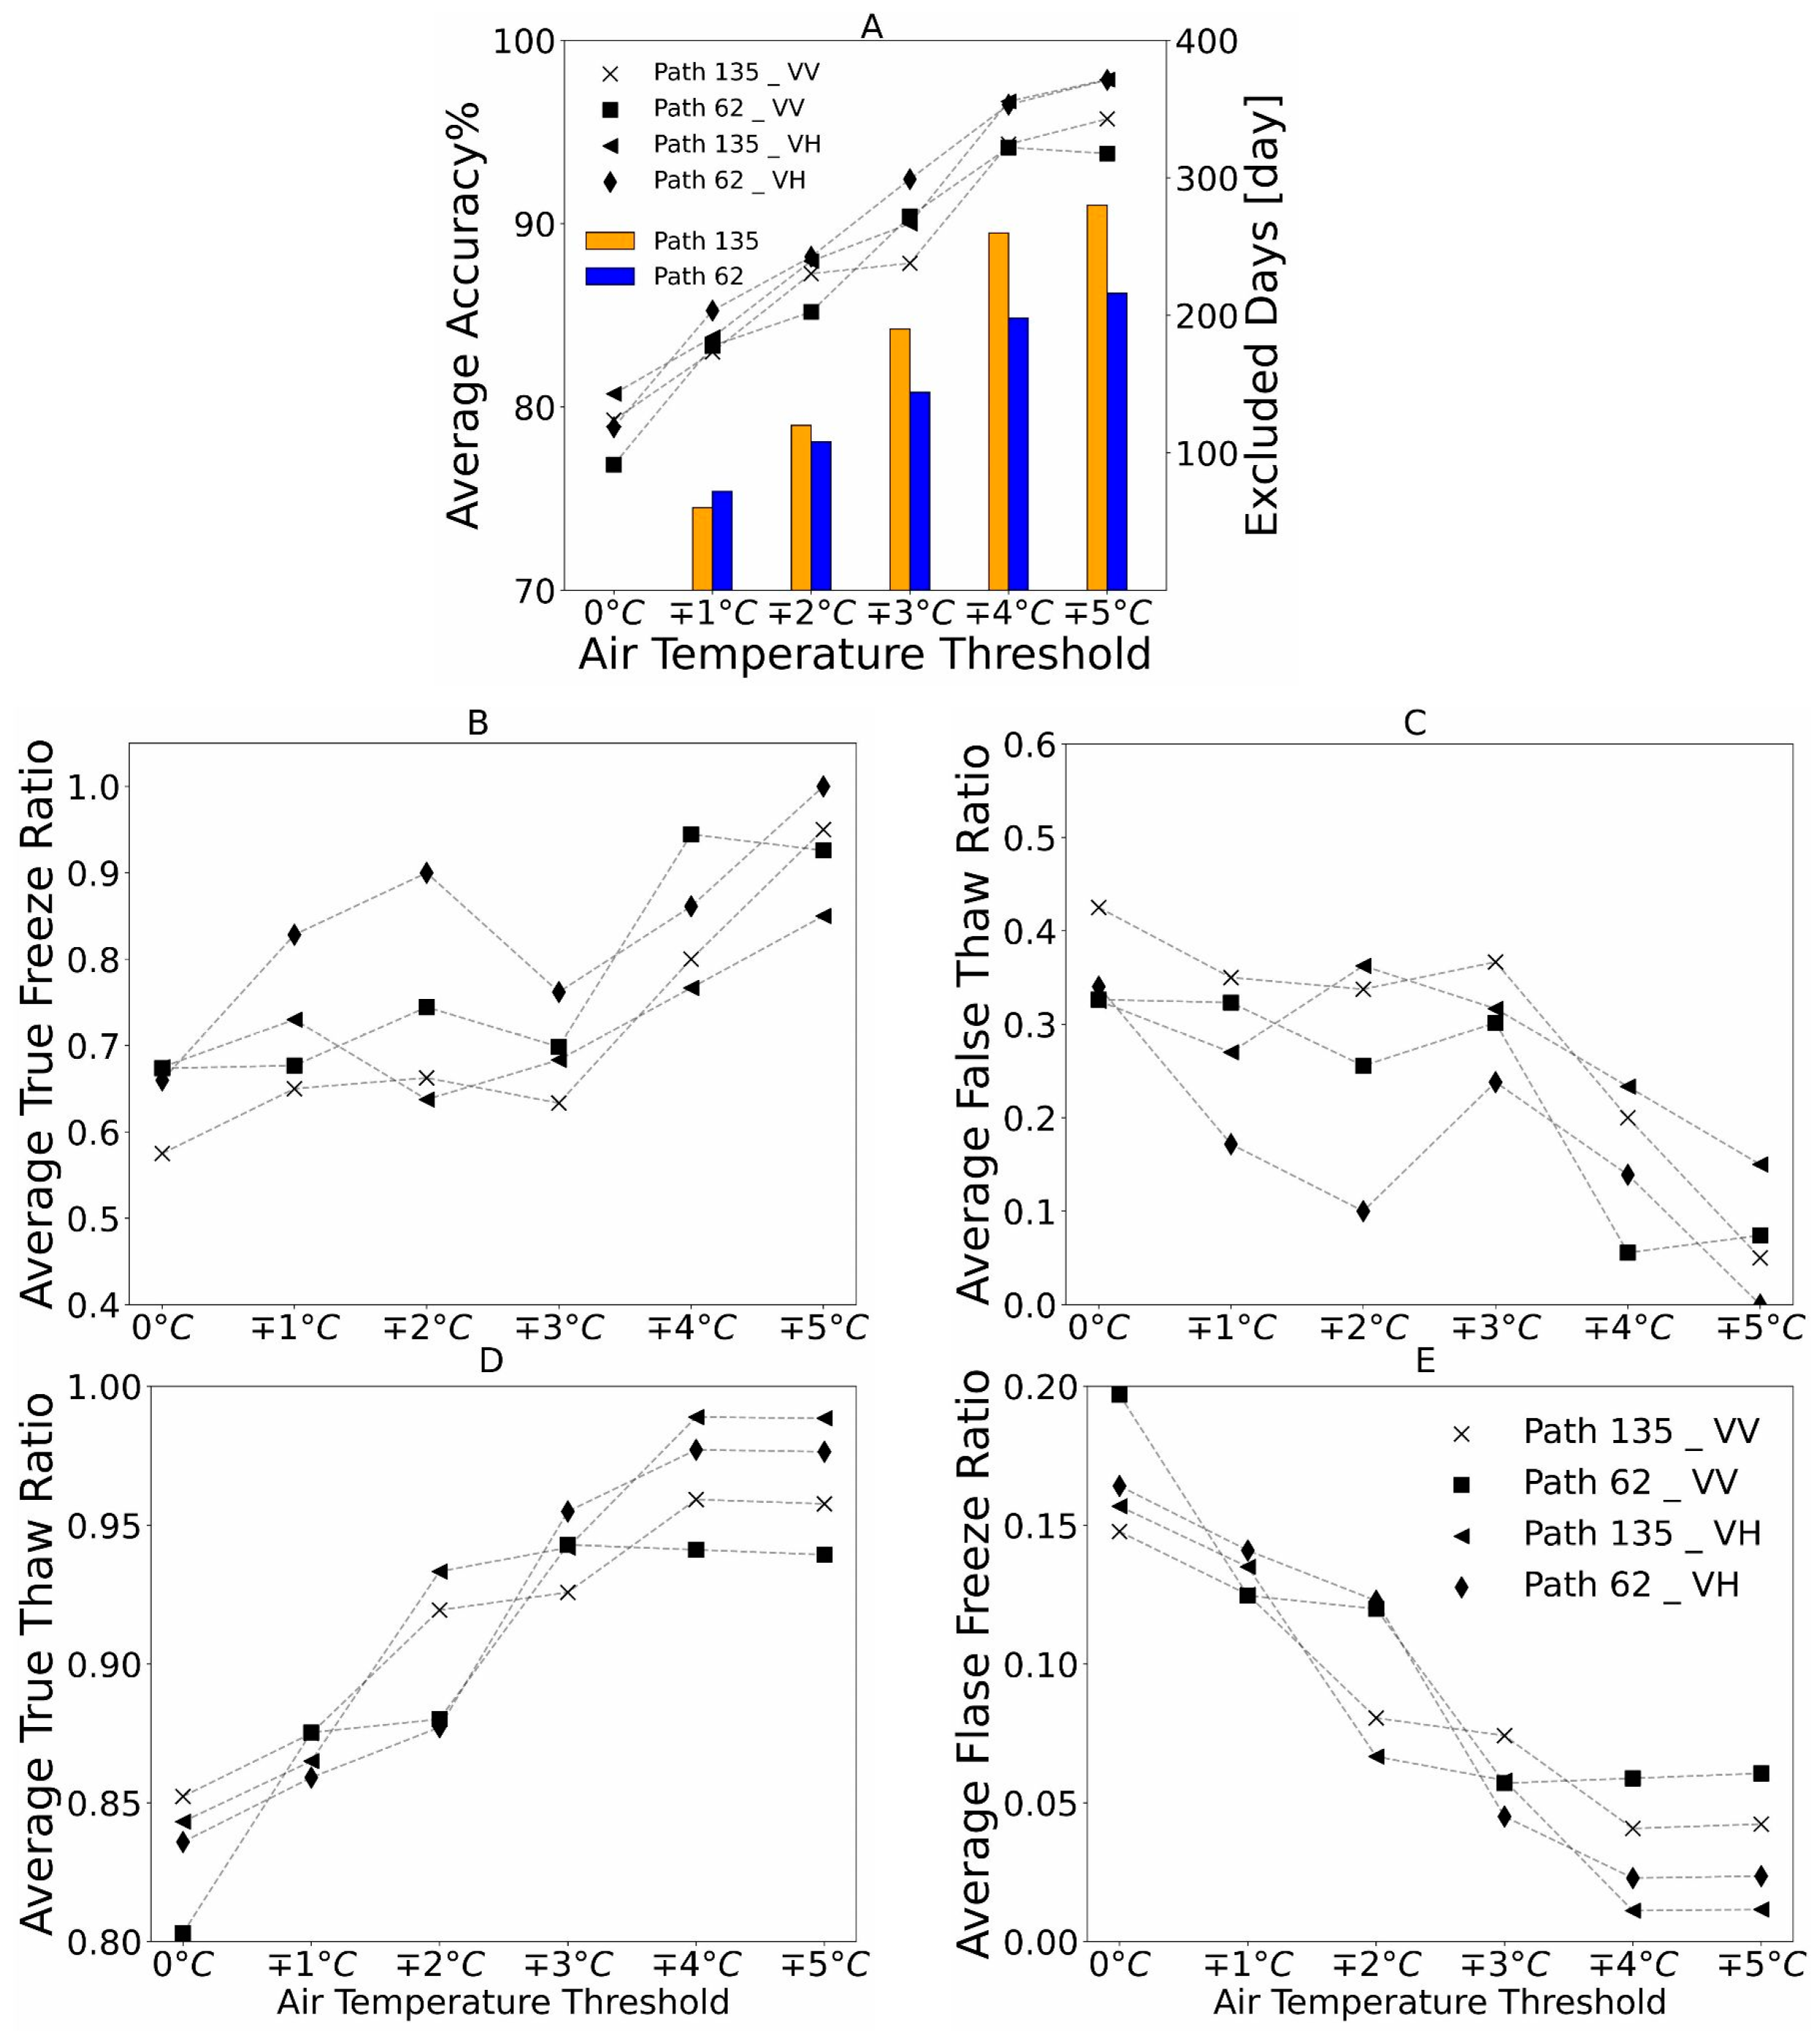
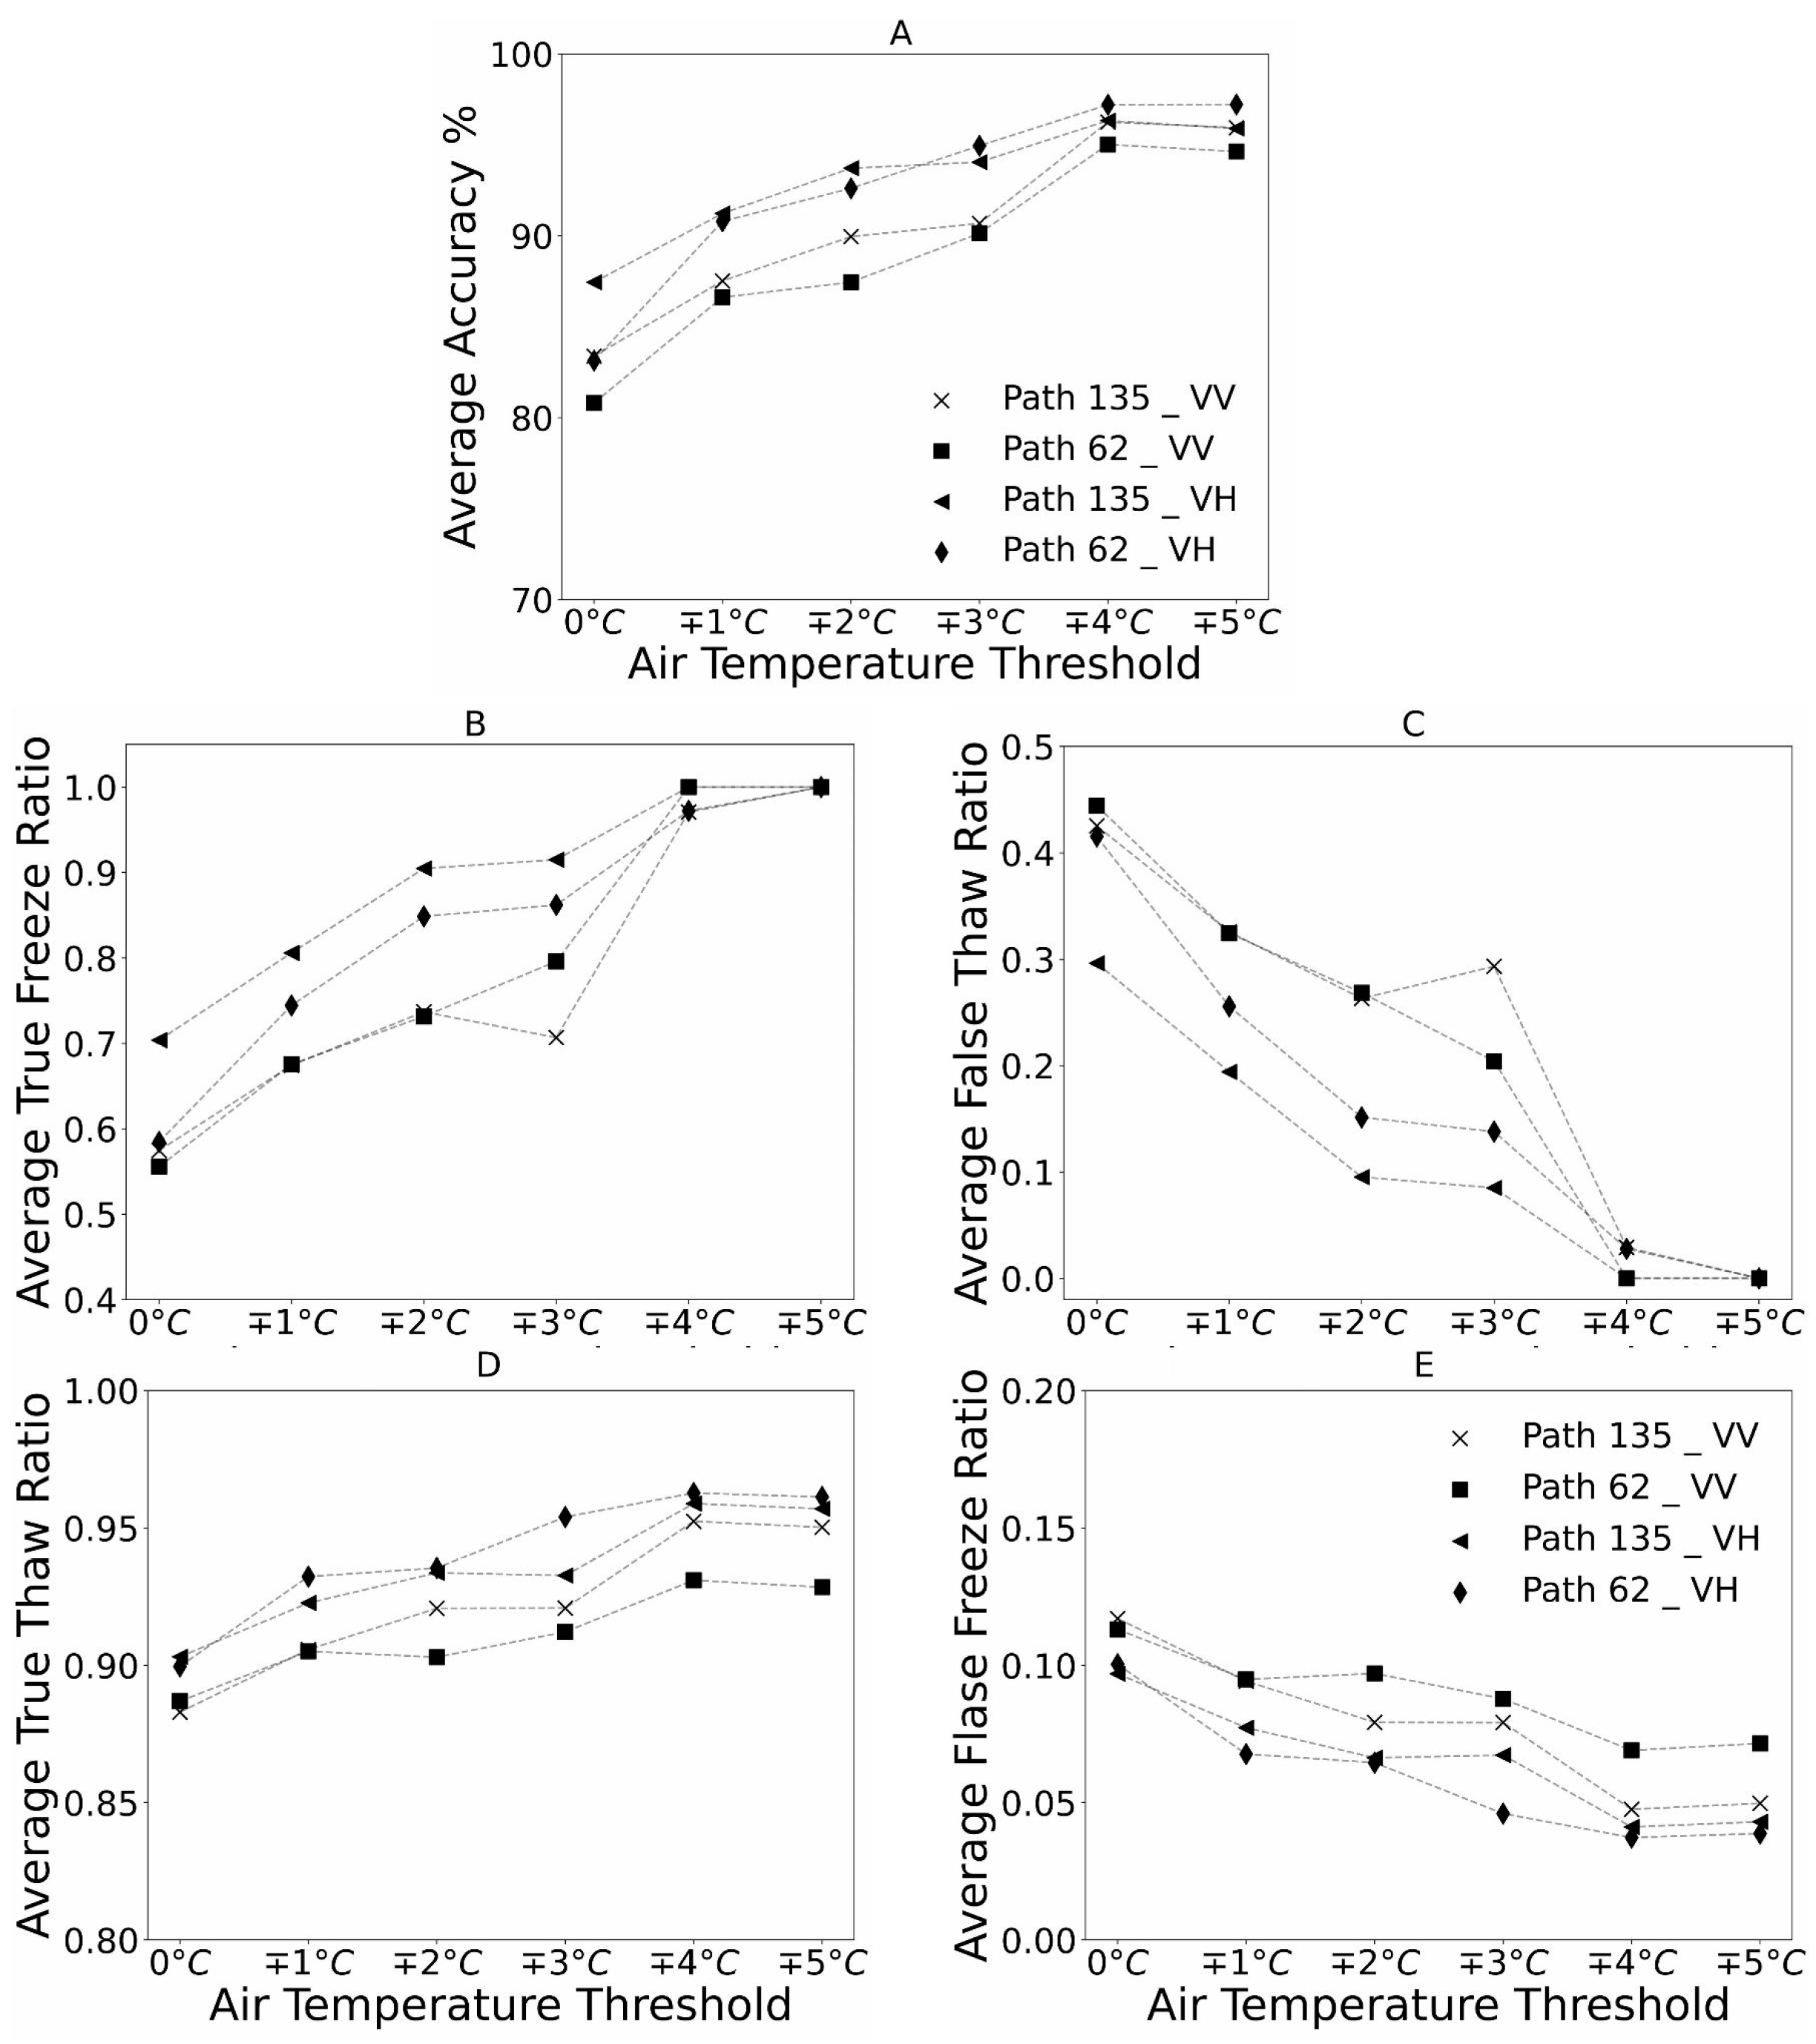
To investigate the impact of the FT threshold used for air temperature measurements (Tth,air in Equation (1)), various temperature thresholds (±5 °C, ±4 °C, ±3 °C, ±2 °C, ±1 °C) were utilized instead of 0 °C. Figure 8 and Figure 9 illustrate that the overall accuracy of FT retrieval using the GTA and STA improved as the absolute value of the air temperature threshold used to define the FT state increased from 0 °C to 5 °C. While GTA provided a comparable performance to STA even with a threshold of 0 °C, it achieved the same level of accuracy as STA when targeting more extreme FT events (i.e., using Tth,air with higher absolute values). The average accuracy, which was 77% for GTA and 84% for STA with a Tth,air of 0 °C, increased to 96% for both approaches when the threshold was set to 5 °C.
The rise in overall accuracy was primarily achieved by excluding radar observations that their coinciding air temperatures fell within the range of [−Tth,air, Tth,air] (presented by yellow and blue bars in Figure 8A). For instance, 60 radar observations from Path 135 were excluded from analysis when +1 °C and −1 °C were employed to define thaw and freeze states, respectively, which accounts for 11% of backscatter observations over the study period from that path. The number of observations from Paths 135 and 62 was reduced by 50% and 40%, respectively, by employing ±5 °C as the air temperature threshold. This exclusion of radar signals coinciding with an ‘ambivalent’ temperature range (i.e., within a small range of 0 °C) led to a notable reduction in erroneous FT retrievals, particularly false thaw retrievals (Figure 8C,E and Figure 9C,E). For example, increasing the absolute value of the Tth,air from 0 °C to 5 °C reduced the ratio of false thaw retrievals of GTA from 35% to less than 7%, on average for both VH and VV polarized data across Paths 135 and 62.

3.5. Coherence Approach

Figure 10 shows the distribution of the coherence values obtained for the entire study area during the winters between 2020 and 2022. Coherences ranged from 0.01 to 0.95. The distribution of coherence values that coincided with an FT change between the corresponding image pairs (the blue bars in Figure 10) did not reveal a consistent relationship with the ground surface FT states. For Path 135, only 30% of the FT changes were associated with low coherence values (<0.4). The coherences remained relatively high (≥0.7) approximately half of the time when a change occurred in the surface FT state. The distribution of Path 62’s coherence was different from Path 135. Path 62’s low coherences appeared to be more clearly associated with FT state changes. For this path, 48% of FT events had coherences less than 0.4. Time series of coherence, air temperature, and snow cover fraction show a weak association of coherence and change in FT status (Figure 5 and Figure 6). For example, coherence stayed high when a relatively mild FT transition occurred between a pair of images if at least one image was acquired when the air temperature was close to freezing, fluctuating by approximately ±3 °C. One example of such a condition occurred for the 10 and 22 January 2021 image pair. All Path 135’s pixels had a coherence higher than 0.87 but air temperatures of −2.3 °C and 2.4 °C on 10 and 22 January 2021, respectively, suggest that there was an FT transition. Another example is the 18 and 30 November 2021 pair which had a coherence greater than 0.7 and Tair values of −0.1 °C and 17.3°, respectively. Here the high coherence value could be explained by the presence of some liquid water content on the 18th due to its very mild freezing temperature and the impact of natural freezing point depression in soils [65].
Another type of problematic pair had the same FT state but low coherences. We found that approximately 80% of the low coherences of Path 135 did not coincide with an FT change (presented by white bars in Figure 10). While a similar discrepancy was found for Path 62, low coherence values tended to correspond to an FT change considerably more frequently (~60% of the time). Here we observed changes in the snow on/off condition and rainfall events might cause decorrelation in the absence of an FT transition. For example, while the 22 January 2021 and 3 February 2021 image pair from Path 135 had the same FT state based on air temperatures of 2.4 °C and 0.8 °C, respectively, the average coherence over the study area was only 0.23. The change in snow coverage could explain this lack of correlation as the snow coverage was 0% at the time of the first acquisition and 100% at the time of the second acquisition.

4. Discussion

The results of this study highlight the potential of Sentinel-1 C-band SAR images for retrieving the FT state of soil using STA and GTA approaches with approximately 80% overall accuracy over our region of interest. The STA and GTA approached SMAP-level accuracy with a 30 m spatial resolution, offering a unique opportunity to study the heterogeneity of FT processes with comparatively higher spatial resolution.
Despite the great potential, there are still some challenges in the application of SAR for reliable FT detection. Firstly, one of the main drawbacks of the current satellite SAR sensors is their low temporal resolution. Podest et al. [48] recommended a 1–3-day repeat cycle to accurately characterize FT processes during thaw seasons in boreal regions. In the ephemeral regions, besides the spring transitions, the soil state could rapidly change through the course of winter [38], requiring an even shorter revisit frequency. Secondly, the presence of wet snow introduces a potential source of error in FT retrieval using SAR imagery. While radar signals can penetrate the snowpack to a certain depth, the behavior of wet and dry snow differs due to the varying penetration characteristics of the SAR signal [66]. In the case of the C-band, dry snow exhibits low absorption or scattering of the signal, enabling a potential penetration depth of around 20 cm when observing dry snow [67]. However, as the snowpack begins to melt, the dielectric properties of the snowpack undergo considerable changes, resulting in an increased absorption and reflection of the signal by wet snow [68]. Consequently, the penetration depth decreases, only reaching approximately 3 cm, with backscattering reflection from the liquid water becoming the dominant process [67,69]. When surface refreezing occurs, an increase in backscattering is expected due to the volumetric scattering of the coarse snow grains formed during the refreezing process [70]. Such an increase in backscatter coefficients due to re-frozen wet snow can lead to a false thaw detection. Therefore, the presence of wet snow has the potential to mask the backscattering from the underlying soil and present challenges in FT detection.
The STA demonstrated a higher overall performance in comparison to the general threshold algorithm. STA has been commonly applied to much coarser passive microwave data (tens of kilometers), or passive/active merged products. However, for active radar data (tens of meters or finer), its implementation over identical extents is far more costly, involving ~106 times more pixels. Moreover, there are multiple factors that potentially impact the performance of the seasonal approach which need to be acknowledged. One potential source of error in the STA is large precipitation events occurring before the satellite acquisition, particularly during the thaw reference period. Such precipitation can lead to an increase in soil moisture, resulting in a spike in the observed backscatter coefficient. It has been shown that the radar backscattering coefficient increases with soil moisture, either linearly or exponentially [20,71]. The elevated values of the backscatter signal due to precipitation could subsequently lead to a higher thaw reference value, potentially causing false freeze detections later.
Additional potential sources of error in the STA are the changes in vegetation structure, density, and water content between the thaw and freeze reference periods. These alterations in vegetation characteristics can affect the scattering, absorption, and penetration of radar signals, leading to discrepancies in backscatter coefficients observed during the reference periods. These variations are not related to changes in the soil state, posing a challenge to the fundamental assumption underlying the seasonal approach. To minimize the interference of vegetation in thaw reference backscatters, specifically at the mixed pixels, in this study, the STA utilized the mean of the five highest backscatters observed in September throughout the study period. At intermediate wavelengths such as the C-band, radar signals interact with the vegetation layer above a soil surface which impacts the backscatters from the soil surface [72]. Although the degree of interaction with the vegetation varies with the incidence angle and the polarization [73,74], vegetation characteristics also play a crucial role. As highlighted by Schmugge et al. [75], a sufficiently thick vegetation layer can obstruct the observation of the soil surface entirely. In addition to geometry and density, the water content of the vegetation also impacts backscatters from the underlying ground surface. Brown et al. [76] showed that C-band signals can penetrate drier vegetation more effectively than wet vegetation.
Although the STA applied in this study is similar to the common STA used in passive imagery in terms of the main rationale and assumption, the sensitivity of radar backscatter response to high precipitation and fractional open water is greater than brightness temperature for microwave bands and resulted in a different range of the scale factor. In passive microwave remote sensing, the highest thaw reference values are observed during the summer period due to the direct relationship between the brightness temperatures and the physical temperature of the soil. This implies that the seasonal scale factor in the common STA ranges from approximately 0 to 1 where a scale factor of 1 means the observation at the given time is the same as the thaw reference. However, as shown in Section 3.1, the scale factor in STA could take values much higher than 1 (less than 4). Investigating the dates when the scale factors over the study area were higher than 1 showed that in approximately 80% of these cases, there was precipitation on the day of acquisition or a day or even two days prior. This finding could raise a question on the impact of these high-scale factors on the optimized threshold as these anomalies were a consequence of the temporary increase in soil moisture. More investigation is needed in this case to study how excluding these anomalies impacts the performance of the STA approach. It should also be mentioned that the available ancillary data was not adequate to identify the root causes of high-scale factors (>1) in the 20% of cases when there was not a rainfall event involved.
In this study, the STA utilized threshold values that were individually optimized for each pixel. While this pixel-specific optimization improved the overall performance, it has higher computational costs. On average for both paths and polarization, the overall accuracy of the optimized threshold and the corresponding accuracy of the common threshold of 0.5 differed by less than 3%. Based on the marginal improvement achieved by optimizing the threshold for each pixel, using a common threshold value of 0.5 may suffice for soil freeze-thaw detection in the study area.
Our second approach, the general threshold algorithm, aimed to determine soil FT state using a single threshold, applicable to the entire study area, thereby facilitating the implementation process. This threshold would reflect the local surface characteristics including composition, structure, and roughness of the surface as well as signal characteristics such as frequency and polarization. It is straightforward to determine specific thresholds for other landscapes with different crop types or agricultural management systems owing to GTA’s simplicity and low computational demands. This makes the GTA readily applicable to various land cover types beyond our study area.
In this study, although the satellite observations from both paths covered the same region, there were inconsistencies in the paths’ optimal thresholds of GTA. The two studied paths’ images were acquired on different dates, and they only captured a partial slice of the overall surface processes and FT dynamics occurring through the entire course of the season. Consequently, the discrepancies in meteorological conditions coinciding with the acquisitions from different paths could have implications for the performance of the GTA. The errors associated with radiometric and terrain corrections may be another contributing factor to such differences in the paths’ optimal thresholds. It should be acknowledged that even state-of-the-art correction methods are not error-free and so differences in viewing geometries of paths may explain some inconsistencies. Nonetheless, to maintain simplicity for the GTA, a single threshold was chosen for each polarization, independent of the specific path (0.08 for VV and 0.02 for VH). By doing so, it provided a practical and efficient means of FT detection across the study area with an approximately 80% overall accuracy. It is worth acknowledging that the use of a similar threshold for both paths resulted in a minor decrease in the overall accuracy (averaging less than 4%). This suggests that employing a common threshold value, regardless of the path, still yields reasonably accurate results, which may justify the simplicity and ease of implementation.
Although the threshold of 0 °C is commonly used in the literature to detect FT events from in-situ air temperature observations as the ground truth [77,78,79], we found that it could have implications for the performance of the FT retrieval algorithms, specifically GTA. Using the air temperature thresholds with higher absolute values improved the overall accuracy of both GTA and STA yet resulted in data loss because ‘uncertain’ data within ±T°C were omitted. However, this approach limits the application of the retrieval algorithms to the more extreme events with more obvious and distinguishable differences in dielectric constant and radar backscatters. As a result, FT detection approaches became less applicable during transition seasons when milder FT events occurred. For instance, when using thresholds larger than ±3 °C, less than 40 freeze events (all of which took place in the months of January and February) remained in the datasets. The trade-off between reduction in data and enhanced accuracy seems reasonable for thresholds of ±1 °C or ±2 °C. In these cases, data reduction was distributed throughout the entire winter, rendering the algorithm still applicable for FT detection during the entire winter period. This finding highlights the possibility of enhancing the overall performance of the GTA by focusing on more severe freeze-thaw events, depending on the application and meteorological characteristics of the study area.
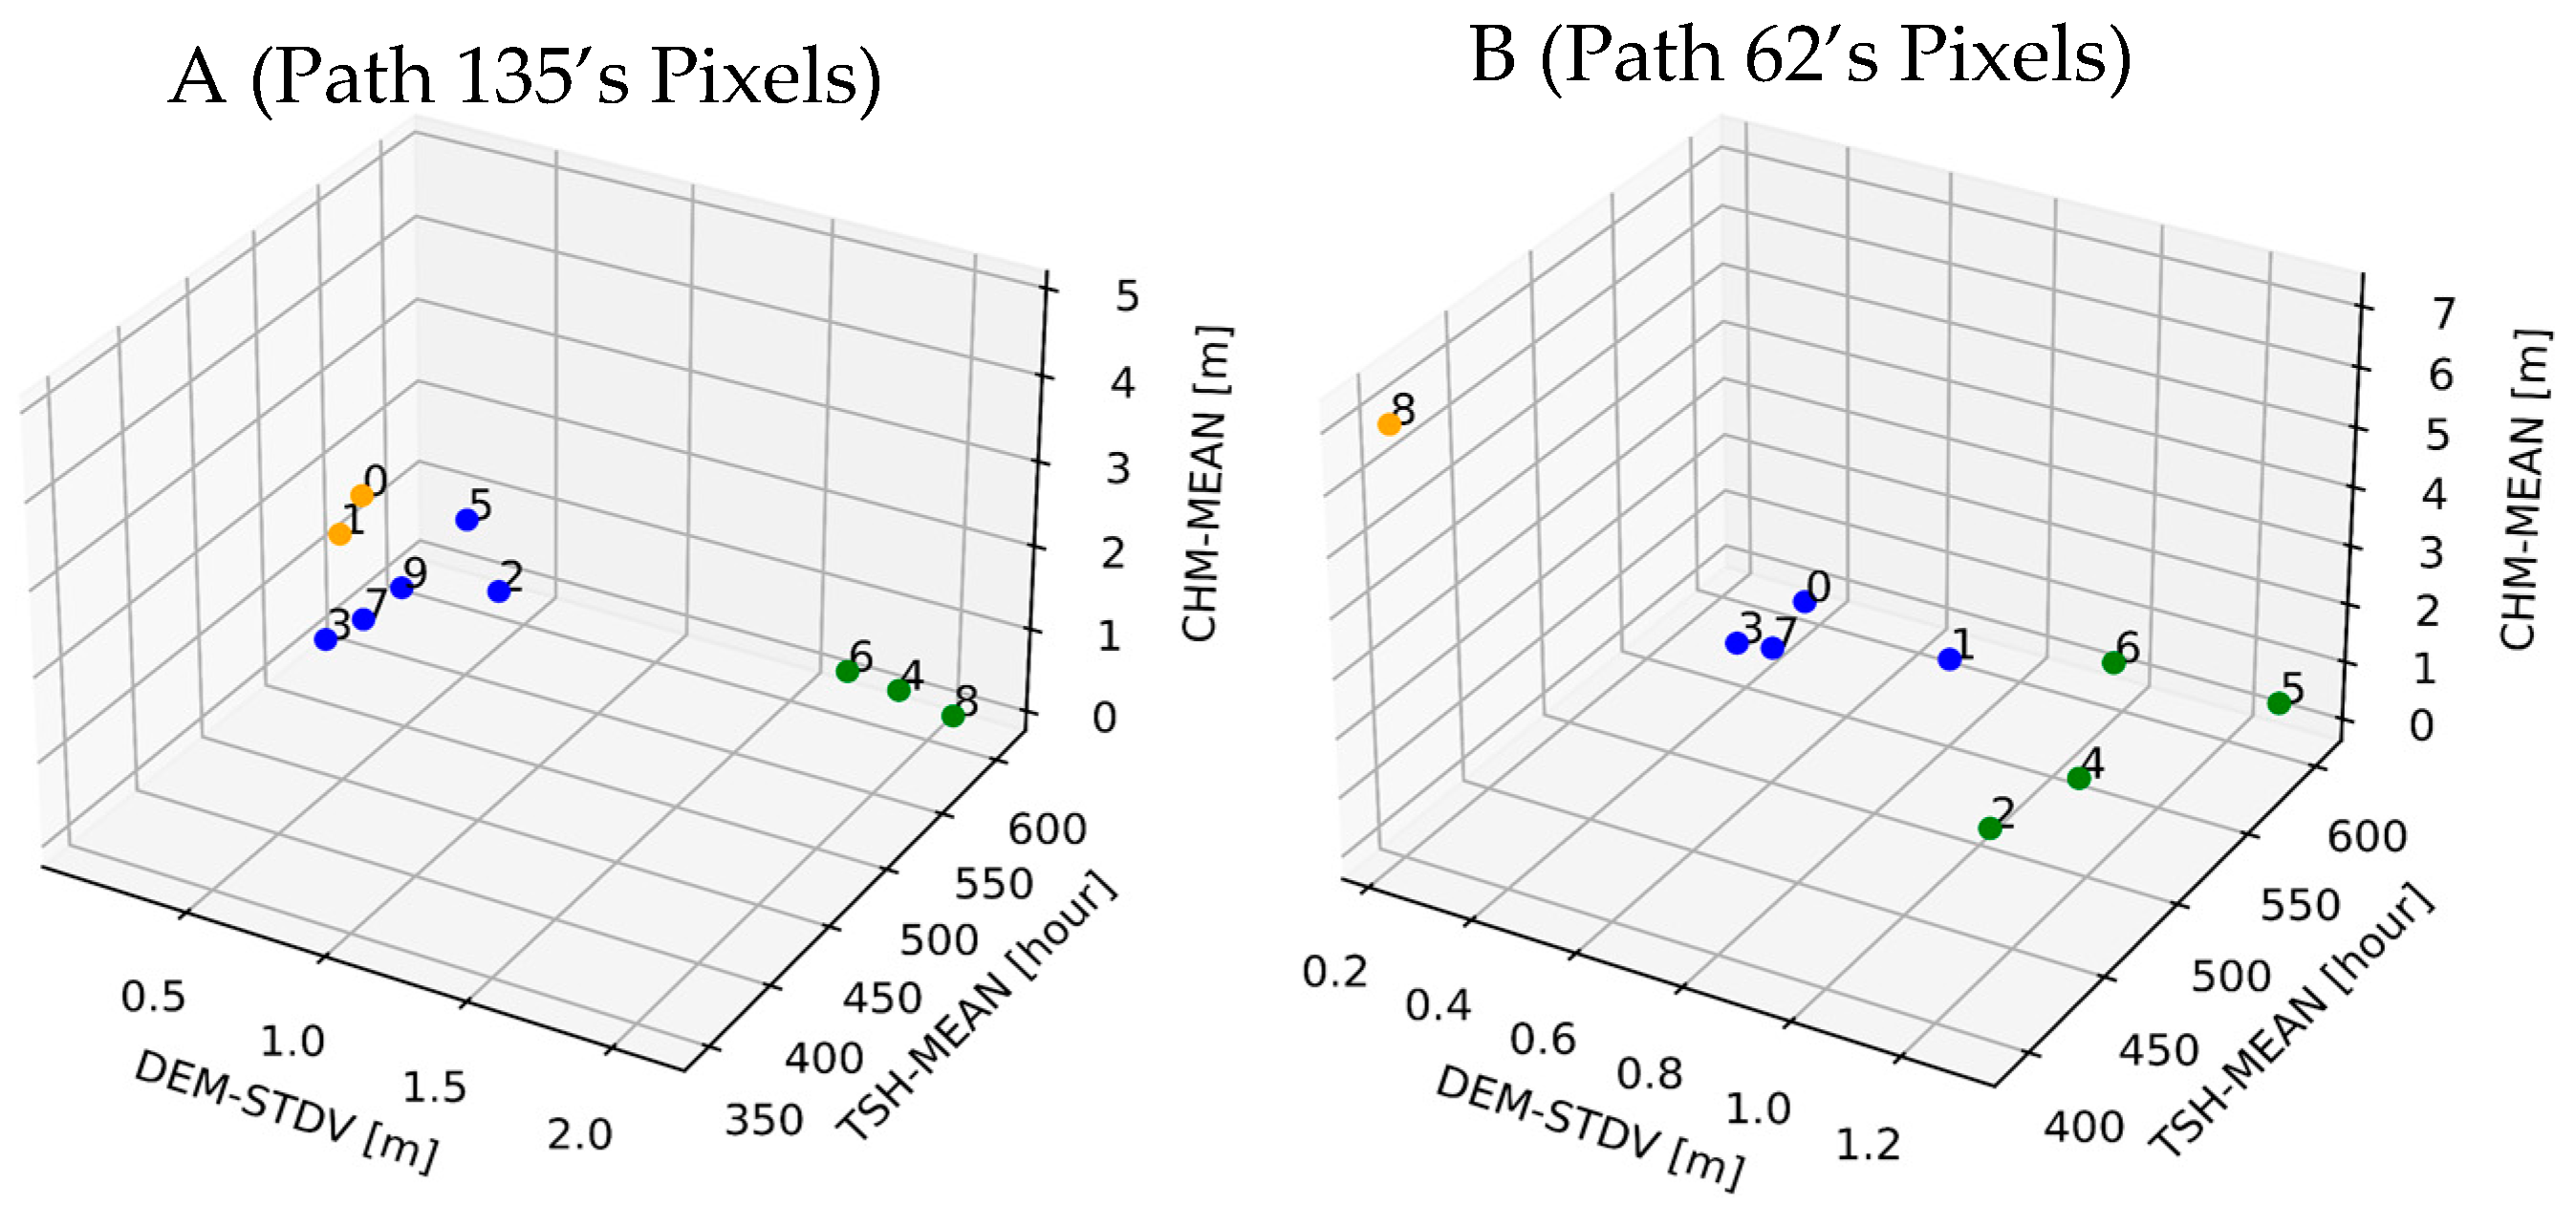
Although the GTA aims to reduce the computational cost of FT detection by applying one threshold over the entire study area, the spatial variability in surface characteristics could introduce errors in interpreting the SAR backscatters. Our K-means clustering analysis using the standard deviation of DEM (DEM-STDV), mean canopy height (CHM-MEAN), and mean total sun hour (TSH-MEAN) indicated that there were three clusters over the study area for each path (Figure A5). The DEM-STDV and CHM-MEAN can be considered as measures that, to some extent, may reflect surface roughness. At the cluster of pixels with higher canopy height, the vegetation characteristics and changes may contribute more to the scattering of the SAR signal compared to the soil. Also, the pixels with more variation in DEM may scatter SAR signals not only due to soil state but also small-scale heterogeneity in their surface. Yet, GTA does not differentiate these clusters from the rest and assesses backscatter from the entire area collectively. Hence, while the GTA’s implementation offers simplicity, such sources of errors should be acknowledged while using this method.
Overall, the higher ratios of false thaw retrievals compared to the ratios of false freeze obtained for both general and seasonal approaches, especially at the end of the winter and early spring, imply that the two studied FT classifiers exhibited a bias toward the thaw events. While further assessment is required to identify the causes, the study period’s higher number of thawed than frozen dates may explain why there was a tendency to detect frozen as thawed rather than the other way around. Out of the total 560 RCSs on Path 135 and 540 RCSs on Path 62, only 120 and 144 of them, respectively, were acquired on days with air temperatures below 0 °C. Such an imbalanced dataset can adversely impact the performance of the retrieval algorithms and force a tendency to retrieve the thaw state more frequently (higher false thaw ratios compared to false freeze ratios), leading to a reduced ability to accurately predict freeze events (lower true freeze ratios compared to true thaw ratios). In this situation, a high overall accuracy metric could be misleading because even an FT detection algorithm that detects every day as thawed can achieve a high accuracy [13].
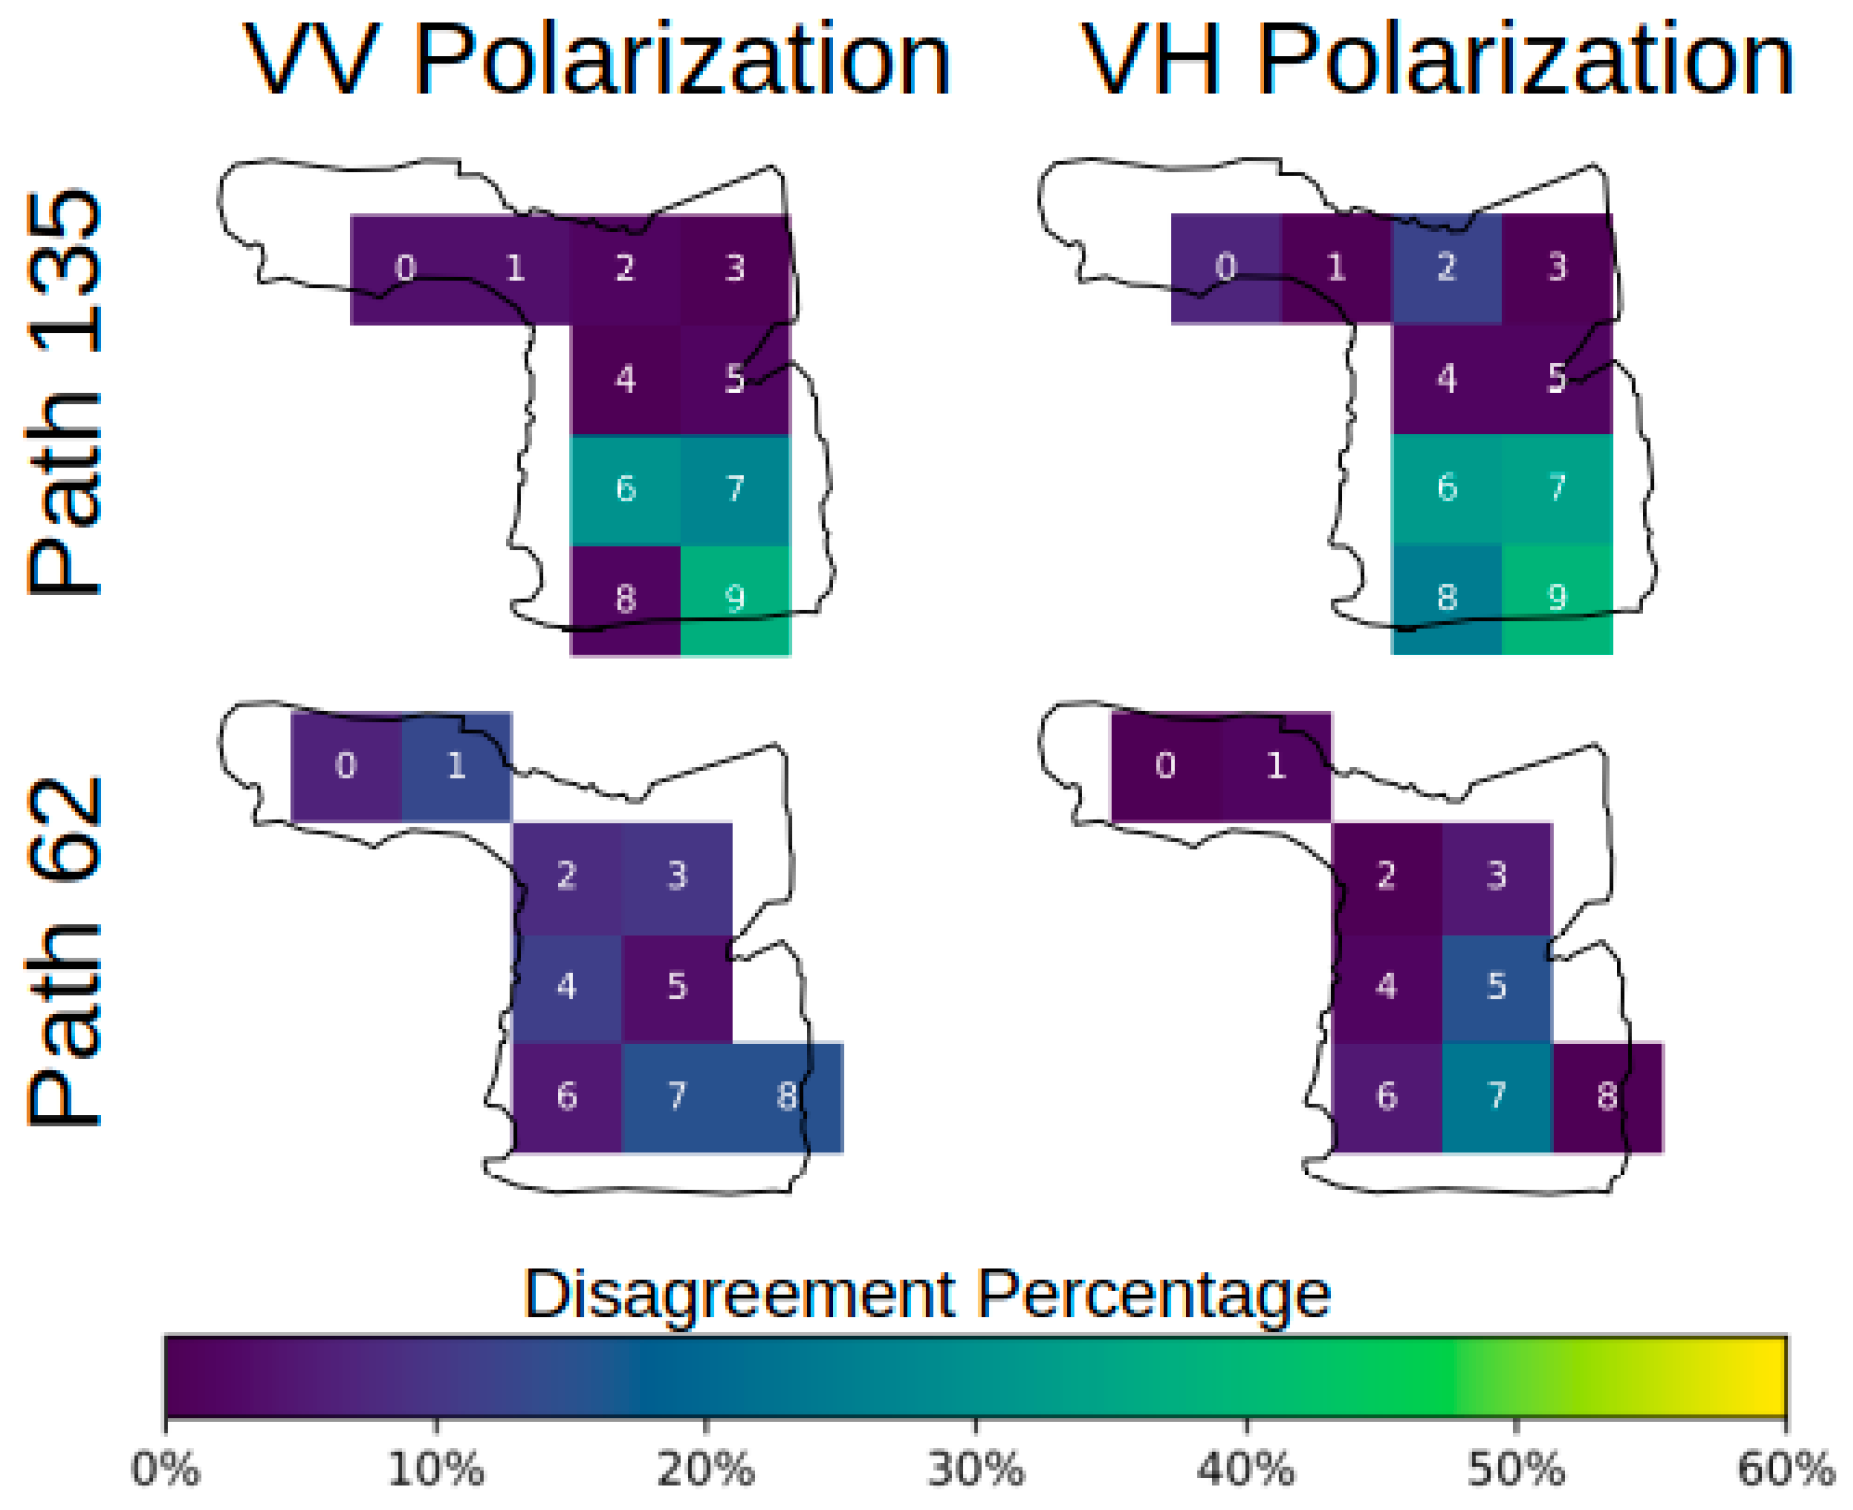
Comparison of the FT detection approaches applied in this study against each other showed that there is a generally good agreement between the STA and GTA (Figure A6). Generally, there was less than 30% disagreement between STA and GTA across the study area. The average disagreement percentages for both polarizations were lower for Path 62. Pixels 6, 7, and 9 along Path 135 and pixel 7 along Path 62 exhibited the highest disagreement between STA and GTA (more than 25%). Outside of these pixels, the disagreement percentages generally did not exceed 12%. Further assessment of the dates when disagreement happened between these two methods showed that in most cases either the backscatter value in the GTA or the scale factor value in the STA were very close to their thresholds. So, it can be concluded that the nature of binary classification used in this study is a contributor to the disagreement in such cases. If the methods could consider a transitional state (in addition to the frozen and thawed states) when their predictors are in a pre-defined range around the thresholds, their performance would possibly be more similar. In order to understand the spatial variability of disagreement between STA and GTA, high-resolution LIDAR-derived variables describing the surface characteristics were used (Figure 1). Such surface characteristics were considered for analysis due to their potential impact on the spatial variability of backscatter values across this study, even when the pixels have the same FT state. However, our analysis was not conclusive and did not lead to a generic flag to help attribute the differences between STA and GTA. More detailed data such as the surface temperature of snowpack on acquisition dates as well as the structure of vegetation are recommended to identify the contributors to differences between STA and GTA.
While the general and seasonal threshold algorithms proved their efficiency in FT detection, our analysis did not support a consistent relationship between interferometric coherence and ground surface FT states, contrary to the study of Zhou et al. [28]. They used the fourth-order Fourier representation of coherence and detected the onset of freezing over the Qinghai-Tibet Plateau (QTP) region within 12 days of the observed onset. Comparing the study area of Zhou et al. [28] and our region of interest suggests a potential explanation for the disagreement in our results regarding the application of coherence for FT retrievals. Zhou et al.’s study area [28] is a continuous permafrost zone where after the initial freezing event, the soil stays frozen through the whole winter. Although the snowpack is shallow (the maximum snow depth not exceeding 3.5 cm), it is persistent during the entire winter. The soil at QTP seems to be confidently frozen for much of the winter season, usually in excess of −5 °C. In this environment with cold and dry winters, a more notable difference between the SAR acquisitions at frozen and thawed conditions (lower coherence) is expected. In contrast, our study area experiences a relatively mild winter, featuring frequent but mild freeze/thaw events and low-persistent snowpack. Soil temperature remains in an isothermal condition close to 0 °C for most of the winter, making the decorrelation of images less noticeable, especially in the presence of wet snow. This could justify the relatively high coherence values in some incidents when a change in soil FT state was observed.
There is also another challenge to using coherence analysis for FT detection. We found that approximately 60% of the relatively low coherence values (≤0.4) were not associated with FT processes (averaged over both paths). This is because coherence between two observations generally decreases over time even in the absence of any major event impacting surface characteristics between acquisition dates. Coherence decay increases with longer satellite repeat intervals following an exponential relationship with rates depending on land cover type [80,81]. Therefore, shorter intervals are more appropriate to minimize the inherent temporal decay of coherence values. Our analysis implied that the 12-day interval is not appropriate for our study area to ensure that the decorrelations were dominantly induced by FT processes. There were three snow-on periods in the studied winter 2021 and 2022, and four in winter 2020 with the snowpack completely melted away between these periods. Although a shallow snowpack may not appreciably impact C-band backscatter, it can impact the signal phase (and so the coherence) as it alters height above the surface. Our findings emphasize the complexities involved in interpreting coherence data in relation to soil freeze-thaw dynamics, especially under a non-persistent snowpack. Moreover, Zhou et al. [28] reported generally low rainfall precipitation during wintertime in the QTP region which allowed them to ignore the decorrelation due to precipitation between two acquisitions. The frequent rainfall events during winter in our study area, however, raise a question about the attribution of FT processes to the decreases in coherence values.
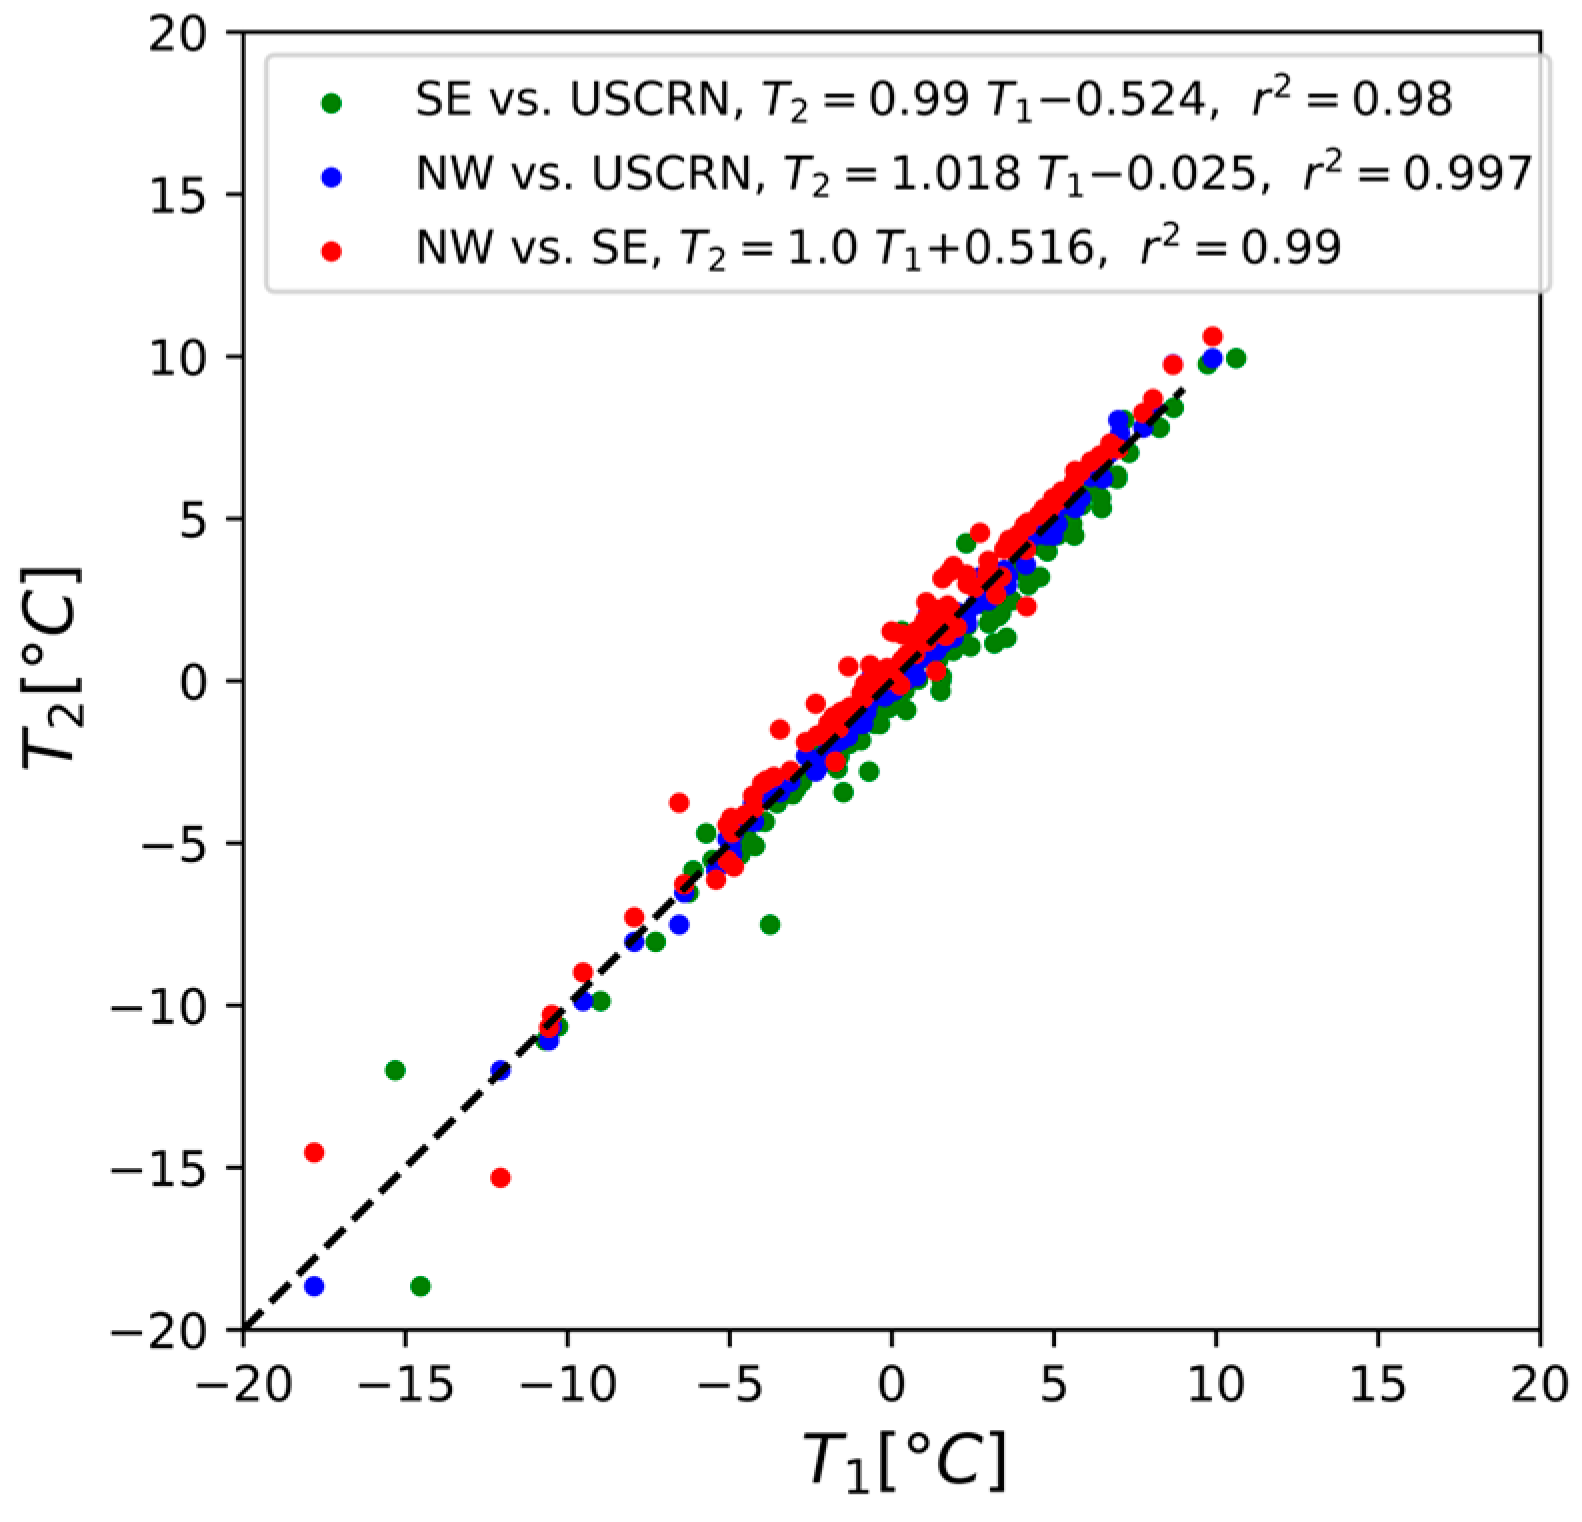
In this study, air temperature observations were assumed to be an appropriate reference dataset. Despite the uncertainties, air temperature is commonly used as a proxy for ground FT state, especially for the C band and higher frequency signals considering their penetration depth [26,82,83]. C-band signals with their 5.6 GHz frequency theoretically describe the condition of the top layer of ground which is the first layer to react to changes in air temperature while soil moisture and temperature probes are usually located deeper than the C-band maximum penetration depth (5 cm [84]). Even for lower frequency signals with deeper penetration depths (such as L band with 5–15 cm penetration depth), it is still quite common to use air temperature for validation of FT products [15,77,78,85,86,87,88,89]. Moreover, in the absence of well-distributed soil temperature observations, point-scale air temperature data have lower representativeness errors due to its substantially longer spatial correlation length [90]. Our preliminary analysis indicated relatively low air temperature variation over the study area. (Figure A7). The air temperature observations collected during winter 2023 at three locations over the study area agreed very well with each other with approximately ±0.5 °C difference, on average. Therefore, it can be argued that a stricter threshold (such as ±1 °C) to define FT state from in-situ air temperature observations would readily account for the limited variability in the air temperature over the study area. Such a threshold can also, to some degree, compensate for the differences between ground surface temperature and air temperature and reduce the uncertainties associated with that.

5. Summary and Conclusions

In this study, we assessed the application of C-band SAR data for FT detection using three approaches, seasonal threshold, general threshold, and coherence, over a study area located in New Hampshire, USA, featuring a shallow snowpack and frequent FT cycles through the cold season. The value of this research is to investigate GTA performance and error sources for freeze-thaw condition mapping at sub-field-scales in agricultural lands over large regions (e.g., CONUS) to assist in identifying antecedent conditions that may negatively impact crop growing season.
The backscatter data of two Sentinel-1 paths at both VV and VH polarizations were used, and the performance of the three FT detection approaches was evaluated against in-situ air temperature observations. Using VV polarization, the STA and GTA achieved approximately 82% and 76% accuracy, on average, over the entire study area, respectively. Generally, the average accuracies of STA and GTA were marginally better when VH polarization was used, reaching to 85% and 78%, respectively. The STA and GTA were able to exceed/approach SMAP FT accuracy for latitudes >45 (80%) but with a noisier instrument and comparatively higher resolution.
We found that the optimization of the STA threshold for each individual pixel improved the accuracy by less than 3%, on average, compared to using the conventional 0.5 threshold. This suggests that the additional computations required to find the threshold optimized for each pixel individually can be avoided without compromising the performance. Also, GTA and STA performances were comparable (with approximately a 6 percentage point difference in the overall accuracy for both polarizations). We showed that GTA could offer similar performance to STA when there is lower uncertainty about the actual FT state of observations (i.e., stricter threshold on reference air temperatures). Because GTA requires fewer computational steps, it may be a more suitable approach for FT detection across large study domains.
Finally, our analysis revealed that the application of interferometric coherence for FT detection depends on the winter dynamics (i.e., the severity of FT transitions, frequency and intensity of mid-winter rainfall, and snowpack persistency). The mild winter conditions in our study area and therefore subtle changes in the amount of frozen water in the soil may not be enough to impact the coherence between two SAR images. We also found other factors such as changes in snow coverage and frequent mid-winter rainfall could cause decorrelation, posing challenges in FT detection using coherence.

Author Contributions

Conceptualization, M.M. and S.K.; Methodology, M.M., S.K. and J.J.; Formal analysis, M.M.; Writing—original draft, M.M.; Writing—review & editing, S.K. and J.M.J., J.J.; Supervision, J.M.J.; Funding acquisition, S.K. and J.M.J. All authors have read and agreed to the published version of the manuscript.

Funding

This research was funded by United States Department of Agriculture under Agreement Number 58-8042-2-097.

Data Availability Statement

The Sentinel-1 images are available freely to the public at the Alaska Satellites Facility website (https://asf.alaska.edu, accessed on 1 September 2023). The lidar observations at Thompson Farm are available from the corresponding author upon request.

Acknowledgments

The authors thank Adam Hunsaker for providing the processed lidar observations for this study.

Conflicts of Interest

The authors declare no conflicts of interest.

Appendix A

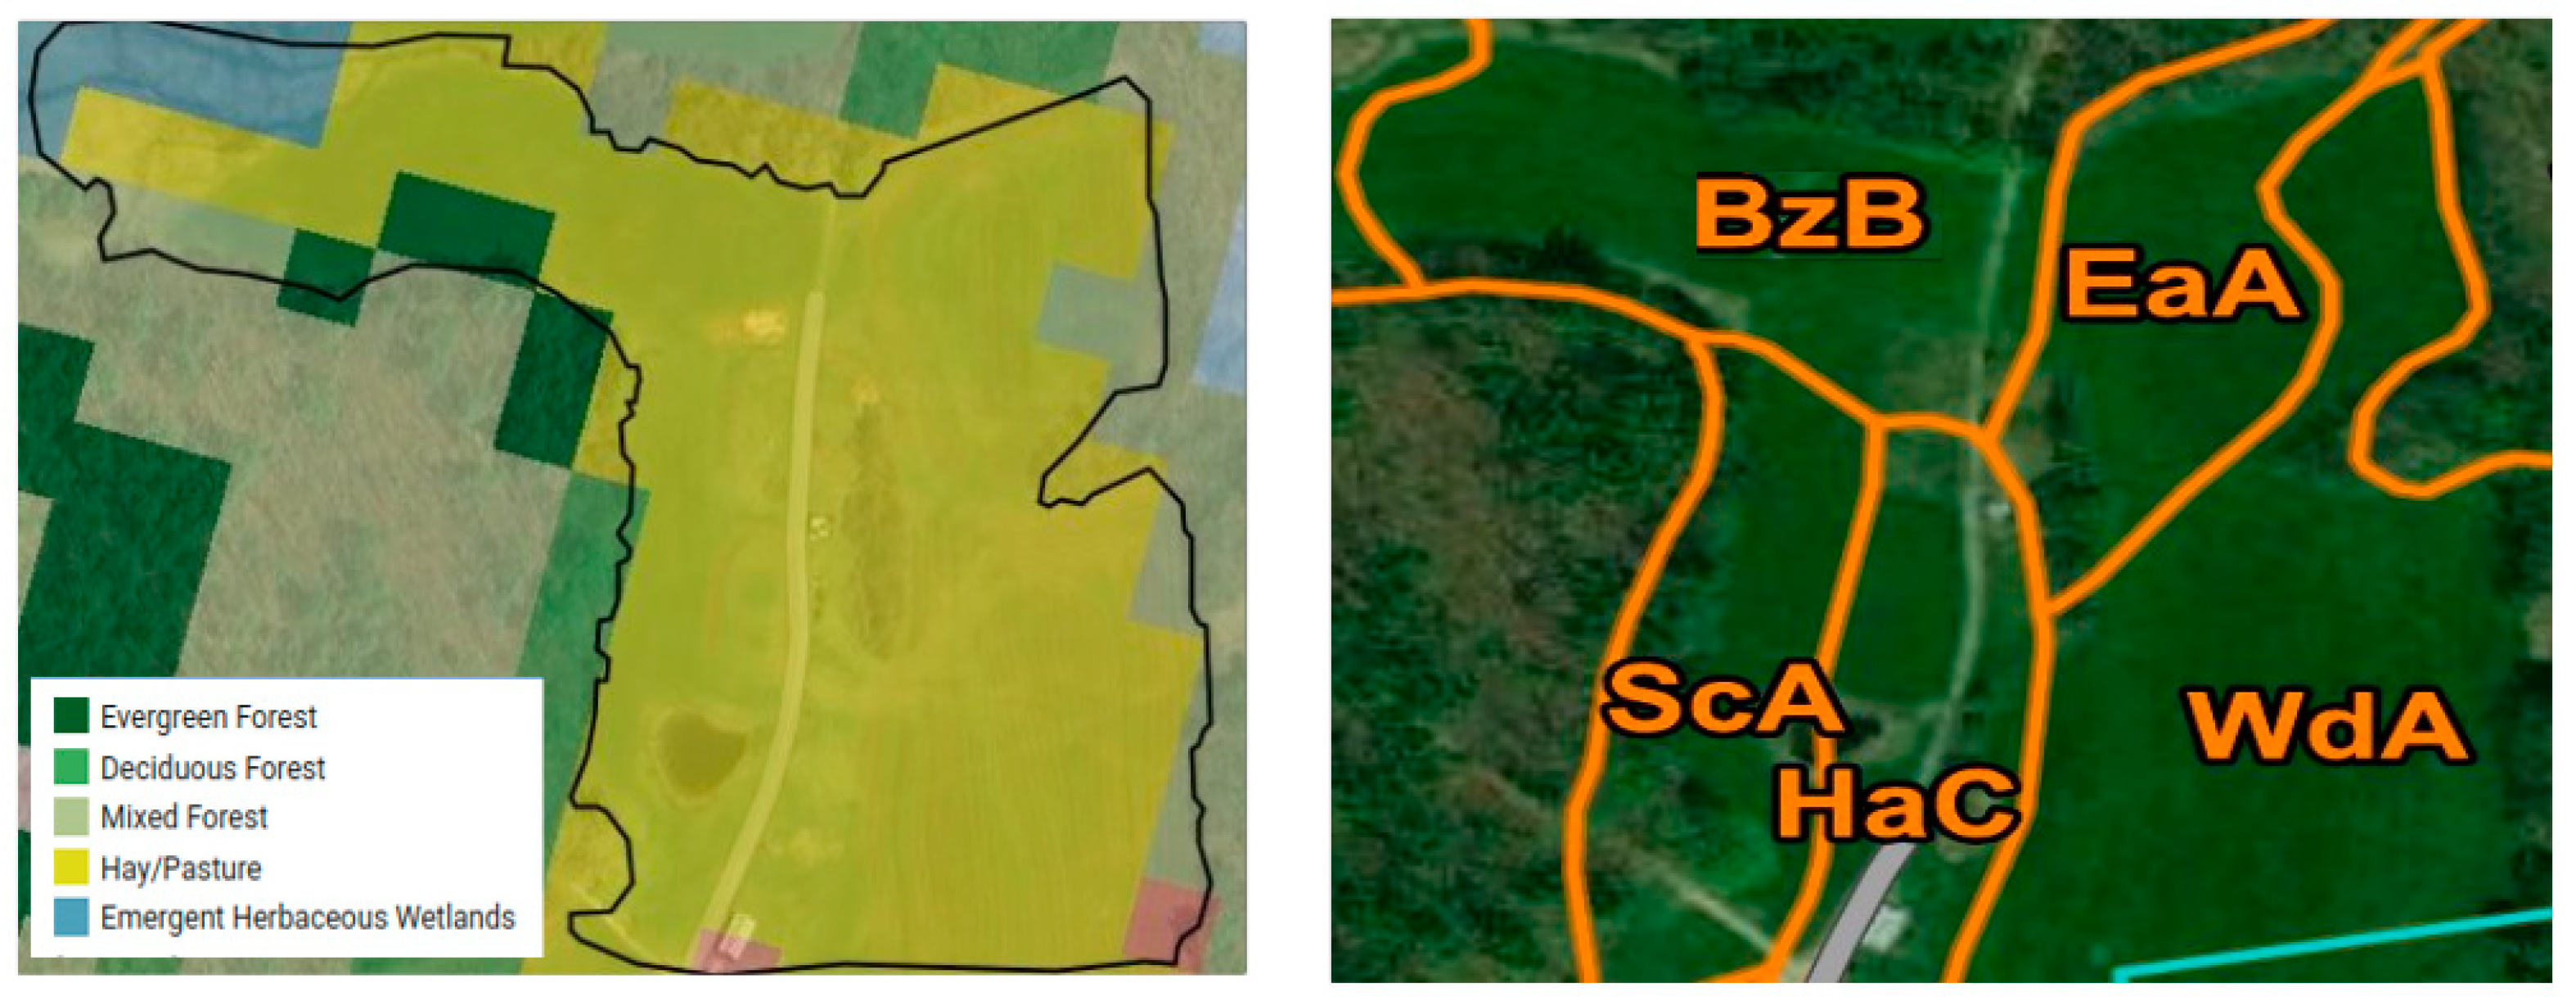
Figure A1. Land cover type (right) and soil type (left) maps over the Thompson Farm. Soil types are Buxton silt loam (BzB), Elmwood fine sandy loam (EaA), Windsor loamy sand (WdA), Hinckley loamy sand (HaC), and Scantic silt loam (ScA).
Remotesensing 16 02784 g0a1
Figure A2. Distribution of the Sentinel-2 NDSI considering forest-only (green) and field-only (brown) pixels.
Remotesensing 16 02784 g0a2
Figure A3. True freeze (dark blue), false thaw (light blue), true thaw (red), and false freeze (orange) ratios of the seasonal threshold algorithm over Path 135 (A,C) and Path 62 (B,D) pixels, covering the Thompson Farm).
Remotesensing 16 02784 g0a3
Figure A4. Monthly summary of performance metrics for general threshold approach when air temperature threshold is equal to 0 °C for Path 135 (A,C) and Path 62 (B,D) for both VV and VH polarization.
Remotesensing 16 02784 g0a4
Figure A5. Scatterplot of surface characteristics including mean total sun hours (TSH-MEAN), standard deviation of DEM (DEM-STDV) and mean canopy height (CHM-MEAN) at Path 135’s pixels (A) and Path 62’s pixels (B). Each point represents a pixel (check Figure 1 for the location). Points with similar color belongs the same cluster, determined by K-means clustering.
Remotesensing 16 02784 g0a5
Figure A6. Percentage of disagreement between FT states detected by STA and GTA approaches when Tth,air = 0 °C. The disagreement percentage between the two methods at each pixel is the proportion of instances where the two methods did not concur on the soil state, relative to the total number of Sentinel-1 observations analyzed for that pixel.
Remotesensing 16 02784 g0a6
Figure A7. Daily mean air temperature observations, measured at three locations over Thompson Farm, NH during winter 2023.
Remotesensing 16 02784 g0a7
Table A1. Accuracies of various thresholds ( γ t h 0 from Equation (5)) employed by the general threshold approach for detecting FT events over the Thompson Farm when Tth,air = 0 °C. The bold numbers highlight the selected thresholds and their corresponding metrics.
Threshold (Linear Power)Threshold [dB]KappaTrue Freeze RatioFalse Thaw RatioTrue Thaw RatioFalse Freeze RatioAccuracy %
VV1350.06511.870.360.390.610.920.0880.9
0.0711.550.40.50.50.890.1180.5
0.07511.250.410.580.430.850.1579.3
0.0810.970.350.630.370.780.2374.5
0.08510.710.320.690.310.720.2871.1
0.0910.460.30.770.230.650.3567.5
0.09510.220.230.840.160.520.4858.8
0.110.000.190.910.090.420.5852.3
620.06511.870.10.10.90.970.0373.9
0.0711.550.250.240.760.950.0576.5
0.07511.250.370.380.620.940.0678.9
0.0810.970.390.470.530.890.1178
0.08510.710.450.580.420.860.1478.5
0.0910.460.450.670.330.80.276.9
0.09510.220.410.720.280.750.2574.1
0.110.000.330.750.250.650.3567.6
VH1350.00820.970.140.110.890.990.0179.8
0.0120.000.250.220.780.970.0380.9
0.012519.030.340.330.680.950.0582
0.01518.240.410.480.530.910.0981.6
0.017517.570.480.680.330.840.1680.7
0.0216.990.460.820.180.760.2477.3
0.0315.230.11100.220.7838.9
0.0413.980.01100.020.9822.7
620.00820.970.040.030.970.990.0173.7
0.0120.000.10.080.920.990.0174.8
0.012519.030.20.190.810.970.0376.1
0.01518.240.350.340.660.950.0578.9
0.017517.570.430.470.530.920.0879.8
0.0216.990.480.660.340.840.1678.9
0.0315.230.190.980.020.320.6849.3
0.0413.980.04100.080.9232.4

References

  1. Nielsen, C.B.; Groffman, P.M.; Hamburg, S.P.; Driscoll, C.T.; Fahey, T.J.; Hardy, J.P. Freezing effects on carbon and nitrogen cycling in northern hardwood forest soils. Soil Sci. Soc. Am. J. 2001, 65, 1723–1730. [Google Scholar] [CrossRef]
  2. Yang, K.; Wang, C. Water storage effect of soil freeze-thaw process and its impacts on soil hydro-thermal regime variations. Agric. For. Meteorol. 2019, 265, 280–294. [Google Scholar] [CrossRef]
  3. Zhang, T.; Barry, R.G.; Armstrong, R.L. Application of satellite remote sensing techniques to frozen ground studies. Polar Geogr. 2004, 28, 163–196. [Google Scholar] [CrossRef]
  4. Bélanger, G.; Castonguay, Y.; Bertrand, A.; Dhont, C.; Rochette, P.; Couture, L.; Drapeau, R.; Mongrain, D.; Chalifour, F.P.; Michaud, R. Winter damage to perennial forage crops in eastern Canada: Causes, mitigation, and prediction. Can. J. Plant Sci. 2006, 86, 33–47. [Google Scholar] [CrossRef]
  5. Sharratt, B.S. Freeze-thaw and winter temperature of agricultural soils in interior Alaska. Cold Reg. Sci. Technol. 1993, 22, 105–111. [Google Scholar] [CrossRef]
  6. Sharratt, B.S.; Saxton, K.E.; Radke, J.K. Freezing and thawing of agricultural soils: Implications for soil, water, and air quality. J. Minn. Acad. Sci. 1995, 59, 1–5. [Google Scholar]
  7. Six, J.; Bossuyt, H.; Degryze, S.; Denef, K. A history of research on the link between (micro) aggregates, soil biota, and soil organic matter dynamics. Soil Tillage Res. 2004, 79, 7–31. [Google Scholar] [CrossRef]
  8. Chang, X.; Jin, H.; Zhang, Y.; He, R.; Luo, D.; Wang, Y.; Lü, L.; Zhang, Q. Thermal impacts of boreal forest vegetation on active layer and permafrost soils in northern Da Xing’anling (Hinggan) Mountains, Northeast China. Arct. Antarct. Alp. Res. 2015, 47, 267–279. [Google Scholar] [CrossRef]
  9. Jiang, H.; Yi, Y.; Zhang, W.; Yang, K.; Chen, D. Sensitivity of soil freeze/thaw dynamics to environmental conditions at different spatial scales in the central Tibetan Plateau. Sci. Total Environ. 2020, 734, 139261. [Google Scholar] [CrossRef]
  10. World Meteorological Organization (WMO). The 2022 GCOS ECVs Requirements (GCOS 245). 2022. Available online: https://library.wmo.int/viewer/58111/download?file=GCOS-245_2022_GCOS_ECVs_Requirements.pdf&type=pdf&navigator=1 (accessed on 11 January 2023).
  11. Whitcraft, A.K.; Becker-Reshef, I.; Justice, C.O.; Gifford, L.; Kavvada, A.; Jarvis, I. No pixel left behind: Toward integrating Earth Observations for agriculture into the United Nations Sustainable Development Goals framework. Remote Sens. Environ. 2019, 235, 111470. [Google Scholar] [CrossRef]
  12. Kim, Y.; Kimball, J.S.; Zhang, K.; McDonald, K.C. Satellite detection of increasing Northern Hemisphere non-frozen seasons from 1979 to 2008: Implications for regional vegetation growth. Remote Sens. Environ. 2012, 121, 472–487. [Google Scholar] [CrossRef]
  13. Kraatz, S.; Jacobs, J.M.; Schröder, R.; Cho, E.; Cosh, M.; Seyfried, M.; Prueger, J.; Livingston, S. Evaluation of SMAP freeze/thaw retrieval accuracy at core validation sites in the contiguous United States. Remote Sens. 2018, 10, 1483. [Google Scholar] [CrossRef]
  14. Rautiainen, K.; Parkkinen, T.; Lemmetyinen, J.; Schwank, M.; Wiesmann, A.; Ikonen, J.; Derksen, C.; Davydov, S.; Davydova, A.; Boike, J.; et al. SMOS prototype algorithm for detecting autumn soil freezing. Remote Sens. Environ. 2016, 180, 346–360. [Google Scholar] [CrossRef]
  15. Wang, J.; Jiang, L.; Cui, H.; Wang, G.; Yang, J.; Liu, X.; Su, X. Evaluation and analysis of SMAP, AMSR2 and MEaSUREs freeze/thaw products in China. Remote Sens. Environ. 2020, 242, 111734. [Google Scholar] [CrossRef]
  16. Livingstone, C.E.; Sikaneta, I.; Gierull, C.; Chiu, S.; Beaulne, P. RADARSAT-2 system and mode description. In Meeting Proceedings; RTO-MP-SCI-150, Paper; RTO: Bangalore, India, 2005; Volume 15. [Google Scholar]
  17. Torres, R.; Snoeij, P.; Geudtner, D.; Bibby, D.; Davidson, M.; Attema, E.; Potin, P.; Rommen, B.; Floury, N.; Brown, M.; et al. GMES Sentinel-1 mission. Remote Sens. Environ. 2012, 120, 9–24. [Google Scholar] [CrossRef]
  18. Werninghaus, R.; Buckreuss, S. The TerraSAR-X mission and system design. IEEE Trans. Geosci. Remote Sens. 2009, 48, 606–614. [Google Scholar] [CrossRef]
  19. Covello, F.; Battazza, F.; Coletta, A.; Lopinto, E.; Fiorentino, C.; Pietranera, L.; Valentini, G.; Zoffoli, S. COSMO-SkyMed an existing opportunity for observing the Earth. J. Geodyn. 2010, 49, 171–180. [Google Scholar] [CrossRef]
  20. Baghdadi, N.; Abou Chaaya, J.; Zribi, M. Semiempirical calibration of the integral equation model for SAR data in C-band and cross polarization using radar images and field measurements. IEEE Geosci. Remote Sens. Lett. 2010, 8, 14–18. [Google Scholar] [CrossRef]
  21. Baghdadi, N.; Bazzi, H.; El Hajj, M.; Zribi, M. Detection of frozen soil using Sentinel-1 SAR data. Remote Sens. 2018, 10, 1182. [Google Scholar] [CrossRef]
  22. Fayad, I.; Baghdadi, N.; Bazzi, H.; Zribi, M. Near real-time freeze detection over agricultural plots using Sentinel-1 data. Remote Sens. 2020, 12, 1976. [Google Scholar] [CrossRef]
  23. Rodionova, N.V. Identification of Frozen/Thawed Soils in the Areas of Anadyr (Chukotka) and Belaya Gora (Sakha) from the Sentinel 1 Radar Data. Izv. Atmos. Ocean. Phys. 2019, 55, 1314–1321. [Google Scholar]
  24. Entekhabi, D.; Njoku, E.; Houser, P.; Spencer, M.; Doiron, T.; Smith, J.; Girard, R.; Belair, S.; Crow, W.; Jackson, T.; et al. The Hydrosphere State (HYDROS) mission concept: An Earth SystemPathfinder for global mapping of soil moisture and land freeze/thaw. Trans. Geosci. Remote Sens. 2004, 42, 2184–2195. [Google Scholar]
  25. Chen, Y.; Wang, L.; Bernier, M.; Ludwig, R. Retrieving Freeze/Thaw Cycles Using Sentinel-1 Data in Eastern Nunavik (Québec, Canada). Remote Sens. 2022, 14, 802. [Google Scholar] [CrossRef]
  26. Wang, J.; Jiang, L.; Rautiainen, K.; Zhang, C.; Xiao, Z.; Li, H.; Yang, J.; Cui, H. Daily High-Resolution Land Surface Freeze/Thaw Detection Using Sentinel-1 and AMSR2 Data. Remote Sens. 2022, 14, 2854. [Google Scholar] [CrossRef]
  27. Rosen, P.A.; Hensley, S.; Joughin, I.R.; Li, F.K.; Madsen, S.N.; Rodriguez, E.; Goldstein, R.M. Synthetic aperture radar interferometry. Proc. IEEE 2000, 88, 333–382. [Google Scholar] [CrossRef]
  28. Zhou, X.; Zhang, Z.; Shen, Q.; Chen, Q.; Liu, X. Identifying soil freeze/thaw states using scattering and coherence time series of high-resolution C-band synthetic aperture radar in the Qinghai-Tibet Plateau. IEEE J. Sel. Top. Appl. Earth Obs. Remote Sens. 2021, 15, 519–532. [Google Scholar] [CrossRef]
  29. Cho, E.; Hunsaker, A.G.; Jacobs, J.M.; Palace, M.; Sullivan, F.B.; Burakowski, E.A. Maximum entropy modeling to identify physical drivers of shallow snowpack heterogeneity using unpiloted aerial system (UAS) lidar. J. Hydrol. 2021, 602, 126722. [Google Scholar]
  30. Jacobs, J.M.; Hunsaker, A.G.; Sullivan, F.B.; Palace, M.; Burakowski, E.A.; Herrick, C.; Cho, E. Snow depth mapping with unpiloted aerial system lidar observations: A case study in Durham, New Hampshire, United States. Cryosphere 2021, 15, 1485–1500. [Google Scholar] [CrossRef]
  31. Proulx, H.; Jacobs, J.M.; Burakowski, E.A.; Cho, E.; Hunsaker, A.G.; Sullivan, F.B.; Palace, M.; Wagner, C. Brief communication: Comparison of in-situ ephemeral snow depth measurements over a mixed-use temperate forest landscape. Cryosphere Discuss. 2023, 17, 3435–3442. [Google Scholar] [CrossRef]
  32. Johnston, J.; Jacobs, J.M.; Cho, E. Global Snow Seasonality Regimes from Satellite Records of Snow Cover. J. Hydrometeorol. 2023, 25, 65–88. [Google Scholar]
  33. Lopes, A.; Touzi, R.; Nezry, E. Adaptive speckle filters and scene heterogeneity. IEEE Trans. Geosci. Remote Sens. 1990, 28, 992–1000. [Google Scholar] [CrossRef]
  34. Shi, Z.; Fung, K.B. A comparison of digital speckle filters. In Proceedings of the IGARSS’94-1994 IEEE International Geoscience and Remote Sensing Symposium, Pasadena, CA, USA, 8–12 August 1994; IEEE: Piscataway, NJ, USA, 1994; Volume 4, pp. 2129–2133. [Google Scholar]
  35. Alaska Satellite Facility RTC Guild. Available online: https://hyp3-docs.asf.alaska.edu/guides/rtc_product_guide/ (accessed on 1 August 2023).
  36. Alaska Satellite Facility InSAR Product Guide. Available online: https://hyp3-docs.asf.alaska.edu/guides/insar_product_guide/ (accessed on 1 August 2023).
  37. Henry, H.A. Soil freeze–thaw cycle experiments: Trends, methodological weaknesses and suggested improvements. Soil Biol. Biochem. 2007, 39, 977–986. [Google Scholar] [CrossRef]
  38. Moradi, M.; Cho, E.; Jacobs, J.M.; Vuyovich, C.M. Seasonal soil freeze/thaw variability across North America via ensemble land surface modeling. Cold Reg. Sci. Technol. 2023, 209, 103806. [Google Scholar] [CrossRef]
  39. Ren, J.; Vanapalli, S.K.; Han, Z. Soil freezing process and different expressions for the soil-freezing characteristic curve. Sci. Cold Arid Reg. 2017, 9, 221–228. [Google Scholar]
  40. Gascoin, S.; Barrou Dumont, Z.; Deschamps-Berger, C.; Marti, F.; Salgues, G.; López-Moreno, J.I.; Revuelto, J.; Michon, T.; Schattan, P.; Hagolle, O. Estimating fractional snow cover in open terrain from sentinel-2 using the normalized difference snow index. Remote Sens. 2020, 12, 2904. [Google Scholar] [CrossRef]
  41. Salomonson, V.V.; Appel, I. Estimating fractional snow cover from MODIS using the normalized difference snow index. Remote Sens. Environ. 2004, 89, 351–360. [Google Scholar] [CrossRef]
  42. Hall, D.K.; Riggs, G.A.; Salomonson, V.V. Algorithm Theoretical Basis Document (ATBD) for the MODIS Snow and Sea Ice-Mapping Algorithms (Text); 610 WebDev; NASA GSFC: Greenbelt, MD, USA, 2001; Volume 45, pp. 14–28.
  43. Tong, R.; Parajka, J.; Komma, J.; Blöschl, G. Mapping snow cover from daily Collection 6 MODIS products over Austria. J. Hydrol. 2020, 590, 125548. [Google Scholar] [CrossRef]
  44. Zhang, H.; Zhang, F.; Zhang, G.; Che, T.; Yan, W.; Ye, M.; Ma, N. Ground-based evaluation of MODIS snow cover product V6 across China: Implications for the selection of NDSI threshold. Sci. Total Environ. 2019, 651, 2712–2726. [Google Scholar] [CrossRef]
  45. Schwanghart, W.; Scherler, D. TopoToolbox 2–MATLAB-based software for topographic analysis and modeling in Earth surface sciences. Earth Surf. Dyn. 2014, 2, 1–7. [Google Scholar] [CrossRef]
  46. Reda, I.; Andreas, A. Solar Position Algorithm for Solar Radiation Applications; National Renewable Energy Laboratory: Golden, CO, USA, 2008.
  47. Entekhabi, D.; Yueh, S.; De Lannoy, G. SMAP Handbook; NASA: Washington, DC, USA, 2014.
  48. Podest, E.; McDonald, K.C.; Kimball, J.S. Multisensor microwave sensitivity to freeze/thaw dynamics across a complex boreal landscape. IEEE Trans. Geosci. Remote Sens. 2014, 52, 6818–6828. [Google Scholar] [CrossRef]
  49. Bakon, M.; Czikhardt, R.; Papco, J.; Barlak, J.; Rovnak, M.; Adamisin, P.; Perissin, D. remotIO: A Sentinel-1 multi-temporal InSAR infrastructure monitoring service with automatic updates and data mining capabilities. Remote Sens. 2020, 12, 1892. [Google Scholar] [CrossRef]
  50. Cigna, F.; Banks, V.J.; Donald, A.W.; Donohue, S.; Graham, C.; Hughes, D.; McKinley, J.M.; Parker, K. Mapping ground instability in areas of geotechnical infrastructure using satellite InSAR and Small UAV surveying: A case study in Northern Ireland. Geosciences 2017, 7, 51. [Google Scholar] [CrossRef]
  51. Macchiarulo, V.; Milillo, P.; Blenkinsopp, C.; Reale, C.; Giardina, G. Multi-temporal InSAR for transport infrastructure monitoring: Recent trends and challenges. Proc. Inst. Civ. Eng. Bridge Eng. 2021, 176, 92–117. [Google Scholar] [CrossRef]
  52. Abdel-Hamid, A.; Dubovyk, O.; Greve, K. The potential of sentinel-1 InSAR coherence for grasslands monitoring in Eastern Cape, South Africa. Int. J. Appl. Earth Obs. Geoinf. 2021, 98, 102306. [Google Scholar] [CrossRef]
  53. Nasirzadehdizaji, R.; Cakir, Z.; Sanli, F.B.; Abdikan, S.; Pepe, A.; Calo, F. Sentinel-1 interferometric coherence and backscattering analysis for crop monitoring. Comput. Electron. Agric. 2021, 185, 106118. [Google Scholar] [CrossRef]
  54. Zalite, K.; Antropov, O.; Praks, J.; Voormansik, K.; Noorma, M. Monitoring of agricultural grasslands with time series of X-band repeat-pass interferometric SAR. IEEE J. Sel. Top. Appl. Earth Obs. Remote Sens. 2015, 9, 3687–3697. [Google Scholar] [CrossRef]
  55. Lu, Z.; Meyer, D.J. Study of high SAR backscattering caused by an increase of soil moisture over a sparsely vegetated area: Implications for characteristics of backscattering. Int. J. Remote Sens. 2002, 23, 1063–1074. [Google Scholar] [CrossRef]
  56. Moeremans, B.; Dautrebande, S. Soil moisture evaluation by means of multi-temporal ERS SAR PRI images and interferometric coherence. J. Hydrol. 2000, 234, 162–169. [Google Scholar] [CrossRef]
  57. Zhang, T.; Zeng, Q.; Li, Y.; Xiang, Y. Study on relation between InSAR coherence and soil moisture. In Proceedings of the ISPRS Congress, Beijing, China, 3–11 July 2008; pp. 3–11. [Google Scholar]
  58. Zwieback, S.; Hensley, S.; Hajnsek, I. Assessment of soil moisture effects on L-band radar interferometry. Remote Sens. Environ. 2015, 164, 77–89. [Google Scholar] [CrossRef]
  59. Wegmueller, U. Soil Moisture Monitoring with ERS SAR Interferometry; Print; ESA SP: São Paulo, Brazil, 1997; pp. 47–52. [Google Scholar]
  60. Li, Z.; Guo, H.; Li, X.; Wang, C. SAR Interferometry coherence analysis for snow mapping. In Proceedings of the IGARSS 2001. Scanning the Present and Resolving the Future. Proceedings. IEEE 2001 International Geoscience and Remote Sensing Symposium (Cat. No. 01CH37217), Sydney, NSW, Australia, 9–13 July 2001; IEEE: Piscataway, NJ, USA, 2001; Volume 6, pp. 2905–2907. [Google Scholar]
  61. Lund, J.; Forster, R.R.; Deeb, E.J.; Liston, G.E.; Skiles, S.M.; Marshall, H.P. Interpreting Sentinel-1 SAR backscatter signals of snowpack surface melt/freeze, warming, and ripening, through field measurements and physically-based SnowModel. Remote Sens. 2022, 14, 4002. [Google Scholar] [CrossRef]
  62. Singh, G.; Venkataraman, G.; Rao, Y.S.; Kumar, V. InSAR coherence measurement techniques for snow cover mapping in Himalayan region. In Proceedings of the IGARSS 2008-2008 IEEE International Geoscience and Remote Sensing Symposium, Boston, MA, USA, 7–11 July 2008; IEEE: Piscataway, NJ, USA, 2008; Volume 4, pp. IV-1077–IV-1080. [Google Scholar]
  63. Cohen, J. A coefficient of agreement for nominal scales. Educ. Psychol. Meas. 1960, 20, 37–46. [Google Scholar] [CrossRef]
  64. McHugh, M.L. Interrater reliability: The kappa statistic. Biochem. Medica Biochem. Medica 2012, 22, 276–282. [Google Scholar] [CrossRef]
  65. Kraatz, S.; Jacobs, J.M.; Miller, H.J. Spatial and temporal freeze-thaw variations in Alaskan roads. Cold Reg. Sci. Technol. 2019, 157, 149–162. [Google Scholar] [CrossRef]
  66. Tsai, Y.L.S.; Dietz, A.; Oppelt, N.; Kuenzer, C. Remote sensing of snow cover using spaceborne SAR: A review. Remote Sens. 2019, 11, 1456. [Google Scholar] [CrossRef]
  67. Mätzler, C. Applications of the interaction of microwaves with the natural snow cover. Remote Sens. Rev. 1987, 2, 259–387. [Google Scholar] [CrossRef]
  68. Karbou, F.; Veyssière, G.; Coleou, C.; Dufour, A.; Gouttevin, I.; Durand, P.; Gascoin, S.; Grizonnet, M. Monitoring wet snow over an alpine region using Sentinel-1 observations. Remote Sens. 2021, 13, 381. [Google Scholar] [CrossRef]
  69. Ashcraft, I.S.; Long, D.G. Comparison of methods for melt detection over Greenland using active and passive microwave measurements. Int. J. Remote Sens. 2006, 27, 2469–2488. [Google Scholar] [CrossRef]
  70. Floricioiu, D.; Rott, H. Seasonal and short-term variability of multifrequency, polarimetric radar backscatter of alpine terrain from SIR-C/X-SAR and AIRSAR data. IEEE Trans. Geosci. Remote Sens. 2001, 39, 2634–2648. [Google Scholar] [CrossRef]
  71. Ulaby, F.T.; Batlivala, P.P.; Dobson, M.C. Microwave backscatter dependence on surface roughness, soil moisture, and soil texture: Part I-bare soil. IEEE Trans. Geosci. Electron. 1978, 16, 286–295. [Google Scholar] [CrossRef]
  72. Barrett, B.W.; Dwyer, E.; Whelan, P. Soil moisture retrieval from active spaceborne microwave observations: An evaluation of current techniques. Remote Sens. 2009, 1, 210–242. [Google Scholar] [CrossRef]
  73. Freeman, A.; Durden, S.L. A three-component scattering model for polarimetric SAR data. IEEE Trans. Geosci. Remote Sens. 1998, 36, 963–973. [Google Scholar] [CrossRef]
  74. McNairn, H.; Brisco, B. The application of C-band polarimetric SAR for agriculture: A review. Can. J. Remote Sens. 2004, 30, 525–542. [Google Scholar] [CrossRef]
  75. Schmugge, T.J.; Kustas, W.P.; Ritchie, J.C.; Jackson, T.J.; Rango, A. Remote sensing in hydrology. Adv. Water Resour. 2002, 25, 1367–1385. [Google Scholar] [CrossRef]
  76. Brown, R.J.; Pokier, S.; Manore, M.J. Correlations between X, C and L-band imagery within an agricultural environment. In Proceedings of the IEEE International Geoscience and Remote Sensing Symposium (IGARSS’88), Edinburgh, UK, 12–16 September 1988; pp. 1279–1280. [Google Scholar]
  77. Derksen, C.; Xu, X.; Dunbar, R.S.; Colliander, A.; Kim, Y.; Kimball, J.S.; Black, T.A.; Euskirchen, E.; Langlois, A.; Loranty, M.M.; et al. Retrieving landscape freeze/thaw state from Soil Moisture Active Passive (SMAP) radar and radiometer measurements. Remote Sens. Environ. 2017, 194, 48–62. [Google Scholar] [CrossRef]
  78. Kim, Y.; Kimball, J.S.; Xu, X.; Dunbar, R.S.; Colliander, A.; Derksen, C. Global assessment of the SMAP freeze/thaw data record and regional applications for detecting spring onset and frost events. Remote Sens. 2019, 11, 1317. [Google Scholar] [CrossRef]
  79. Roy, A.; Royer, A.; Derksen, C.; Brucker, L.; Langlois, A.; Mialon, A.; Kerr, Y.H. Evaluation of spaceborne L-band radiometer measurements for terrestrial freeze/thaw retrievals in Canada. IEEE J. Sel. Top. Appl. Earth Obs. Remote Sens. 2015, 8, 4442–4459. [Google Scholar] [CrossRef]
  80. Kellndorfer, J.; Cartus, O.; Lavalle, M.; Magnard, C.; Milillo, P.; Oveisgharan, S.; Osmanoglu, B.; Rosen, P.A.; Wegmüller, U. Global seasonal Sentinel-1 interferometric coherence and backscatter data set. Sci. Data 2022, 9, 73. [Google Scholar] [CrossRef]
  81. Yun, H.W.; Kim, J.R.; Choi, Y.S.; Lin, S.Y. Analyses of time series InSAR signatures for land cover classification: Case studies over dense forestry areas with L-band SAR images. Sensors 2019, 19, 2830. [Google Scholar] [CrossRef] [PubMed]
  82. Cohen, J.; Lemmetyinen, J.; Ruiz, J.J.; Rautiainen, K.; Ikonen, J.; Kontu, A.; Pulliainen, J. Detection of soil and canopy freeze/thaw state in the boreal region with L and C Band Synthetic Aperture Radar. Remote Sens. Environ. 2024, 305, 114102. [Google Scholar] [CrossRef]
  83. Cohen, J.; Rautiainen, K.; Lemmetyinen, J.; Smolander, T.; Vehviläinen, J.; Pulliainen, J. Sentinel-1 based soil freeze/thaw estimation in boreal forest environments. Remote Sens. Environ. 2021, 254, 112267. [Google Scholar] [CrossRef]
  84. Meyer, F. Spaceborne Synthetic Aperture Radar: Principles, data access, and basic processing techniques. In Synthetic Aperture Radar (SAR) Handbook: Comprehensive Methodologies for Forest Monitoring and Biomass Estimation; NASA: Washington, DC, USA, 2019; pp. 21–64. [Google Scholar]
  85. Du, J.; Kimball, J.S.; Azarderakhsh, M.; Dunbar, R.S.; Moghaddam, M.; McDonald, K.C. Classification of Alaska spring thaw characteristics using satellite L-band radar remote sensing. IEEE Trans. Geosci. Remote Sens. 2014, 53, 542–556. [Google Scholar]
  86. Kim, Y.; Kimball, J.S.; Glassy, J.; Du, J. An extended global Earth system data record on daily landscape freeze–thaw status determined from satellite passive microwave remote sensing. Earth Syst. Sci. Data 2017, 9, 133–147. [Google Scholar] [CrossRef]
  87. Mortin, J.; Schrøder, T.M.; Walløe Hansen, A.; Holt, B.; McDonald, K.C. Mapping of seasonal freeze-thaw transitions across the pan-Arctic land and sea ice domains with satellite radar. J. Geophys. Res. Ocean. 2012, 117, C08004. [Google Scholar] [CrossRef]
  88. Roy, A.; Toose, P.; Derksen, C.; Rowlandson, T.; Berg, A.; Lemmetyinen, J.; Royer, A.; Tetlock, E.; Helgason, W.; Sonnentag, O. Spatial variability of L-band brightness temperature during freeze/thaw events over a prairie environment. Remote Sens. 2017, 9, 894. [Google Scholar] [CrossRef]
  89. Roy, A.; Toose, P.; Williamson, M.; Rowlandson, T.; Derksen, C.; Royer, A.; Berg, A.A.; Lemmetyinen, J.; Arnold, L. Response of L-Band brightness temperatures to freeze/thaw and snow dynamics in a prairie environment from ground-based radiometer measurements. Remote Sens. Environ. 2017, 191, 67–80. [Google Scholar] [CrossRef]
  90. Lyu, H.; McColl, K.A.; Li, X.; Derksen, C.; Berg, A.; Black, T.A.; Euskirchen, E.; Loranty, M.; Pulliainen, J.; Rautiainen, K.; et al. Validation of the SMAP freeze/thaw product using categorical triple collocation. Remote Sens. Environ. 2018, 205, 329–337. [Google Scholar] [CrossRef]
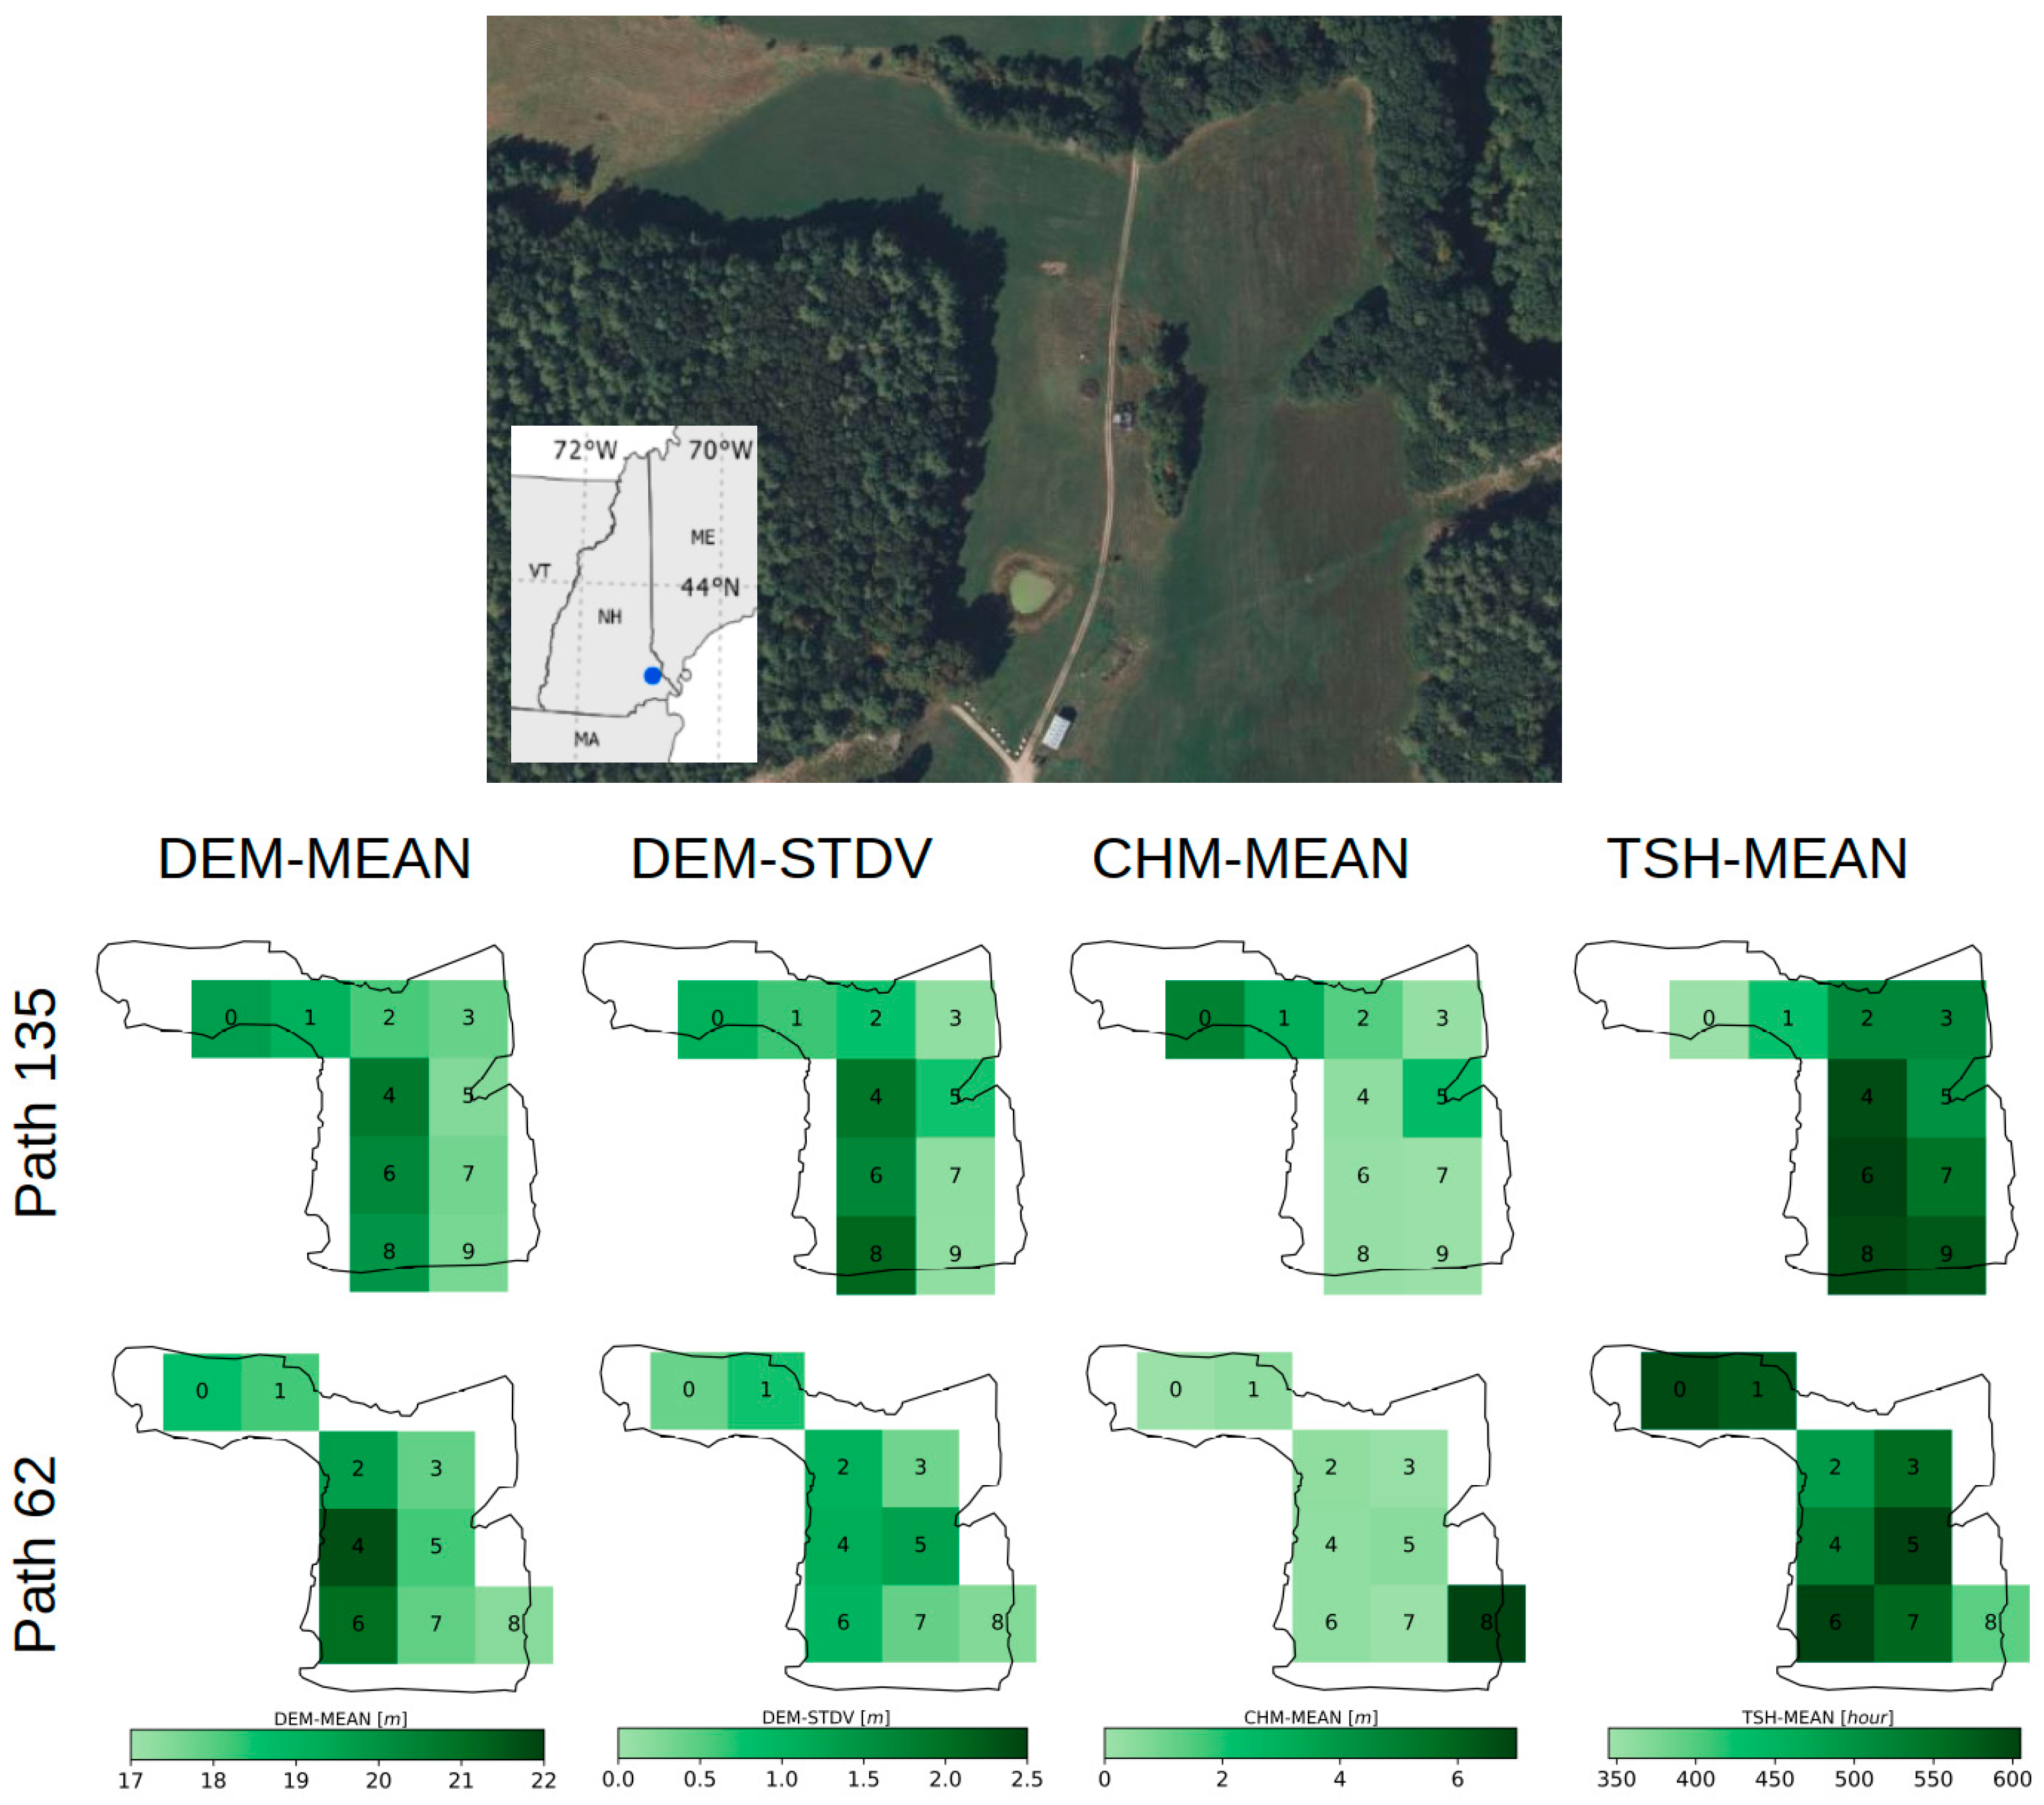
Figure 1. The study area of Thompson Farm, Durham, New Hampshire, United States (top) with the pixels of Paths 135 and 62 (bottom) color-coded based on their mean digital elevation model (DEM-MEAN), standard deviation of DEM (DEM-STDV), mean canopy height model (CHM-MEAN), and mean total sun hours (TSH-MEAN). The pixel numbers are arbitrary, ranging from 0 to 9 for path 135 and from 0 to 8 for path 62.
Remotesensing 16 02784 g001
Figure 2. Examples of radar backscatters map at VV polarization over Thompson Farm in the original pixel spacing (30 m) and coherence pixel spacing (80 m), featuring the thawed and frozen states for Paths 135 (top) and 62 (bottom). The pixels with assigned numbers were used for analysis.
Remotesensing 16 02784 g002
Figure 3. Time series of VV backscatter observations for Paths 135 and 62. The red-shaded dots in the figures indicate the mean of backscatters over an 80 × 80 m coherence pixel. The green triangle represents the overall mean backscatter over the entire study area. The red, horizontal, dashed line marks the GTA threshold. The blue line shows in-situ air temperature observations and blue dots mark the air temperatures at the date of Sentinel-1 acquisition. The blue, horizontal, dashed line marks 0 °C air temperature. The vertical purple lines represent in-situ observations of daily accumulated precipitation.
Remotesensing 16 02784 g003
Figure 4. Same as Figure 3 but for VH polarization.
Remotesensing 16 02784 g004
Figure 5. Time series of coherence (⍴, green dots), seasonal scale factor (∆) and VV polarized SAR backscatter ( γ 0 ), along with air temperature (Tair) and snow cover faction (FSCA, purple dots) at an unmixed pixel (#7) and mixed pixel (#0) of Path 135. On each acquisition date, the first vertical line in the panel of seasonal scale factor shows the retrieved FT state by STA which is followed by the observed FT state based on air temperature. The same presentation is provided for GTA in the VV backscatter panel. The yellow and blue colors represent the thaw and freeze state, respectively. In the backscatter ( γ 0 ) panel, the dot represents the mean backscatter at the pixel while the gray-shaded envelope indicates the 90th and 10th percentiles of the backscatter within that pixel.
Remotesensing 16 02784 g005
Figure 6. Same as Figure 5 but for an unmixed pixel (#7) and mixed pixel (#4) of Path 62.
Remotesensing 16 02784 g006
Figure 7. Optimal thresholds (top boxes) and their corresponding accuracies (bottom boxes) of the seasonal threshold algorithm over Path 135 (A) and Path 62 (B) pixels, covering Thompson Farm. The orange, red, and brown dash lines mark thresholds of 0.4, 0.5, and 0.6, respectively. For example, Pixel 2 in Path 135 has an optimal threshold of 0.6 for VV polarization and 0.4 for VH polarization.
Remotesensing 16 02784 g007
Figure 8. (A) Overall accuracy (left axis, black dot) and number of excluded days (right axis, vertical yellow and blue bars), (B) true freeze ratio, (C) false thaw ratio, (D) true thaw ratio and (E) false freeze ratio of the GTA for different FT thresholds of air temperature.
Remotesensing 16 02784 g008
Figure 9. (A) Overall accuracy, (B) true freeze ratio, (C) false thaw ratio, (D) true thaw ratio and (E) false freeze ratio of the STA for different FT thresholds of air temperature.
Remotesensing 16 02784 g009
Figure 10. Distribution of coherence values over the Thompson Farm for Paths 135 and 62 during the winters between 2020 and 2022. The blue bars represent coherence between two images with a different FT state. White bars on top of the blue bars show coherence values for the pairs with no FT state change.
Remotesensing 16 02784 g010
Table 1. Performance metrics of the selected thresholds employed by the general threshold approach for detecting FT events over the Thompson Farm when Tth,air = 0 °C.
PathThreshold (Linear Power)Threshold [dB]KappaTrue Freeze RatioFalse Thaw RatioTrue Thaw RatioFalse Freeze RatioAccuracy %
VV1350.0810.970.350.630.370.780.2374.5
620.390.470.530.890.1178.0
VH1350.0216.990.460.820.180.760.2477.3
620.480.660.340.840.1678.9
Disclaimer/Publisher’s Note: The statements, opinions and data contained in all publications are solely those of the individual author(s) and contributor(s) and not of MDPI and/or the editor(s). MDPI and/or the editor(s) disclaim responsibility for any injury to people or property resulting from any ideas, methods, instructions or products referred to in the content.