Article

The Preparation Phase of the 2023 Kahramanmaraş (Turkey) Major Earthquakes from a Multidisciplinary and Comparative Perspective

1
Istituto Nazionale di Geofisica e Vulcanologia (INGV), 00143 Rome, Italy
2
Departmento de Física de la Tierra y Astrofísica, Universidad Complutense de Madrid (UCM), 28040 Madrid, Spain
3
Dipartimento di Scienze, Università Roma TRE, 00154 Rome, Italy
*
Author to whom correspondence should be addressed.
Remote Sens. 2024, 16(15), 2766; https://doi.org/10.3390/rs16152766
Submission received: 15 June 2024 / Revised: 16 July 2024 / Accepted: 25 July 2024 / Published: 29 July 2024
(This article belongs to the Section Earth Observation for Emergency Management)

Abstract

:
On 6 February 2023, Turkey experienced its most powerful earthquake in over 80 years, with a moment magnitude (Mw) of 7.7. This was then followed by a second earthquake of Mw 7.6 just nine hours later. According to the lithosphere–atmosphere–ionosphere coupling (LAIC) models, such a significant seismic activity is expected to cause anomalies across various observables, from the Earth’s surface to the ionosphere. This multidisciplinary study investigates the preparatory phase of these two major earthquakes by identifying potential precursors across the lithosphere, atmosphere, and ionosphere. Our comprehensive analysis successfully identified and collected various anomalies, revealing that their cumulative occurrence follows an accelerating trend, either exponential or power-law. Most anomalies appeared to progress from the lithosphere upward through the atmosphere to the ionosphere, suggesting a sequential chain of processes across these geospheres. Notably, some anomalies deviated from this overall trend, manifesting as oscillating variations. We propose that these anomalies support a two-way coupling model preceding major earthquakes, highlighting the potential role of fluid chemistry in facilitating these processes.

Graphical Abstract

1. Introduction

Large seismic events are the manifestation, together with volcanic phenomena, of the vitality of our planet. At the same time, they can be the cause of death and destruction because they involve the release, in the form of elastic waves, of an enormous quantity of energy accumulated due to forces of tectonic origin. Their complexity lies in the multiplicity of physical and chemical phenomena that manifest themselves in the phases preceding, accompanying, and following the paroxysm of the mainshock, and that interest the lithosphere, the atmosphere, and the ionosphere [1].
Many studies have already highlighted anomalies in multiple environmental parameters, linking them to the occurrence of strong earthquakes [2,3,4,5].
The lithosphere–atmosphere–ionosphere coupling (LAIC) model encompasses a range of phenomena supported by extensive experimental evidence, observed before, during, and after strong seismic and volcanic events.
Among co-seismic observations, the ionospheric perturbations (CIPs) are believed to have originated from shock–acoustic waves: these cause variations in the total electron content (TEC), producing travelling ionospheric disturbances (TIDs). The gravity waves instead are believed to be originated by tsunami waves and/or Rayleigh surface waves [6,7,8]. Studies on these kinds of perturbations can now highlight and correlate the spatial asymmetry of these waves to the rupture geometry of the main fault ([9,10])
For what concerns the periods preceding strong earthquakes (EQs), there has been exhaustive literature on pre-seismic phenomena, for example, summarised in [11]: in their work, the coupling between the lithosphere, where the processes are supposing to have originated, and the atmosphere/ionosphere is subtly already presented. Over the following years, the evidence in the scientific literature supporting the coupling hypothesis became stronger, based on analyses performed on multiple physical observables from both ground- and satellite-based instruments (e.g., [12,13,14], among the most recent). As a matter of fact, since the early 1960s (when the drive to achieve earthquake prediction was stronger), different kinds of anomalies were found not only in the lithosphere, but also in the atmosphere and ionosphere. For instance, VLF modulation and emissions of ULF radio waves were reported to have anomalous characteristics (e.g., [15,16]); the statistically significant increasing of thermal energy is observed before large seismic events in multiple parameters, with the skin temperature (SKT), outgoing longwave radiation (OLR), and surface latent heat flux (SLHF) being among the most prominent ([17]). Because of such thermal anomalies and pressure gradients, wave-like structures may appear in the atmosphere in the frequency bands of the acoustic gravity waves (AGWs) (e.g., [18]).
Several comprehensive models have been developed over the years to explain these phenomena. Among them, two widely accepted models are those proposed by Hayakawa et al. [19] and Pulinets and Ouzounov [1], both grounded on the rock dilatancy diffusion model [20].
The preparatory phase within the nucleation volume of a main rupture involving fluids, particularly water, has been modelled by [21], providing a detailed description of chemical activity. Hayakawa et al. [19] delineates three channels of energy transmission between geospheres: chemical, thermodynamic via AGWs, and electromagnetic emissions (EMs).
Pulinets and Ouzounov [1] formulated a very similar comprehensive model where the unique source is the release of radon, the radioactive gas produced in the decay chain of uranium or thorium and released from bedrock material. The charged particles emitted during radon decay ionise air molecules, triggering the aggregation of aerosols through vapour condensation. This process is accompanied by the release of latent heat, pressure variations, and disruptions in atmospheric conductivity. Thus, their model defines both the electrical (direct) and thermal (indirect) channels for these disturbances.
According to [19], the “chemical channel” involves the release of gases in the epicentral area (e.g., radon) or variations in the water level which, in turn, cause the modification of both the air content and conductivity (and, consequently, of the atmospheric electric field), which is reflected in the changes in density and temperature in the ionospheric plasma. The “AGW channel” is supposed to be driven by the release of heat at the ground level: in turn, the resulting expansion of air is capable of causing a strength of gravity and planetary waves due to the AGW.
Based on the microfracturing charge separation, EMs preceding large EQs [15] penetrate the inner magnetosphere and interact with high-energy particles, leading to their precipitation into the lower ionosphere [22]. Moreover, in the ionosphere, anomalies found in the F2-layer critical frequency measurements by ionosonde installed close to the epicentre could be recognised as a pre-seismic interaction due to the impending event (e.g., [23]).
On 6 February 2023, a “strong doublet” [24] of large seismic events struck the Kahramanmaraş province, a south-eastern Anatolia region of Turkey, in the western section of the East Anatolian fault zone (EAFZ). According to the Turkish Disaster and Emergency Management Authority (AFAD, https://en.afad.gov.tr/, accessed on 5 March 2023), the first largest EQ, with a moment magnitude (Mw) of 7.7 (M7.8 according to USGS), the strongest in more than 80 years of Turkish seismic history, occurred at 01:17:32 UT (37.166°N, 37.042°E, with a focal depth of 8.6 km), approximately 30 km away from one of the largest cities in Turkey, Gaziantep, close to the border with Syria [25]. This seismic event was a quite pure left-lateral strike-slip event, with no superficial displacement, occurring instead at a depth ranging from 6 to 20 km with a maximum slip of 7 m, with three asperities that correlate with bends and stepovers along the EAFZ [26]. About 9 h later, at 10:24:47 UT, a Mw 7.6 EQ (M7.5 according to USGS) occurred to the north-northeast of the first one, in Kahramanmaraş province (38.089°N, 37.239°E, with 7 km depth) [27], causing a mapped surface rupture of 130 ± 10 km [28], also with a left-lateral strike-slip with a major asperity along the Çardak Fault featuring a maximum slip of approximately 9.5 m at depths between 0 to 24 km [25].
Actually, in agreement with Bath’s Law, on the coda of the mainshock, about 11 min after it, at 01:28:16 UT, the largest aftershock of M6.6 struck close to the epicentre. After two weeks, another major event (M6.3) hit the region, this time further southeast along the EAF, near the sea and the Turkish–Syrian border, on 20 February at 17:04:29 with the epicentre (36.162°N, 36.025°E) at a 16 km depth (USGS). Ultimately, the sequence of those large events caused about 60,000 people to be killed (50,783 in Turkey and over 7000 in Syria), leaving around 120,000 people injured and 1.5 million homeless [29]. The number of aftershocks of the sequence reached something more than 37,000 (until 22 June 2023), distributing along two branches following the EAF, as shown in Figure 1.
Recently, [31] recomputed the magnitude of the doublet by means of the coda momentum through long-term coda energy: they estimated the magnitudes to be slightly larger with values of 7.95 ± 0.013 and 7.86 ± 0.012, respectively.
The first of the two major 2023 Kahramanmaraş EQs exceeded expectations in both size and destructiveness [32,33]. By analysing the near-field seismic records, [32] developed a dynamic rupture model that reconciles conflicting inversion results and reveals variable propagation speeds during the EQ. Predominantly, supershear speeds were observed along the Narli fault and at the southwest end of the EAF. The model underscores the importance of geometric complexity and heterogeneous frictional conditions in enabling continued rupture propagation and influencing rupture speeds. Additionally, it identifies the conditions that allowed the rupture to jump from the Narli fault to the EAF and generated a delayed backpropagating rupture towards the southwest [32].
Picozzi et al. [34] investigated the existence of a preparatory process for the first major earthquake, occurring on 6 February 2023, in southern Turkey by analysing the temporal evolution of seismic data from around 7500 EQs (ML ≥ 1.5) along the EAF since 2014. These authors found that different segments of the EAF showed varying temporal patterns in nonclustered seismicity, which they interpret as changes in fault coupling. They also examined the Gutenberg–Richter b-value [35], fractal dimension, and energy rate of the earthquakes. The Amanos and Pazarcık fault segments exhibited a long-term trend from 2020 to 2022, suggesting a quiescence phase, followed by changes in EQ clustering and characteristics starting about eight months before the first major event. These findings confirm a long-lasting preparatory phase for the Kahramanmaraş EQ and highlight the potential for detecting such phases to mitigate the seismic risk by identifying deviations from steady fault behaviour.
About 8 months prior to the 2023 M7.8 Kahramanmaraş EQ on the EAFZ, seismicity transients were noted [36]. These transients consisted of isolated spatio-temporal clusters within 65 km of the future epicentre, displaying non-Poissonian inter-event time statistics, magnitude correlations, and low b-values. Such patterns had not been observed locally since at least 2014. Despite this, only sparse seismic activity occurred near the epicentre in the weeks before the quake. The preparatory trends for this EQ align with patterns seen in laboratory stick–slip tests and numerical models of heterogeneous EQ ruptures involving multiple fault segments [36].
A recent study [37], observing strong geomagnetic storms before these EQs with long delays, proposed that the Turkish seismic events may be the result of the solar wind stimulation on the lithosphere processes.
The surge in research following significant natural disasters, such as that in Turkey, illustrates how the scientific community intensifies its efforts to thoroughly investigate the underlying processes. Their goal is to better understand the phenomena occurring during the preparatory phases of such events and, ultimately, to develop methods for early detection. This aim requires a holistic approach [38] that embraces different fields of knowledge, traditionally even very far from each other (e.g., from seismology to atmospheric physics, and ionospheric and particle physics).
Generally, anomalous behaviours may emerge, as a result of some kind of interaction, as a pattern that significantly deviates from the expected behaviour—e.g., seismic acceleration due to some significant change in the stress field during the earthquake preparation phase (e.g., [39]), resonant vibrations of magnetic field lines [18], or as outliers, i.e., extreme values emerging with respect to a previous trend or a background, such as peaks in the counting rate (CR) of Van Allen’s belts’ particle precipitation measured by satellites [40].
The fact that we have learned from the cases analysed in the literature is that, even when in the presence of a strong earthquake, not all observables known to be subject to coupling with the lithosphere through one of the “channels” show anomalies simultaneously, but the latter can appear at their own space–time scales, and this is a major concern. Nonetheless, our experience in this field is that a multidisciplinary approach is the only way to a deeper understanding of the physics behind the seismic event. Multidisciplinarity allows us to collect “facts” from each field (let us call them “anomalies” or “events”) which, perhaps, if taken alone, do not help us go much further; but, placed (or ordered) next to each other, they allow “the puzzle” to be put together in an increasingly complete way, helping to confirm or refute the physical models formulated.
This paper is structured as follows: in the following section, we give a description of the geological/geodynamical setting, surely responsible for the seismic activity under study and possibly related to the lithospheric processes that are supposed to interact with the geospheres above. Section 3 describes the source and characteristics of the multiple data analysed here. Section 4 shows the results obtained by the multiple analyses carried out on the different types of observables measured from the ground up to the ionosphere through the atmosphere. In Section 5, the discussion on the results with a depiction of the interpretative frame is given. Section 6 reports the conclusions.

2. Geological and Geodynamic Settings

Kahramanmaraş province is a part of Turkish territory, characterised by an articulated fault network [41], located in the central-southern area of Turkey, in what has been defined as the Anatolia microplate.
The Permian basement consists of metamorphic rocks. In this area, (Mesozoic) marine carbonate platforms indicate the presence of a shallow and shelf environment. It generally shows a Paleozoic–Mesozoic metamorphic complex, defined as the Malatya complex, often superimposed on younger formations (ophiolites) for tectonic thrust, made up of silicates such as mica-schist, quartz schist, and phyllite, and a series of carbonate rocks such as dolomite, marble, and recrystallised limestones; and an ophiolite (Berit Metaophilite) formation spanning from the late cretaceous to the Eocene. Starting probably from the late Cretaceous, surely from the early Miocene due to the impending closure of the Neotethys, magmatism leaves its heritage of subduction and post-collisional origin (East Anatolian Volcanic Province—EAVP). Products span from mantle-derived composition like basalts and gabbros; then, there is an evolution toward intermediate and acidic terms. In the Plio quaternary, mostly, alluvial sediments are generally undisturbed on the top of this sequence ([42,43] and references therein).
The Kahramanmaraş basin has been formed by the collision of the Arabian and Anatolian plates [44]. This area started to be filled up gradually from alluvial sediments and flysch [44], starting from the Miocene collision between the Arabic and Eurasian plates [45]. Here, intrusive granitoids are present and widespread. They intruded in quite volcanic and intrusive formations, up to the Malatya complex that overlies them. Quaternary alluvial sediments even here are on the top.
Two important elements border the Anatolia microplate. Two strike-slip zones border this microplate: the North Anatolian fault zone (NAFZ), a right lateral E-W strike-slip, and the EAFZ, an ENE-WSW left-lateral strike-slip. The intersection of these two main faults identifies the Karlıova Triple Junction zone, where the Anatolian microplate and the Arabic and the Eurasian plates meet each other.
As reported in [46], the horizontal deformation velocity of the whole of Anatolia relative to Eurasia accounts for an average westward motion of about 20–25 mm/y and a shear strain rate concentrated along active tectonic structures, in particular, along the entire NAFZ and part of the EAFZ. Kurt et al. [47] report, in the NAFZ, a slip rate of up to 26 mm/y E-W, while the NNW slip rate goes up to 10 mm/y in the EAFZ. Starting from the southern border, the vectors are directed towards the NW to WNW direction. Along the northern border, the vectors point west, indicating a counterclockwise rotation. The result is an overall motion of Anatolia toward the west, as it is squeezed by the Arabian Plate, which moves nearly northward, and the Eurasian Plate, which generally has no N-S motion. According to [48], the heat flux in this area is above average, probably still linked to past magmatic activity. In fact, the area of the Kahramanmaraş province reaches values of up to 100 mW/m2. Here, by using the formula H = λ d T / d z , where H is the conductive heat flux (supposing that no convective flux is acting) and λ is the thermal conductivity, and assuming a value of 2 W(m °C)−1, typical of metamorphic and igneous rocks, we should have a geothermal gradient close to 50 °C/km.

3. Multidisciplinary Data and Methods

3.1. Earthquake Data Analyses

3.1.1. b-Value Analysis

When dealing with earthquakes localised in a specific country (Turkey, in this case) where a dense network operates, it is always preferable to make use, when available, of data coming from that national network. Therefore, in order to characterise the seismicity of the region hit by those large events, we first downloaded the Turkey earthquake catalogue from the Kandilli Observatory (http://www.koeri.boun.edu.tr/new/en, accessed on 8 September 2023), from beginning of 2018 to 31 July 2023, also to initially inspect the sequence of aftershocks, and then refined the selection in a way that was appropriate for our purposes.
The way seismic events occur is in strict relationship with the lithology and the tectonic stress field that characterise the region. There are several quantities developed to characterise the evolution of seismicity. Certainly, among the others, one of them (probably the most fundamental) is the Gutenberg–Richter (G–R) law [35]. But, when one wants to disclose the acceleration in seismicity preceding a large EQ, the accelerated seismic release (AMR) is the analysis to apply.
The G–R law is a universal (exponential) relation linking the number of earthquakes and their magnitude through the equation log 10 N m = a b m , where N(m) is the number of earthquakes with magnitude greater than or equal to m; b is a scaling parameter; and a is a constant [35]. A reliable estimation of the b-value can be performed only after an accurate estimation of the magnitude of completeness (Mc): this parameter depends on the seismic network capability to detect events of potentially all magnitudes equal to or greater than Mc occurring in the region where it is deployed. The Mc of the catalogue, representing the minimum detectable value, was calculated using the maximum curvature method [49]. Practically, it is estimated as the lower end at which the frequency–magnitude distribution deviates from the G–R law [50].
As a result of consolidated studies (e.g., [51,52]), the b-value for earthquakes is today considered characteristic of the seismicity within a given region, and, in particular, the regional variations of b reflect the variations in the state of stress: as failure is approached, the b-value gradually decreases as larger and more foreshocks occur.
Both Mc and the b-value were computed through the software, freely available at the ETH site, called ZMAP 7 [53] (http://www.seismo.ethz.ch/en/research-and-teaching/products-software/software/ZMAP/, accessed on 3 November 2020).
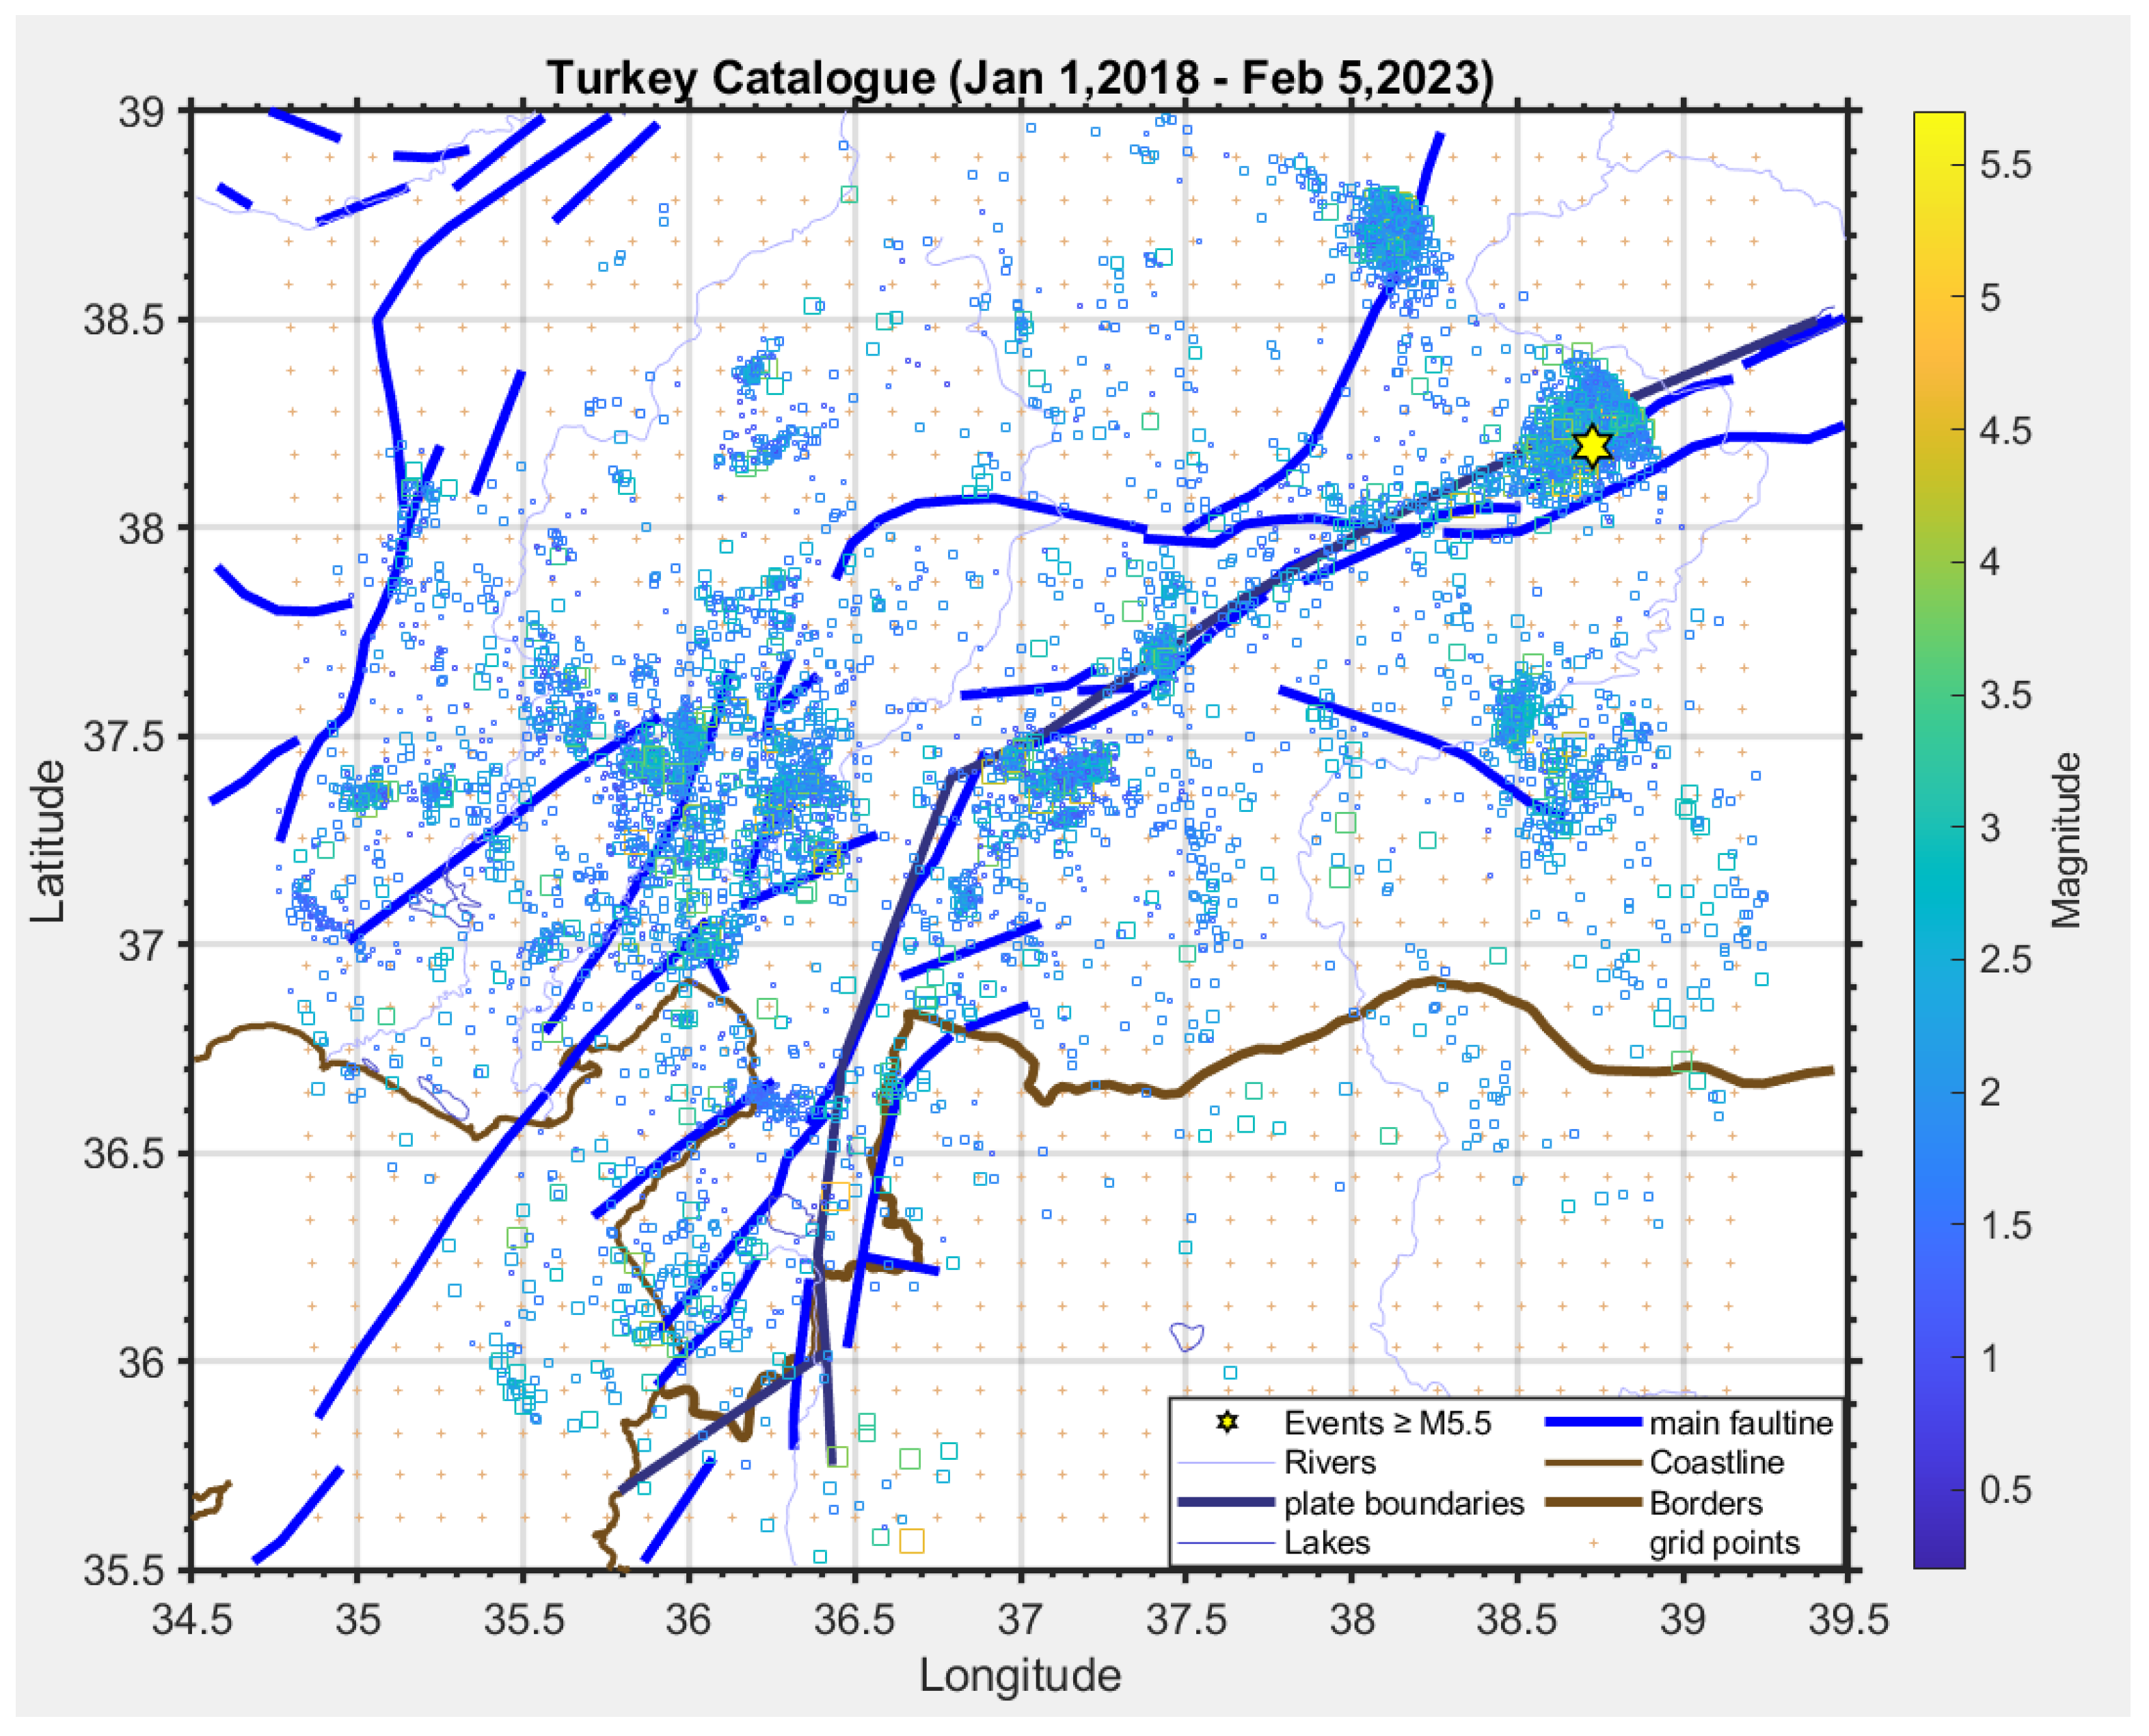
We collected the regional seismic catalogue of the Turkish Bogazici University KOERI, Regional Earthquake-Tsunami Monitoring Center (http://www.koeri.boun.edu.tr/sismo/2/earthquake-catalog/, accessed on 8 September 2023). Figure 2 shows the EQ spatial distribution of all available events from 1 January 2018 to 31 July 2023, constituting the dataset obtained without imposing any selection criteria to space and magnitude.

3.1.2. Revised Acceleration Seismic Release (R-AMR)

Although not always present in seismic sequences, several studies (e.g., [54]) indicate that accelerating seismicity is another characteristic phenomenon which, when the right conditions are respected [55], may be observed as a sequence of moderate-sized earthquakes preceding the large earthquake. The critical point theory is one of the theoretical frameworks used to explain and model this conduct. As the stress drives the seismogenic region to a “self-organised critical” (SOC) state” [55], the acceleration appears as a cascade of small earthquakes leading to much larger events, and, lastly, to the mainshock (i.e., the phase transition) at a certain “failure time”, tf. This behaviour is usually termed the “accelerating moment release” (AMR) and its mathematical model is a simple power-law time-to-failure equation [56] as the following:
s t = A + B t f t m ,
where tf is the time of the mainshock, A and B are constants, and m is a measure of how fast acceleration grows towards tf, being generally about 0.3 [57]. The quantity s t = i E i is called cumulative Benioff strain: the i-th earthquake of magnitude Mi releases an amount of strain s i proportional to the square root of its energy E i = 10 1.5 M i + 4.8 . To detect acceleration, the AMR, and, particularly, its revised version—henceforth called R-AMR—is computed by analysing seismicity around the region under study [39]. R-AMR differs from classic AMR for the weight G r i modulating through the inverse of the distance (i.e., r i 1 ), the amount of deformation released on the mainshock fault by the i-th earthquake that occurs within the considered seismogenic area: s i ^ = s i · G r i . In this way, given the same magnitude, distant earthquakes are weighed less than nearby ones.
The acceleration is found when the comparison between the linear fit (due to the background seismicity) and the fit with the power-law is such that the latter is better. A measure of the goodness of the comparison is the C-value [54]. C is defined as the ratio of the sum of the squares of the residuals of the power-law fit R M S E p o w l a w to the same quantity for the linear fit R M S E l i n e a r : the smaller the C-value (at least less than 0.6), the greater the predominance of the acceleration compared to the linear trend:
C = R M S E p o w l a w R M S E l i n e a r .
Thus, continuing the characterisation of the seismicity, we proceeded in the search of possible acceleration before the beginning of the sequence. For this purpose, we applied the R-AMR [39,58] algorithm to the complete seismic catalogue.

3.2. Atmospheric Data Analysis

As regards the atmospheric analysis, the data used come from climatological re-analysis datasets, in particular, European Center for Medium-range Weather Forecasts (ECMWF) ERA5 reanalysis dataset (https://www.ecmwf.int/, accessed on 2 September 2023). This is a comprehensive reanalysis, from 1940 to five days behind present time, which assimilates as many observations as possible in the upper air and near surface. In our case, however, the dataset of the parameters that we use dates back to 1980 [58], because we are confident that the shorter dataset is more homogeneous.
We focused our attention on some of the parameters which usually are reported as influenced by the preparation phase of the impending earthquake, such as skin temperature (SKT) and outgoing longwave radiation (OLR): in fact, supported by many pieces of evidence in literature (e.g., [17,59]), LAIC models consider them as directly affected by the “thermodynamic” channel.
The ECMWF time series of each atmospheric quantity has been collected in order to apply CAPRI algorithm [17]: for each day, in a temporal window of some months preceding the seismic event, the average and standard deviation of the atmospheric parameter of the forty year (1980–2022) historical time series is computed, after the removal of the linear trend (to take into account the effect of global warming); then, the comparison of each day’s present value with the corresponding historical daily average (and standard deviation) is made for around forty years (1980–2022). If the observable of interest exceeds, with certain persistence, the mean of the time series by twice the standard deviation, an anomaly is identified. In this work, we considered an interval of four months before the EQ. The area sensitive to the EQ preparation phase energy was chosen and it corresponds to 2° × 2° in latitude and longitude, respectively.
CAPRI algorithm has been applied also to some gas time series. In particular, carbon dioxide (CO2), carbon monoxide (CO), and sulphur dioxide (SO2) have been retrieved from climatological physical chemical model Modern-Era Retrospective Analysis for Research and Applications, version 2, [60] (MERRA-2) provided by NOAA in the sub-dataset M2T1NXAER version 5.12.4. The data have a spatial resolution of 0.625° longitude and 0.5° latitude and a temporal resolution of 1 h.

3.3. Ionospheric Data Analysis

With the aim to detect electromagnetic anomalies possibly related to the 6 February 2023 Turkey EQs, we resort to both ground-based and satellite (in situ) measurements.
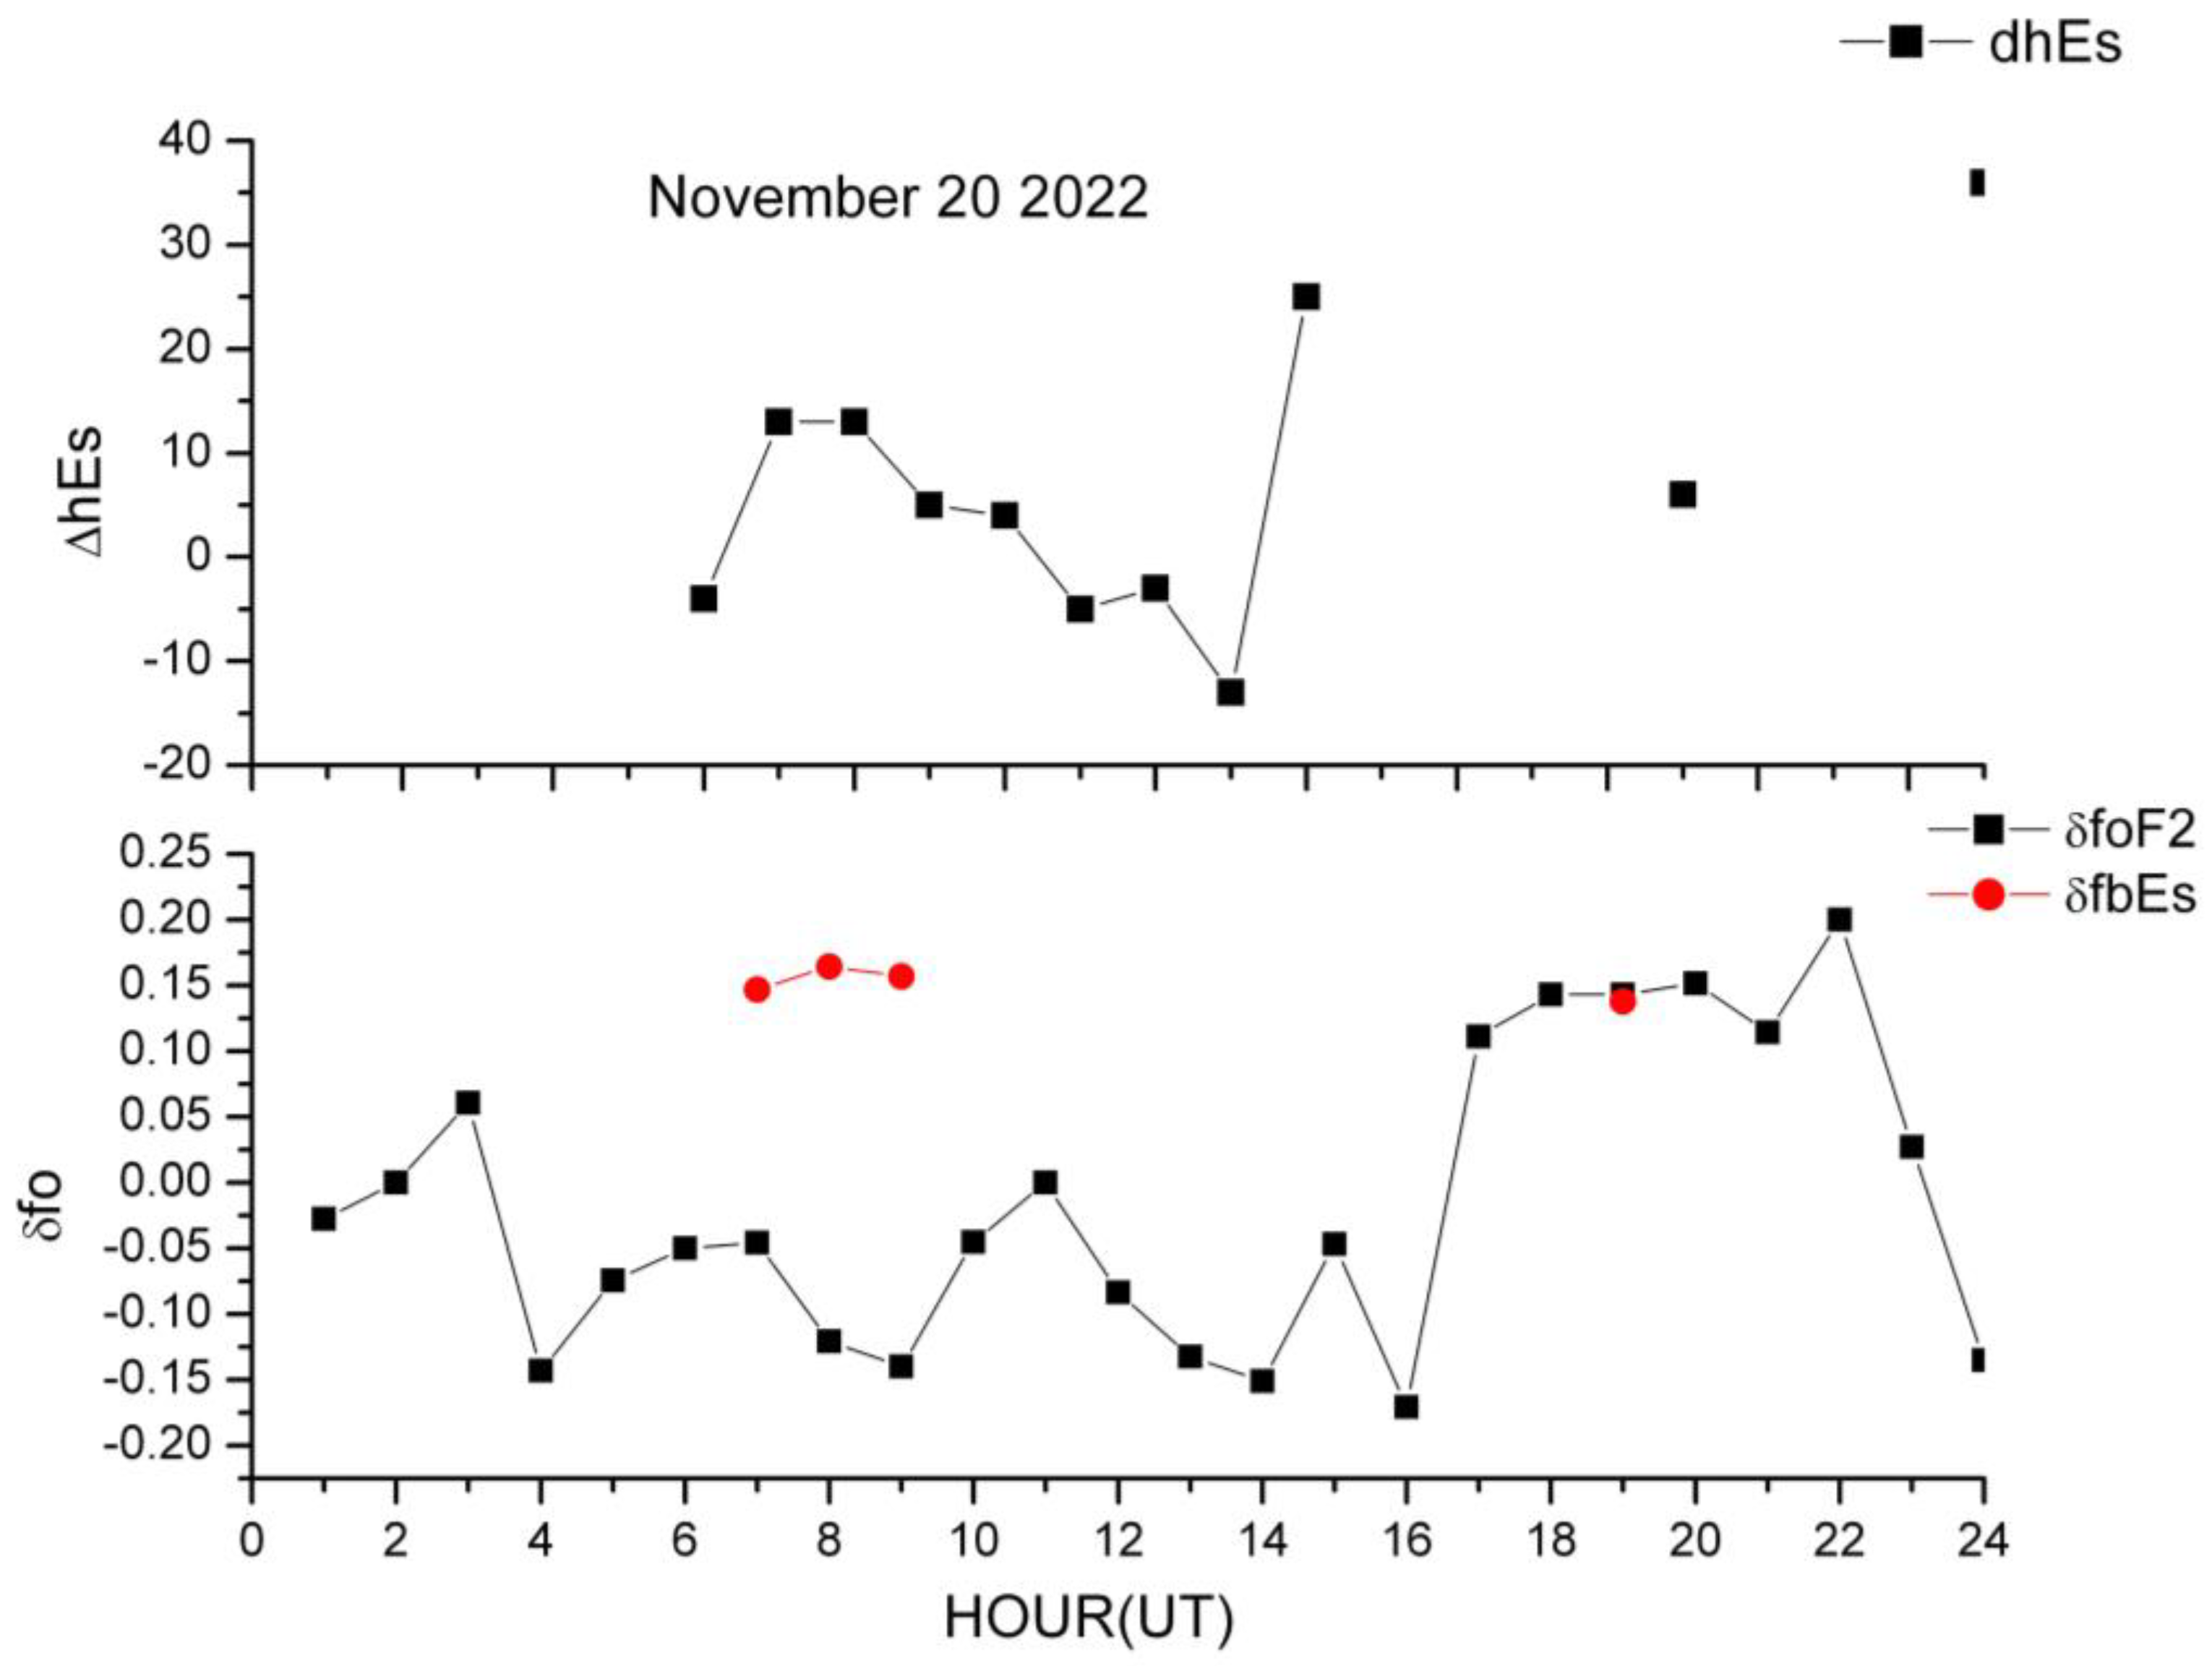
For the ground segment, the data of the DPS-4D ionosonde located at the Nicosia (Cyprus) Ionospheric Observatory (35.03°N; 33.16°E) (https://giro.uml.edu/, accessed on 8 September 2023) were used to detect pre-earthquake anomalies, applying the multiparametric method (see [23,61]). In particular, the values of the F2-layer critical frequency (foF2), the sporadic E (Es)-layer critical frequency (foEs), and its virtual height (h’Es) automatically scaled from vertical incidence ionograms recorded every hour were used for this scope. According to the method applied, long-living (~2–3 h) Es layers were observed when formed at higher altitudes than normal, accompanied by an increase in the above-mentioned critical frequencies. Ionospheric anomalies are then defined considering strong deviations of the parameters with respect to a background level specified by 27-day hourly running medians centred in the day of the observation. Specifically, the following criteria should be satisfied: Δh’Es ≥ 10 km, δfoEs ≥ 0.2, and δfoF2 ≥ 0.1 (where Δ means absolute deviation and δ relative ones), provided that they follow each other within few hours under geomagnetically quiet conditions specified by values of the daily geomagnetic index Ap < 15 nT.
We also made use of “in situ” measured magnetic and electron density satellite data. We collected and analysed data coming from both the Swarm satellite constellation mission, run by European Space Agency (ESA) and in orbit since November 2013; and the first China Seismo-Electromagnetic Satellite (CSES-01) mission, launched in February 2018 and run by the Chinese National Space Administration (CNSA) and Italian Space Agency (ASI) to investigate the near-Earth electromagnetic, plasma, and particle environment. Swarm mission is composed of three identical satellites (named Swarm-A, Swarm-B, and Swarm-C, or simply Alpha, Bravo, and Charlie) orbiting with the specific quasi-polar configuration designed for a deeper understanding and monitoring of the Earth’s geomagnetic field (and its temporal evolution), together with the electric field in the atmosphere. Swarm-A and Swarm-C spacecrafts fly close together at around 400–450 km (at the time of writing), separated by this distance to measure gradients of magnetic fields. Swarm-B flies at higher altitude (between 450–500 km) with a slightly different inclination in order to measure at different local times (source).
Regarding the Swarm data, we analysed the electron density (Ne, sampled at 2 Hz) from all the Swarm satellites and the three magnetic field components (X, Y, and Y, at 1 Hz) from Swarm-A only, collected in the last release of Swarm and EFIx_LP_1B and MAGx_LR_1B datasets, respectively.
CSES-01 was designed for monitoring the electromagnetic field and plasma parameters of the near-Earth environment in search of natural (and artificial) sources able to induce particle precipitations from the Van Allen belts (VABs) and other peculiar changes in magnetic and electric field, electron density, et cetera. The spacecraft flies at an altitude of about 500 km with a circular sun-synchronous orbit, inclined to about 98°: with this configuration, the satellite explores almost the same local times, having its ascending and descending nodes at 02:00 and 14:00 LT, respectively. We performed the analysis of the ionospheric plasma parameters acquired by CSES-01 sensors and the ionosonde.
These analyses covered a period ranging from 90 days before 6 February 2023 to 10 days after.
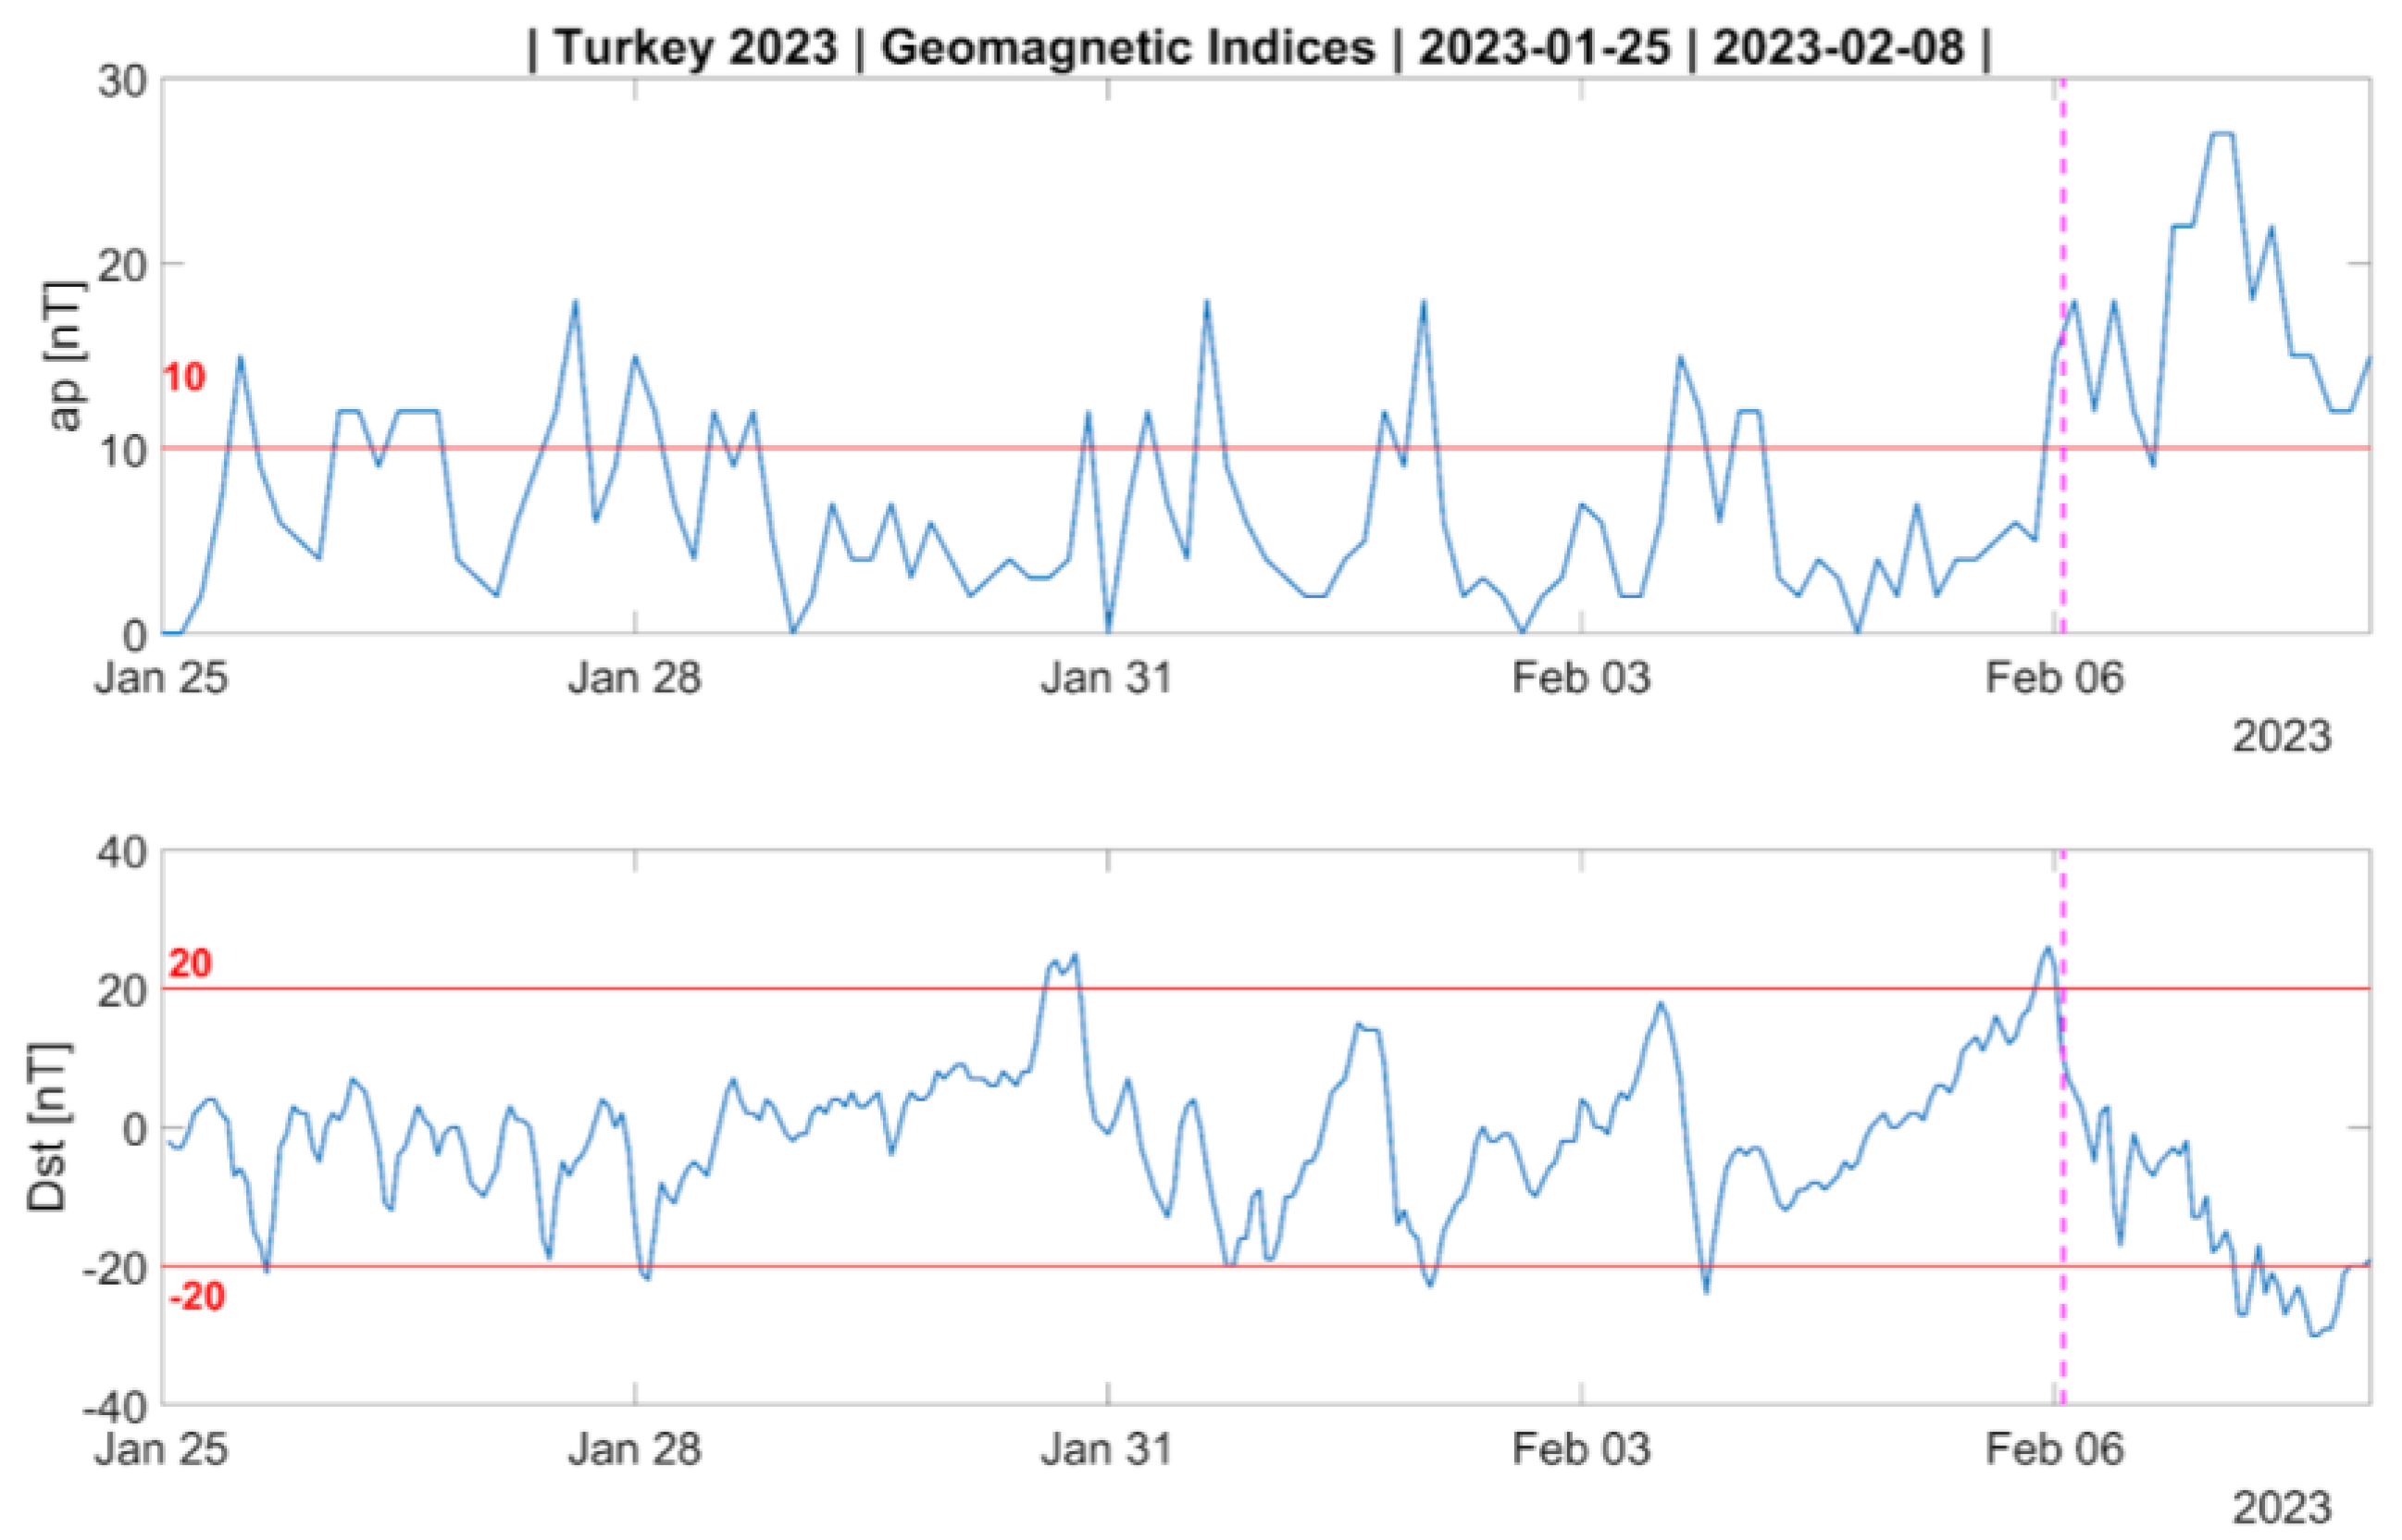
For the magnetic and electron density satellite data analyses, we carried out an automatic search (e.g., [12,62]) using the two algorithms developed to extract anomalous signals possibly related to the impending earthquake: Magnetic Anomaly Search by Spline (MASS) and Ne Anomaly Detection (NeAD), for magnetic and Ne density data, respectively. In principle, the rationale behind the two algorithms is the same: for each single satellite semi-orbit (or track), confined in the interval 50° of magnetic latitude, the first difference (first derivative) between successive values of the measurement is computed to remove the lower frequencies; then, the fit to a proper function (a cubic spline and a polynomial for MASS and NeAD, respectively) is first computed and then removed from the derivative to enhance the emergence of the small and otherwise hidden features. Once the whole track root mean square (RMS) of the “residual” signal is computed, a small window slides along the track returning the “local” rms, which, in turn, is compared to the RMS: when rms > kt·RMS, then that window is marked as “anomalous”. Not all tracks are considered. Indeed, we restrict our inspection only to those which (1) crossed the theoretical preparation circular area centred in the epicentre [63], whose radius (in km) scales with the magnitude M of the mainshock, according to the formula: R = 10 0.43 M ; and (2) when the geomagnetic indices Dst and ap respect the following conditions: Dst < 20 nT and ap < 10 nT, meaning that the geomagnetic activity, which can heavily perturb the magnetic field and the ionospheric plasma and, therefore, mislead the anomaly search results, is low.
Figure 3 shows the trend of the geomagnetic indices Dst and ap in the period from 25 February to 8 February 2023: when the ap (Dst) index values are lower than (within the) red line(s), geomagnetic conditions are quiet and the diverse analyses are applied to data (ionosonde, particle burst, etc.) since no external solar influence is expected; dashed magenta vertical line is the origin time of the first mainshock.

3.4. Electron Burst Data Analysis

Electron loss phenomena (also generally known as particle burst, PB) are considered indirect evidence of the interaction between the lithosphere (where EM signals originate) and the magnetosphere. In this perspective, from the population of PB “events” (also due to other well-established magnetospheric sources), those that are earthquake-associated must be discriminated against through their characterisation.
Starting from May 2013 to May 2023, PBs were analysed in depth, comparing them to the seismic activity, including the events of Kermadec on 15 June 2019, and Tonga on 15 January 2022 [64]. All PB-associated events with magnitudes greater or equal to 6.5 that occurred in the South Pacific were analysed, and, finally, a new kind of loss phenomenon was evidenced: it consisted of extended electron losses characterised by a more gradual increase in the CRs, lasting for several minutes; see Figure 4. A set of counting rates increasing around the South Atlantic Anomaly (SAA) is evidenced by a red ellipse. Moreover, a singular spike, which is defined as an electron burst, is highlighted in Figure 4 by a red rectangle. Extended electron losses were mainly observed westward of SAA and not far away from it. In rare cases, they were observed at longitudes less than 170°. Extended electron losses were observed to persist in the ionosphere for up to a few hours, with a drift velocity of 30°–50°/h towards the east.
Following the methodology reported in [64], this distinction will be made. Specifically, during a period of about two weeks before the Turkey mainshock, electron losses and geomagnetic activity were analysed. On 6 February 2023, the geomagnetic indices showed magnetic perturbations that may induce electron losses, so the days up to 5 February 2023 were analysed.
The algorithm used to detect electron bursts is not able to always collect both phenomena. When an extended electron loss occurs, the algorithm can detect only the higher tips of the phenomenon. At the same time, the algorithm is not able to always detect a brief duration counting rate fluctuation because the daily averages of counting rates of all the intervals of the space phase are high during extended loss phenomena. Thus, the algorithm is able to detect brief-duration electron bursts when extended losses are not observed, while it is unable to detect brief-duration electron bursts when extended losses are observed. The result is a nonhomogeneous set of electron bursts. Furthermore, it was decided that several detections along a single semi-orbit constitute a unique electron burst, therefore increasing confusion about it.
We collected and analysed data from the particle detectors working on-board all NOAA POES and MetOp satellites. Those instruments are composed of eight solid-state telescopes called Medium Energy Proton and Electron Detector (MEPED). The three NOAA satellites (NOAA-15, 18, and 19) are in quite sun-synchronous polar orbit, at altitudes between 807 and 854 km, and we considered data from all of them. Unfortunately, for MetOp satellites, which fly at altitudes ranging from 810 to 830 km, we could resort to MetOp-01 and 03 only, since MetOp-02 ended its mission in 2021. The MEPED instrumentation is composed of two proton-telescopes, monitoring the particle flux in five energy bands, in the range of 40 keV to 2.5 MeV; two electron-telescopes, in three energy bands in the range of 40 keV to 2.9 MeV; and four omnidirectional detectors, sensitive to proton energies above 16 MeV. The 0.5 Hz sampled average data of electrons and protons were obtained from the NOAA website (https://www.ngdc.noaa.gov/stp/satellite/poes/dataaccess.html, accessed on 22 September 2023) in the network Common Data Form (netCDF) format.

4. Results

4.1. Seismological Analyses

4.1.1. Magnitude of Completeness (Mc) and b-Value

Our following analyses aimed to investigate the behaviour in time of the seismic b-value to put it in relation with other seismological parameters.
For performing the analysis around the region of interest, we refined the seismic data selection on the previously downloaded catalogue, by applying some thresholds in time and space. Therefore, we restricted the catalogue to seismic events in the period from 1 January 2018 to 5 February 2023, within an area of 200 km around the epicentre, and at a depth of less than or equal to 50 km: this selection resulted in 7120 events, spatially distributed as shown in Figure 5.
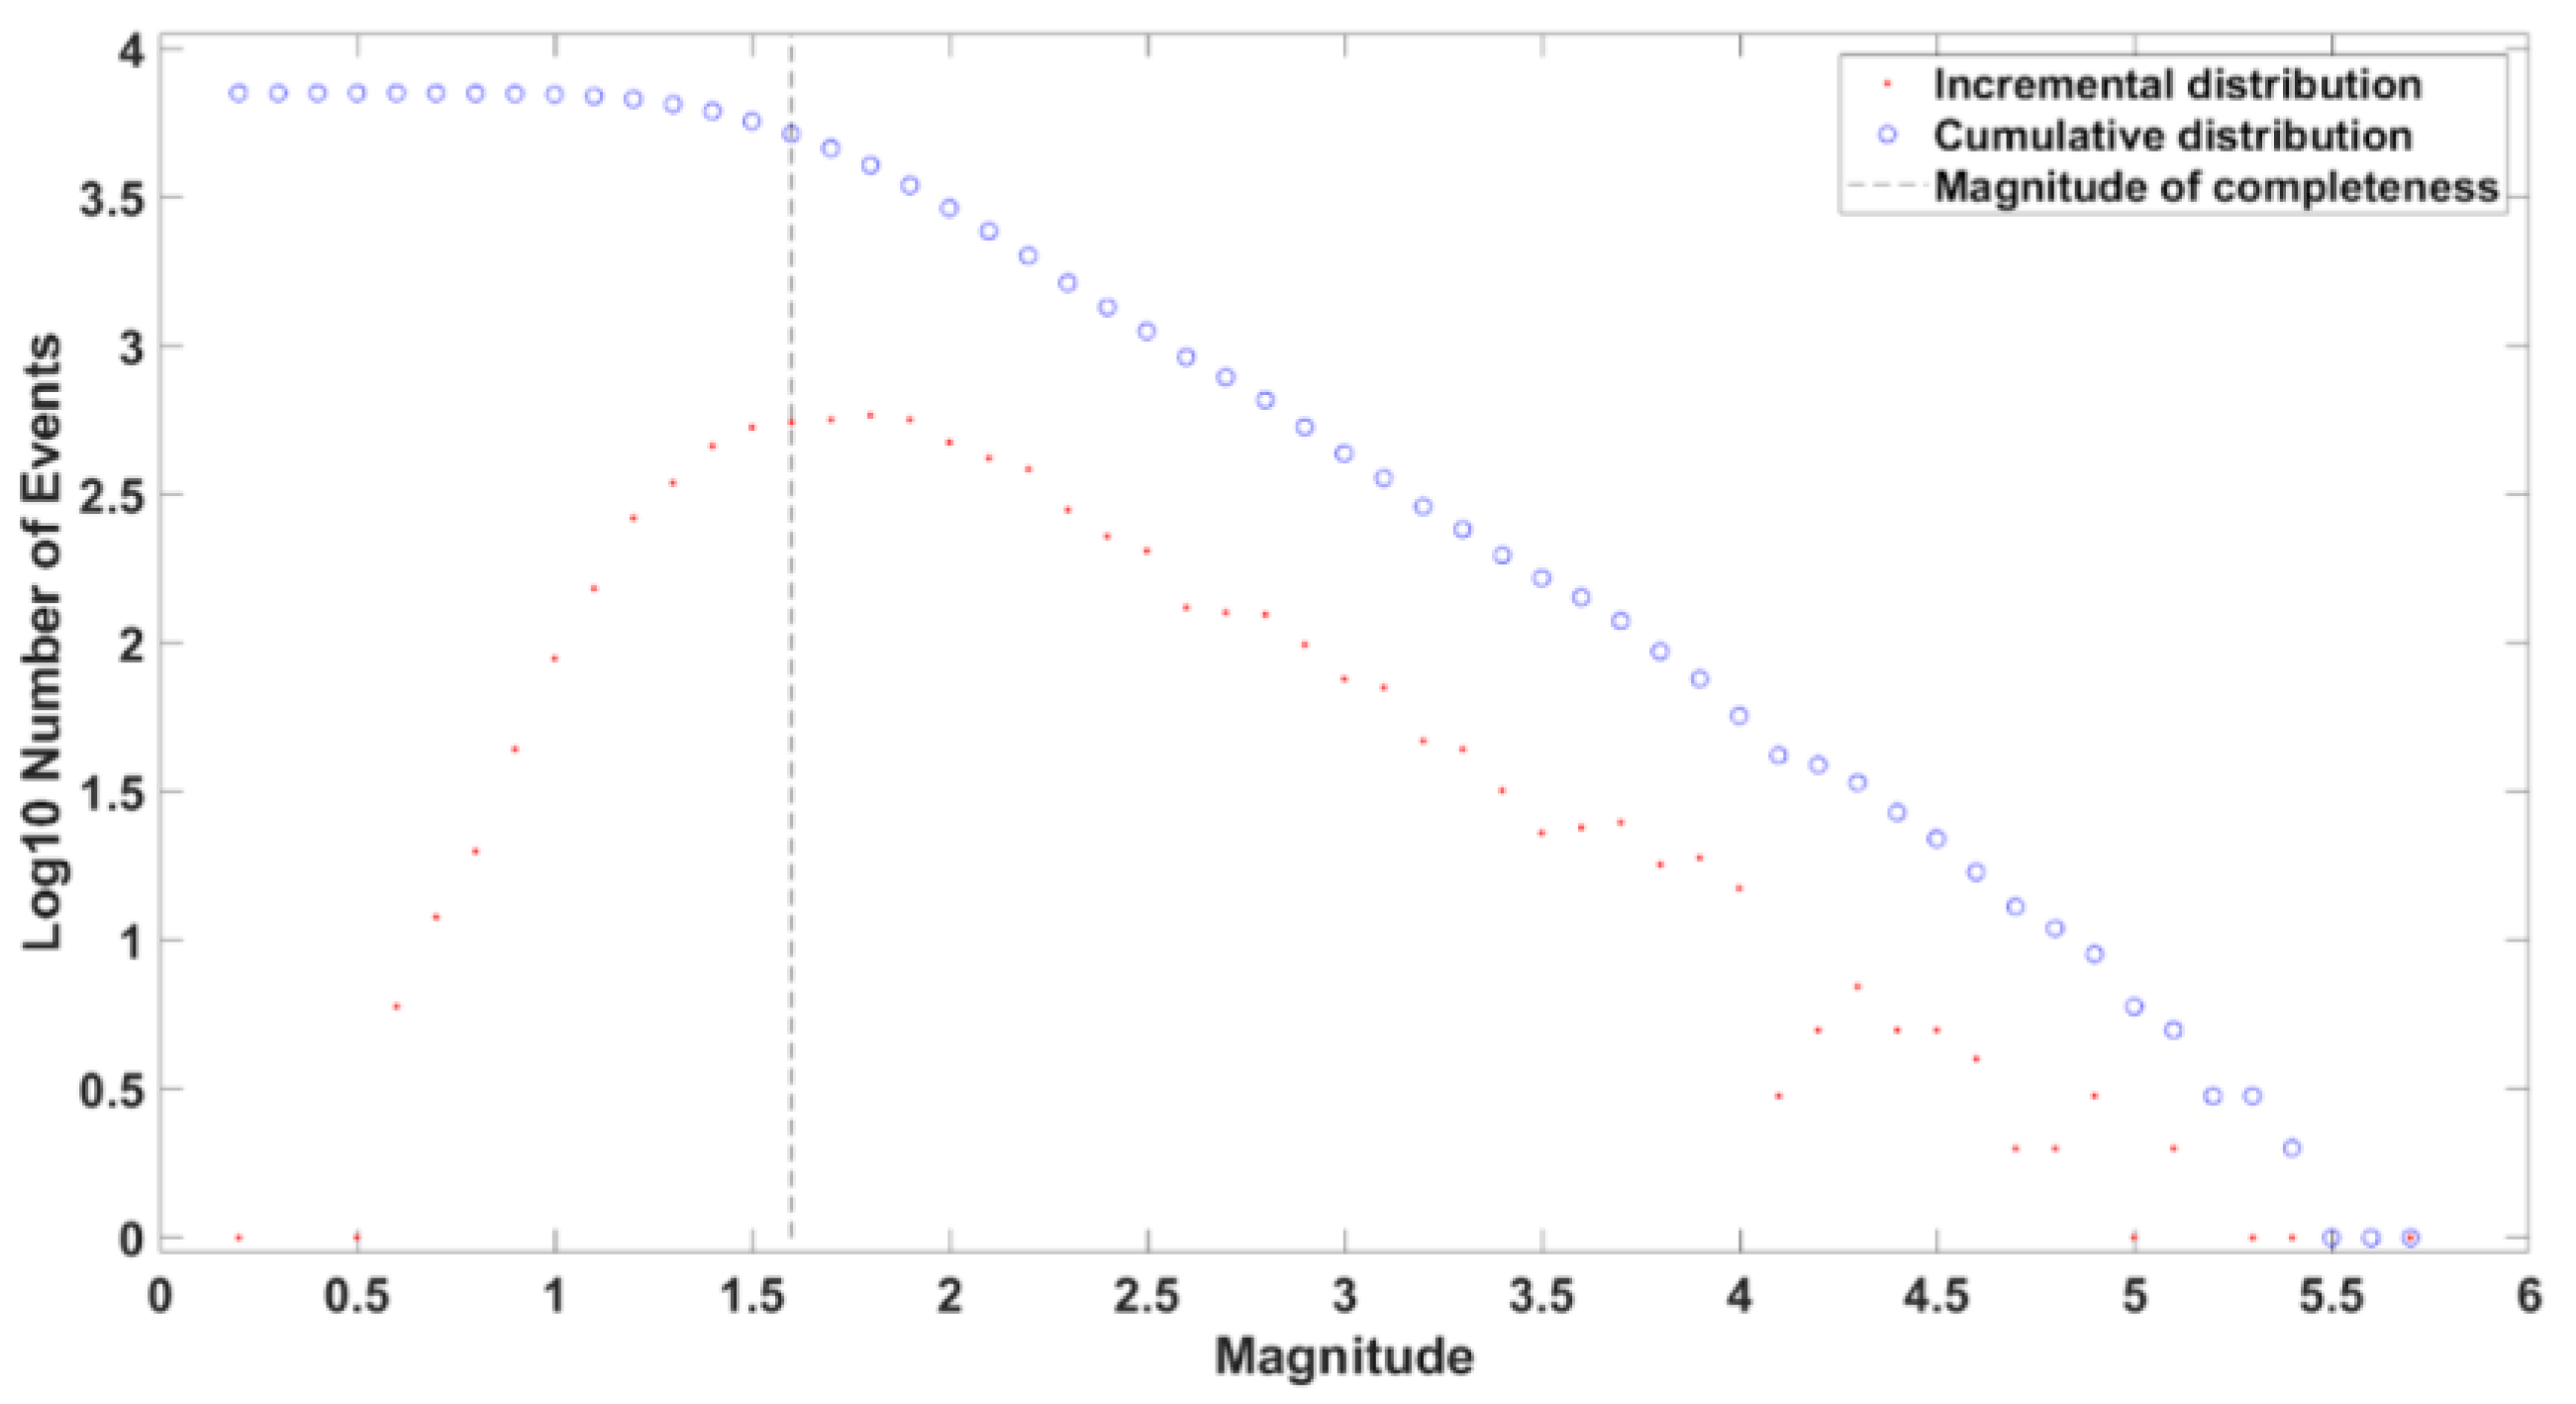
The computation of the b-value requests the knowledge of the magnitude of completeness Mc: from our analysis, we obtain a value of Mc equal to 1.6; from that magnitude and above, it included 95% of the data [49], as shown in Figure 6, considering only M1.6+ earthquakes resulted in having a total of 5187 events.
Then, we cut events with a magnitude lower than Mc to estimate the temporal variations of the b-value parameter of the Gutenberg–Richter (G–R) law.
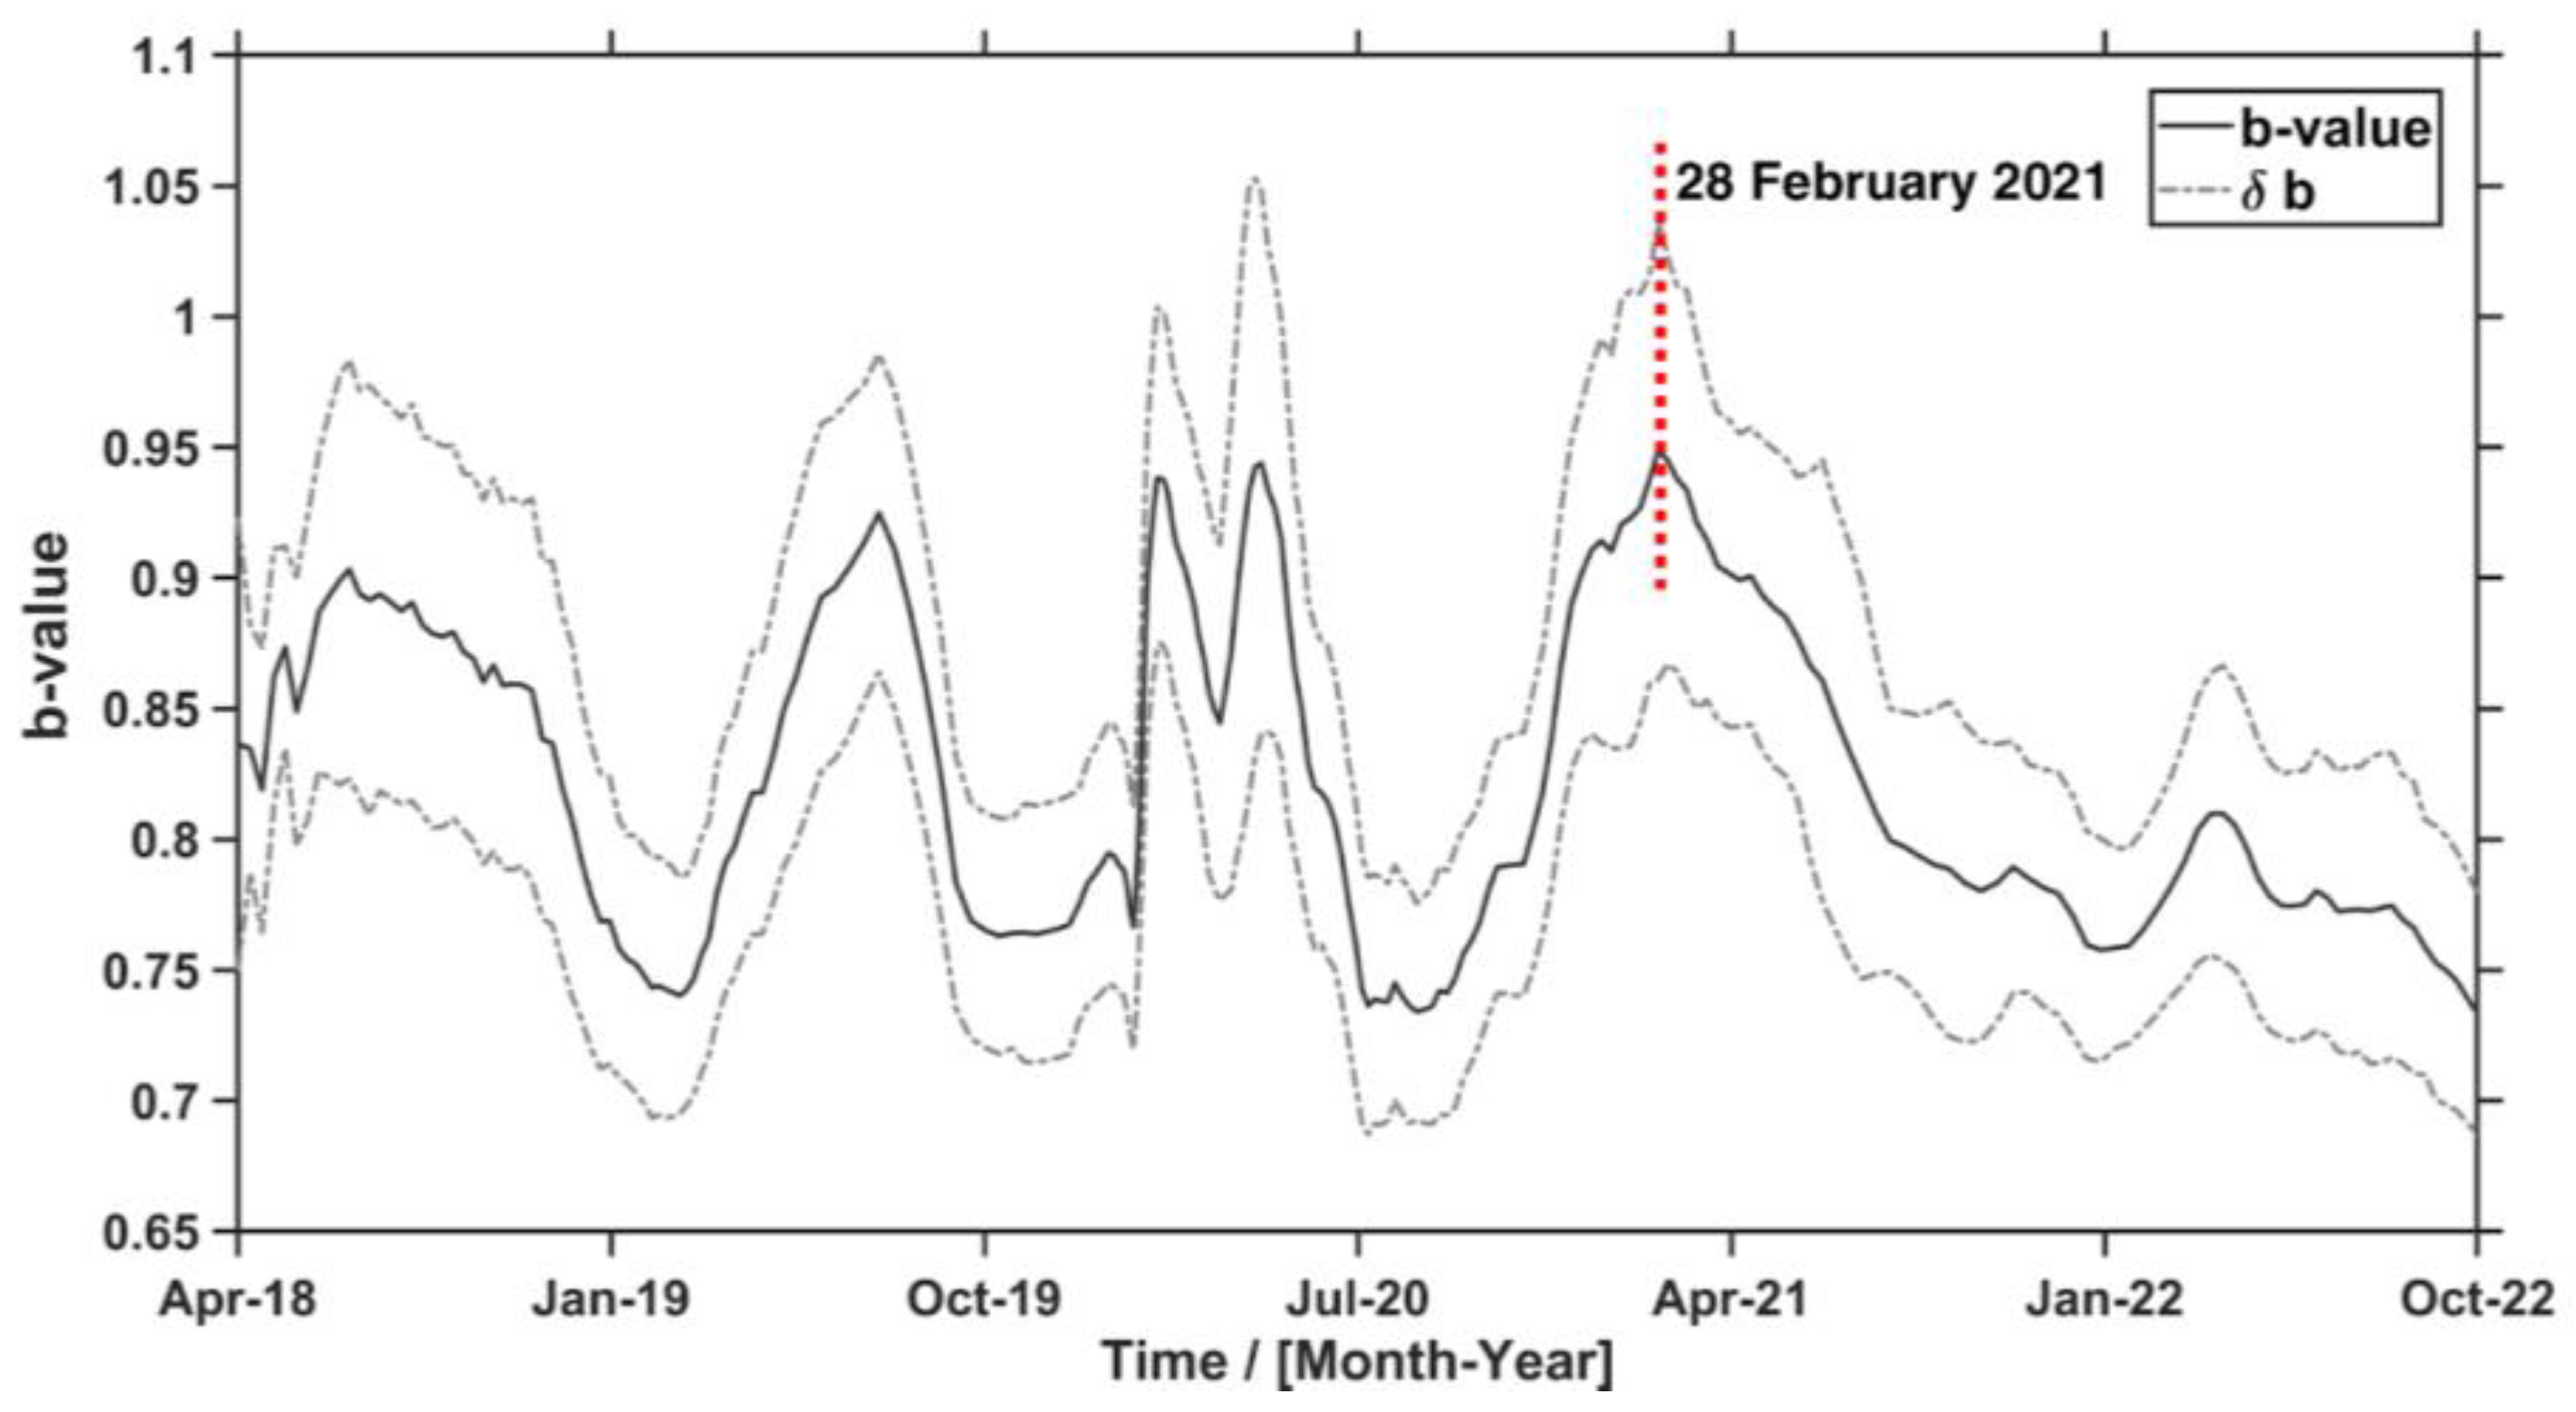
In the analysed period, the trend of the b-value shows values lower than the global average, assumed to be equal to 1 (Figure 7). In detail, it fluctuates between 0.65 and 0.85. As stated before, low b-values have been correlated with areas of increasing stress and where the nucleation of earthquakes is likely to happen [65,66,67,68,69]. This means that we can consider 28 February 2021, when the b-value began its descent from a value of 0.94 to 0.73 just before the mainshock, as a “time marker”, i.e., one of the outcomes characterising the seismicity of the area, with which to relate the anomalies or events emerging from subsequent analyses.

4.1.2. R-AMR Analysis

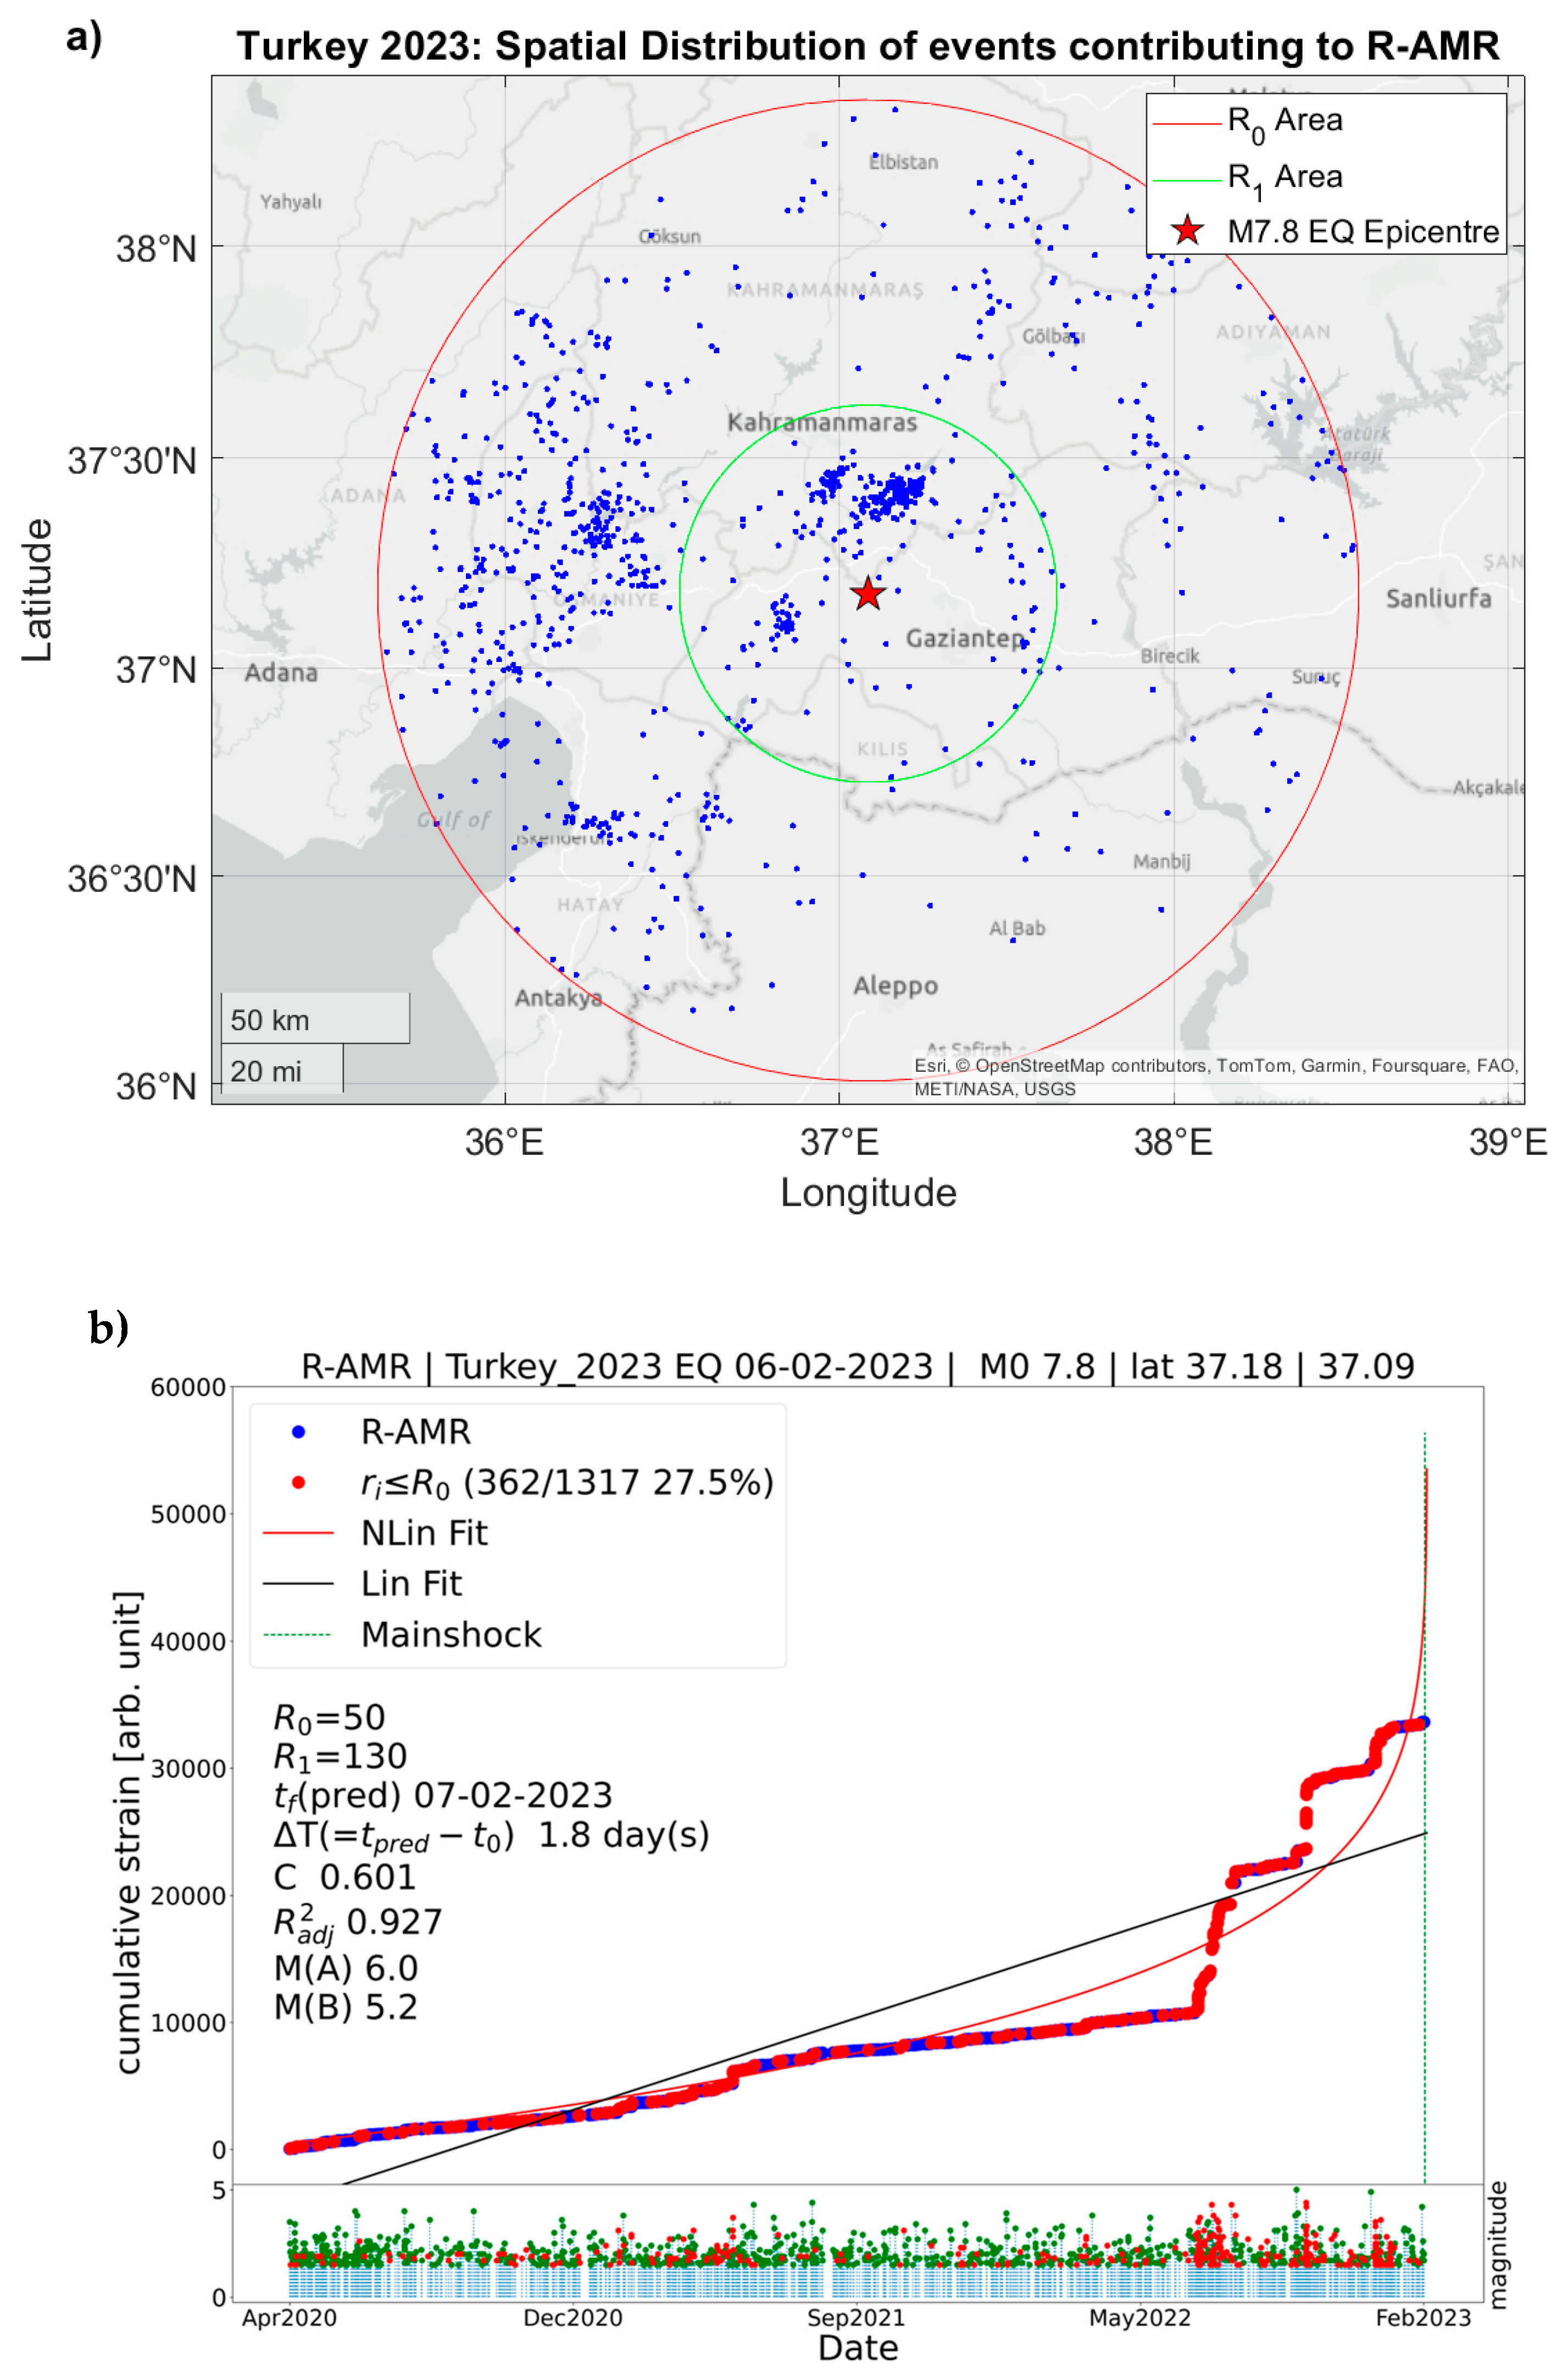
The focal search area was centred at the epicentre of the largest event of the doublet (i.e., the Mw7.8 at 01:07:33 UT), whose rupture length was estimated to be around 130 km (Figure 8). In order to also include the segment of the EAF which caused the 2021 sequence North-East with respect to the 2023 sequence, we set the maximum search distance to 300 km. Figure 8 shows the results of this analysis: consider that the mainshock and all following aftershocks were not included in the analysis. First, we notice that acceleration is evidenced: the C-value, which is a measure of the emergence of “critical” behaviour with respect to the background, equals 0.615. Moreover, the critical time tf was estimated to be less than 2 days after the real mainshock occurrence. This accelerating behaviour was manifested in a small area of the fault with a radius between 50 and 130 km around the epicentre. The R-AMR also provides two independent estimates of the impending earthquake magnitude: although these values (6.0 and 5.2) are smaller than the real values, they point to a significant earthquake magnitude.
The outcome of this automatic analysis allows us to set in around April 2020 an estimated beginning of the seismic acceleration in the lithosphere, starting from which we can look for the establishment of the different energy transmission channels towards the ionosphere, as hypothesised in the LAIC models. More important, however, among the other important outcomes of this analysis, is the slope change in the cumulative curve: starting around 6 months before the first mainshock, we can observe the increasing seismicity, which will lead the trend toward the “critical point”. Moreover, this time marker constitutes one of the pieces of the puzzle that we aim to recognise in the early stages of preparing for a strong EQ.

4.2. Atmospheric Data Analysis

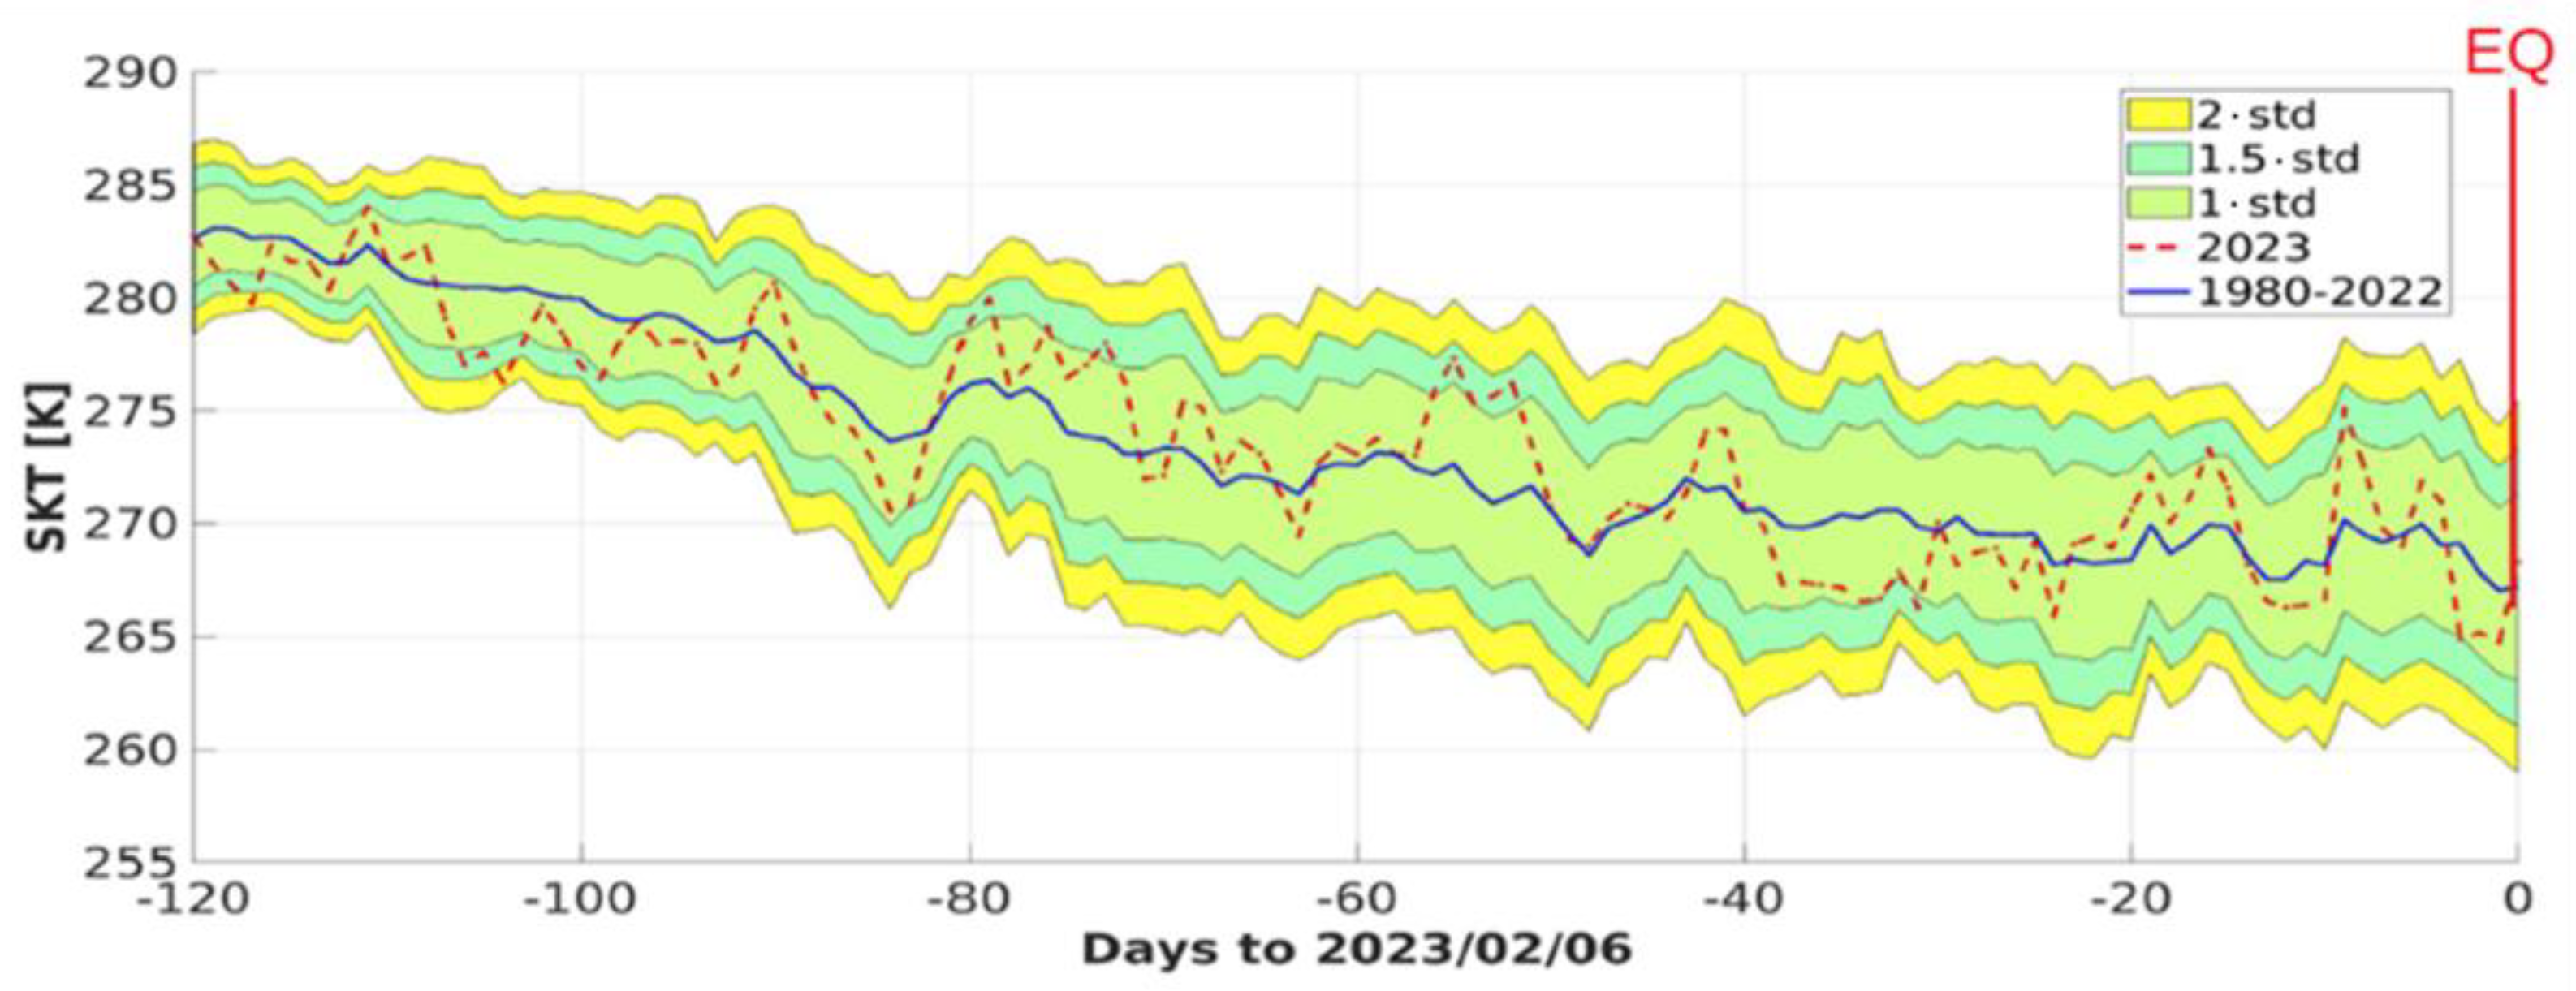
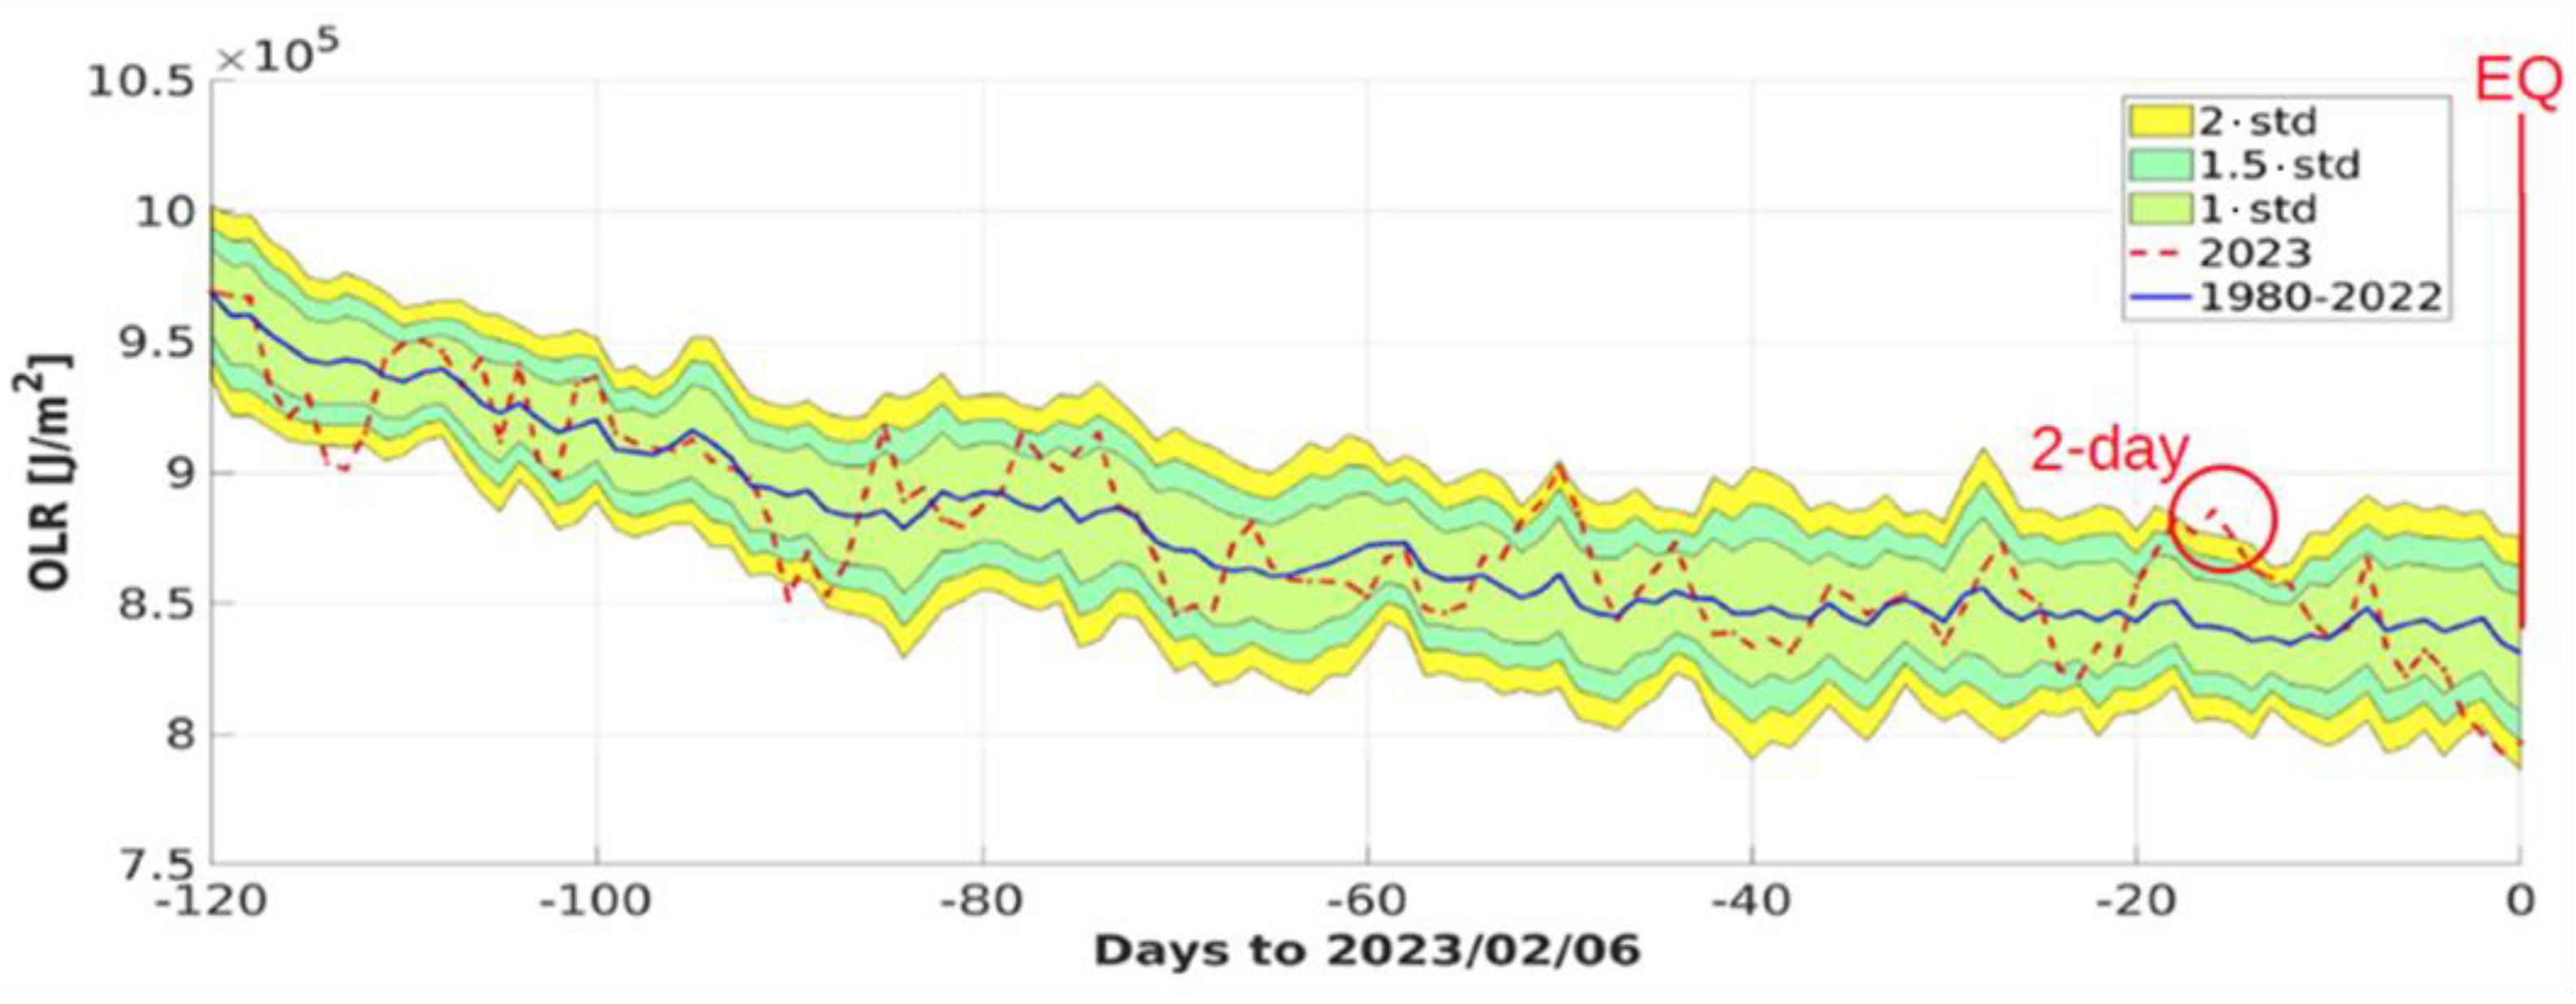
We focused on the skin temperature (SKT) and outgoing longwave radiation (OLR) over four months before the first major seismic event, comparing the data with the historical time series of the past forty-two years, i.e., from 1980 to 2022.
In the 120 days before the seismic event, no anomaly on SKT was found (Figure 9).
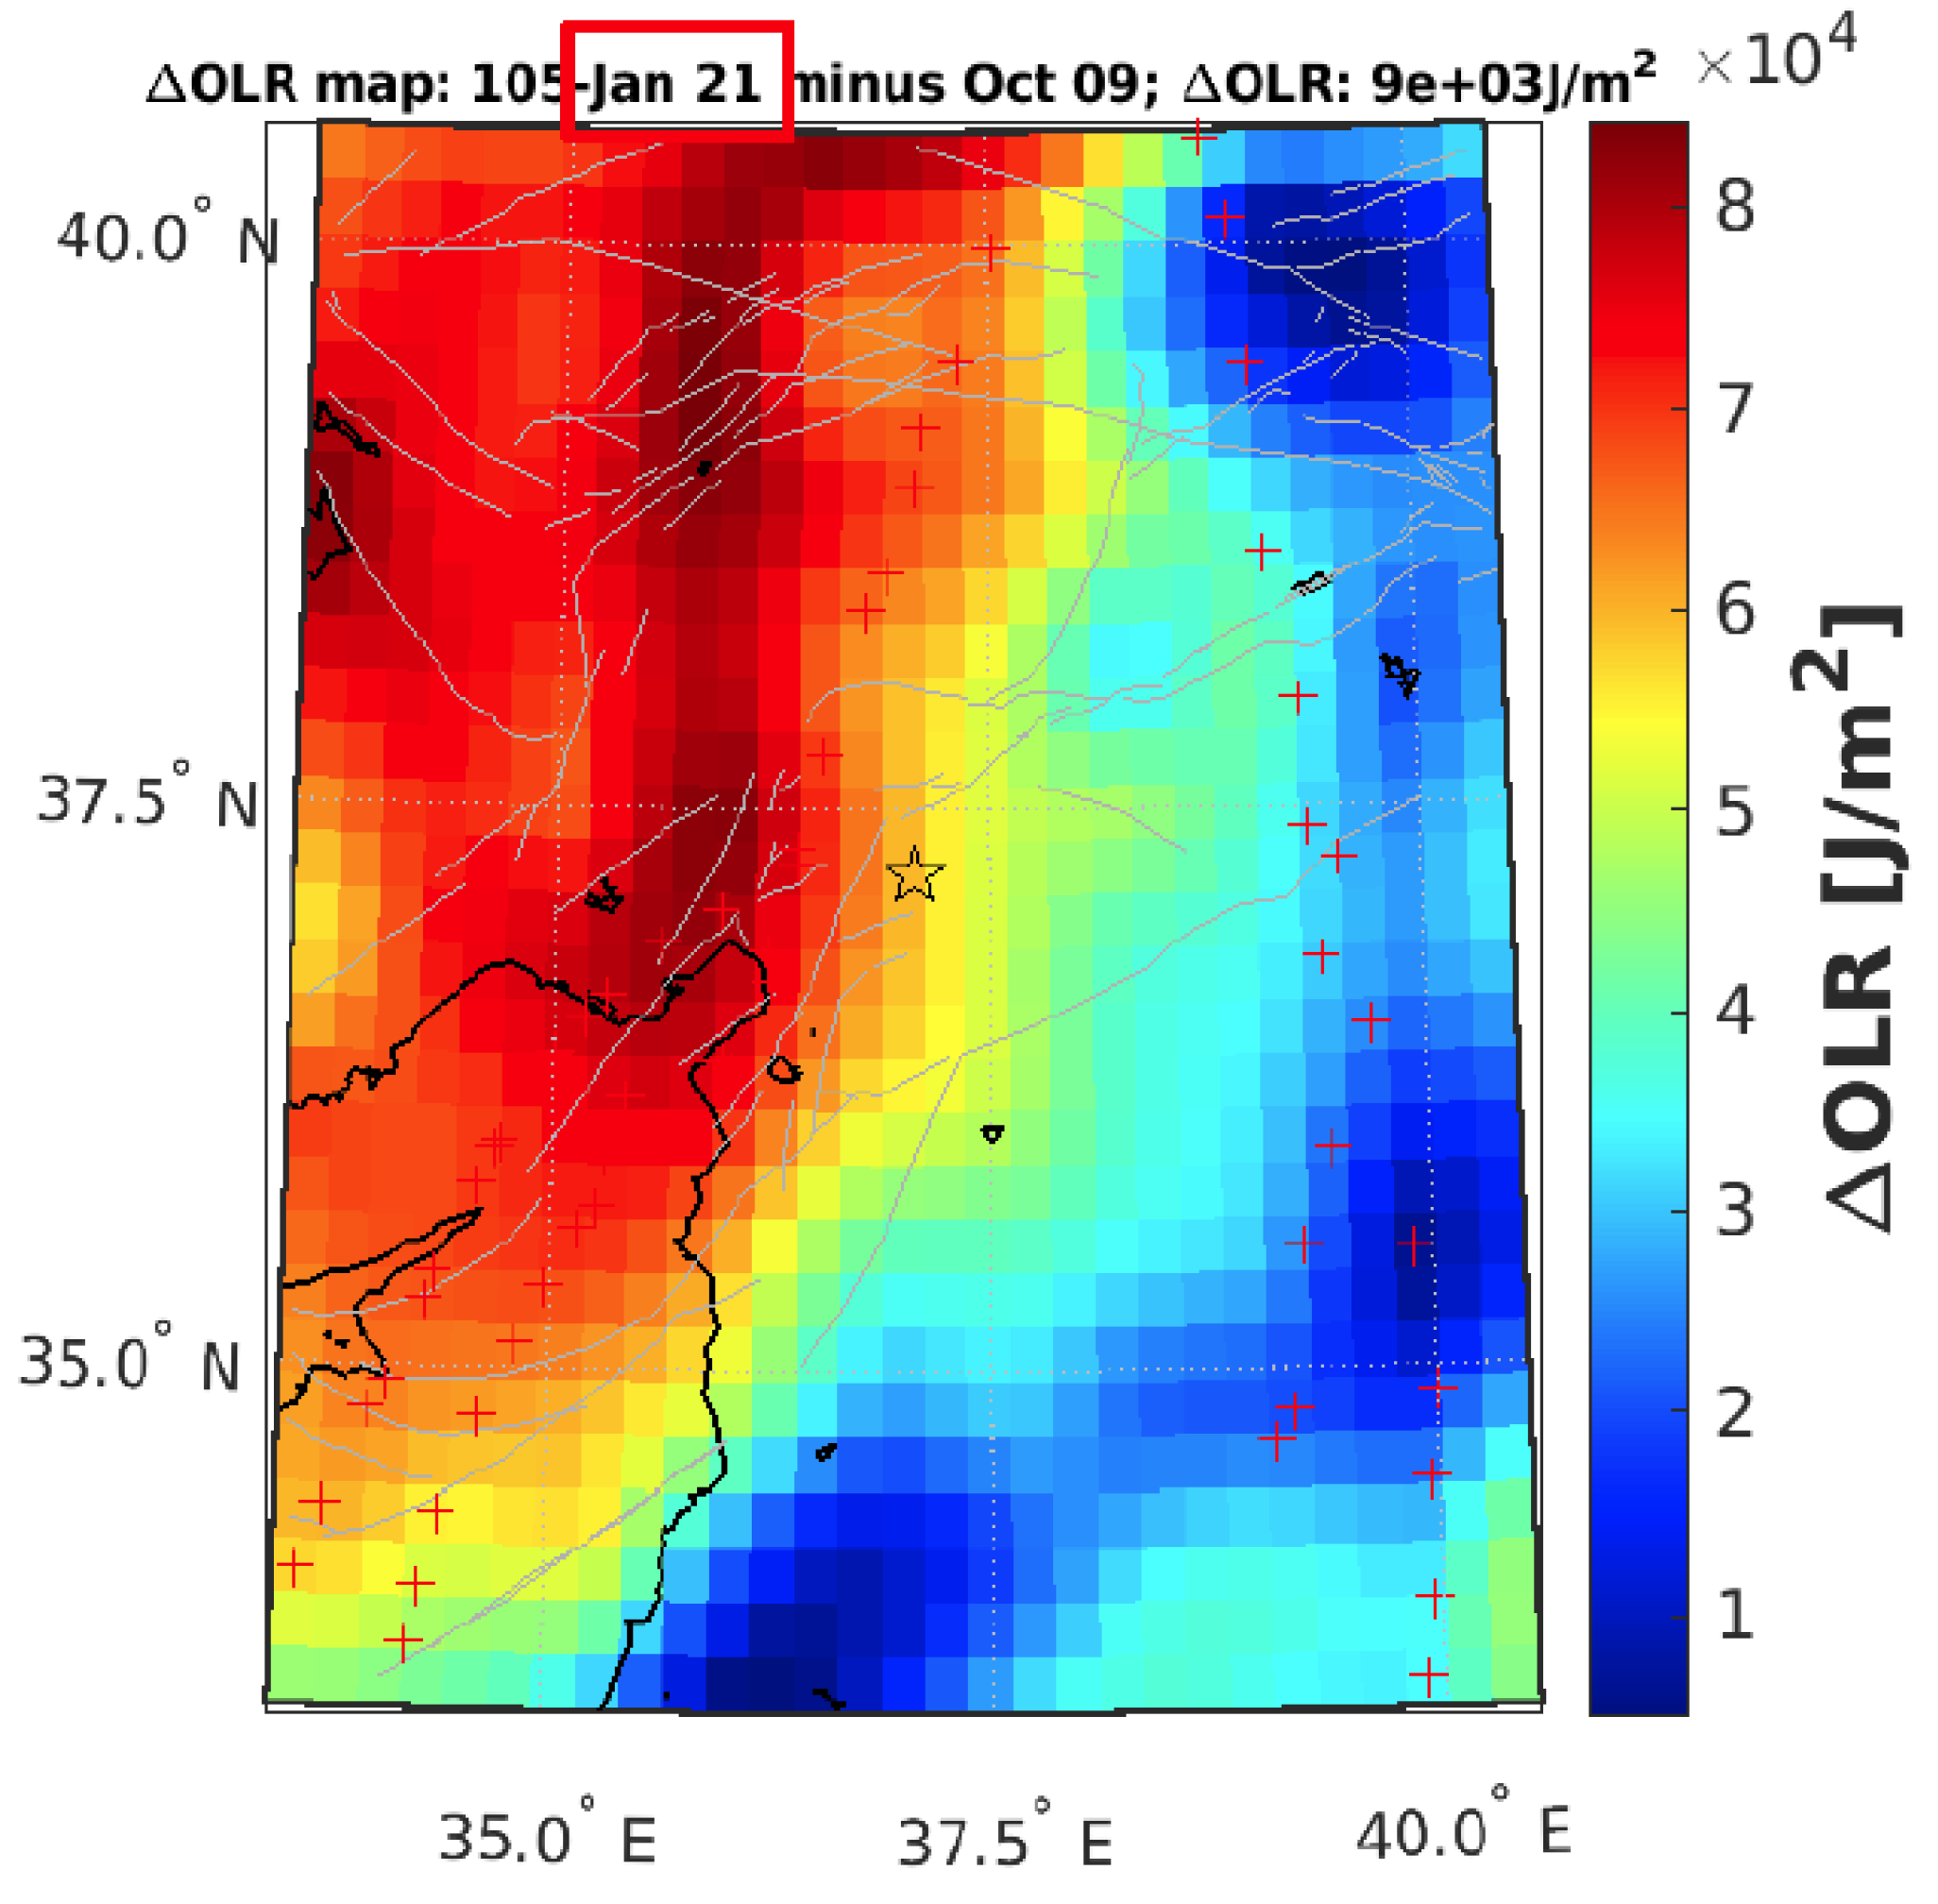
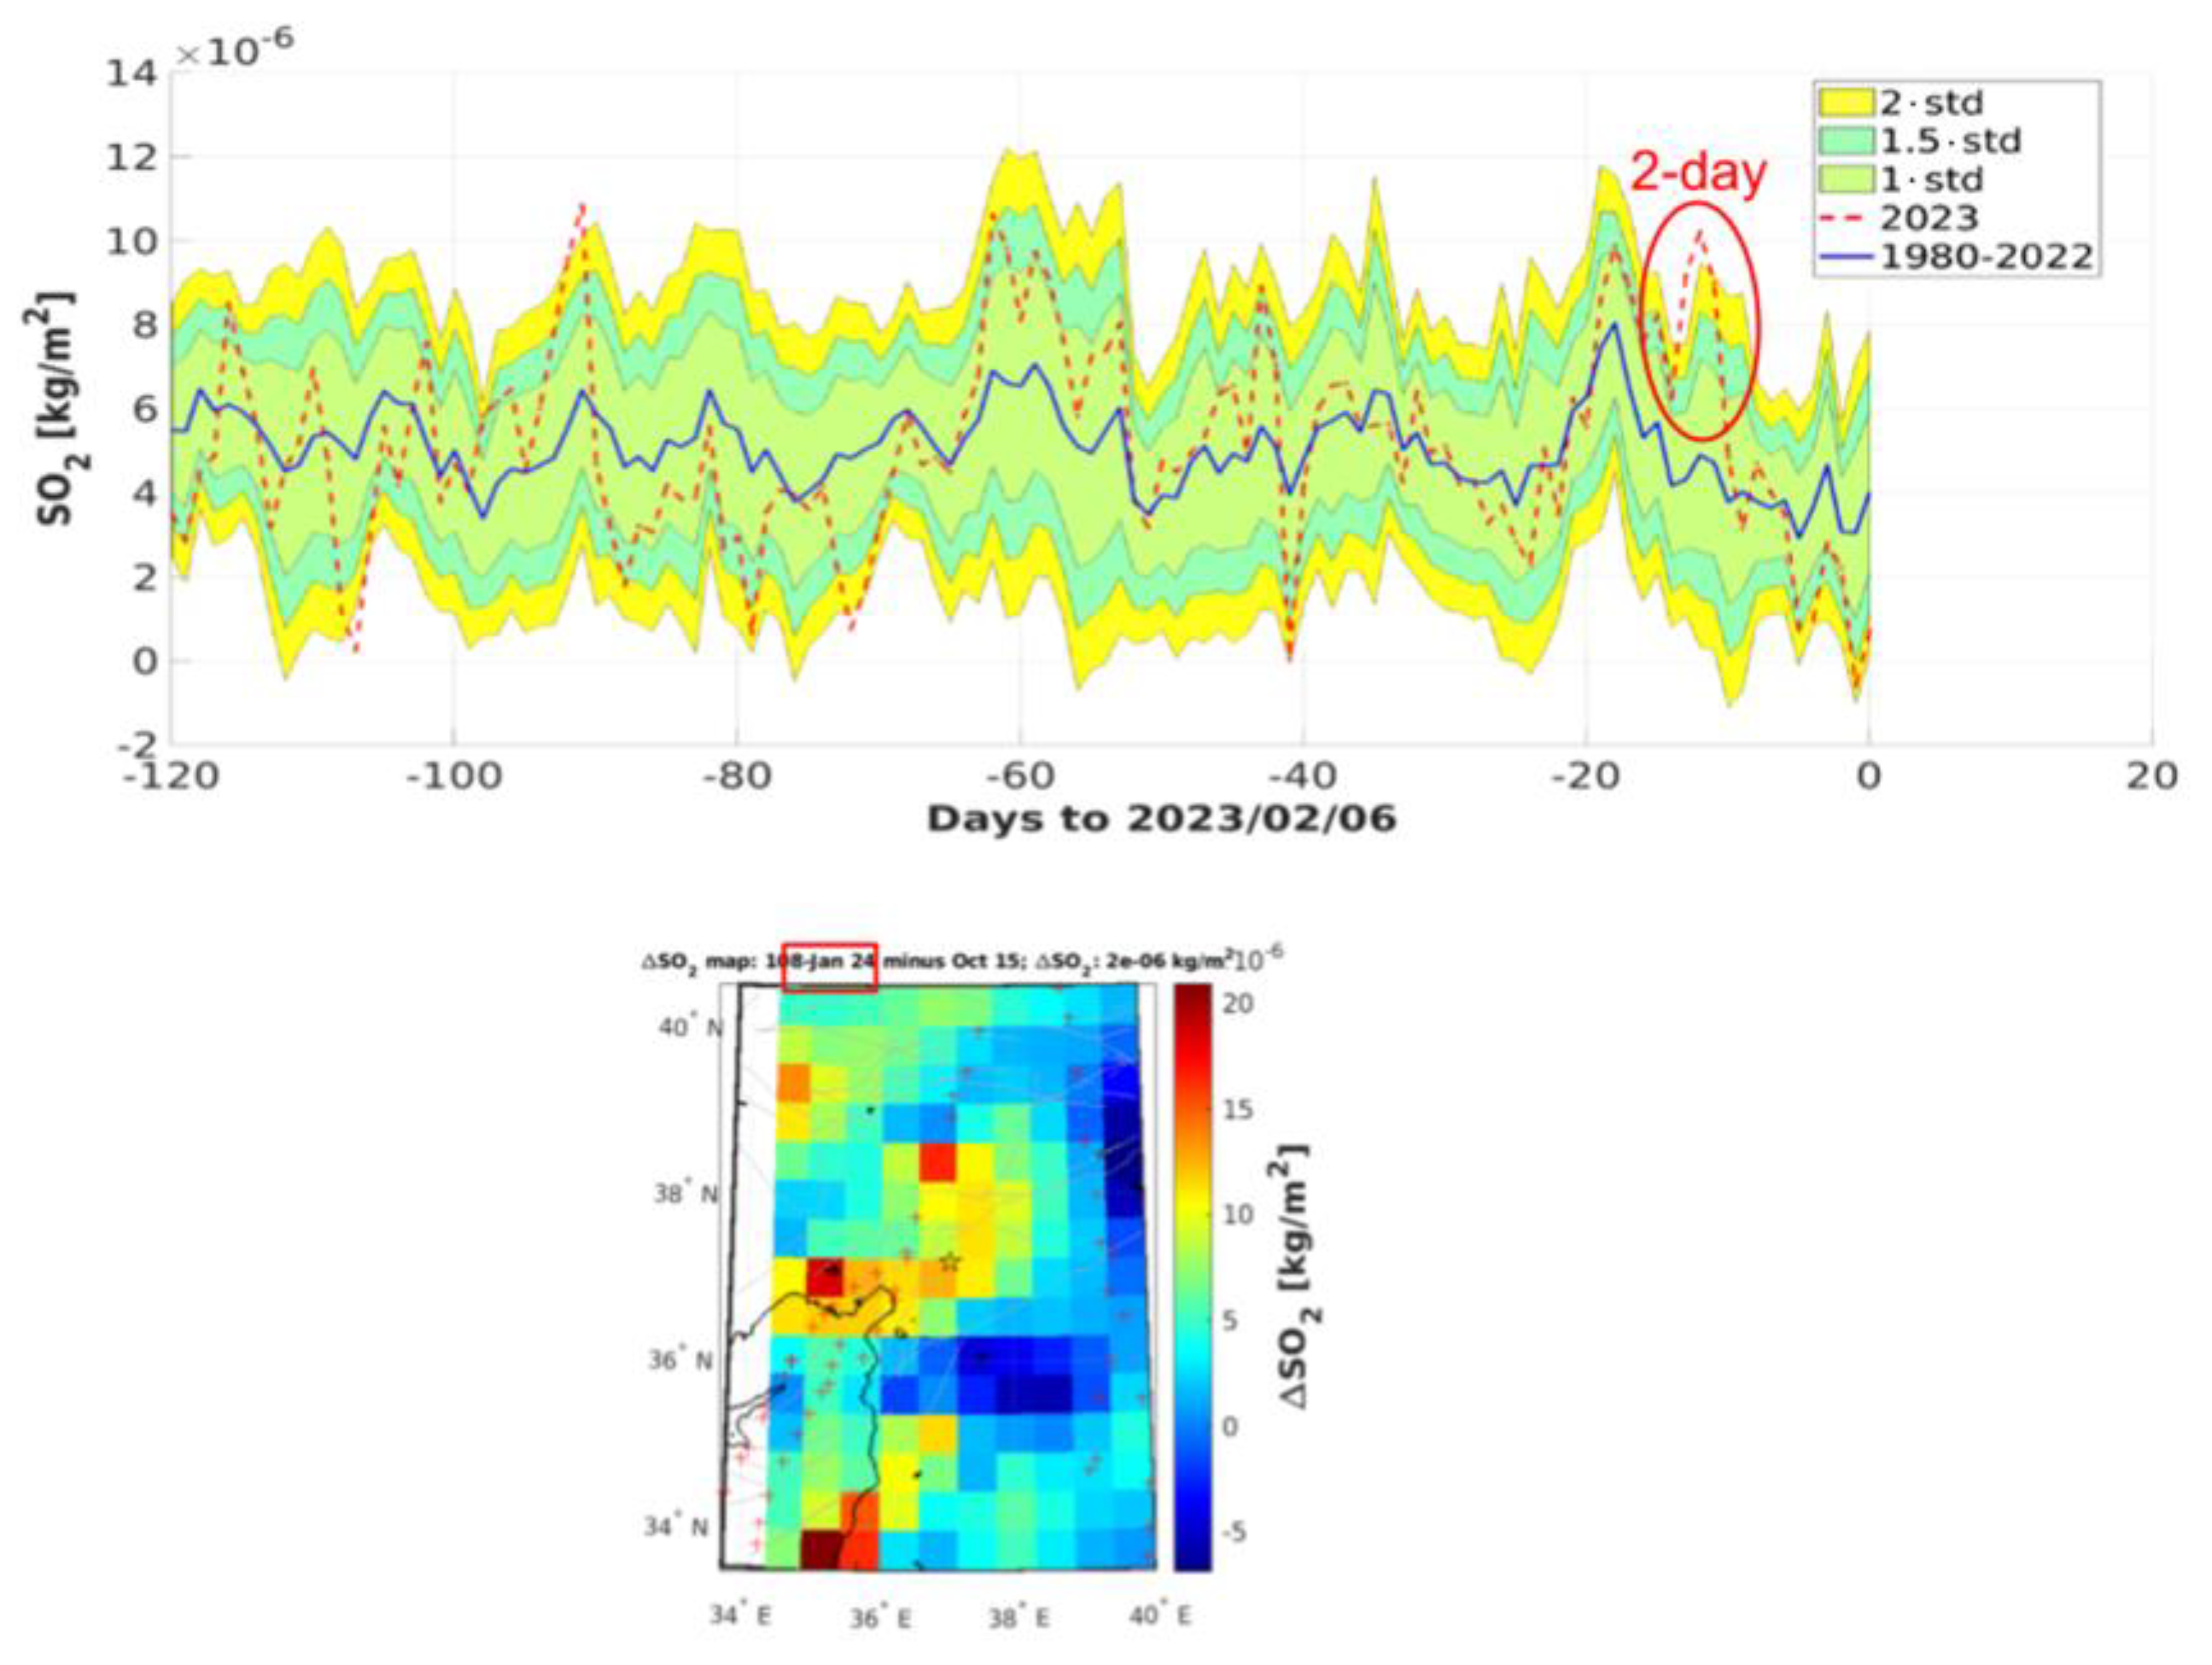
Figure 10 evidenced the OLR data with the individuation of an anomaly with a two-day persistence on 21 January 2023 (i.e., 16 days before the mainshock). In order to assure the correlation of this anomaly with the imminent EQ, we visualised the corresponding spatial distribution allowing us to check the position of this maximum value. As shown in Figure 11, this maximum had a spatial position at the west of the epicentre.
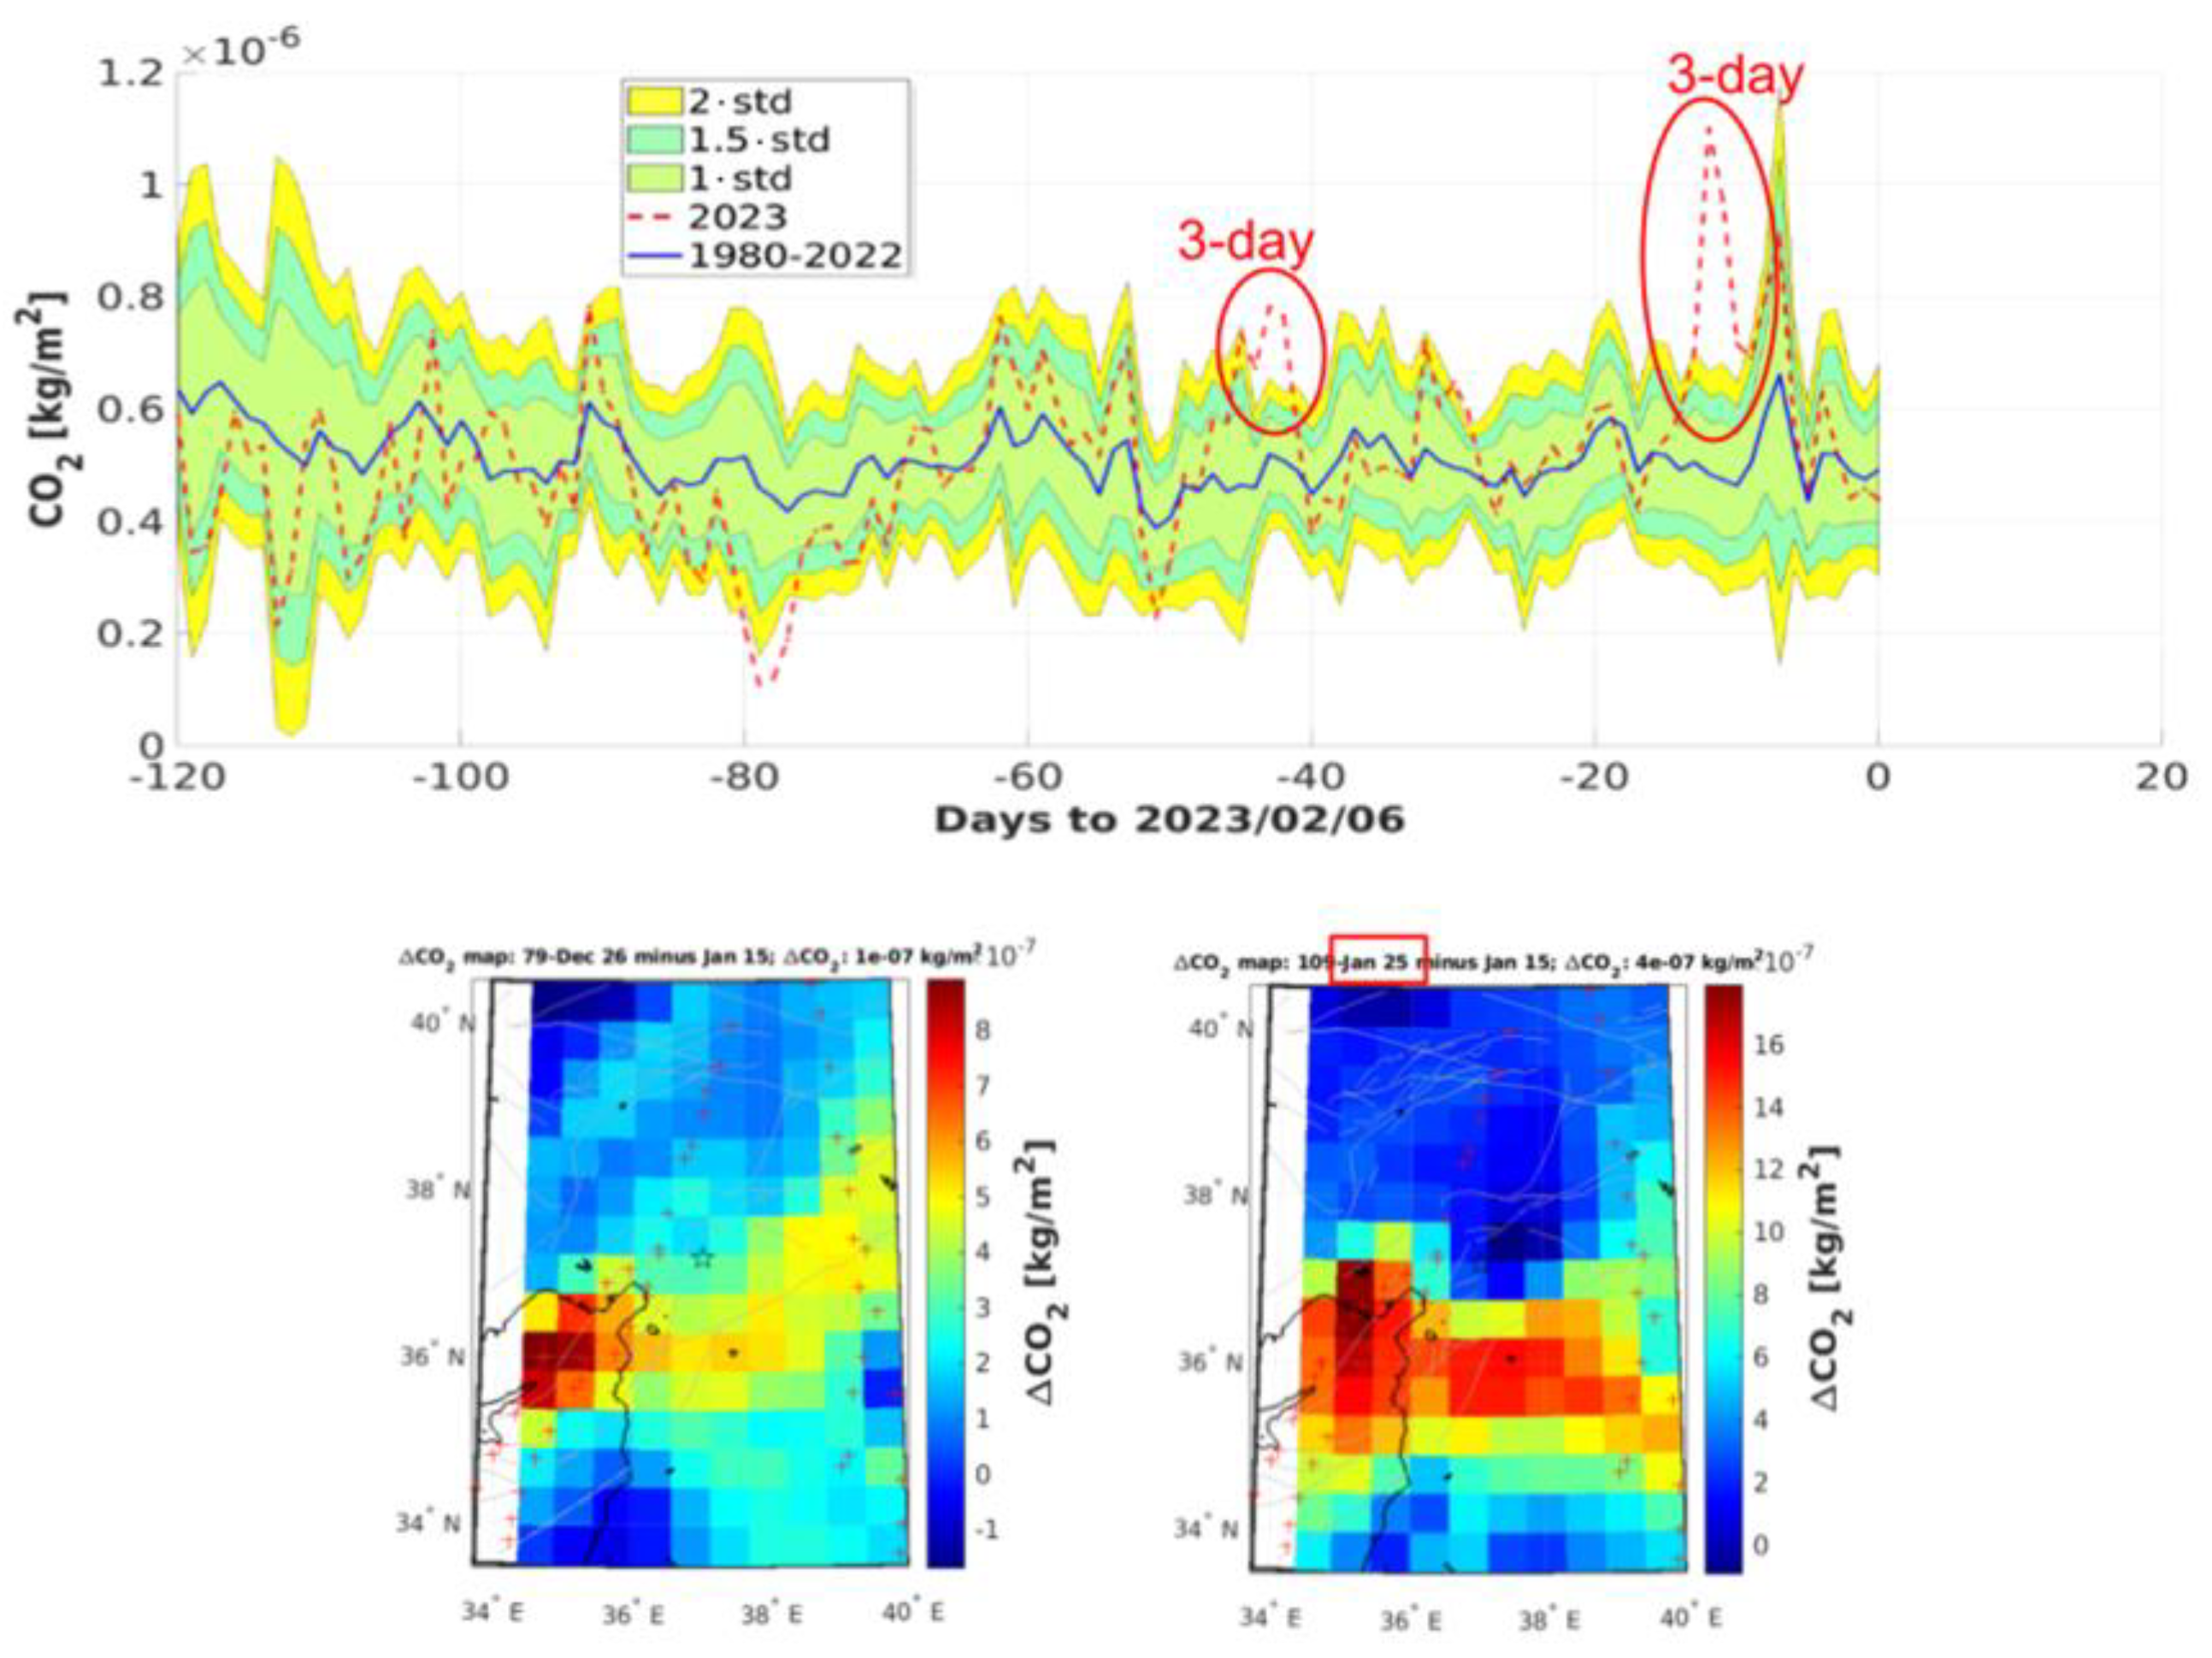
Figure 12, Figure 13 and Figure 14 show the CAPRI algorithm applied to MERRA-2 gas time series and the maps of the days characterised by the main anomaly, in the selected geographical area.
SO2, CO2, and CO show main anomalies occurred on 24–25 January and 3 February, i.e., 13, 12, and 3 days before the earthquake, respectively. The SO2 anomaly has a two-day persistence, while CO2 and CO had a 3-day and 7-day persistence, respectively.
Looking at the anomaly maps, we can see that the concentration of maximum values is close to the EQ epicentre.

4.3. Swarm and CSES-01 Magnetic and Electron Density Data Analysis

We searched for anomalous signals on satellite data tracks in a time period ranging from 90 days before and 10 days after the main earthquake (M7.8), analysing the Ne from all the Swarm satellites and CSES-01, and the three magnetic field components from Swarm-A only, as mentioned above in the Data section.
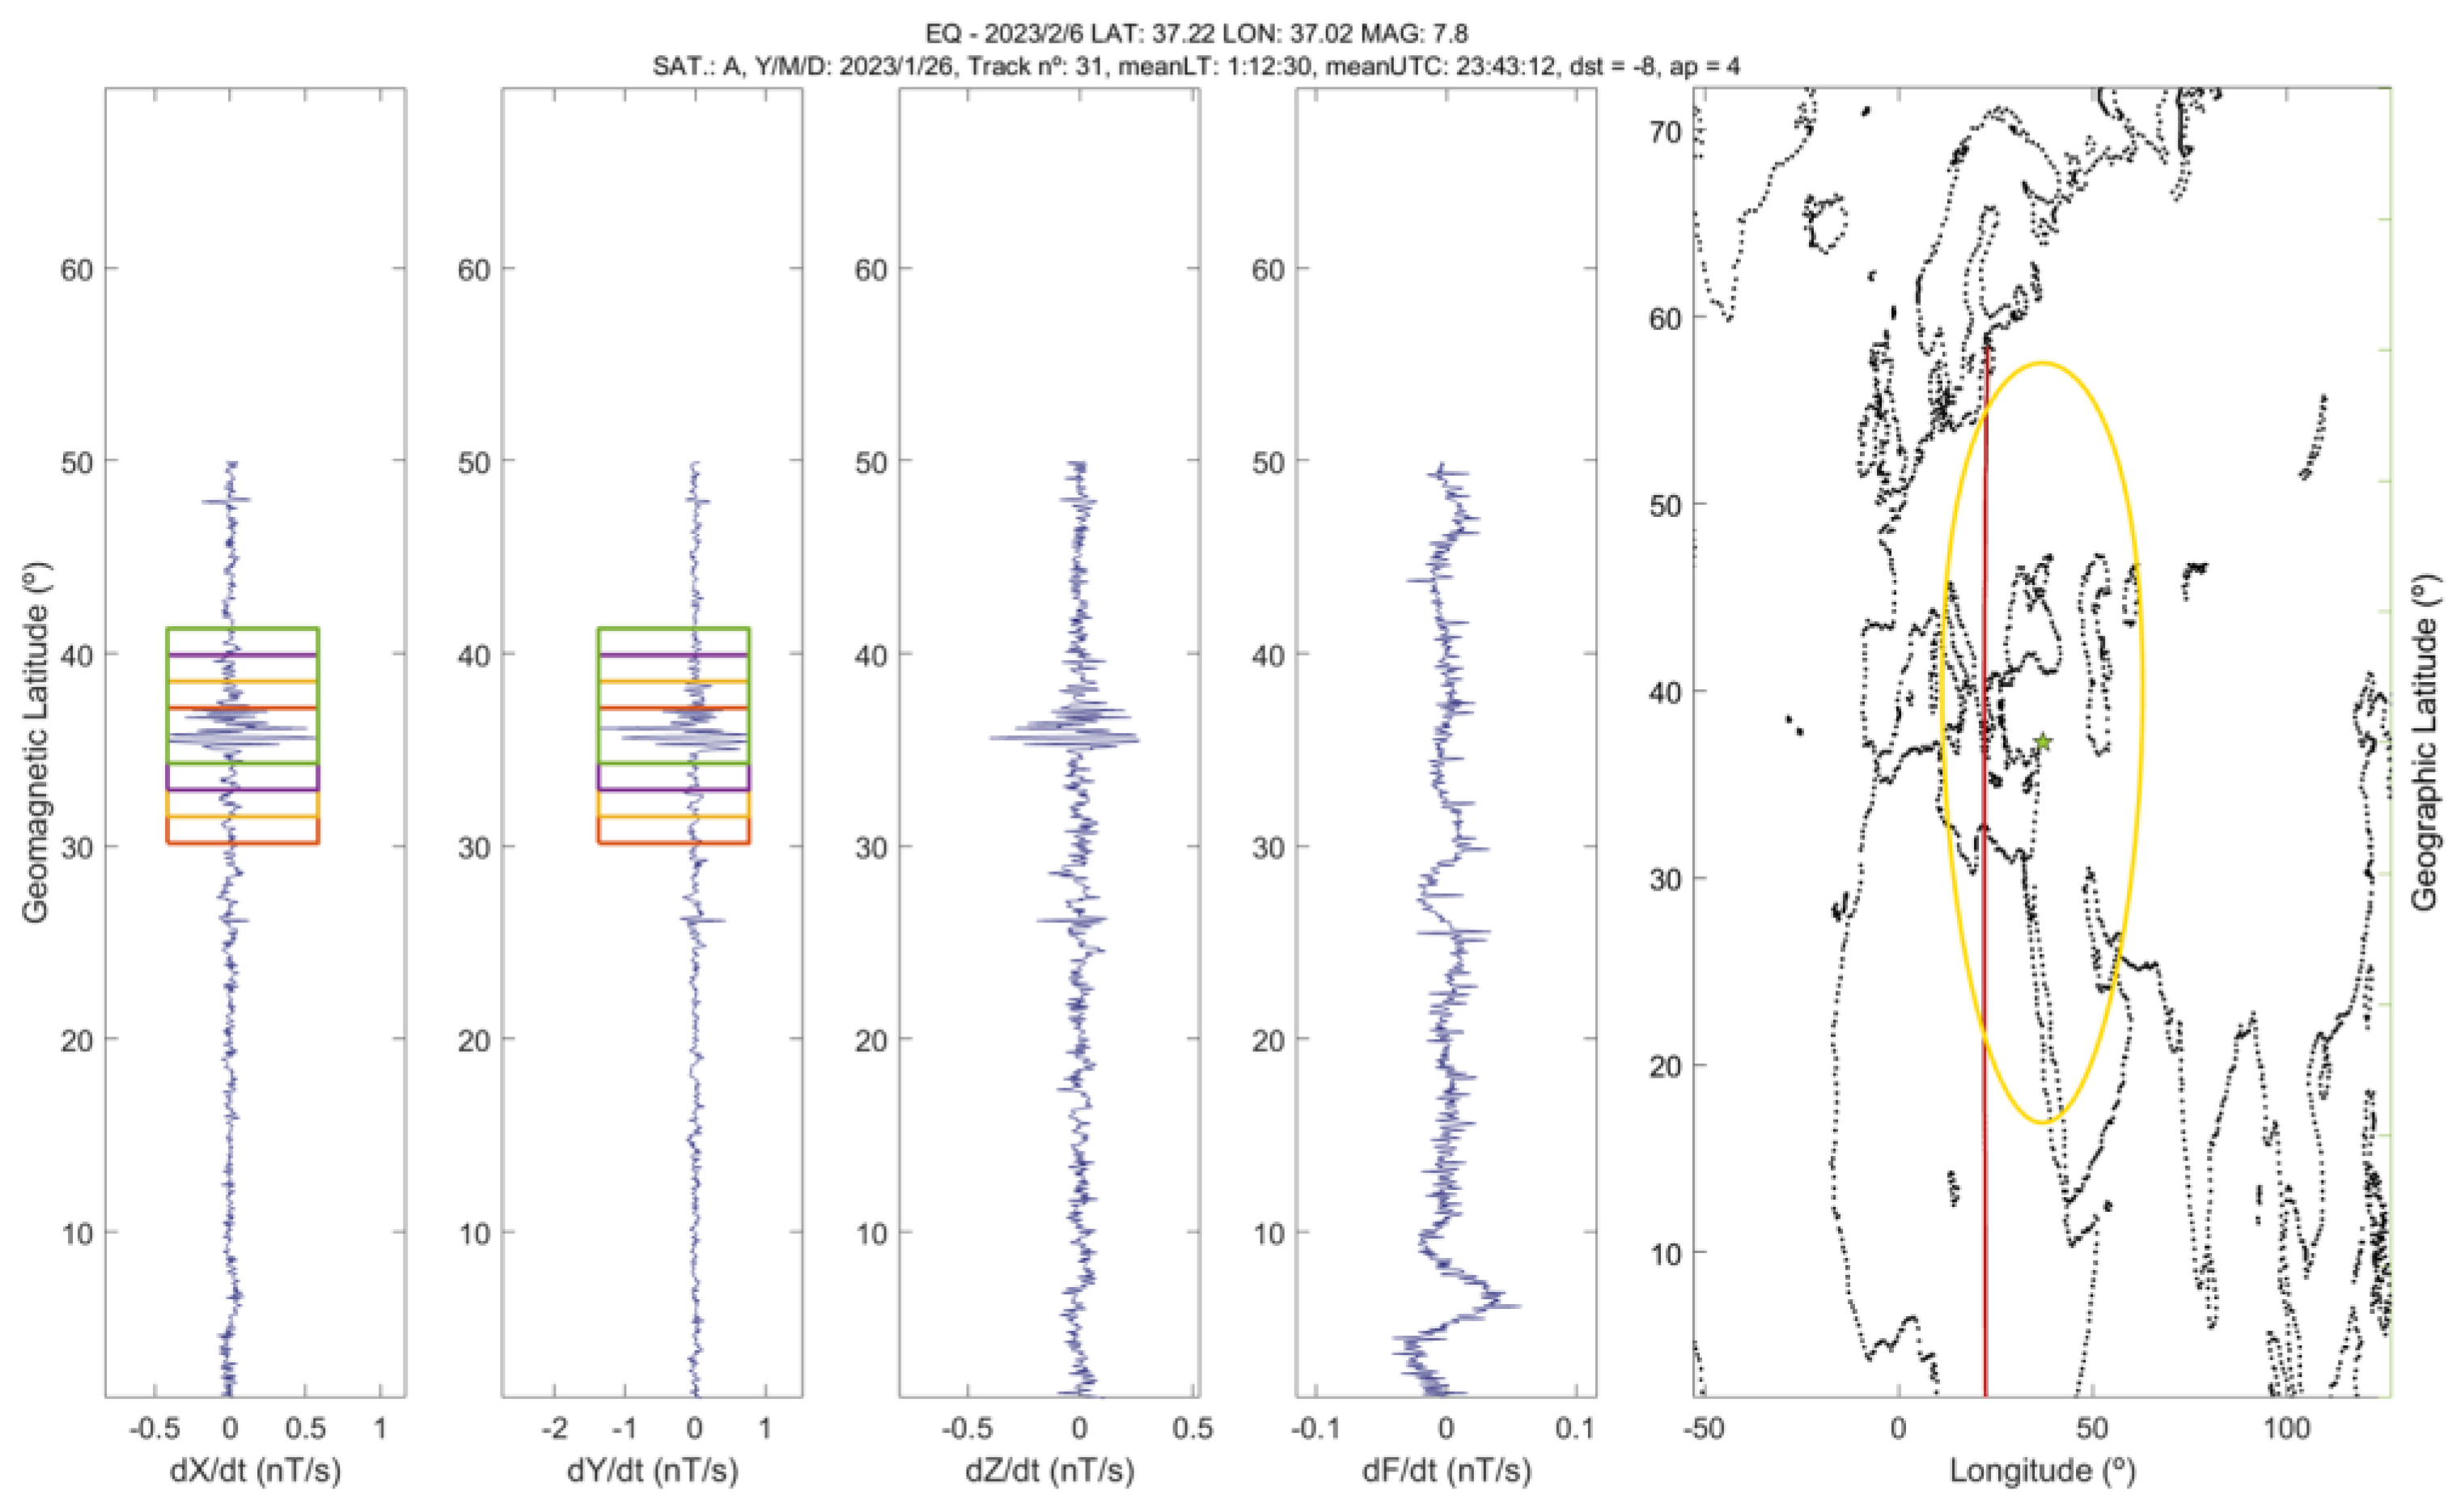
From the analysis of the Swarm-A magnetic data, we collected some interesting “anomalies” on several days before the M7.8; the first of the two large earthquakes occurred on 6 February, taken as a time reference: on 10 and 13 November 2022 (i.e., 88 and 85 days before the mainshock, respectively), on 15 December 2022 (i.e., 53 days before), on 11, 20, 26, and 29 January 2023 (i.e., 26, 17, 11, and 8 days in advance, respectively), on 3 February 2023 (i.e., 3 days before the earthquake), and on 14 February 2023 (i.e., 8 days after the EQ “doublets” and with the seismic sequence running). Figure 15 shows the case of 26 January 2023, i.e., 11 days before the main EQ.
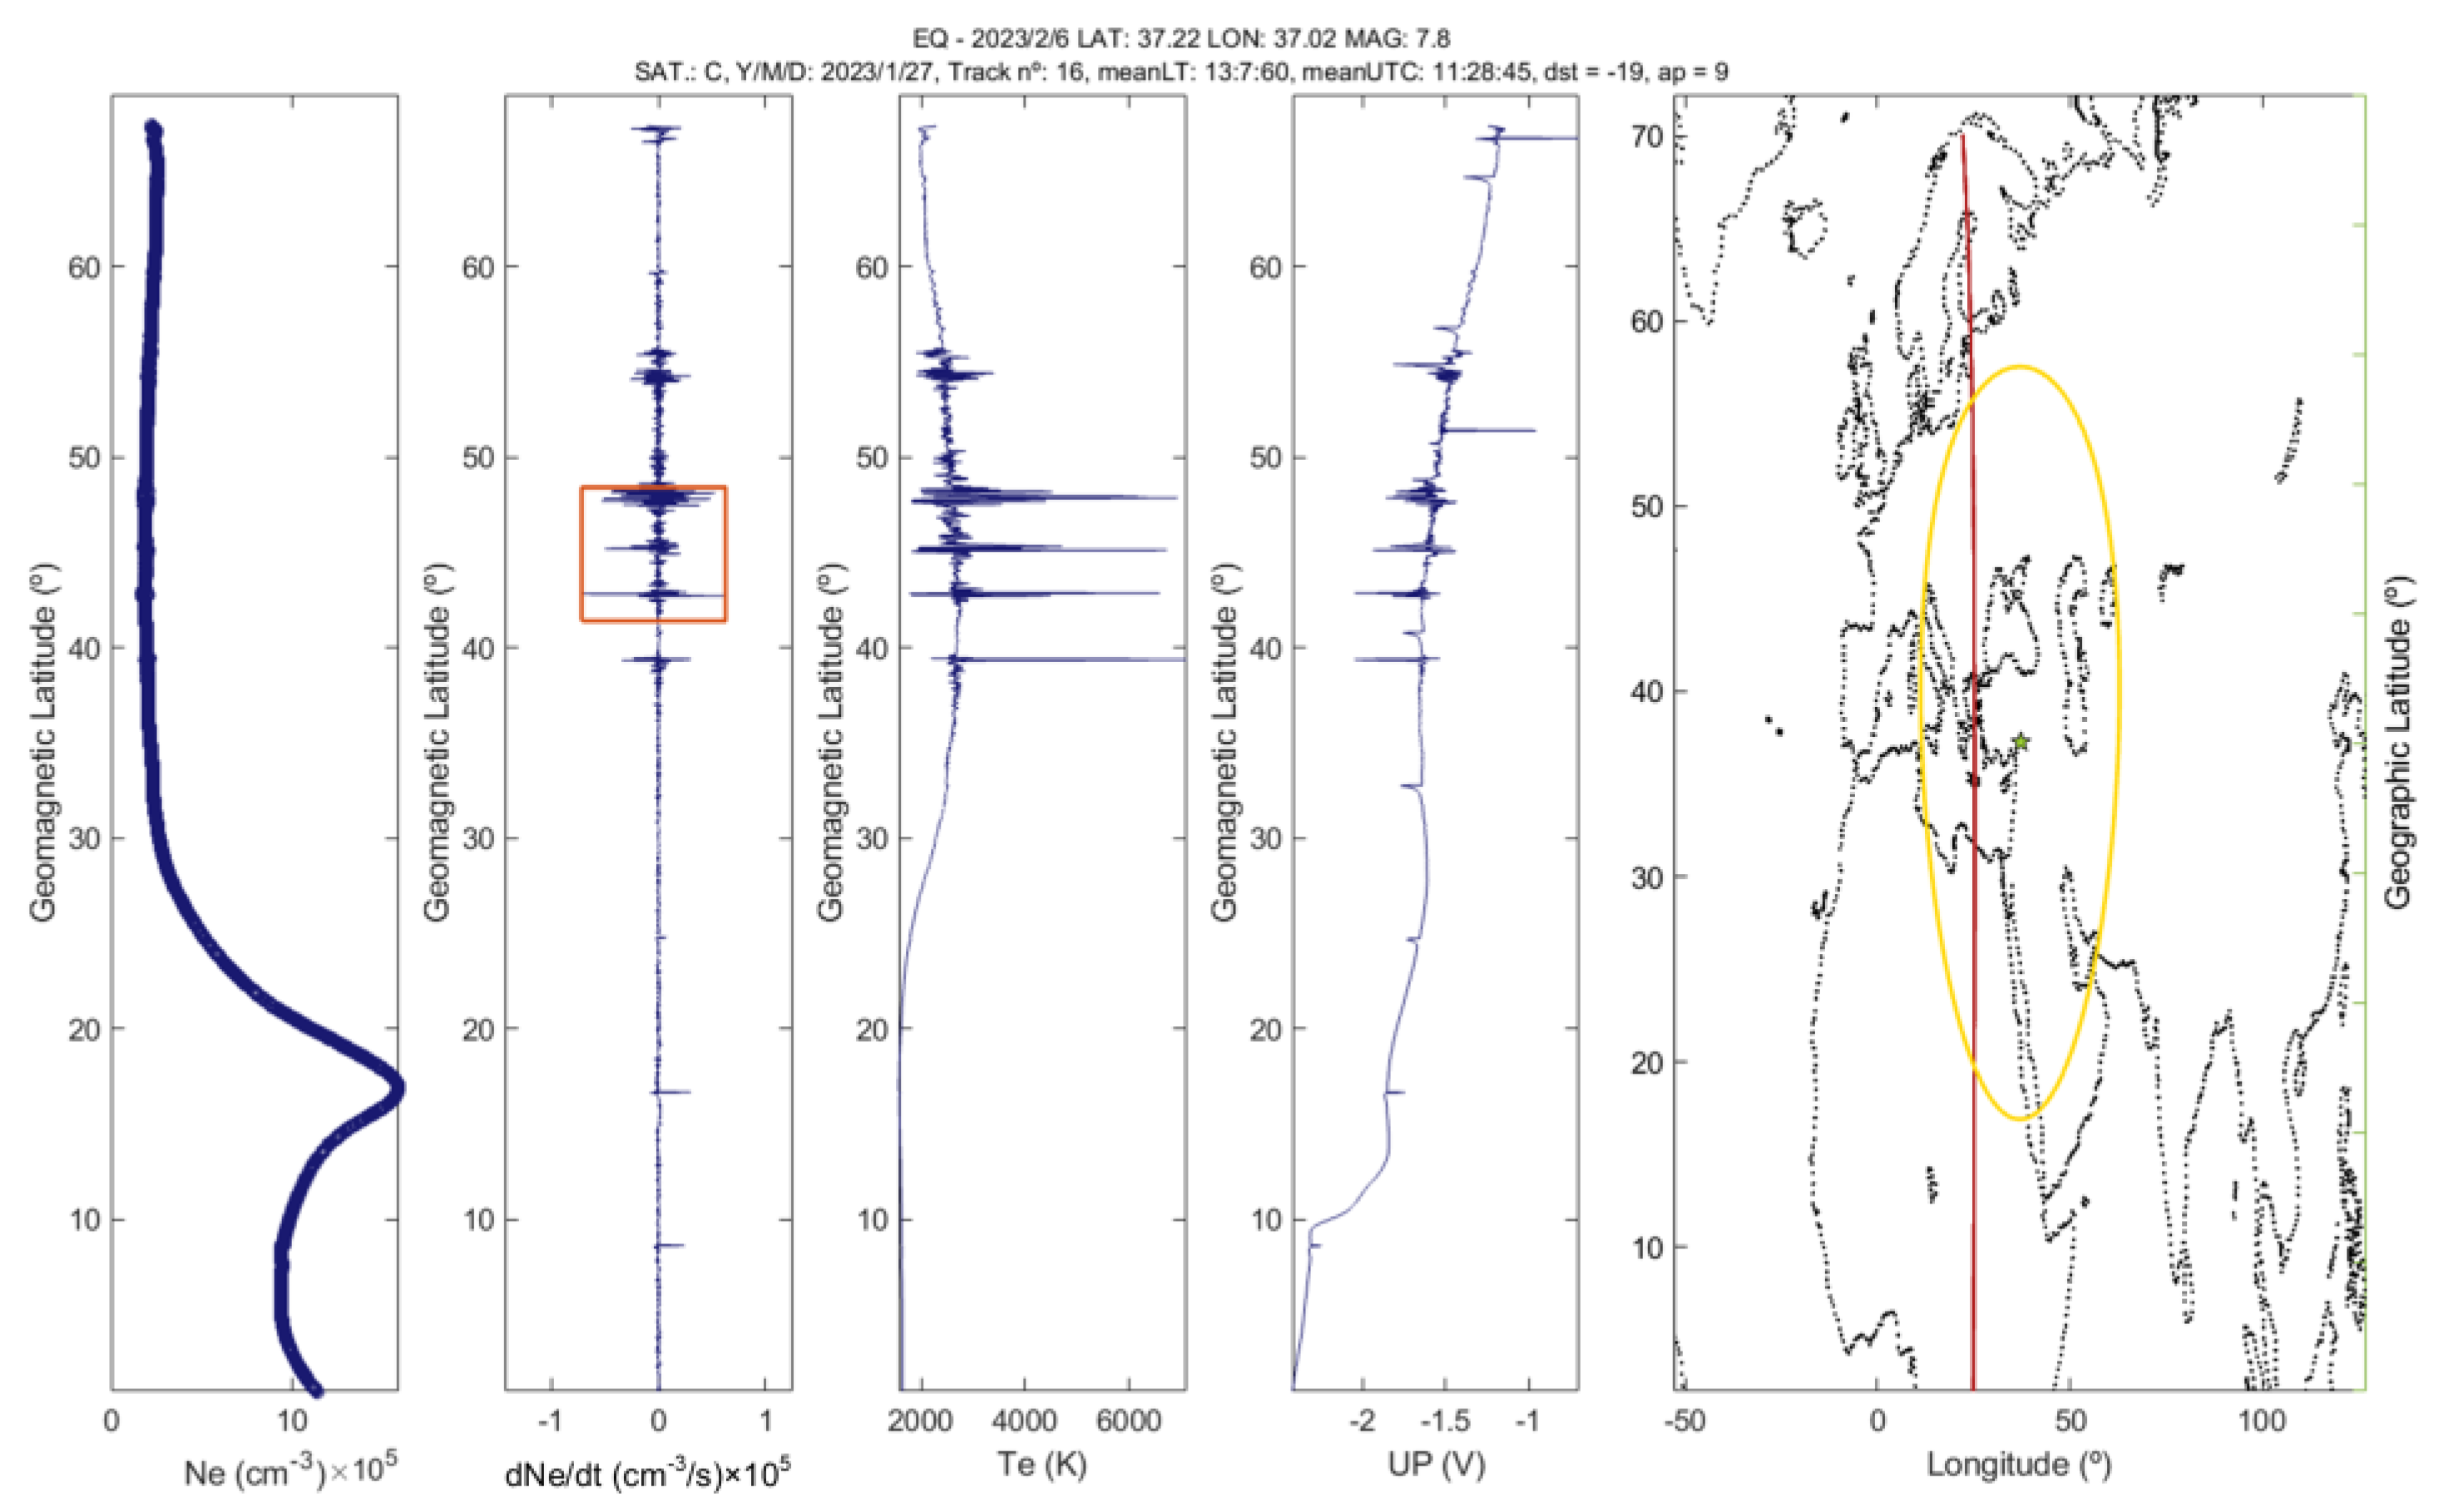
Interestingly, [70] found evidence of an Ne anomaly on 27 January 2023 (i.e., 10 days before EQ) in the nightside, therefore, just one day after the magnetic anomaly seen after applying the MASS method (Figure 15). We have conducted the analogous analysis using the NeAD method: as explained before, it is similar to MASS but adapted to Ne data from Swarm (see [12] for more details). We found an anomaly detected by Swarm-C on the same day at 13:07 LT, which is also observed in the electron temperature (Te) and plasma potential (Figure 16).
As found by Rikitake [71], a law is expected to relate the precursory time (in the logarithmic scale) and the magnitude M of the earthquakes such as log 10 T = 0.76 M 1.83 .
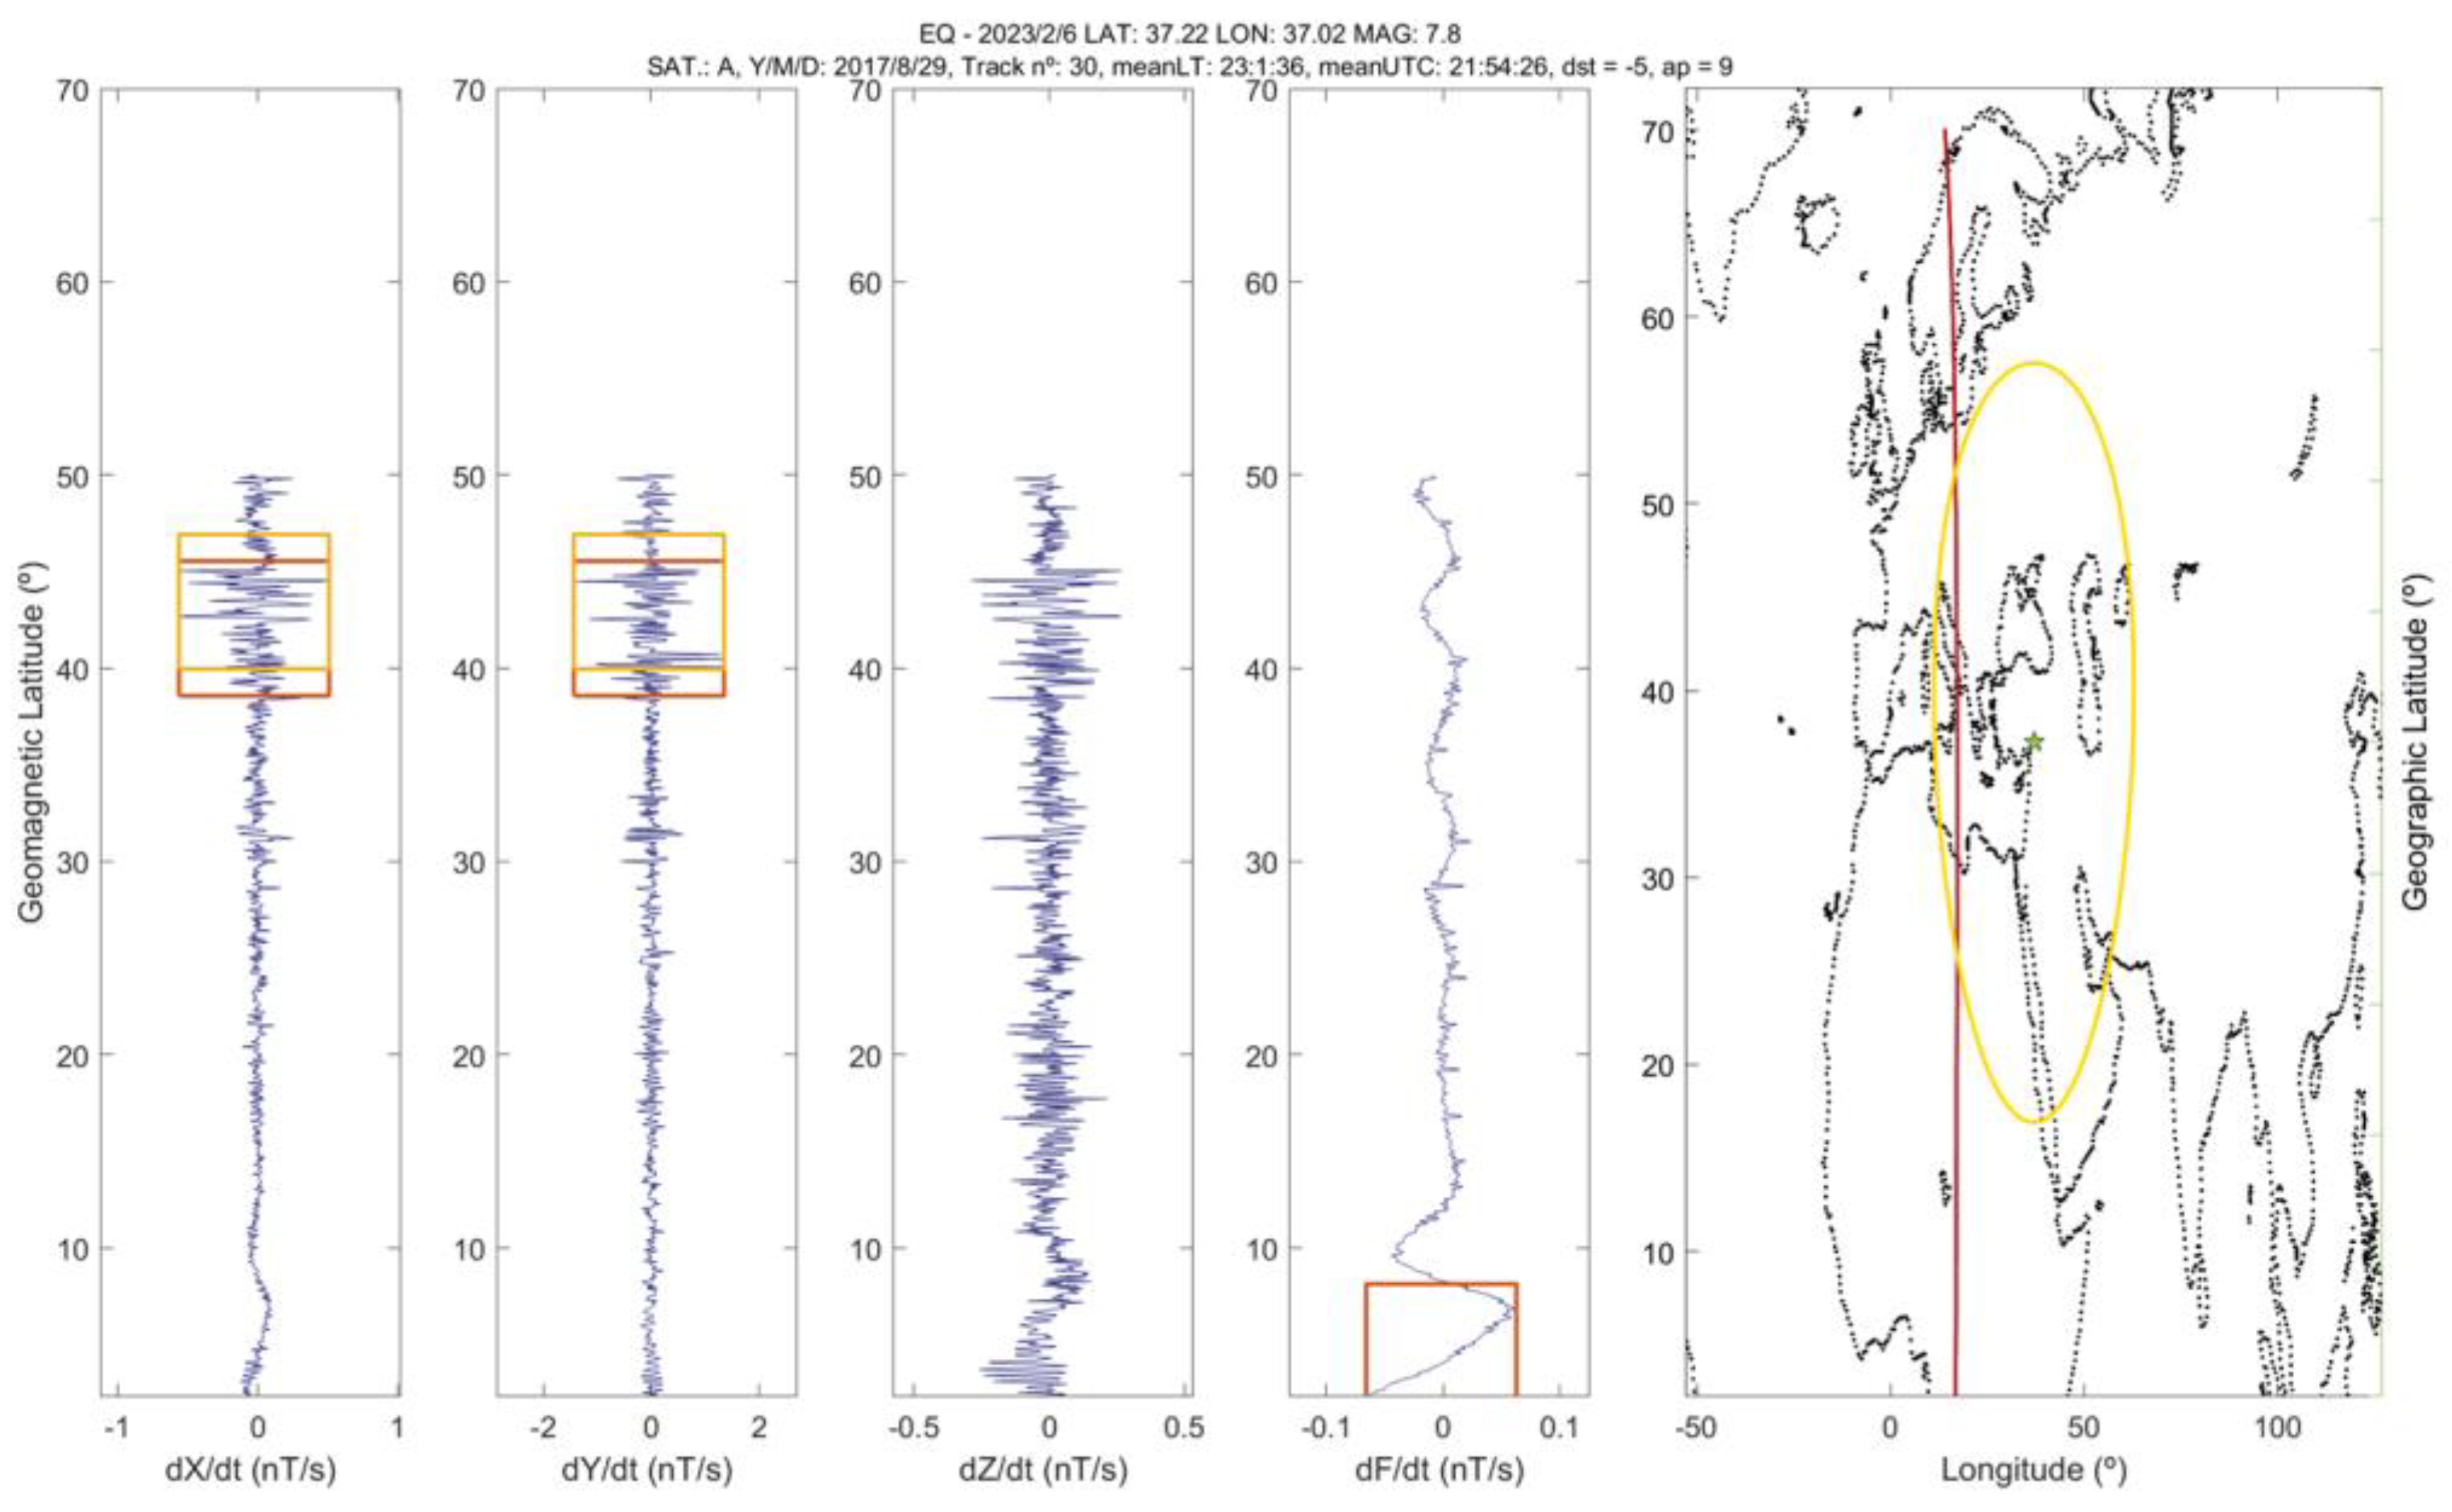
Applying the Rikitake law to the case of the Turkey mainshock, in particular, for the electromagnetic anomalies extracted from satellite data [12], we learn that, for a M7.8 earthquake, we would expect to find anomalies about 2000 days before the earthquake, i.e., in September 2017 for our case study. Considering a reasonable interval between 25 August and 20 September 2017, we have carried out an automatic search using the MASS method. Interestingly, we happened to find anomalies around the expected days: 29 August 2017 (Figure 17) and 6 September 2017. We exclude the notion that the found anomalous train of waves is a kind of medium-scale travelling ionospheric disturbance (MSTID), because, here, the period is of the order of 5–10 s, while a typical MSTID has a period of 30–60 min [72].
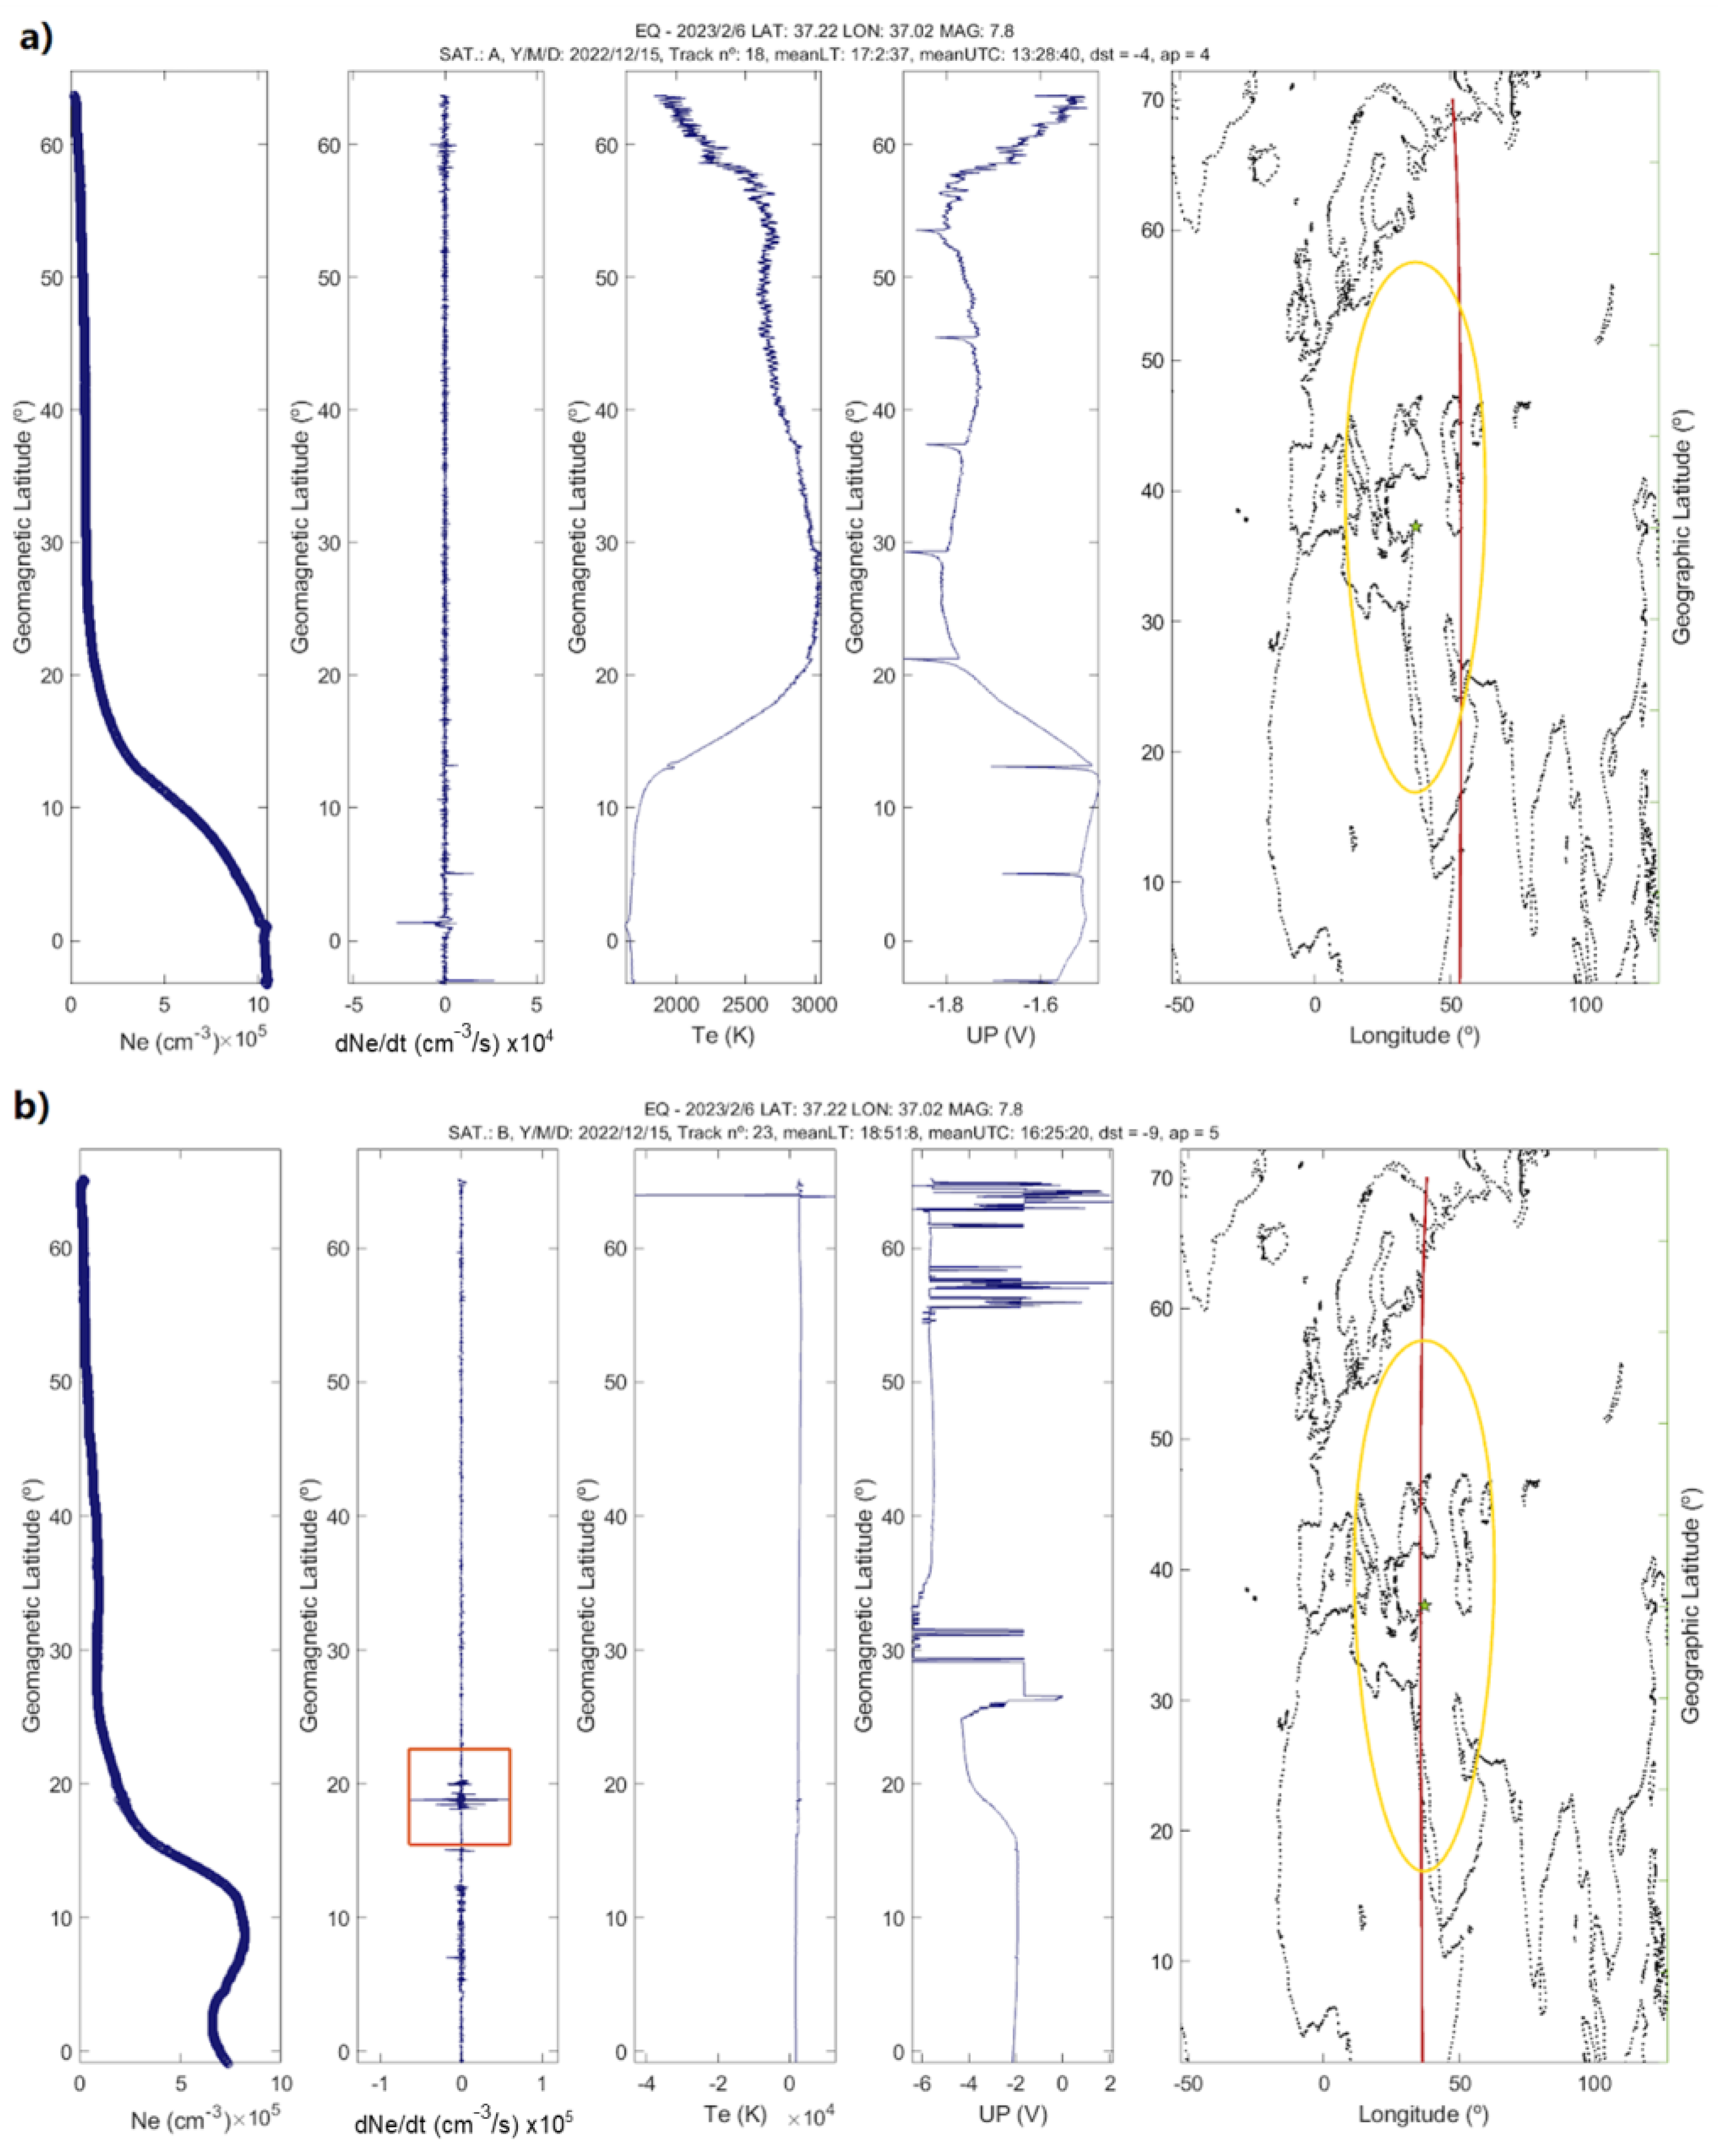
Regarding the CSES-01 electron density (Ne) data, we would like to point out a particular feature that has been detected in part of the data that span the period under study, i.e., 90 days before and 10 days after the seismic events. We have observed that some tracks are affected by jumps during the measurement (e.g., Figure 18), always around 20°–10° of geomagnetic latitude.
In order to verify the origin of this finding on CSES-01 data, we made a comparison with a different spacecraft (i.e., Swarm) measuring the same parameter, on the same day and in close orbit. We have carried out this comparison with the Ne data from Swarm shown in Figure 19, on 15 December 2022, in order to see if this phenomenon is something related to the measurement acquisition system by CSES-01 or if it has a physical reason. We found that, for similar local times, tracks do not show jumps or other particular features (Figure 19a,b) so we can conclude that these particular features in CSES-01 Ne are likely an artefact. Incidentally, we find an anomaly from Swarm-B that could be related to the EQ (anomaly evidenced by a red square in Figure 19b).

4.4. Analysis of Ionospheric Data from Ionosonde

Several recent papers investigated the co-seismic (and post-seismic) effects on the ionosphere, which are much documented and modelled (e.g., [73]).
By combining data from Doppler sounding systems, ionosondes, and GNSS receivers, Haralambous et al. [8] distinguish various types of disturbances variations, following the Turkey mainshock, which propagate around the F-region peak at different velocities and through different mechanisms. [74] identified two large-scale travelling ionospheric disturbances (LSTIDs) over Turkey, with phase speeds of 534 and 305 m/s, following the second major EQ at 10:24 UT on 6 February 2023. These disturbances suggest that strong earthquakes can perturb equatorial ionospheric currents, including the E-region equatorial electrojet (EEJ) and F-region ionospheric radial current (IRC). Vesnin et al. [75] analysed the TEC data and found that the amplitude of the ionospheric response caused by the daytime M7.5 EQ exceeded by five times that caused by the nighttime M7.8 main EQ. Significant anomalies in TEC data were also found [76].
Seventeen minutes after the mainshock, a Doppler ionosonde detected a co- or post-seismic disturbance over a 3010 km radio path from Kuwait to the Institute of Ionosphere in Almaty [77]. Acoustic waves at a height of 232 km in the ionosphere appeared 568 s after the Rayleigh surface wave reached the sub-ionospheric point, matching the predicted time for vertically moving acoustic waves. This disturbance lasted 160 s with a significant amplitude above 2 Hz, exceeding normal Doppler frequency fluctuations [8].
Most of the above results were about the co-seismic effects on the ionosphere. In any case, they encourage us to investigate, also in search of pre-seismic effects.
Our multi-instrument approach allows for a comprehensive analysis of how the preparation phase of seismic events impacts the ionosphere, providing a clearer understanding of the resulting disturbances.
The Nicosia (Cyprus) ionosonde data are then analysed to find ionospheric variations possibly linked to the Turkey EQs in the 90 days preceding the first major EQ.
The ionospheric station of Nicosia is indeed located inside the EQ preparation zone according to the formula by [63] (see R[km] in Table 1).
The application of the ionosonde multiparametric method imposes some constraints to three ionospheric parameters. The method revealed a single anomaly occurred about 78 days before the Turkey EQs. While analysing the characteristics of the F2 layer, the authors stated [75] that they did not find any anomaly, also because they analysed a shorter interval. The time variations of the three ionospheric parameters are shown by Figure 20. Such an anomaly occurred on November 20, 2022 at 06:00 UT, i.e., 77.84/78.20 days before the two EQs (Table 2).
Since the anomaly (Figure 20) occurred in a day with the geomagnetic index Ap = 5 nT, the criterion (Ap ≤ 15 nT) was strictly satisfied. The values of the auroral electrojet index AE have also been checked in the previous 6 h, verifying the low level of the auroral activity, which could reach middle latitudes and perturb foF2.
This anomaly detected by the ionosonde is so unique: it appears just once for all the analysed 90-day period. Moreover, it appears in a moment that that ionosphere is very quiet, so it cannot be ascribed to an external solar origin. The work [23] showed that this method provides, although not perfect, a good prediction of an impending EQ (Accuracy of 69%).
It is also noteworthy that, as shown in Figure 21, the anomaly is close to the relationship between ∆T·R and M (with ∆T anticipation time in days, while R is in km) previously found by the analysis of 33 crustal EQs of magnitude M6 in the Pacific region near Japan in 1985–2000 [78]. As pointed out in previous works (e.g., [23]), such a relationship indicates the process of spreading the disturbance from the epicentre towards the periphery during the EQ preparation process. Besides, similar relationships were obtained in different parts of the world, suggesting the uniformity of the coupling processes between the lithosphere and the ionosphere during the preparation period.

4.5. Electron Loss Data Analysis

Since geomagnetic storms and substorms are known to induce electron precipitation, the first part of the analysis was centred on the geomagnetic indices (Figure 3).
Our analysis was extended from 25 January to 8 February 2023 and there are perturbed magnetic conditions on the mainshock day (6 February). In the whole time interval considered, we found several electron bursts (“events”) and some extensive perturbations that could not be correlated to the seismic event. They were detected mainly at low latitudes and around the SAA. Therefore, these loss phenomena were hardly linkable to the Turkey seismic event occurring at medium latitudes. On 28 January 2023 (i.e., 9 days after EQ), we identified three different electron bursts of low duration, visualised from MetOp-01, and NOAA-18 and 19, at latitudes and longitudes close to the EQ epicentre. Detection times occurred at around 12:30, 13:15, and 20:30 UT. The three detections are shown in Figure 22, where the electron flux level of these loss events is notable, reaching 1500–2000 counts·cm−2·s−1·str−1, as much as the flux levels detected for the extended phenomena.
Moreover, a significant and extensive electron loss phenomenon was detected from MetOp-01 on 7 February 2023, at unusual geographical positions around, and always eastwards of, the epicentral area. The record is shown in Figure 23, which describes an electron flux of up to 5500 counts·cm−2·s−1·str−1, from 0° to 30° in latitude and from 80° to 90° in longitude. The loss phenomenon lasted more than 8 min, around 04:15 UT. Contrary to other cases of extended electron precipitation, this phenomenon was not detected by other satellites, therefore limiting its possible time extension. Bouncing altitudes corresponding to these longitudes are much higher than the satellite altitude, so electron detections should have been a very strong perturbation from the trapped conditions.

5. Discussion: Comprehensive Analysis of Turkey EQ

In this section, we discuss our findings with a multidisciplinary glance, also in the light of analogous analyses published in literature (e.g., [13,14,79]) and aiming to disclose anomalies during the preparation phase of the 2023 Turkish seismic sequence.
Each analysis that we conducted evidenced what we can call an event (e.g., a time marker) or, more generally, an anomaly, according to its nature and characteristics. The purpose of the multidisciplinary approach, applied to the early stages of the preparation of a large EQ, is to collect the diverse pieces of the puzzle to relate them, and thus identify some patterns that are recognizable in other case studies: Table 3 lists the cumulative anomalies, ordering them according to the lead time (or delay) compared to the occurrence time of the first of the two mainshocks on 6 February; each is labelled with the sources from which they have their origin.
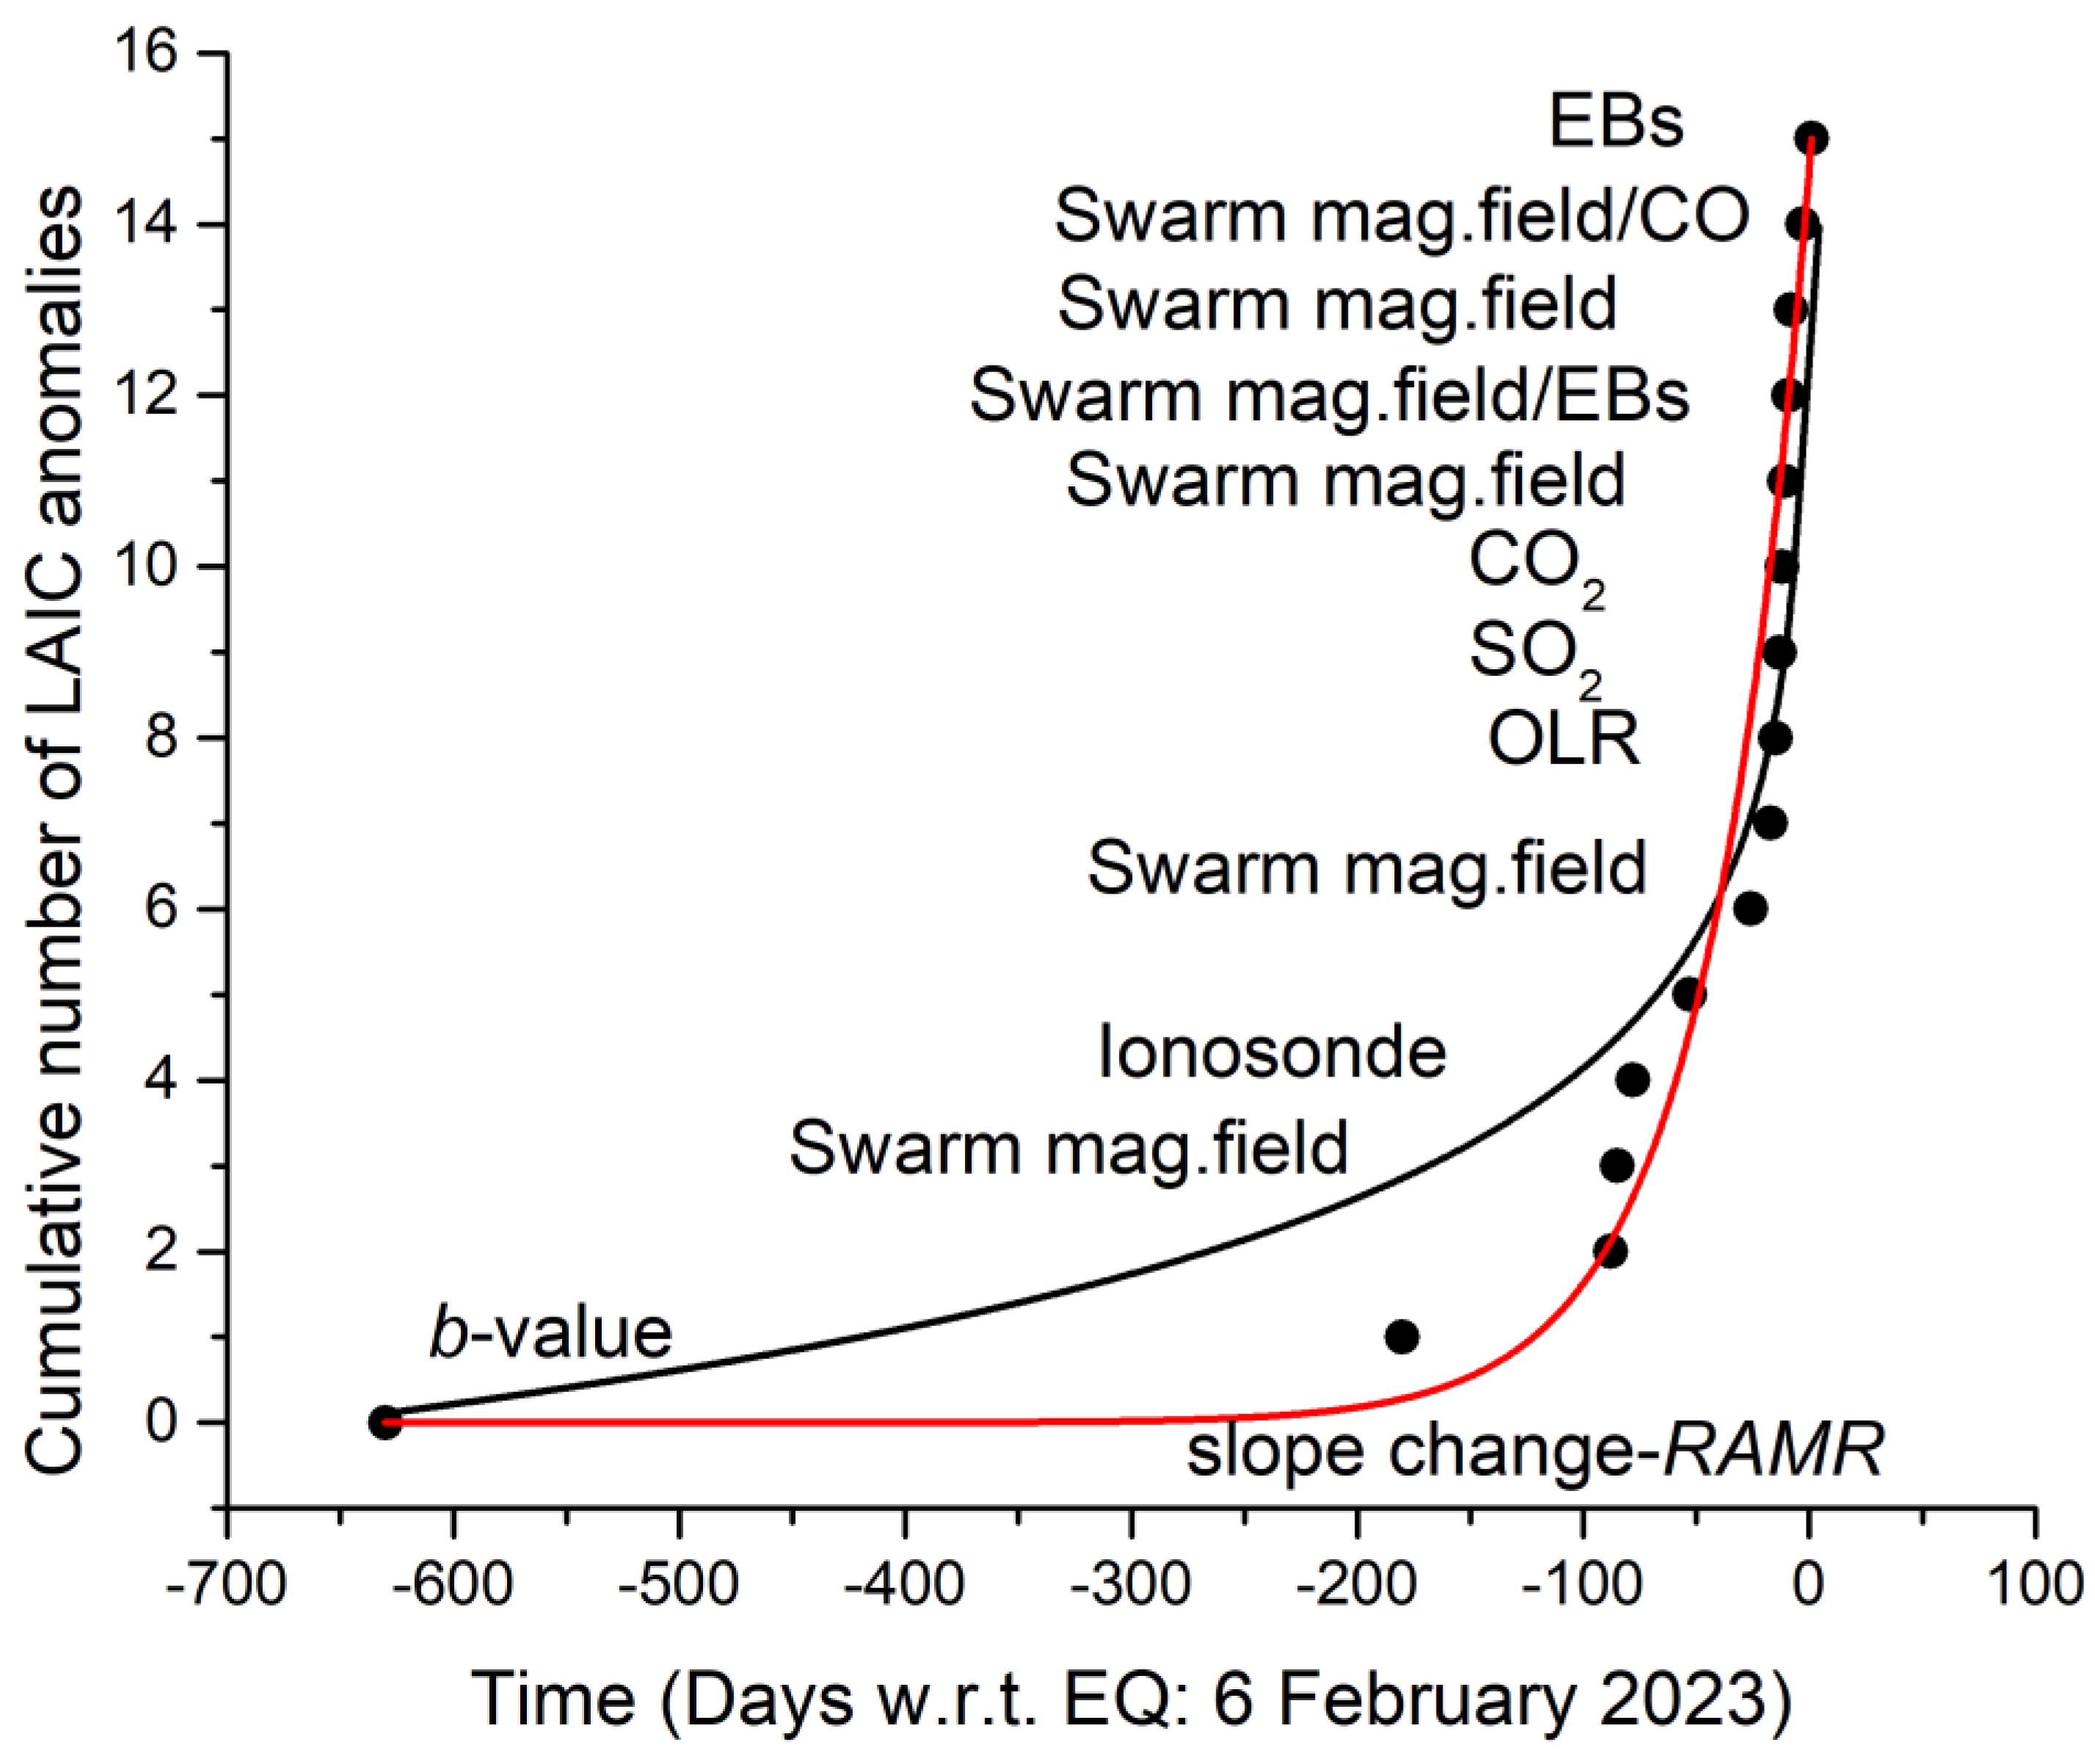
Plotting the cumulative number of all anomalies identified in the different geolayers (i.e., lithosphere, atmosphere, and ionosphere) in their chronological order, as occurred in the 700 days before the mainshock, we find the behaviour as shown in Figure 24. Both an exponential or power-law fit represent well the overall trend related to the anomalies preceding the Turkey EQ.
Very interestingly, we notice that the anomalies appear in time mostly from below (seismic data in the lithosphere) to above (atmosphere and ionosphere), although some anomalies are mixed (i.e., some satellite anomalies appear before the atmospheric ones; these satellite anomalies are so evidenced in bold in Table 3), confirming a possible two-way model of lithosphere–atmosphere–ionosphere coupling [14]: a direct coupling, likely electromagnetic, and a secondary diffusive one, likely thermodynamic.
Actually, what we believe is worth pointing out is the remarkable similarity between the cumulative number found here (Figure 24) and that obtained by [80], where, in a similar way, both an exponential (red curve in Figure 24) or power-law (black curve in Figure 24) trend and the oscillation in the acceleration phase are found, although in a different seismological context and for the EQ magnitude (2022 Luding Ms6.8 EQ, China). This notable similarity can only encourage us to continue further along this path of the multiparametric approach that we have followed.
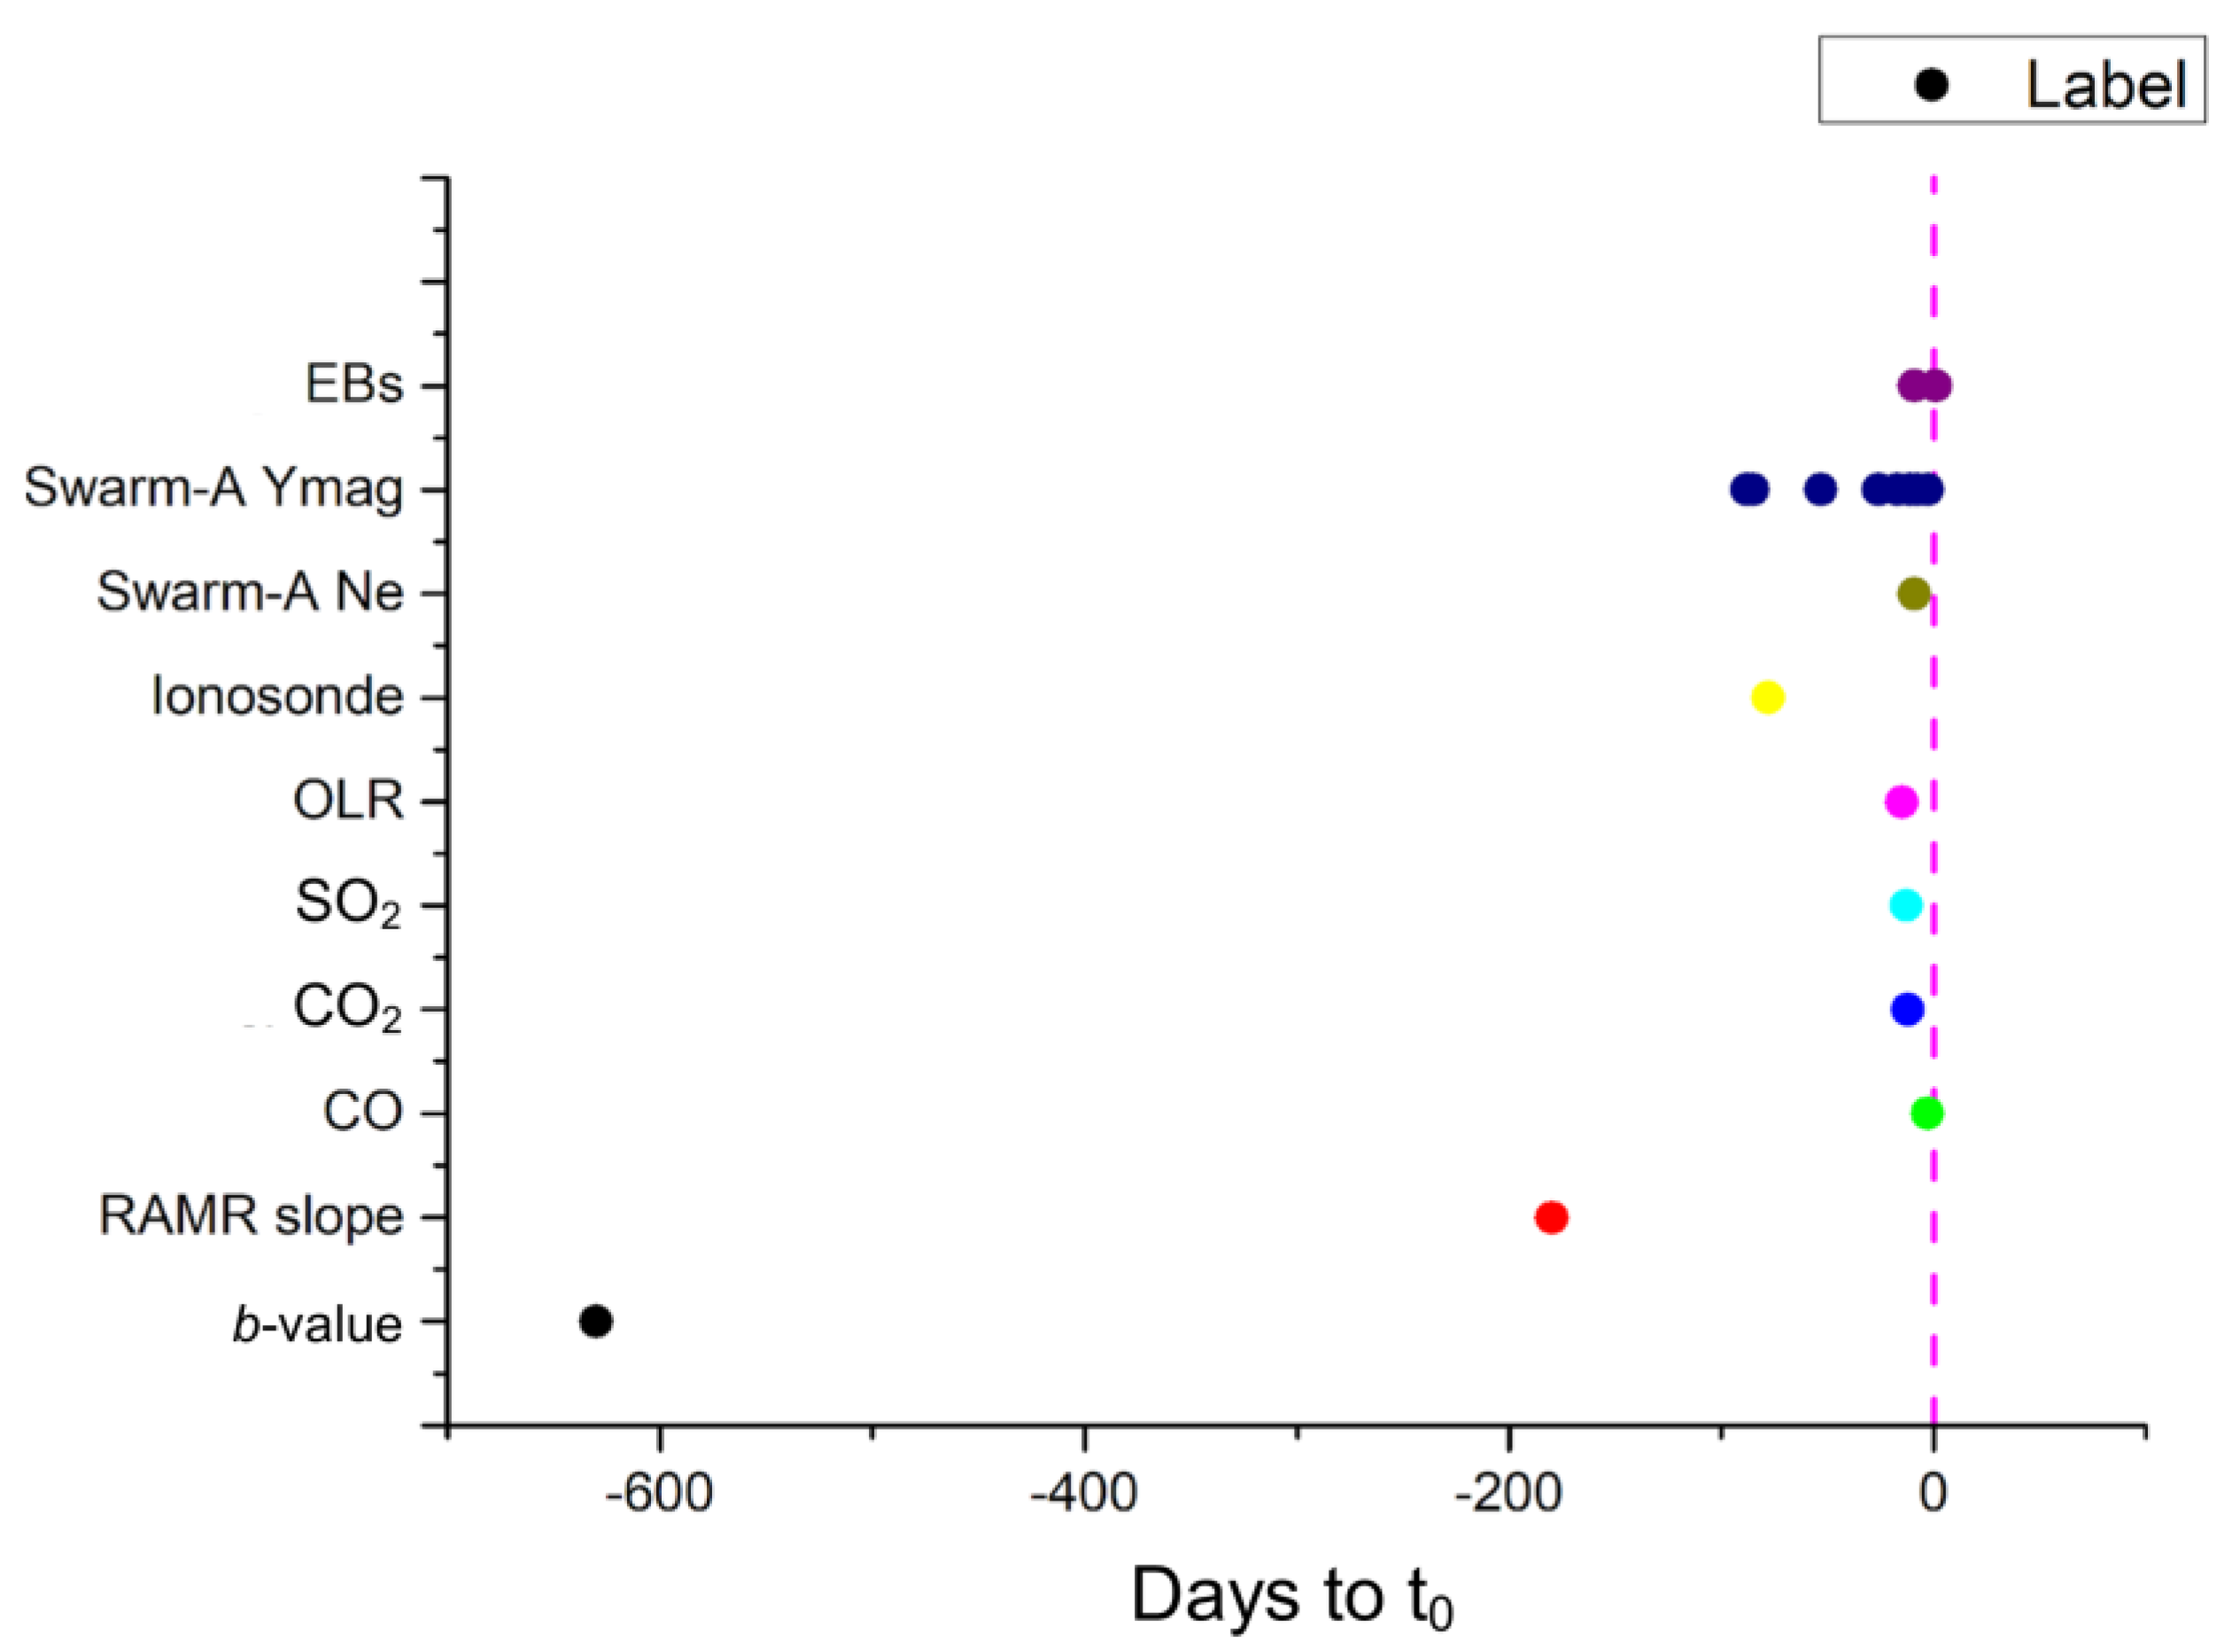
In addition, by grouping the anomalies according to their time of appearance (with respect to the mainshock origin time t0, in abscissa) and their altitude (in ordinate), we can notice (Figure 25) that, also in the case of the major Turkey EQ, we find the following:
  • According to the seismic models, the emergence of lithospheric activity (the decreasing of b-value as stress increases) dates back even years before the great seismicity;
  • Ionospheric anomalies are much more numerous than atmospheric ones but begin to appear more frequently within a few months to weeks before the mainshock;
  • Moreover, some satellite anomalies appear well before atmospheric anomalies so they should be produced with another kind of coupling, which is not the progressive one from the lithosphere to atmosphere and ionosphere, but it is more direct. As in [80], if we remove these anomalies (those indicated in bold in Table 3) from the general trend of Figure 25, this appears with less oscillating parts.
These outcomes empirically strengthen at least two ways in the LAIC process: one from the lithosphere, through the atmosphere, to the ionosphere (“thermodynamic” or “diffusive-delayed” coupling); and another directly from the lithosphere to ionosphere (“direct” or electromagnetic coupling). The former one may correspond to the chemical channel or acoustic gravity channel of the [19] model, which takes place close to the surface of the Earth; the latter one does not practically interact with the atmosphere and is likely related to the EM coupling channel, impacting the magnetic field and ionospheric parameters, causing the precipitation of particles near, and around, the main earthquake.
Here, we try to go a little deeper into the phenomena that occur in the earthquake enucleation zone, focusing on the chemical role of fluids in the processes of generation of the coupling, as, for example, modelled by [1,19].
Specifically, among the anomalies coming from below, it is interesting to mention a mechanism detailed in [21]. It describes principally the active contribution of water chemistry in the earthquake nucleation zone: this mechanism lays the foundation for explaining the onset (and the time scales) of chemical and thermodynamic phenomena, and probably some of the electromagnetic anomalies, found in the observables above the Earth’s surface. According to this model, the near-simultaneous CO2, SO2, and CO release data indicate that an intense flux of discharging fluids has been observed during the main shock preparation phase. Some authors report recognised chemical anomalies during the preparatory phase in air, CO and SO2 in [81], and groundwaters, the Na, Cl, and SO4 ion in [82]. The presence of a temporary higher content of SO4 ion in groundwater should be the result of the reaction of an SO2-rich fluid that interacted with the groundwater. SO2 reacted with H2O, thus forming the SO4 ion. Given the deeper origin of fluids generally rich in components usually not detected at that level at the surface, namely, SO2, CO2, and CO (last one originated in horizons depleted in O2) could indicate a temporary increase of permeability due to microcrack formations and fracture coalescence around the deep nucleation zone. This nucleation zone could follow the Scholz mechanism of dilatancy diffusion [20] if and only if water is present in that rock volume. Assuming that supercritical water is present, given the temperature at that depth, the initially trapped water undergoes a series of chemical and physical modifications that produce the separation of some elements, some of which separate in supercritical aggregation states. A multiphase system is created, and each phase—quite pure—follows its own path to the surface, according to its physical characteristics: e.g., the dipole moment, viscosity, partial charge distribution, and self-aggregation structure. All these characteristics, if T = c o n s t , are dependent mainly on the density, in turn, depending on the pressure acting on the fluid phase, and, in a dynamic environment like those of an earthquake nucleation zone, on pressure changes. Following the dilatancy diffusion model of [20], and integrating it with the chemistry, given the hypocenter temperature around 500 °C, we have, in sequence, the following:
1.
As soon as microcracks develop, the fluid pressure (pore pressure in [20]) drops. Elements solvated in supercritical water separate. Multiphase systems develop with each pure phase as it is similar to a distillation process. Now, each phase is theoretically free to move and to migrate in pre-existing and coalesced fissures or newly created ones, according to their chemical and physical characteristics. The chemical release of elements, free to migrate upward, begins here. The next step is as follows:
2.
Due to the constant tectonic load, the pressure acting on fluids starts to rise again. The fluid density rises again and H2O tends to interact more actively with solids in freshly opened fractures it encounters. CO2 acquires a dipole moment (measured in [83], calculated with quantum chemistry methods by Saharay and Balasubramanian [84], and modelled by Calcara and Caricaterra [85]), and tends to co-ordinate ions, becoming a polar solvent as well [86]—at the same time, free to migrate upward more easily than water can as a result of having a lower density. Being lighter and smaller than CO2, CO follows other paths. In this stage, besides the release and the eventual upward migration, rocks of the nucleation zone become weaker as a result of the chemical action of fluids. The combined action of the water/fluid chemistry and increasing total pressure will lead to the main shock.
As it is easily comprehensible, some elements could be detected at the surface if a continuous permeability path has been created, for each element and probably even with a different temporal release. It could happen that, if the permeability increase is sufficiently high in the most superficial strata, adiabatic expansion occurs, with low temperature increase at the surface. During their path to the surface, elements pertaining to relatively more superficial strata, as even 222Rn can be, could be carried up to the surface as well, in turn, determining the air ionisation claimed as the source of the EM channel by, among others, for example, [1].

6. Conclusions

With this study, we show the retrospective analysis of the case study of the recent 2023 Turkey EQs, to which we applied our methodological multiparametric and multiplatform approach, consisting in the analyses of data from the different geolayers (lithosphere, atmosphere, and ionosphere) involved in the coupling during the preparation phase of significant-magnitude EQs. We recognise two possible kinds of LAIC channels established when all anomalies coming from all geolayers were placed in chronological order. The comprehensive accumulation of all anomalies has two possible kinds of trends: one is exponential and the other is oscillating/intermittent. When we remove the ionospheric anomalies that occur before atmospheric ones, the fluctuations around the exponential cumulative number of anomalies almost disappear, in agreement with [80]. The two behaviours represent two modes of LAIC processes that act almost independently, one from the other: one of a thermodynamic type with diffusive/delayed character, while the other probably electromagnetic, with an oscillating and intermittent trend.
The results of the analyses from the case study were very interesting, confirming the power of our Geosystemics approach [62] in detecting LAIC effects before large EQs.
We also attempted to give a little deeper insight into the phenomena that could occur in the earthquake enucleation zone, focusing on the chemical role of fluids in the processes of the generation of the coupling between the lithosphere and lower atmosphere.

Author Contributions

Conceptualisation, G.C., M.C., A.D.S. and L.P.; formal analysis, G.C., A.D.S., A.P., C.F., D.S., M.O., S.A.C., M.D.C. and M.S.; funding acquisition, A.D.S. and L.P.; investigation, G.C., A.D.S., A.P., S.D., C.F., D.S., M.O., L.P., M.D.C. and M.S.; methodology, G.C., A.D.S., A.P., C.F. and L.P.; software, G.C., A.D.S., A.P., C.F., L.P., S.A.C. and M.S.; writing—original draft, G.C., M.C., A.D.S., A.P., S.D., C.F., D.S., M.O., L.P., S.A.C., M.D.C., A.N. and M.S.; writing—review and editing, G.C., M.C., A.D.S., A.P., S.D., C.F., D.S., M.O., L.P., S.A.C., M.D.C., A.N. and M.S. All authors have read and agreed to the published version of the manuscript.

Funding

This research was funded by the Italian Space Agency (ASI) through Limadou Scienza+ Project (CUPF19C20000110005 OB.FU. 1066.010) and the Italian Ministry of Research and University (MUR) through Pianeta Dinamico INGV Project (CUP D53J19000170001) and FURTHER INGV Earthquakes Department Project (CUP D83C22001980006).

Data Availability Statement

The original data presented in the study are openly available in the following: Earthquake Catalogue; Kandilli Observatory (http://www.koeri.boun.edu.tr/new/en); ECMWF ERA5 (https://www.ecmwf.int/en/forecasts/dataset/ecmwf-reanalysis-v5); ESA Swarm Mission Data (https://swarm-diss.eo.esa.int/); CSES Mission Data available upon request and formal approval at http://www.leos.ac.cn/; NOAA (https://www.ngdc.noaa.gov/stp/satellite/poes/dataaccess.html); Nicosia (Cyprus) Ionospheric Observatory (https://giro.uml.edu/); and GIRO Group (http://spase.info/SMWG/Observatory/GIRO).

Conflicts of Interest

The authors declare no conflicts of interest.

References

  1. Pulinets, S.; Ouzounov, D. Lithosphere-atmosphere-ionosphere coupling (LAIC) model-an unified concept for earthquake precursors validation. J. Asian Earth Sci. 2011, 41, 371–382. [Google Scholar] [CrossRef]
  2. Hayakawa, M. Atmospheric and Ionospheric Electromagnetic Phenomena Associated with Earthquakes; Terra Scientific Publishing Company: Tokyo, Japan, 1999; p. 996. [Google Scholar]
  3. Korepanov, V.; Hayakawa, M.; Yampolski, Y.; Lizunov, G. AGW as a seismo–ionospheric coupling responsible agent. Phys. Chem. Earth Parts A/B/C 2009, 34, 485–495. [Google Scholar] [CrossRef]
  4. Pulinets, S.A.; Boyarchuk, K.A. Ionospheric Precursors of Earthquakes; Springer: Berlin/Heidelberg, Germany, 2004. [Google Scholar]
  5. Rozhnoi, A.; Solovieva, M.S.; Molchanov, O.A.; Hayakawa, M. Middle latitude LF (40 kHz) phase variations associated with earthquakes for quiet and disturbed geomagnetic conditions. Phys. Chem. Earth 2004, 29, 89–598. [Google Scholar] [CrossRef]
  6. Astafyeva, E. Ionospheric detection of natural hazards. Rev. Geophys. 2019, 57, 1265–1288. [Google Scholar] [CrossRef]
  7. Bravo, M.; Benavente, R.; Foppiano, A.; Urra, B.; Ovalle, E. Traveling Ionospheric Disturbances observed over South America after lithospheric events: 2010–2020. J. Geophys. Res. Space Phys. 2022, 127, e2021JA030060. [Google Scholar] [CrossRef]
  8. Haralambous, H.; Guerra, M.; Chum, J.; Verhulst, T.G.W.; Barta, V.; Altadill, D.; Cesaroni, C.; Galkin, I.; Márta, K.; Mielich, J.; et al. Multi-instrument observations of various ionospheric disturbances caused by the 6 February 2023 Turkey earthquake. J. Geophys. Res. Space Phys. 2023, 128, e2023JA031691. [Google Scholar] [CrossRef]
  9. Sunil, A.S.; Bagiya, M.S.; Catherine, C.; Rolland, L.; Sharma, N.; Sunil, P.S.; Ramesh, D.S. Dependence of near field co-seismic ionospheric perturbations on surface deformations: A case study based on the April, 25 2015 Gorkha Nepal earthquake. Adv. Space Res. 2017, 59, 1200–1208. [Google Scholar] [CrossRef]
  10. Reddy, C.D.; Seemala, G.K. Two-mode ionospheric response and Rayleigh wave group velocity distribution reckoned from GPS measurement following Mw 7.8 Nepal earthquake on 25 April 2015. J. Geophys. Res. Space Phys. 2015, 120, 7049–7059. [Google Scholar] [CrossRef]
  11. Cicerone, R.D.; Ebel, J.E.; Britton, J. A systematic compilation of earthquake precursors. Tectonophysics 2009, 476, 371–396. [Google Scholar] [CrossRef]
  12. De Santis, A.; Marchetti, D.; Pavón-Carrasco, F.J.; Cianchini, G.; Perrone, L.; Abbattista, C.; Alfonsi, L.; Amoruso, L.; Campuzano, S.A.; Carbone, M.; et al. Precursory worldwide signatures of earthquake occurrences on Swarm satellite data. Sci. Rep. 2019, 9, 20287. [Google Scholar] [CrossRef]
  13. De Santis, A.; Cianchini, G.; Marchetti, D.; Piscini, A.; Sabbagh, D.; Perrone, L.; Campuzano, S.A.; Inan, S. A Multiparametric Approach to Study the Preparation Phase of the 2019 M7.1 Ridgecrest (California, United States) Earthquake. Front. Earth Sci. 2020, 8, 540398. [Google Scholar] [CrossRef]
  14. D’Arcangelo, S.; Regi, M.; De Santis, A.; Perrone, L.; Cianchini, G.; Soldani, M.; Piscini, A.; Fidani, C.; Sabbagh, D.; Lepidi, S.; et al. A multiparametric-multilayer comparison of the preparation phase of two geophysical events in the Tonga-Kermadec subduction zone: The 2019 M7.2 Kermadec earthquake and 2022 Hunga Ha’apai eruption. Front. Earth Sci. 2023, 11, 1267411. [Google Scholar] [CrossRef]
  15. Molchanov, O.A.; Hayakawa, M. Generation of ULF electromagnetic emissions by microfracturing. Geophys. Res. Lett. 1995, 22, 3091–3094. [Google Scholar] [CrossRef]
  16. Hayakawa, M.; Kawate, R.; Molchanov, O.A.; Yumoto, K. Results of ultra-low-frequency magnetic field measurements during the Guam earthquake of 8 August 1993. Geophys. Res. Lett. 1996, 23, 241–244. [Google Scholar] [CrossRef]
  17. Piscini, A.; De Santis, A.; Marchetti, D.; Cianchini, G. A Multi-parametric Climatological Approach to Study the 2016 Amatrice–Norcia (Central Italy) Earthquake Preparatory Phase. Pure Appl. Geophys. 2017, 174, 3673–3688. [Google Scholar] [CrossRef]
  18. Piersanti, M.; Materassi, M.; Battiston, R.; Carbone, V.; Cicone, A.; D’Angelo, G.; Diego, P.; Ubertini, P. Magnetospheric–Ionospheric–Lithospheric Coupling Model. 1: Observations during the 5 August 2018 Bayan Earthquake. Remote Sens. 2020, 12, 3299. [Google Scholar] [CrossRef]
  19. Hayakawa, M.; Hattori, K.; Ando, Y. Natural electromagnetic phenomena and electromagnetic theory: A review. IEEJ Trans. Fundam. Mater. 2004, 124, 72–79. [Google Scholar] [CrossRef]
  20. Scholz, C.H.; Sykes, L.R.; Aggarwal, Y.P. Earthquake prediction: A physical basis. Science 1973, 180, 632–641. [Google Scholar] [CrossRef]
  21. Calcara, M. Chemistry in earthquake: The active chemical role of liquid and supercritical waters in microfracturing at depth. J. Seismol. 2022, 26, 1205–1221. [Google Scholar] [CrossRef]
  22. Fidani, C. The Conditional Probability of Correlating East Pacific Earthquakes with NOAA Electron Bursts. Appl. Sci. 2022, 12, 10528. [Google Scholar] [CrossRef]
  23. Perrone, L.; De Santis, A.; Abbattista, C.; Alfonsi, L.; Amoruso, L.; Carbone, M.; Cesaroni, C.; Cianchini, G.; De Franceschi, G.; Di Giovambattista, R.; et al. Ionospheric anomalies detected by ionosonde and possibly related to crustal earthquakes in Greece. Ann. Geophys. 2018, 36, 361–371. [Google Scholar] [CrossRef]
  24. Ni, S.; Sun, H.; Somerville, P.; Yuen, D.A.; Milliner, C.; Wang, H.; Zhou, J.; Cui, Y. Complexities of the Turkey-Syria doublet earthquake sequence. Innovation 2023, 4, 100431. [Google Scholar] [CrossRef]
  25. Chadha, R.K. An Mw 7.8 Earthquake on 6 February 2023 on the East Anatolian Fault, TurkeyJour. Geol. Soc. India 2023, 99, 449–453. [Google Scholar] [CrossRef]
  26. Liu, J.; Huang, C.; Zhang, G.; Shan, X.; Korzhenkov, A.; Taymaz, T. Immature characteristics of the East Anatolian Fault Zone from SAR, GNSS and strong motion data of the 2023 Türkiye-Syria earthquake doublet. Sci. Rep. 2024, 14, 10625. [Google Scholar] [CrossRef]
  27. Okuwaki, R.; Yagi, Y.; Taymaz, T.; Hicks, S.P. Multi-scale rupture growth with alternating directions in a complex fault network during the 2023 south-eastern Türkiye and Syria earthquake doublet. Geophys. Res. Lett. 2023, 50, e2023GL103480. [Google Scholar] [CrossRef]
  28. Softa, M.; Koçbulut, F.; Akgün, E.; Aksoy, E.; Sözbilir, H.; Tatar, O.; Karabacak, V.; Özkaymak, Ç.; Utku, M.; Özdag, Ö.C.; et al. Surface rupture during the 6th of February 2023 Mw 7.6 Elbistan-Ekinözü (Kahramanmaras) earthquake: Implications for fault rupture dynamics along the northern branch of East Anatolian Fault Zone. Turk. J. Earth Sci. 2023, 32, 1–21. [Google Scholar] [CrossRef]
  29. Galasso, C.; Opabola, E.A. The 2023 Kahramanmaras Earthquake Sequence: Finding a path to a more resilient, sustainable, and equitable society. Commun. Eng. 2024, 3, 24. [Google Scholar] [CrossRef]
  30. Sparacino, F.; Galuzzi, B.G.; Palano, M.; Segou, M.; Chiarabba, C. Seismic coupling for the Aegean-Anatolian region. Earth-Sci. Rev. 2022, 228, 103993. [Google Scholar] [CrossRef]
  31. Jiang, X.; Song, X.; Li, T.; Wu, K. Moment magnitudes of two large Turkish earthquakes on February 6, 2023 from long-period coda. Earthq. Sci. 2023, 36, 169–174. [Google Scholar] [CrossRef]
  32. Abdelmeguid, M.; Zhao, C.; Yalcinkaya, E.; Gazetas, G.; Elbanna, A.; Rosakis, A. Dynamics of episodic supershear in the 2023 M7.8 Kahramanmaras/Pazarcik earthquake, revealed by near-field records and computational modeling. Commun. Earth Environ. 2023, 4, 456. [Google Scholar] [CrossRef]
  33. Dal Zilio, L.; Ampuero, J.P. Earthquake doublet in Turkey and Syria. Commun. Earth Environ. 2023, 4, 71. [Google Scholar] [CrossRef]
  34. Picozzi, M.; Iaccarino, A.G.; Spallarossa, D. The preparatory process of the 2023 Mw7.8 Türkiye earthquake. Sci. Rep. 2023, 13, 17853. [Google Scholar] [CrossRef]
  35. Gutenberg, B.; Richter, C.F. Frequency of earthquakes in California. Bull. Seism. Soc. Am. 1944, 34, 185–188. [Google Scholar] [CrossRef]
  36. Kwiatek, G.; Martínez-Garzón, P.; Becker, D.; Dresen, G.; Cotton, F.; Beroza, G.C.; Acarel, D.; Ergintav, S.; Bohnhoff, M. Months-long seismicity transients preceding the 2023 MW 7.8 Kahramanmaras earthquake, Türkiye. Nat. Commun. 2023, 14, 7534. [Google Scholar] [CrossRef]
  37. Ouzounov, D.; Khachikyan, G. On the impact of geospace weather on the occurrence of M7.8/M7.5 earthquakes on 6 February 2023 (Turkey), possibly associated with the geomagnetic storm of 7 November 2022. Geosciences 2024, 14, 159. [Google Scholar] [CrossRef]
  38. De Santis, A.; Abbattista, C.; Alfonsi, L.; Amoruso, L.; Campuzano, S.A.; Carbone, M.; Cesaroni, C.; Cianchini, G.; De Franceschi, G.; De Santis, A.; et al. Geosystemics View of Earthquakes. Entropy 2019, 21, 412. [Google Scholar] [CrossRef]
  39. Cianchini, G.; De Santis, A.; Di Giovambattista, R.; Abbattista, C.; Amoruso, L.; Campuzano, S.A.; Carbone, M.; Cesaroni, C.; De Santis, A.; Marchetti, D.; et al. Revised Accelerated Moment Release under test: Fourteen worldwide real case studies in 2014–2018 and simulations. PAGeoph 2020, 177, 4057–4087. [Google Scholar] [CrossRef]
  40. Fidani, C. West Pacific Earthquake Forecasting Using NOAA Electron Bursts with Independent L-Shells and Ground-Based Magnetic Correlations. Front. Earth Sci. 2021, 9, 673105. [Google Scholar] [CrossRef]
  41. Emre, Ö.; Duman, T.Y.; Özalp, S.; Şaroğlu, F.; Olgun, Ş.; Elmacı, H.; Çan, T. Active fault database of Turkey. Bull. Earthq. Eng. 2018, 16, 3229–3275. [Google Scholar] [CrossRef]
  42. Rizaoglu, T.; Parlak, O.; Isler, F. Geochemistry of the Esence Granitoid (Göksun-Kahramanmaras), SE Turkey. Yerbilimleri 2005, 26, 1–13. [Google Scholar]
  43. Ertürk, M.A.; Kara, H.; Sar, A.; Yilmaz, I.; Aysal, N. Geochronology and petrogenesis of the lower Miocene felsic rocks: New evidence for initiation of post-collisional magmatism in the SW Malatya—Eastern Anatolia (Turkey). Geol. Carpathica 2023, 74, 245–260. [Google Scholar] [CrossRef]
  44. Naji, D.M.; Akin, M.K.; Cabalar, A.F. A Comparative Study on the VS30 and N30 Based Seismic Site Classification in Kahramanmaras, Turkey. Adv. Civ. Eng. 2020, 2020, 8862827. [Google Scholar] [CrossRef]
  45. Hacioglu, Ö.; Basokur, A.T.; Çiftçi, E.T. Crustal structure of a young collision zone: The Arabia–Eurasia collision in northeastern Turkey investigated by magnetotelluric data. Earth Planets Space 2018, 70, 161. [Google Scholar] [CrossRef]
  46. Weiss, J.R.; Walters, R.J.; Morishita, Y.; Wright, T.J.; Lazecky, M.; Wang, H.; Hussain, E.; Hooper, A.J.; Elliott, J.R.; Rollins, C.; et al. High-resolution surface velocities and strain for Anatolia from Sentinel-1 InSAR and GNSS data. Geophys. Res. Lett. 2020, 47, e2020GL087376. [Google Scholar] [CrossRef]
  47. Kurt, A.I.; Özbakir, A.D.; Cingöz, A.; Semih, E.; Dogan, U.; Seda, Ö. Contemporary Velocity Field for Turkey Inferred from Combination of a Dense Network of Long Term GNSS Observations. Turk. J. Earth Sci. 2000, 32, 4. [Google Scholar] [CrossRef]
  48. Akin, U.; Ulugergerli, E.U.; Kutlu, S. The assessment of geothermal potential of Turkey by means of heat flow estimation. Bull. Min. Res. Exp. 2014, 149, 201–210. [Google Scholar] [CrossRef]
  49. Wiemer, S.; Wyss, M. Minimum magnitude of completeness in earthquake catalogs: Examples from Alaska, the Western United States, and Japan. Bull. Seism. Soc. Am. 2000, 90, 859–869. [Google Scholar] [CrossRef]
  50. Zúñiga, F.R.; Wyss, M. Inadvertent changes in magnitude reported in earthquake catalogs: Their evaluation through b-value estimates. Bull. Seismol. Soc. Am. 1995, 85, 1858–1866. [Google Scholar] [CrossRef]
  51. Scholz, C.H. The frequency-magnitude relation of microfracturing in rock and its relation to earthquakes. Bull. Seismol. Soc. Am. 1968, 58, 399–415. [Google Scholar] [CrossRef]
  52. Schorlemmer DWiemer, S.; Wyss, M. Earthquake statistics at Parkfield: 1. Stationarity of b values. J. Geophys. Res. 2004, 109, B12307. [Google Scholar] [CrossRef]
  53. Wiemer, S. A software package to analyze seismicity: ZMAP. Seismol. Res. Lett. 2001, 72, 373–382. [Google Scholar] [CrossRef]
  54. Bowman, D.D.; Ouillon, G.; Sammis, C.G.; Sornette, A.; Sornette, D. An observational test of the critical earthquake concept. J. Geophys. Res. Solid Earth 1998, 103, 24359–24372. [Google Scholar] [CrossRef]
  55. Jaumé, S.C.; Sykes, L.R. Evolution of moderate seismicity in the San Francisco Bay region, 1850 to 1993: Seismicity changes related to the occurrence of large and great earthquakes. J. Geophys. Res. Solid Earth 1996, 101, 765–789. [Google Scholar] [CrossRef]
  56. Bufe, C.G.; Varnes, D.J. Predictive modeling of the seismic cycle of the greater San Francisco Bay region. J. Geophys. Res. 1993, 98, 9871–9883. [Google Scholar] [CrossRef]
  57. Mignan, A.; King, G.C.P.; Bowman, D. A mathematical formulation of accelerating moment release based on the stress accumulation model. J. Geophys. Res. 2007, 112, B07308. [Google Scholar] [CrossRef]
  58. Hersbach, H.; Bell, B.; Berrisford, P.; Biavati, G.; Horányi, A.; Muñoz Sabater, J.; Nicolas, J.; Peubey, C.; Radu, R.; Rozum, I.; et al. ERA5 hourly data on single levels from 1940 to present. Copernicus Climate Change Service (C3S) Climate Data Store (CDS). 2023. Available online: https://doi.org/10.24381/cds.adbb2d47 (accessed on 8 September 2023).
  59. Ouzounov, D.; Liu, D.; Chunli, K.; Cervone, G.; Kafatos, M.; Taylor, P. Outgoing long wave radiation variability from IR satellite data prior to major earthquakes. Tectonophysics 2007, 431, 211–220. [Google Scholar] [CrossRef]
  60. Gelaro, R.; McCarty, W.; Suárez, M.J.; Todling, R.; Molod, A.; Takacs, L.; Randles, C.A.; Darmenov, A.; Bosilovich, M.G.; Reichle, R.; et al. The Modern-Era retrospective analysis for research and applications, version 2 (MERRA-2), American meteorological society-modern-Era retrospective analysis for research and applications version 2 (MERRA-2) special collection. J. Clim. 2017, 30, 5419–5454. [Google Scholar] [CrossRef] [PubMed]
  61. Ippolito, A.; Perrone, L.; De Santis, A.; Sabbagh, D. Ionosonde Data Analysis in Relation to the 2016 Central Italian Earthquakes. Geosciences 2020, 10, 354. [Google Scholar] [CrossRef]
  62. De Santis, A.; Marchetti, D.; Spogli, L.; Cianchini, G.; Pavón-Carrasco, F.J.; De Franceschi, G.; Di Giovambattista, R.; Perrone, L.; Qamili, E.; Cesaroni, C.; et al. Magnetic field and electron density data analysis from Swarm satellites searching for ionospheric effects by great earthquakes: 12 case studies from 2014 to 2016. Atmosphere 2019, 10, 371. [Google Scholar] [CrossRef]
  63. Dobrovolsky, I.R.; Zubkov, S.I.; Myachkin, V.I. Estimation of the size of earthquake preparation zones. Pure Appl. Geophys. 1979, 117, 1025–1044. [Google Scholar] [CrossRef]
  64. Fidani, C.; D’Arcangelo, S.; De Santis, A.; Perrone, L.; Soldani, M. Investigating a Possible Correlation between NOAA-Satellite-Detected Electron Precipitations and South Pacific Tectonic Events. Remote Sens. 2024, 16, 1059. [Google Scholar] [CrossRef]
  65. Schorlemmer, D.; Wiemer, S. Microseismicity data forecasts rupture area. Nature 2005, 434, 1086. [Google Scholar] [CrossRef] [PubMed]
  66. Sharma, V.; Biswas, R. Spatio-temporal variation in b-value prior to the 26 November 2021 Mizoram earthquake of northeast India. Geol. J. 2022, 57, 5361–5373. [Google Scholar] [CrossRef]
  67. Xie, W.; Hattori, K.; Han, P. Temporal variation and statistical assessment of the b value off the pacific coast of Tokachi, Hokkaido, Japan. Entropy 2019, 21, 249. [Google Scholar] [CrossRef] [PubMed]
  68. Xie, Z.; Lyu, Y.; Li, X. Temporal and spatial changes in the b-value prior to the 2021 Luxian MS 6.0 earthquake in Sichuan, China. Geomat. Nat. Hazards Risk 2022, 13, 934–948. [Google Scholar] [CrossRef]
  69. Tormann, T.; Wiemer, S.; Mignan, A. Systematic survey of high-resolution b value imaging along Californian faults: Inference on asperities. J. Geophys. Res. Solid Earth 2014, 119, 2029–2054. [Google Scholar] [CrossRef]
  70. Ouzounov, D.; Kalenda, P.; Pulinets, S.; Shen, X.; Yan, R.; Rušajová, J. Multi-parameter precursory patterns associated with the earthquake sequence in Turkey on February 6th, 2023. In Proceedings of the IWEP7 workshop, Chiba University (Nishi-Chiba Campus), Chiba, Japan, 24–25 May 2023. [Google Scholar]
  71. Rikitake, T. Earthquake precursors. Bull. Seismol. Soc. Am. 1975, 65, 1133–1162. [Google Scholar] [CrossRef]
  72. Kawai, K.; Shiokawa, K.; Otsuka, Y.; Oyama, S.; Kasaba, Y.; Kasahara, Y.; Tsuchiya, F.; Kumamoto, A.; Nakamura, S.; Matsuoka, A.; et al. First simultaneous observation of a night time medium-scale traveling ionospheric disturbance from the ground and a magnetospheric satellite. J. Geophys. Res. Space Phys. 2021, 126, e2020JA029086. [Google Scholar] [CrossRef]
  73. Occhipinti, G.; Rolland, L.; Lognonné, P.; Watada, S. From Sumatra 2004 to Tohoku-Oki 2011: The systematic GPS detection of the ionospheric signature induced by tsunamigenic earthquakes. J. Geophys. Res. Space Phys. 2013, 118, 3626–3636. [Google Scholar] [CrossRef]
  74. Zhang, K.; Wang, H.; Xia, H.; Wang, W.; Liu, J.; Zhang, S.; Jin, Y. The Turkey earthquake Induced Equatorial Ionospheric Current Disturbances on 6 February 2023. Remote Sens. 2024, 16, 272. [Google Scholar] [CrossRef]
  75. Vesnin, A.; Yasyukevich, Y.; Perevalova, N.; Sentürk, E. Ionospheric Response to the 6 February 2023 Turkey–Syria Earthquake. Remote Sens. 2023, 15, 2336. [Google Scholar] [CrossRef]
  76. Akhoondzadeh, M. Kalman Filter, ANN-MLP, LSTM and ACO Methods Showing Anomalous GPS-TEC Variations Concerning Turkey’s Powerful Earthquake (6 February 2023). Remote Sens. 2023, 15, 3061. [Google Scholar] [CrossRef]
  77. Salikhov, N.; Shepetov, A.; Pak, G.; Nurakynov, S.; Kaldybayev, A.; Ryabov, V.; Zhukov, V. Investigation of the Pre- and Co-Seismic Ionospheric Effects from the 6 February 2023 M7.8 Turkey Earthquake by a Doppler Ionosonde. Atmosphere 2023, 14, 1483. [Google Scholar] [CrossRef]
  78. Korsunova, L.P.; Khegai, V.V. Medium-term ionospheric precursors to strong earthquakes. Int. J. Geomagn. Aeron. 2006, 6, GI3005. [Google Scholar] [CrossRef]
  79. Akhoondzadeh, M.; Marchetti, D. Study of the Preparation Phase of Turkey’s Powerful Earthquake (6 February 2023) by a Geophysical Multi-Parametric Fuzzy Inference System. Remote Sens. 2023, 15, 2224. [Google Scholar] [CrossRef]
  80. Zhang, X.; De Santis, A.; Liu, J.; Campuzano, S.A.; Yang, N.; Cianchini, G.; Ouyang, X.; D’Arcangelo, S.; Yang, M.; De Caro, M.; et al. Pre-earthquake oscillating and accelerating patterns in the Lithosphere Atmosphere Ionosphere coupling (LAIC) before the 2022 Luding (China) Ms6.8 earthquake. Remote Sens. 2024, 16, 2381. [Google Scholar] [CrossRef]
  81. Sahin, Ü.A.; Kaynak, B. Questioning whether there was a short-term interaction between the 6 February 2023 earthquakes and air quality parameters in Türkiye. Chemosphere 2024, 347, 140616. [Google Scholar] [CrossRef]
  82. Inan, S.; Çetin, H.; Yakupoglu, N. Spring water anomalies before two consecutive earthquakes (Mw 7.7 and Mw 7.6) in Kahramanmaras (Türkiye) on 6 February 2023. Nat. Hazards Earth Syst. Sci. 2024, 24, 397–409. [Google Scholar] [CrossRef]
  83. Di Noto, V.; Vezzù, K.; Conti, F.; Giffin, G.A.; Lavina, S.; Bertucco, A. Broadband Electric Spectroscopy at High CO2 Pressure: Dipole Moment of CO2 and Relaxation Phenomena of the CO2–Poly(vinyl chloride) System. J. Phys. Chem. B 2011, 115, 9014–9021. [Google Scholar] [CrossRef] [PubMed]
  84. Saharay, M.; Balasubramanian, S. Enhanced Molecular Multipole Moments and Solvent Structure in Supercritical Car-bon Dioxide. ChemPhysChem 2004, 5, 1442–1445. [Google Scholar] [CrossRef] [PubMed]
  85. Calcara, M.; Caricaterra, M. CO2 Dipole Moment: A Simple Model and Its Implications for CO2-Rock Interactions. Minerals 2023, 13, 87. [Google Scholar] [CrossRef]
  86. Criscenti, L.J.; Cygan, R.T. Molecular Simulations of Carbon Dioxide and Water: Cation Solvation. Environ. Sci. Technol. 2013, 47, 87–94. [Google Scholar] [CrossRef] [PubMed]
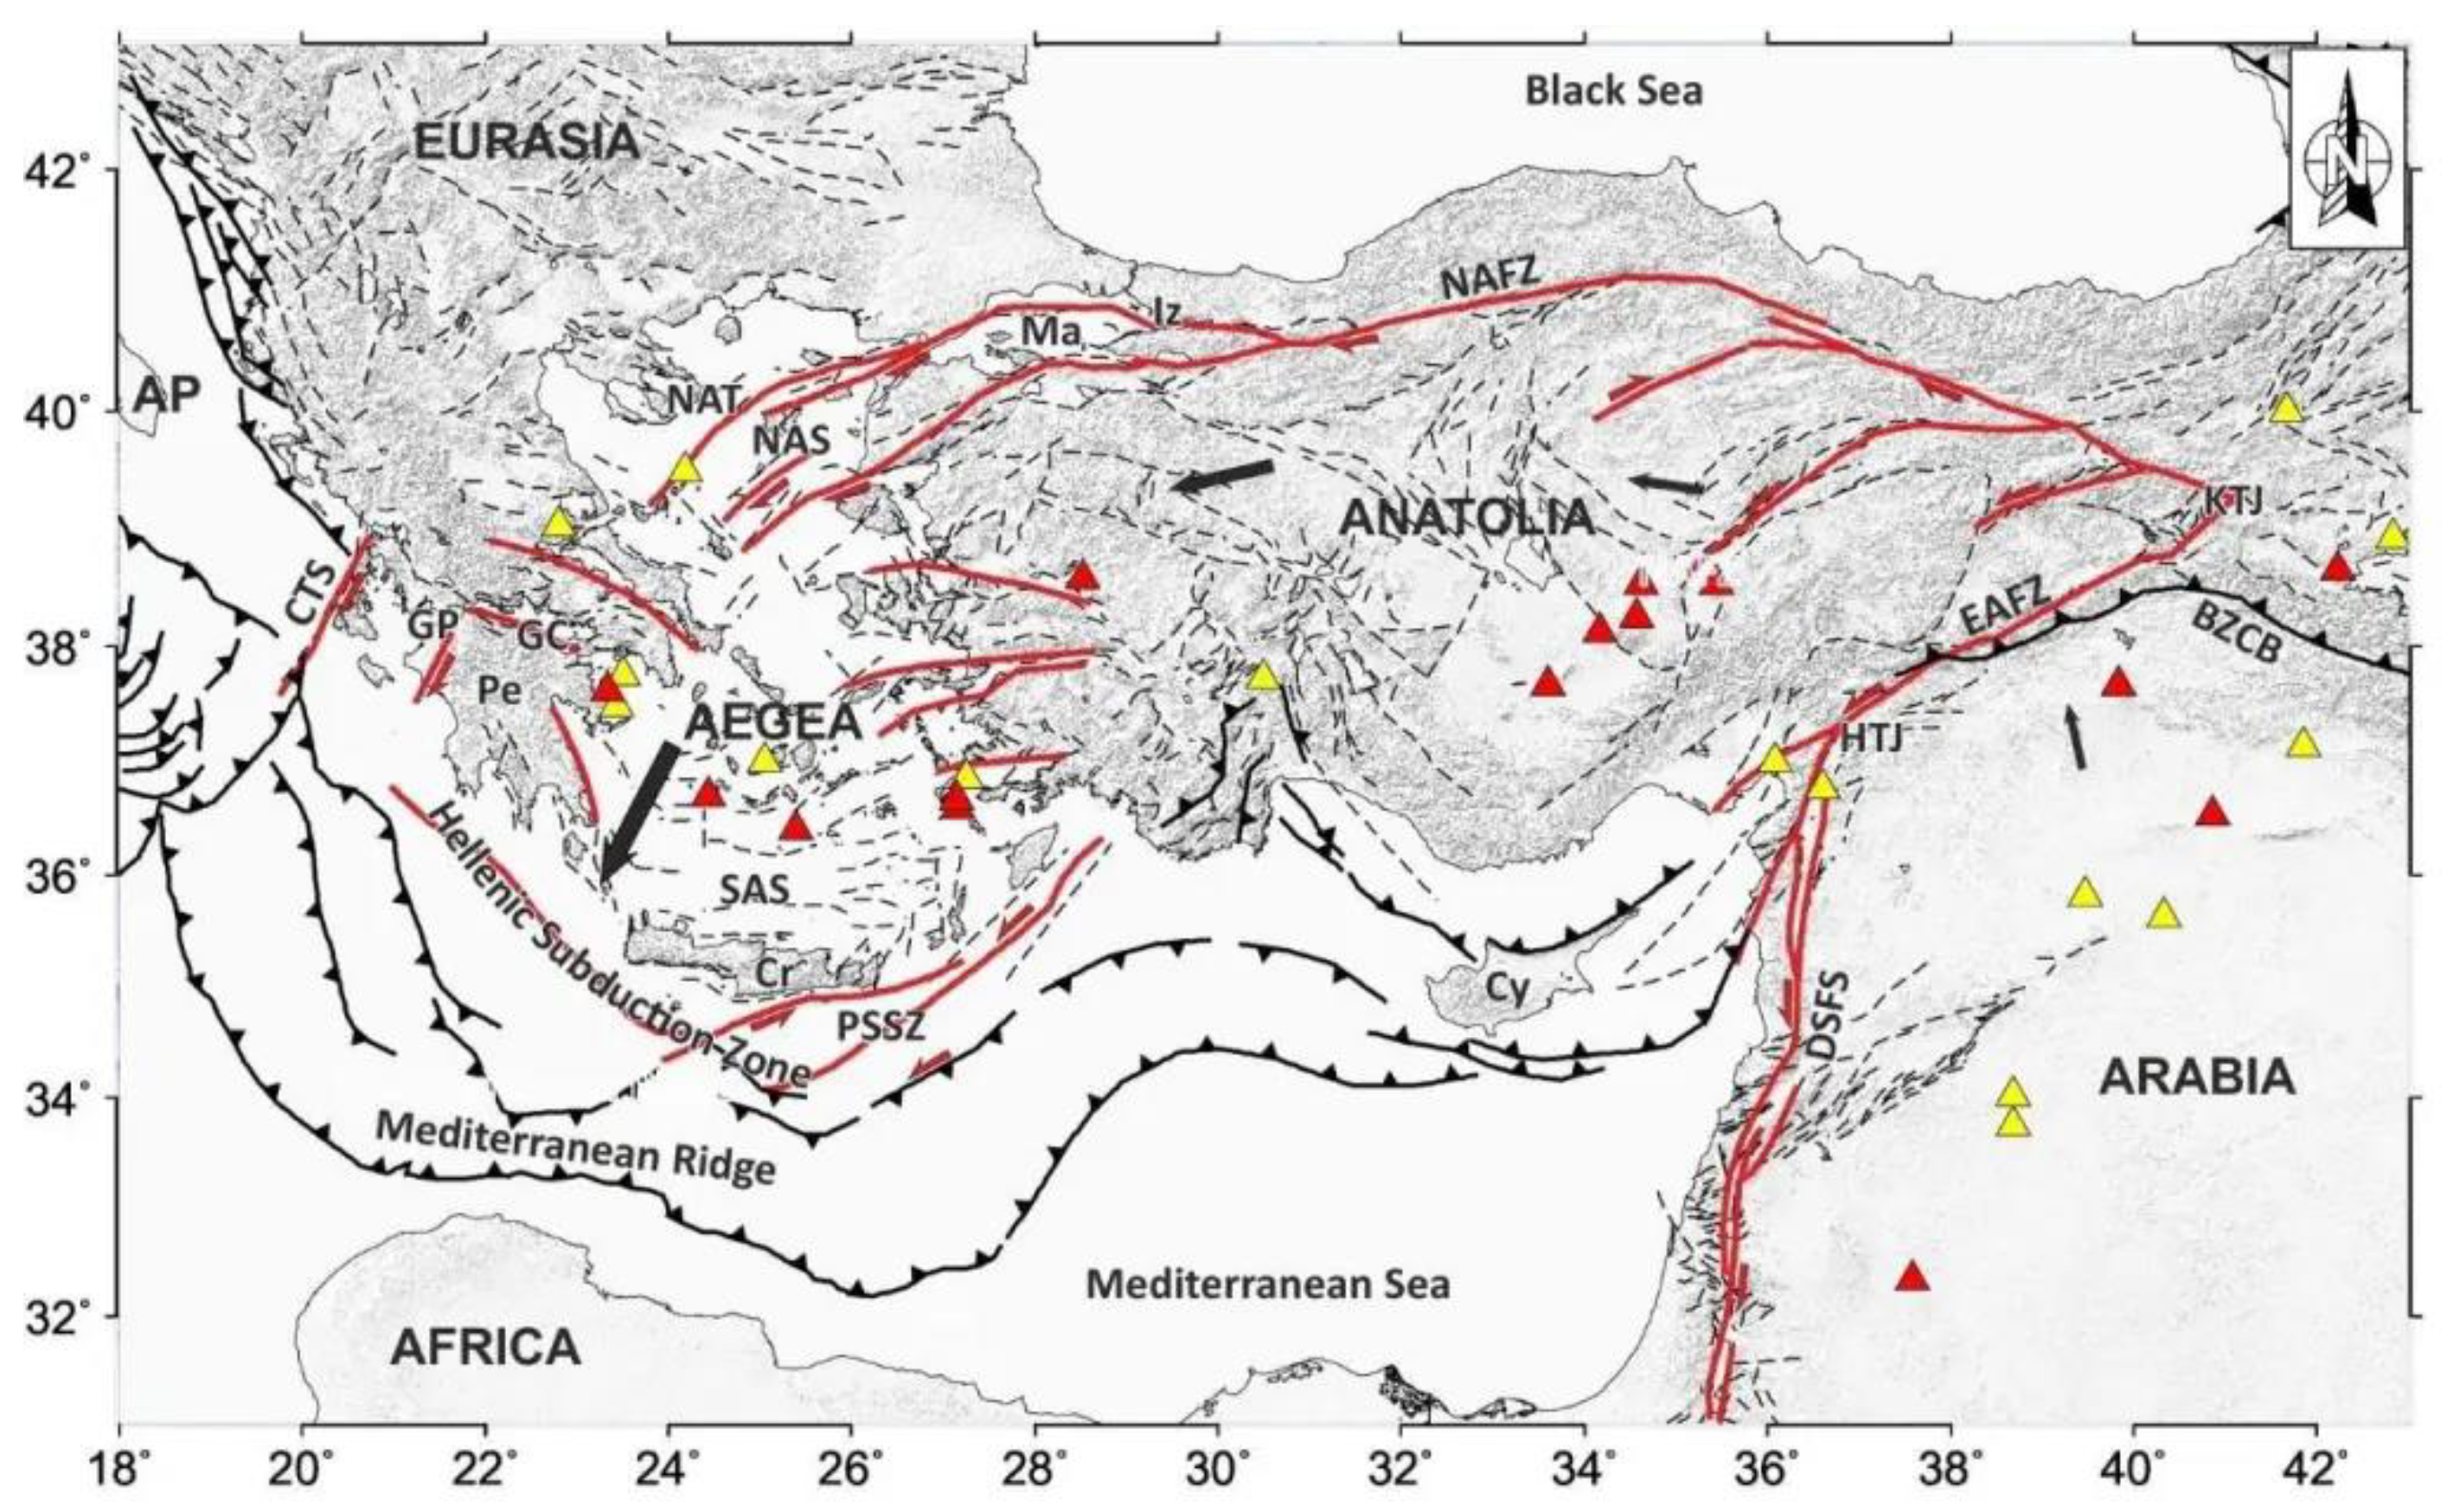
Figure 1. Tectonic setting of the Aegean–Anatolian region: the black and red lines represent the major thrust and faults in region, respectively; the black arrows represent the motion of the Aegean and Anatolian blocks; the red and yellow triangles are the volcanoes (Reprinted with permission from Ref. [30]).
Remotesensing 16 02766 g001
Figure 2. Spatial EQ distribution of all available events from 1 January 2018 to 31 July 2023, constituting the catalogue that was obtained without imposing any selection criteria. The clustering of events in green (mostly aftershocks) along the two branches in the EAFZ, where the large EQ doublet occurred (red stars), put in evidence the fault segments which activated on February 6, accompanied by the three larger aftershocks of the sequence (magenta circle).
Remotesensing 16 02766 g002
Figure 3. Geomagnetic indices (ap and Dst) from 25 January to 8 February 2023. Red horizontal lines highlight the veto thresholds applied for the ionospheric data analyses. Magenta dashed vertical line corresponds to the 6 February mainshock origin time.
Remotesensing 16 02766 g003
Figure 4. The two kinds of electron loss phenomena, the electron burst inside the red square and several extended electron precipitations around the SAA as viewed by NOAA-19 on 31 January 2023.
Remotesensing 16 02766 g004
Figure 5. Seismicity map for the analysed time period, together with the main fault systems of the investigated area. The yellow star represents an earthquake (M5.5) that occurred on 4 August 2020.
Remotesensing 16 02766 g005
Figure 6. Mc calculated using the maximum likelihood method with a 95% confidence.
Remotesensing 16 02766 g006
Figure 7. Temporal variations of the b-value parameter of the G–R law based on the likelihood method.
Remotesensing 16 02766 g007
Figure 8. (a) Map of the spatial distribution of the events, which contributed to the acceleration characterising the sequence of foreshocks; (b) the R-AMR analysis: red symbols represents those events occurring within the inner circle with R0 = 50 km radius (representing the fault area); the blue and the green dots, in the upper and lower insets, respectively, are the events outside the inner circle, i.e., those occurring in the external damped region. The analysis evidenced the appearance of acceleration (C-value = 0.615). Noteworthy is the resulting time to failure tf (1.7 days), i.e., almost 2 days after the real mainshock occurrence.
Remotesensing 16 02766 g008
Figure 9. Analysis of the SKT parameter for Turkey EQ with comparison between the 2023 time series (dashed red line) and the historical time series (1980–2022, blue line). No anomalies were evidenced. In each legend, std stands for standard deviation; 1·std, 1.5·std, 2·std mean one, one and half and two standard deviations, respectively.
Remotesensing 16 02766 g009
Figure 10. Analysis of the OLR parameter for Turkey EQ with comparison between the 2023 time series (dashed red line) and the historical time series (1980–2022, blue line). Evidenced by the red circle, there is one anomalous value with a persistence of 2 days referred to 21 January 2023 (i.e., 15 and 16 days before the mainshock). In each legend, std stands for standard deviation; 1·std, 1.5·std, 2·std mean one, one and half and two standard deviations, respectively.
Remotesensing 16 02766 g010
Figure 11. Map of the OLR anomalous day (21 January) in terms of difference with respect to the historical mean. The epicentre is indicated by the central star. The darker red part of the region could be related to a pre-earthquake OLR anomaly.
Remotesensing 16 02766 g011
Figure 12. Sulphur dioxide (SO2) concentration in the four months before the mainshock (dashed red line) compared with the historical time series of the previous almost 19 years. The blue line is the historical mean, while the coloured bands present the 1 (light blue), 1.5 (green), and 2 (yellow) standard deviations. The red circle indicates an anomaly that emerges clearly from the 2σ background. Bottom: main anomaly maps form 2-day persistent signals.
Remotesensing 16 02766 g012
Figure 13. Carbon dioxide (CO2) concentration in the four months before the mainshock (dashed red line) compared with the historical time series of the previous almost 19 years. The blue line is the historical mean, while the coloured bands present the 1 (light blue), 1.5 (green), and 2 (yellow) standard deviations. The red circle indicates an anomaly that emerges clearly from the 2σ background. Bottom: main anomaly maps form 3-day and 3-day persistent signals, respectively.
Remotesensing 16 02766 g013
Figure 14. Carbon monoxide (CO) concentration in the four months before the mainshock compared (dashed red line) with the historical time series of the previous almost 19 years. The blue line is the historical mean, while the coloured bands present the 1 (light blue), 1.5 (green), and 2 (yellow) standard deviations. The red circle indicates an anomaly that emerges clearly from the 2σ background. Bottom: main anomaly maps form 11-day and 9-day persistent signals, respectively.
Remotesensing 16 02766 g014
Figure 15. Swarm-A (from left to right panels) first differences (MASS method for magnetic data) of: X, Y, Z, and F; and map with the location of the epicentre of the earthquake (green star), Dobrovolsky area (yellow circle; [63]), and analysed track (red line) for 26 January 2023 (i.e., 11 days before the earthquake). Coloured squares indicate the anomalies automatically detected by MASS.
Remotesensing 16 02766 g015
Figure 16. Swarm-C (from left to right panels): electron density data with respect to geomagnetic latitude; first differences (NeAD method for Ne data); electron temperature data with respect to geomagnetic latitude; plasma potential data with respect to geomagnetic latitude; and map with the location of the epicentre of the earthquake (green star), Dobrovolsky area (yellow circle), and analysed track (red line) for 27 January 2023 (10 days before the earthquake). Coloured square indicates the anomaly automatically detected by NeAD.
Remotesensing 16 02766 g016
Figure 17. Swarm-A (from left to right panels) first differences (MASS method for magnetic data) of: X, Y, Z, and F; and map with the location of the epicentre of the earthquake (green star), Dobrovolsky area (yellow circle), and analysed track (red line) for 29 August 2017 (i.e., 1987 days before the earthquake). Coloured squares indicate the anomalies automatically detected by MASS.
Remotesensing 16 02766 g017
Figure 18. CSES-01 (from left to right panels): electron density data with respect to geomagnetic latitude; first differences (NeAD method for Ne data); electron density data with respect to geographic latitude; electron density data with respect to time in hours; and map with the location of the epicentre of the earthquake (green star), Dobrovolsky area (yellow circle), and analysed track (red line) for 15 December 2022 (i.e., 53 days before the earthquake). Coloured squares indicate the anomalies automatically detected by NeAD. In this case this anomaly is an artefact due to the jumps seen around 20°–10° geomagnetic and geographic latitudes, and it is outside of the Dobrovolsky area.
Remotesensing 16 02766 g018
Figure 19. Swarm Alpha (a) and Bravo (b) (from left to right panels): electron density data with respect to geomagnetic latitude; first differences (NeAD method for Ne data); electron temperature data with respect to geomagnetic latitude; plasma potential data with respect to geomagnetic latitude; and map with the location of the epicentre of the earthquake (green star), Dobrovolsky area (yellow circle), and analysed track (red line) for 15 December 2022 (i.e., 53 days before the earthquake). Coloured square indicates the anomaly automatically detected by NeAD.
Remotesensing 16 02766 g019
Figure 20. The anomaly observed on 20 November 2022 by using Δh’Es, δfbEs, and δfoF2 variations.
Remotesensing 16 02766 g020
Figure 21. Ionosonde anomaly on 20 November 2022 likely associated to the 6 February 2023 Mw7.8 Turkey EQ (indicated by the black arrow), compared to the relationship between ∆T·R and M previously found by the analysis of 33 M6+ EQs in the vicinity of Japan during the years 1985–2000 [78] (solid line).
Remotesensing 16 02766 g021
Figure 22. Electron bursts were detected by (a) NOAA-18, (b) NOAA-19, and (c) MetOp-01 on 28 January 2023.
Remotesensing 16 02766 g022
Figure 23. A significant and extensive electron loss phenomenon was observed by MetOp-01 on 7 February 2023.
Remotesensing 16 02766 g023
Figure 24. Comprehensive cumulative number of all anomalies. The red curve represents the best exponential fit, while the black curve is the best power-law fit. The type of anomaly is also indicated in correspondence with each point.
Remotesensing 16 02766 g024
Figure 25. The time markers of the appearance of the anomalies: ordered in abscissa with time to the EQ origin time (t0) (magenta dashed line); and with the altitude in ordinate.
Remotesensing 16 02766 g025
Table 1. Information about the Turkey EQs (time, location, and magnitude) and the ionospheric station of Nicosia (ionosonde type, location, and distance with respect to the EQ epicentres).
EQ
Date Time
(UT)
EQ Location
(Lat Lon)
Magnitude [Mw]IonosondeIonosonde
Location
(Lat Lon)
R [km]
6 February 2023
01:17
37.20°N 37.06°E7.8DPS-4D
(Nicosia)
35.03°N
33.16°E
425.30
6 February 2023
10:24
38.09°N 37.27°E7.6501.16
Table 2. Anomalous day as detected by the ionospheric station of Nicosia and possibly related to the Turkey EQs.
DateHour [UT]Δh’EsδfbEsδfoF2ΔT [days]Ap IndexAE Index
20 November 202206-07130.40.1877.84/78.25 nT<100 nT
Table 3. Cumulative number of anomalies ordered according to their lead time (or delay) with respect to the mainshock. Each is associated with the sources from which they were extracted. The bold is used to distinguish the group of anomalies which deviate (accelerate) around 100 days before the mainshock.
Days to MainshockCumulative NumberSource
−6301b-value descent
−1802change slope RAMR
−883Swarm-A Y mag. field
−854Swarm-A Y mag. field
−785Ionosonde
−536Swarm-A Y mag. field
−267Swarm-A Y mag. field
−178Swarm-A Y mag. field
−159OLR
−1310SO2
−1211CO2
−1112Swarm-A Y mag. field
−913Swarm-A Ne
−914EBs
−815Swarm-A Y mag. field
−316CO
−317Swarm-A Y mag. field
118EBs
Disclaimer/Publisher’s Note: The statements, opinions and data contained in all publications are solely those of the individual author(s) and contributor(s) and not of MDPI and/or the editor(s). MDPI and/or the editor(s) disclaim responsibility for any injury to people or property resulting from any ideas, methods, instructions or products referred to in the content.