Article

An Analysis of the Mechanisms Involved in Glacial Lake Outburst Flooding in Nyalam, Southern Tibet, in 2018 Based on Multi-Source Data

1
National Institute of Natural Hazards, Ministry of Emergency Management, Beijing 100085, China
2
College of Water Conservancy and Civil Engineering, Tibet Agriculture and Animal Husbandry University, Linzhi 860000, China
3
Water Cycle Monitoring Station of Yarlung Zangbo Grand Canyon, Linzhi 860000, China
4
Tibet Autonomous Region Institute of Water Conservancy and Electric Power Planning, Survey and Design Institute, Lhasa 850000, China
*
Author to whom correspondence should be addressed.
Remote Sens. 2024, 16(15), 2719; https://doi.org/10.3390/rs16152719
Submission received: 11 June 2024 / Revised: 23 July 2024 / Accepted: 23 July 2024 / Published: 24 July 2024
(This article belongs to the Section Earth Observation for Emergency Management)

Abstract

:
Glacial Lake Outburst Flood (GLOF) events, particularly prevalent in Asia’s High Mountain regions, pose a significant threat to downstream regions. However, limited understanding of triggering mechanisms and inadequate observations pose significant barriers for early warnings of impending GLOFs. The 2018 Nyalam GLOF event in southern Tibet offers a valuable opportunity for retrospective analysis. By combining optical and radar remote sensing images, meteorological data, and seismicity catalogs, we examined the spatiotemporal evolution, triggering factors, and the outburst mechanism of this event. Our analysis reveals a progressive retreat of 400–800 m for the parent glaciers between 1991 and 2018, increasing the runoff areas at glacier termini by 167% from 2015 to 2018 and contributing abundant meltwater to the glacial lake. In contrast, the lake size shrunk, potentially due to a weakening moraine dam confirmed by SAR interferometry, which detected continuous subsidence with a maximum line-of-sight (LOS) rate of ~120 mm/a over the preceding ~2.5 years. Additionally, temperature and precipitation in 2018 exceeded the prior decade’s average. Notably, no major earthquakes preceded the event. Based on these observations, we propose a likely joint mechanism involving high temperatures, heavy precipitation, and dam instability. An elevated temperature and precipitation accelerated glacial melt, increasing lake water volume and seepage through the moraine dam. This ultimately compromised dam stability and led to its failure between 3 August 2018 and 6 August 2018. Our findings demonstrate the existence of precursory signs for impending GLOFs. By monitoring the spatiotemporal evolution of environmental factors and deformation, it is possible to evaluate glacial lake risk levels. This work contributes to a more comprehensive understanding of GLOF mechanisms and is of significant importance for future glacial lake risk assessments.

1. Introduction

As climate warming has become increasingly acute since the 1970s, glacial hazards have intensified. High-mountain glacial melting leads to increased water levels in glacial lakes and an increased number of glacial lake outburst flood (GLOF) events [1,2,3,4]. Glacial lakes in China are mostly located in the Himalaya mountains, the Qinghai–Tibet Plateau, and the Tianshan Mountains [5,6]. Since the 1930s, half of the recorded GLOF events have occurred in Tibet [7], with heavy associated death tolls, severe infrastructure damages, and huge economic loss in the downstream areas. The analysis of GLOF mechanisms is helpful for monitoring and providing early warnings for future events, with the aim of reducing or even avoiding the damages caused.
To assess the GLOF risk for a glacial lake, first, one must understand the causes and mechanisms of outbursts. In general, the major causes are an abrupt rise in lake water levels due to earthquakes, landslides, or snow avalanches, the instability of downstream dams, debris such as moraines falling into the lake, parent glacier melting, or large-scale precipitation [8]. Yamada categorized the causes of GLOF events on the Tibetan Plateau into external factors (avalanche, precipitation, earthquakes, etc.) and internal factors (melting of dead ice in moraine dams, the expansion of pipe surges, etc.) [9]. In terms of failure mechanisms, Liu Jingjing classified four forms of terminal moraine lake outburst that can cause a flood: overflow dam failure, dam pipe burst, instantaneous dam failure, and multiple mechanisms coupled with each other [10]. It is worth noting that GLOF mechanisms are very complex and are not only related to changes in the glacial lake water volume [11]; they are also closely related to the parent glacier [12], dam composition [13], earthquakes [14], and climatic factors [15]. Therefore, it is necessary to determine the triggering factors and understand the outburst mechanisms in a comprehensive manner.
Given that most glacial lakes are inaccessible due to the high altitudes, conducting traditional field measurements is often challenging and costly. Thus, remote sensing techniques have become the most effective means of studying glacial lakes [16]. Remote sensing has the advantages of taking in rich multispectral information over a large observation area via dynamic monitoring with a short repeat period, and the process is not limited by the ground type [17]. Furthermore, it can provide abundant data for the retrospective analysis of historic GLOF events. At present, high-resolution optical images are used for glacial lake spatial coverage mapping, DEM-based geomorphological analysis, GLOF risk evaluation, and GLOF process simulation. However, in many cases, cloud cover makes it impossible to effectively obtain useful information using optical images [18]. In such cases, synthetic aperture radar (SAR) sensors, which actively emit/receive microwaves and can work at night and under all weather conditions, are used to obtain high-precision topographic information and monitor small surface deformations [19]. Combining optical and SAR remote sensing data, the time-series analysis of the surface information around a glacial lake before a GLOF can provide information for the assessment and analysis of the glacial lake outburst event.
In this study, we used both optical and SAR images to comprehensively analyze the 2018 Nyalam GLOF event in southern Tibet, China. Firstly, with high-resolution optical images, the glacier melting area at the trailing edge and the flow path of the glacial lake outburst were identified. Through the visual interpretation of optical images from 1991 to 2018, we then calculated the change in the glacial lake area and the distance between the parent glacier and the runoff area at the end of the glacier over the past 30 years. Subsequently, the C-band SAR data collected by the Sentinel-1 satellite from 2016 to 2018 were used to obtain the surface subsidence rate and the temporal evolution of the moraine dam and hillside. Finally, using seismic data and meteorological data, the triggering factors and outburst mechanisms of the glacial lake outburst flood event were comprehensively explored, and the surface deformation and potential risks in the area around the glacial lake were evaluated.

2. Study Areas and Data Sources

2.1. Study Area

The 2018 Nyalam GLOF event has been described in previous studies [20]. It occurred in Nyalam Town, the Tibet Autonomous Region, China, close to the China–Nepal border. Previous studies only report an approximate outburst time between 18 June 2018 and 15 October 2018, with a discharge volume of 2.28 × 10⁶ m3. No damage was reported and the outburst mechanism and process remain to be elucidated.
The responsible glacial lake (GL-A) is located on the southern side of the Himalaya mountains (Figure 1) within the Ganges River Basin. It has an area of ~122,000 km2 and a varied topography, climate, and vegetation. This basin crosses southern Tibet from west to east, with a total length of around 1154.5 km, and the terrain is generally high from east to west and low in the middle, with a large altitude difference. The lowest point is 2051 m and the highest is 5400 m, which fully demonstrates the complexity and richness of its natural environment. In addition, the basin belongs to the plateau subtemperate climate zone. The region is cold, with an annual average temperature of 2.1 °C and a maximum temperature difference of 31.2 °C; the snowfall period is more than six months. The rainy season is concentrated from June to August, with huge amounts of precipitation [21]. As a result, glacial lake outburst floods are common in the summer.
Due to its unique geographical features, the study area has a typical Himalayan alpine valley topography. Strongly influenced by the tectonic intrusion of the Himalayan region, a series of north-dipping large fault systems have formed in this region that run through the entire mountain range. The lake is located to the south of the South Tibet Detachment System (STDS) fault, to the west of the Tangra Yum Co–Xuru Co rift, and to the north of the Main Central Thrust (MCT) fault. The STDS is an extensional detachment system that developed along the trend of the Himalayan orogenic belt, which provides important clues for the tectonic study of the collision between the Indian and Eurasian plates [22]. The MCT was once active and extends at depth to the low-angle Main Himalayan Thrust (MHT) fault which has hosted most large Himalayan earthquakes, including the 2015 Mw7.8 Gorkha (Nepal) earthquake [23]. The Tangra Yum Co–Xuru Co rift is a north–south trending fault zone involving the Tangra Yum Co to the north and Xuru Co to the south. It is characterized by normal fault activity, which is related to the east–west extension of the central Tibetan Plateau [24,25]. The presence of these faults has exacerbated the seismic frequency in the region, making earthquakes one of the most serious geological disasters in Himalayan range [26]. In addition, the long-term activity of these faults not only affects the geomorphology of the Himalayas, but also is responsible for varied geological hazards in this region [27].
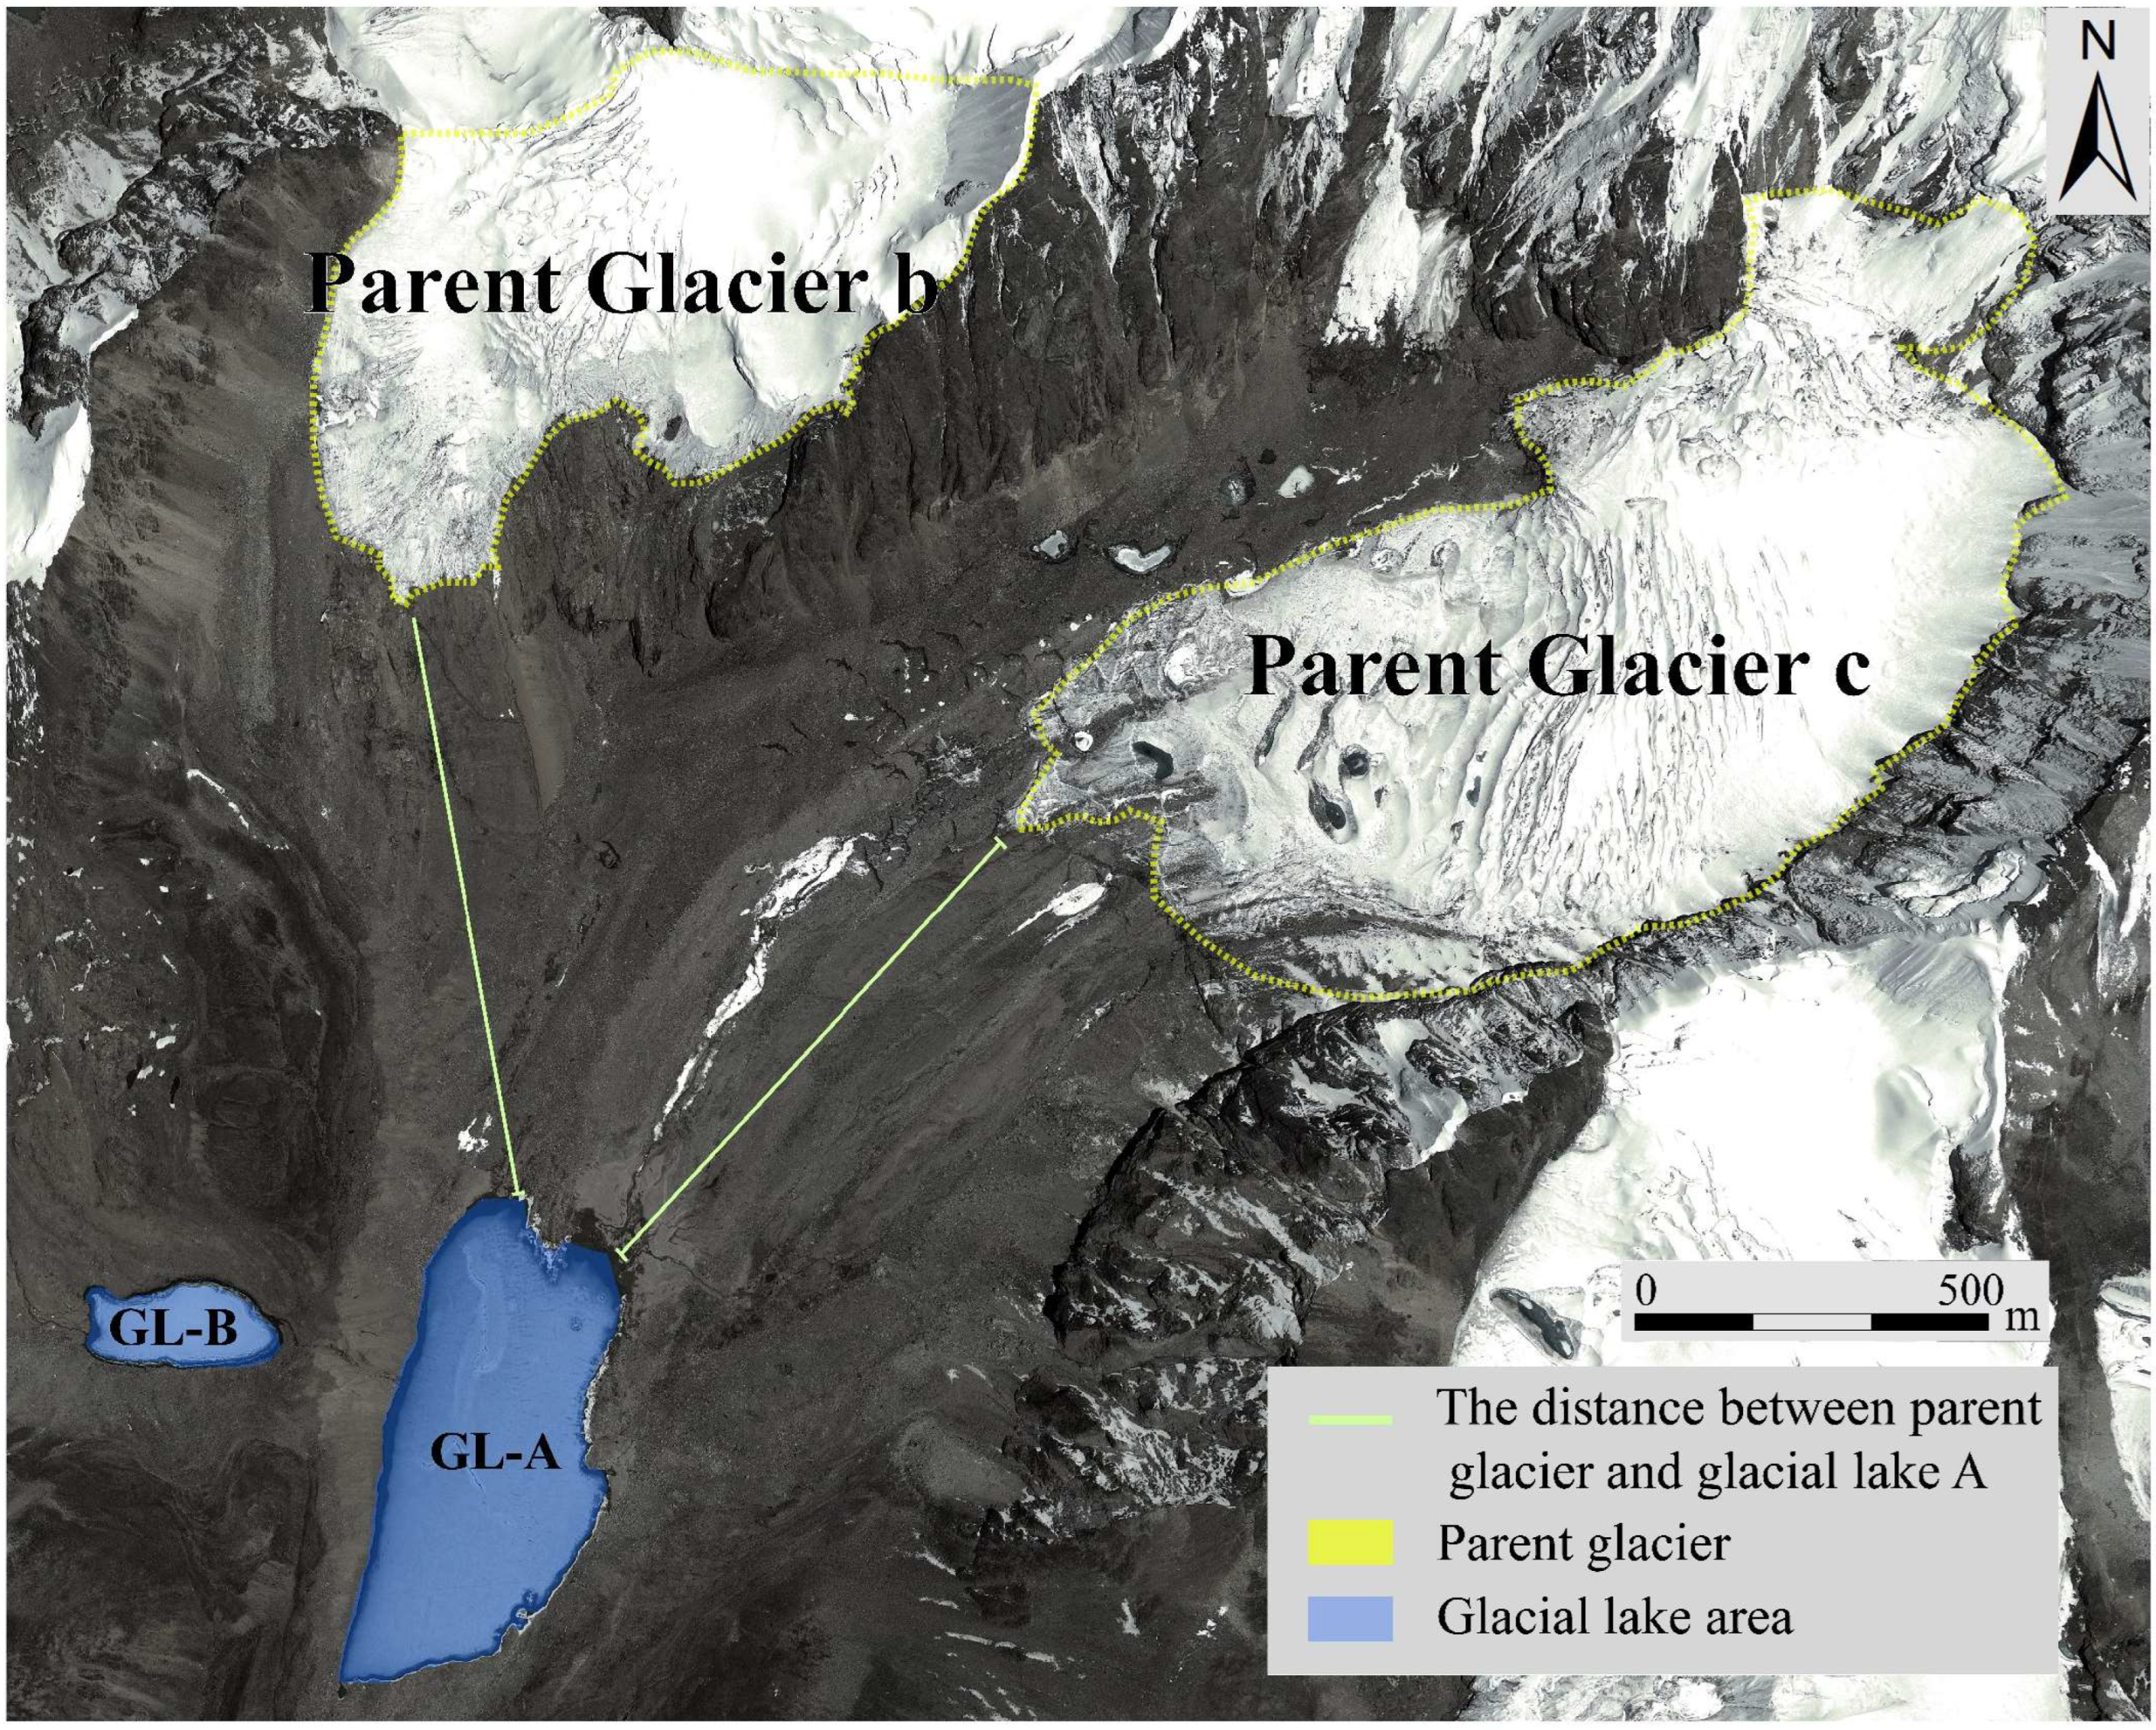
The GL-A is a typical moraine dam lake, with coordinates of 28°14′38.40″N, 86°19′15.60″E. The upper reaches of the lake are distributed with the well-developed Cuolangma Glacier, adjacent to the G318 National Highway to the west and approximately 34.6 km away from Nyalam County. It borders Nepal to the south. The lake surface has an average altitude of 5366 m, with an irregular trapezoidal shape along the northeast–southwest direction. It has a long-axis length of ~0.76 km and a width of ~0.32 km. There are slopes on both sides, with an average incline of 18° and 21.4° on each. The exit is located on the south side of the lake. Before the outburst, the GL-A area was 0.21 km2, the area of the parent glacier G-c was 1.1743 km2, and the end of the glacier was only 0.86 km away from the glacial lake. According to the second glacier inventory dataset in China, the altitude of these three glaciers is 5600–5900 m. In addition, they are typical moraine-covered glaciers, with estimated volumes of 0.004 km2 for G-a, 0.02 km2 for G-b, and 0.04 km2 for G-c [28]. In addition, a large number of ice fissures were observed on the surface of the three glaciers, indicating that they were melting quickly and demonstrating the impact of global warming. There are circulation channels between the glaciers and glacial lakes, which means that glacial meltwater can flow smoothly to the glacial lakes and play a key role in their recharge. It is worth noting that there is a small glacial lake, GL-B, approximately 200 m west of GL-A, and the main water source of GL-B is glacier G-a. In addition, GL-B is higher in elevation than GL-A, with a channel connecting them.

2.2. Datasets

Multi-spectral optical images were used to map the spatial extents of the lakes and parent glaciers, and to identify the existence of possible landslides, moraine collapse, ice calving, and snow avalanches. From 1991 to 2012, Landsat TM/ETM+ images with a moderate ground resolution (30 m) were used. For the time period since 2015, we used high-resolution (1–2 m) optical images from Gaofen (GF) series satellites launched by the China Platform of Earth Observation System (CPEOS), i.e., from GF-1, GF-2, and GF-6 before and after the GLOF event.
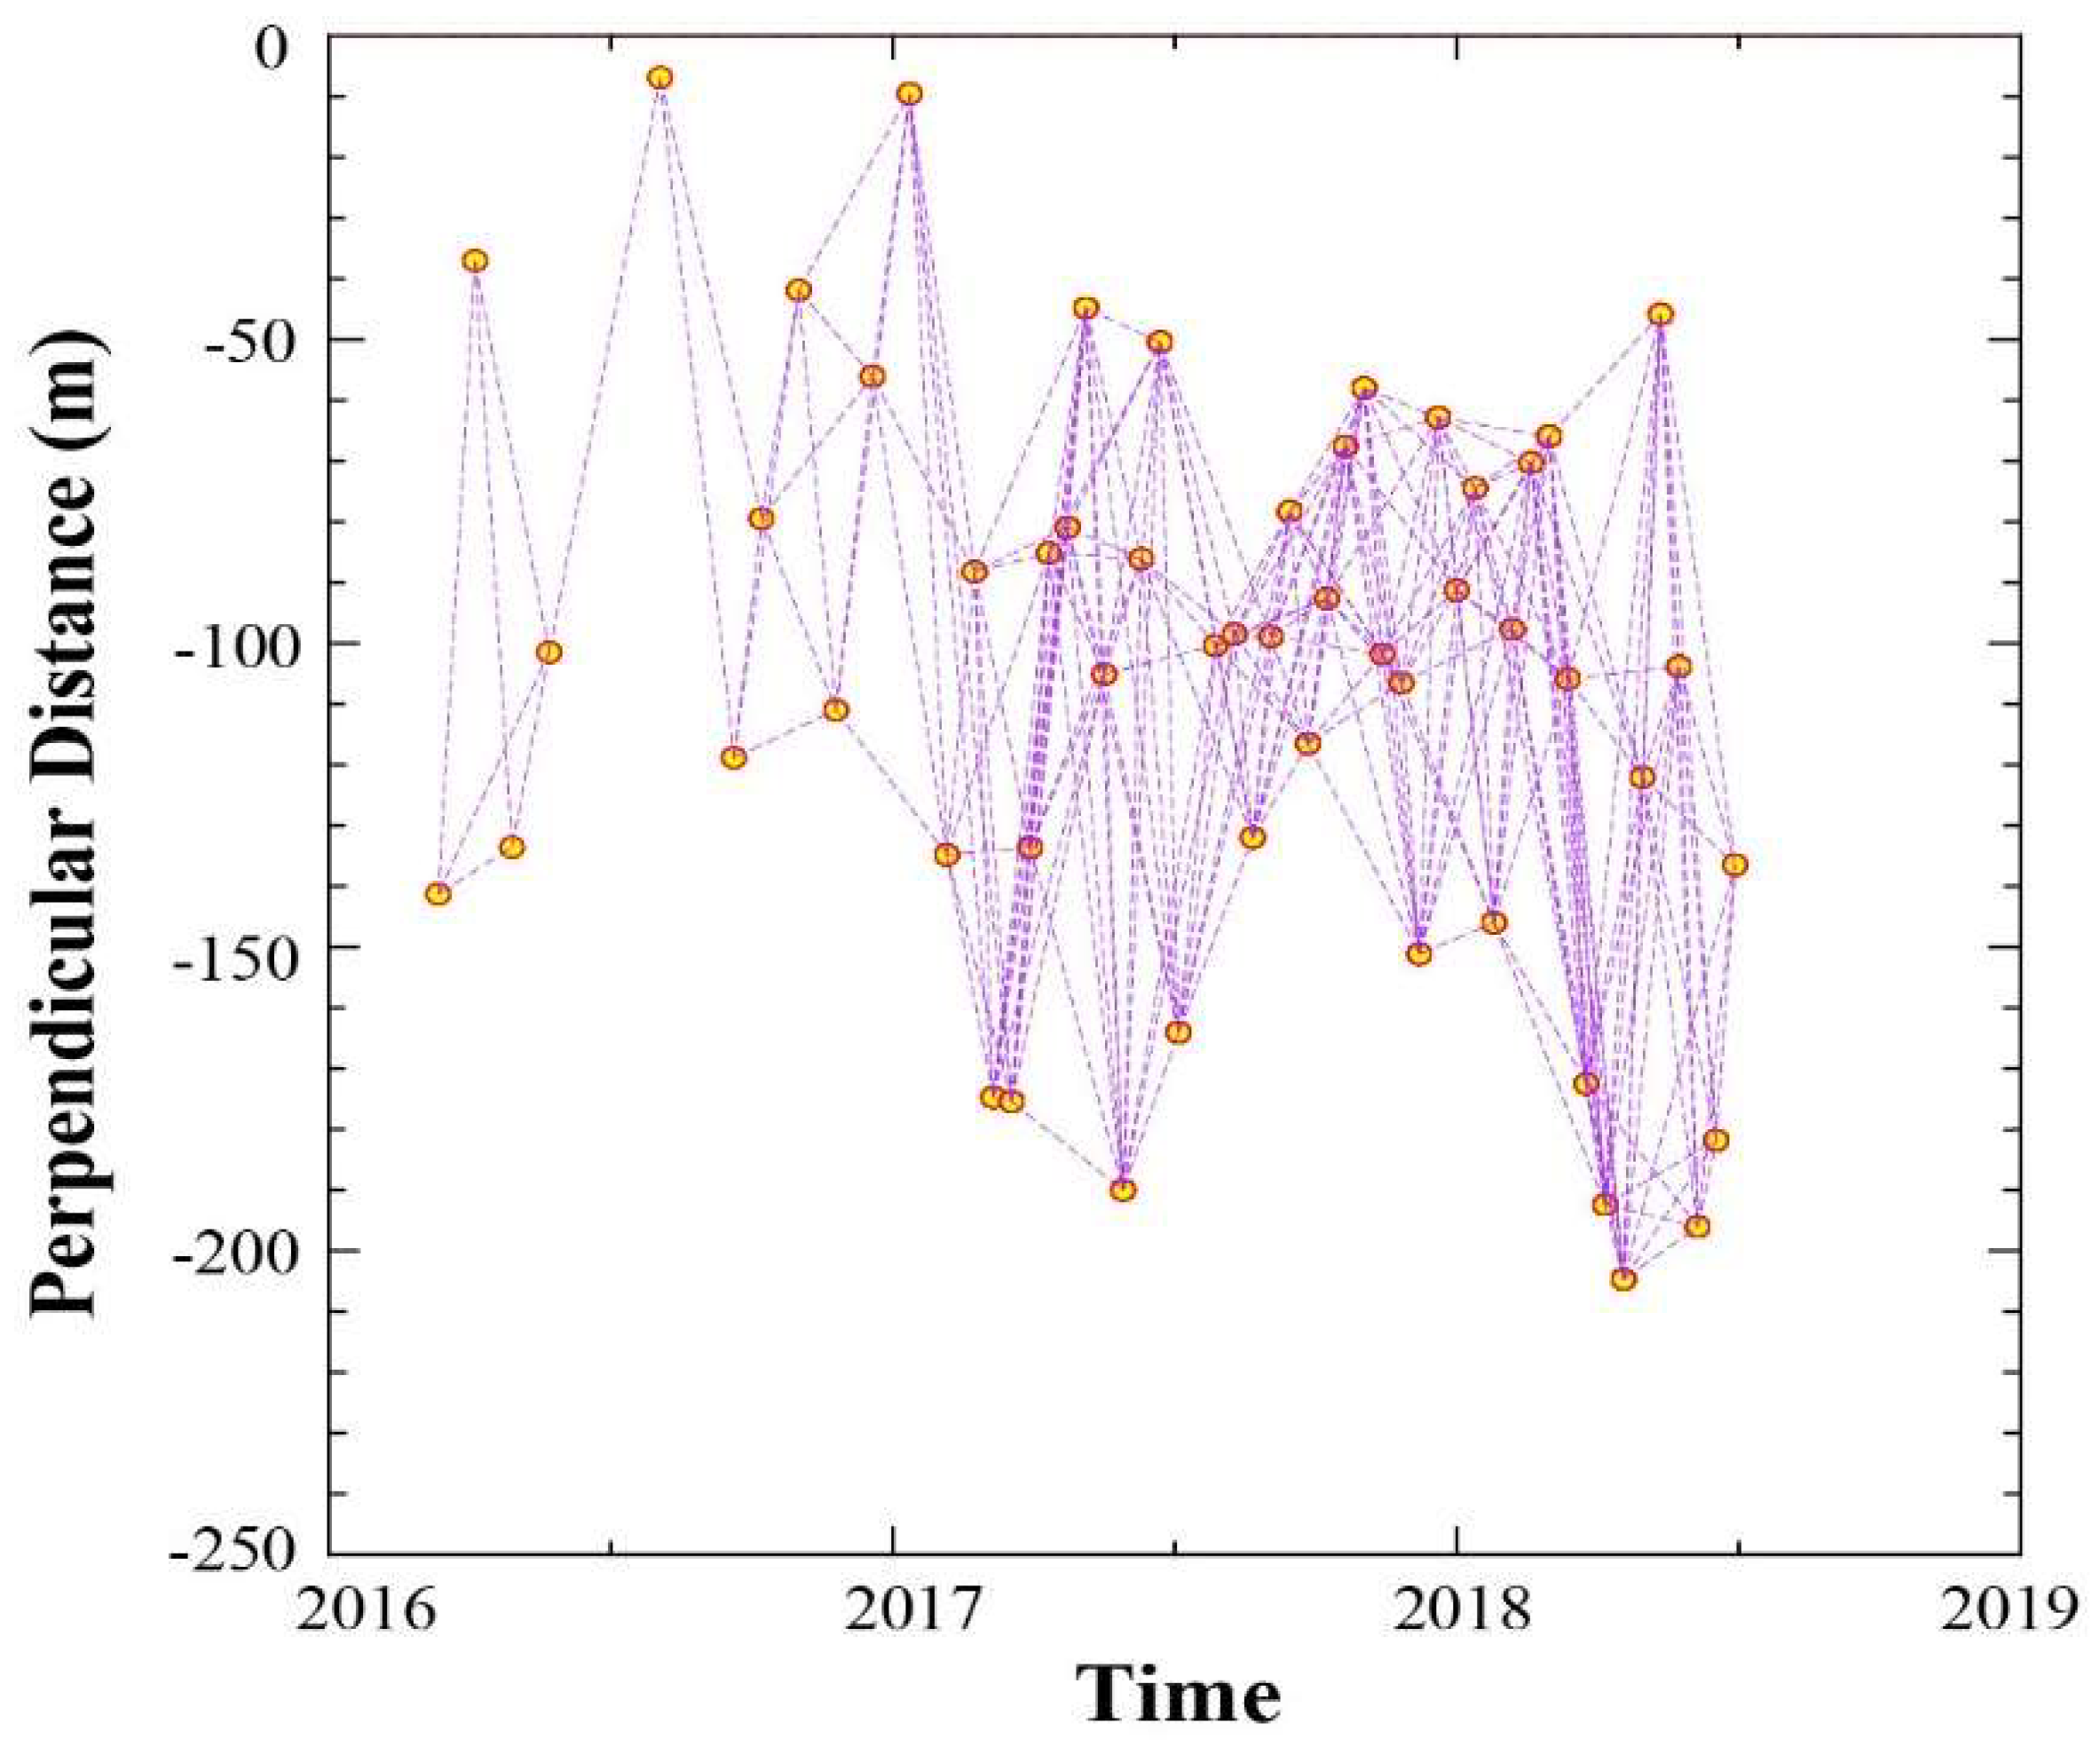
We used Sentinel-1 C-band SAR data to detect the ground deformation, which revealed dam subsidence and landslide movement. SAR data amplitude images also provided clues concerning the time of the GLOF event because the area was covered by heavy clouds during that period. Three Sentinel-1 tracks cover the study area with different viewing geometries, i.e., the descending track T121 and ascending tracks T12 and T85. We processed 55 acquisitions from the T121 track (Table S1) to derive the deformation field. Images collected from July to August 2018 for the T12 and T85 tracks were used to determine the exact time of the outburst event. Images collected by the satellite launched by the European Space Agency (ESA) in 2014 in TOPS mode were processed and the surface deformation field of the glacial lake area was obtained via SBAS-InSAR time-series analysis.
Meteorological data from the National Oceanic and Atmospheric Administration (NOAA) were used to analyze the annual variation in the local temperature and precipitation, which are the two most important environmental factors triggering a GLOF. Based on a global summary of the day from the NOAA, the triggering factors of the GLOF were determined.
Seismicity data up to one year before 31 August 2018 were utilized to assess potential triggering by a nearby earthquake. Both catalogs from the United States Geological Survey (USGS) and Chinese National Earthquake Data Center (NEDC) were used, including information on the time, location, and magnitude of earthquakes around the study area.
Table 1 lists all data used in this work. Detailed information on the individual datasets can be found in the Supplementary Material (Table S1 lists the specific information about the images used).

3. Methods

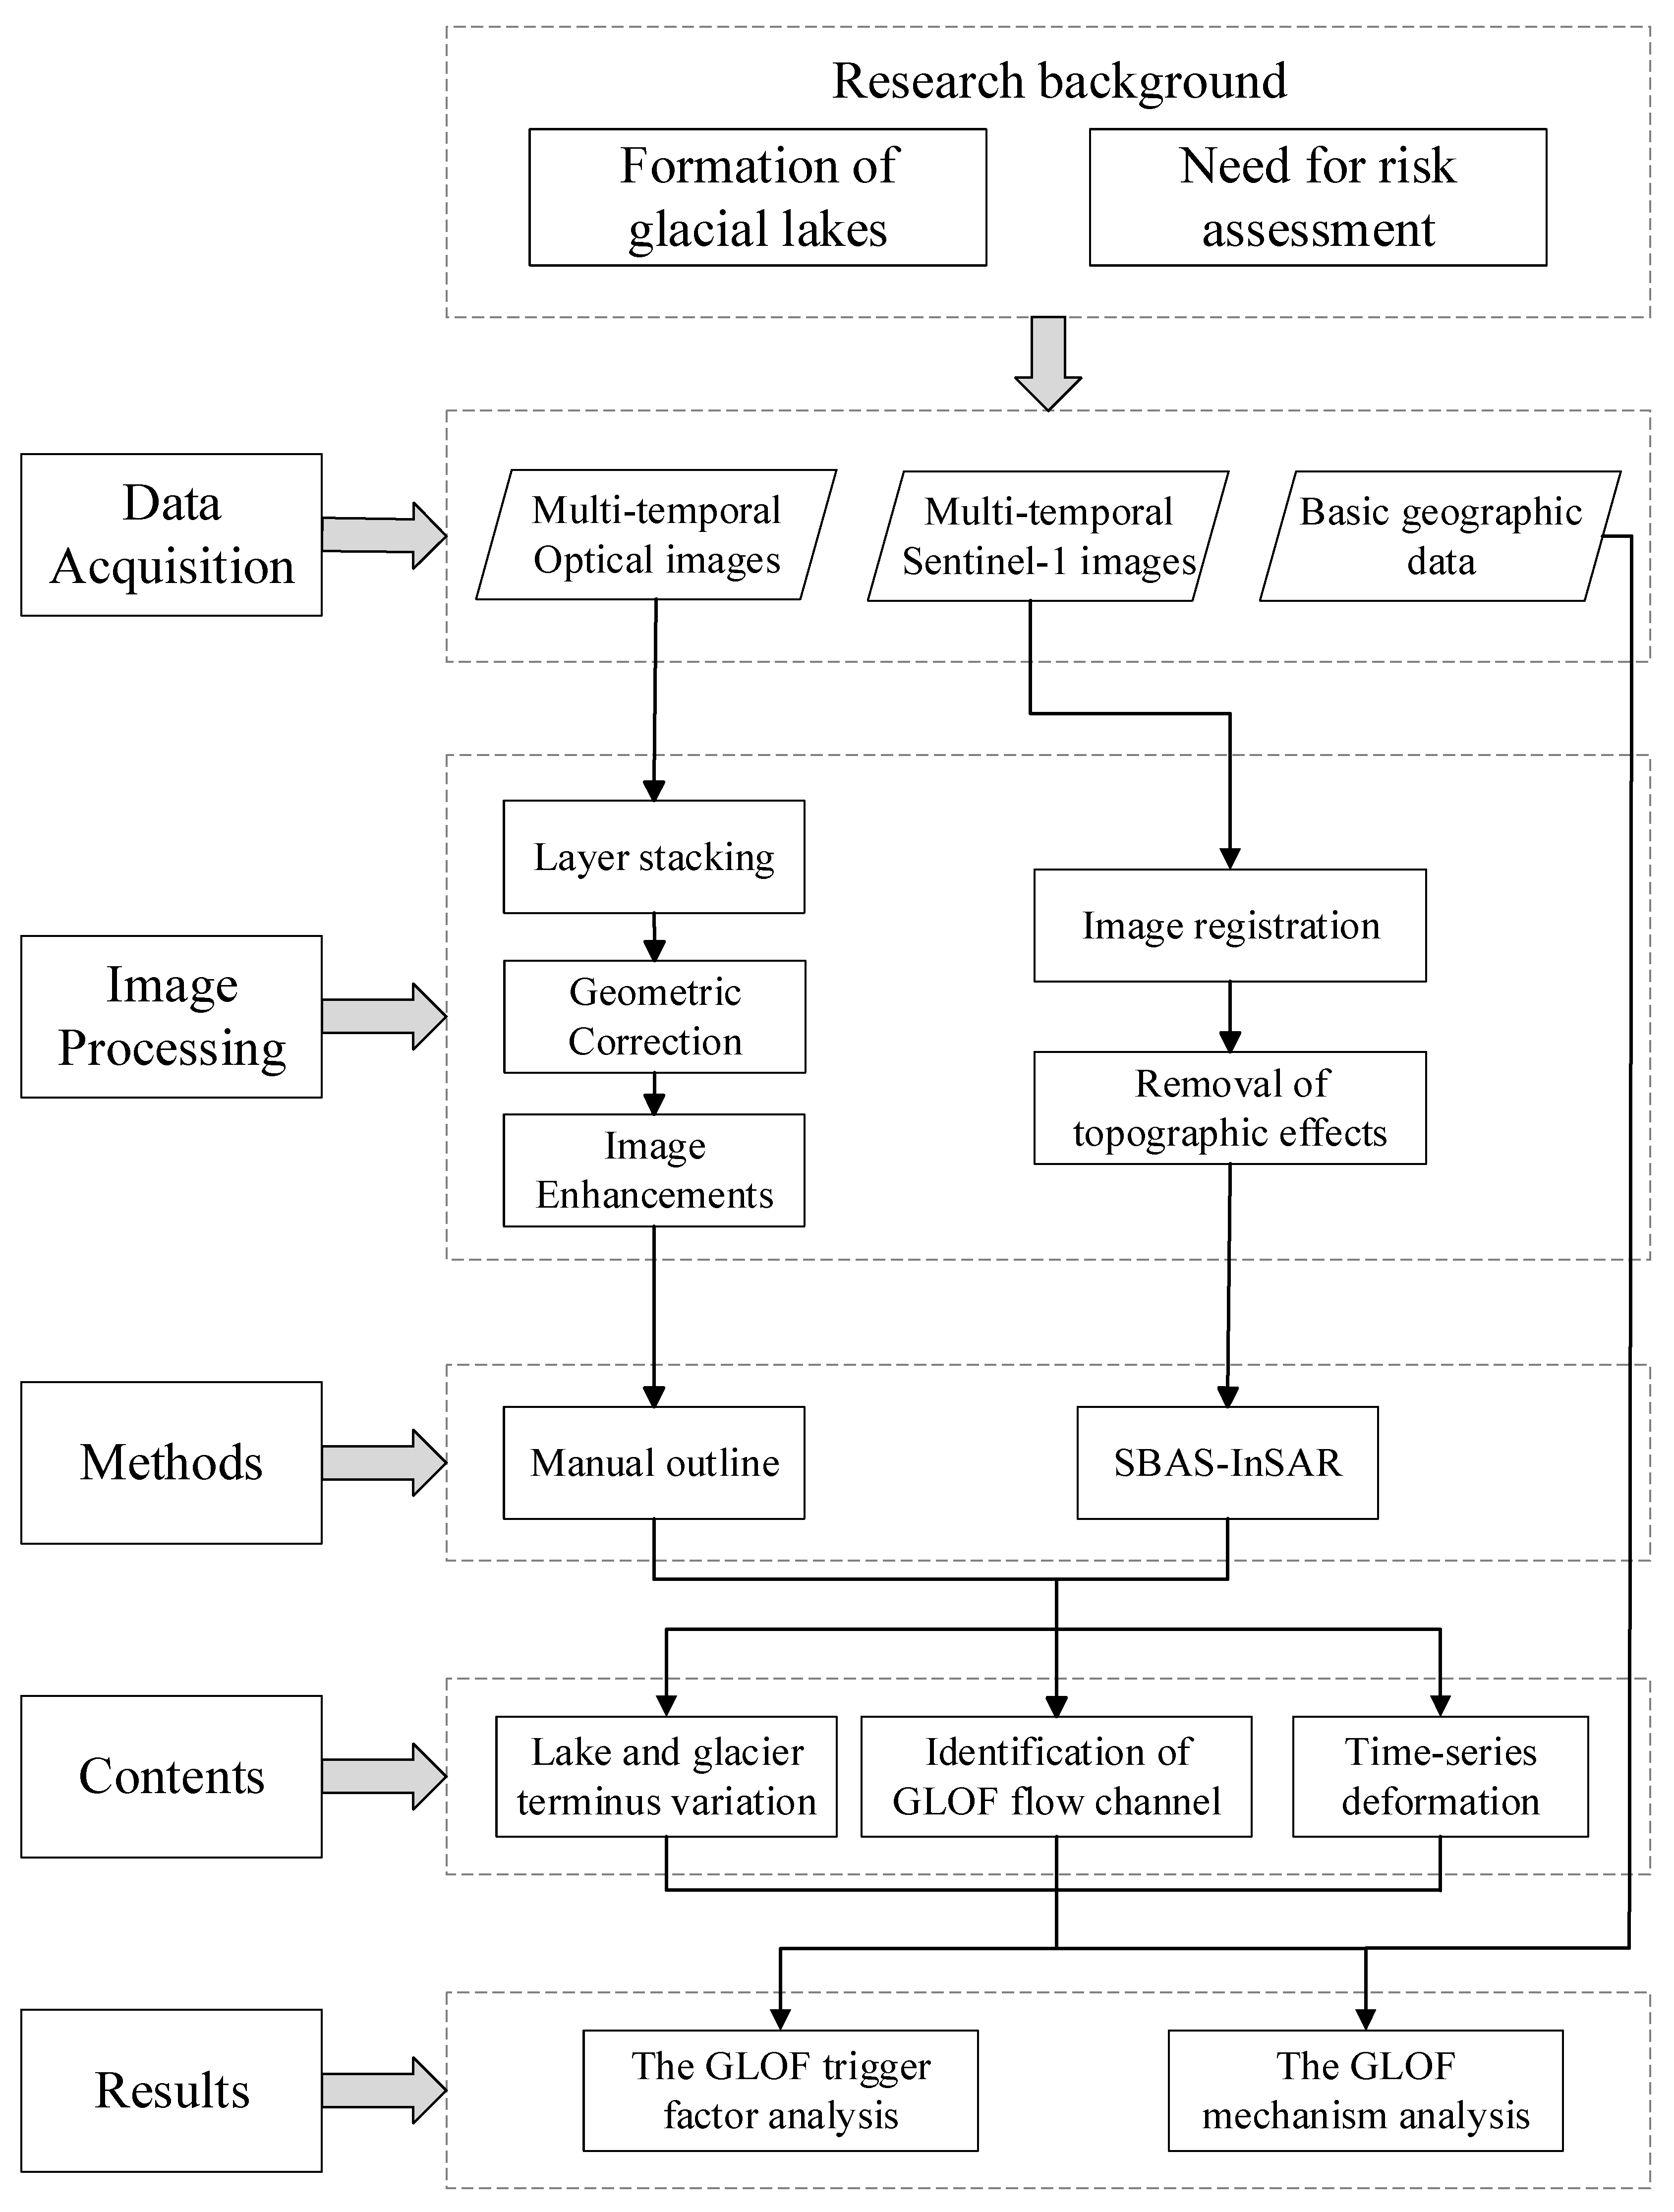
A combination of active and passive remote sensing techniques was used to investigate the 2018 Nyalam GLOF. The water level and morphological characteristics of the two glacial lakes, and the terminus of the parent glaciers, were captured by long-time-span optical satellite images. In addition, the deformation characteristics of the glacial lake periphery were obtained using the SBAS-InSAR method with Sentinel-1A SAR data. Finally, by additionally assessing seismic, meteorological, and hydrological data, the triggering factors and outburst mechanisms of the GLOF were analyzed. Figure 2 shows the workflow of this study.

3.1. Identify Spatiotemporal Evolution of Lakes and Parent Glaciers

Landsat TM/ETM+ from 1991 to 2012 and GF-1 optical images from 2013, 2014, and 2017 were obtained. The raw multi-spectral images were preprocessed, including radiometric calibration, atmospheric correction, orthorectification, and image fusion, to obtain a total of six high-resolution multispectral remote sensing images. These data were used to identify the glacier melting area at the trailing edge of the glacial lake and the flow path of the glacial lake outburst. In addition, they were also utilized to analyze the GL-A area, the distance from the parent glacier, and the change in the GL-B area.
The key to analyzing GLOS events is monitoring dynamic changes in the glacial lake and its environment [29,30,31,32,33]. The area of the glacial lake and the distance from lake to parent glacier are usually selected as the key indicators in GLOF analysis (Figure 3). Cui et al. proposed that the area and length of glacial lakes are the main factors affecting the occurrence of a GLOF [34]. In addition, Huang Jingli et al. showed that the reservoir capacity of moraine lakes is often affected by their area; the larger the area of moraine lakes, the larger their reservoir capacity. This leads to an increase in the hydrostatic pressure of the terminal, which increases the risk of dam instability and failure due to compression [35]. The distance between the glacial lake and the end of the parent glacier is also an important indicator to predict whether an ice avalanche or avalanche may enter the glacial lake in the terminal area of the glacier. The closer the distance, the higher the probability of a GLOF. Conversely, the probability is relatively low if the distance is larger [36]. Through the interpretation of multi-temporal optical remote sensing images, we determined the long-term changes in the glacial lakes and glacier ends. Because of the closeness of GL-B and GL-A, the relationship between the areas of these two glacial lakes was statistically analyzed through a time-series analysis.
The glacial lake area was calculated after extracting the glacial lake boundary in a manual, semi-automated, or automated way [37]. The distance between the glacial lake and the end of the parent glacier was measured visually based on geometrically corrected remote sensing images. In order to avoid the influence of clouds and fog, we only used Landsat4, Landsat5, and GF-1 optical data with a cloud cover of less than 10%. To obtain the best visual expression for extracting lake and glacier boundaries, we finally chose the 5th, 4th, and 3rd bands of the Landsat ETM+ images (corresponding to the near-infrared band (NIR), red band, and green band, respectively) to form the false-color image. Thereafter, the GF-1 image from 2018 was used as a reference image, and the rest of the images were georeferenced to it. Finally, based upon the registered images, the glacial lake areas and the glacier end retreat were calculated and their trends were analyzed.

3.2. Monitor Ground Deformation around Lakes and Glaciers

We used the SBAS-InSAR method to process the Sentinel-1A SAR data acquired from 2016 to 2018. SBAS-InSAR can monitor surface deformation at a millimeter accuracy [38]. The open-source software GMTSAR 5.5.0 (https://topex.ucsd.edu/gmtsar/), which was developed by the University of California, was used for the InSAR time-series analysis. Firstly, the Sentinel-1images were cropped according to the extent of our study area in order to reduce the processing time. A single-view Sentinel-1 image has a width of approximately 250 km × 180 km, and the data frame of each period is offset in the satellite heading. The images were then geometrically registered to reference one (26 October 2014) using the POD precise orbit ephemerides (Figure 4). Enhanced spectral diversity (ESD) registration optimization was used to further improve the registration accuracy and remove the obvious phase jumps between bursts [39]. The coherence was rather high for the temporal baselines of several months. We, therefore, generated interferograms with temporal baselines of ≤72 days, without any constraints for the spatial baseline. The topographic phase was removed using a 90 m STRM DEM. The interferograms were filtered using a Gaussian low-pass filter and Goldstein filter to suppress speckle noise. The Snaphu software v2.0.4 was used for phase unwrapping, initializing using the minimum cost flow (MCF) algorithm. We used a coherence of 0.2 to remove the decorrelated areas of the water body, ice cover, and other fast-changing surfaces (e.g., sand, glacier, and melted moraine). The SBAS method based on the unwrapped phase and coherence weighting was used for the temporal analysis to obtain the displacement time series of each pixel in the image in the satellite’s line-of-sight (LOS) direction and to estimate the average rate during the observation period using the least square method. Finally, based on the precise orbit data, we established a geocoding conversion between the geographic coordinate system and the radar coordinate system, converting the deformation field from the radar coordinate system to WGS-84 coordinate system [40].

4. Results

4.1. Changes in Glacial Lake Area and Glacier Terminus in the Past 30 Years

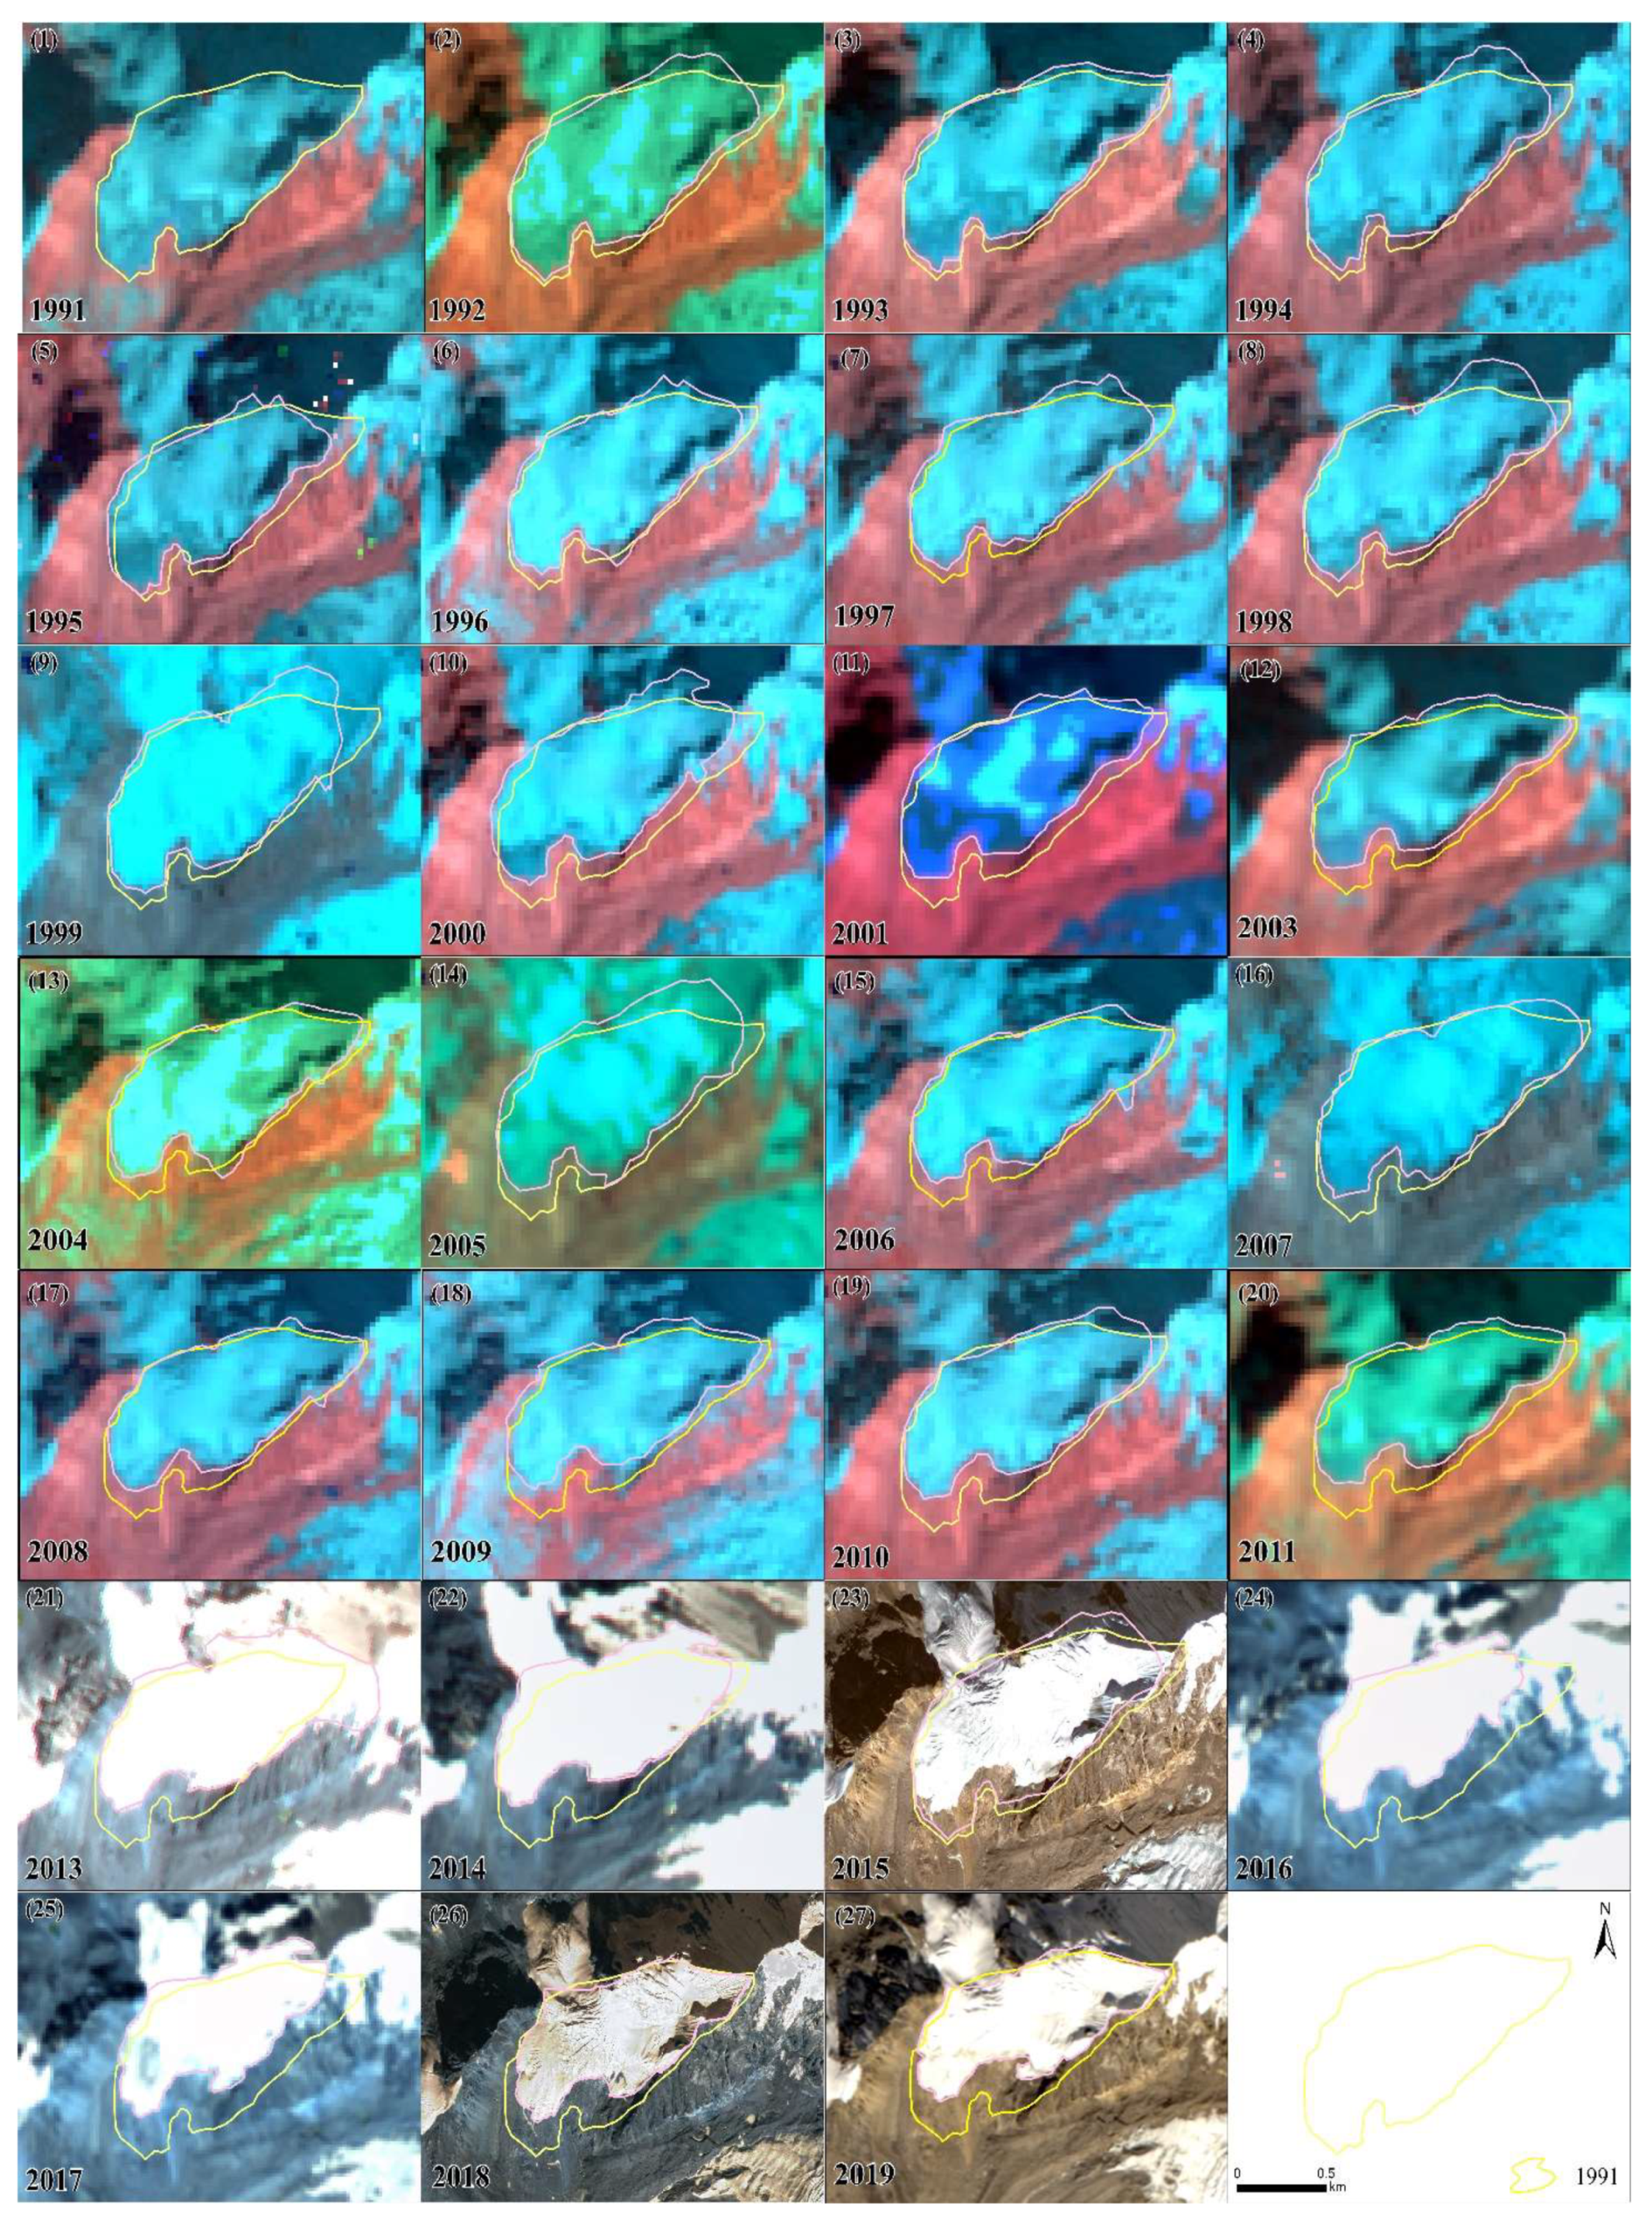
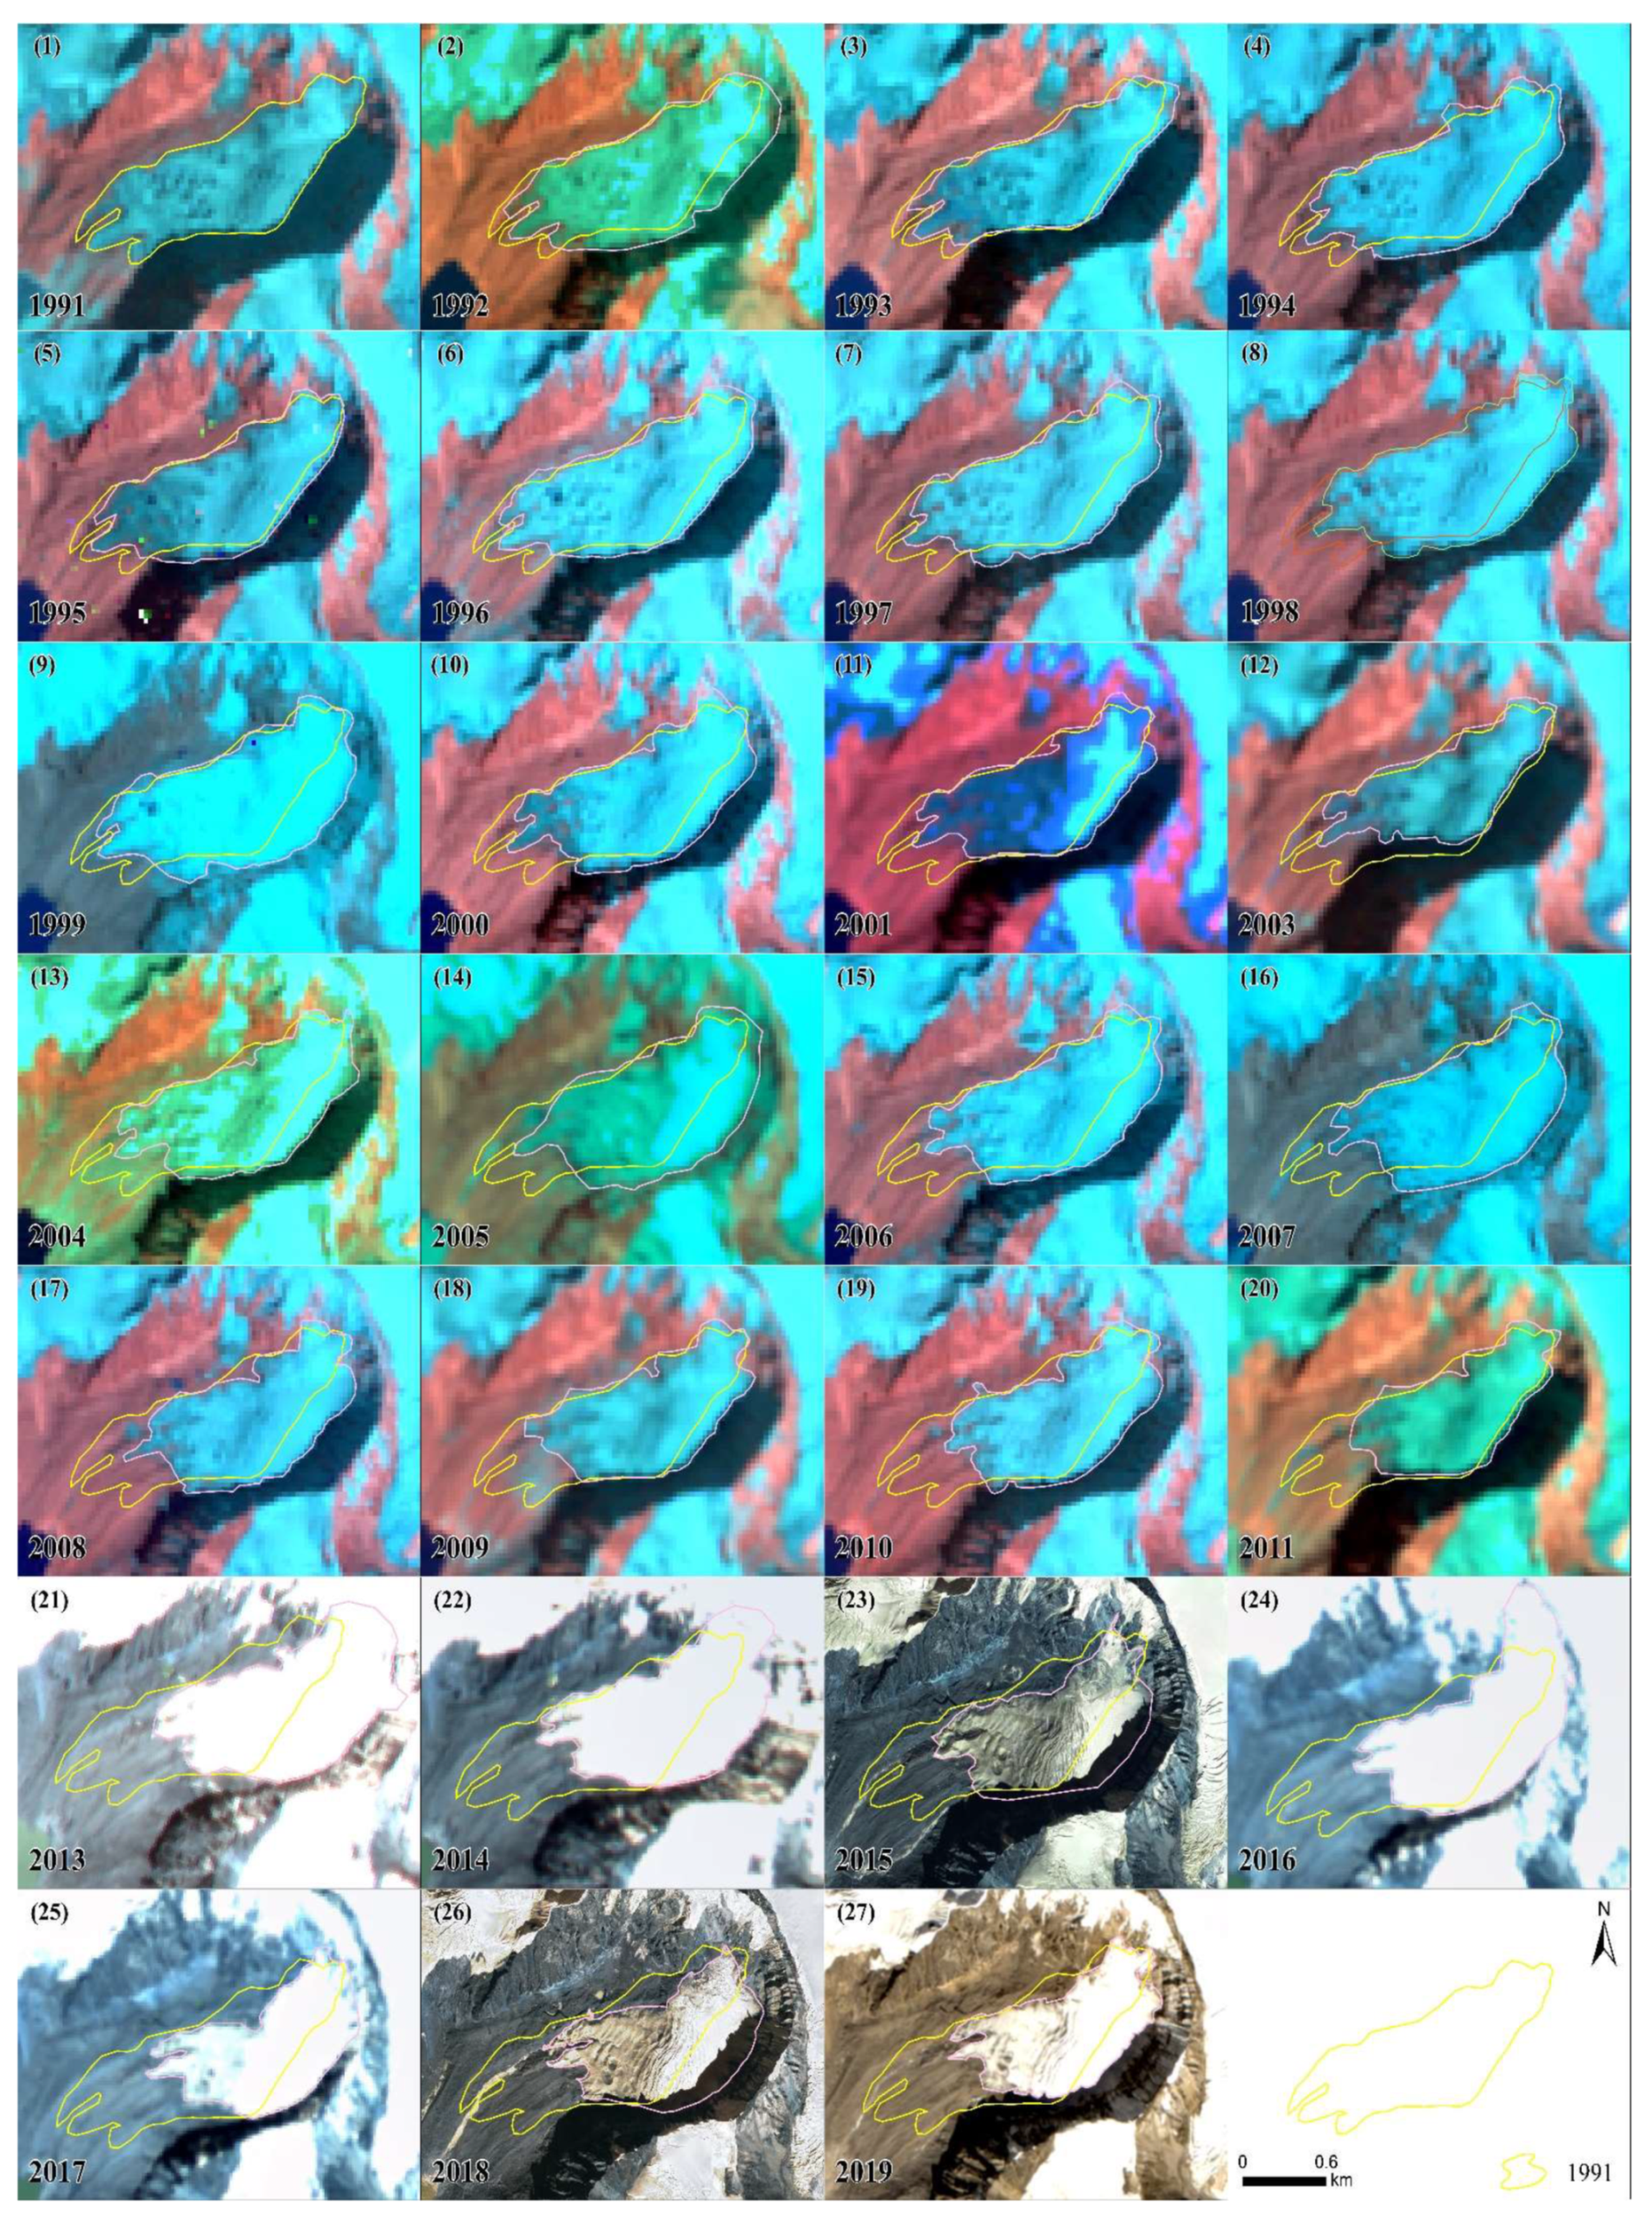
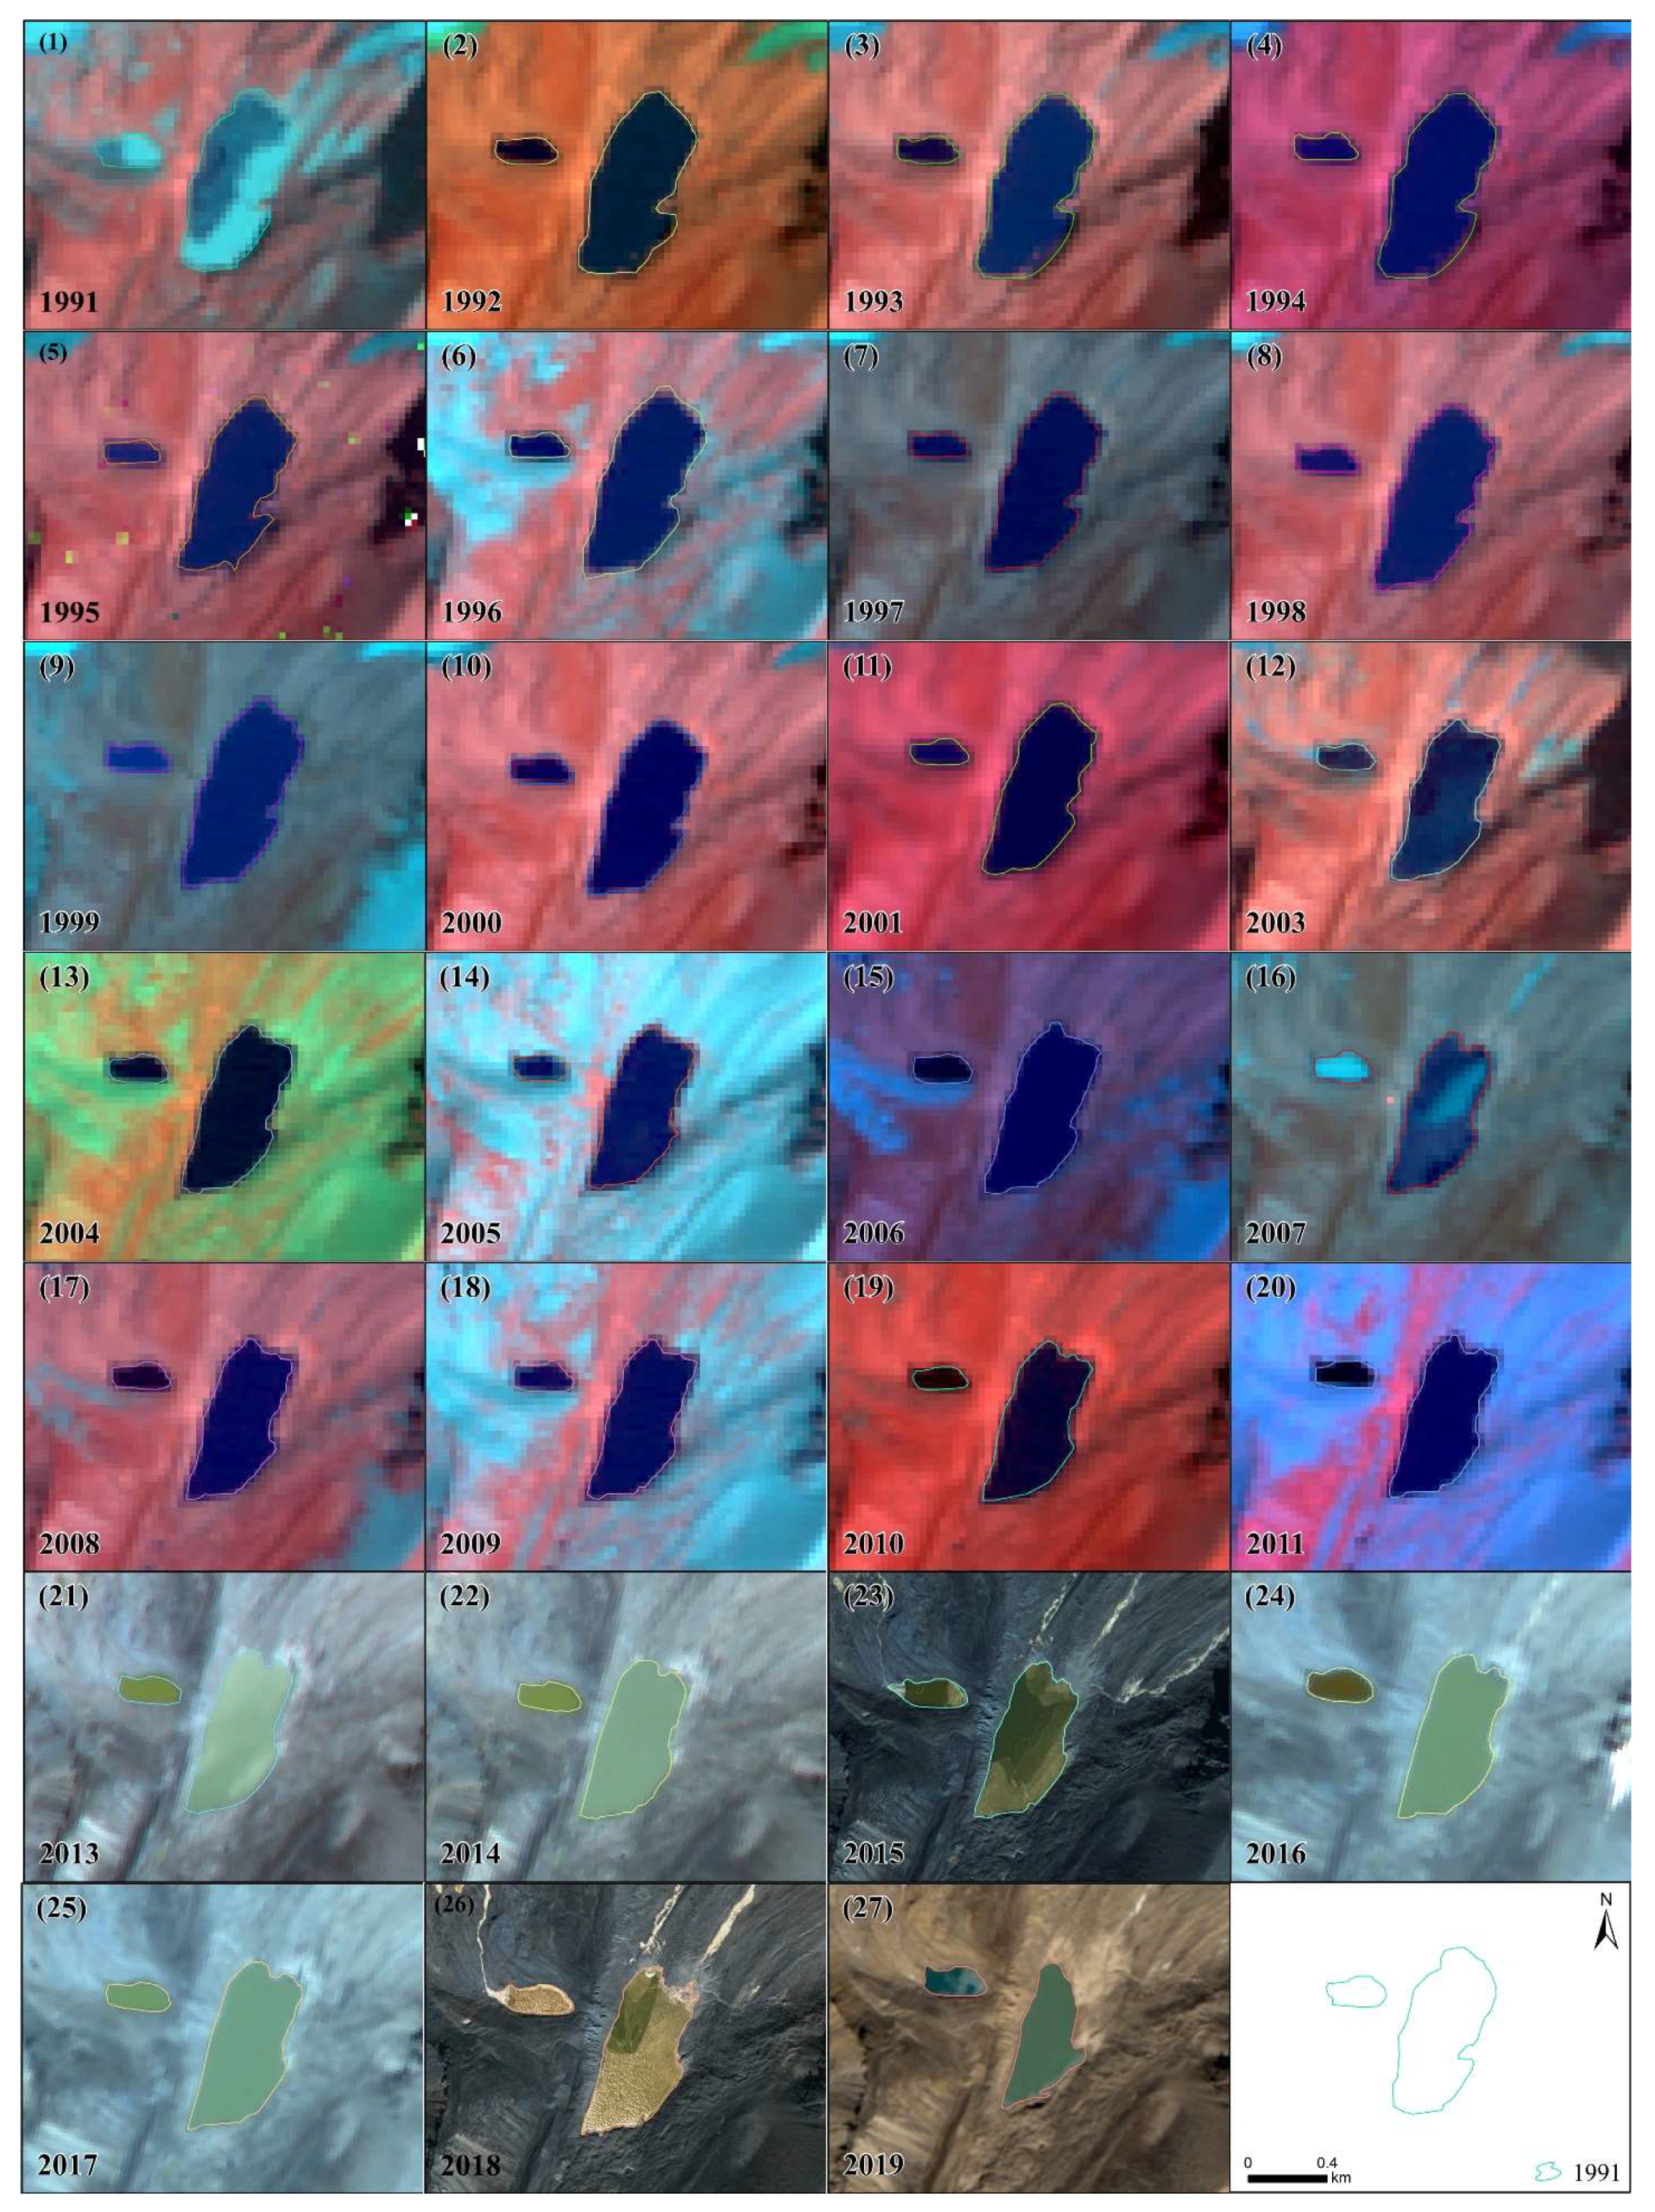
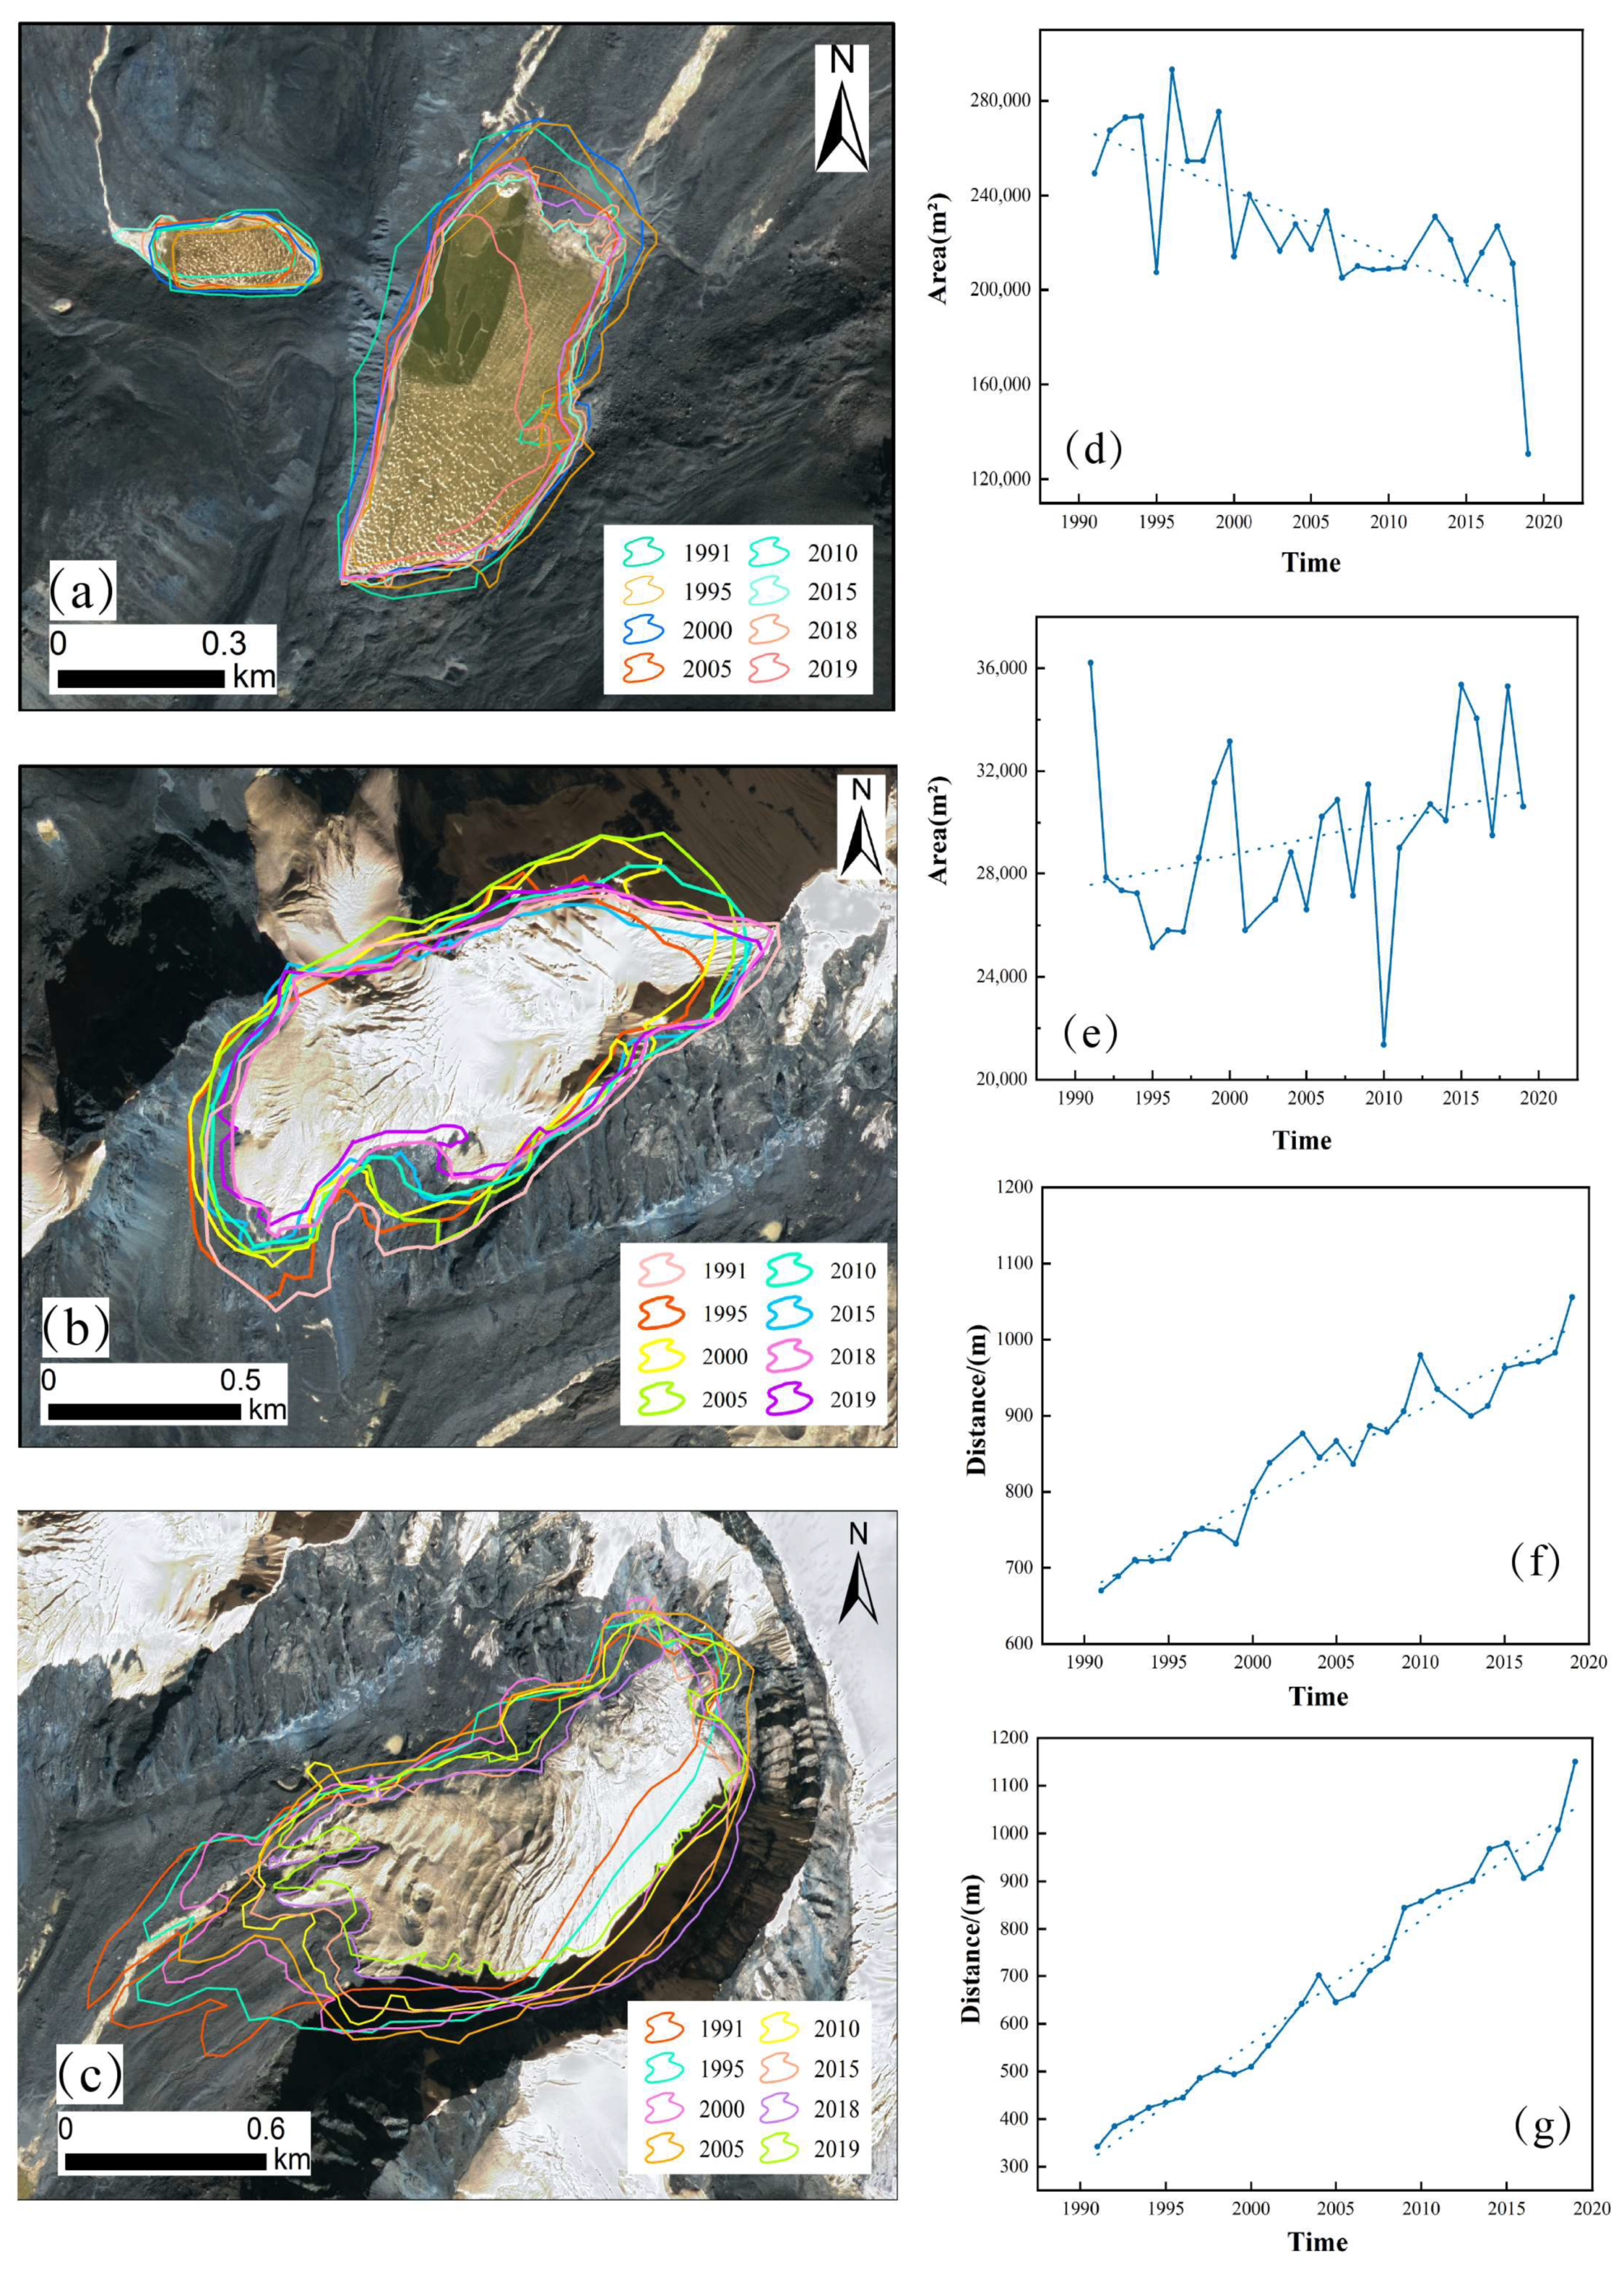
Multi-spectral optical images collected from 1991 to 2019 (Table 1) were used to determine the dynamic change in the lake water and its parent glaciers. The termini of the G-b and G-c glaciers retreated 385 m and 751 m over the preceding three decades (Figure 5), respectively (Figure 6). The retreat rate was not constant over the whole period, with an average rate of ~20 m/a before 2000 and 50 m/a after 2004 for glacier G-c. Similarly, the retreat of the glacier G-b terminus accelerated from 2000. However, the area of lake GL-A decreased (Figure 7), especially from 2000. Optical images show that the north side of the lake widened significantly and the south side had not changed significantly before the outburst. This may have been due to an increase in glacial meltwater, which led to an increase in the lake’s water demand. After the outburst event, the widths of the north and south sides of the lake changed significantly. A study by Yaping Gao et al. shows an increasing trend of glacial lake areas alongside climate warming using a visual interpretation [41]. An analysis of the decrease in the area of lake GL-A is presented in Section 4.2 of this paper.
Lake GL-B is located 0.21 km west of lake GL-A, stretching ~388 m in the east–west direction and 131 m in the north–south direction, with an area of 30,189 m2 and an average altitude of 5465 m. It lies ~0.45 km away from its parent glacier G-a. In contrast to lake GL-A, its area continuously increased from 1991 to 2019, as shown in Figure 8. The two glacial lakes began to change significantly around 2000. Based on the areas of lakes GL-A and GL-B and the time when the distance between GL-A and G-c changed, this may have been related to warming in the region after 2000.
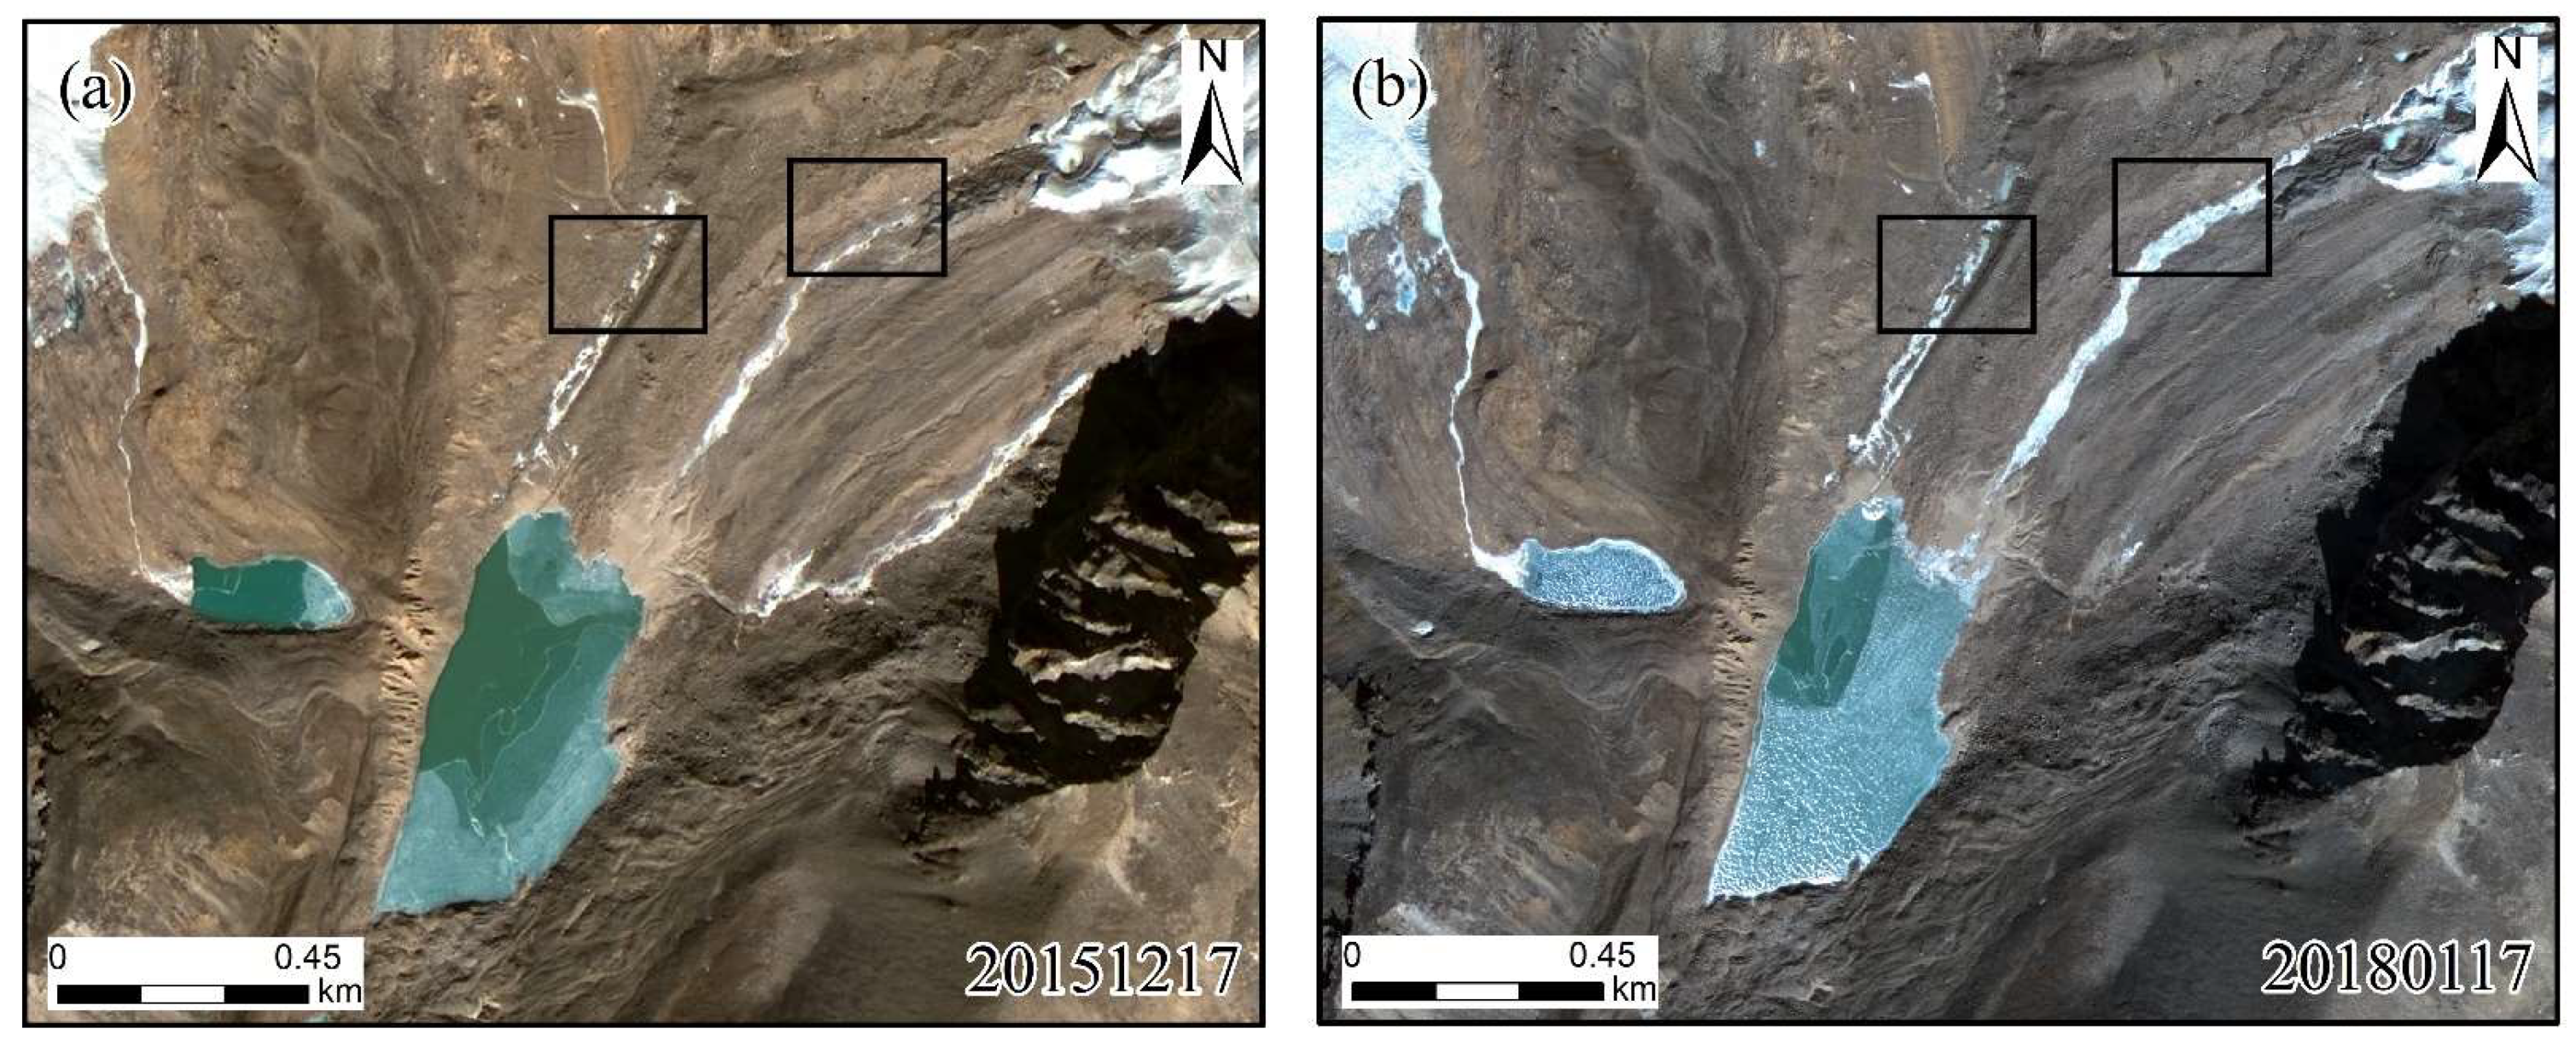
The digital elevation model (DEM) for the area shows that the terminal elevations of G-a, G-b, and G-c are 5605 m, 5636 m, and 5508 m, respectively, while the average elevation of the glacial lakes is 5370 m. Glacier runoff increases due to glacier melting, which, in turn, increases due to rising temperatures. This abundance of water can cause glacial lake outbursts. Specifically, according to the GF-1 and GF-6 PMS satellite image statistics (Figure 9), the G-c terminal runoff area, which is one of the recharge water sources of the glacial lakes, was 7980 m2 in 2015, 9485 m2 in 2016, and 25,288 m2 in 2018, which is an increase of 167% compared with 2016.
In summary, the G-c parent glacier terminal continuously retreated and there was a significant increase in runoff at the end of the glacier. However, the decrease in GL-A’s area indicates that its recharge water source was smaller than the outflow. In addition, GL-B’s recharge water source was larger than the outflow, so GL-B’s area exhibited an increasing trend. Thus, in order to analyze the cause of GL-A failure, it is necessary to assess the deformation of the downstream dam body.

4.2. Surface Deformation around the Glacial Lakes

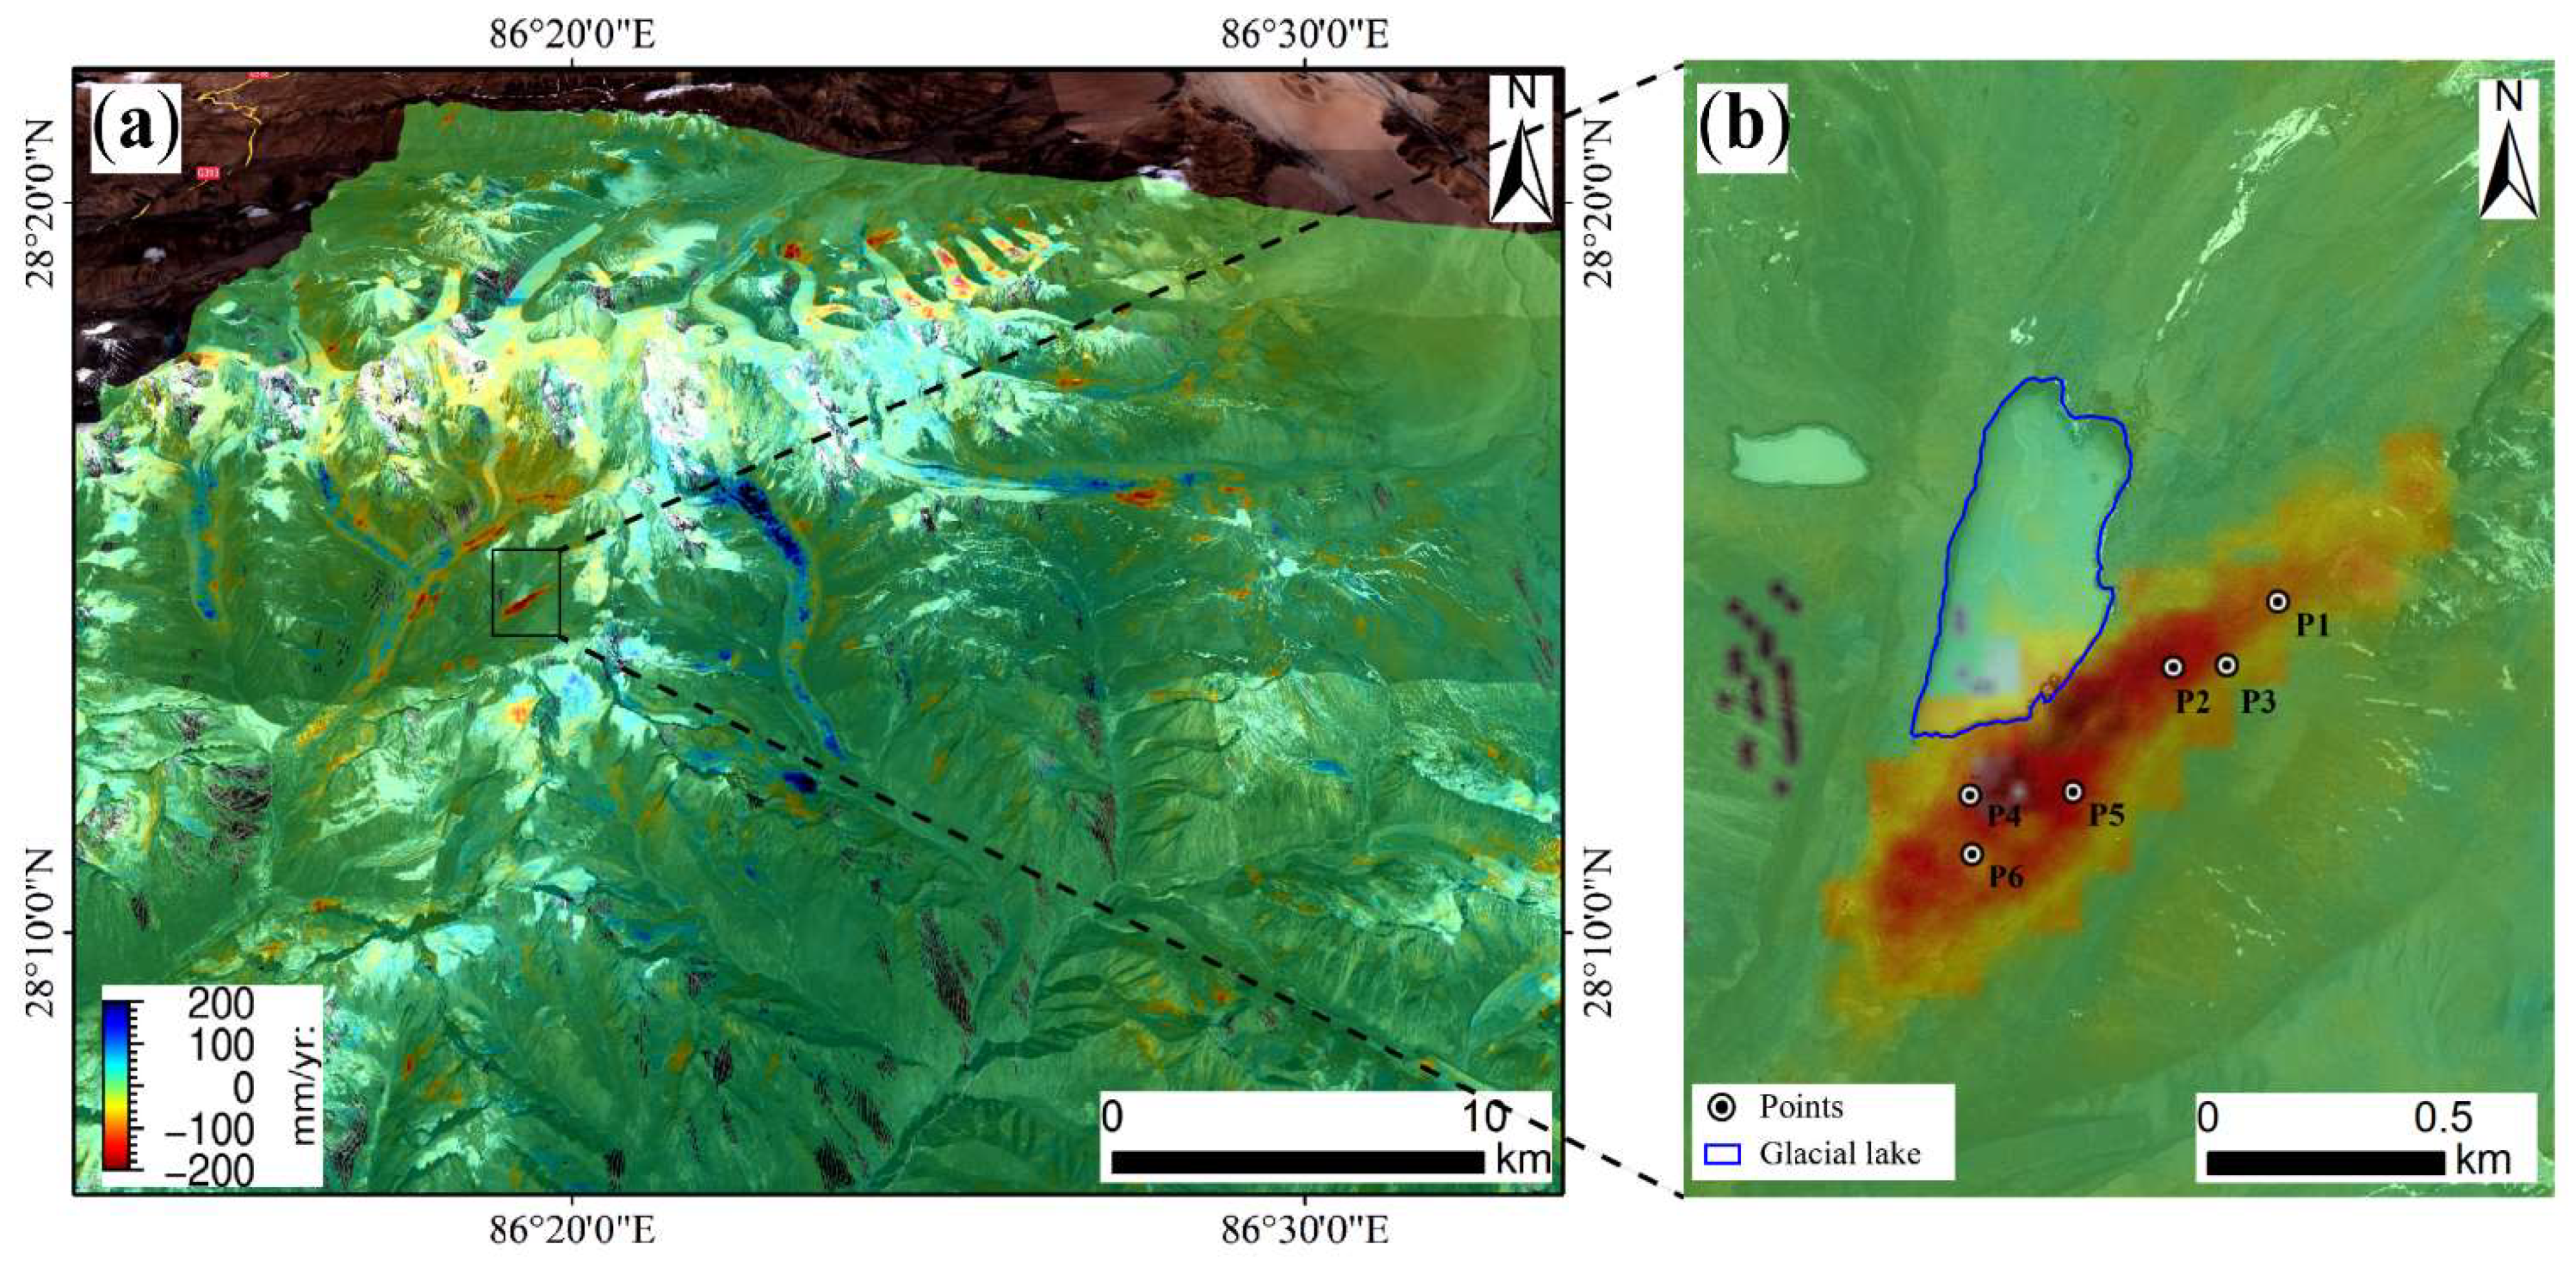
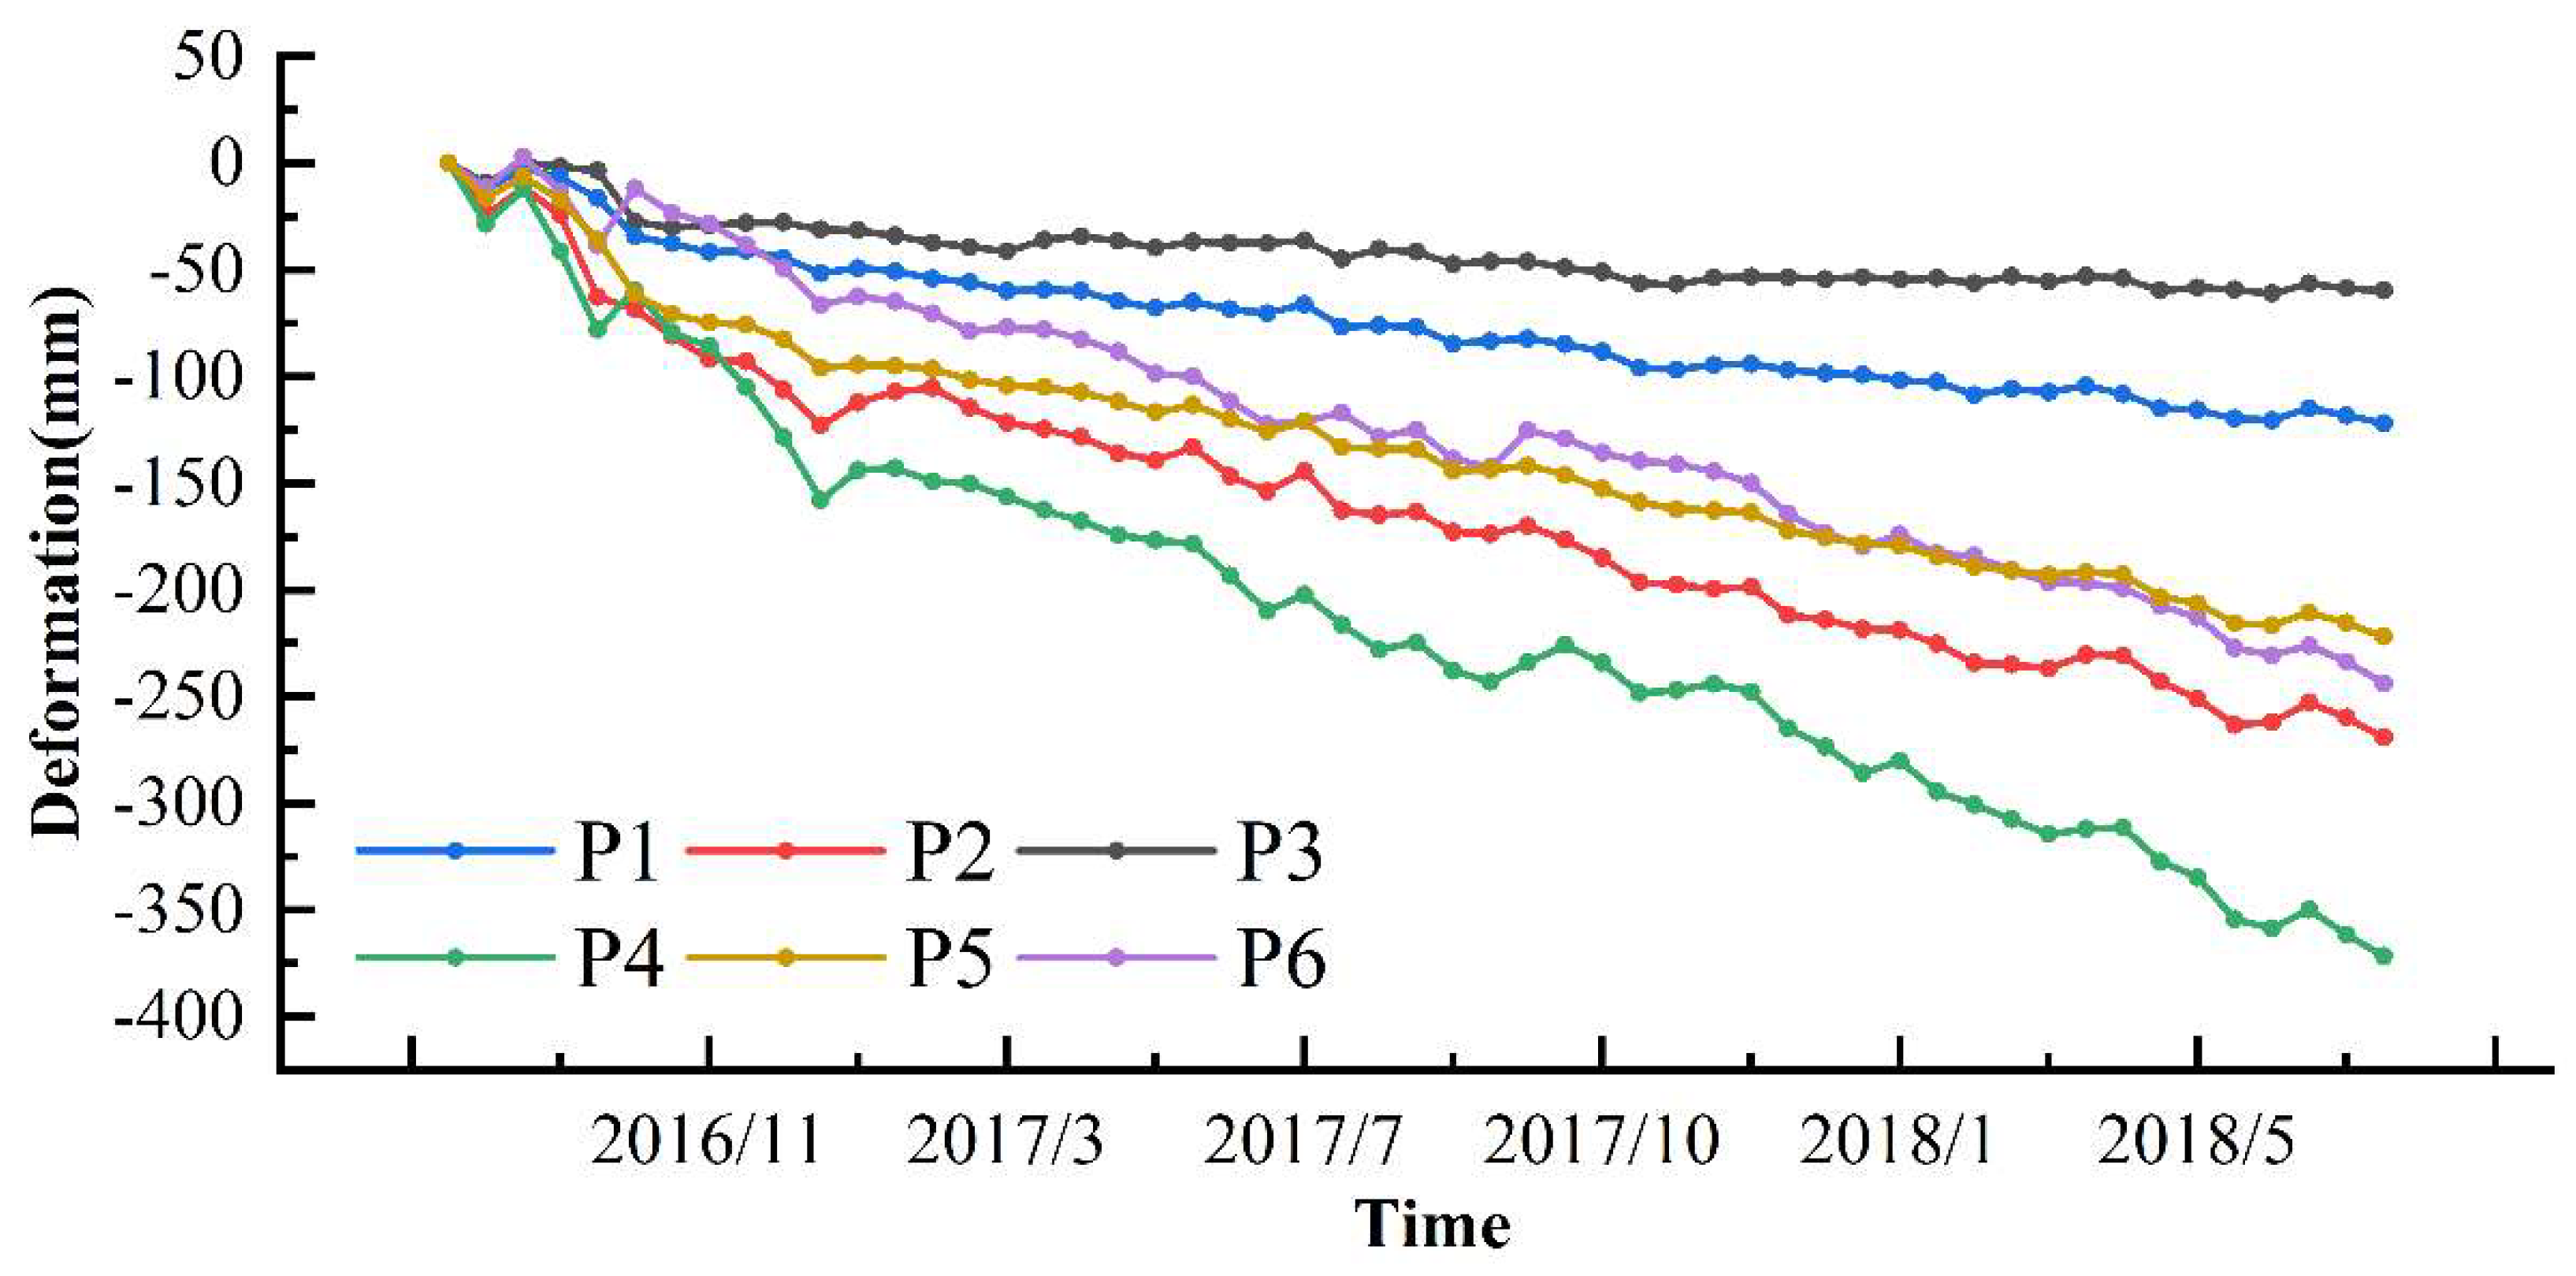
In order to comprehensively evaluate the surface deformation process and to capture the abnormal signals that may have occurred in the area around the glacial lake before and after the 2018 Nyalam GLOF event, the surface deformation results from 2016 to 2018 were obtained using SBAS-InSAR method (Figure 10). The results showed that during the monitoring period before the disaster, the cumulative deformation in most areas around the glacial lake was in the range of −20~20 mm, indicating that most areas were relatively stable. The prominently deforming area was ~1.56 km long and ~0.4 km wide, with slopes of 0~10°. The deformation decreased from the center to the margins. By overlaying the deformation map on the optical image, we found that the most rapid subsidence that occurred was mainly concentrated on the dam body and the southeast-side hill slope. The time-series results (Figure 11) showed that the surface subsidence mainly exhibited a linear trend, with a maximum cumulative subsidence of ~371 mm, indicating that the moraine dam might have experienced significant subsidence over longer time period than the SAR data observation before the outburst.
Within the subsiding area, the deformation at locations P4 to P6 was greater than that for P1 to P3. It revealed that the subsidence at P4 on the downstream dam was most significant, with a maximum cumulative displacement of 371 mm and a rate of 120 mm/a. The deformation at P2, the lateral moraine, was also large, with a cumulative deformation of 269 mm and a rate of 100 mm/a. Among the selected locations, P3 exhibited the slowest deformation, with a cumulative deformation of only 59 mm. The time-series deformation results also revealed a slight accelerating trend in dam subsidence, with ~96 mm in 2016, 73 mm in 2017, and 99 mm in 2018.

5. Discussion

5.1. The Impact of the Seismicity

The study area is located within the seismically active Himalayan range, bounded by several active faults across the Himalaya–Tibet region [27]. There have been two earthquakes of magnitude 6~6.9 and five earthquakes of magnitude 4.7~5.9 in the Tangra Yum Co–Xuru Co fault zone [42]. The MCT and Main Boundary Thrust (MBT) faults were prominent continental structures in the Himalayas but no longer at present [43]. The Main Frontal Thrust (MFT) fault is the present-day active structure accommodating the India–Asia convergence, extending downwards to the MHT at depth as the most seismically active areas in the Himalaya–Tibet Oregon [44]. Historically, the region has experienced a number of significant seismic events, which are often associated with the activity of the MHT. For example, the 2015 Mw7.8 Gorkha (Nepal) earthquake caused significant fault slip at depth and large coseismic displacement on the surface.
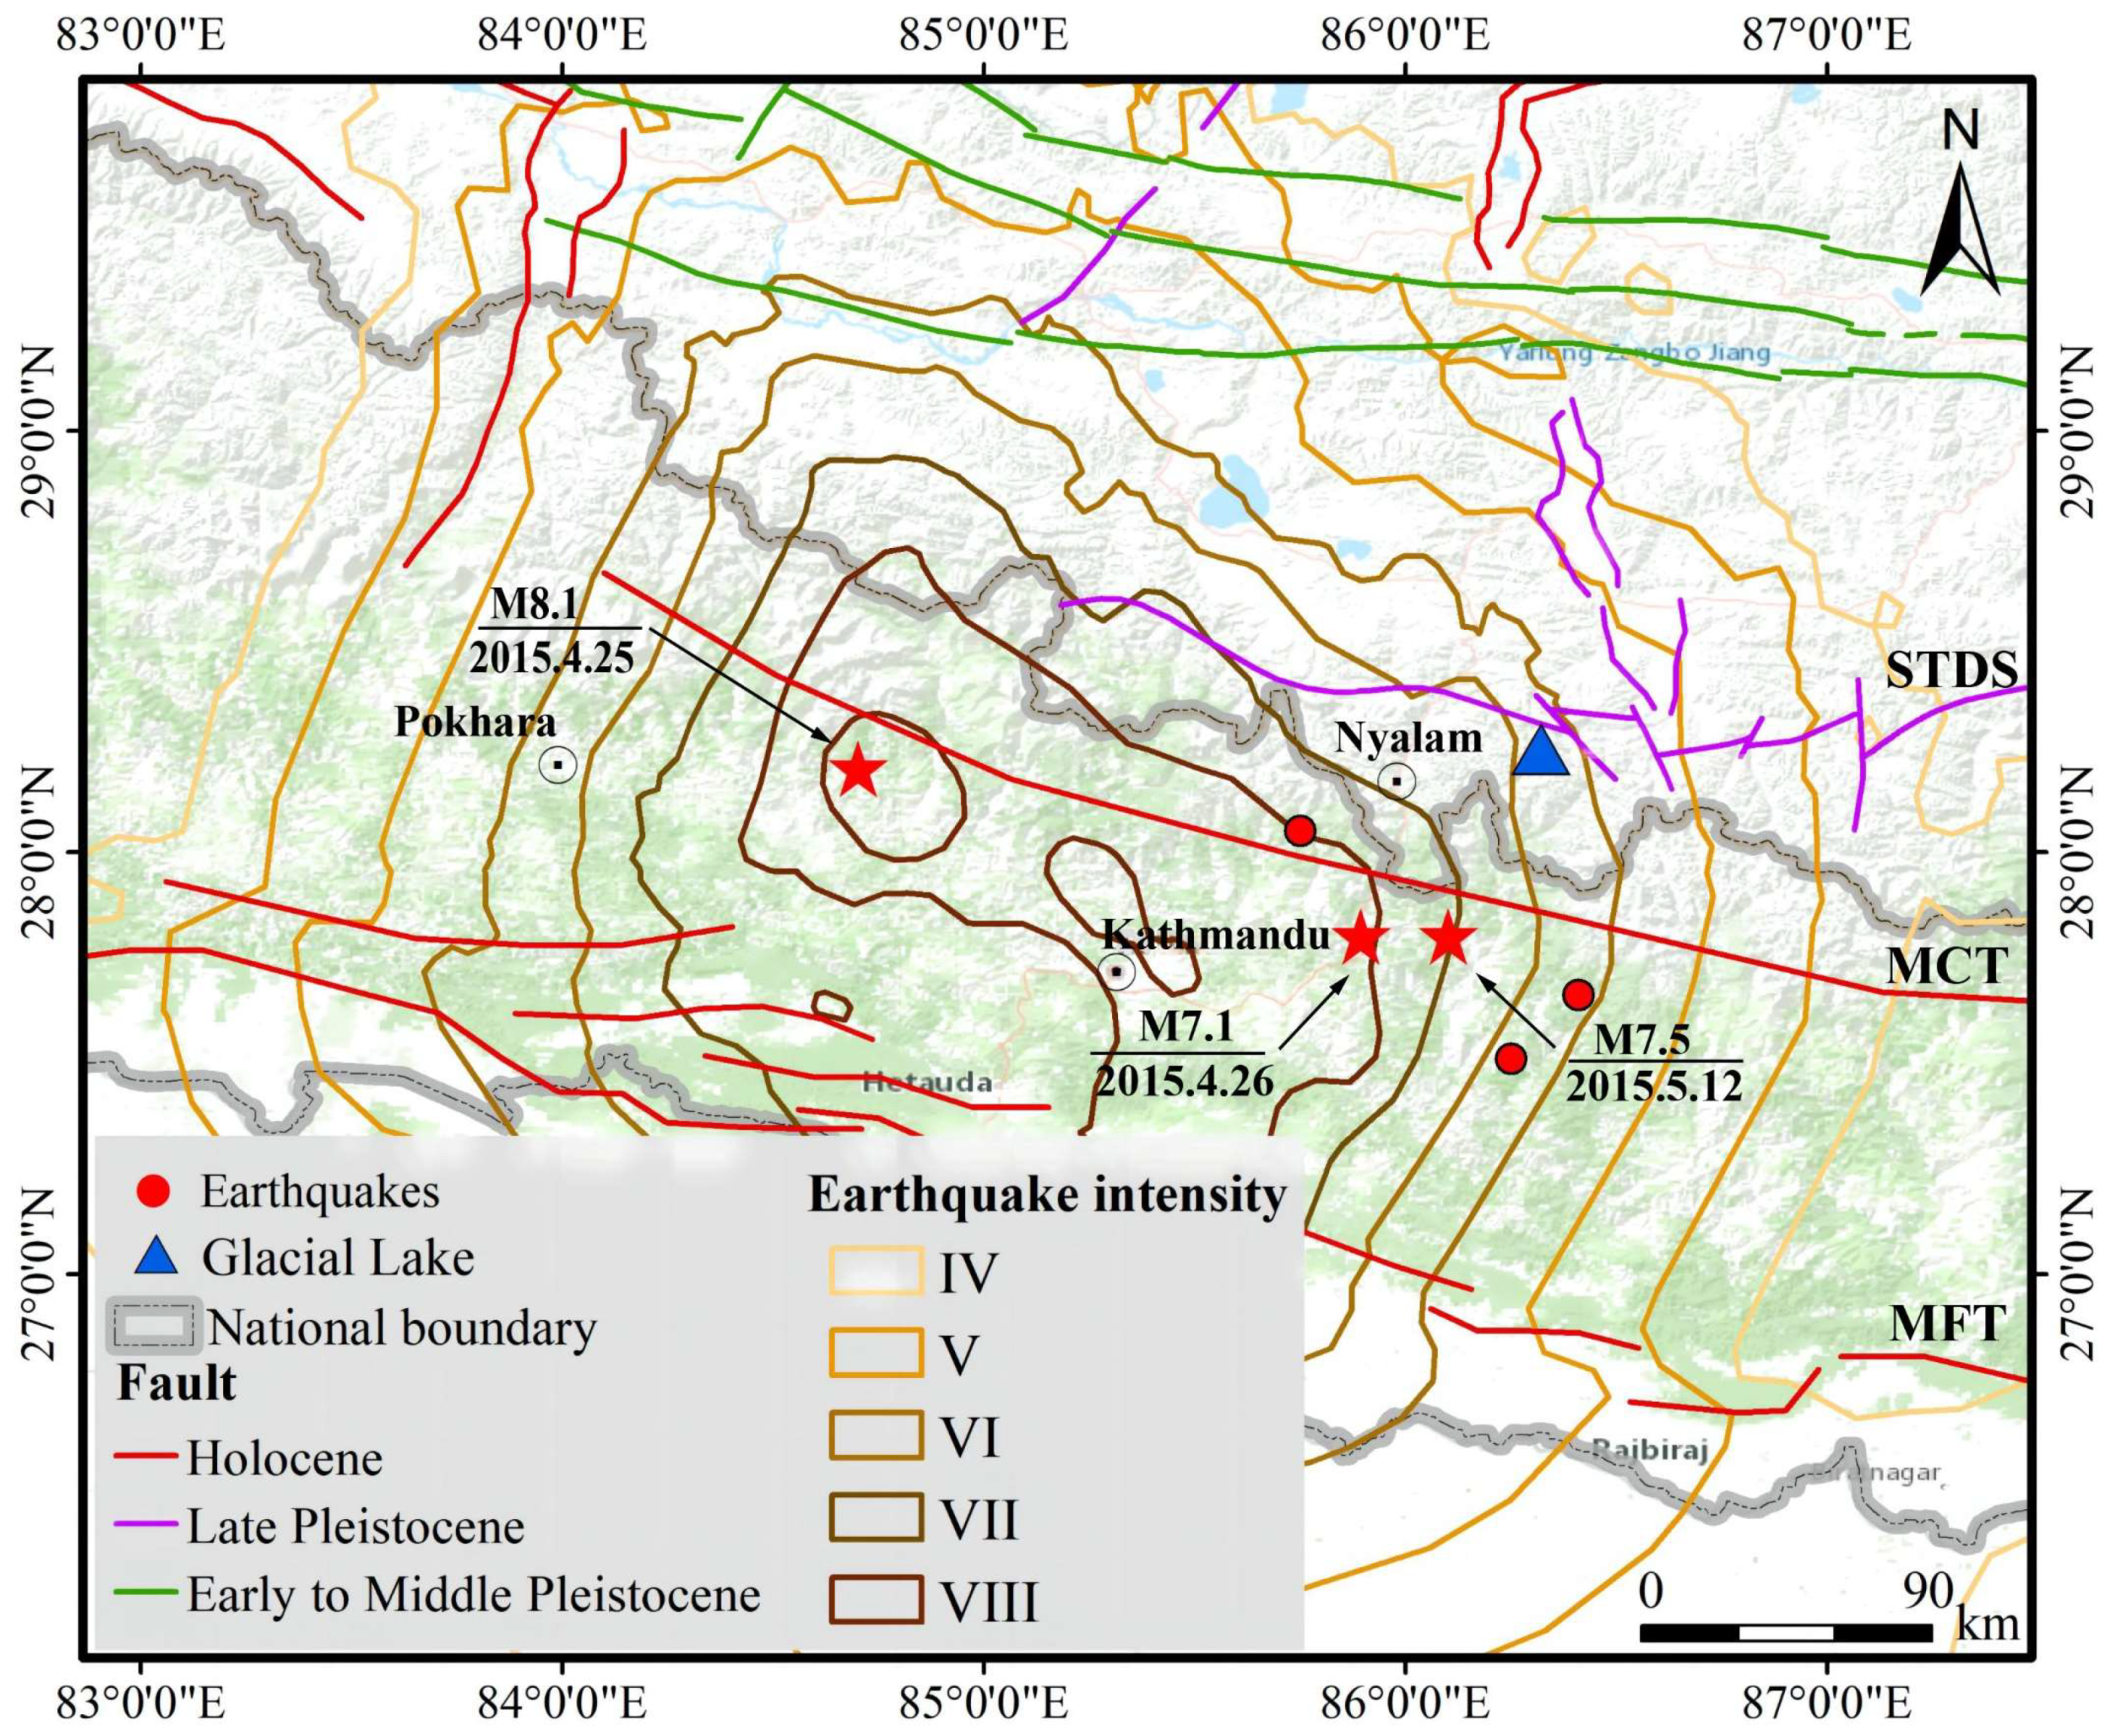
Earthquake data were collected from one year before the 2018 GLOF event, as shown in Figure 12, with magnitude between 3 and 4.5. Among them, the largest earthquake occurred on 2 March 2018, in Xietongmen County, Shigatse City, Tibet. Its epicenter was approximately 270 km away from the glacial lake. In addition, another two earthquakes close to the outburst occurred on 1 August 2018, with magnitudes of 3.1 and 4.2, also lying ~268 km away. No other seismicity was recorded by the current seismic network. Therefore, an earthquake can be ruled out as a direct triggering factor of the 2018 outburst event.
However, it is worth noting that the 2015 Gorkha (Nepal) earthquake, whose epicenter was located 159 km to the west of the glacial lake, might have promoted the 2018 event. According to the China Earthquake Network, this largest earthquake in the Himalayan range over the past decades occurred on 25 April 2015, Beijing time, with a hypocenter depth of ~20 km. The glacial lake under study is located in seismic intensity zone VI, which might have weakened the dam stability. Furthermore, within a month of this earthquake, one M > 7 aftershock occurred in an area ~64 km away, west of the glacial lake. According to the glacial lake area change statistics, the area of glacial lakes decreased by 17,676 m2 after the 2015 Nepal earthquake, suggesting a possible small-scale dam failure resulting from these earthquakes. This may have caused the development of instability of the dam body, increasing the risk level of a subsequent glacial lake outburst.

5.2. Triggering from Meteorological Factors

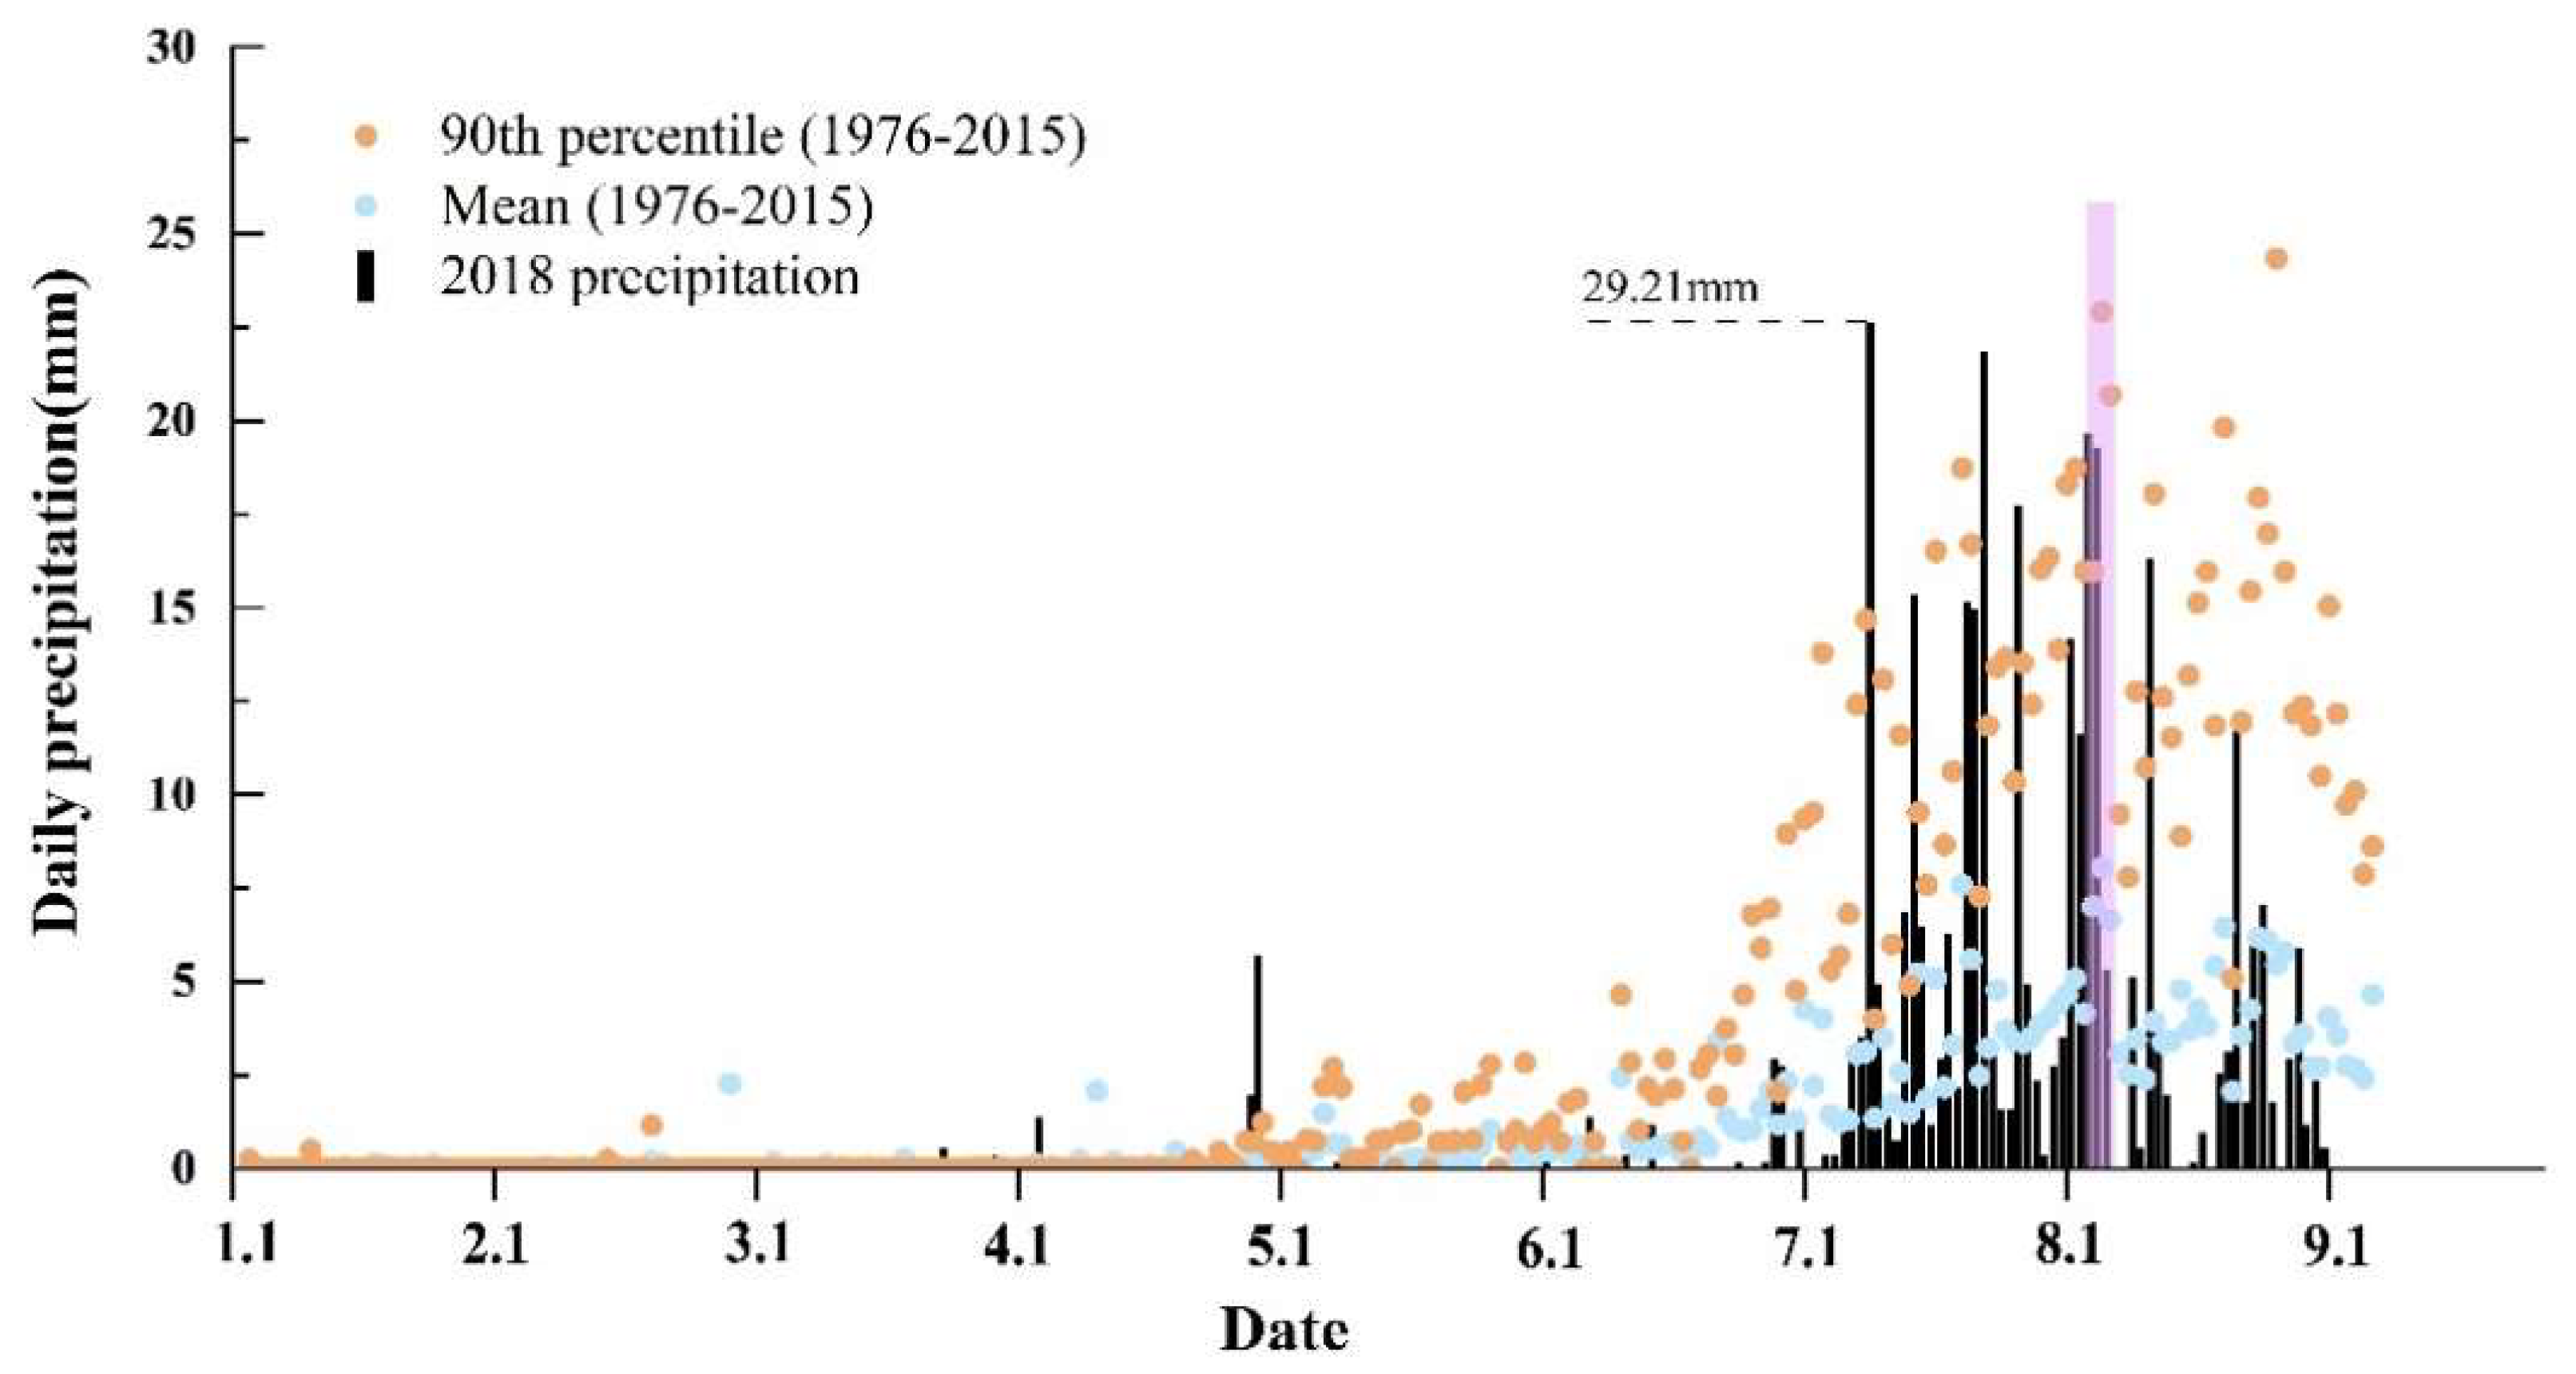
Generally, precipitation triggers a GLOF as the result of a rise in lake water levels. Considering global warming and the abnormal climate of the Qinghai–Tibet Plateau in particular, it is necessary to investigate the meteorological conditions at the time of the event. In situ observations from the nearest meteorological station to the glacial lake were collected for this purpose. The station is located 84.5 km northeast of the glacial lake, and the daily maximum temperature and precipitation from 1976 to 2015 were analyzed. For simplicity, we calculated the average and 90th percentile of the temperature and precipitation data for each day in the past 30 years, and then compared the results with the daily observation in 2018. This comparison enables us to assess whether the glacial lake outburst flood event was related to meteorological conditions.
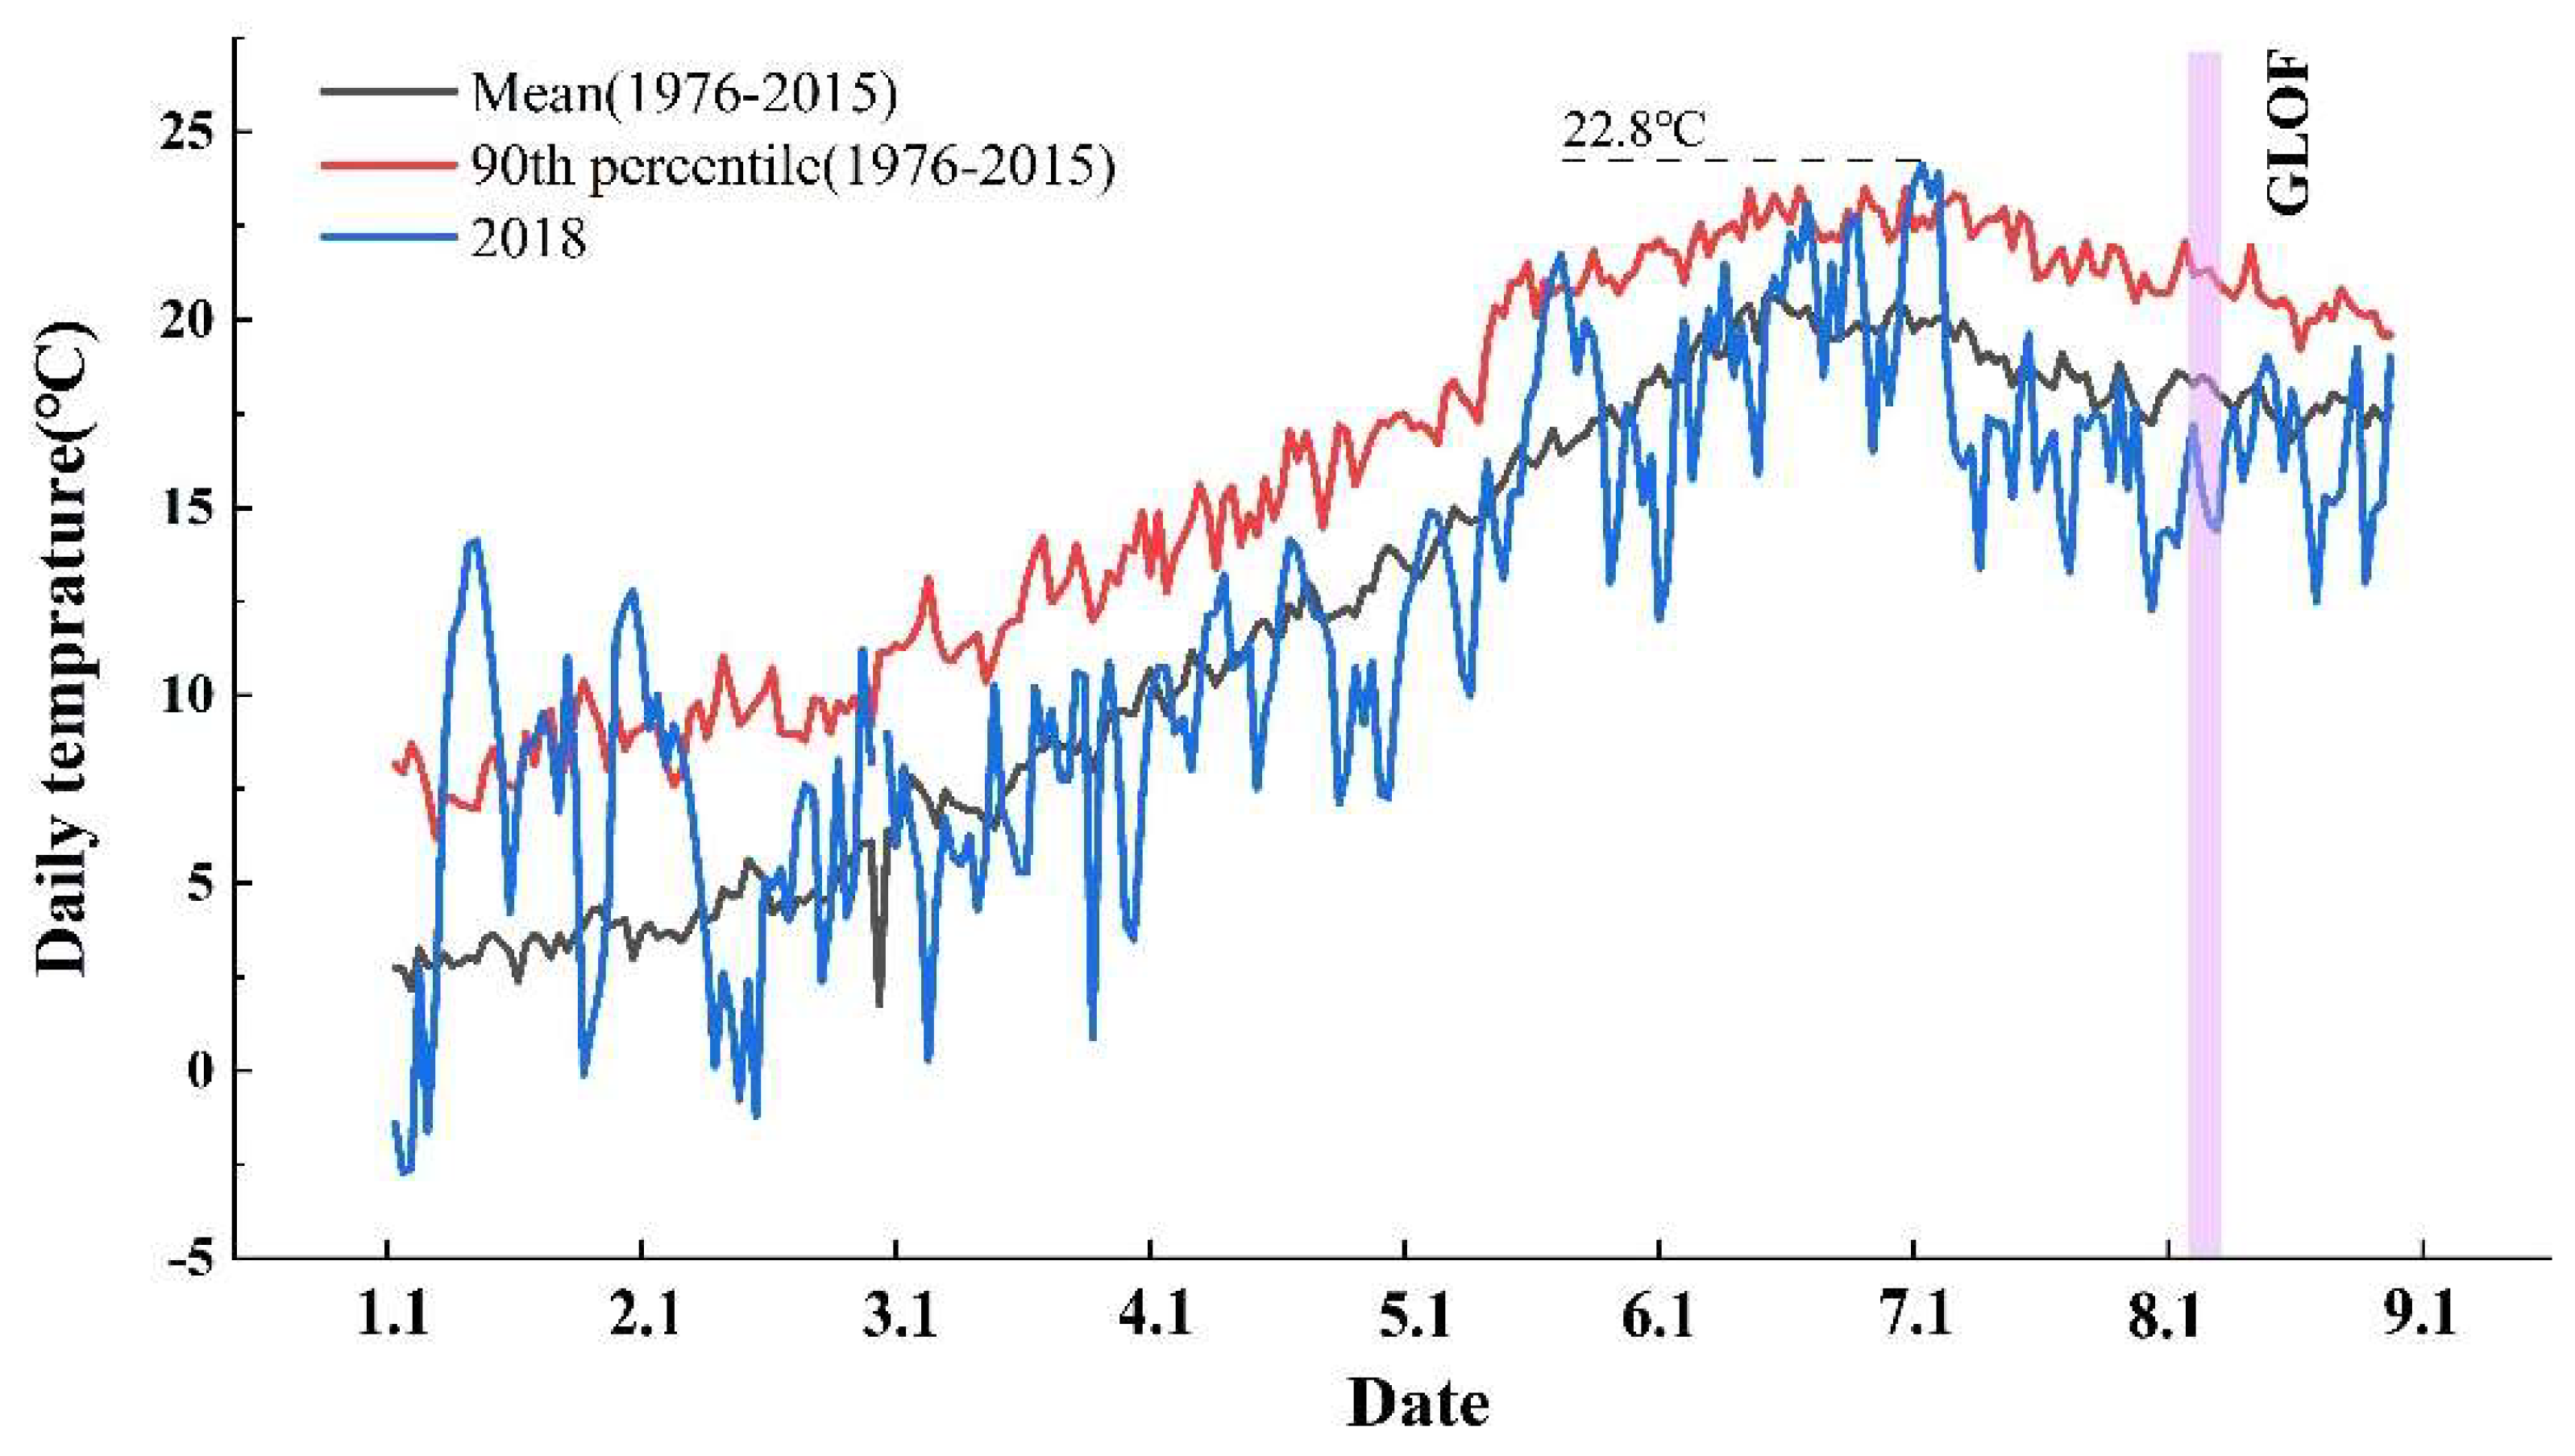
Figure 13 shows that the glacial lake outburst occurred during periods of unusually high temperatures and unusually wet periods compared to long-term climatic conditions. The highest temperatures in the region occur from June to September, with average daily temperatures above 15 °C. During this period, the glaciers melt and the lake glacial period ends. It is worth noting that on July 3, 2018, the temperature was ~3.68 °C higher than the annual average temperature, and on July 5, it climbed to 24.1 °C, which not only set a new temperature record in 2018, but also exceeded the 90th percentile of the same period in previous years.
In the study area, precipitation exhibits obvious seasonal fluctuations, with low precipitation levels in winter and abundant precipitation in summer. From 10 July 2018, precipitation also began to rise significantly, reaching 29.21 mm, far exceeding the level of the same period in previous years. Subsequently, precipitation continued in the region, peaking again at 19.558 mm on 21 July and climbing to a maximum of 28.194 mm on 23 July. Interestingly, even on 2 August, immediately before the breach, precipitation remained above the 90th percentile of the previous years.
Against the backdrop of an unusually warm and humid climate, it is not difficult to observe clear factors that can cause glacial lake outburst flood events. Persistent high temperatures in the summer can cause the end of parent glaciers to melt, providing a large amount of water to glacial lakes. In addition, persistent precipitation can increase the water content of a lake basin, increasing the infiltration water pressure and, consequently, the dike instability [8]. It is, therefore, reasonable to speculate that these anomalous climatic conditions were one of the triggering factors for the GLOF.
In summary, the glacial lake under study is a glacier terminus lake, and its main sources of recharge are the parent glacier, snowmelt, and atmospheric precipitation. The high-resolution optical remote sensing images show that the terminal moraine ridge on the side of the glacial lake is mainly composed of a large amount of gravel, sediment, and moraine as opposed to large particulate matter. This is relatively rare. Its permeability is good but its structure is relatively loose, resulting in poor overall stability. The persistent high temperatures in the summer caused the tip of the parent glacier to melt, which, combined with a large amount of precipitation, provided the glacial lake with a large amount of water. However, it is difficult to make a definitive judgment on whether the rise in the water level of the glacial lake directly caused the GLOF.

5.3. The Impact of Surface Deformation on GLOF

Based on the C-band radar data collected by the Sentinel-1 satellite, it was found that there was no obvious deformation in the parent glacier area in the upper reaches of GL-A from 2016 to before the GLOF event. Together with optical images, we can rule out ice calving, a snow avalanche, and a landslide as the triggering factor for the 2018 GLOF event. However, the settlement signal of the dam body and slope downstream of GL-A was obvious, indicating that the lateral moraine slope and the downstream dam body experienced significant deformation in 2018. This suggested that the deformation of the side moraine may have been due to the compression caused by glacial movement or gravity, while the deformation of the downstream dam body was caused by the pressure of the glacial lake. Based on optical remote sensing images, we found that the soil structure of the lower reaches and side moraines was loose and would have facilitated water seepage. In addition, the long-term evolution of the glacial lake showed that the lake area decreased continuously. This phenomenon confirms the water seepage problem in the lower reaches of the glacial lake, which could be the direct trigger of the GLOF.

5.4. Outburst Mechanism of the 2018 Nyalam GLOF Event

In order to analyze the causes of the GLOF, seismic and meteorological data were comprehensively analyzed. Although the study area is located near several active faults in the Himalayas, there were no major earthquakes in the year before the glacial lake outburst, and the epicenters of the earthquakes were far away. Therefore, it can be assumed that an earthquake was not the main cause of the disaster. Comparatively speaking, meteorological factors appeared to play an important role in the outburst. The temperature before the event was significantly higher than that of the same period in previous years, and the high temperature accelerated the melting of the glacier, which provided the glacial lake with a large amount of water. This along with the large amount of precipitation led to the increase in the capacity of the glacial lake, accelerated the lake’s infiltration process, and seriously affected the stability of the dam, which eventually led to the glacial lake outburst.
Through a comprehensive observation and analysis using Google Earth, high-resolution remote sensing images, and InSAR deformation maps, it was found that the increase in precipitation led to an increase in glacier melting; thus, the water storage capacities of the GL-A and GL-B glacial lakes increased, with the area of GL-B eventually also increasing. With the continuous melting of the glacier, the water storage capacity of the glacial lake continued to increase and the seepage volume of the downstream also continued to increase; thus, the continuous settlement rate eventually led to the instability of the dam and the GL-A outburst flood event. However, due to the small area, stable surrounding terrain, no obvious settlement deformation, and relatively stable recharge water source, the GL-B failure risk is relatively low and can be temporarily ruled out. However, it is necessary to observe the special geographical relationship between GL-B and GL-A. GL-B is not only close to GL-A, but is also located on the moraine ridge to the west of GL-A, and its average elevation is higher than that of GL-A. Based on high-resolution remote sensing images, GL-B has a flow path to GL-A, which means that, in the future, the water from GL-B may continue to flow into GL-A, and an increase in these flow dynamics may have a significant impact on GL-A. As the water in GL-B continues to flow in, the water content of GL-A may gradually increase, which may lead to a rise in its water level and may even increase the risk of another outburst. Therefore, although the risk of outburst in the GL-B lake itself is low, its potential impact on GL-A cannot be ignored. In view of this, it is necessary to continue to pay attention to GL-A and strengthen monitoring and early warning systems. Thus, through regular observations and data analyses, we can grasp the dynamic changes in glacial lakes over time, predict possible risks, and take corresponding preventive measures. In addition, we should maintain close communication with the local government and residents, and jointly formulate emergency plans to ensure that we can respond quickly and effectively in case of emergencies to protect the lives and property of local people.

6. Conclusions

Using optical and SAR remote sensing data, we investigated the spatiotemporal evolution of lake water and ground deformation leading up to the 2018 Nyalam GLOF event in southern Tibet, China. Our integrated analysis of water levels, meteorological conditions, surface deformation, and seismicity led to the following conclusions:
(1)
Optical remote sensing images revealed dynamic variations in the glacial lake and its parent glaciers. From 1991 to 2018, two parent glaciers (G-b and G-c) retreated by cumulative distances of 385 m and 751 m, respectively. The runoff area at the end of G-c increased by 17,308 m2 from 2015 to 2018, augmenting the glacial lake’s water volume and reservoir capacity significantly. In addition, lake GL-A shrank by 38,065 m2 due to limited recharge sources compared to outflow. Conversely, lake GL-B exhibited an increasing trend as recharge sources surpassed outflow.
(2)
Time-series InSAR analysis using Sentinel-1 data from the period 2016–2018 revealed rapid subsidence southeast of lake GL-A, with a maximum LOS subsidence rate of ~120 mm/a on the marine dam.
(3)
No signs of landslides, avalanches, ice calving, or major earthquakes were observed before the event that could have triggered an abrupt rise and strong outflow of lake water. However, the higher temperature recorded in 2018 accelerated glacier melting, resulting in increased runoff. Furthermore, the continuous monsoon rainfall during that year further amplified water volume, contributing to a rapid increase in water outflow which gradually impacted moraine dam stability, leading to its final failure between 3 August 2018 and 6 August 2018. The formation of a new downstream passage led to the outburst of lake water that continued for several months.
This work demonstrates that by integrating active and passive remote sensing techniques to investigate the GLOF, we can accurately capture its spatial and temporal evolution characteristics and triggering mechanisms, thus deepening our understanding of GLOF events triggered by lateral moraine landslides. This is of significant importance for glacial lake risk assessment and providing early warning for future GLOF events. Moreover, the research introduces an innovative approach by analyzing both meteorological and seismic factors to examine GLOF triggers and mechanisms comprehensively. Unlike conventional studies focusing on isolated factors, this approach provides a nuanced and scientifically robust framework for understanding the multifaceted causes of GLOFs, encompassing extreme weather events (such as intense rainfall and rapid snowmelt) and potential seismic activities. The chosen glacial lake, which has not been extensively studied before, expands the scope of glacier and glacial hazard research. It serves as a valuable case study, offering crucial data for risk assessment and disaster prevention in similar regions. Through analysis of this previously unexplored glacial lake, this study reveals its unique geographic, climatic, and geological features and their interactions with GLOF events. This enriches our understanding of mechanisms underlying glacial hazard formation.
However, several challenges hinder these advancements. Specifically, although InSAR technology is powerful, it suffers from the incoherence problem, which sometimes limits its ability to accurately capture deformation information. On the other hand, the acquisition of optical remote sensing imagery is often constrained by adverse weather conditions, such as cloud cover and fog, which affects the continuity and reliability of the data. In addition, studies on GLOFs often suffer from limited access to in situ observation data, which is primarily due to their remote locations in high-elevation mountains with steep terrains and harsh environmental conditions. Furthermore, when exploring the spatial and temporal evolution of the long time series of GLOFs, a single assessment index was chosen, which fails to comprehensively reflect the multidimensional characteristics of the changes.

Supplementary Materials

The following supporting information can be downloaded at: https://www.mdpi.com/article/10.3390/rs16152719/s1, Table S1: Specific information about the images used.

Author Contributions

Conceptualization, W.J. and Q.L.; methodology, W.J. and Y.T.; validation, W.J. and Q.J.; formal analysis, Q.L. and Y.L.; investigation W.J. and Y.Z.; resources, W.J. and Y.T.; data curation, Q.J. and Y.L.; writing—original draft preparation Y.Z.; writing—review and editing, W.J. and Y.T.; project administration, W.J. and Q.L.; funding acquisition, T.G., Y.G. and W.Z. All authors have read and agreed to the published version of the manuscript.

Funding

This research was funded by the Tibet Autonomous Region Science and Technology Program, grant number XZ202301YD0002C-01, the National Natural Science Foundation of China, grant number 42271015, and the Civil Aerospace Technology Advance Research Project of China, grant number D040405.

Data Availability Statement

Data used in this research are available for free through these websites: Sentinel-1A data (https://search.asf.alaska.edu, accessed on 30 December 2023); Landsat data (https://earthexplorer.usgs.gov, accessed on 30 December 2023); earthquake data (https://data.earthquake.cn/index.html, accessed on 30 December 2023); and meteorological data (https://www.ncei.noaa.gov/maps/daily/, accessed on 30 December 2023).

Acknowledgments

The authors would like to thank the United States Geological Survey (USGS) for providing the SRTM DEM and the Landsat optical scenes and the European Space Agency (ESA) for providing the Sentinel data. We would also like to thank the anonymous reviewers and editors for their valuable comments and suggestions.

Conflicts of Interest

The authors declare no conflicts of interest. Authors Yanhong Gao and Weishou Zhang were employed by the company ‘Tibet Autonomous Region Institute of Water Conservancy and Electric Power Planning, Survey and Design Institute’. The remaining authors declare that the research was conducted in the absence of any commercial or financial relationships that could be construed as a potential conflict of interest.

References

  1. Emmer, A.; Allen, S.K.; Carey, M.; Frey, H.; Huggel, C.; Korup, O.; Mergili, M.; Sattar, A.; Veh, G.; Chen, T.Y.; et al. Progress and challenges in glacial lake outburst flood research (2017–2021): A research community perspective. Nat. Hazards Earth Syst. Sci. 2022, 22, 3041–3061. [Google Scholar] [CrossRef]
  2. Guoxiong, Z.; Keith, A.S.; Anming, B.; Antonio, B.C.J.; Matthias, H.; Guoqing, Z.; Junli, L.; Ye, Y.; Liangliang, J.; Tao, Y.; et al. Increasing risk of glacial lake outburst floods from future Third Pole deglaciation. Nat. Clim. Chang. 2021, 11, 411–417. [Google Scholar]
  3. Harrison, S.; Kargel, J.S.; Huggel, C.; Reynolds, J.; Shugar, D.H.; Betts, R.A.; Emmer, A.; Glasser, N.; Haritashya, U.K.; Klimeš, J.; et al. Climate change and the global pattern of moraine-dammed glacial lake outburst floods. Cryosphere 2018, 12, 1195–1209. [Google Scholar] [CrossRef]
  4. Shugar, D.H.; Burr, A.; Haritashya, U.K.; Kargel, J.S.; Watson, C.S.; Kennedy, M.C.; Bevington, A.R.; Betts, R.A.; Harrison, S.; Strattman, K. Rapid worldwide growth of glacial lakes since 1990. Nat. Clim. Chang. 2020, 10, 939–945. [Google Scholar] [CrossRef]
  5. Zhang, G.; Yao, T.; Xie, H.; Wang, W.; Yang, W. An inventory of glacial lakes in the Third Pole region and their changes in response to global warming. Glob. Planet. Chang. 2015, 131, 148–157. [Google Scholar] [CrossRef]
  6. Zhang, M.; Chen, F.; Zhao, H.; Wang, J.; Wang, N. Recent Changes of Glacial Lakes in the High Mountain Asia and Its Potential Controlling Factors Analysis. Remote Sens. 2021, 13, 3757. [Google Scholar] [CrossRef]
  7. Liu, J.; Zhang, J.; Gao, B.; Li, Y.; Li, M.; Wujin, D.; Zhou, L. An overview of glacial lake outburst flood in Tibet, China. J. Glaciol. Geocryol. 2019, 41, 1335–1347. [Google Scholar]
  8. Wang, S.; Qin, D.; Xiao, C. Methodology and Application of Moraine Lake Outburst Disaster Evaluation in the Himalayas, China; Science Press: Beijing, China, 2016; pp. 52–56. [Google Scholar]
  9. Yamada, T. Glacier Lakes and Their Outburst Floods in the Nepal Himalaya; Report of Water and Energy Commission Secretariat (WECS); Water and Energy Commission Secretariat (WECS): Kathmandu, Nepal, 1993.
  10. Liu, J.; Cheng, Z.; Li, Y.; Luo, X. A study of the outburst form of the end-moraine lake in Tibet. Earth Sci. Front. 2009, 16, 372–380. [Google Scholar]
  11. Zhang, G.; Carrivick, J.L.; Emmer, A.; Shugar, D.H.; Veh, G.; Wang, X.; Labedz, C.; Mergili, M.; Mölg, N.; Huss, M.; et al. Characteristics and changes of glacial lakes and outburst floods. Nat. Rev. Earth Environ. 2024, 5, 447–462. [Google Scholar] [CrossRef]
  12. Veh, G.; Korup, O.; von Specht, S.; Roessner, S.; Walz, A. Unchanged frequency of moraine-dammed glacial lake outburst floods in the Himalaya. Nat. Clim. Chang. 2019, 9, 379–383. [Google Scholar] [CrossRef]
  13. Richardson, S.D.; Reynolds, J.M. An overview of glacial hazards in the Himalayas. Quat. Int. 2000, 65, 31–47. [Google Scholar] [CrossRef]
  14. Ningsheng, C.; Mei, L.; Simon, A.; Mingfeng, D.; Raj, K.N.; Taixin, P.; Shufeng, T.; Christian, H.; Kanglin, W.; Mahfuzur, R.; et al. Small outbursts into big disasters: Earthquakes exacerbate climate-driven cascade processes of the glacial lakes failure in the Himalayas. Geomorphology 2023, 422. [Google Scholar] [CrossRef]
  15. Zheng, G.; Mergili, M.; Emmer, A.; Allen, S.; Bao, A.; Guo, H.; Stoffel, M. The 2020 glacial lake outburst flood at Jinwuco, Tibet: Causes, impacts, and implications for hazard and risk assessment. Cryosphere 2021, 15, 3159–3180. [Google Scholar] [CrossRef]
  16. Kääb, A.; Huggel, C.; Fischer, L.; Guex, S.; Paul, F.; Roer, I.; Salzmann, N.; Schlaefli, S.; Schmutz, K.; Schneider, D.; et al. Remote sensing of glacier- and permafrost-related hazards in high mountains: An overview. Nat. Hazards Earth Syst. Sci. 2005, 5, 527–554. [Google Scholar] [CrossRef]
  17. Lillesand, T.; Kiefer, R.W.; Chipman, J. Remote Sensing and Image Interpretation; John Wiley & Sons: New York, NY, USA, 2015. [Google Scholar]
  18. Wang, W.; Yao, T.; Yang, X. Variations of glacial lakes and glaciers in the Boshula mountain range, southeast Tibet, from the 1970s to 2009. Ann. Glaciol. 2011, 52, 9–17. [Google Scholar] [CrossRef]
  19. Smith, M.; Pain, C. Applications of remote sensing in geomorphology. Prog. Phys. Geogr. 2009, 33, 568–582. [Google Scholar] [CrossRef]
  20. Zhang, T.; Wang, W.; An, B.; Wei, L. Enhanced glacial lake activity threatens numerous communities and infrastructure in the Third Pole. Nat. Commun. 2023, 14, 8250. [Google Scholar] [CrossRef] [PubMed]
  21. Bing, Y.; Rui, C.; Chonglei, Z.; Tong, N.; Lei, H.; Jinri, W.; Chunyu, Z. Identification and Feature Analysis of Regional Geohazard Risks along the Nyalam to Zhangmu Section of the China-Nepal Highway by InSAR. J. Geod. Geodyn. 2024, 44, 709–717. [Google Scholar] [CrossRef]
  22. Tang, Z.; Dong, H.; Wang, Y.; Li, G.; Fei, R. Activity time constraints and tectonic significance of the Cuona Detachment, southern Tibet. Acta Petrol. Sin. 2023, 39, 3572–3584. [Google Scholar] [CrossRef]
  23. Bai, L.; Song, B.; Li, G.; Jiang, Y.; Dhakal, S. Seismic Activity in the Himalayan Orogenic Belt and Its Related Geohazards. Adv. Earth Sci. 2019, 34, 629–639. [Google Scholar]
  24. Niu, X.; Liu, X.; Lu, Y.; Wu, Q. Origin mechanism of thermal springs and their supply of minerals to the salt lake(Li-Rb-Cs) in the Tangqung Co watershed of Tibet. Geol. China 2023, 50, 1163–1175. [Google Scholar]
  25. Zhang, J.; Li, H.; Zhang, H.; Xu, X. Research Progress in Cenozoic N-S Striking Rifts in Tibetan Plateau. Adv. Earth Sci. 2020, 35, 848–862. [Google Scholar]
  26. Jing, J.; Wu, Z.; Ding, W.; Chu, C.; Ma, W. Investigation and Analysis of Geological Disasters and Bank Protection Damage in Nyalam Town, South Tibet. J. Disaster Prev. Mitig. Eng. 2023, 43, 32–40. [Google Scholar]
  27. Zhang, J.; Ding, L. East-west extension in tibetan plateau and its significance to tectonic evolution. Sci. Geol. Sin. 2003, 38, 179–189. [Google Scholar]
  28. Guo, W.; Liu, S.; Xu, J.; Wu, L.; Shangguan, D.; Yao, X.; Wei, J.; Bao, W.; Yu, P.; Liu, Q. The second Chinese glacier inventory: Data, methods and results. J. Glaciol. 2015, 61, 357–372. [Google Scholar] [CrossRef]
  29. Li, D.; Shangguan, D.; Wang, X.; Ding, Y.; Su, P.; Liu, R.; Wang, M. Expansion and hazard risk assessment of glacial lake Jialong Co in the central Himalayas by using an unmanned surface vessel and remote sensing. Sci. Total Environ. 2021, 784, 147249. [Google Scholar] [CrossRef] [PubMed]
  30. Mandanici, E.; Bitelli, G. Preliminary Comparison of Sentinel-2 and Landsat 8 Imagery for a Combined Use. Remote Sens. 2016, 8, 1014. [Google Scholar] [CrossRef]
  31. Qiao, B.; Zhu, L.; Yang, R. Temporal-spatial differences in lake water storage changes and their links to climate change throughout the Tibetan Plateau. Remote Sens. Environ. 2019, 222, 232–243. [Google Scholar] [CrossRef]
  32. Song, C.; Huang, B.; Ke, L.; Richards, K.S. Remote sensing of alpine lake water environment changes on the Tibetan Plateau and surroundings: A review. ISPRS J. Photogramm. Remote Sens. 2014, 92, 26–37. [Google Scholar] [CrossRef]
  33. Zhang, G.; Yao, T.; Xie, H.; Yang, K.; Zhu, L.; Shum, C.K.; Bolch, T.; Yi, S.; Allen, S.; Jiang, L.; et al. Response of Tibetan Plateau lakes to climate change: Trends, patterns, and mechanisms. Earth-Sci. Rev. 2020, 208, 103269. [Google Scholar] [CrossRef]
  34. Cui, P.; Ma, D.; Chen, N.; Jiang, Z. The initiation, motion and mitigation of debris flow caused by glacial lake outburst. Quat. Sci. 2003, 23, 621–628. [Google Scholar]
  35. Jingli, H.; Changming, W.; Chengjie, Z. Application of Fuzzy Comprehensive Evaluation Method in Risk Degree Determination for Ice-lake Outburst-An Example of Luozha County in Tibet. Earth Environ. 2005, 33, 109–114. [Google Scholar]
  36. Ruren, L.; Bangxing, T.; Pingyi, Z. Tibetan Mudslides and the Environment, China; Chengdu University of Science and Technology Press: Chengdu, China, 1999; pp. 71–72. [Google Scholar]
  37. Pan, M.; Cao, Y. Present status and perspectives of remote sensing survey of glacial lakes in High Asia. Remote Sens. Land Resour. 2021, 33, 1–8. [Google Scholar]
  38. Haibo, Z. Moraine Lake Debris Flow Disaster: Risk Evaluation and Numerical Simulation. Ph.D. Thesis, Jilin University, Changchun, China, 2016. [Google Scholar]
  39. Ferretti, A.; Prati, C.; Rocca, F. Permanent scatterers in SAR interferometry. IEEE Trans. Geosci. Remote Sens. 2001, 39, 8–20. [Google Scholar] [CrossRef]
  40. Luo, Y.; Tian, Y.F.; Feng, W.P.; Hu, Y.S. Development and application of automated processing tool for time series deformation analysis using open-source GMTSAR and iGPS software. Rev. Geophys. Planet. Phys. 2023, 54, 653–666. (In Chinese) [Google Scholar] [CrossRef]
  41. Gao, Y.; Yang, W.; Guo, R.; Jiang, L. Remote Sensing Monitoring and Analysis of Jinwuco Lateral Moraine Landslide-Glacial Lake Outburst in Southeast Tibet. Remote Sens. 2023, 15, 1475. [Google Scholar] [CrossRef]
  42. Qin, Y.; Zhang, S.; Liu, H.; Li, Y. Earthquake-Induced Soft-Sediment Deformation Structures in Middle Holocene of Xuru Co Area in Tibet and Its Geological Significance. Earth Sci. 2020, 45, 2945–2956. [Google Scholar]
  43. Mukhopadhyay, D.K.; Chakraborty, S.; Trepmann, C.; Rubatto, D.; Anczkiewicz, R.; Gaidies, F.; Dasgupta, S.; Chowdhury, P. The nature and evolution of the Main Central Thrust: Structural and geochronological constraints from the Sikkim Himalaya, NE India. Lithos 2017, 282, 447–463. [Google Scholar] [CrossRef]
  44. Yang, X.-P.; Wu, G.; Chen, L.-C.; Li, C.-Y.; Chen, X.-L. The seismogenic structure of the April 25, 2015 Mw7.8 Nepal earthquake in the southern margin of Qinghai-Tibetan Plateau. Chin. J. Geophys. Chin. Ed. 2016, 59, 2528–2538. [Google Scholar] [CrossRef]
Figure 1. Location plots of the study area. (a) Map around the Tibetan Plateau. (b) Topography of the study area. The red rectangle denotes the Sentienl-1 data coverage. The red pentagram represents the location of the 2018 Nyalam GLOF. The red circles denote historical earthquakes (1930–2018, M > 5.0) around the study area. F1–F3 represent three active faults near the glacial lake. F1: Nam Co–Xuru Couture fault; F2: the South Tibetan Detachment System (STDS); F3: the Main Central Thrust (MCT). (c) Three-dimensional topographic map of the study area. The overlaid imagery is from Google Earth. GL-A and GL-B represent glacial lakes A and B, respectively. G-a, G-b, and G-c represent parent glaciers a, b, and c, respectively.
Remotesensing 16 02719 g001
Figure 2. The workflow of this study.
Remotesensing 16 02719 g002
Figure 3. Schematic diagram of the indicator analysis.
Remotesensing 16 02719 g003
Figure 4. Sentinel-1 T121 interferograms for the SBAS-InSAR analysis.
Remotesensing 16 02719 g004
Figure 5. G-b terminus change in the period 1991–2019. The yellow line is the extent of the glacier in 1991; the pink line is the extent of the glacier in each year. Images (120) are Landsat 30 m TM/ETM+ images; images (21,22,24,25) are 16 m Gaofen-1 WFV images; and images (23,26,27) are 2 m Gaofen-1 PMS, Gaofen-2 PMS, and Gaofen-6 PMS images, respectively.
Remotesensing 16 02719 g005
Figure 6. G-c terminus change in the period 1991–2019. The yellow line is the extent of the glacier in 1991; the pink line is the extent of the glacier in each year. Images (120) are Landsat 30 m TM/ETM+ images; images (21,22,24,25) are 16 m Gaofen-1 WFV images; and images (23,26,27) are 2 m Gaofen-1 PMS, Gaofen-2 PMS, and Gaofen-6 PMS images, respectively.
Remotesensing 16 02719 g006
Figure 7. The glacial lake extent change in the period 1991–2019. Images (120) use Landsat TM/ETM data with a spatial resolution of 30 m; images (21,22,24,25) use Gaofen-1 WFV data with a spatial resolution of 16 m; images (23,26,27) use Gaofen-1 PMS, Gaofen-2 PMS, and Gaofen-6 PMS data, respectively, with a spatial resolution of 2 m; and image (27) is the aftermath of the GLOF.
Remotesensing 16 02719 g007
Figure 8. Area changes for lakes and glaciers. (a) Extents of GL-A and GL-B lakes; (b,c) extents of glacier G-b and G-c, respectively; (dg) plots of the GL-A area, GL-B area, the distance between GL-A and G-b, and the distance between GL-A and G-c, respectively. The dotted lines represent the trend line.
Remotesensing 16 02719 g008
Figure 9. Optical remote sensing image recognition of glacier terminus flow channel. The black rectangles represent the range of the glacier terminus flow channel. (a,b) The optical remote sensing images from different periods before the GLOF event.
Remotesensing 16 02719 g009
Figure 10. Surface deformation monitoring results of the mountains around the glacial lake. (a) The surface deformation monitored as a whole; (b) an enlarged version of (a). P1–P6 are the selected typical deformation areas.
Remotesensing 16 02719 g010
Figure 11. The time-series deformation results of Figure 10.
Remotesensing 16 02719 g011
Figure 12. The faults and seismic data for the year prior to the GLOF. The red circles are earthquakes that occurred around the glacier up to one year before the GLOF. The brown and yellow lines are the 2015 Nepal Earthquake Intensity Map from the USGS. The glacial lake is located in the intensity area of the Nepal M8.1 earthquake in 2015.
Remotesensing 16 02719 g012
Figure 13. Meteorological conditions from January to August 2018, measured at the Tingri weather station, compared to the long-term climatology data (1976–2015). The pink columns represent the time points of GLOF occurrences.
Remotesensing 16 02719 g013aRemotesensing 16 02719 g013b
Table 1. Data used in this work.
DataDateResolutionPurposeSources
GF1_PMS217 December 20152 m/8 mIdentification of glacial ablation zones and glacial lake circulation paths1
GF2_PMS125 December 20151 m/4 m
GF2_PMS217 January 2018
GF6_PMS13 October 20192 m/8 m
GF6_PMS19 November 2019
GF1_WFV3201316 mGlacial mapping
2014
2016
2017
Sentinel-1A12 March 2016–
1 July 2018
5 m/20 mSBAS-InSAR2
Meteorological data1976–2018dailyMeteorological
analysis
3
Landsat 4–81988–201430 mGlacial mapping4
Earthquake1930–2018 Analyzing the impact of tectonic factors on glacial lake outbursts5
1. China Platform of Earth Observation System (https://www.cpeos.org.cn/ (accessed on 30 December 2023)). 2. European Space Agency (ESA) (https://dataspace.copernicus.eu/ (accessed on 30 December 2023)). 3. National Oceanic and Atmospheric Administration (https://www.ncei.noaa.gov/maps/daily/ (accessed on 30 December 2023)). 4. USGS—United States Geological Survey (https://earthexplorer.usgs.gov/ (accessed on 30 December 2023)). 5. China Earthquake Network Center (CENC) (https://www.ceic.ac.cn/history, (accessed on 30 December 2023)).
Disclaimer/Publisher’s Note: The statements, opinions and data contained in all publications are solely those of the individual author(s) and contributor(s) and not of MDPI and/or the editor(s). MDPI and/or the editor(s) disclaim responsibility for any injury to people or property resulting from any ideas, methods, instructions or products referred to in the content.